
Building SVOD Brand Loyalty and Brand Equity: Application ...
Upload
vuongkhuongCategory
view
226download
0
Exact Commercial Ratings™
Chief Research Officer Bruce Goerlich
Rentrak Overview:
January 22, 2013

2
• Who is Rentrak?
• Strategic Uses of Exact Commercial Ratings™
• Rentrak Examples
• Summary

3
Who is Rentrak?

4
Rentrak’s services are positioned in two categories:

5
The Largest Multi-Screen Coverage
Box Office DVD/Blu-ray/ Video Game Rental
Digital Download (EST/iVOD/sVOD)
• 85,000 screens • 290 million transactions/year
• 6,000 stores / 44,000+ kiosks • 690+ million transactions/year • 10+ million by-mail/online disc subscribers
• 33 of the industry’s most prominent licensees across 75+ countries • 170+ million transactions/year
On Demand TV Linking the Consumer – Advanced Demographics
National TV
• 105+ million TVs • 9 billion transactions/year
• Auto • Retail • Entertainment • CPG • Political • More
• 20+ million televisions • 180 billion transactions/year
Mobile TV Internet TV DVD/Blu-ray Retail Sales • 38+ million transactions/year • 100s of millions of transactions/year • 15,000 stores
• 818 million transactions/year

6
National TV Footprint
1 Rentrak Home projects to
13 U.S. Homes
88.5 Million Homes 225+ Networks • All 210 Local Markets Measured
7
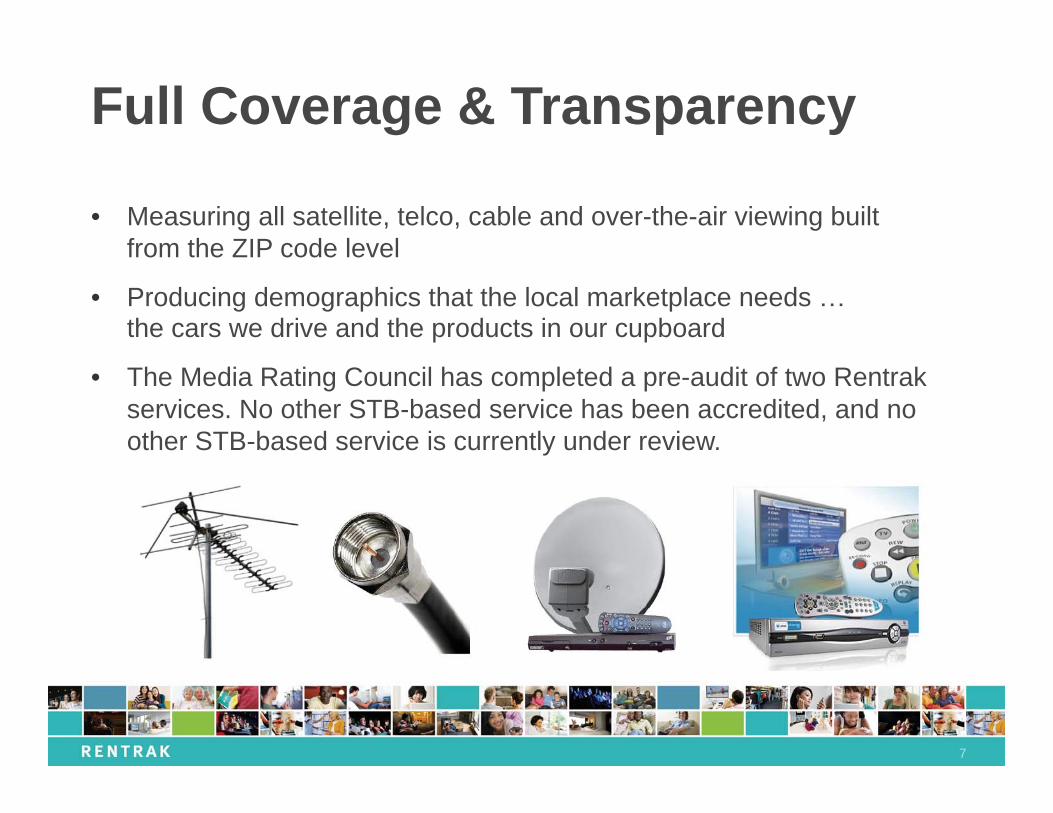
Full Coverage & Transparency
• Measuring all satellite, telco, cable and over-the-air viewing built from the ZIP code level
• Producing demographics that the local marketplace needs the cars we drive and the products in our cupboard
• The Media Rating Council has completed a pre-audit of two Rentrak services. No other STB-based service has been accredited, and no other STB-based service is currently under review.

8
Strategic Uses of Exact Commercial Ratings™

9
Strategic (Beyond Currency) Value for Exact Commercial Ratings™
• Measure Value Delivered – What did we get? • How does my Exact Commercial Rating™ compare to the rating of the
telecast?
• Determine Relative Value – Could we have done better in this specific case?
• How does my Exact Commercial Rating™ compare to other commercials in the telecast?
• How does my Exact Commercial Rating™ compare to other spots in the pod?
• How does my ECR™ compare to my competitive set?

10
• Improve Scheduling & Commercial Production – Can we make better ads?
• When does my commercial wear out?
• Which commercial duration is most impactful?
• Buy Placement – What can we do better in the future? • Which networks, dayparts or series work best: by quarter, month, daypart, pod
position, position within pod, competitive set and/or specific creative?
• Which broadcast week garners the highest ECR?
• Branded Entertainment- Where is additional value? • With iTVX Rentrak has second by second Branded Entertainment ROI
Strategic (Beyond Currency) Value of Exact Commercial Ratings™
11
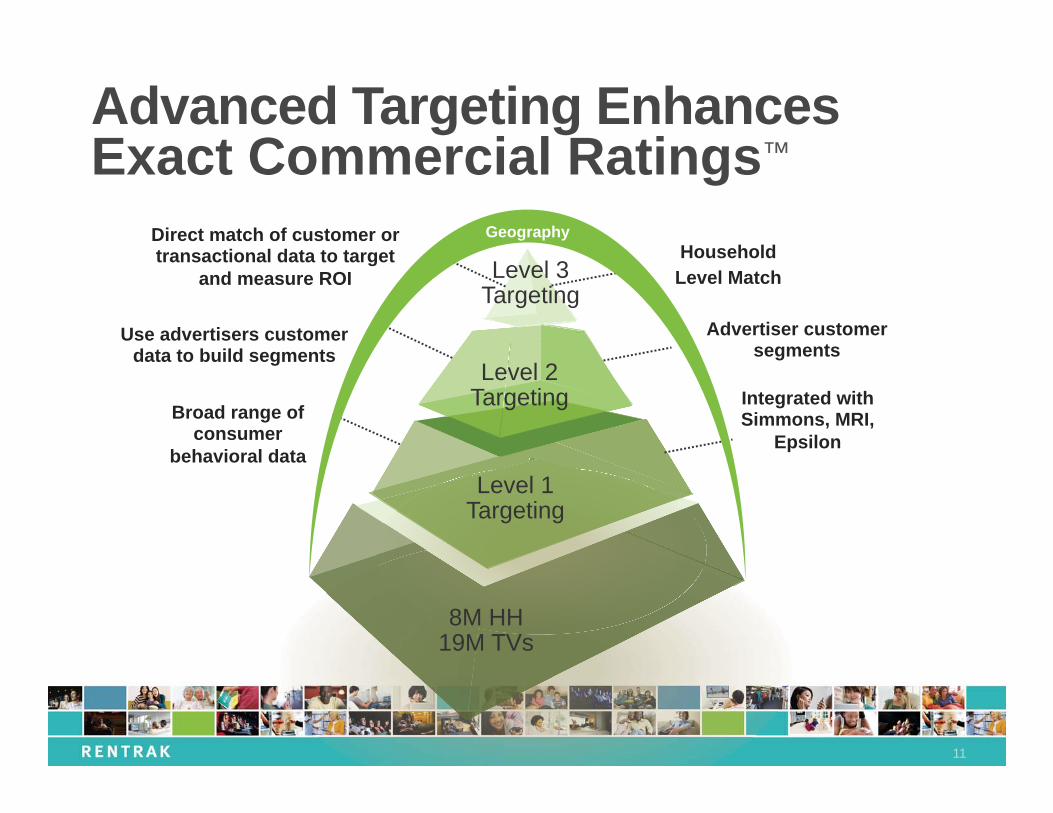
8M HH 19M TVs
Level 1 Targeting
Level 2 Targeting
Level 3 Targeting
Integrated with Simmons, MRI,
Epsilon
Advertiser customer segments
Household Level Match
Broad range of consumer
behavioral data
Use advertisers customer data to build segments
Direct match of customer or transactional data to target
and measure ROI
Geography
Advanced Targeting Enhances Exact Commercial Ratings™

12
Exact Commercial Ratings™ (ECR)
Two paths to ECR™ in Rentrak: • Kantar national commercial occurrence information across
76 broadcast and cable networks. • Received and processed 12 days after airing
• 5 second threshold of viewing
• Custom Schedule Analysis

13
Rentrak Examples

14
ECR™ vs. Program

15
ECR™ vs. Program
In the 10/7 episode of 60 Minutes, the Subway ad, which starts in the 3rd pod, has a higher rating (14.60) than the telecast average (12.90).

16
ECR™ vs. Pod Position

17
ECR™ vs. Pod Position
When we look at the entire 3rd pod for 60 Minutes, that Subway ad clearly benefits from first position placement, rating 0.62 points higher than the pod average (13.98).
13.98 pod average

18
ECR™ vs. Commercial Average

19
ECR™ vs. Commercial Average
Commercial Average = 6.83
ECR™ can also demonstrate the difference between an ad’s performance and the entire commercial average. A trailer for Frankenweenie in Modern Family for instance, that wasn’t in the first pod or even a first position, out performs the total commercial average.

20
ECR™: Competitive Analysis

21
ECR™: Competitive Analysis
ECR™ allows users to directly compare advertising to competitors. In this telecast example, Allstate benefits from a last, non-promo position which drives a higher rating than Geico’s middle position.

22
ECR™: Network & Series Performance ECR™ can convey a wealth of summarized information about buys, including which networks or series work best for any amount of time, by daypart, by pod, by position, by competitive and creative.

23
ECR™: Network & Series Performance
For E*Trade, we can see that the buys on CNBC, GOLF, NBC SPORTS, etc. performed better for the high net worth audiences

24
ECR™: Commercial Duration ECR™ compares the various commercial durations from a campaign in any number of ways.

25
ECR™: Commercial Duration
Here, E*Trade’s :15 spots not only have a higher basic rating, but also have a higher ad-to-telecast ratio than the :30s. This means that the :15 spots not only rate higher, but also perform better when controlled for the show environment they’re in.

26
ECR™ Flowchart Here we see ECR™ data put together from broadcast weeks, networks, series, demographics, etc. to essentially rebuild a potential competitor’s entire Q1 schedule based on REAL ECR™ GRPs.

27
Branded Entertainment iTVX and Rentrak monitored and appraised Branded Entertainment (BE) within NBCU’s coverage of the London 2012 Olympics: • An Exact Commercial Audience
• An Exact Branded Entertainment Audience
• Ability to combine both Branded Entertainment and Commercial metrics
• Comparison across advertisers
• Comparison between BE and traditional commercials
• Quantification of incremental added value of Branded Entertainment

28
London 2012 – BE Examples
Week One Only
Advertiser Exact Average Audience (Commercials)
Exact Average Audience (BE)
# of Ads # of BE Events BE to Ad Index
AT&T 14.1 17.2 61 43 122BP 6.9 7.7 11 6 112Chevrolet 13 13.9 120 56 107Citibank 11.7 9.5 49 18 81Coca-Cola 14.7 18 38 85 123McDonald’s 14.9 15.8 28 16 107P&G 12.6 20.3 72 80 161Visa 15.3 17.6 40 45 115
Audience Size IN MILLIONS OF TV HOUSEHOLDS
P&G’s BE placement outperformed their ad placement.
BP 6.9 7.7 11 6 112Ch l t 13 13 9 120 56 107
P&G 12.6 20.3 72 80 161

29
• Exact Commercial Ratings™ offer a wealth of strategic leverage points.
• Rentrak will give any advertiser a free schedule analysis: • Contact Evan Goldfarb, SVP, Agency Sales – [email protected]

Chief Research Officer [email protected]
Blog: BruceGoerlich.com
twitter: @BGoerlich
January 22, 2013
Bruce Goerlich
30


![Gibson Dunn: Media, Entertainment and Technology Group ......Forza Horizon . series).[45] Microsoft now owns thirteen gaming development studios.[46] B. SVOD Update. 1. Diversification,](https://static.fdocuments.in/doc/165x107/5f4fe48136913912fb04368d/gibson-dunn-media-entertainment-and-technology-group-forza-horizon-series45.jpg)
![Web viewTHIS VOD & SVOD LICENSE AGREEMENT (together with all exhibits, attachments and schedules hereto, “Agreement”), dated as of [_________ __, 20__] (“Agreement Date](https://static.fdocuments.in/doc/165x107/5aad07097f8b9a8f498dc0dd/web-viewthis-vod-svod-license-agreement-together-with-all-exhibits-attachments.jpg)


![wikileaks.orgDeals... · Web viewTHIS VOD & SVOD LICENSE AGREEMENT (together with all exhibits, attachments and schedules hereto, “Agreement”), dated as of January [__], 2013](https://static.fdocuments.in/doc/165x107/5a7138497f8b9ab1538ca43f/wikileaksorg-dealsdoc-fileweb-viewthis-vod.jpg)
