Renfrew CFDC Renewable Energy Final Report · Renfrew County CFDC Renewable Energy Report May 2011...
80
Renfrew County CFDC Renewable Energy Research Project Final Report May 11, 2011
Transcript of Renfrew CFDC Renewable Energy Final Report · Renfrew County CFDC Renewable Energy Report May 2011...
Renfrew County CFDC Renewable Energy Research
Project
Final Report May 11, 2011
Final Report May 11, 2011
EXECUTIVESUMMARY.........................................................................................................................................1
1.ACKNOWLEDGEMENTS...................................................................................................................................2
2.OVERVIEWANDPROJECTSCOPE.................................................................................................................3PROJECTSCOPE.......................................................................................................................................................................4
3.PROCESS...............................................................................................................................................................5PROJECTTEAM........................................................................................................................................................................5FINANCIALMODELS................................................................................................................................................................6SITEVISIT‐RENFREW...........................................................................................................................................................7SITEVISIT‐SHARBOTLAKE.................................................................................................................................................7SECONDSITEVISIT–RENFREW...........................................................................................................................................8NyleneCanadaInc...................................................................................................................................................................8BenHokum&SonLtd............................................................................................................................................................9HerbShaw&SonsLtd........................................................................................................................................................10
4.LITERATUREREVIEW...................................................................................................................................12ONTARIOFEED‐INTARIFF(FIT).......................................................................................................................................16BIOMASSTECHNOLOGIES....................................................................................................................................................21CANADIANENERGYPRODUCTIONFROMBIOMASS.........................................................................................................27CapacityFactors....................................................................................................................................................................28
UBCBIOENERGYRESEARCHANDDEMONSTRATIONPROJECT.......................................................................................30FORESTBIOMASSVOLUME..................................................................................................................................................32MILLRESIDUE.......................................................................................................................................................................32FORESTRESIDUESUPPLYCHAINS.....................................................................................................................................33CASESTUDY:BIOMASSPOWERCOSTANDOPTIMUMPLANTSIZEINWESTERNCANADA.............................................34REVIEWCONCLUSION...........................................................................................................................................................35
5.ASSUMPTIONS,ANALYSISANDDISCUSSION........................................................................................36ASSUMPTIONS........................................................................................................................................................................36ANALYSIS................................................................................................................................................................................38PaybackPeriodDifference...............................................................................................................................................42FuelCostDifference.............................................................................................................................................................42
6.RECOMMENDATIONS....................................................................................................................................43
APPENDIX1:ONTARIOBIOMASSENERGYALLIANCE...........................................................................46
APPENDIX2:INTERVIEWQUESTIONS........................................................................................................47
APPENDIX3:HOWBIOMASSENERGYWORKS.........................................................................................51
APPENDIX4:SPREADSHEETCALCULATIONSOFFITRATESCENARIOS............................................0
APPENDIX5:HYDROONECONNECTIONIMPACTASSESSMENTFEES................................................0
GLOSSARY.................................................................................................................................................................3
Renfrew County CFDC Renewable Energy Report May 2011 Page 1 of 70
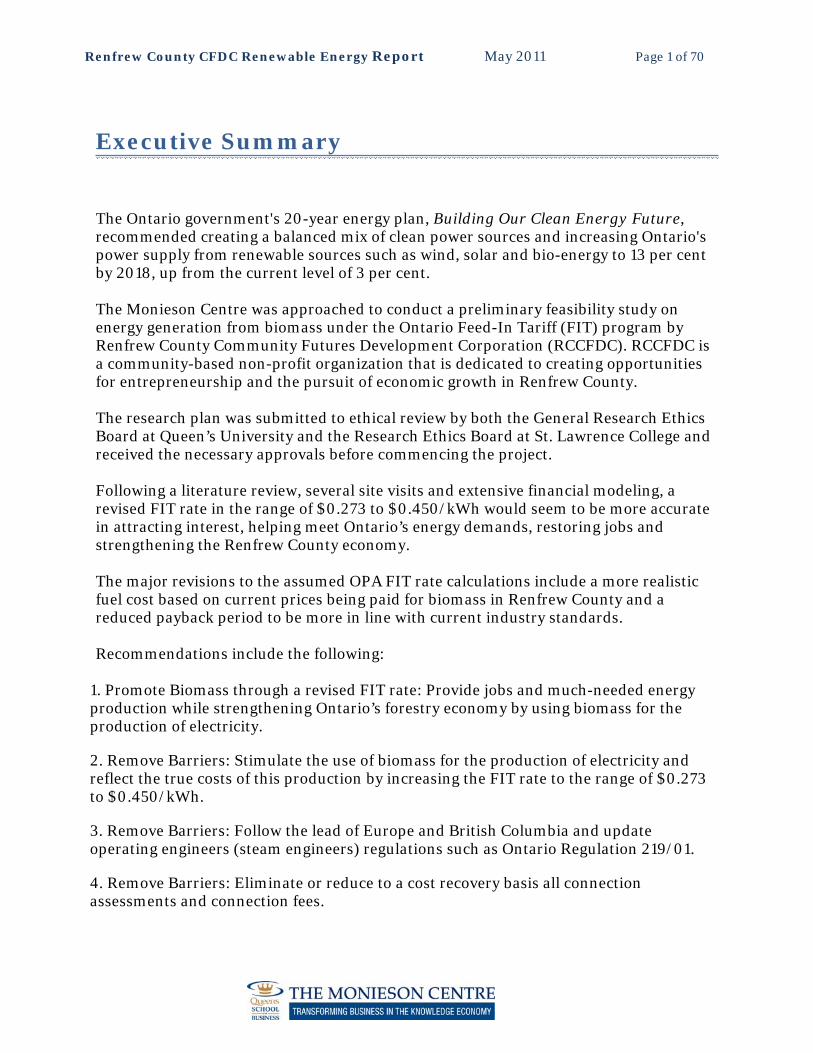
Executive Summary
The Ontario government's 20-year energy plan, Building Our Clean Energy Future, recommended creating a balanced mix of clean power sources and increasing Ontario's power supply from renewable sources such as wind, solar and bio-energy to 13 per cent by 2018, up from the current level of 3 per cent.
The Monieson Centre was approached to conduct a preliminary feasibility study on energy generation from biomass under the Ontario Feed-In Tariff (FIT) program by Renfrew County Community Futures Development Corporation (RCCFDC). RCCFDC is a community-based non-profit organization that is dedicated to creating opportunities for entrepreneurship and the pursuit of economic growth in Renfrew County. The research plan was submitted to ethical review by both the General Research Ethics Board at Queen’s University and the Research Ethics Board at St. Lawrence College and received the necessary approvals before commencing the project. Following a literature review, several site visits and extensive financial modeling, a revised FIT rate in the range of $0.273 to $0.450/kWh would seem to be more accurate in attracting interest, helping meet Ontario’s energy demands, restoring jobs and strengthening the Renfrew County economy. The major revisions to the assumed OPA FIT rate calculations include a more realistic fuel cost based on current prices being paid for biomass in Renfrew County and a reduced payback period to be more in line with current industry standards. Recommendations include the following:
1. Promote Biomass through a revised FIT rate: Provide jobs and much-needed energy production while strengthening Ontario’s forestry economy by using biomass for the production of electricity.
2. Remove Barriers: Stimulate the use of biomass for the production of electricity and reflect the true costs of this production by increasing the FIT rate to the range of $0.273 to $0.450/kWh.
3. Remove Barriers: Follow the lead of Europe and British Columbia and update operating engineers (steam engineers) regulations such as Ontario Regulation 219/01.
4. Remove Barriers: Eliminate or reduce to a cost recovery basis all connection assessments and connection fees.
Renfrew County CFDC Renewable Energy Report May 2011 Page 2 of 70
1. Acknowledgements
Leo Hall, Owner/Operator, Opeongo Forestry Service 199 Opeongo Road, Renfrew, ON K7V 2T2 Tel: 613-432-5209 [email protected] A considerable amount of background information was gleaned from Mr. Hall’s research, both here and in Europe, into the use of biomass in electricity and steam generation, and he provided invaluable assistance in reviewing and refining the report drafts. David Stewart, Chair, Renfrew County Community Futures Development Corporation 2 International Drive, Pembroke, ON K8A 6W5 Tel: 613-735-3951 [email protected] Sincere thanks to Mr. Stewart who opened many doors, made many introductions, and clarified many concepts to greatly improve the data collection for this report. Alastair Baird 9 International Drive, Pembroke, ON K8A 6W5 Tel: 613-735-0091, ext. 466 [email protected] Mr. Baird helped coordinate site interviews and introduced the research team to many valuable contacts in Renfrew County. Martin Lensink, P. Eng., Principal-In-Charge, CEM Engineering 26 Hiscott Street, Suite 201, St. Catharines, ON L2R 1C6 Tel: 905-935-5815 [email protected] www.cemeng.ca We acknowledge and thank Martin Lensink of CEM Engineering for his substantial assistance. CEM has extensive experience in converting biomass resources to thermal and electrical energy via a number of cogeneration technologies. They prepared the initial financial model using the assumptions provided by the OPA in May 2009. Christopher Amey, PE, Director, Project Development, Rentech, Inc. 1331 17th Street, Suite 720, Denver CO 80202 Tel: 720-274-3116 [email protected] www.rentechinc.com
Renfrew County CFDC Renewable Energy Report May 2011 Page 3 of 70
Mr. Amey acted as a very knowledgeable "sounding board" for ideas and conclusions relevant to the project and consistently delivered excellent suggestions.
2. Overview and Project Scope
On November 23, 2010, following passage of the Green Energy and Green Economy Act, 2009,1 the Ontario government announced an updated Long-Term Energy Plan that set the course for a clean energy revolution to create thousands of good new jobs in Ontario, and clean up the air we breathe. The government's 20-year energy plan, Building Our Clean Energy Future,2 recommended creating a balanced mix of clean power sources and increasing Ontario's power supply from renewable sources such as wind, solar and bio-energy to 13 per cent by 2018, up from the current level of 3 per cent.
Over the next 20 years, about 80 percent of Ontario’s existing electricity supply capacity will need to be replaced with a combination of conservation and new supply facilities. This outlook reflects some clear realities: projected population and economic growth; the decisions required for Ontario’s nuclear-power generating facilities, which today account for about one-half of total supply; and the need to eliminate environmentally harmful coal-fired generation, which today accounts for about 20 percent of supply.3
Encouraged by this positive synergy between job creation and renewable energy production, the Renfrew County Community Futures Development Corporation (RCCFDC) approached The Monieson Centre to conduct a preliminary feasibility study on energy generation from biomass under the Ontario Feed-In Tariff (FIT) program. RCCFDC is a community-based non-profit organization that is dedicated to creating opportunities for entrepreneurship and the pursuit of economic growth in Renfrew County.
Biomass energy – the conversion of organic waste matter into a combustible fuel for electricity generation – is a cost-effective energy source that can reduce dependence on non-renewable fuels without harming the environment and as an adjunct to other agricultural operations. Ontario has plentiful sources of biomass than can be tapped for electricity generation, especially residual material from forestry and
1 Government of Ontario, Legislative Assembly of Ontario, http://www.ontla.on.ca/web/bills/bills_detail.do?locale=en&BillID=2145.(accessed Mar 29, 2011) 2 Government of Ontario, “Ontario’s Long Term Energy Plan, Building Our Clean Energy Future”, http://www.mei.gov.on.ca/en/energy/html/LTEP_en.html. (accessed March 16, 2011) 3 Government of Ontario, “Ontario’s Renewable Energy Standard Offer Program”, June 2008
Renfrew County CFDC Renewable Energy Report May 2011 Page 4 of 70
agricultural production, as well as millions of tonnes of organic municipal waste.4
The Monieson Centre works with organizations and researchers to provide leading-edge solutions to business, industry and community challenges. Findings are then translated into effective, practical recommendations. The Monieson Centre offers real-world solutions that are evidence-based and comprehensive, so working with RCCFDC on this project was a good fit. Currently, the revenue for electricity fed into the Ontario Power Authority (OPA) grid system is set by the FIT rate. The current FIT rate for biomass power is set at $0.13/kWh, while solar and wind rates are set much higher, up to $0.80/kWh. Potential operators of biomass plants in Renfrew County have estimated a break even price of $0.19-$0.20/kWh to meet the costs of wood supply and plant construction and operation. The OPA will review and modify (if justified) its FIT rates in the fall of 2011 with analysis beginning in spring 2011. To support the justification of an increased rate for biomass energy, RCCFDC sought research on biomass co-generation (power/heat) costs versus revenue. This report opens a dialogue between proponents of low-carbon socioeconomic development in Eastern Ontario and members of the business, economic development, and academic communities in the region. The aim is to support sustainable business development by attracting the required financial and human capital.
Project Scope The scope of the project includes a literature review and an analysis of input costs for a biomass energy supply system including the following:
Biomass value paid to landowner or mill owner in the case of sawmill residue Harvesting costs Transportation costs Processing costs at the energy production site Energy site costs (i.e., construction-capital investment return, operating costs,
labour, utilities, administration and marketing). Based on these costs, recommendations will include an appropriate FIT rate in compliance with the Green Energy and Green Economy Act to encourage the production of electricity in Renfrew County from biomass.
4 Ibid, p. 5
Renfrew County CFDC Renewable Energy Report May 2011 Page 5 of 70
3. Process
Project Team The Monieson Centre established a project team of Queen's faculty and graduate students and experts from other universities to oversee the project, execute the research protocol, and provide recommendations. The research plan underwent ethical review by both the General Research Ethics Board at Queen’s University and the Research Ethics Board at St. Lawrence College and received the necessary approvals before commencing. The project team included the following: The Monieson Centre Dr. Yolande Chan, Director & Jeff Dixon, Assistant Director By drawing together leading researchers, The Monieson Centre at Queen’s School of Business helps organizations and communities discover how to harness and enhance their knowledge capital in the knowledge economy. Teams conduct applied research for client organizations, focusing on complex organizational and knowledge management issues. The Centre then translates these research findings into practice-based recommendations. Moore Partners Steven Moore, Partner & Susan Moore, Partner Moore Partners has implemented and assessed sustainability projects for over 25 years. Current clients include Queen’s University, Bader International Study Centre, Quinte Economic Development Commission, Lennox & Addington Economic Development, St. Lawrence College, Loyalist College, Toronto Region Conservation, Lower Trent Conservation, Ganaraska Region Conservation Authority, Public Works and Government Services Canada, Lennox & Addington Stewardship Council, and Hastings Stewardship Council. Laurentian University’s Bachelor of Business Administration degree program at St. Lawrence College Vincent Durant, Professor Laurentian University offers its Bachelor of Business Administration (BBA) at St. Lawrence College in Kingston. The program is focused on providing an honours degree that combines the practical strengths of a college with the theoretical underpinnings of a university. The focus of this program is to provide access to education in a seamless manner, which gives credit for prior academic and experiential learning.
Renfrew County CFDC Renewable Energy Report May 2011 Page 6 of 70
Queen’s School of Business Centre for Responsible Leadership Dr. Tina Dacin, Director The Queen’s School of Business Centre for Responsible Leadership was founded in 2004 to educate a generation of globally responsible leaders. It fosters high-quality research to build knowledge on topics related to the successful formation and implementation of Responsible Leadership practice strategies. It supports the non-profit community and is a global advocate for Responsible Leadership. Queen’s University Institute for Energy and Environmental Policy Dr. Warren Mabee, Director The Queen's Institute for Energy and Environmental Policy arises from the conviction that trans-disciplinary research increases the scope and influence of work that is already being done. The Institute promotes the meeting of unlike minds; it offers a crossroads where the best academic research intersects with the challenges of policy makers and industry. Sustainable Bioeconomy Centre at Queen’s University Dr. Andrew Pollard, Director The Sustainable Bioeconomy Centre (SBC) is creating a collaborative community to advance the environmental, economic and ethical use of biological resources within the Great Lakes Region. The SBC community serves as the forum for biological, financial and academic engagement in the process of advancing the bioeconomy. Also contributing were Tom Elmer, Industry Liaison, St. Lawrence College; Kevin Majkut, MSc Candidate, Queen’s School of Business; Kanishka Panchal, MSc Candidate, Queen’s School of Business; and Jacqueline Corbett, PhD Candidate, Queen’s School of Business. Data collection included industry analysis, local site analysis, in-depth interviews, and information from other jurisdictions. Data analysis included financial modeling of several different sizes of electricity generating facilities.
Financial Models A web-based search was initiated by the research team to discover what financial models were available for an analysis of the costs of burning biomass to produce electricity. Several models were considered, including one dealing with the food industry, the best being the RetScreen International Model developed by the government of Canada.5 The team also investigated a model developed and used by CEM Engineering in their earlier study on turning biomass to steam that involved Renfrew County and an industrial manufacturer. After discussions with a member of the research team, Martin
5 Natural Resources Canada, “RETScreen Software Biomass Heating Model”, http://www.retscreen.net/ang/g_biomas.php. (accessed November 5, 2010)

Renfrew County CFDC Renewable Energy Report May 2011 Page 7 of 70
Lensink of CEM Engineering generously supplied the research team with the financial model used in that study. The research team discussed the two models (RetScreen and CEM's model) with Prof. Warren Mabee, who was familiar with RetScreen. It was agreed that the CEM model was the better one for our purposes, in part because Martin Lensink and his colleagues had been able to infer, from discussions/meetings with OPA, certain assumptions being made by OPA for their determination of FIT rates. Concurrent with these decisions, data gathering and verification were being carried out by the research team including preliminary contacts with forestry companies and sawmill operators in Renfrew County and the management at Nylene Canada.
Site Visit - Renfrew A Member of the research team attended a meeting of the Ontario Biomass Energy Alliance (OBEA) on November 23, 2010 in Renfrew chaired by Alastair Baird, Manager of Business and Economic Development at the County of Renfrew. The objective of the meeting was to begin promoting investment in biomass projects and finding interested parties willing to invest. (For more information on the Ontario Biomass Energy Alliance, please see Appendix 1.) Issues addressed included the following: Reduced forestry activity in Renfrew County is badly hurting the local economy Practices in Sweden, Finland, and Germany might be helpful in our region Most incentives have been used for power and not for heat In Ontario, we have ample forests but reduced sawmill production and reduced
sawmill residue The Forest Products Association of Canada may have useful models Limited grid capacity may hinder biomass projects Unfortunately, OPA will not assess capacity until an application is submitted.
Site Visit - Sharbot Lake On December 9, 2010, members of the research team met with David Stewart, Chair of RCCFDC, and Barry Verch of M. W. Miller Logging, based in Eganville, for a tour of one of Barry’s red pine harvest operations on crown land. They viewed a harvesting machine that cut the trees down, stripped the branches and cut the logs into lengths and the loading operation of pine logs to a logging truck, as Barry explained the machinery and the process.
Renfrew County CFDC Renewable Energy Report May 2011 Page 8 of 70
Most wood contains 60-75 per cent moisture when cut. If left to dry for several months, it will decrease to 30-40 per cent. A certain level of residue should be left on the ground to replenish nutrients for future growth, but much of the nutrient requirement is supplied by dropped needles from previous years. The local situation was described in detail by David and Barry, including the closure of pulp mills and panel operations, and the local loss of jobs. Without the income from the sale of forest residue and low-end products, the normal logging operations are not profitable enough to continue. There was a good discussion of costs, transportation, uses for the wood products, government restrictions, and possible scenarios for FIT programs.
Second Site Visit – Renfrew Prior to the Renfrew research interviews, the research team identified three interview candidates and sent them each a questionnaire in advance (see Appendix 2). During a second visit to Renfrew County on February 3rd and 4th, 2011, interviews were held with representatives of Nylene Canada Inc. in Arnprior, Herb Shaw & Sons Ltd. in Pembroke and Ben Hokum & Son Ltd. in Killaloe to gather data for use in developing a financial model/case to determine the most appropriate FIT rate for biomass electricity production. Meetings were also held with David Stewart, Chair of RCCFDC; Diane McKinnon, Executive Director of RCCFDC; and Leo Hall, owner/operator of Opeongo Forestry Services, Renfrew. David Stewart and Leo Hall offered invaluable assistance during this visit to Renfrew County by taking time from their busy schedules to discuss the Renfrew biomass project and to view nearby logging operations.
Nylene Canada Inc. The Nylene Canada Inc. Arnprior Site has been in operation since 1966. It is a diverse manufacturing plant for nylon 6 polymers and continuous filament carpet yarns in North America. The processes of polymerization, depolymerization, compounding, fiber extrusion, cabletwist and heatsetting are contained on this site. Nylene has developed an integrated closed loop system producing polymers and yarns with varying levels of recycled content. The use of steam in their manufacturing process and a large industrial load makes them a possible candidate for a cogeneration program. David Steeds, Director of Manufacturing Services at Nylene Canada,6 pointed out in person and in subsequent correspondence the need for Operating Engineers for any
6 http://www.nylene.com/nylene_canada_inc.html (accessed March 22, 2011)
Renfrew County CFDC Renewable Energy Report May 2011 Page 9 of 70
biomass plant under consideration. He made reference to Ontario Regulation 219/017 that lays out the need for operators of boilers in Ontario. He indicated that this requirement may be a regulatory and financial challenge to the ability to operate biomass electrical generation facilities and mentioned other jurisdictions, such as British Columbia and Norway, where this may not be required because of differences in regulations regarding the construction and operation of steam generation and prime movers. Renfrew Sawmills Stockpiling of Residue Cost is a major reason that the mills cannot stockpile a large amount of residue. Other considerations include environmental issues, such as sawdust blowing into the air and water, risk of fire, etc. If the market dries up, the mills can only stockpile for the short term. Revenues The mills receive average net rates of $18 to $35 per green tonne, net to the mill, depending on the species of biomass. They do not calculate the “cost” of their residual biomass. Rather, any net revenue from selling it is applied against the costs of their overall sawmill operations. Cogeneration For some mill operations, there may be an opportunity to operate a “package boiler” on site. This would involve chipping the residuals by putting them through a hammermill, then using torrefaction to render the material to a coke-like consistency, making it easier to store than either raw biomass or pellets. Following this, the torrified material is fed into a cogeneration package boiler that would provide electricity to the grid under the FIT program and heat that could be used to kiln-dry lumber on site.
Ben Hokum & Son Ltd. Ben Hokum & Son Limited,8 a family-operated company in business since 1956, is situated near Killaloe. Their operation utilizes a large log mill using a carriage for its primary breakdown and an optimized, automated high production small log mill. They have grown to be the largest mill in Renfrew County. North American Sawmills Machinery is part of Ben Hokum & Son, and specializes in the fabrication of sawmill machinery, and parts and steel distribution. Their large volume of lumber production makes them a possible candidate for a biomass generation facility. Dean Felhaber, President of Ben Hokum & Son, indicated that they have room for a biomass cogeneration (electricity and heat) operation at their site in Killaloe, and provided the following details on their operation:
7 Ontario Regulation 219/01, Operating Engineers, Queen’s Printer for Ontario, 2001. 8 http://benhokum.com/ (accessed March 22, 2011)

Renfrew County CFDC Renewable Energy Report May 2011 Page 10 of 70
Their sawmill produces approximately 100,000 green tonnes of bark, sawdust, chips
and roundwood pulp per year. Their sawmill operation produces 55 per cent usable lumber and 45 per cent residue. They currently ship the vast majority of their biomass to Quebec. Bark is sent to southern Ontario. 90 per cent goes for mulch; 10 per cent goes to
other locations for hog fuel (wood chips or shavings, residue from sawmills, etc., used for fuel, landfill, and animal feed, and for surfacing paths and running tracks). (Mulch is bark that is used for landscaping, paths/tracks, and soil amendment applications. Hog fuel is bark that is used for fuel purposes.)
They have a 44 kilovolt (kV) line to their site that might be capable of transmitting to the grid.
Herb Shaw & Sons Ltd. Established in 1847, Herb Shaw & Sons Limited, situated near Pembroke, is a family owned company producing pine lumber and utility poles with timber procured from managed forests. The company produces 45,000 poles and the sawmill produces 14 million board feet of rough lumber annually. Their operation includes a sawmill, poleyard and wood-drying facilities. They are a possible candidate for a biomass generation facility because they have the required space and a high volume of tree-length wood. John Shaw, President, and his cousin Dana Shaw, Vice-president, are the principals of Herb Shaw & Sons Ltd.9 Details of their operation are as follows: Currently, 95 per cent of their sawmill residue (biomass) goes to pulp mills in
Quebec. Bark goes for landscaping to an agent in Ontario for mulch. Their yearly production of residue includes:
o 9,000 ODT (oven-dried tonnes) of pine chips o 5,000 ODT of sawdust o 250 loads of white pine bark o 300 loads of red pine peeling (from poles) o 10,000 GT (green tonnes) with 60 per cent moisture content of hardwood
pulp (roundwood) o 20,000 GT of poplar pulp (roundwood) o 10,000 GT of softwood pulp (roundwood).
Note: A load of green wood is a tractor-trailer load with a moisture content of 60 per cent and is equivalent to 14 to 15 oven-dried tonnes. A load of oven-dried wood is a tractor-trailer load with a moisture content of close to zero per cent and is 36 tonnes.
9 http://www.shawlumber.ca/operations (accessed March 22, 2011)

Renfrew County CFDC Renewable Energy Report May 2011 Page 11 of 70
The moisture content makes a significant difference in transportation costs and the load limit on the highways is 36 to 38 tonnes per load. Information gained from this second Renfrew trip was circulated to the research team and adjustments were made to the CEM model to include five scenarios: a 1.5-year payback, a 3-year payback, a 5.2-year payback, a 6.4-year payback, and the current FIT rate (11.8-year payback). These scenarios are reported in the Assumptions, Analysis and Discussion section of this report.
Renfrew County CFDC Renewable Energy Report May 2011 Page 12 of 70
4. Literature Review
The Case for Biomass Ontario Electricity Needs According to the Ontario government’s Long Term Energy Plan10 (released in September, 2010) Ontario's population is expected to rise about 28 per cent — a gain of almost 3.7 million people by the year 2030. The Ontario Power Authority forecasts that this will require more than 15,000 MW (megawatts) of electrical capacity to be renewed, replaced or added. To meet these needs Ontario will need a diverse supply mix and both small and large generators.
Ontario is also planning for energy generation that will involve efficient, localized generation from smaller, cleaner sources of electricity rather than relying exclusively on large, centralized power plants transmitting electricity over long distances. This strategy is known as "distributed generation." Distributed generation opens up opportunities for smaller power producers, allowing individuals, Aboriginal communities and small co-operatives or
partnerships to become generators. Ontario will continue to develop its renewable energy potential over the next decade. Based on the medium growth electricity demand outlook, 10,700 MW of renewable capacity (wind, solar and bioenergy) as part of the supply mix by 2018 is anticipated. This forecast is based on planned transmission expansion, overall demand for electricity and the ability to integrate renewables into the system. This target will be equivalent to meeting the annual electricity requirements of two million homes. The province's renewable energy capacity target will be met with the development of renewable energy projects from wind, solar, biogas, landfill gas and biomass projects across Ontario.11
10 Ontario Ministry of Energy, Long Term Energy Plan, Queen’s Printer for Ontario, 2010, http://www.mei.gov.on.ca/en/energy/, p. 8.Queen’s Printer for Ontario, 2010 11 Ibid., p. 31
Renewable energy—wind, solar, hydro and bioenergy — is an important part of the supply mix.1o
Renewable energy makes it possible to generate electricity in urban and rural areas where it was not feasible before.11
Renfrew County CFDC Renewable Energy Report May 2011 Page 13 of 70
According to the Canadian federal government’s Invest in Canada, a bureau of the Department of Foreign Affairs and International Trade, Canada has the world’s third-largest forest areas; some 44 per cent of the land area is forested and 92 per cent of Canadian fibre (trees) is publicly owned. As could be expected, Canada has a large, well-developed forest sector and is one of the world’s largest exporters. For example, the forest industry exported $41.9 billion in paper, pulp, lumber, board, and other forest products in 2005. The production of woody biomass, which could be used as fuel for electricity generation, is commensurate with this production of forest goods.12 Ontario Biomass With over 68 million acres of forested land and a long-established forestry industry, Ontario offers great opportunities for biomass cogeneration. It is estimated that Ontario’s forest biomass has the potential to supply about 7 per cent of the province’s electrical energy.13 Ontario’s Ministry of Natural Resources is exploring the potential for electricity generation from forest biomass, promoting innovative technologies and developing a policy framework that encourages companies and communities to engage in business ventures in this sector. Renfrew County Renfrew County has a wide diversity of forests, topography, lakes and wetlands. The Canadian Shield that dominates a large portion of the county is marked by red and white pine, aspen, red oak and red maple. Tolerant hardwoods such as sugar maple, beech and basswood prefer scattered pockets of better soil. Sandy flats support jack pine, while the west end of the county is more boreal with aspen, birch, spruce and fir. Finally, the eastern region of the county has agricultural clay soils and supports mixed woods with elm, green ash and bur oak.14 Forestry is a vital part of Renfrew County. Approximately 265,100 hectares (655,100 acres) of the forest is private land, covering 53 per cent of the county, and over 100 forest product companies depend on these forests.15 However, this vitality is diminishing. Ontario's Annual Allowable Cut, that is, the volume of wood that can be harvested from public lands each year, is roughly 32 million cubic metres (m3)/annum.16 But, for many reasons, the Ontario forestry industry is shrinking. 12 Invest in Canada: Biomass Cogeneration, Invest in Canada Bureau, Foreign Affairs and International Trade, Her Majesty the Queen in Right in Canada, 2009, http://investincanada.gc.ca/eng/publications/biomass.aspx, p. 1 13 Ibid., p. 31 14 The Renfrew Chapter of the Ontario Woodlot Association, http://www.ont-woodlot-assoc.org/chapt_Renfrew.html. (accessed Feb. 20, 2010) 15 Ibid. 16 Warren E. Mabee, K. Calvert, N. Manion, J. Mirck, J. Stephen, T. Wood, “Biomass�derived fuels for transportation” (paper presented at the FCRC�NRC Fifth Annual Colloquium on Fuel Cell and Hydrogen Technologies, Kingston, ON, CanadaDecember 14, 2010).

Renfrew County CFDC Renewable Energy Report May 2011 Page 14 of 70
As Dr. Luc Duchesne, the President and CEO of Forest BioProducts Inc., a firm conducting project development in bioproducts, says, “At the best of times, when the forest industry was thriving and the mills were humming day and night, we harvested 25 M m3/annum. Now we are harvesting about 14 M m3/annum. At the best of times, we have a resource at 18 M m3/annum that is used neither as fibre or biofibre. In practice, this means we are not supporting jobs with this wood. It means we aren't taking advantage of our resources.”17 There is considerable disagreement that Ontario's Annual Allowable Cut is, in fact, sustainable, but there does appear to be unused capacity within the limits of sustainability. Products from forestry operations could be used as biomass fuel in Renfrew County to help meet Ontario’s future power needs. Direct Combustion power plants burn the biomass fuel directly in boilers that supply steam for the same kind of steam-electric generators used to burn fossil fuels. The heat generated can be used to dry the feedstock before it is burned and to heat nearby buildings, while any excess steam can also be used to drive any number of industrial processes.
17 Dr. Luc Duchesne, “If a tree falls in the woods where is the value?” Northern Ontario Business, March 1, 2009, http://www.thefreelibrary.com/If+a+tree+falls+in+the+woods+where+is+the+value%3f-a0195856791 (accessed March 26, 2011)
Renfrew County CFDC Renewable Energy Report May 2011 Page 15 of 70
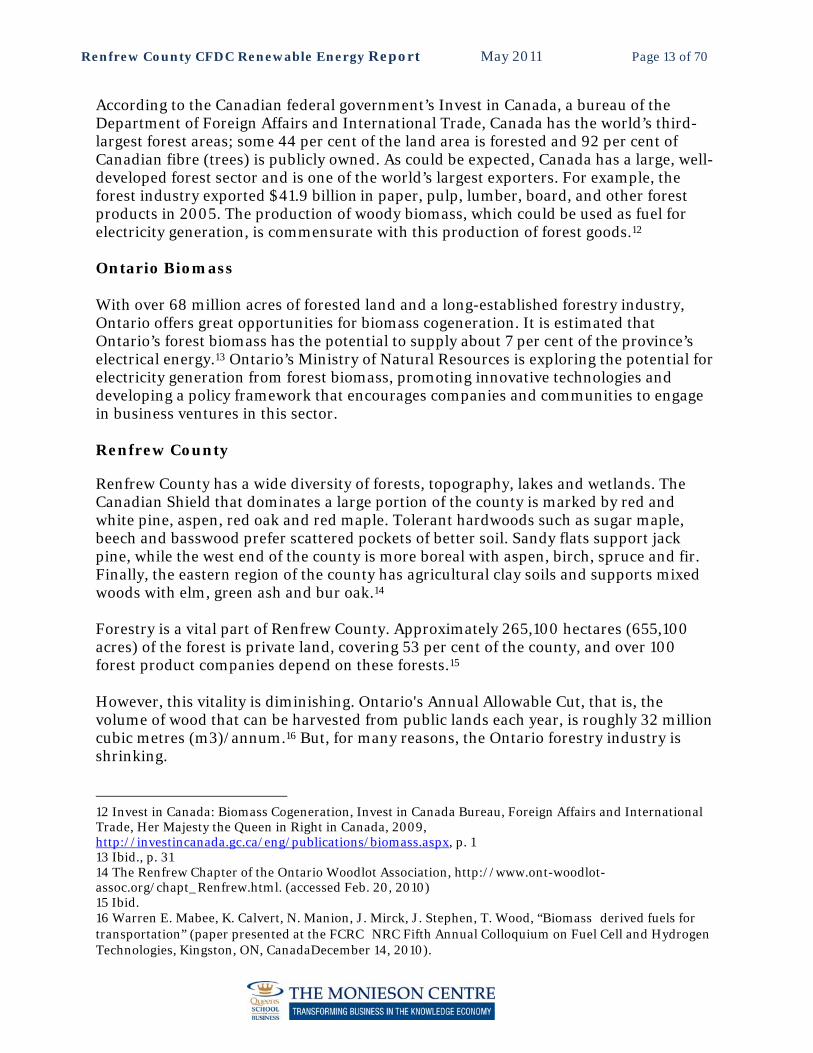
Figure 1: Renfrew County Forests18
A complete description of the conversion of biomass to electrical energy from the Union of Concerned Scientists can be found in Appendix 3: How Biomass Energy Works. Biomass conversion projects can take many forms, from steam production only to electricity production only, with various combinations in between. Key project drivers tend to be:
Proximity to fuel supply by-products and surplus materials from the forestry and paper sector
Proximity to transmission and distribution systems Governmental policies encouraging green technologies Existing and future land uses and zoning approval Market rate for energy produced.
18 County of Renfrew Forestry Map, http://www.countyofrenfrew.on.ca/departments/development-and-property/forestry/forestry-map/. (accessed Feb. 5, 2010)
Renfrew County CFDC Renewable Energy Report May 2011 Page 16 of 70
With these drivers in mind, the Invest in Canada bureau provides a representative profile as follows that is a good general description of the requirements of a 50 MW biomass project: 19
General description of operations Biomass cogenerating (heat and electricity) facility that uses bark, wood chips, wood pellets and sludge, with 50 MW electrical capacity Capital costs for machinery and equipment CDN $ 65,000,000 Estimated costs for financial modeling Labour Production operatives: 40 Supervisor/engineers: 10 Maintenance and technicians: 10 Management and administration: 3 Property Land: 4 acres Building: 49,000 sq. ft. Utilities Monthly power consumption: 500,000 kWh
Ontario Feed-In Tariff (FIT) The key to developing the renewable resources of Renfrew County is Ontario's Feed-In Tariff or FIT Program, North America's first comprehensive guaranteed pricing structure for renewable electricity production.20 The FIT Program offers stable prices under long-term contracts for energy generated from renewable sources, including biomass, biogas, landfill gas, on-shore and off-shore wind, solar photovoltaic (PV) and waterpower. The FIT Program was enabled by the Green Energy and Green Economy Act, 2009, which was passed into law on May 14, 2009. The Ontario Power Authority is responsible for implementing the program.
19 Invest in Canada: Biomass Cogeneration, op.cit., p. 5 20 Ontario Power Authority, Renewable Energy Feed-In Tariff Program, http://fit.powerauthority.on.ca/Page.asp?PageID=1115&SiteNodeID=1052. (accessed Feb. 20, 2011)
Renfrew County CFDC Renewable Energy Report May 2011 Page 17 of 70
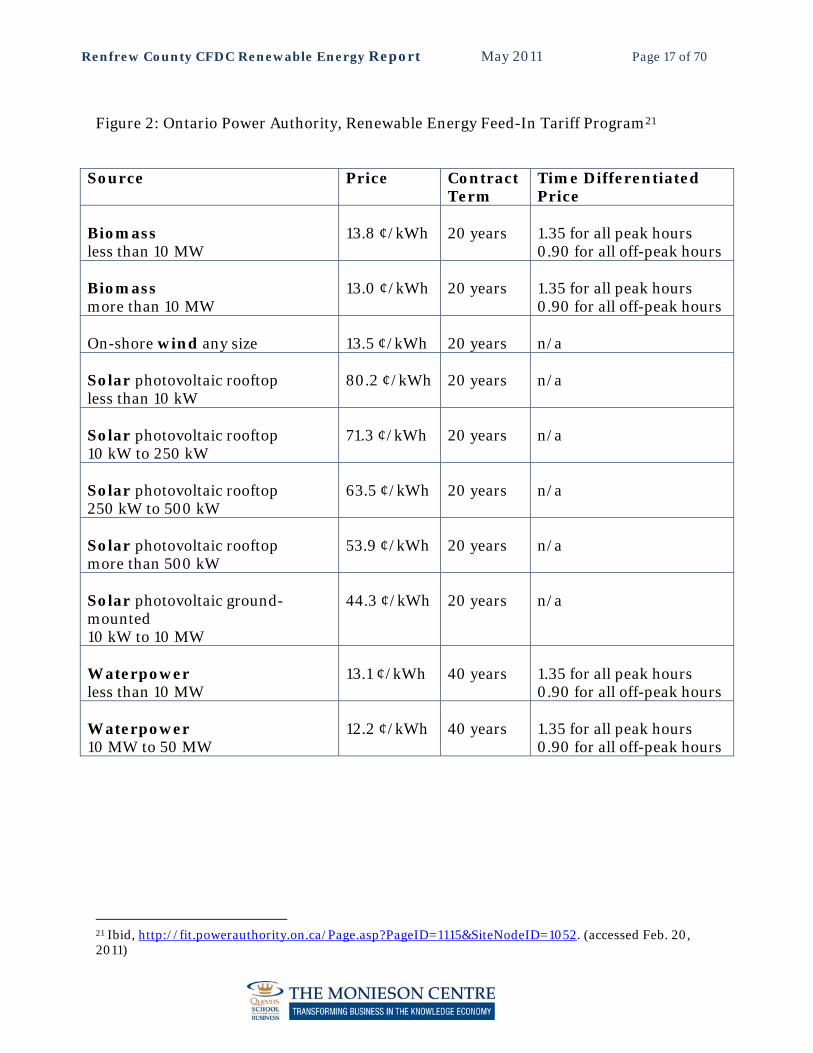
Figure 2: Ontario Power Authority, Renewable Energy Feed-In Tariff Program21
Source Price Contract Term
Time Differentiated Price
Biomass less than 10 MW
13.8 ¢/kWh
20 years
1.35 for all peak hours 0.90 for all off-peak hours
Biomass more than 10 MW
13.0 ¢/kWh
20 years
1.35 for all peak hours 0.90 for all off-peak hours
On-shore wind any size
13.5 ¢/kWh
20 years
n/a
Solar photovoltaic rooftop less than 10 kW
80.2 ¢/kWh
20 years
n/a
Solar photovoltaic rooftop 10 kW to 250 kW
71.3 ¢/kWh
20 years
n/a
Solar photovoltaic rooftop 250 kW to 500 kW
63.5 ¢/kWh
20 years
n/a
Solar photovoltaic rooftop more than 500 kW
53.9 ¢/kWh
20 years
n/a
Solar photovoltaic ground-mounted 10 kW to 10 MW
44.3 ¢/kWh
20 years
n/a
Waterpower less than 10 MW
13.1 ¢/kWh
40 years
1.35 for all peak hours 0.90 for all off-peak hours
Waterpower 10 MW to 50 MW
12.2 ¢/kWh
40 years
1.35 for all peak hours 0.90 for all off-peak hours
21 Ibid, http://fit.powerauthority.on.ca/Page.asp?PageID=1115&SiteNodeID=1052. (accessed Feb. 20, 2011)
Renfrew County CFDC Renewable Energy Report May 2011 Page 18 of 70
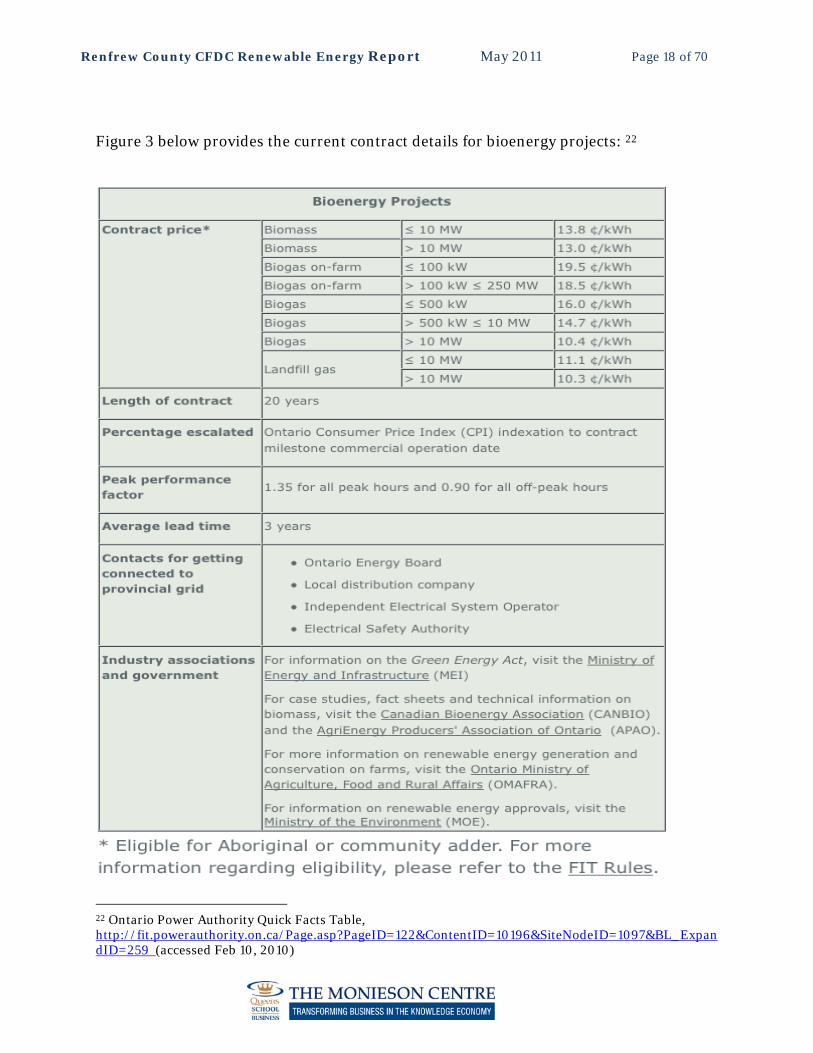
Figure 3 below provides the current contract details for bioenergy projects: 22
22 Ontario Power Authority Quick Facts Table, http://fit.powerauthority.on.ca/Page.asp?PageID=122&ContentID=10196&SiteNodeID=1097&BL_ExpandID=259 (accessed Feb 10, 2010)
Renfrew County CFDC Renewable Energy Report May 2011 Page 19 of 70
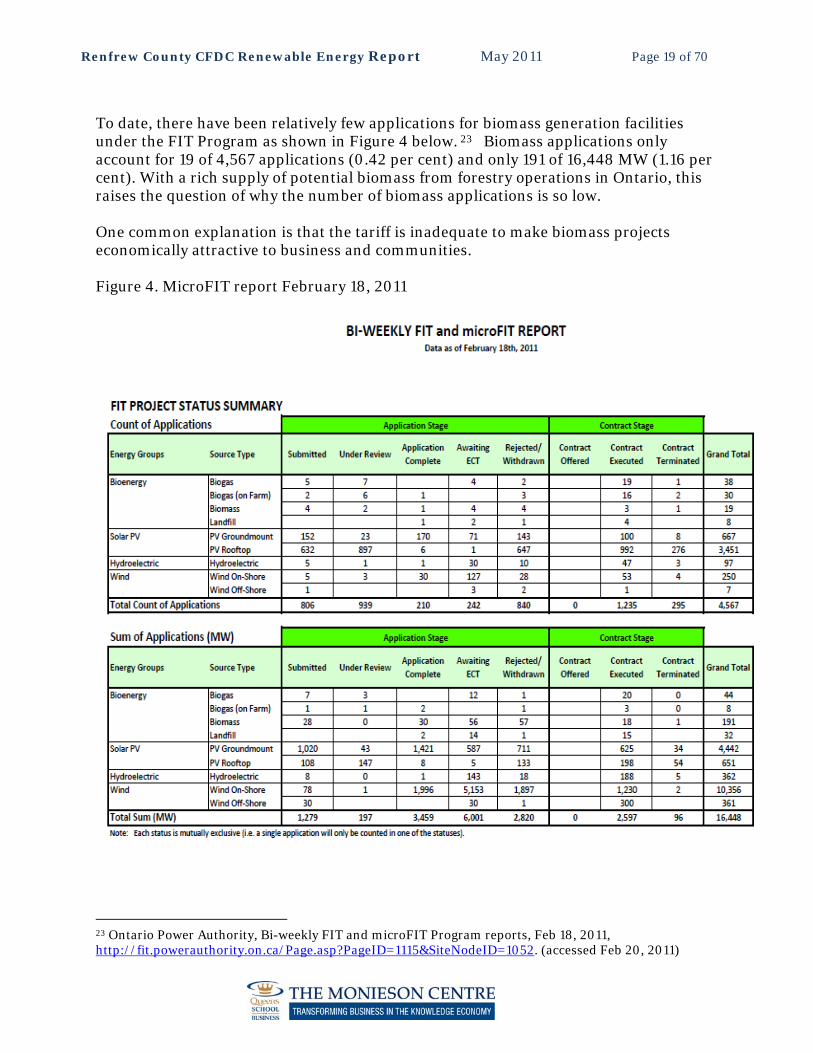
To date, there have been relatively few applications for biomass generation facilities under the FIT Program as shown in Figure 4 below. 23 Biomass applications only account for 19 of 4,567 applications (0.42 per cent) and only 191 of 16,448 MW (1.16 per cent). With a rich supply of potential biomass from forestry operations in Ontario, this raises the question of why the number of biomass applications is so low. One common explanation is that the tariff is inadequate to make biomass projects economically attractive to business and communities. Figure 4. MicroFIT report February 18, 2011
23 Ontario Power Authority, Bi-weekly FIT and microFIT Program reports, Feb 18, 2011, http://fit.powerauthority.on.ca/Page.asp?PageID=1115&SiteNodeID=1052. (accessed Feb 20, 2011)

Renfrew County CFDC Renewable Energy Report May 2011 Page 20 of 70
Another key factor that has been identified is the inability of projects to confirm wood supply from the Crown.24 Accordingly, Ontario has begun to streamline the process to gain access to an estimated 22 million cubic metres of biomass, including harvest tops and branches, unused allowable harvest, and unmerchantable timber. Other major barriers to the conversion of biomass to energy have been antiquated legacy legislation by the Ministry of the Environment; conflicting air quality permits; onerous permitting processes; and poor definitions that lump woody biomass together with municipal waste. It is hoped that the Green Energy Act will eventually streamline approvals for renewable energy projects.
24 Douglas Bradley, Canada Report on Bioenergy 2010, http://www.climatechangesolutions.net. (accessed Jan 15, 2011)
Renfrew County CFDC Renewable Energy Report May 2011 Page 21 of 70
Biomass Technologies Biomass produces renewable energy on demand, and can produce renewable heat, power, fuels and bio-chemicals. At present, most biomass power plants burn lumber, agricultural, or construction/demolition wood wastes. Direct combustion power plants burn the biomass fuel directly in boilers that supply steam for the same kind of steam-electric generators used to burn fossil fuels. The biomass fuel may be in the form of logging residue or wood pellets made from residue. Another process is biomass gasification, where biomass is converted into methane that can be used to fuel steam generators, combustion turbines, combined cycle technologies or fuel cells. The primary benefit of biomass gasification, compared to direct combustion, is that extracted gasses can be used in a variety of power plant configurations. Because biomass technologies use combustion processes to produce electricity, they can generate electricity at any time, unlike wind and most solar technologies that only produce when the wind is blowing or the sun is shining. Whether combusting directly or engaged in gasification, biomass electricity generation does result in air emissions. These emissions vary depending upon the precise fuel and technology used. If wood is the primary biomass resource, very little sulfur dioxide (SO2) comes out of the stack. NOx (nitric oxide and nitrogen dioxide) emissions vary significantly among combustion facilities depending on their design and controls. Some biomass power plants show a relatively high NOx emission rate per kilowatt hour generated if compared to other combustion technologies.25 Carbon monoxide (CO) is also emitted - sometimes at levels higher than those for coal plants. Biomass plants also release carbon dioxide (CO2), the primary greenhouse gas. However, the cycle of growing, processing and burning biomass recycles CO2 from the atmosphere. If this cycle is sustained, there is little or no net change in atmospheric CO2. The collection of biomass fuels can have significant environmental impacts. Harvesting timber and growing agricultural products for fuel require large volumes to be collected, transported, processed and stored. However, biomass fuels may be obtained from supplies of clean, uncontaminated wood that otherwise would be landfilled, or from sustainable harvests. Therefore, in both of these fuel collection examples, the net environmental benefits of biomass are significant when compared to fossil fuel collection alternatives. On the other hand, the collection, processing and combustion of biomass fuels may cause environmental problems if, for example, the fuel source contains toxic
25 Natural Resources Defense Council, Rating the Environmental Impact of Electricity Products, http://www.powerscorecard.org/tech_detail.cfm?resource_id=1 . (accessed Feb 21, 2011)
Renfrew County CFDC Renewable Energy Report May 2011 Page 22 of 70
contaminants or burning biomass deprives local ecosystems of nutrients that forest waste may otherwise provide.26 Soil carbon (C) and nitrogen (N) are often considered master variables determining both soil fertility and the role of soils as a source or sink for C on a global scale. The effects of forest management on soil C and N depend on many variables: the soil type and structure, the tree species, and the range of availability of nutrients, to name just three. A literature review of forest management effects on soil C and N showed that forest harvesting, on average, had little or no effect on soil C and N.27 Significant effects of harvest type and species were noted, with sawlog harvesting causing increases (+18 per cent) in soil C and N and whole-tree harvesting causing decreases (−6 per cent). The positive effect of sawlog harvesting appeared to be restricted to coniferous species. As fuel for electricity generation, biomass has several advantages: Farmers and foresters already produce a great deal of residue. While much of it is
needed to protect habitat, soil and nutrient cycles, tens of millions of tons could be safely collected, and even more could be collected in the future with the right management practices.
Unlike coal, biomass produces no harmful sulfur or mercury emissions and has
significantly less nitrogen -- which means less acid rain, smog and other toxic air pollutants.
Over time, if the deliberate growth of biomass is sustainably managed, burning
biomass can result in zero net carbon dioxide emissions, meaning that the carbon .dioxide released in the burning can be absorbed right back from the atmosphere by growing more biomass.
Switchgrass, a promising source of biofuel, if planted in such a way that it does not
replace native habitat, is a native, perennial prairie grass that is easier to grow responsibly than most row crops. It can help reduce erosion and nitrogen runoff, and it increases soil carbon faster when mowed than when standing.
All these benefits can be gained regardless of the specific biomass conversion technology used. These technologies can include combustion (including pelletization), gasification, pyrolysis, fermentation, transesterification, and anaerobic digestion.28
26 Ibid 27 Dale W. Johnson and Peter S. Curtis, “Effects of forest management on soil C and N storage: meta analysis,” Forest Ecology and Management, Volume 140, Issues 2-3 (2001): 227-238. 28 Natural Resources Canada, Bioenergy Systems, http://canmetenergy-canmetenergie.nrcan-rncan.gc.ca/eng/bioenergy/publications/200843.html. (accessed February 19, 2011)
Renfrew County CFDC Renewable Energy Report May 2011 Page 23 of 70
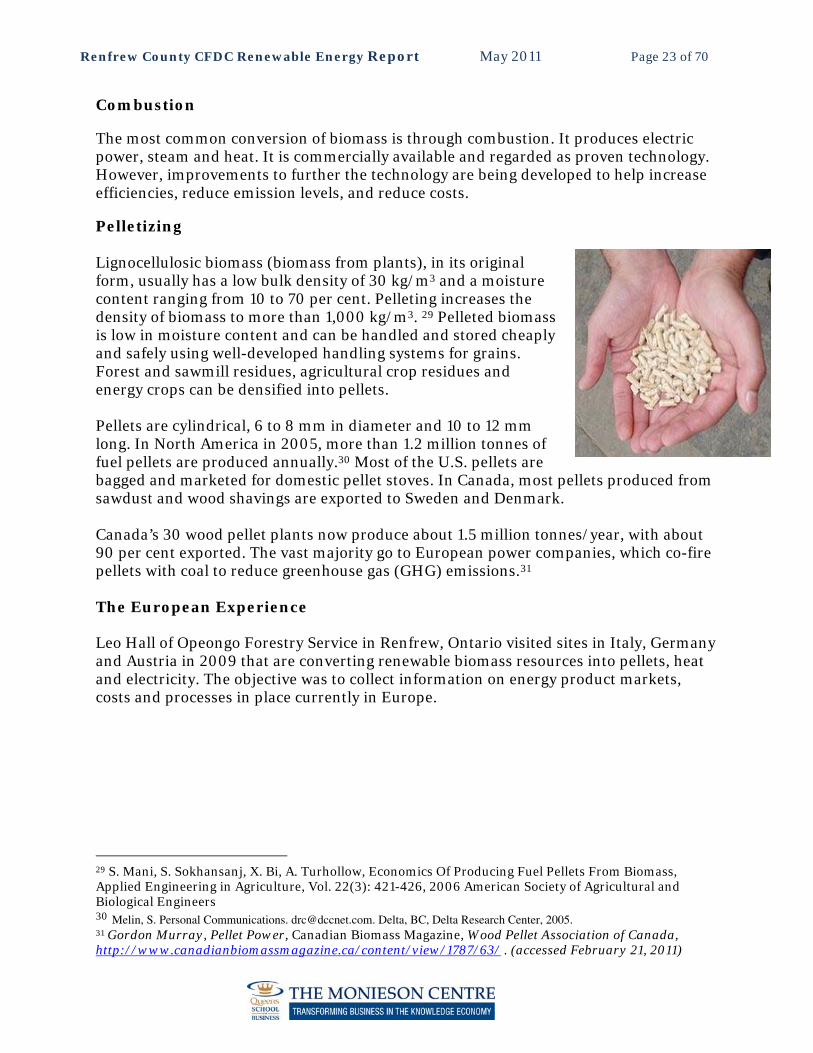
Combustion The most common conversion of biomass is through combustion. It produces electric power, steam and heat. It is commercially available and regarded as proven technology. However, improvements to further the technology are being developed to help increase efficiencies, reduce emission levels, and reduce costs. Pelletizing Lignocellulosic biomass (biomass from plants), in its original form, usually has a low bulk density of 30 kg/m3 and a moisture content ranging from 10 to 70 per cent. Pelleting increases the density of biomass to more than 1,000 kg/m3. 29 Pelleted biomass is low in moisture content and can be handled and stored cheaply and safely using well-developed handling systems for grains. Forest and sawmill residues, agricultural crop residues and energy crops can be densified into pellets. Pellets are cylindrical, 6 to 8 mm in diameter and 10 to 12 mm long. In North America in 2005, more than 1.2 million tonnes of fuel pellets are produced annually.30 Most of the U.S. pellets are bagged and marketed for domestic pellet stoves. In Canada, most pellets produced from sawdust and wood shavings are exported to Sweden and Denmark. Canada’s 30 wood pellet plants now produce about 1.5 million tonnes/year, with about 90 per cent exported. The vast majority go to European power companies, which co-fire pellets with coal to reduce greenhouse gas (GHG) emissions.31 The European Experience Leo Hall of Opeongo Forestry Service in Renfrew, Ontario visited sites in Italy, Germany and Austria in 2009 that are converting renewable biomass resources into pellets, heat and electricity. The objective was to collect information on energy product markets, costs and processes in place currently in Europe.
29 S. Mani, S. Sokhansanj, X. Bi, A. Turhollow, Economics Of Producing Fuel Pellets From Biomass, Applied Engineering in Agriculture, Vol. 22(3): 421-426, 2006 American Society of Agricultural and Biological Engineers 30 Melin, S. Personal Communications. [email protected]. Delta, BC, Delta Research Center, 2005. 31 Gordon Murray, Pellet Power, Canadian Biomass Magazine, Wood Pellet Association of Canada, http://www.canadianbiomassmagazine.ca/content/view/1787/63/ . (accessed February 21, 2011)
Renfrew County CFDC Renewable Energy Report May 2011 Page 24 of 70
The major findings from the visit included the following: 32
The markets for wood pellets are large, growing rapidly (10 per cent or more annually), and apparently still quite young and variable in most of Europe.
Wood pellets produced in Ontario are not going to be shipped at an adequate profit into the simplest electrical coal plant co-firing market in Europe, under current cost and market price realities.
To be profitable from Ontario, a marketing strategy enabling access to higher value residential and small commercial heat market segments will be necessary.
The technology for converting wood biomass directly into renewable district heat and electrical energy is understood, developed and proven in the European context. Such activity in Ontario is not economical at this time because of less expensive fossil fuel alternatives such as natural gas.
A European type market is needed in Ontario for pellets, district heat and electricity to take advantage of our rich and available biomass resources.
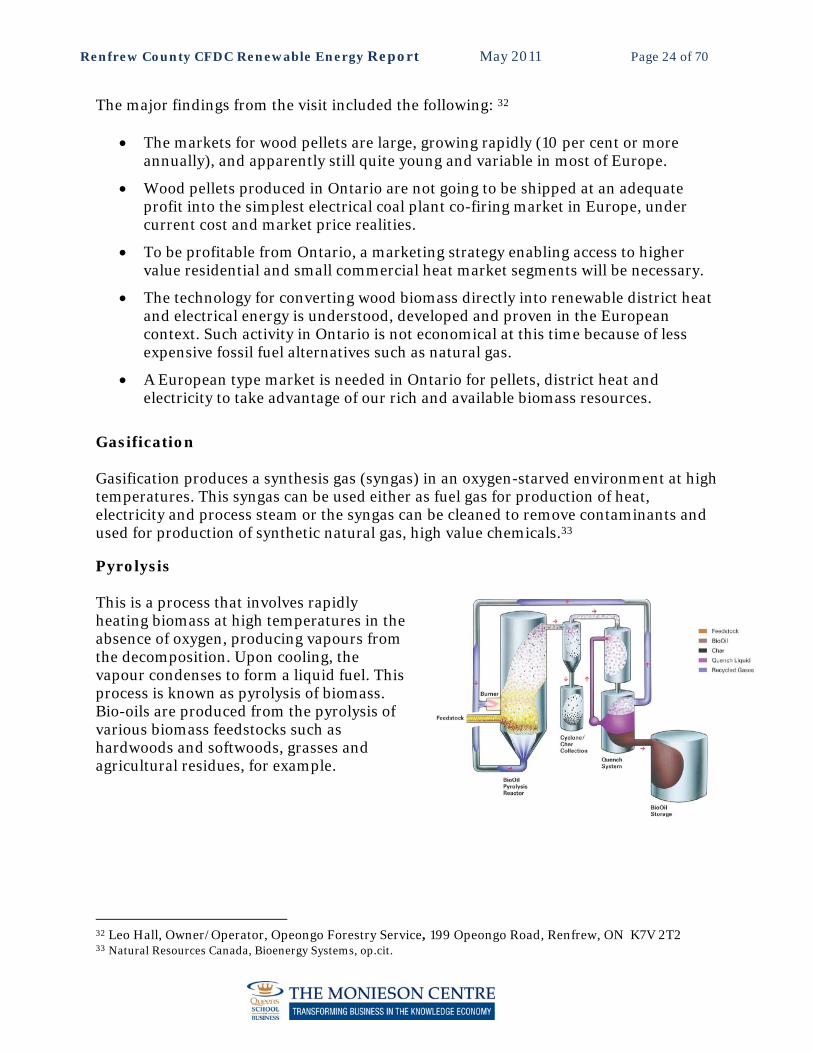
Gasification Gasification produces a synthesis gas (syngas) in an oxygen-starved environment at high temperatures. This syngas can be used either as fuel gas for production of heat, electricity and process steam or the syngas can be cleaned to remove contaminants and used for production of synthetic natural gas, high value chemicals.33 Pyrolysis This is a process that involves rapidly heating biomass at high temperatures in the absence of oxygen, producing vapours from the decomposition. Upon cooling, the vapour condenses to form a liquid fuel. This process is known as pyrolysis of biomass. Bio-oils are produced from the pyrolysis of various biomass feedstocks such as hardwoods and softwoods, grasses and agricultural residues, for example.
32 Leo Hall, Owner/Operator, Opeongo Forestry Service, 199 Opeongo Road, Renfrew, ON K7V 2T2 33 Natural Resources Canada, Bioenergy Systems, op.cit.
Renfrew County CFDC Renewable Energy Report May 2011 Page 25 of 70
Torrefaction
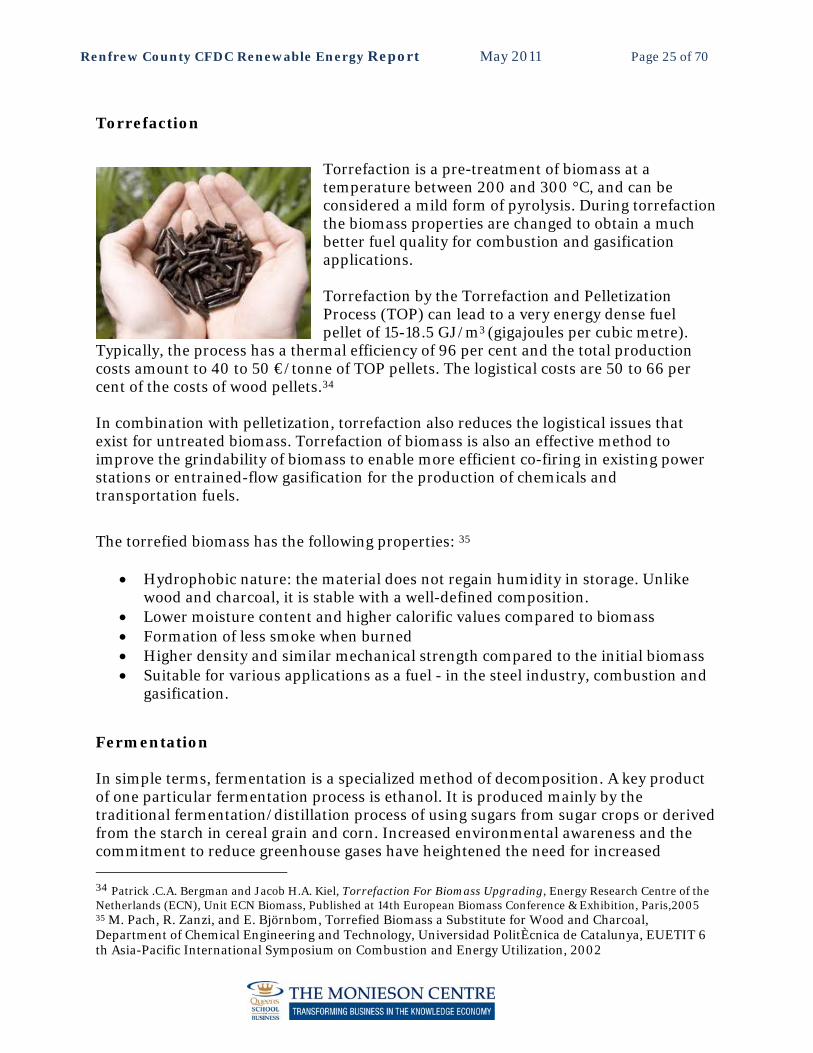
Torrefaction is a pre-treatment of biomass at a temperature between 200 and 300 °C, and can be considered a mild form of pyrolysis. During torrefaction the biomass properties are changed to obtain a much better fuel quality for combustion and gasification applications. Torrefaction by the Torrefaction and Pelletization Process (TOP) can lead to a very energy dense fuel pellet of 15-18.5 GJ/m3 (gigajoules per cubic metre).
Typically, the process has a thermal efficiency of 96 per cent and the total production costs amount to 40 to 50 €/tonne of TOP pellets. The logistical costs are 50 to 66 per cent of the costs of wood pellets.34 In combination with pelletization, torrefaction also reduces the logistical issues that exist for untreated biomass. Torrefaction of biomass is also an effective method to improve the grindability of biomass to enable more efficient co-firing in existing power stations or entrained-flow gasification for the production of chemicals and transportation fuels.
The torrefied biomass has the following properties: 35
Hydrophobic nature: the material does not regain humidity in storage. Unlike wood and charcoal, it is stable with a well-defined composition.
Lower moisture content and higher calorific values compared to biomass Formation of less smoke when burned Higher density and similar mechanical strength compared to the initial biomass Suitable for various applications as a fuel - in the steel industry, combustion and
gasification. Fermentation In simple terms, fermentation is a specialized method of decomposition. A key product of one particular fermentation process is ethanol. It is produced mainly by the traditional fermentation/distillation process of using sugars from sugar crops or derived from the starch in cereal grain and corn. Increased environmental awareness and the commitment to reduce greenhouse gases have heightened the need for increased 34 Patrick .C.A. Bergman and Jacob H.A. Kiel, Torrefaction For Biomass Upgrading, Energy Research Centre of the Netherlands (ECN), Unit ECN Biomass, Published at 14th European Biomass Conference & Exhibition, Paris,2005 35 M. Pach, R. Zanzi, and E. Björnbom, Torrefied Biomass a Substitute for Wood and Charcoal, Department of Chemical Engineering and Technology, Universidad PolitÈcnica de Catalunya, EUETIT 6 th Asia-Pacific International Symposium on Combustion and Energy Utilization, 2002
Renfrew County CFDC Renewable Energy Report May 2011 Page 26 of 70
production of ethanol in Canada. At present, about 200 million litres of fuel ethanol are produced in Canada each year from cereal grain and corn. On a full life cycle basis, ethanol made from corn or grain reduces greenhouse gases by 30 to 40 per cent compared to gasoline, while that made from the cellulosic part of biomass reduces greenhouse gases by 60 to 80 per cent.36 Transesterfication In this process, specific kinds of biomass such as vegetable or animal fats are treated with sodium hydroxide and methanol to yield glycerine and fatty acid methyl esters. These esters are referred to as biodiesel.37 Anaerobic Digestion (AD) AD is a naturally occurring process whereby biomass is broken down or ‘digested’ by bacteria in an air free environment. AD takes place in landfills and is used to treat certain fractions of municipal wastewater and other industrial wastewaters. More recently, AD has been introduced to the Canadian farming community to treat manure, animal processing wastes and other agricultural residues. The anaerobic bacteria produce methane rich biogas that can be converted to heat, electricity and/or ethanol.38
36 Natural Resources Canada, Bioenergy Systems, op.cit. 37 Ibid., Natural Resources Canada, Bioenergy Systems 38 Ibid., Natural Resources Canada, Bioenergy Systems
Renfrew County CFDC Renewable Energy Report May 2011 Page 27 of 70
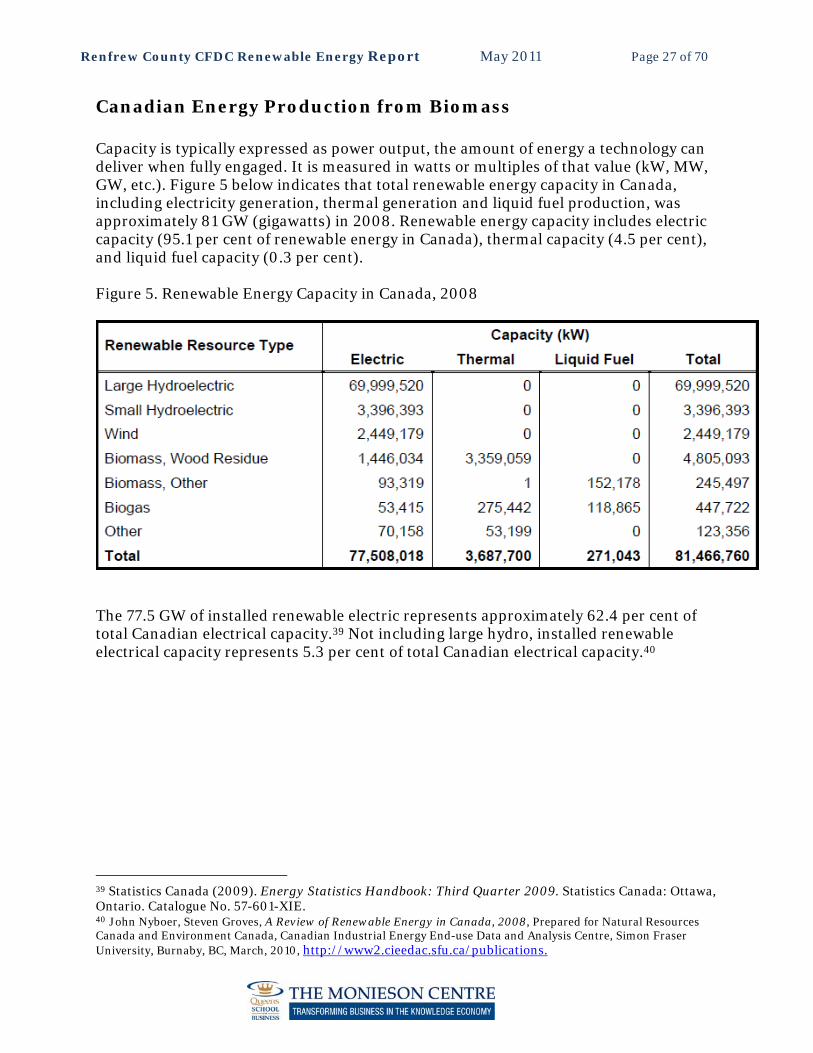
Canadian Energy Production from Biomass Capacity is typically expressed as power output, the amount of energy a technology can deliver when fully engaged. It is measured in watts or multiples of that value (kW, MW, GW, etc.). Figure 5 below indicates that total renewable energy capacity in Canada, including electricity generation, thermal generation and liquid fuel production, was approximately 81 GW (gigawatts) in 2008. Renewable energy capacity includes electric capacity (95.1 per cent of renewable energy in Canada), thermal capacity (4.5 per cent), and liquid fuel capacity (0.3 per cent). Figure 5. Renewable Energy Capacity in Canada, 2008
The 77.5 GW of installed renewable electric represents approximately 62.4 per cent of total Canadian electrical capacity.39 Not including large hydro, installed renewable electrical capacity represents 5.3 per cent of total Canadian electrical capacity.40
39 Statistics Canada (2009). Energy Statistics Handbook: Third Quarter 2009. Statistics Canada: Ottawa, Ontario. Catalogue No. 57-601-XIE. 40 John Nyboer, Steven Groves, A Review of Renewable Energy in Canada, 2008, Prepared for Natural Resources Canada and Environment Canada, Canadian Industrial Energy End-use Data and Analysis Centre, Simon Fraser University, Burnaby, BC, March, 2010, http://www2.cieedac.sfu.ca/publications.
Renfrew County CFDC Renewable Energy Report May 2011 Page 28 of 70
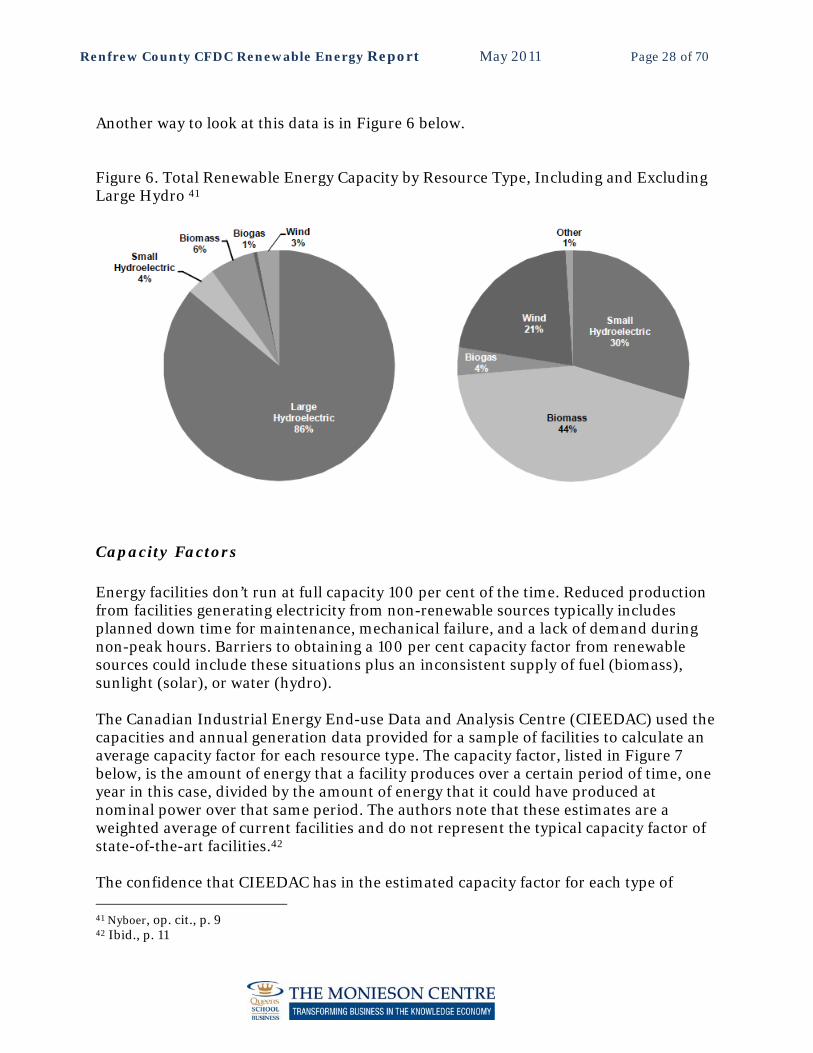
Another way to look at this data is in Figure 6 below. Figure 6. Total Renewable Energy Capacity by Resource Type, Including and Excluding Large Hydro 41
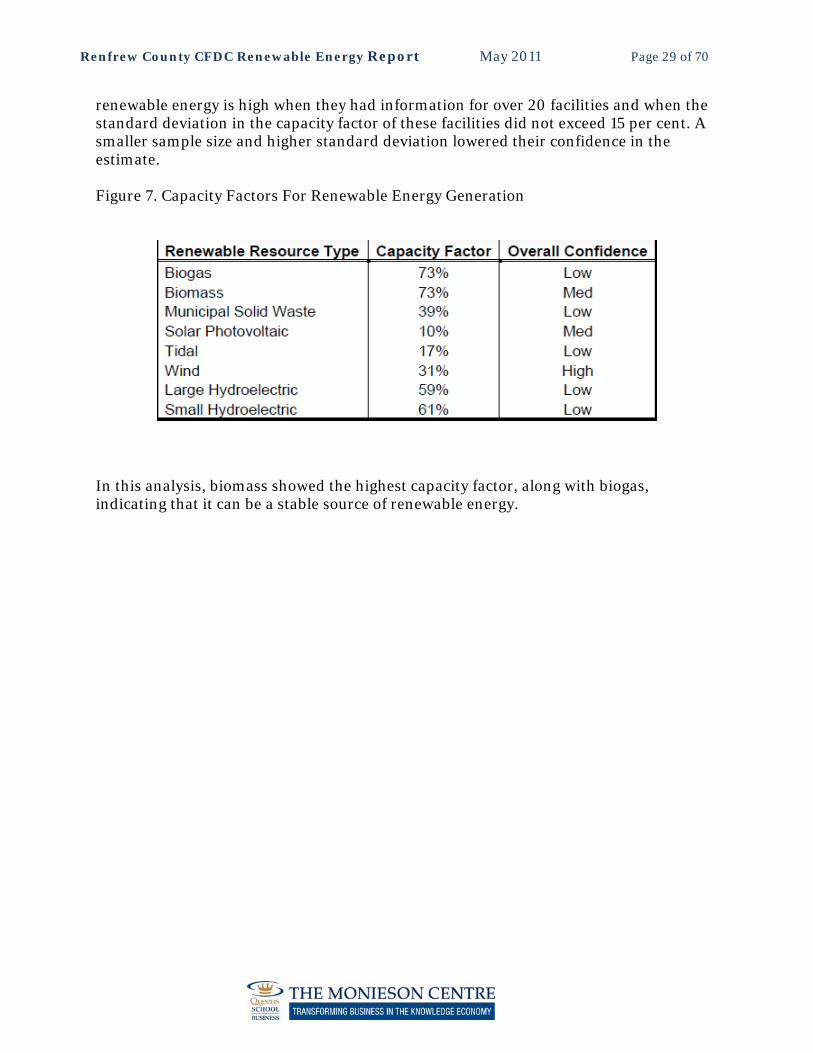
Capacity Factors Energy facilities don’t run at full capacity 100 per cent of the time. Reduced production from facilities generating electricity from non-renewable sources typically includes planned down time for maintenance, mechanical failure, and a lack of demand during non-peak hours. Barriers to obtaining a 100 per cent capacity factor from renewable sources could include these situations plus an inconsistent supply of fuel (biomass), sunlight (solar), or water (hydro). The Canadian Industrial Energy End-use Data and Analysis Centre (CIEEDAC) used the capacities and annual generation data provided for a sample of facilities to calculate an average capacity factor for each resource type. The capacity factor, listed in Figure 7 below, is the amount of energy that a facility produces over a certain period of time, one year in this case, divided by the amount of energy that it could have produced at nominal power over that same period. The authors note that these estimates are a weighted average of current facilities and do not represent the typical capacity factor of state-of-the-art facilities.42 The confidence that CIEEDAC has in the estimated capacity factor for each type of 41 Nyboer, op. cit., p. 9 42 Ibid., p. 11
Renfrew County CFDC Renewable Energy Report May 2011 Page 29 of 70
renewable energy is high when they had information for over 20 facilities and when the standard deviation in the capacity factor of these facilities did not exceed 15 per cent. A smaller sample size and higher standard deviation lowered their confidence in the estimate. Figure 7. Capacity Factors For Renewable Energy Generation In this analysis, biomass showed the highest capacity factor, along with biogas, indicating that it can be a stable source of renewable energy.
Renfrew County CFDC Renewable Energy Report May 2011 Page 30 of 70
UBC Bioenergy Research and Demonstration Project 43 Using biomass to produce energy is becoming increasingly common. An example of the production of energy through biomass gasification is the University of British Columbia (UBC) Bioenergy Research and Demonstration Project, which produces renewable biomass-based heat and power for its campus. The project is a collaboration among Nexterra Systems Corp., GE Jenbacher (General Electric’s gas engine division), FPInnovations and the University of British Columbia. The UBC bioenergy project has two main operating modes. The first mode – commercial thermal (heat) mode – will utilize commercial Nexterra gasification technology to convert waste wood into “syngas” that will replace some of the natural gas currently used for campus heating. The second mode – the demonstration (heat and power) mode – will use Nexterra proprietary syngas conditioning technology with a high-efficiency GE Jenbacher gas engine to convert syngas into electrical power. Currently, the campus heat requirements are fulfilled by burning fossil fuels that produce greenhouse gases. The project will provide 12 per cent of UBC’s average heat and up to 4.5 per cent of peak power demand in cogeneration mode and 25 per cent of UBC’s average heat in thermal mode. In the demonstration or cogeneration mode, the system will produce steam heat as well as up to two megawatts of electricity – equal to the energy required for approximately 1,500 homes. By reducing the use of fossil fuel, the UBC bioenergy project will eliminate up to 9,000 tonnes of greenhouse gas emissions each year. This is the equivalent of taking more than 2,200 cars off the road. UBC research collaborators include the Institute for Resources, Environment and Sustainability, the Clean Energy Research Centre, the Centre for Interactive Research on Sustainability, the faculty of Applied Science, and the Sauder School of Business. The project will be designed to support research activities – including laboratory space, process access, and sampling ports – within the facility.
43 Nexterra UBC Bioenergy Research and Demonstration Project, http://www.nexterra.ca/news/100215_backgrounder.html. (accessed November 10, 2010)
Renfrew County CFDC Renewable Energy Report May 2011 Page 31 of 70
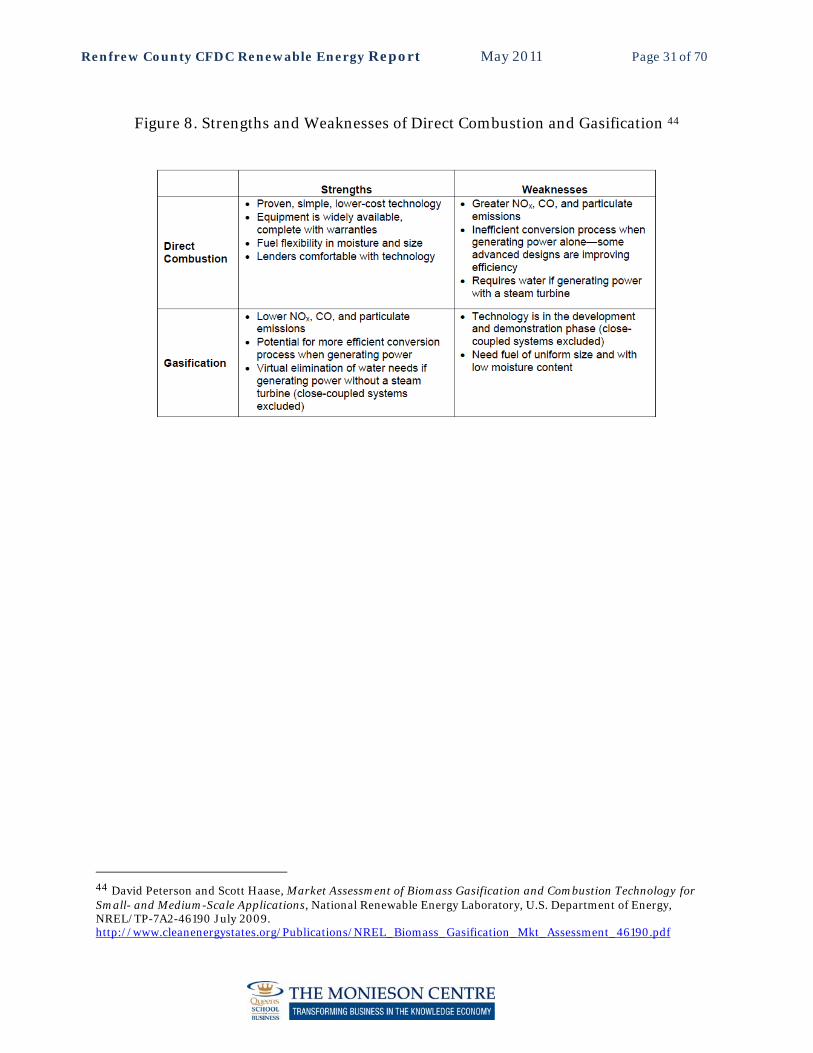
Figure 8. Strengths and Weaknesses of Direct Combustion and Gasification 44
44 David Peterson and Scott Haase, Market Assessment of Biomass Gasification and Combustion Technology for Small- and Medium-Scale Applications, National Renewable Energy Laboratory, U.S. Department of Energy, NREL/TP-7A2-46190 July 2009. http://www.cleanenergystates.org/Publications/NREL_Biomass_Gasification_Mkt_Assessment_46190.pdf
Renfrew County CFDC Renewable Energy Report May 2011 Page 32 of 70
Forest Biomass Volume Most analyses separate forest biomass into two categories: mill residue (bark, sawdust and shavings primarily from pulp mill and sawmill operations) and forest residue (tops, branches and leaves from harvest and thinning operations that are left in the forest or at the roadside after delimbing).45 Mill residue bears a lower cost as it is already at a mill site and is partially pulverized. Biomass projects tend to use the lowest cost feedstock, usually 100 per cent mill residue. Where mill residues are scarce or dispersed, an energy plant will try to find the lowest cost mix encompassing mill residue and some forest residue.
Mill Residue A 2005 mill residue survey 46 of Canadian pulp mills and sawmills indicated an annual production of bark, sawdust and shavings of 21.2 million oven-dried tonnes (ODT). Much of this biomass is committed to produce onsite energy, or sold to independent power producers, board and pellet manufacturers, farmers for animal bedding, and landscapers for garden beds. Ontario showed a surplus of 100,000 ODT. A January 2007 survey 47 of Eastern Ontario showed that while virtually all mill residues were consumed, only 20 per cent went to energy while 50 per cent was sold or given away to landscapers. Prices ranged from $0 to $22.50/ODT, but much was sold for under $12/ODT. A sizable amount of this biomass could be recovered for energy at reasonable cost. Estimated biomass recovery from landscaping to energy is 415,000 ODT in Ontario. Heritage Bark Piles In Ontario, mills pile excess residue at the mill site, and a broad estimate for availability is 6.6 million ODT.48 Only recently have mills been looking to this bark as fuel source. In some cases this bark is contaminated with rocks or soil, or is too wet to be economically usable. However, many of these piles are excellent sources of biomass.
45 Douglas Bradley, Canada- Sustainable Forest Biomass Supply Chains, Climate Change Solutions, 2007, p.6, http://www.canbio.ca/documents/publications/sustainableforestsupplychainsoct192007.pdf. (accessed Dec 18, 2010) 46 Estimated Production, Consumption and Surplus Mill Wood Residues in Canada-2004, A National Report- NRCan & FPAC; Prepared by BW McCloy and Associates and Climate Change Solutions,
http://catalogue.nrcan.gc.ca/opac/extras/unapi?format=htmlholdings-full;id=tag:open-ils.org,2011:biblio-record_entry/8068091/CFS-SCF-SAULTSTEMARIE. (accessed December 15, 2010) 47 Douglas Bradley, op.cit., p. 7 48 Ibid., p. 7
Renfrew County CFDC Renewable Energy Report May 2011 Page 33 of 70
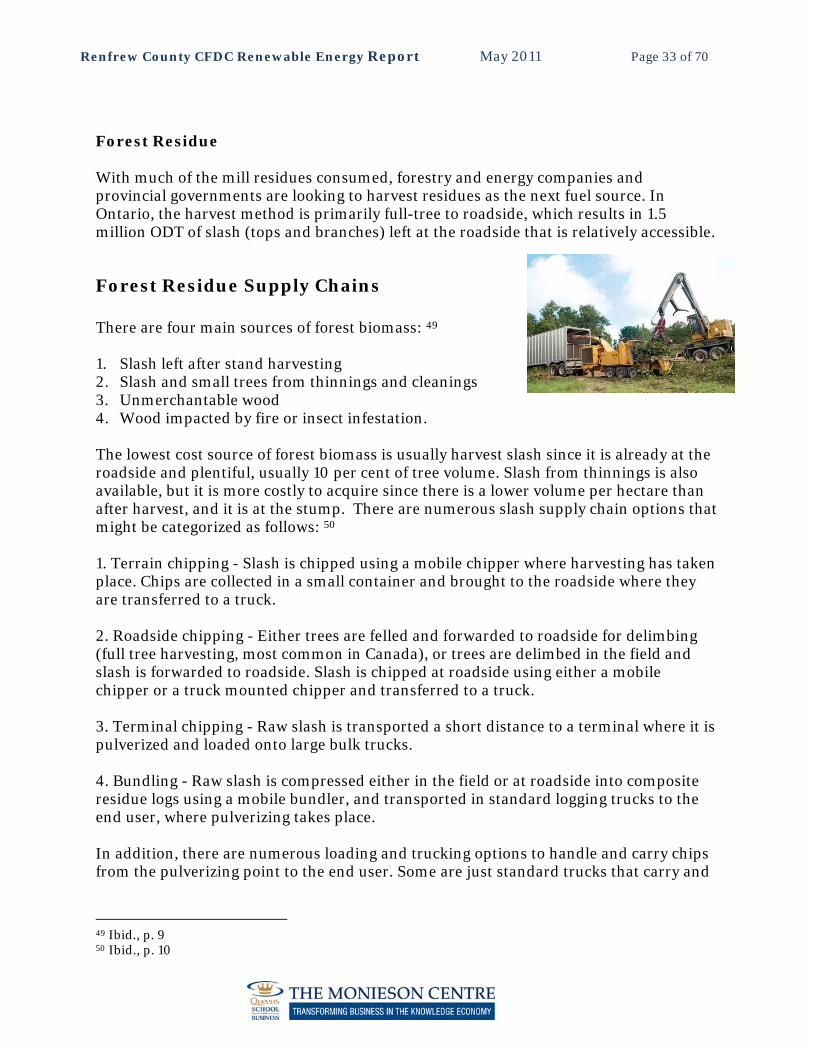
Forest Residue With much of the mill residues consumed, forestry and energy companies and provincial governments are looking to harvest residues as the next fuel source. In Ontario, the harvest method is primarily full-tree to roadside, which results in 1.5 million ODT of slash (tops and branches) left at the roadside that is relatively accessible.
Forest Residue Supply Chains There are four main sources of forest biomass: 49 1. Slash left after stand harvesting 2. Slash and small trees from thinnings and cleanings 3. Unmerchantable wood 4. Wood impacted by fire or insect infestation. The lowest cost source of forest biomass is usually harvest slash since it is already at the roadside and plentiful, usually 10 per cent of tree volume. Slash from thinnings is also available, but it is more costly to acquire since there is a lower volume per hectare than after harvest, and it is at the stump. There are numerous slash supply chain options that might be categorized as follows: 50 1. Terrain chipping - Slash is chipped using a mobile chipper where harvesting has taken place. Chips are collected in a small container and brought to the roadside where they are transferred to a truck. 2. Roadside chipping - Either trees are felled and forwarded to roadside for delimbing (full tree harvesting, most common in Canada), or trees are delimbed in the field and slash is forwarded to roadside. Slash is chipped at roadside using either a mobile chipper or a truck mounted chipper and transferred to a truck. 3. Terminal chipping - Raw slash is transported a short distance to a terminal where it is pulverized and loaded onto large bulk trucks. 4. Bundling - Raw slash is compressed either in the field or at roadside into composite residue logs using a mobile bundler, and transported in standard logging trucks to the end user, where pulverizing takes place. In addition, there are numerous loading and trucking options to handle and carry chips from the pulverizing point to the end user. Some are just standard trucks that carry and
49 Ibid., p. 9 50 Ibid., p. 10
Renfrew County CFDC Renewable Energy Report May 2011 Page 34 of 70
dump chips, some are purpose-built to load and compress chips to reduce costs, and some include the capability to tip at the end-user to further reduce handling costs. Transportation In all these supply chains, the cost of moving feedstock or products is a key component of the overall cost of recovering energy from biomass. Two cost components are critical in analyzing transportation cost: distance variable costs (DVC), the component that is directly dependent on the distance traveled, and distance fixed costs (DFC), which are independent of the distance traveled. DVC depends on the transportation mode and the specific location; an example is the “per ton kilometre” cost of trucking or rail shipment. DFC depends on the type of biomass being transported and the equipment and contractual arrangements involved, and both are case specific; examples include the cost of loading and unloading biomass from a truck, railcar or ship. Hence, DFC will vary based on the specific form of biomass to a far greater extent than DVC, and the impact of DFC on overall transportation cost diminishes with increasing distance.51 Biomass has a relatively low energy density, defined as the amount of energy contained in a volume of material, and the energy produced from biomass is lower than the energy in the biomass as a result of conversion losses. The energy density can have a significant impact on the final cost of generating electricity. For example, at 500 km, the cost of transporting biomass by truck is more than $4/GJ (gigajoule), a significant cost considering that, throughout 2010, wholesale monthly Canadian natural gas prices (intra-Alberta) fluctuated between $3.19 CDN/GJ and $5.23 CDN/GJ. 52
Case Study: Biomass power cost and optimum plant size in western Canada 53 While the actual amount of the costs might vary, this case study by Kumar et al., describes the kinds of costs that were calculated to determine the power cost and optimum plant size for power plants using three biomass fuels in western Canada. The three fuels are biomass from agricultural residues (grain straw), whole boreal forest, and forest harvest residues from existing lumber and pulp operations (limbs and tops). This study provides a reasonable starting template to determine the costs that should be considered in determining an economic FIT for biomass in Ontario. 51 Erin Searcy, Peter Flynn, Emad Ghafoori, Amit Kumar, “The Relative Cost Of Biomass Energy Transport”, Applied Biochemistry and Biotechnology, Volume 137-140, Numbers 1-12, 639-652, http://www.springerlink.com/content/h73770482r5p8418/ 52 Natural Resources Canada, North American Natural Gas - Heating Season and Winter Update, http://nrcan.gc.ca/eneene/sources/natnat/shocou-eng.php. (accessed Feb 21, 2011) 53 Amit Kumar, Jay B. Cameron, Peter C. Flynn, “Biomass power cost and optimum plant size in western Canada”, Biomass and Bioenergy 24 (2003), 445 – 464. http://www.citeulike.org/user/nathanparker/article/1629524
Renfrew County CFDC Renewable Energy Report May 2011 Page 35 of 70
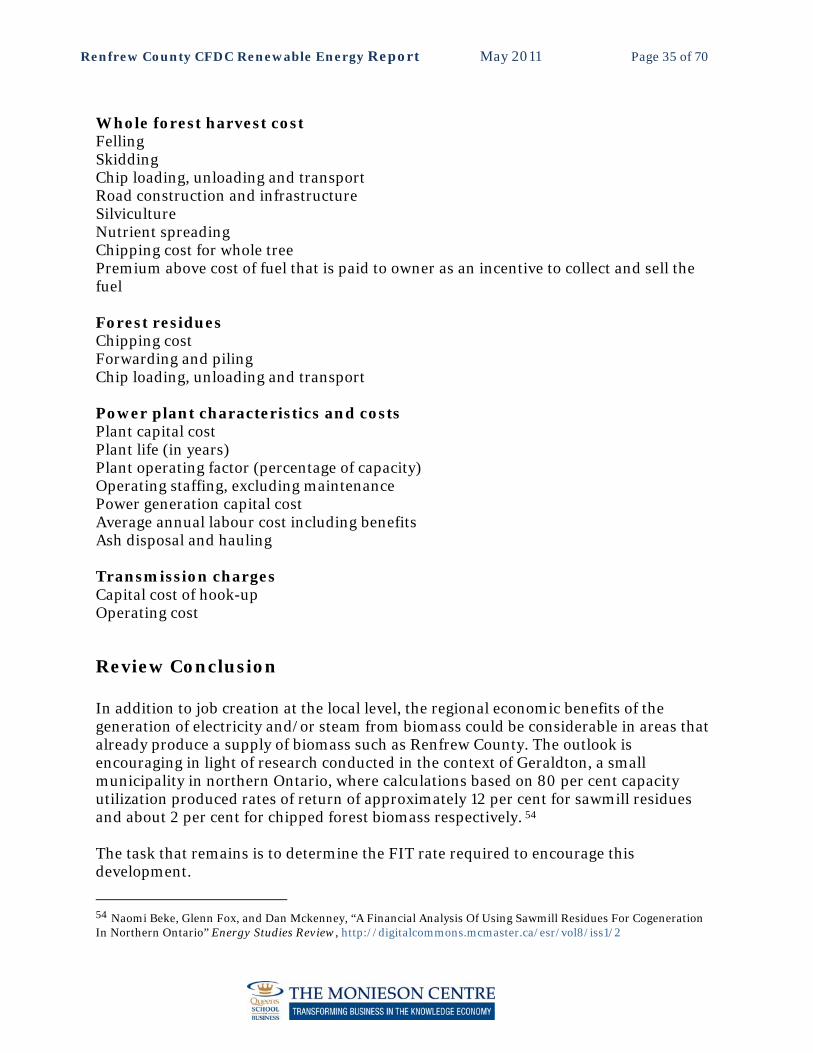
Whole forest harvest cost Felling Skidding Chip loading, unloading and transport Road construction and infrastructure Silviculture Nutrient spreading Chipping cost for whole tree Premium above cost of fuel that is paid to owner as an incentive to collect and sell the fuel Forest residues Chipping cost Forwarding and piling Chip loading, unloading and transport Power plant characteristics and costs Plant capital cost Plant life (in years) Plant operating factor (percentage of capacity) Operating staffing, excluding maintenance Power generation capital cost Average annual labour cost including benefits Ash disposal and hauling Transmission charges Capital cost of hook-up Operating cost
Review Conclusion In addition to job creation at the local level, the regional economic benefits of the generation of electricity and/or steam from biomass could be considerable in areas that already produce a supply of biomass such as Renfrew County. The outlook is encouraging in light of research conducted in the context of Geraldton, a small municipality in northern Ontario, where calculations based on 80 per cent capacity utilization produced rates of return of approximately 12 per cent for sawmill residues and about 2 per cent for chipped forest biomass respectively. 54 The task that remains is to determine the FIT rate required to encourage this development.
54 Naomi Beke, Glenn Fox, and Dan Mckenney, “A Financial Analysis Of Using Sawmill Residues For Cogeneration In Northern Ontario” Energy Studies Review, http://digitalcommons.mcmaster.ca/esr/vol8/iss1/2

Renfrew County CFDC Renewable Energy Report May 2011 Page 36 of 70
5. Assumptions, Analysis and Discussion
The literature review, interviews and financial models all provided input into the findings and analysis.
Assumptions System Capacity Factor of 85 per cent This is in keeping with a conservative estimate of biomass plants and the industry standard errs on the conservative side. Systems never produce at their “stated” capacity. Chris Amey commented, “This is a reasonable number. We plan on lower capacity factors during the start-up year and first full year of operation. Thereafter, we typically plan on two scheduled shut downs of two weeks per year, as well as unscheduled shut downs totaling an additional two weeks per year for a total capacity factor of 88.5 per cent during the second full year of operation.” Elimination of CoGen Income Markets for any heat/steam from a biomass-burning plant are extremely limited and greatly reduce the number of potential sites. In most cases, siting a plant close to a steam market increases the biomass transportation costs to the plant to such an extent that it is counter-productive. However any excess heat/steam would certainly not be wasted as it could be used for drying green fuel and/or used in sawmill drying kilns. Fuel Costs A price of $49.50/GT is in line with reports from local sawmills on the current price they are paid to deliver biomass to mills/plants in Quebec. The estimate is on the conservative side, since the market for biomass is currently depressed due to economic conditions, but will likely rise due to improvements in demand along with increases in transportation costs related to the price of oil. Chris Amey and Martin Lensink concur with this estimate. Chris Amey comments, “Based on the information that we have gathered to date, which includes a detailed canvas of the Eastern Ontario fibre market, and a commissioned third party wood fibre feedstock study, the expected delivered price of virgin marketable roundwood fibre should be in the range of $45 to $50 per green tonne.” Discount Rate for net present value (NPV) is 10 per cent This was based on normal equity structure (60 per cent debt, 40 per cent equity), and is consistent with normal business practice. The expected return is influenced by the amount of interest that must be paid on debt, and the required return to provide acceptable levels of return to equity investors. A weighted average of these two (called WACC for Weighted Average Cost of Capital) forms a benchmark for evaluating new
Renfrew County CFDC Renewable Energy Report May 2011 Page 37 of 70
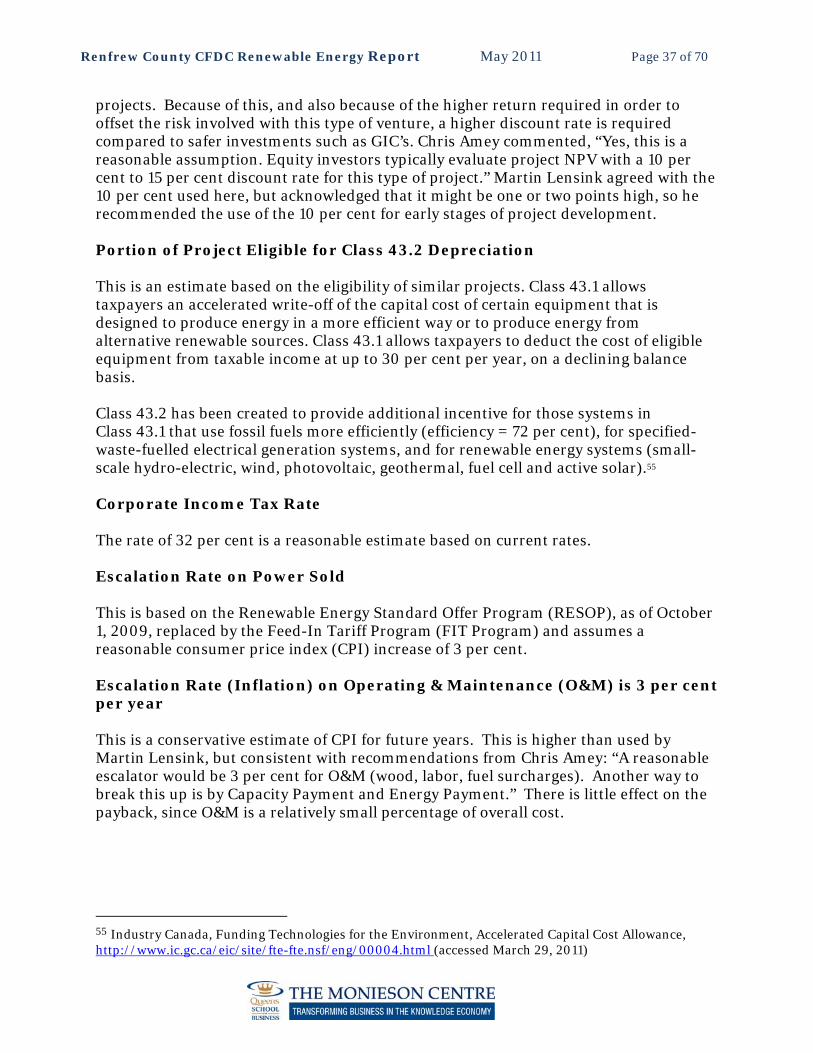
projects. Because of this, and also because of the higher return required in order to offset the risk involved with this type of venture, a higher discount rate is required compared to safer investments such as GIC’s. Chris Amey commented, “Yes, this is a reasonable assumption. Equity investors typically evaluate project NPV with a 10 per cent to 15 per cent discount rate for this type of project.” Martin Lensink agreed with the 10 per cent used here, but acknowledged that it might be one or two points high, so he recommended the use of the 10 per cent for early stages of project development. Portion of Project Eligible for Class 43.2 Depreciation This is an estimate based on the eligibility of similar projects. Class 43.1 allows taxpayers an accelerated write-off of the capital cost of certain equipment that is designed to produce energy in a more efficient way or to produce energy from alternative renewable sources. Class 43.1 allows taxpayers to deduct the cost of eligible equipment from taxable income at up to 30 per cent per year, on a declining balance basis. Class 43.2 has been created to provide additional incentive for those systems in Class 43.1 that use fossil fuels more efficiently (efficiency = 72 per cent), for specified-waste-fuelled electrical generation systems, and for renewable energy systems (small-scale hydro-electric, wind, photovoltaic, geothermal, fuel cell and active solar).55 Corporate Income Tax Rate The rate of 32 per cent is a reasonable estimate based on current rates. Escalation Rate on Power Sold This is based on the Renewable Energy Standard Offer Program (RESOP), as of October 1, 2009, replaced by the Feed-In Tariff Program (FIT Program) and assumes a reasonable consumer price index (CPI) increase of 3 per cent. Escalation Rate (Inflation) on Operating & Maintenance (O&M) is 3 per cent per year This is a conservative estimate of CPI for future years. This is higher than used by Martin Lensink, but consistent with recommendations from Chris Amey: “A reasonable escalator would be 3 per cent for O&M (wood, labor, fuel surcharges). Another way to break this up is by Capacity Payment and Energy Payment.” There is little effect on the payback, since O&M is a relatively small percentage of overall cost.
55 Industry Canada, Funding Technologies for the Environment, Accelerated Capital Cost Allowance, http://www.ic.gc.ca/eic/site/fte-fte.nsf/eng/00004.html (accessed March 29, 2011)
Renfrew County CFDC Renewable Energy Report May 2011 Page 38 of 70
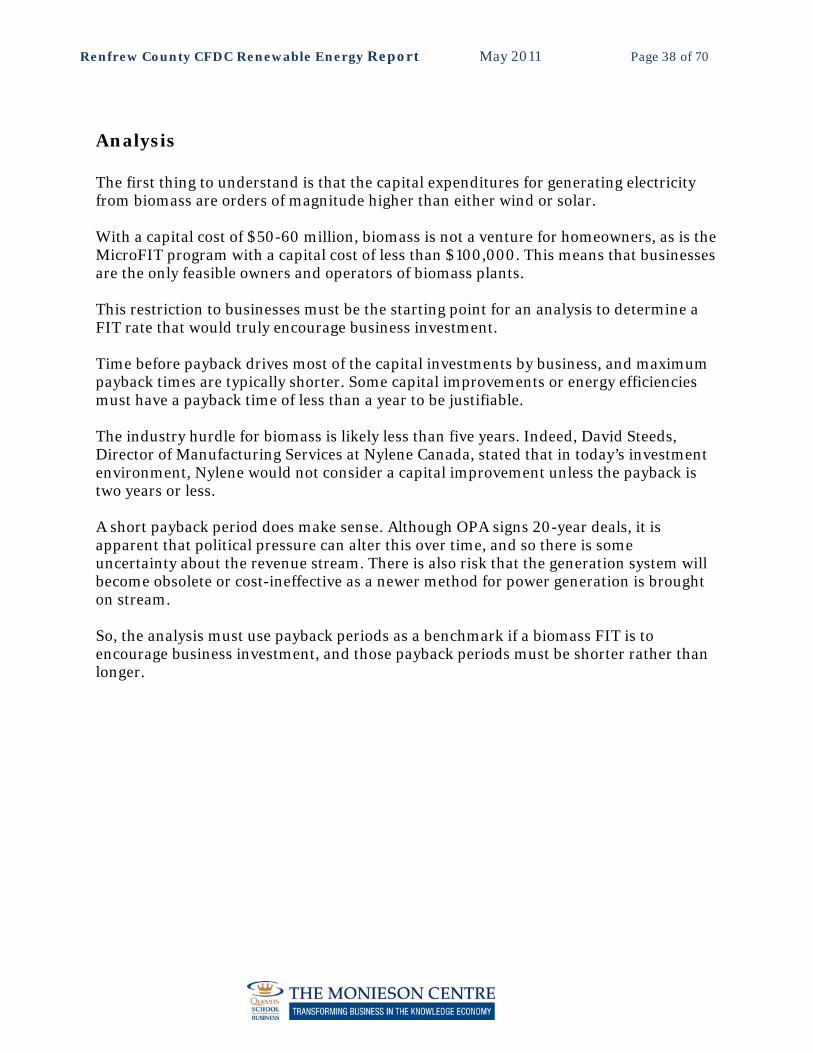
Analysis The first thing to understand is that the capital expenditures for generating electricity from biomass are orders of magnitude higher than either wind or solar. With a capital cost of $50-60 million, biomass is not a venture for homeowners, as is the MicroFIT program with a capital cost of less than $100,000. This means that businesses are the only feasible owners and operators of biomass plants. This restriction to businesses must be the starting point for an analysis to determine a FIT rate that would truly encourage business investment. Time before payback drives most of the capital investments by business, and maximum payback times are typically shorter. Some capital improvements or energy efficiencies must have a payback time of less than a year to be justifiable. The industry hurdle for biomass is likely less than five years. Indeed, David Steeds, Director of Manufacturing Services at Nylene Canada, stated that in today’s investment environment, Nylene would not consider a capital improvement unless the payback is two years or less. A short payback period does make sense. Although OPA signs 20-year deals, it is apparent that political pressure can alter this over time, and so there is some uncertainty about the revenue stream. There is also risk that the generation system will become obsolete or cost-ineffective as a newer method for power generation is brought on stream. So, the analysis must use payback periods as a benchmark if a biomass FIT is to encourage business investment, and those payback periods must be shorter rather than longer.
Renfrew County CFDC Renewable Energy Report May 2011 Page 39 of 70
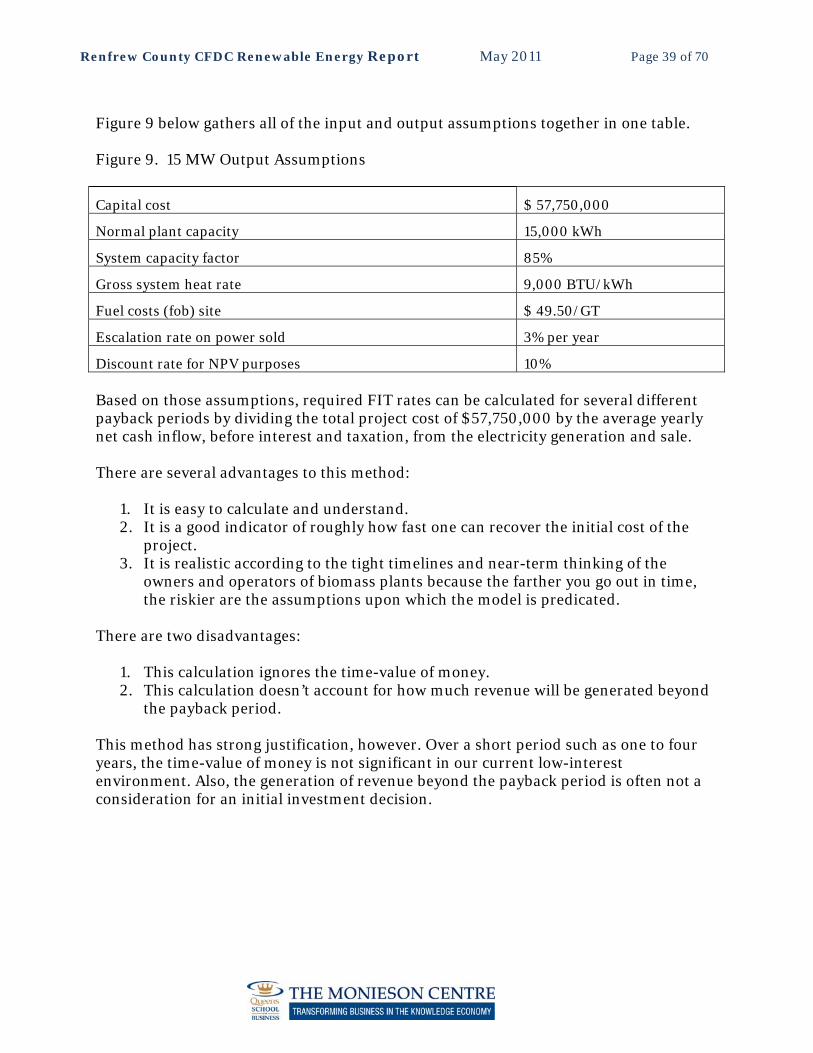
Figure 9 below gathers all of the input and output assumptions together in one table. Figure 9. 15 MW Output Assumptions
Capital cost $ 57,750,000
Normal plant capacity 15,000 kWh
System capacity factor 85%
Gross system heat rate 9,000 BTU/kWh
Fuel costs (fob) site $ 49.50/GT
Escalation rate on power sold 3% per year
Discount rate for NPV purposes 10% Based on those assumptions, required FIT rates can be calculated for several different payback periods by dividing the total project cost of $57,750,000 by the average yearly net cash inflow, before interest and taxation, from the electricity generation and sale. There are several advantages to this method:
1. It is easy to calculate and understand. 2. It is a good indicator of roughly how fast one can recover the initial cost of the
project. 3. It is realistic according to the tight timelines and near-term thinking of the
owners and operators of biomass plants because the farther you go out in time, the riskier are the assumptions upon which the model is predicated.
There are two disadvantages:
1. This calculation ignores the time-value of money. 2. This calculation doesn’t account for how much revenue will be generated beyond
the payback period. This method has strong justification, however. Over a short period such as one to four years, the time-value of money is not significant in our current low-interest environment. Also, the generation of revenue beyond the payback period is often not a consideration for an initial investment decision.
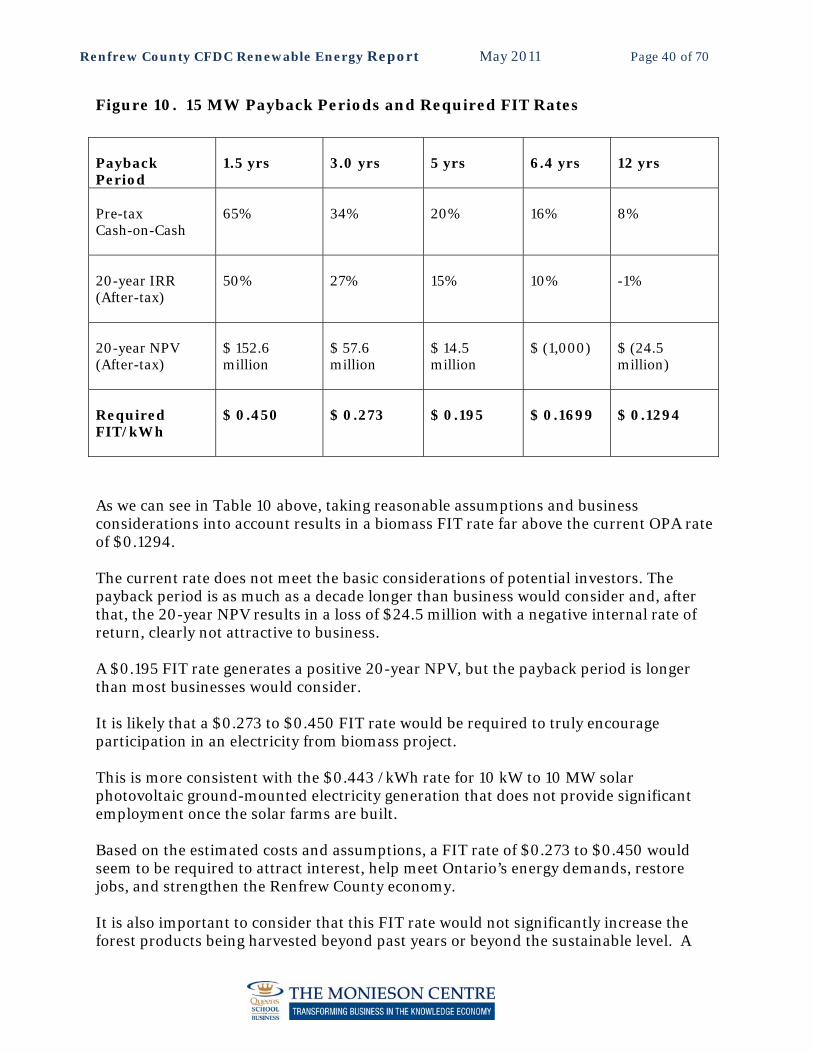
Renfrew County CFDC Renewable Energy Report May 2011 Page 40 of 70
Figure 10. 15 MW Payback Periods and Required FIT Rates Payback Period
1.5 yrs
3.0 yrs
5 yrs
6.4 yrs
12 yrs
Pre-tax Cash-on-Cash
65%
34%
20%
16%
8%
20-year IRR (After-tax)
50%
27%
15%
10%
-1%
20-year NPV (After-tax)
$ 152.6 million
$ 57.6 million
$ 14.5 million
$ (1,000)
$ (24.5 million)
Required FIT/kWh
$ 0.450
$ 0.273
$ 0.195
$ 0.1699
$ 0.1294
As we can see in Table 10 above, taking reasonable assumptions and business considerations into account results in a biomass FIT rate far above the current OPA rate of $0.1294. The current rate does not meet the basic considerations of potential investors. The payback period is as much as a decade longer than business would consider and, after that, the 20-year NPV results in a loss of $24.5 million with a negative internal rate of return, clearly not attractive to business. A $0.195 FIT rate generates a positive 20-year NPV, but the payback period is longer than most businesses would consider. It is likely that a $0.273 to $0.450 FIT rate would be required to truly encourage participation in an electricity from biomass project. This is more consistent with the $0.443 /kWh rate for 10 kW to 10 MW solar photovoltaic ground-mounted electricity generation that does not provide significant employment once the solar farms are built. Based on the estimated costs and assumptions, a FIT rate of $0.273 to $0.450 would seem to be required to attract interest, help meet Ontario’s energy demands, restore jobs, and strengthen the Renfrew County economy. It is also important to consider that this FIT rate would not significantly increase the forest products being harvested beyond past years or beyond the sustainable level. A
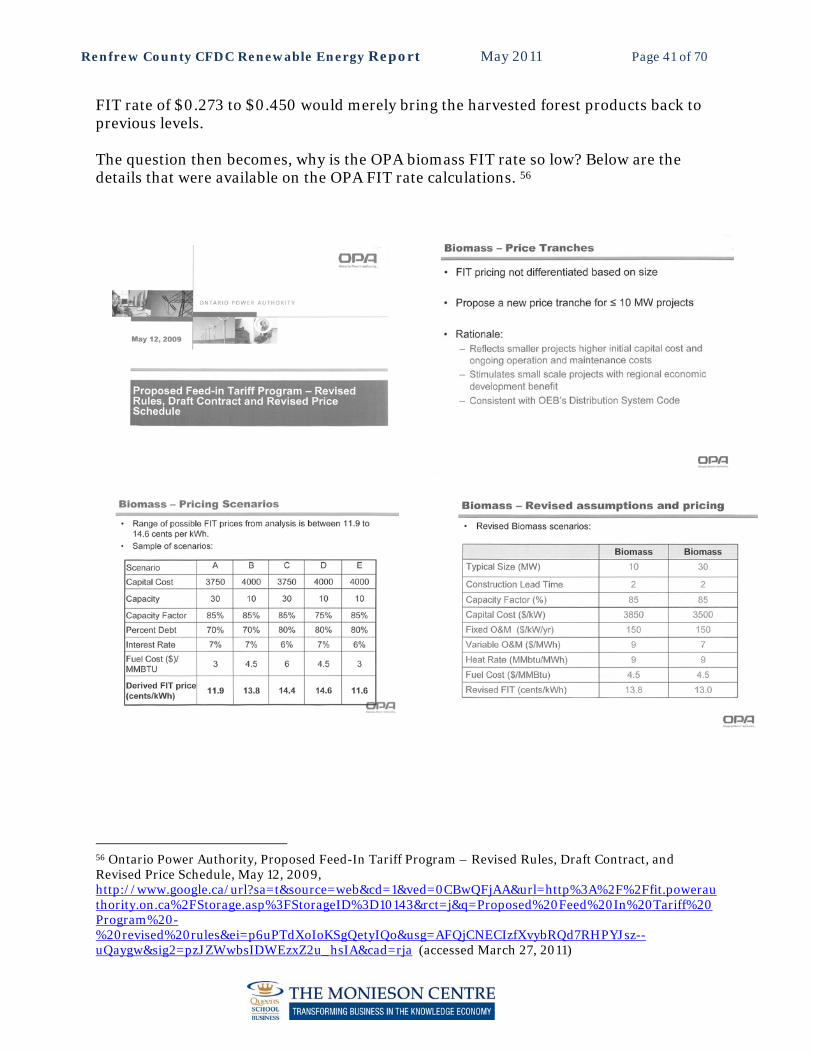
Renfrew County CFDC Renewable Energy Report May 2011 Page 41 of 70
FIT rate of $0.273 to $0.450 would merely bring the harvested forest products back to previous levels. The question then becomes, why is the OPA biomass FIT rate so low? Below are the details that were available on the OPA FIT rate calculations. 56
56 Ontario Power Authority, Proposed Feed-In Tariff Program – Revised Rules, Draft Contract, and Revised Price Schedule, May 12, 2009, http://www.google.ca/url?sa=t&source=web&cd=1&ved=0CBwQFjAA&url=http%3A%2F%2Ffit.powerauthority.on.ca%2FStorage.asp%3FStorageID%3D10143&rct=j&q=Proposed%20Feed%20In%20Tariff%20Program%20-%20revised%20rules&ei=p6uPTdXoIoKSgQetyIQo&usg=AFQjCNECIzfXvybRQd7RHPYJsz--uQaygw&sig2=pzJZWwbsIDWEzxZ2u_hsIA&cad=rja (accessed March 27, 2011)
Renfrew County CFDC Renewable Energy Report May 2011 Page 42 of 70
Two areas where the OPA analysis and the Monieson analysis seem to differ the most are fuel costs and payback periods.
Payback Period Difference Payback periods have been discussed above.
Fuel Cost Difference
More than just the cost of the fuel by raw weight is required to calculate the cost of burning biomass to produce electricity. Different fuels contain different amounts of heat and moisture, so a heat factor must also be applied. In the OPA analysis, the final fuel cost is calculated as $4.50/10*6 BTU.57 This fuel cost assumption works out to $26.50/GT when applying a heat factor of 2500 BTU/lb for green wood chips, and 2200 lb in a metric tonne. 58 As mentioned above in Assumptions, our fuel costs are based on the current rates being paid in the Renfrew area for biomass at $49.50/GT. This price translates into the heat value required for consistency with the OPA calculations in the spreadsheets. So what is the difference between the OPA fuel cost of $26.50/GT and our fuel cost of $49.50/GT? We speculate that the difference is in transportation. If we subtract the transportation costs from the current Renfrew biomass prices being paid, we arrive at very nearly the OPA estimate. But transportation costs cannot be ignored. Biomass plants cannot be sited anywhere; they must be centrally located at a point where a grid connection can be made and that has sufficient space to handle the biomass required. That requires transporting the biomass fuel to the plant. As well, transportation costs are magnified as the plant scale increases because it takes more trucks burning fossil fuel to supply biomass to feed a larger plant. For this reason, we have eliminated the 30 MW plan size in our calculations because we think the transportation costs (and the fossil fuel consumption) will partially defeat the purpose of producing energy from a renewable resource and is not consistent with the Green Energy and Green Economy Act, 2009.
57 Martin Lensink, P. Eng., Principal-In-Charge, CEM Engineering, 26 Hiscott Street, Suite 201, St. Catharines ON L2R 1C6 58 Leo Hall, Owner/Operator, Opeongo Forestry Service, 199 Opeongo Road, Renfrew, ON K7V 2T2
Renfrew County CFDC Renewable Energy Report May 2011 Page 43 of 70
6. Recommendations
1. Promote Biomass: Provide jobs and much-needed energy production while strengthening Ontario’s forestry economy by using biomass for the production of electricity. Pulpwood can be a key fuel source in Ontario, well within the Ministry of Resources guidelines for sustainability. There is current unused capacity of approximately 18 million cubic feet within Ontario’s Annual Allowable Cut. Not only can the logs be used for energy production, but this will also make tops and branches accessible and usable for energy production. Without the logs, the tops and branches are inaccessible and, therefore, irrelevant. The use of Ontario forest products for energy production does not constitute additional pressure on forests, it merely returns us to our traditional use and there is unused capacity within Ontario's Annual Allowable Cut.
2. Remove Barriers: Stimulate the use of biomass for the production of electricity and reflect the true costs of this production by increasing the FIT rate from the current $0.138/kWh to the range of $0.273 to $0.450/kWh. From the analysis, it appears that the break-even FIT rate is $ 0.1699, with a 20-year after-tax net present value of -$1000. Even this would take 6.4 years, far longer than is typically allowed in the private sector. The analysis points to a FIT rate of $0.273 to $0.450 kWh for biomass before this resource can be properly used to assist with Ontario’s electricity needs. This rate is consistent with common business payback periods for capital expenses of two years and takes into account the actual cost of biomass fuel currently being paid in Renfrew County. With a minimum FIT rate of $0.273, we achieve the following results:
Simple Payback is 3.0 years (cost divided by average Earnings Before Interest and Taxes per year)
Pre-tax cash-on-cash return is 34% (calculated as total cash received each year for 20 years at the FIT rate divided by capital cost of $57,750,000)
20-year internal rate of return, after tax but before financing, is 27% (the amount of return required to achieve a net present value (capital cost equal to discounted cash flow after tax) equal to capital cost of project)
20-year net present value, after tax, before financing, is $57,750,000, which is also the capital cost of the project.

Renfrew County CFDC Renewable Energy Report May 2011 Page 44 of 70
The FIT rate of $0.273 to $0.450/kWh for biomass is consistent with the Ontario government's 20-year energy plan, Building Our Clean Energy Future,59 that recommended creating a balanced mix of clean power sources and increasing Ontario's power supply from renewable sources such as wind, solar and bio-energy to 13 per cent by 2018, up from the current level of 3 per cent. Without this FIT modification, it is likely that biomass will be significantly under-used and will not contribute to the renewable energy goals of Ontario. 3. Remove Barriers: Follow the lead of Europe and British Columbia and update operating engineers (steam engineers) regulations such as Ontario Regulation 219/01. The technology of biomass boilers has recently undergone some significant improvements. Depending on the specifications and operating conditions of the boilers used, the currently applicable Ontario regulations may be out-of-date. The BC government has updated an outdated requirement for low-pressure thermal fluid (or steam) plants to have an engineer on staff for 24 hours, seven days per week. The old regulation did not take into account advances in control technology for non-pressurized systems such as European biomass boilers.60 The new rule generally exempts non-pressurized plants of any size from the staffing requirement if they have automated control systems, commissioning systems, functional testing programs and maintenance programs that have been approved by a professional engineer, according to the BC Safety Authority.61 Prior to March 2010, the BC Safety Standards Act: Power Engineers, Boiler, Pressure Vessel and Refrigeration Safety Regulation (“boiler regulation”) prescribed staffing requirements for low pressure thermal fluid plants with boiler capacities over 150 m², regardless of the amount of modern automated technology and safety control systems that the plant utilized. Following consultations with industry, as of March 1, 2010, BC’s regulations prescribing staffing levels in these types of plants have been eliminated, provided that the plant has an approved automated control system that:
Monitors the plant and its systems, including all systems related to automated operation, and automatically alters the operation of the plant, including during start up and shut down, to ensure it is operating safely
59 Government of Ontario, “Ontario’s Long Term Energy Plan, Building Our Clean Energy Future”, http://www.mei.gov.on.ca/en/energy/html/LTEP_en.html. (accessed March 16, 2011) 60 Importing European Biomass Boiler to British Columbia http://www.safetyauthority.ca/permits-approval-design-reg/importing-bioenergy (accessed Mar 25, 2011) 61 BC Safety Authority Client Services, http://www.safetyauthority.ca/thermal-pressure-fluid-plants (accessed March 25, 2011)

Renfrew County CFDC Renewable Energy Report May 2011 Page 45 of 70
Is designed so that any failure of the automated control system itself will cause the plant to go to a predetermined safe state, and
Has been registered by the BC Safety Authority’s (BCSA) provincial safety manager in accordance with section 84.1 of the boiler regulation.
All of the above, plus the design, commissioning programs, functional testing programs and maintenance programs, must be approved by a professional engineer. This change provides a choice to owners of low pressure thermal fluid plants as to how they will control their risks. Owners can choose the traditional approach of designing and installing systems that will be staffed in accordance with the boiler regulation, or mitigate future operating costs by investing in modern control technology. Most state-of-the-art biomass boilers are being manufactured in northern Europe, but regulations stand in the way of Canadians gaining access to the best new technologies. “The BC Safety Authority has also made provision to accept non-ASME (American Society of Mechanical Engineers) boilers if they can be shown to meet equivalent standards. This is also a step in the right direction, but we need to see how it will work in practice. Can boilers certified to EU standards (for example) be deemed to meet an equivalent boiler standard or do subtle differences in standards still stand in the way?” said Bruce McCallum, Vice President of CanBio (Canadian Bioenergy Association), who authored a report, “Addressing Barriers Restricting Bioenergy System Applications in Canada.”62 4. Remove Barriers: Eliminate or reduce to a cost recovery basis all connection assessments and connection fees As can be seen in Appendix 5, Hydro One Networks recently won approval to increase the cost of a Connection Impact Assessment from $6,000 for projects over 10 MW to $10,405. Hydro One appears to see these assessments as a revenue source, or they are paying a $100,000 per year employee one-tenth of their annual salary to do just one. This is not reasonable, especially when combined with actual Hydro connection fees sometimes quoted in the hundreds of thousands of dollars. These unnecessarily high fees can be a significant barrier to new projects and are counter to the Ontario government’s stated goal of encouraging the development of renewable energy. These fees should be reduced to a level of cost recovery or eliminated entirely.
62 Canadian Bioenergy Association, op. cit.
Renfrew County CFDC Renewable Energy Report May 2011 Page 46 of 70
Appendix 1: Ontario Biomass Energy Alliance The Ontario Biomass Energy Alliance (OBEA) and its members represent forestry communities and businesses from across Ontario. A partial list of members includes:
The mandate of the OBEA is to promote and foster the use of wood biomass in the production of renewable energy. The balance of life and business in forest industry communities across Ontario requires markets for lumber, high value wood products, and wood residuals from mill and forestry operations. Biomass energy is the vital future market area for these residuals and as such is the key to the survival of our communities. A healthy forest and wood processing industry will help to sustain healthy small towns and rural economies where forestry has been the mainstay for generations. Biomass energy has been recognized as a sustainable and renewable green energy source in Ontario's Green Energy and Green Economy Act (GEGEA). In practice, unfortunately, the structure of the GEGEA and matching Feed-In Tariff (FIT) do not provide the necessary mechanisms to enable the desired and sought-after deployment of biomass energy across Ontario. The OBEA unites the social, community, business, and sustainability goals of Ontario and its forestry communities and regions in the effort to foster biomass energy in Ontario. Information: Alastair Baird, Manager of Economic Development Services County of Renfrew and the Ottawa Valley Forest Industry Alliance [email protected] 1-800-273-0183 ext. 466
Thomas J. Neuman Lumber Co. Ltd. McRae Lumber Co. Ltd. Lavern Heideman & Sons Ltd. Gulick Lumber Company Murray Brothers Lumber Co. Ltd. Hec Clouthier & Sons George Stein Ltd. M.W. Miller Logging John Stewart Forest Products Ltd. H.J. Searson Ltd. Makwa Community Development
Ben Hokum & Son Ltd. Odorizzi Lumber Company Ltd. Opeongo Forestry Service Etmanskie Lumber Herb Shaw & Sons Ltd. Carson Lake Lumber Ltd. Pastway Planing Ensyn Technologies
Renfrew County CFDC Renewable Energy Report May 2011 Page 47 of 70
Appendix 2: Interview Questions Nylene Canada, Arnprior: General Interview Questions
Are there templates or calculators we can access for financial analyses? Current and proposed capacities in MW Advantages and disadvantages of biomass? What forms of biomass (raw, pellets, etc.) are feasible? What permits, regulations, and approvals are required? Do you know of any funding sources or rebates that can be accessed? Are there any pertinent grid connection details for electricity generation? The current FIT for biomass is $0.13/kWh. Do you think this is reasonable? Do you foresee any Green Energy and Green Economy Act compliance issues? Other
Nylene Canada: Biomass Required Site Considerations: Leasing considerations Cost of steam that would make project feasible for you Volume of steam required Transportation by Rail considerations Transportation by Truck considerations Loading/unloading considerations Storage considerations Utility considerations Administration and marketing Test period Other factors Overview of costs of FIT project Ben Hokum & Son (Sawmill), Killaloe: General Interview Questions Are there templates or calculators we can access for financial analyses? What are the steps you took to use biomass? What is your overall cost structure? What are your various supply chain costs? What do you see as the advantages and disadvantages of biomass? What regulations and approvals are required? Do you know of any funding sources or rebates that can be accessed? Are there any pertinent grid connection details for electricity generation?
Renfrew County CFDC Renewable Energy Report May 2011 Page 48 of 70
The current FIT for biomass is $0.13/kWh. Do you think this is reasonable? Do you foresee any Green Energy and Green Economy Act compliance issues?
Ben Hokum & Son: Biomass on Site Site Costs: Land purchase and fees Permits and approvals Design and construction Equipment installation Emission cleaners Operating expenses Labour Building and equipment maintenance Utility fees Administration and marketing Test period Total costs of site requirements Fuel and Processing: Description and volume of raw biomass fuel Type of yard Log concentration Equipment to process & dry fuel Use of dryer, hammermill, pellet machine, cooler Description of process Range of moisture content Heat source of dryer Use of residual heat from electricity generation: to dry feedstock or other reuse? Disposal or use of ash, sand or char Boiler requirements and regulations Monitoring and measurement equipment Pellet plant feasibility Total costs of processing Transportation: A: Increased incoming traffic (for a new FIT operation) B: Pellet plant facility Distances and route to transport raw wood or pellets Bylaws and/or approvals for increased truck traffic Is an environmental assessment required? Road maintenance resulting from extra truck traffic Availability of trucking supply companies and cost estimates Type of fuel in trucks

Renfrew County CFDC Renewable Energy Report May 2011 Page 49 of 70
Equipment required and load/unload infrastructure Dual-purpose load/unload services Alternative modes of transport (rail, ship, etc.) Total costs of transportation Storage: Facility: indoor/outdoor Size of warehouse or silo Use of conveyors, separators Equipment for dust control, temperature sensors, fire suppression systems Total costs for storage Herb Shaw & Sons (Sawmill), Pembroke: General Interview Questions Are there templates or calculators we can access for financial analyses? What are the steps you took to use biomass? What is your overall cost structure? What are your various supply chain costs? What do you see as the advantages and disadvantages of biomass? What regulations and approvals are required? Do you know of any funding sources or rebates that can be accessed? Are there any pertinent grid connection details for electricity generation? The current FIT for biomass is $0.13/kWh. Do you think this is reasonable? Do you foresee any Green Energy and Green Economy Act compliance issues?
Herb Shaw & Sons: Biomass on Site Site Costs: Land purchase and fees Permits and approvals Design and construction Equipment installation Emission cleaners Operating expenses Labour Building and equipment maintenance Utility fees Administration and marketing Test period Total costs of site requirements Fuel and Processing: Description and volume of raw biomass fuel
Renfrew County CFDC Renewable Energy Report May 2011 Page 50 of 70
Type of yard Log concentration Equipment to process & dry fuel Use of dryer, hammermill, pellet machine, cooler Description of process Range of moisture content Heat source of dryer Use of residual heat from electricity generation: to dry feedstock or other reuse? Disposal or use of ash, sand or char Boiler requirements and regulations Monitoring and measurement equipment Pellet plant feasibility Total costs of processing Transportation: A: Increased incoming traffic (for a new FIT operation) B: Pellet plant facility: Distances and route to transport raw wood or pellets Bylaws and/or approvals for increased truck traffic Is an environmental assessment required? Road maintenance resulting from extra truck traffic Availability of trucking supply companies and cost estimates Type of fuel in trucks Equipment required and load/unload infrastructure Dual-purpose load/unload services Alternative modes of transport (rail, ship, etc.) Total costs of transportation Storage: Facility: indoor/outdoor Size of warehouse or silo Use of conveyors, separators Equipment for dust control, temperature sensors, fire suppression systems Total costs for storage
Renfrew County CFDC Renewable Energy Report May 2011 Page 51 of 70
Appendix 3: How Biomass Energy Works63
Although US-based, the following explanation from the Union of Concerned Scientists is very relevant and helpful.
To many people, the most familiar forms of renewable energy are the wind and the sun. But biomass (plant material and animal waste) is the oldest source of renewable energy, used since our ancestors learned the secret of fire.
Until recently, biomass supplied far more renewable electricity—or “biopower”—than wind and solar power combined.[1]
If developed properly, biomass can and should supply increasing amounts of biopower. In fact, in numerous analyses of how America can transition to a clean energy future, sustainable biomass is a critical renewable resource.[2]
Sustainable, low-carbon biomass can provide a significant fraction of the new renewable energy we need to reduce our emissions of heat-trapping gases like carbon dioxide to levels that scientists say will avoid the worst impacts of global warming. Without sustainable, low-carbon biopower, it will likely be more expensive and take longer to transform to a clean energy economy.
But like all our energy sources, biopower has environmental risks that need to be mitigated. If not managed carefully, biomass for energy can be harvested at unsustainable rates, damage ecosystems, produce harmful air pollution, consume large amounts of water, and produce net greenhouse emissions.
However, most scientists believe there is a wide range of biomass resources that can be produced sustainably and with minimal harm, while reducing the overall impacts and risks of our current energy system. Implementing proper policy is essential to securing the benefits of biomass and avoiding its risks.
Based on our bioenergy principles, the work by the Union of Concerned Scientists (UCS) on biopower is dedicated to distinguishing between beneficial biomass resources and those that are questionable or harmful—in a practical and efficient manner—so that beneficial resources can make a significant contribution to our clean energy future.
Note: This section addresses using biomass to generate biopower. For more information on biofuels, go to the UCS Clean Vehicles Program’s biofuels pages.
63 Union of Concerned Scientists, Citizens and Scientists for Environmental Solutions, “How Biomass Energy Works”, http://www.ucsusa.org/clean_energy/technology_and_impacts/energy_technologies/how-biomass-energy-works.html. (accessed Feb 5, 2010)
Renfrew County CFDC Renewable Energy Report May 2011 Page 52 of 70
Biomass is a renewable energy source not only because the energy it contains comes from the sun, but also because biomass can re-grow over a relatively short period of time. Through the process of photosynthesis, chlorophyll in plants captures the sun's energy by converting carbon dioxide from the air and water from the ground into carbohydrates—complex compounds composed of carbon, hydrogen and oxygen.
When these carbohydrates are burned, they turn back into carbon dioxide and water and release the energy they captured from the sun. In this way, biomass functions as a sort of natural battery for storing solar energy. As long as biomass is produced sustainably—meeting current needs without diminishing resources or the land’s capacity to re-grow biomass and recapture carbon—the battery will last indefinitely and provide sources of low-carbon energy.
Types of Beneficial Biomass
Most scientists believe that a wide range of biomass resources are “beneficial” because their use will clearly reduce overall carbon emissions and provide other benefits. Among other resources, beneficial biomass includes
1. Energy crops that don’t compete with food crops for land 2. Portions of crop residues such as wheat straw or corn stover 3. Sustainably harvested wood and forest residues, and 4. Clean municipal and industrial wastes.[3]
Beneficial biomass use can be considered part of the terrestrial carbon cycle — the balanced cycling of carbon from the atmosphere into plants and then into soils and the atmosphere during plant decay. When biopower is developed properly, emissions of biomass carbon are taken up or recycled by subsequent plant growth within a relatively short time, resulting in low net carbon emissions.
Beneficial biomass sources generally maintain or even increase the stocks of carbon stored in soil or plants. Beneficial biomass also displaces carbon emissions from fossil fuels, such as coal, oil or natural gas, the burning of which adds new and additional carbon to the atmosphere and causes global warming.
Among beneficial resources, the most effective and sustainable biomass resources will vary from region to region and also depend on the efficiency of converting biomass to its final application, be it for biopower, biofuels, bioproducts or heat.
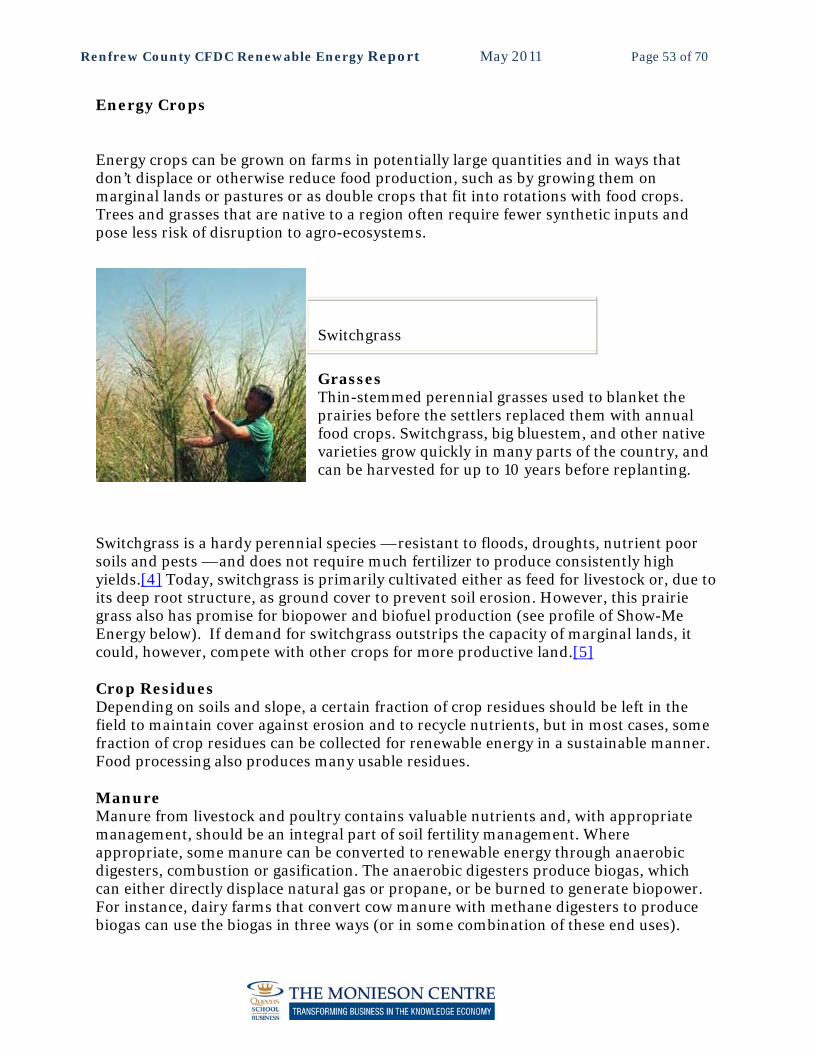
Renfrew County CFDC Renewable Energy Report May 2011 Page 53 of 70
Energy Crops
Energy crops can be grown on farms in potentially large quantities and in ways that don’t displace or otherwise reduce food production, such as by growing them on marginal lands or pastures or as double crops that fit into rotations with food crops. Trees and grasses that are native to a region often require fewer synthetic inputs and pose less risk of disruption to agro-ecosystems.
Grasses Thin-stemmed perennial grasses used to blanket the prairies before the settlers replaced them with annual food crops. Switchgrass, big bluestem, and other native varieties grow quickly in many parts of the country, and can be harvested for up to 10 years before replanting.
Switchgrass is a hardy perennial species — resistant to floods, droughts, nutrient poor soils and pests — and does not require much fertilizer to produce consistently high yields.[4] Today, switchgrass is primarily cultivated either as feed for livestock or, due to its deep root structure, as ground cover to prevent soil erosion. However, this prairie grass also has promise for biopower and biofuel production (see profile of Show-Me Energy below). If demand for switchgrass outstrips the capacity of marginal lands, it could, however, compete with other crops for more productive land.[5]
Crop Residues Depending on soils and slope, a certain fraction of crop residues should be left in the field to maintain cover against erosion and to recycle nutrients, but in most cases, some fraction of crop residues can be collected for renewable energy in a sustainable manner. Food processing also produces many usable residues.
Manure Manure from livestock and poultry contains valuable nutrients and, with appropriate management, should be an integral part of soil fertility management. Where appropriate, some manure can be converted to renewable energy through anaerobic digesters, combustion or gasification. The anaerobic digesters produce biogas, which can either directly displace natural gas or propane, or be burned to generate biopower. For instance, dairy farms that convert cow manure with methane digesters to produce biogas can use the biogas in three ways (or in some combination of these end uses).
Switchgrass
Renfrew County CFDC Renewable Energy Report May 2011 Page 54 of 70
They can use the biogas on-site as a replacement for the farm’s own natural gas or propane use, clean up the biogas and pressurize and inject it into nearby natural gas pipelines, or burn it to produce steam that is run through a turbine to generate renewable electricity for use on-site and/or fed into the local energy grid. The best application of biogas from manure will be determined by the type of manure, opportunity to displace natural gas or propane use, local energy markets, and state and federal incentives.
Beneficial biomass: food waste, forest residues and perennial grasses in Minnesota
In Minnesota, food industry and other byproducts are feeding a new combined heat and power (CHP) plant that generates renewable electricity and efficiently uses waste heat from the boiler. Rahr Malting Company and the Shakopee Mdewakanton Sioux partnered to form Koda Energy, which in 2009, began generating up to 22 megawatts of renewable electricity with oat hulls, wood chips, prairie grasses, and barley malt dust from Rahr Malting.
The Koda plant burns about 170,000 tons of these agricultural waste products a year, and is able to operate at over 70 per cent efficiency because Rahr Malting also uses the waste heat from the boiler in their operations, displacing the need for additional natural gas. About half of the plant’s renewable electricity is used to power Rahr Malting, with the remainder purchased by Xcel Energy to supply to their customers. In the future, the Shakopee Mdewakanton Sioux Community hopes to use switchgrass grown on restored prairies to provide some of the biomass for Koda Energy.[7]
Poultry litter can be digested to produce biogas, or combusted to produce renewable electricity, either directly or through gasification, which improves efficiency and reduces emissions.
Woody biomass
Bark, sawdust, and other byproducts of milling timber and making paper are currently the largest source of biomass-based heat and renewable electricity; commonly, lumber, pulp, and paper mills use them for both heat and power. In addition, shavings produced during the manufacture of wood products and organic sludge (or "liquor") from pulp and paper mills are biomass resources. Some of these “mill residues” could be available for additional generation of renewable electricity.
Renfrew County CFDC Renewable Energy Report May 2011 Page 55 of 70
Beyond these conventional types of woody biomass, there are additional sources of woody biomass that could be used for renewable energy. With the proper policy (see below), these additional sources could be sustainably harvested and make a significant contribution to renewable energy generation.
Forest residues It is important to leave some tree tops and branches, and even dead standing trees, on-site after forest harvests. Coarse woody debris left on the soil surface cycles nutrients, especially from leaves, limbs and tops, reduces erosion, and provides habitat for invertebrates.
Dead standing trees provide bird habitat. Provided that appropriate amounts of residues are left in the forest, the remaining amounts of limbs and tops, which are normally left behind in the forest after timber-harvesting operations, can be sustainably collected for energy use. Often, limbs and tops are already piled at the “landing”— where loggers haul trees to load them onto trucks. Using these residues for biomass can be cheaper than making additional trips into the woods — and reduce impacts on forest stands, wildlife and soils.
Forest treatments Many forest managers see new biomass markets providing opportunities to improve forest stands.[9] Where traditional paper and timber markets require trees to meet diameter and quality specifications, biomass markets will pay for otherwise unmarketable materials, including dead, damaged and small-diameter trees. Income from selling biomass can pay for or partially offset the cost of forest management treatments needed to remove invasive species, release valuable understory trees, or reduce the threat of fires, though the science behind fire reduction is very complex and site specific.[10]
Removing undesired, early succession or understory species can play an important role in restoring native forest types and improving habitat for threatened or endangered species, such as longleaf forests in the U.S. Southeast.[11]
Thinned trees Thinning plantations of smaller-diameter trees before final harvest can also provide a source of biomass. In addition, thinning naturally regenerating stands of smaller-diameter trees can also improve the health and growth of the remaining trees. With the decline in paper mills, some areas of the country no longer have markets for smaller-diameter trees. Under the right conditions, biomass markets could become a sustainable market for smaller-diameter trees that could help improve forest health and reduce carbon emissions.
Short-rotation trees Under the right circumstances, there may be a role for short-rotation tree plantations dedicated to energy production. Such plantations could either be replanted or “coppiced.” (Coppicing is the practice of cutting certain species close to the ground and
Renfrew County CFDC Renewable Energy Report May 2011 Page 56 of 70
letting them re-grow.) Coppicing allows trees to be harvested every three to eight years for a span of 20 or 30 years before replanting.
Short-rotation management, either through coppicing or replanting, is best suited to existing plantations, not longer-rotation naturally-regenerating forests, which tend to have greater biodiversity and store more carbon than plantations.
Policy is needed to ensure that the growing biomass industry will use these beneficial resources, and use them on a sustainable basis. See below for more on the policy needed to guide the biomass industry toward sustainable, beneficial resources.
Urban wastes
People generate biomass wastes in many forms, including "urban wood waste" (such as tree trimmings, shipping pallets and clean, untreated leftover construction wood) and the clean, biodegradable portion of garbage (paper that wouldn’t be recycled, food, yard waste, etc.). In addition, methane can be captured from landfills or produced in the operation of sewage treatment plants and used for heat and power, reducing air pollution and emissions of global warming gases.
Converting Biomass to Biopower
From the time of Prometheus to the present, the most common way to capture the energy from biomass was to burn it to make heat. Since the industrial revolution, this biomass fired heat has produced steam power, and more recently this biomass fired steam power has been used to generate electricity. Burning biomass in conventional boilers can have numerous environmental and air-quality advantages over burning fossil fuels.
Advances in recent years have shown that there are even more efficient and cleaner ways to use biomass. It can be converted into liquid fuels, for example, or “cooked” in a process called "gasification" to produce combustible gases, which reduces various kinds of emissions from biomass combustion, especially particulates.
Direct combustion The oldest and most common way of converting biomass to electricity is to burn it to produce steam, which turns a turbine that produces electricity. The problems with direct combustion of biomass are that much of the energy is wasted and that it can cause some pollution if it is not carefully controlled. Direct combustion can be done in a plant using solely biomass (a “dedicated plant”) or in a plant made to burn another fuel, usually coal.
Co-firing An approach that may increase the use of biomass energy in the short term is to mix it with coal and burn it at a power plant designed for coal — a process known as “co-firing.” Through gasification, biomass can also be co-fired at natural gas-powered plants.
Renfrew County CFDC Renewable Energy Report May 2011 Page 57 of 70
The benefits associated with biomass co-firing can include lower operating costs, reductions of harmful emissions like sulfur and mercury, greater energy security and, with the use of beneficial biomass, lower carbon emissions. Co-firing is also one of the more economically viable ways to increase biomass power generation today, since it can be done with modifications to existing facilities.
Repowering Coal plants can also be converted to run entirely on biomass, known as “re-powering.” (Similarly, natural gas plants could also be converted to run on biogas made from biomass; see below.)
Combined heat and power (CHP) Direct combustion of biomass produces heat that can also be used to heat buildings or for industrial processes (for example, see textbox on Koda Energy above). Because they use heat energy that would otherwise be wasted, CHP facilities can be significantly more efficient than direct combustion systems. However, it is not always possible or economical to find customers in need of heat in close proximity to power plants.
Biomass gasification By heating biomass in the presence of a carefully controlled amount of oxygen and under pressure, it can be converted into a mixture of hydrogen and carbon monoxide called syngas. This syngas is often refined to remove contaminants.
Equipment can also be added to separate and remove the carbon dioxide in a concentrated form. The syngas can then be run directly through a gas turbine or burned and run through a steam turbine to produce electricity. Biomass gasification is generally cleaner and more efficient than direct combustion of biomass. Syngas can also be further processed to make liquid biofuels or other useful chemicals.
Anaerobic digestion Micro-organisms break down biomass to produce methane and carbon dioxide. This can occur in a carefully controlled way in anaerobic digesters used to process sewage or animal manure. Related processes happen in a less-controlled manner in landfills, as biomass in the garbage breaks down. A portion of this methane can be captured and burned for heat and power. In addition to generating biogas, which displaces natural gas from fossil fuel sources, such collection processes keep the methane from escaping to the atmosphere, reducing emissions of a powerful global warming gas.
Energy density Another important consideration with biomass energy systems is that unprocessed biomass contains less energy per pound than fossil fuels — it has less “energy density.” Green woody biomass contains as much as 50 per cent water by weight. This means that unprocessed biomass typically can't be cost-effectively shipped more than about 50-100 miles by truck before it is converted into fuel or energy.
It also means that biomass energy systems may be smaller scale and more distributed than their fossil fuel counterparts, because it is hard to sustainably gather and process
Renfrew County CFDC Renewable Energy Report May 2011 Page 58 of 70
more than a certain amount of it in one place. This has the advantage that local, rural communities will be able to design energy systems that are self-sufficient, sustainable, and adapted to their own needs.
However, there are ways to increase the energy density of biomass and to decrease its shipping costs. Drying, grinding and pressing biomass into “pellets” increases its energy density. Compared to raw logs or wood chips, biomass pellets can also be more efficiently handled with augers and conveyers used in power plants. In addition, shipping biomass by water greatly reduces transportation costs compared to hauling it by truck.
Thus, hauling pelletized biomass by water has made it economical to transport biomass much greater distances, even thousands of miles, across the Atlantic and Pacific, to markets in Japan and Europe. In the last few years, the international trade in pelletized biomass has been growing rapidly, largely serving European utilities that need to meet renewable energy requirements and carbon-reduction mandates. Several large pellet manufacturers are locating in the Southern U.S., with its prodigious forest plantation resource, to serve such markets.[12]
Potential for Biopower
Biomass was the largest source of renewable electricity in the U.S. until 2009, when it was overtaken by wind energy. Biopower accounted for more than 35 per cent of total net renewable generation in 2009, excluding conventional hydroelectric generation.[14] The contribution for heat is also substantial. But with better conversion technology and more attention paid to energy crops, we could produce much more.
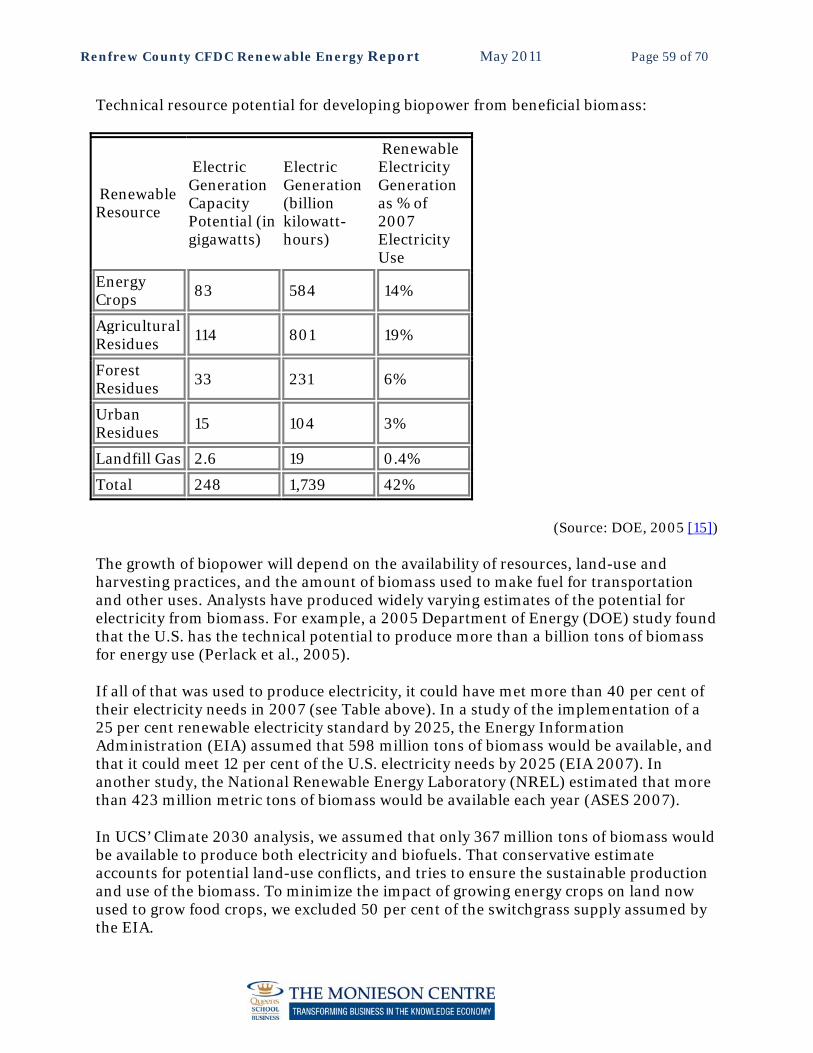
Renfrew County CFDC Renewable Energy Report May 2011 Page 59 of 70
Technical resource potential for developing biopower from beneficial biomass:
Renewable Resource
Electric Generation Capacity Potential (in gigawatts)
Electric Generation (billion kilowatt-hours)
Renewable Electricity Generation as % of 2007 Electricity Use
Energy Crops
83 584 14%
Agricultural Residues
114 801 19%
Forest Residues
33 231 6%
Urban Residues
15 104 3%
Landfill Gas 2.6 19 0.4%
Total 248 1,739 42%
(Source: DOE, 2005 [15])
The growth of biopower will depend on the availability of resources, land-use and harvesting practices, and the amount of biomass used to make fuel for transportation and other uses. Analysts have produced widely varying estimates of the potential for electricity from biomass. For example, a 2005 Department of Energy (DOE) study found that the U.S. has the technical potential to produce more than a billion tons of biomass for energy use (Perlack et al., 2005).
If all of that was used to produce electricity, it could have met more than 40 per cent of their electricity needs in 2007 (see Table above). In a study of the implementation of a 25 per cent renewable electricity standard by 2025, the Energy Information Administration (EIA) assumed that 598 million tons of biomass would be available, and that it could meet 12 per cent of the U.S. electricity needs by 2025 (EIA 2007). In another study, the National Renewable Energy Laboratory (NREL) estimated that more than 423 million metric tons of biomass would be available each year (ASES 2007).
In UCS’ Climate 2030 analysis, we assumed that only 367 million tons of biomass would be available to produce both electricity and biofuels. That conservative estimate accounts for potential land-use conflicts, and tries to ensure the sustainable production and use of the biomass. To minimize the impact of growing energy crops on land now used to grow food crops, we excluded 50 per cent of the switchgrass supply assumed by the EIA.
Renfrew County CFDC Renewable Energy Report May 2011 Page 60 of 70
That allows for most switchgrass to grow on pasture and marginal agricultural lands — and also provides much greater cuts in carbon emissions (for more details, see Appendix G of Climate 2030: http://www.ucsusa.org/assets/documents/global_warming/climate2030-app-g-biomass.pdf).
The potential contribution of biomass to electricity production in our analysis is therefore just one-third of that identified in the DOE study, and 60 per cent of that in the EIA study.[16]
Distribution of biomass Whether crop or forest residues, urban and mill wastes, or energy crops, biomass of one kind or another is available in most areas of the country. For information on the availability of various kinds of biomass resources in particular parts of the country, see the National Renewable Energy Labs’ searchable biomass databases.
Environmental Risks and Benefits Like all energy sources, biomass has environmental impacts and risks. The main impacts and risks from biomass are sustainability of the resource use, air quality and carbon emissions.
Sustainability Biomass energy production involves annual harvests or periodic removals of crops, residues, trees or other resources from the land. These harvests and removals need to be at levels that are sustainable, i.e., ensure that current use does not deplete the land’s ability to meet future needs, and also be done in ways that don’t degrade other important indicators of sustainability. Because biomass markets may involve new or additional removals of residues, crops or trees, we should be careful to minimize impacts from whatever additional demands biomass growth or harvesting makes on the land.
Markets for corn stover, wheat straw and other crop residues are common, and considerable research has been done on residue management. In addition, participation in some federal crop programs requires conservation plans. As a result of established science and policy, farmers generally leave a certain percentage of crop residues on fields, depending on soil and slope, to reduce erosion and maintain fertility. Additional harvests of crop residues or the growth of energy crops might require additional research and policy to minimize impacts.
In forestry, where residue or biomass markets are less common, new guidelines might need to be developed. Existing best management practices (BMPs) were developed to address forest management issues, especially water quality, related to traditional sawlog and pulpwood markets, with predictable harvest levels. But the development of new biomass markets will entail larger biomass removals from forests, especially forestry residues and small-diameter trees. Current BMPs may not be sufficient under higher harvesting levels and new harvests of previously unmarketable materials.

Renfrew County CFDC Renewable Energy Report May 2011 Page 61 of 70
However, because woody biomass is often a low-value product, sustainability standards must be relatively inexpensive to implement and verify. Thankfully, we can improve the sustainability of biomass harvests with little added cost to forest owners through the use of existing forest management programs, including 1) biomass BMPs, 2) certification or 3) forest management plans.
Working with forest owner associations, foresters, forest ecologists, wildlife conservation experts and biomass developers, UCS helped develop practical and effective sustainability provisions that can provide a measure of assurance that woody biomass harvests will be sustainable in the U.S.
State-based biomass Best Management Practices (BMPs) or guidelines:
Missouri, Minnesota, Pennsylvania, Maine and Wisconsin developed biomass harvesting guidelines to avoid negative impacts of biomass removals. Other states and regions, including Southern states, are also developing biomass guidelines. Developed through collaborative stakeholder processes, BMPs are practical enough to be used by foresters and loggers.
Third-party forest certification:
Certification can also be used to verify the sustainability of biomass harvests. Between them, the Forest Stewardship Council, the Sustainable Forestry Initiative, and Tree Farm have certified nearly 275 million acres of industrial and private forestland in the U.S. Certification programs already address, or are being updated to address, many of the concerns related to biomass harvests.
Forest management plans written by professionally accredited foresters:
Foresters can help anticipate and therefore minimize impacts of additional biomass removals. Although a minority of smaller forest owners have management plans, forest owner associations have long recommended that more forest owners have them written to better achieve their financial and conservation objectives. Forest owners who have management plans stand to make more money than if they lacked such plans. To avoid out-of-pocket costs, proceeds from biomass sales could cover the cost of writing management plans.
Whether implemented through BMPs, certification or management plans, sustainability standards should minimize short-term impacts and avoid long-term degradation of water quality, soil productivity, wildlife habitat, and biodiversity — all key indicators of sustainability. Science and local conditions need to be used in determining the standards. For example, fire-adapted forests will likely require retention of less woody biomass than forests adapted to other disturbances such as hurricanes.
Sustainability standards should ensure nutrients removed in a biomass harvest are replenished and that removals do not damage long-term productivity, especially on sensitive soils. Coarse woody material that could be removed for biomass energy also

Renfrew County CFDC Renewable Energy Report May 2011 Page 62 of 70
provides crucial wildlife habitat; depending on a state’s wildlife, standards might protect snags, den trees, and large downed woody material. Biodiversity can be fostered through sustainability standards that encourage retention of existing native ecosystems and forest restoration. Lastly, sustainability standards should provide for the regrowth of the forest — surely a requirement for woody biomass to be truly renewable.
Air quality Especially with the emissions from combustion systems, biomass can impact air quality. Emissions vary depending on the biomass resource, the conversion technology (type of power plant), and the pollution controls installed at the plant. The table below from the National Renewable Energy Laboratory and Oak Ridge National Laboratory compares air emissions from different biomass, coal and natural gas power plants with pollution control equipment.
Because most biomass resources and natural gas contain far less sulfur and mercury than coal, biomass and natural gas power plants typically emit far less of these pollutants than do coal-fired power plants.[17] Sulfur emissions are a key cause of smog and acid rain. Mercury is a known neurotoxin.
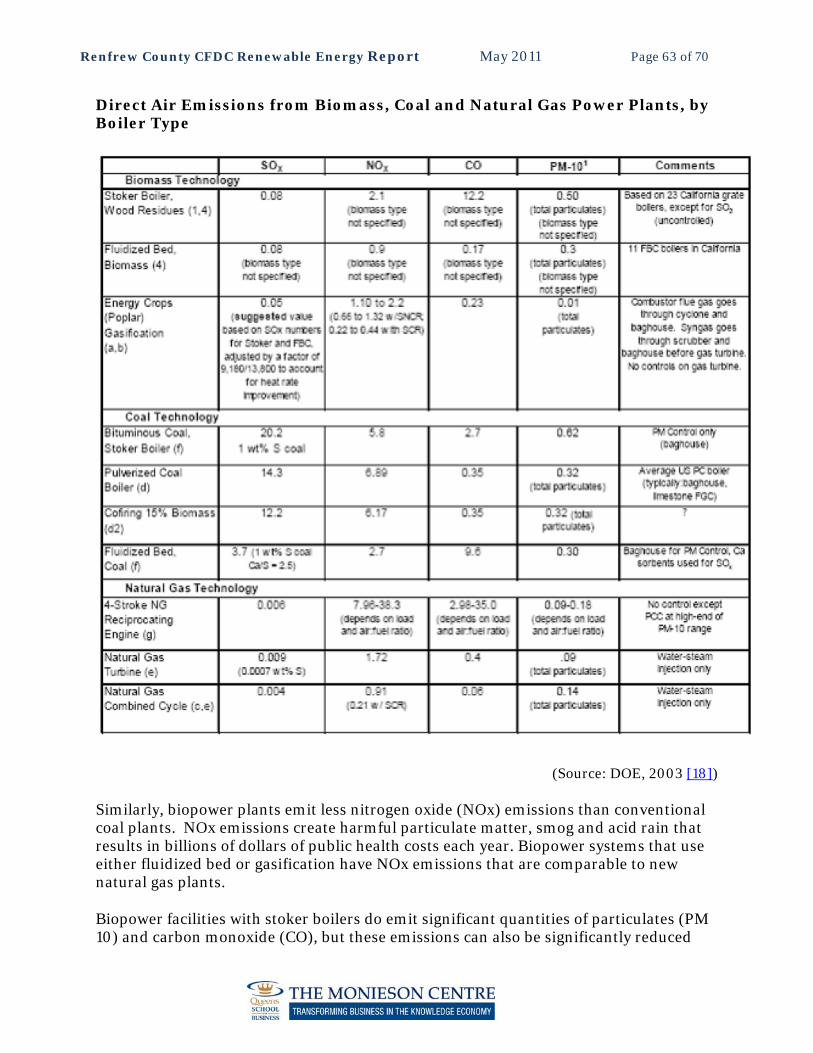
Renfrew County CFDC Renewable Energy Report May 2011 Page 63 of 70
Direct Air Emissions from Biomass, Coal and Natural Gas Power Plants, by Boiler Type
(Source: DOE, 2003 [18])
Similarly, biopower plants emit less nitrogen oxide (NOx) emissions than conventional coal plants. NOx emissions create harmful particulate matter, smog and acid rain that results in billions of dollars of public health costs each year. Biopower systems that use either fluidized bed or gasification have NOx emissions that are comparable to new natural gas plants.
Biopower facilities with stoker boilers do emit significant quantities of particulates (PM 10) and carbon monoxide (CO), but these emissions can also be significantly reduced
Renfrew County CFDC Renewable Energy Report May 2011 Page 64 of 70
with fluidized bed and gasification systems. Advanced coal gasification power plants also produce significantly lower air emissions than conventional coal plants.
Carbon Emissions
Burning or gasifying biomass does emit carbon into the atmosphere. With heightened interest in renewable energy and climate change, scientists have put biomass’ carbon emissions under additional scrutiny, and are making important distinctions between biomass resources that are beneficial in reducing net carbon emissions and biomass resources that would increase net emissions. While our understanding of specific biomass resources and applications will continue to evolve, we can group biomass resources into three general categories, based on their net carbon impacts.
Beneficial biomass As mentioned previously, there is considerable consensus among leading scientists that there are biomass resources that are clearly beneficial in their potential to reduce net carbon emissions. These beneficial resources exist in substantial supplies and can form the basis of increasing production of biopower and biofuels.
Harmful biomass In contrast to these beneficial biomass resources, scientists generally agree that harmful biomass resources and practices include clearing forests, savannas or grasslands to grow energy crops, and displacing food production for bioenergy production that ultimately leads to the clearing of carbon-rich ecosystems elsewhere to grow food.[19] Harmful biomass adds net carbon to the atmosphere by either directly or indirectly decreasing the overall amount of carbon stored in plants and soils.
Marginal biomass: resources that could be beneficial — or harmful Scientists think the carbon benefits and risks of some biomass resources range widely, depending on how and where they are harvested, how efficiently they are converted to energy, and what fossil fuels they replace. In other words, these resources might be beneficial or harmful depending on specific situations. The use of trees harvested especially for energy use is a good example.
Using trees that will quickly and certainly re-grow to efficiently displace more carbon-intensive fossil fuels may be beneficial. On the other hand, using trees that will re-grow slowly or maybe not be fully replaced in an inefficient facility or to displace less carbon-intensive fuels may not be beneficial, or may be beneficial only over unacceptably long time frames in comparison to other available resources.[20] Marginal resources should only be used when their use can be demonstrated to reduce net emissions.

Renfrew County CFDC Renewable Energy Report May 2011 Page 65 of 70
Navigating the path forward
We all should be concerned that biomass will be developed sustainably and beneficially — in ways that are cleaner and safer than our current energy mix, that are truly sustainable and that will reduce net carbon emissions. Beneficial biomass resources will in most cases be cleaner, sustainable and beneficial. Harmful biomass resources almost always will not. Marginal biomass resources may be cleaner, sustainable and beneficial — or not — depending on specific circumstances.
On the basis of the science, it would be unwarranted to support the use of all biomass resources, with any conversion technology and for any application. It would also be unwarranted to oppose all biomass on the basis that some biomass resources, conversion technologies or applications are not sustainable or beneficial.
Unfortunately, some biomass advocates and biomass opponents alike make just these mistakes — failing to distinguish beneficial from harmful biomass resources. Thus, all too often the debate about biomass is conducted in absolutist terms, either arguing that all biomass is “carbon neutral” or that “biomass” writ large will accelerate global warming, increase air pollution or lay waste to forests.
These absolutist approaches to biomass have led to two pitfalls in developing biomass policy. Absolute advocates have supported policy that would let almost any kind of biomass resource be eligible for renewable energy and climate legislation. On the other extreme, absolutist opposition has led to proposals to effectively remove most kinds of biomass from policy, especially at the state level.
Both approaches pose challenges to the development of beneficial biopower generation. The “anything goes” approach risks the development of harmful biomass resources that will increase net carbon emissions and cause other harm. Such a path also risks undermining the confidence that the public and policymakers can place in biomass as a legitimate climate solution — which could eventually threaten the inclusion of beneficial biomass as a renewable energy resource in policy.
In tarring biomass with too broad a brush, some biomass opposition lumps beneficial resources with harmful ones and risks not developing beneficial biomass at large enough scale to capture important benefits for the country and the planet. As a group of biomass experts, comprising both advocates and skeptics, noted in an article in Science, “society cannot afford to miss out on the global greenhouse gas reductions and the local environmental and societal benefits when biofuels are done right.”[21]
To capture the benefits of beneficial biomass and avoid the risks of harmful biomass, federal and state policies should distinguish between beneficial and harmful biomass resources. Most policy related to biomass-based energy, be it for fuels, electricity or thermal, includes a definition of eligible biomass resources.
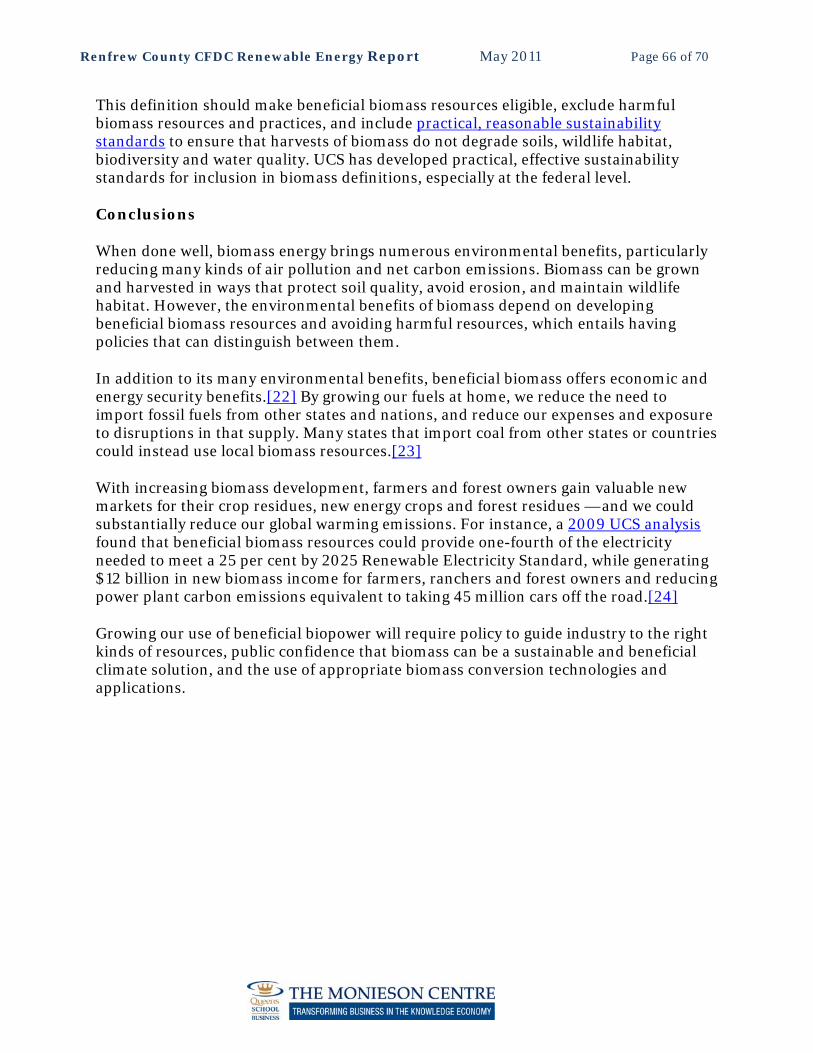
Renfrew County CFDC Renewable Energy Report May 2011 Page 66 of 70
This definition should make beneficial biomass resources eligible, exclude harmful biomass resources and practices, and include practical, reasonable sustainability standards to ensure that harvests of biomass do not degrade soils, wildlife habitat, biodiversity and water quality. UCS has developed practical, effective sustainability standards for inclusion in biomass definitions, especially at the federal level.
Conclusions
When done well, biomass energy brings numerous environmental benefits, particularly reducing many kinds of air pollution and net carbon emissions. Biomass can be grown and harvested in ways that protect soil quality, avoid erosion, and maintain wildlife habitat. However, the environmental benefits of biomass depend on developing beneficial biomass resources and avoiding harmful resources, which entails having policies that can distinguish between them.
In addition to its many environmental benefits, beneficial biomass offers economic and energy security benefits.[22] By growing our fuels at home, we reduce the need to import fossil fuels from other states and nations, and reduce our expenses and exposure to disruptions in that supply. Many states that import coal from other states or countries could instead use local biomass resources.[23]
With increasing biomass development, farmers and forest owners gain valuable new markets for their crop residues, new energy crops and forest residues — and we could substantially reduce our global warming emissions. For instance, a 2009 UCS analysis found that beneficial biomass resources could provide one-fourth of the electricity needed to meet a 25 per cent by 2025 Renewable Electricity Standard, while generating $12 billion in new biomass income for farmers, ranchers and forest owners and reducing power plant carbon emissions equivalent to taking 45 million cars off the road.[24]
Growing our use of beneficial biopower will require policy to guide industry to the right kinds of resources, public confidence that biomass can be a sustainable and beneficial climate solution, and the use of appropriate biomass conversion technologies and applications.

Renfrew County CFDC Renewable Energy Report May 2011 Page 67 of 70
Endnotes
1 Energy Information Administration (EIA). 2008. Renewable energy trends 2007. Washington, DC. Online at http://www.eia.doe.gov/cneaf/solar.renewables/page/trends/rentrends.html. 2 Union of Concerned Scientists. 2009a. UCS Climate 2030: A national blueprint for a clean energy economy. Cambridge, MA. 3 Tilman, David., et al. 2009. Beneficial biofuels—the food, energy and environment trilemma. Science, July 17, 270-271. 4 Natural Resources Conservation Service (NRCS). 2006. Switchgrass burned for power. Washington, DC: U.S. Department of Agriculture. Online at http://www.ia.nrcs.usda.gov/News/newsreleases/2006/switchgrass.html 5 Marshall, Liz., et al. 2010. Fields of Fuel World Resources Institute. Washington, DC. Available online at: http://pdf.wri.org/fields_of_fuel.pdf 6 PRM Energy Systems. 1996. A case study of two biomass gasification systems converting 650 tons/day of rice hulls to PRME NaturallyGas. Hot Springs, AR. Online at: http://gasifiers.bioenergylists.org/files/PRM%20ENERGY%20Gasification%20Systems.pdf 7 Schill, Susanne. 2008. Koda biomass energy facility to begin final testing. Available only online at: http://www.biomassmagazine.com/article.jsp?article_id=2237&q=koda 8 Burnham, Michael. 2009. Energy by the acre. E and E News. Available online at: http://www.eenews.net/special_reports/everglades/energy_by_the_acre/ 9 Forest Guild. 2008. Woody biomass removal case studies. Santa Fe, NM. Available online at: http://biomass.forestguild.org/ 10 Franklin, Jerry., et al. 2003. Forging a science-based national forest fire policy. Forest Fires: Issues in science and technology. Available online at: http://inr.oregonstate.edu/download/forging_a_science_based_national_forest_fire_policy.pdf 11 Brockaway, Dale., et al. 2005. Restoration of longleaf pine ecosystems. US Forest Service, Southern Forest Research Station. Asheville, NC. Available online at: http://www.srs.fs.usda.gov/pubs/gtr/gtr_srs083.pdf 12 Adrian Pirraglia, et al. 2010. Wood pellets: An expanding market opportunity. Biomass Magazine. June. Online at http://www.biomassmagazine.com/article.jsp?article_id=3853. 13 Johnson, R. 2010. It’s show time. Biomass Magazine. 2010. Online at http://www.biomassmagazine.com/article.jsp?article_id=3537 14 Energy Information Administration (EIA). 2010. Annual Energy Outlook 2010. Online at http://www.eia.doe.gov/oiaf/aeo/index.html 15 Department of Energy (DOE) and Department of Agriculture (USDA). 2005. Biomass as feedstock for a bioenergy and bioproducts industry: The technical feasibility of a billion-ton annual supply. Oak Ridge, TN: Oak Ridge National Laboratory. Online at http://feedstockreview.ornl.gov/pdf/billion_ton_vision.pdf. 16 Union of Concerned Scientists. 2009a. UCS Climate 2030: A national blueprint for a clean energy economy. Cambridge, MA. Online at http://www.ucsusa.org/global_warming/solutions/big_picture_solutions/climate-2030-blueprint.html 17 Energy Information Agency (EIA). Biomass for electricity generation. Washington, DC. Online at http://www.eia.doe.gov/oiaf/analysispaper/biomass/ 18 Bain, Richard. 2003. Biopower Technical Assessment: State of the Industry and the Technology. Department of Energy. Washington, DC. Available online at: http://www.fs.fed.us/ccrc/topics/urban-forests/docs/Biopower_Assessment.pdf 19 Tilman, Science. 20 Manomet Center for Conservation Sciences. 2010. Biomass Sustainability and Carbon Policy Study. Brunswick, ME. Online at: http://www.manomet.org/sites/manomet.org/files/Manomet_Biomass_Report_Full_LoRez.pdf 21 Tilman, Science. 22 U.S. Department of Energy (DOE). Biomass: Frequently asked questions. Online at http://www1.eere.energy.gov/biomass/biomass_basics_faqs.html 23 Union of Concerned Scientists. 2010. Burning Coal, Burning Cash. Cambridge, MA. Online at http://www.ucsusa.org/burningcoalburningcash 24 Union of Concerned Scientists. 2009b. Clean Energy, Green Jobs. Cambridge, MA. Online at http://www.ucsusa.org/clean_energy/solutions/renewable_energy_solutions/clean-energy-green-jobs.html
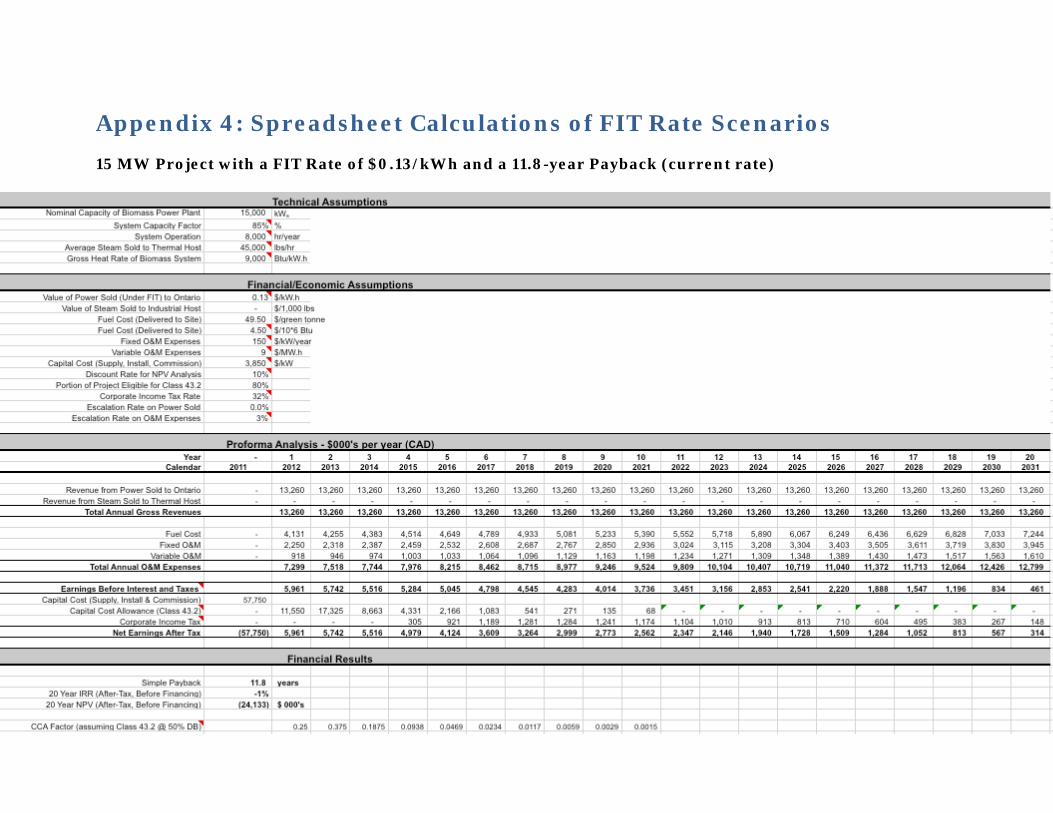
Appendix 4: Spreadsheet Calculations of FIT Rate Scenarios 15 MW Project with a FIT Rate of $0.13/kWh and a 11.8-year Payback (current rate)

Renfrew County CFDC Renewable Energy Report May 2011 Page 1 of 70
15 MW Project with a FIT Rate of $0.17/kWh and a 6.4-year Payback
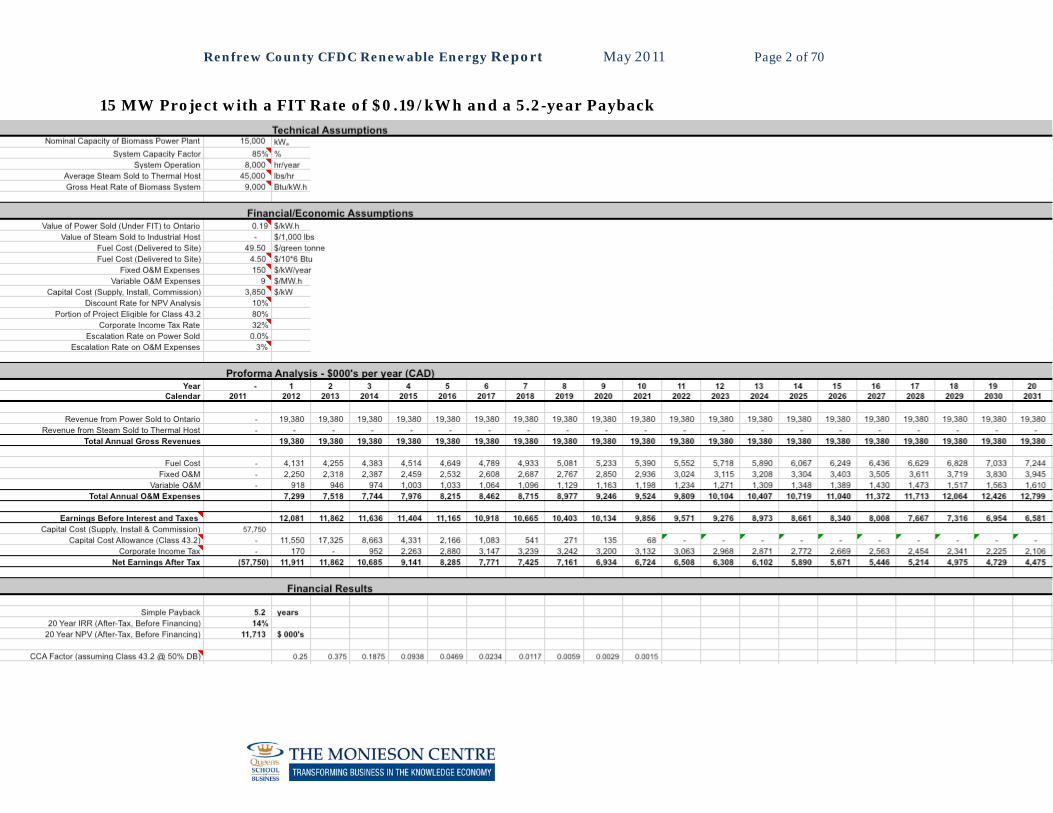
Renfrew County CFDC Renewable Energy Report May 2011 Page 2 of 70
15 MW Project with a FIT Rate of $0.19/kWh and a 5.2-year Payback
Renfrew County CFDC Renewable Energy Report May 2011 Page 3 of 70
15 MW Project with a FIT Rate of $0.27/kWh and a 3.0-year Payback
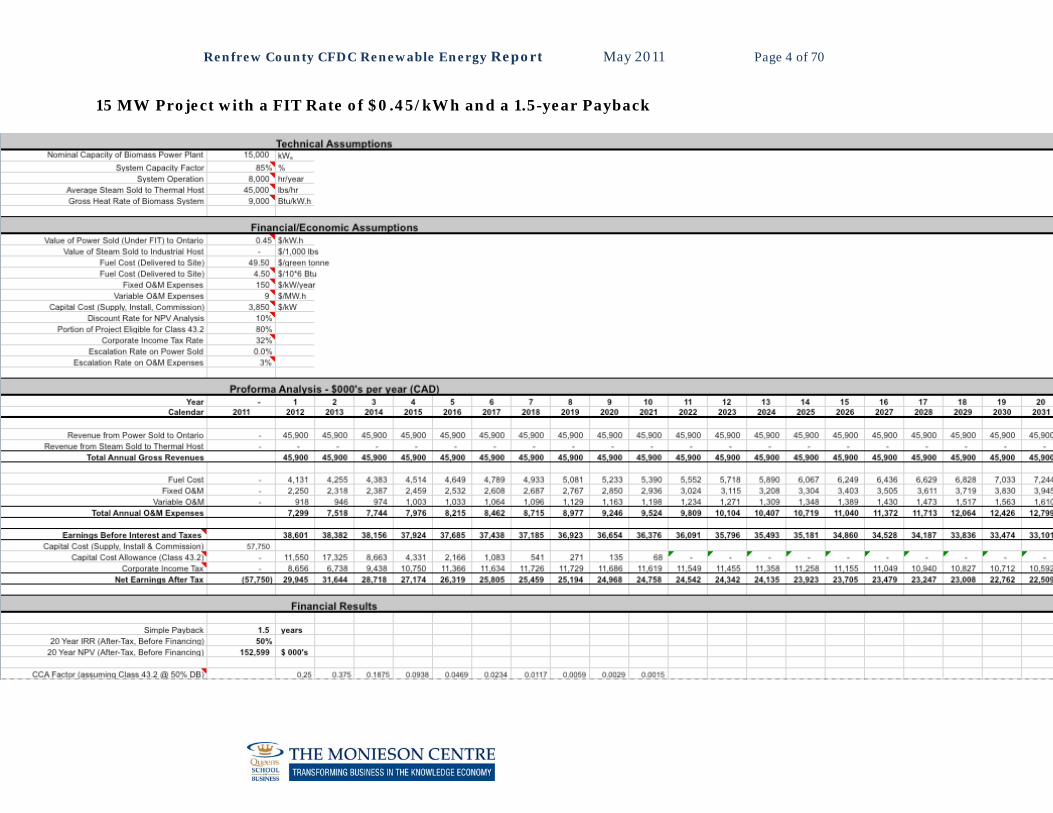
Renfrew County CFDC Renewable Energy Report May 2011 Page 4 of 70
15 MW Project with a FIT Rate of $0.45/kWh and a 1.5-year Payback

Appendix 5: Hydro One Connection Impact Assessment Fees
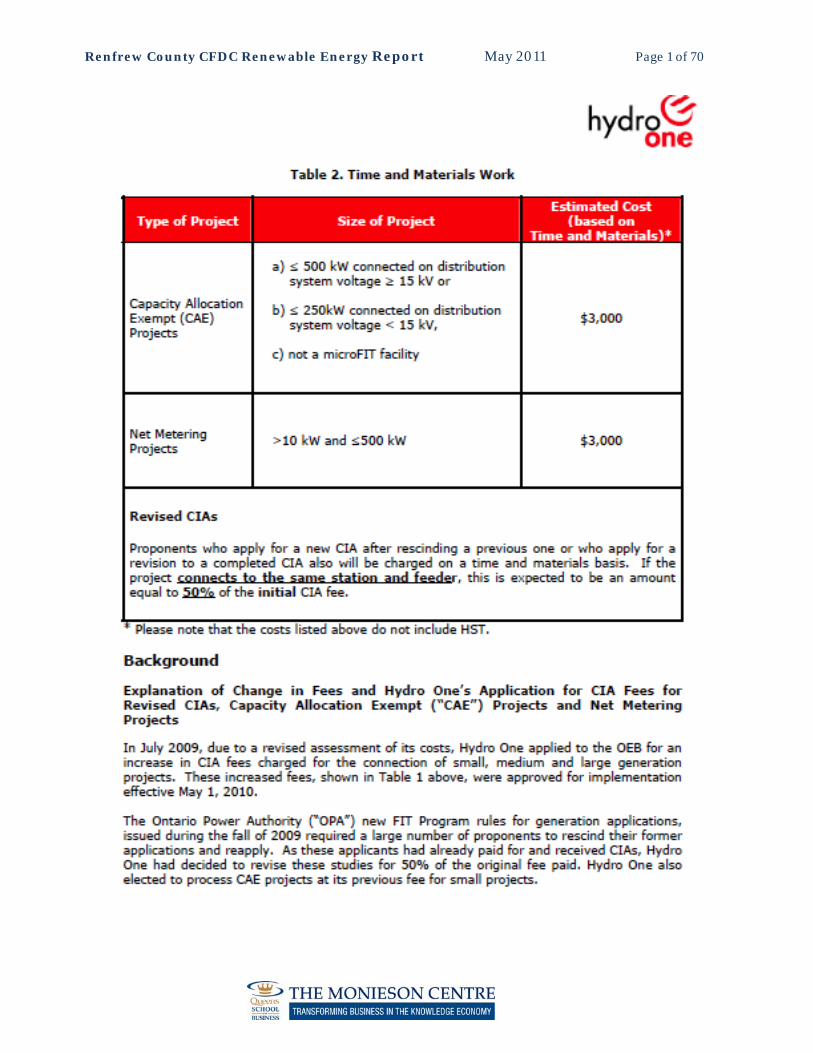
Renfrew County CFDC Renewable Energy Report May 2011 Page 1 of 70

Renfrew County CFDC Renewable Energy Report May 2011 Page 2 of 70
Renfrew County CFDC Renewable Energy Report May 2011 Page 3 of 70
Glossary escalation rate Percentage at which an annual change in the price levels of the goods and services occurs or is expected to occur. FIT – Ontario Feed-in Tariff http://fit.powerauthority.on.ca/ cogen Cogeneration (also combined heat and power, CHP) is the use of a heat engine or a power station to simultaneously generate both electricity and useful heat. fob site, fob mill The term Free on Board (FOB) indicates when legal title to something is transferred. So, FOB shipping point indicates that the purchaser is responsible for insurance, transportation, etc., since they have taken ownership at the shipping point, as soon as it leaves the supplier/factory/sawmill, etc. Conversely, FOB destination means that the seller is totally responsible until the goods arrive and are signed for at the point of destination. In effect, ownership doesn't pass until it arrives and is accepted. In thjs study, FOB mill is used to indicate that shipping costs are added in to the amount paid by Thurso for the wood biomass. When the biomass arrives at Thurso, Shaw or Hokum is paid for the biomass plus the cost of the transportation. Shaw and Hokum record their "sale" as net of the shipping costs. However, the "cost" to Thurso would be the amount they paid for it, which included the shipping costs since it was FOB mill. And that's why, when we are inputting costs for the electricity generation, we would use the higher amount, since that's what it would cost to get the biomass to the facility. Also, that's why we're erring on the high side for these costs, since we know that the cost is transportation-intense, and therefore sensitive to rising fuel prices. full-tree to roadside trees are felled and transported to roadside with branches and top intact, transport to roadside is mainly by cable, grapple or clam-bunk skidders. Then the full trees are processed at roadside or hauled as full trees to a central processing yard or the mill. Roadside processing of full trees can include:
full tree chipping and hauling of full tree chips to the mill

Renfrew County CFDC Renewable Energy Report May 2011 Page 4 of 70
delimbing and topping to produced tree-lengths for hauling to the mill delimbing, topping and bucking to produce wood assortments for hauling as
pulpwood to pulp, paper or wood-based panel mills, and logs to sawmills or veneer/plywood plants
The full tree method is most applicable to clearfelling operations, and in some cases to first commercial thinnings where the material is chipped directly in the stand or short enough to be forwarded to roadside. The full tree method is currently the most widely used logging method in Canada east of Alberta, and accounts for about 65% of the volume harvested GHG A greenhouse gas (sometimes abbreviated GHG) is a gas in an atmosphere that absorbs and emits radiation within the thermal infrared range. This process is the fundamental cause of the greenhouse effect.[1] The primary greenhouse gases in the Earth's atmosphere are water vapor, carbon dioxide, methane, nitrous oxide, and ozone. In the Solar System, the atmospheres of Venus, Mars, and Titan also contain gases that cause greenhouse effects. Greenhouse gases greatly affect the temperature of the Earth; without them, Earth's surface would be on average about 33 °C (59 °F)[note 1] colder than at present green tonne One of many wood residue measurements (chips, shavings, sawdust & bark) 1 Bone Dry Tonne = 2.6525 m3 1 Bone Dry Ton = 2.4067 m3 1 Green Tonne = 1.3262 m3 1 Green Ton = 1.2035 m3 hog fuel An unprocessed mix of coarse chips of bark and wood fiber. Pieces run between a coarse grade of less than 5" to a fine grade of less than 2". Possibly from a nickname of the grinding machine used to create it, a "hog." The word for chopped (hacked) in Norwegian is hogge (hogde past tense). chopped wood has been hogde. Hogde fuel likely morphed into hog fuel. IRR The discount rate often used in capital budgeting that makes the net present value of all cash flows from a particular project equal to zero. Generally speaking, the higher a project's internal rate of return, the more desirable it is to undertake the project. As such, IRR can be used to rank several prospective projects a firm is considering.
Renfrew County CFDC Renewable Energy Report May 2011 Page 5 of 70
Assuming all other factors are equal among the various projects, the project with the highest IRR would probably be considered the best and undertaken first. NPV NPV is a formula that allows you to compare the value of a dollar today to the value of that same dollar in the future, taking inflation and returns into account. If the NPV of a prospective project is positive, it should be accepted. However, if NPV is negative, the project should probably be rejected because cash flows will also be negative. For example, if a retail clothing business wants to purchase an existing store, it would first estimate the future cash flows that store would generate, and then discount those cash flows into one lump-sum present value amount, say $565,000. If the owner of the store was willing to sell his business for less than $565,000, the purchasing company would likely accept the offer as it presents a positive NPV investment. Conversely, if the owner would not sell for less than $565,000, the purchaser would not buy the store, as the investment would present a negative NPV at that time and would, therefore, reduce the overall value of the clothing company. oven dried and ODT Generally described as the amount of wood that weighs 1,000 kg at zero per cent moisture content. roundwood
Wood in its natural state as felled, with or without bark. It may be round, split, roughly squared or in other forms. Roundwood can be used for industrial purposes, either in its round form (e.g. as transmission poles or piling) or as raw material to be processed into industrial products such as sawn wood, panel products or pulp.
slash littered wood chips and broken branches that remain after trees have been cut