RENEWABLES 2005 - IAEA
282
RENEWABLES 2005 GLOBAL STATUS REPORT Paper prepared for the REN21 Network by The Worldwatch Institute Lead Author: Eric Martinot www.ren21.net
Transcript of RENEWABLES 2005 - IAEA

RENEWABLES 2005 GLOBAL STATUS REPORT
Paper prepared for the REN21 Network by The Worldwatch Institute
Lead Author: Eric Martinotwww.ren21.net

Renewable Energy Policy Network for the 21st Century
REN21 is a global policy network aimed at providing a forum for international leadership on renewable energy. Its goal is toallow the rapid expansion of renewable energies in developing and industrial countries by bolstering policy development anddecision making on sub-national, national, and international levels.
Open to all relevant and dedicated stakeholders, REN21 is a network of the capable and the committed which creates anenvironment in which ideas and information are shared and cooperation and action are encouraged to promote renewableenergy worldwide. REN21 connects governments; international institutions and organizations; partnerships and initiatives;and other stakeholders on the political level with those “on the ground.” REN21 is not an actor itself but a set of evolving relationships oriented around a commitment to renewable energy.
The establishment of a global policy network was embraced in the Political Declaration of the International Conferencefor Renewable Energies, Bonn 2004 (Renewables 2004), and formally launched in Copenhagen in June 2005.
Thomas Becker Ministry of the EnvironmentDenmark
Mohammed Berdai Centre de Développement des EnergiesRenouvelables Morocco
James CameronClimate Change Capital
Paulo CyprianoEmbassy of Brazil in Germany
Michael EckhartAmerican Council on Renewable Energy
David HalesWorldwatch Institute
Rainer Hinrichs-Rahlwes Federal Ministry for the Environment,Nature Conservation and Nuclear SafetyGermany
Neil HirstEnergy Technology Collaboration DivisionInternational Energy Agency
Michael HofmannGerman Federal Ministry for EconomicCooperation and Development
Richard HosierGlobal Environment Facility
Jackie JonesDepartment for Environment, Food and Rural AffairsUnited Kingdom
Stephen KarekeziAfrican Energy Policy Research Network
Li JunfengNational Development and ReformCommission, Energy Research InstituteChinese Renewable Energy IndustriesAssociationChina
Susan McDadeEnergy Environment GroupUnited Nations Development Programme
Jennifer Morgan Climate Change Programme, WWF
Paul Mubiru Ministry of Energy and Mineral DevelopmentUganda
Rajendra PachauriThe Energy and Resource InstituteIndia
Wolfgang PalzWorld Council for Renewable Energy
Mark RadkaDivision of Technology, Industry and EconomicsUnited Nations Environment Programme
Peter RaeWorld Wind Energy Association
Artur Runge-Metzger DG Environment: Climate, Ozone and EnergyEuropean Commission
Jamal Saghir Energy and WaterThe World Bank
Steve SawyerClimate and EnergyGreenpeace
Ernst-Christoph StolperNetwork of Regional Governments for Sustainable Developmentnrg4SD
Griffin ThompsonDepartment of StateUnited States
Arthouros ZervosEuropean Renewable Energy CouncilGlobal Wind Energy Council
Ton van der ZonMinistry of Foreign Affairs, DGISNetherlands
Suggested Citation
REN21 Renewable Energy Policy Network. 2005. “Renewables 2005 Global Status Report.” Washington, DC: Worldwatch Institute.
www.ren21.net
REN21 Steering Committee

RENEWABLES 2005 GLOBAL STATUS REPORT
PAGE 2 RENEWABLES 2005 GLOBAL STATUS REPORT
Lead Author and Research Director
Eric Martinot, Worldwatch Institute and Tsinghua University
Sponsors
REN21 Renewable Energy Policy Network; German FederalMinistry for Environment, Nature Protection, and NuclearSafety; German Federal Ministry for Economic Cooperationand Development
Producer and Publisher
Worldwatch Institute and GTZ GmbH
Special Thanks
Tsinghua-BP Clean Energy Research and Education Center,Tsinghua University
Researchers and Regional Correspondents
Kyung-Jin Boo (Korean Energy Economics Institute); JohnMichael Buethe (Georgetown University); Odon de Buen(National Autonomous University of Mexico); AkankshaChaurey (The Energy and Resources Institute (TERI)); RedConstantino (Greenpeace Philippines); Jose Etcheverry(David Suzuki Foundation); Uwe Fritsche (Öko-Institut);Daniele Guidi (Ecosoluzioni); Katja Hünecke (Öko-Institut);Tetsunari Iida (Institute for Sustainable Energy Policies);Waeni Kithyoma (AFREPREN); Liu Pei (Tsinghua Univer-sity); Samuel Martin (Asian Institute of Technology); JoseRoberto Moreira (Biomass Users Network Brazil); MiquelMuñoz (Autonomous University of Barcelona); MikaObayashi (Institute for Sustainable Energy Policies); DerrickOkello (AFREPREN); Kilian Reiche (World Bank); MichaelRogol (Massachusetts Institute of Technology and CLSAAsia Pacific Markets); Ikuko Sasaki (Institute for SustainableEnergy Policies); Janet Sawin (Worldwatch Institute); KlausSchmidt (Öko-Institut); Peter Stair (Worldwatch Institute);Fabby Tumiwa (Indonesia NGOs Working Group on PowerSector Restructuring); Wang Yunbo (Tsinghua University).
Other Contributors
Thanks to the following people for contributing time, mate-rials, and/or review comments: Molly Aeck (WorldwatchInstitute); Lily Alisse (International Energy Agency); DennisAnderson (Imperial College of London); Sven Anemüller(Germanwatch); Frederic Asseline (EU-China Energy andEnvironment Programme); Robert Bailis (University of Cal-ifornia at Berkeley); Doug Barnes (World Bank); MorganBazilian (Sustainable Energy Ireland); Jeff Bell (World
Alliance for Decentralized Energy); Eldon Boes (NREL);John Byrne (University of Delaware); Anil Cabraal (WorldBank); John Christensen (UN Environment Programme);Wendy Clark (NREL); Christian de Gromard (FrenchFFEM); Nikhil Desai; Jens Drillisch (GTZ); Christine Eibs-Singer (E+Co); Chas Feinstein (World Bank); ManfredFischedick (Wuppertal Institute); Larry Flowers (NREL);Lisa Frantzis (Navigant Consulting); David Fridley (LawrenceBerkeley National Laboratory); Lew Fulton (InternationalEnergy Agency); Chandra Govindarajalu (World Bank);Chris Greacen (Palang Thai); Gu Shuhua (Tsinghua Univer-sity); Jan Hamrin (Center for Resource Solutions); MiaoHong (World Bank/GEF China Renewable Energy Project);Thomas Johansson (Lund University); Dan Kammen (Uni-versity of California at Berkeley); Stephen Karakezi(AFREPREN); Sivan Kartha (Tellus Institute); Marlis Kees(GTZ); Jong-dall Kim (Kyungpook National University);June Koch (CMT Consulting); Jean Ku (NREL); Lars Kvale(Center for Resource Solutions); Ole Langniss; Dan Lieber-man (Center for Resource Solutions); Li Hua (SenterNovem);Li Junfeng (China Renewable Energy Industries Associa-tion); John Lund (International Geothermal Associationand Oregon Institute of Technology); Subodh Mathur(World Bank); Paul Maycock (PV News); Bob McCormick(NREL); Susan McDade (UNDP); Tim Merrigan (NREL);Alan Miller (International Finance Corporation); FredMorse (Morse Associates); Wolfgang Mostert; HansjörgMüller (GTZ); Kevin O’Connor, Kathy O’Dell, and RalphOverend (NREL); Rolf Posorski (GTZ); Mark Radka(UNEP); Venkata Ramana (Winrock International); JeannieRenne (NREL); Jamal Saghir (World Bank); Oliver Schaefer(European Renewable Energy Council); Michael Schlup(BASE): Martin Schöpe (German Federal Ministry for Environment, Nature Protection and Nuclear Safety); RickSellers (International Energy Agency); Shi Pengfei with Qin Haiyan (China Wind Energy Association); Judy Siegel(Energy and Security Group); Scott Sklar (Stella Group);Brian Smith (NREL); Virginia Sonntag-O’Brien (BASE);Till Stenzel (International Energy Agency); Paul Suding(GTZ); Blair Swezey (NREL); Christof Tempe (Öko-Insti-tut); Valérie Thill (European Investment Bank); Molly Tir-pak (ICF); Dieter Uh (GTZ); Eric Usher (UN EnvironmentProgramme); Claudia von Fersen (KfW); Bill Wallace(UNDP/GEF China Renewable Energy Project); NjeriWamukonya (UNEP); Xiaodong Wang (World Bank); WangZhongying (China Energy Research Institute); Werner Weiss(AEE INTEC); Ryan Wiser (Lawrence Berkeley NationalLaboratory); Christine Woerlen (GEF); Jeremy Woods(Imperial College of London); Dana Younger (InternationalFinance Corporation); Arthouros Zervos (European Renew-able Energy Council and European Wind Energy Association).
ACKNOWLEDGMENTS
RENEWABLES 2005 GLOBAL STATUS REPORT PAGE 3
Executive Summary . . . . . . . . . . . . . . . . . . . . . 4
1. Global Market Overview . . . . . . . . . . . . . . . 6
2. Investment Flows . . . . . . . . . . . . . . . . . . . . 14
3. Industry Trends . . . . . . . . . . . . . . . . . . . . . 17
4. Policy Landscape . . . . . . . . . . . . . . . . . . . . 19Policy Targets for Renewable Energy . . . . . . . . 19Power Generation Promotion Policies . . . . . . . 20Solar Hot Water/Heating Promotion Policies . . 24Biofuels Promotion Policies . . . . . . . . . . . . . . . 25Green Power Purchasing and Utility
Green Pricing . . . . . . . . . . . . . . . . . . . . . . . . 26Municipal-Level Policies . . . . . . . . . . . . . . . . . . 27
5. Rural (Off-Grid) Renewable Energy . . . . . . 29
Glossary . . . . . . . . . . . . . . . . . . . . . . . . . . . . . 34
Notes and References . . . . . . . . . . . . . . . . . . (*)
Figures, Tables, and Sidebar
Figure 1. Renewable Energy Contribution toGlobal Primary Energy, 2004 . . . . . . . . . . . . . . 6
Figure 2. Average Annual Growth Rates ofRenewable Energy Capacity, 2000–2004 . . . . . 8
Figure 3. Solar PV, Existing World Capacity,1990–2004 . . . . . . . . . . . . . . . . . . . . . . . . . . . 8
Figure 4. Wind Power, Existing World Capacity, 1990–2004 . . . . . . . . . . . . . . . . . . . . 9
Figure 5. Renewable Power Capacities, EU,Top 5 Countries, and Developing World, 2004 . . . . . . . . . . . . . . . . . . . . . . . . . . 9
Figure 6. Wind Power Capacity, Top 10 Countries, 2004 . . . . . . . . . . . . . . . . . 10
Figure 7. Share of Existing Solar Hot Water/Heating Capacity, Selected Countries, 2004 . . 10
Figure 8. Solar Hot Water Existing per 1,000 Inhabitants . . . . . . . . . . . . . . . . . . . . . 11
Figure 9. Fuel Ethanol Production, 2000 and 2004 . . . . . . . . . . . . . . . . . . . . . . . 11
Figure 10. Annual Investment in RenewableEnergy, 1995–2004 . . . . . . . . . . . . . . . . . . . . 14
Figure 11. EU Renewable Energy Targets—Share of Electricity by 2010 . . . . . . . . . . . . . . 19
Table 1. Renewable Energy Indicators . . . . . . . 7
Table 2. Status of Renewables Technologies—Characteristics and Costs . . . . 12
Table 3. Non-EU Countries with Renewable Energy Targets . . . . . . . . . . . . . . . 20
Table 4. Renewable Energy Promotion Policies . . . . . . . . . . . . . . . . . . . . . . . . . . . . . . 21
Table 5. Cumulative Number ofCountries/States/Provinces Enacting Feed-in Policies . . . . . . . . . . . . . . . . . . . . . . . 23
Table 6. Cumulative Number ofCountries/States/Provinces Enacting RPS Policies . . . . . . . . . . . . . . . . . . . . . . . . . . 23
Table 7. Selected Major Cities with Renewable Energy Goals and/or Policies . . . . 27
Table 8. Common Existing Applications ofRenewable Energy in Rural (Off-Grid) Areas . . 30
Sidebar 1. Bonn Action Programme in International Context . . . . . . . . . . . . . . . . . 15
CONTENTS
(*) Full notes and references are available on the REN21 Web site,www.ren21.net.

PAGE 4 RENEWABLES 2005 GLOBAL STATUS REPORT
This report provides an overview of the status of renew-able energy worldwide in 2005. It covers markets, invest-ments, industries, policies, and rural (off-grid) renewableenergy in developing countries. By design, the report doesnot provide analysis, recommendations, or conclusions.An extensive research and review process over severalmonths involving more than 100 researchers and con-tributors has kept inaccuracies to a minimum. REN21sees this report as the beginning of an active exchange ofviews and information.
This report reveals some surprising facts aboutrenewable energy, many reflecting strong growthtrends and increasing significance relative to conven-tional energy.
x About $30 billion was invested in renewable energyworldwide in 2004 (excluding large hydropower), afigure that compares to conventional power sectorinvestment of roughly $150 billion. Investment inlarge hydropower was an additional $20–25 billion,mostly in developing countries.
x Renewable power capacity totals 160 gigawatts(GW) worldwide (excluding large hydropower),about 4 percent of global power sector capacity.Developing countries have 44 percent of this capac-ity, or 70 GW.
x Renewable energy generated as much electricpower worldwide in 2004 as one-fifth of the world’snuclear power plants, not counting largehydropower (which itself was 16 percent of theworld’s electricity).
x The fastest growing energy technology in the worldis grid-connected solar photovoltaic (PV), whichgrew in existing capacity by 60 percent per yearfrom 2000–2004, to cover more than 400,000rooftops in Japan, Germany, and the United States.Second is wind power capacity, which grew by 28percent per year, led by Germany, with almost 17GW installed as of 2004.
x Rooftop solar collectors provide hot water to nearly40 million households worldwide, most of these inChina, and more than 2 million geothermal heatpumps are used in 30 countries for building heat-ing and cooling. Even so, biomass-fueled heatingprovides five times more heat worldwide than solarand geothermal combined.
x Production of biofuels (ethanol and biodiesel)exceeded 33 billion liters in 2004, about 3 percentof the 1,200 billion liters of gasoline consumedglobally. Ethanol provided 44 percent of all (non-diesel) motor vehicle fuel consumed in Brazil in2004 and was being blended with 30 percent of allgasoline sold in the United States.
x There were more than 4.5 million green power consumers in Europe, the United States, Canada,Australia, and Japan in 2004, purchasing power voluntarily at the retail level or via certificates.
x Direct jobs worldwide from renewable energy man-ufacturing, operations, and maintenance exceeded1.7 million in 2004, including some 0.9 million forbiofuels production.
x Renewable energy, especially small hydropower,biomass, and solar PV, provides electric power,heat, motive power, and water pumping for tens of millions of people in rural areas of developingcountries, serving agriculture, small industry,homes, schools, and other community needs.Sixteen million households cook and light theirhomes with biogas, and two million households use solar lighting systems.
Policies to promote renewables have mushroomedover the past few years. At least 48 countries worldwidenow have some type of renewable energy promotionpolicy, including 14 developing countries. By 2005, atleast 32 countries and 5 states/provinces had adoptedfeed-in policies, more than half of which have beenenacted since 2002. At least 32 states or provinces haveenacted renewable portfolio standards (RPS), half ofthese since 2003, and six countries have enacted
EXECUTIVE SUMMARY

EXECUTIVE SUMMARY RENEWABLES 2005 GLOBAL STATUS REPORT PAGE 5
national renewable portfolio standards since 2001.Some type of direct capital investment subsidy, grant,or rebate is offered in at least 30 countries. Most U.S.states and at least 32 other countries offer a variety oftax incentives and credits for renewable energy. TheU.S. federal production tax credit has applied to morethan 5.4 GW of wind power installed since 1995.
Policy targets for renewable energy exist in at least45 countries worldwide, including 10 developingcountries, all 25 European Union (EU) countries,and many states/provinces in the United States andCanada. Most targets are for shares of electricity pro-duction, typically 5–30 percent, by the 2010–2012timeframe. There is an EU-wide target of 21 percent of electricity production by 2010. China’s target of10 percent of total power capacity by 2010 (excludinglarge hydropower) implies 60 GW of renewablescapacity by 2010, up from today’s 37 GW.
Municipalities around the world are also settingtargets for future shares of renewable energy for gov-ernment consumption or total city consumption,typically in the 10–20 percent range. Some cities haveestablished CO2-reduction targets. Many cities areenacting a variety of policies for promoting solar hotwater and solar PV, and conducting urban planningthat incorporates renewable energy.
Brazil has been the world leader in promoting bio-fuels for the past 25 years. All gasoline sold must beblended with ethanol, and all gas stations sell bothpure ethanol and ethanol blends. In addition to Brazil,mandates for blending biofuels into vehicle fuels havebeen enacted in at least 20 states/provinces worldwideand two countries (China and India).
Renewable energy has become big business. Largecommercial banks are starting to take notice, and several are “mainstreaming” renewable energy invest-ments in their lending portfolios. Other large investorsare entering the renewable energy market, includingventure capital investors and leading investment banks like Morgan Stanley and Goldman Sachs.Major investments and acquisitions have been made in recent years by leading global companies, such asGE, Siemens, Shell, BP, Sanyo, and Sharp. Five of thelargest electrical equipment and aerospace companiesin China have decided to enter the wind power busi-
ness. Combined, 60 leading publicly-traded renewableenergy companies, or renewable energy divisions ofmajor companies, have a market capitalization of atleast $25 billion.
Half a billion dollars goes to developing countrieseach year as development assistance for renewableenergy projects, training, and market support, with the German Development Finance Group (KfW), theWorld Bank Group, and the Global EnvironmentFacility (GEF) providing the majority of these funds,and dozens of other donors and programs providingthe rest.
Government support for renewable energy was onthe order of $10 billion in 2004 for the United Statesand Europe combined, including direct support (“on-budget”) and support from market-based policy mech-anisms (“off-budget”). This includes more than $700million per year in research and development spending.
The costs of many renewable energy technologiesare declining with technology improvements andeconomies of scale in production. Solar and windpower costs are now half what they were 10–15 yearsago. Many renewable technologies can compete withretail and even wholesale prices of conventional energyunder good conditions, even as conventional technol-ogy costs also decline (offset by increased fuel prices).
Market facilitation organizations (MFOs) are supporting the growth of renewable energy markets,investments, industries, and policies through somecombination of networking, information exchange,market research, training, partnering, project facilita-tion, consulting, financing, policy advice, and othertechnical assistance. A preliminary list shows at least150 such organizations around the world, includingindustry associations, non-governmental organiza-tions, multilateral and bilateral development agencies,international partnerships and networks, and govern-ment agencies.

PAGE 6 RENEWABLES 2005 GLOBAL STATUS REPORT
enewable energy supplies 17 percent ofthe world’s primary energy, countingtraditional biomass, large hydropowerand “new” renewables (small hydro,
modern biomass, wind, solar, geothermal, and bio-fuels).*† (See Figure 1.) Traditional biomass, pri-marily for cooking and heating, represents about 9 percent and is growing slowly or even decliningin some regions as biomass is used more efficientlyor replaced by more modern energy forms. Largehydropower is slightly less than 6 percent andgrowing slowly, primarily in developing countries.‡
New renewables are 2 percent and growing veryrapidly in developed countries and in some devel-oping countries. Clearly, each of these three formsof renewable energy is unique in its characteristicsand trends. This report focuses primarily on newrenewables because of their large future potential and thecritical need for market and policy support in acceleratingtheir commercial use.§[N1, N2]**
Renewable energy competes with conventional fuels in four distinct markets: power generation, hot water andspace heating, transport fuels, and rural (off-grid) energy.(See Table 1.) In power generation, renewable energy com-prises about 4 percent of power-generating capacity andsupplies about 3 percent of global electricity production(excluding large hydropower). Hot water and space heatingfor tens of millions of buildings is supplied by solar, bio-mass, and geothermal. Solar thermal collectors alone arenow used by an estimated 40 million households world-wide. Biomass and geothermal also supply heat for industry,homes, and agriculture. Biomass transport fuels make small
but growing contributions in some countries and a verylarge contribution in Brazil, where ethanol from sugar canenow supplies 44 percent of automotive (non-diesel) fuelconsumption for the entire country. In developing coun-tries, 16 million households cook and light their homesfrom biogas, displacing kerosene and other cooking fuel;more than 2 million households light their homes with solarPV; and a growing number of small industries, includingagro-processing, obtain process heat and motive powerfrom small-scale biogas digesters.††[N3]
The fastest growing energy technology in the world hasbeen grid-connected solar PV, with total existing capacityincreasing from 0.16 GW at the start of 2000 to 1.8 GW bythe end of 2004, for a 60 percent average annual growth rateduring the five-year period. (See Figures 2 and 3, page 8.)
1. GLOBAL MARKET OVERVIEW
Solar PV, off-gridGeothermal heating
EthanolSmall hydropower
Biomass powerGeothermal power
Biomass heatingLarge hydropower
0 10 20 30 40 50 60 70Percent
Figure 1. Renewable Energy Contributionto Global Primary Energy, 2004
Biofuels0.2%Power
generation1.2%
Hot water/heating0.7%
Traditionalbiomass
9.0%
Largehydro power
5.7%
New Renewables
2.0%
Figure 3. Solar PV, Existing World Capacity, 1990–2004
1990 1992 1994 1996 1998 2000 2002 2004
2,000
4,000
3,500
3,000
2,500
1,500
1,000
500
0
Meg
awat
ts
Total
Grid-connectedonly
Figure 6. Wind Power Capacity, Top 10 Countries, 2004
Meg
awat
tsG
igaw
atts
10
20
30
Figure 5. Renewable Power Capacities, EU,Top 5 Countries, and Developing World, 2004
Gig
awat
ts
50
25
100
75
175
150
125
5,000
10,000
15,000
20,000
* Unless indicated otherwise, the use of “renewable energy” in this report refers to “new” renewables. There is no universally accepted definition of renewableenergy, but referring to “new” renewables as “renewable energy” in written work is a generally accepted semantic practice. For example, BP in its annual sta-tistical review of world energy defines “renewable energy” to exclude large hydro. And the landmark International Energy Agency book Renewables for PowerGeneration (2003) also excludes large hydro. Common practice is to define large hydro as above 10 MW, although small hydro statistics in this report includeplants up to 50 MW in China and 30 MW in Brazil, as these countries define and report small hydro based on those thresholds.
† Depending on the methodology for how large hydro and other renewable power generation technologies are counted in the global energy balance, renew-ables’ total contribution to world primary energy can also be reported as 13–14 percent rather than 17 percent. The basic issue is whether to count the ener-gy value of equivalent primary energy or of the electricity; see Note 2 [N2] for further explanation.
‡ “Developing country” is not an exact term, but refers generally to a country with low per-capita income. One metric is whether it qualifies for World Bankassistance. Developing countries in this report are non-OECD countries plus OECD members Mexico and Turkey, but excluding Russia and other formerlyplanned economies in transition.
§ This report covers only renewable energy technologies that are in commercial application on a significant global scale today. Many other technologies areshowing commercial promise for the future or are already being employed in limited quantities on a commercial basis, including active solar cooling (alsocalled “solar assisted air conditioning of buildings”), concentrating solar electric power (with Fresnel lenses), ocean thermal energy conversion, tidal power,wave power, hot dry/wet rock geothermal, and cellulose-derived ethanol. Solar cookers were reportedly in use by almost one million households but data oncurrent trends were not readily available. In addition, passive solar heating and cooling is a commercially proven and widespread building design practice,but is not covered in this report. Future editions of this report could cover more of these technologies and practices.
** Notes and references for this report are designated in brackets following the paragraph to which they refer, e.g. [N1]. Full notes and references can befound on the REN21 Web site, at www.ren21.net/globalstatusreport.
†† Solar PV for off-grid includes residential, commercial, signal and communications, and consumer products. In 2004 globally, there were 70 MW used forconsumer products, 80 MW used for signal and communications, and 180 MW used for residential and commercial off-grid applications.
R

GLOBAL MARKET OVERVIEW RENEWABLES 2005 GLOBAL STATUS REPORT PAGE 7
During the same period, other renewableenergy technologies grew rapidly (annualaverage) as well: wind power 28 percent(see Figure 4, page 9), biodiesel 25 percent,solar hot water/heating 17 percent, off-gridsolar PV 17 percent, geothermal heatcapacity 13 percent, and ethanol 11 per-cent. Other renewable energy power gener-ation technologies, including biomass,geothermal, and small hydro, are moremature and growing by more traditionalrates of 2–4 percent per year. Biomass heat supply is likely growing by similaramounts, although data are not available.These growth rates compare with annualgrowth rates of fossil fuel-based electricpower capacity of typically 3–4 percent(higher in some developing countries),a 2 percent annual growth rate for largehydropower, and a 1.6 percent annualgrowth rate for nuclear capacity during the three year period 2000–2002.[N3]
Existing renewable electricity capacityworldwide totaled 160 GW in 2004, exclud-ing large hydro. (See Figure 5, page 9.)Small hydro and wind power account fortwo-thirds of this capacity. This 160 GWcompares to 3,800 GW installed capacityworldwide for all power generation. Dev-eloping countries as a group, includingChina, have 70 GW (44 percent) of the 160GW total, primarily biomass and smallhydro power. The European Union has 57GW (36 percent), a majority of which iswind power. The top five individual coun-tries are China (37 GW), Germany (20GW), the United States (20 GW), Spain (10 GW), and Japan (6 GW).[N4, N5]
Large hydropower remains one of thelowest-cost energy technologies, althoughenvironmental constraints, resettlementimpacts, and the availability of sites havelimited further growth in many countries.Large hydro supplied 16 percent of global electricity pro-duction in 2004, down from 19 percent a decade ago. Largehydro totaled about 720 GW worldwide in 2004 and hasgrown historically at slightly more than 2 percent per year(half that rate in developed countries). Norway is one ofseveral countries that obtain virtually all of their electricityfrom hydro. The top five hydropower producers in 2004were Canada (12 percent of world production), China (11.7percent), Brazil (11.4 percent), the United States (9.4 per-cent), and Russia (6.3 percent). China’s hydro growth haskept pace with its rapidly growing power sector. China
installed nearly 8 GW of large hydro in 2004 to becomenumber one in terms of installed capacity (74 GW). Otherdeveloping countries also invest significantly in large hydro,with a number of plants under construction.
Small hydropower has developed worldwide for morethan a century. More than half of the world’s small hydro-power capacity exists in China, where an ongoing boom insmall hydro construction added nearly 4 GW of capacity in2004. Other countries with active efforts include Australia,Canada, India, Nepal, and New Zealand. Small hydro isoften used in autonomous (not grid-connected) village-
Table 1. Renewable Energy Indicators
ExistingCapacity
Indicator End of 2004 Comparison Indicators
Power generation (GW)
Large hydropower 720 World electric power Small hydropower 61 capacity=3,800
Wind turbines 48Biomass power 39Geothermal power 8.9Solar PV, off-grid 2.2Solar PV, grid-connected 1.8Solar thermal power 0.4Ocean (tidal) power 0.3Total renewable power capacity(excluding large hydropower) 160
Hot water/space heating (GWth)
Biomass heating 220Solar collectors for hot water/heating (glazed) 77Geothermal direct heating 13Geothermal heat pumps 15
Households with solar hot water 40 million Total households world-Buildings with geothermal wide=1,600 millionheat pumps 2 million
Transport fuels (liters/yr)
Ethanol production 31 billion Total gasoline production=Biodiesel production 2.2 billion 1,200 billion
Rural (off-grid) energy
Household-scale biogas digesters 16 million Total households off-grid=Small-scale biomass gasifiers n/a 360 million
Household-scale solar PV systems 2 millionSolar cookers 1 million

PAGE 8 RENEWABLES 2005 GLOBAL STATUS REPORT GLOBAL MARKET OVERVIEW
power applications to replace diesel generators orother small-scale power plants or to provide elec-tricity for the first time to rural populations. In thelast few years, more emphasis has been put on theenvironmental integration of small hydro plantsinto river systems in order to minimize environ-mental impacts, incorporating new technology andoperating methods.
Wind power markets are concentrated in a fewprimary countries, with Spain, Germany, India, theUnited States, and Italy leading expansion in 2004.(See Figure 6, page 10.) Several countries are nowtaking their first steps to develop large-scale com-mercial markets, including Russia and other transi-tion countries, China, South Africa, Brazil, andMexico. In the case of China, most wind powerinvestments historically have been donor- or gov-ernment-supported, but a shift to private invest-ment has been underway in recent years. Severalother countries are at the stage of demonstratingwind farm installations, looking to develop com-mercial markets in the future.[N6]
Offshore wind power markets are just emerg-ing. About 600 MW of offshore wind exists, all inEurope. The first large-scale offshore wind farm(170 MW) was completed in 2003 in Denmark,and ambitious plans exist for over 40 GW of devel-opment in Europe, particularly in Germany, theNetherlands, and the United Kingdom.[N6]
Biomass electricity and heat production isslowly expanding in Europe, driven mainly bydevelopments in Austria, Finland, Germany, andthe United Kingdom. A boom in recent years inconverting waste wood in Germany is now levellingoff, as the resource base is mostly used. The UnitedKingdom has seen recent growth in “co-firing”(burning small shares of biomass in coal-fired powerplants). Continuing investments are occurring in Denmark,Finland, Sweden, the United States, and several other OECDcountries. The use of biomass for district heating and com-bined heat-and-power has been expanding in some coun-tries, including Austria and Germany. In Sweden, biomasssupplies more than 50 percent of district heating needs.Among developing countries, small-scale power and heatproduction from agricultural waste is common, for examplefrom rice or coconut husks. The use of sugar cane waste(bagasse) for power and heat production is significant incountries with a large sugar industry, including Brazil,Columbia, Cuba, India, the Philippines, and Thailand.Increasing numbers of small-scale biomass gasifiers arefinding application in rural areas (and there are alsodemonstrations of biomass gasification for use in high-efficiency combined-cycle power plants in developed coun-tries). Interest in bioenergy “coproduction,” in which both
energy and non-energy outputs (for example, animal feedor industrial fiber) are produced in an integrated process, isalso growing.[N6]
Like small hydro, geothermal energy has been used forelectricity generation and heat for a century. There are atleast 76 countries with geothermal heating capacity and 24 countries with geothermal electricity. More than 1 GW of geothermal power was added between 2000 and 2004,including significant increases in France, Iceland, Indonesia,Kenya, Mexico, the Philippines, and Russia. Most of thegeothermal power capacity in developed countries exists inItaly, Japan, New Zealand, and the United States.[N6]
Geothermal direct-heat utilization capacity nearly dou-bled from 2000 to 2005, an increase of 13 GWth, with atleast 13 new countries using geothermal heat for the firsttime. Iceland leads the world in direct heating, supplyingsome 85 percent of its total space-heating needs from geot-hermal. Turkey has increased its geothermal direct-heating
Figure 2. Average Annual Growth Rates of Renewable Energy Capacity, 2000–2004
Solar PV, grid-connectedWind power
BiodieselSolar hot water/heating
Solar PV, off-gridGeothermal heating
EthanolSmall hydropower
Biomass powerGeothermal power
Biomass heatingLarge hydropower
0 10 20 30 40 50 60 70Percent
Figure 1. Renewable Energy Contributionto Global Primary Energy, 2004
Biofuels0.2%Power
generation1.2%
Hot water/heating0.7%
Traditionalbiomass
9.0%
Largehydro power
5.7%
New Renewables
2.0%
Figure 3. Solar PV, Existing World Capacity, 1990–2004
1990 1992 1994 1996 1998 2000 2002 2004
2,000
4,000
3,500
3,000
2,500
1,500
1,000
500
0
Meg
awat
ts
Total
Grid-connectedonly
Figure 6. Wind Power Capacity, Top 10 Countries, 2004
Meg
awat
ts
Figure 4. Wind Power, Existing World Capacity, 1990
Gig
awat
ts
10
20
30
40
50
Figure 5. Renewable Power Capacities, EU,Top 5 Countries, and Developing World, 2004
Gig
awat
ts
50
25
100
75
175
150
125
5,000
10,000
15,000
20,000
EthanolSmall hydropower
Biomass powerGeothermal power
Biomass heatingLarge hydropower
0 10 20 30 40 50 60 70Percent
Figure 1. Renewable Energy Contributionto Global Primary Energy, 2004
Biofuels0.2%Power
generation1.2%
Hot water/heating0.7%
Traditionalbiomass
9.0%
Largehydro power
5.7%
New Renewables
2.0%
Figure 3. Solar PV, Existing World Capacity, 1990–2004
1990 1992 1994 1996 1998 2000 2002 2004
2,000
4,000
3,500
3,000
2,500
1,500
1,000
500
0
Meg
awat
ts
Total
Grid-connectedonly
Figure 6. Wind Power Capacity, Top 10 Countries, 2004
Meg
awat
tsG
igaw
atts
10
20
Figure 5. Renewable Power Capacities, EU,Top 5 Countries, and Developing World, 2004
Gig
awat
ts
50
25
100
75
175
150
125
5,000
10,000
15,000
20,000

GLOBAL MARKET OVERVIEW RENEWABLES 2005 GLOBAL STATUS REPORT PAGE 9
capacity by 50 percent since 2000, which now supplies heatequivalent to the needs of 70,000 homes. About half of theexisting geothermal heat capacity exists as geothermal heatpumps, also called ground source heat pumps. These areincreasingly used for heating and cooling buildings, withnearly 2 million heat pumps used in over 30 countries,mostly in Europe and the United States.
Grid-connected solar PV installations are concentratedin three countries: Japan, Germany, and the United States,driven by supportive policies. By 2004, more than 400,000homes in these countries had rooftop solar PV feedingpower into the grid. This market grew by about 0.7 GW in 2004, from 1.1 GW to 1.8 GW cumulative installedcapacity. Around the world, there are also a growing num-ber of commercial and public demonstrations of building-
integrated solar PV. Typical examples include asubway station (100 kW), gas station (30kW),solar PV manufacturing plant (200kW), fire station (100kW), city hall (50kW), exhibition hall (1000 kW), museum (10kW), universitybuilding (10kW), and prison (70kW).[N7]
The concentrating solar thermal power markethas remained stagnant since the early 1990s, when350 MW was constructed in California due tofavorable tax credits. Recently, commercial plansin Israel, Spain, and the United States have led aresurgence of interest, technology evolution, andpotential investment. In 2004, construction startedon a 1 MW parabolic trough in Arizona, the firstnew plant anywhere in the world since the early1990s. Spain’s market is emerging, with investorsconsidering two 50 MW projects in 2005. Somedeveloping countries, including India, Egypt,Mexico, and Morocco, have planned projects with multilateral assistance, although the status of some of these projects remains uncertain.
Solar hot water/heating technologies arebecoming widespread and contribute signifi-cantly to the hot water/heating markets in China,Europe, Israel, Turkey, and Japan. Dozens ofother countries have smaller markets. Chinaaccounts for 60 percent of total installed capacityworldwide. (See Figure 7, page 10, and Figure 8,page 11). The European Union accounts for 11percent, followed by Turkey with 9 percent andJapan with 7 percent (all figures are for glazedcollectors only). Total sales volume in 2004 inChina was 13.5 million square meters, a 26-per-cent increase in existing capacity. Vacuum tubesolar water heaters now dominate the Chinese
market, with an 88-percent share in 2003. In Japan, exist-ing solar hot capacity continues to decline, as new installa-tions fall short of retirements. In Europe, about 1.6 millionsquare meters was installed in 2004, partly offset by retire-ments of older existing systems. The 110 million squaremeters of installed collector area (77 GWth of heat produc-tion capacity) worldwide translates into almost 40 millionhouseholds worldwide now using solar hot water. This is2.5 percent of the roughly 1,600 million households thatexist worldwide.*[N8]
Space heating from solar is gaining ground in severalcountries, although the primary application remains hotwater. In Sweden and Austria, more than 50 percent of theannually-installed collector area is for combined hot waterand space heating systems. In Germany, the share of com-
70
Biofuels0.2%
2004
Figure 6. Wind Power Capacity, Top 10 Countries, 2004
Meg
awat
ts
Added in 2004
Germany
SpainUnite
d
StatesUnite
d
Kingdom
DenmarkIndia
Italy
Netherlands
JapanChina
Figure 4. Wind Power, Existing World Capacity, 1990–2004
1990 1992 1994 1996 1998 2000 2002 20040
Gig
awat
ts
0
10
20
30
40
50
Figure 5. Renewable Power Capacities, EU,Top 5 Countries, and Developing World, 2004
JapanSpainUnitedStates
GermanyChinaEU-25DevelopingWorld
World
Gig
awat
ts
0
50
25
100
75
175
150
125Solar PV (grid)GeothermalBiomassWindSmall Hydro
0
5,000
10,000
15,000
20,000
2,050
2,070
8,100
390
10880
360 200 230 250 200
* Solar hot water/heating is commonly called “Solar Heating and Cooling” to emphasize that solar cooling (solar-assisted air conditioning) is also a commer-cial technology. This report uses solar hot water/heating because hot water alone constitutes the vast majority of installed capacity. Some capacity worldwide,particularly in Europe, does serve space heating, although space heating is a small share of total heat even in combined systems. Solar cooling is not yet inwidespread commercial use but many believe its future is promising.

PAGE 10 RENEWABLES 2005 GLOBAL STATUS REPORT GLOBAL MARKET OVERVIEW
bined systems is 25–30 percent of the annualinstalled capacity. Less than 5 percent of systems inChina provide space heating in addition to hot water.
Biofuels production of 33 billion liters in 2004compares with about 1,200 billion liters annuallyof gasoline production worldwide. (See Figure 9,page 11.) Brazil has been the world’s leader (andprimary user) of fuel ethanol for more than 25years. It produced about 15 billion liters of fuelethanol in 2004, contributing slightly less than halfthe world’s total. All fueling stations in Brazil sellboth pure ethanol (E95) and gasohol, a 25-percentethanol/75-percent gasoline blend (E25). In 2004,almost as much ethanol as gasoline was used forautomobile (non-diesel) fuel in Brazil; that is,ethanol blended into gasohol or sold as pureethanol accounted for 44 percent of total automo-bile fuel sold in Brazil. Demand for ethanol fuels,compared to gasoline, was very strong in 2005. Inrecent years, significant global trade in fuel ethanolhas emerged, with Brazil being the leadingexporter. Brazil’s 2.5 billion liters of ethanolexports accounted for more than half of globaltrade in 2004.[N9]
Brazil’s transport fuels and vehicle marketshave evolved together. After a sharp decline in thesales of pure-ethanol vehicles during the 1990s,sales were climbing again in the early 2000s, due toa significant decline in ethanol prices, rising gaso-line prices, and the introduction of so-called “flexi-ble fuel” cars by automakers in Brazil. These carscan operate on either pure ethanol or ethanol/gaso-line blends. By 2003, these cars were being offeredby most auto manufacturers at comparable pricesto pure ethanol or gasohol cars. Flexible-fuel carshave been widely embraced by drivers, some out ofconcern for fuel-supply uncertainties (such as an ethanolshortage that happened in 1989 or future oil shocks). Salesincreased rapidly, and by 2005 more than half of all new carssold in Brazil were flex-fuel cars.[N10]
The United States is the world’s second-largest con-sumer and producer of fuel ethanol. The growth of the U.S. market is a relatively recent trend; ethanol productioncapacity increased from 4 billion liters per year in 1996 to 14 billion liters per year in 2004. Recent annual growth hasbeen in the 15–20 percent range. By 2005, there were nearly400 fueling stations (mostly in the upper Midwest) that soldE85, an 85-percent ethanol/15-percent gasoline blend, andmany more selling gasohol (E10). By 2005, about 3 percentof the 140 billion gallons of vehicle fuel (non-diesel) con-sumed annually in the U.S. was ethanol. In addition, 30 percent of all gasoline sold in the United States was beingblended with ethanol (E10) as a substitute oxygenator forMTBE (methyl tertiary-butyl ether), which more and more
states were requiring be discontinued. Other countries producing fuel ethanol include Australia, Canada, China,Columbia, the Dominican Republic, France, Germany,India, Jamaica, Malawi, Poland, South Africa, Spain, Swe-den, Thailand, and Zambia.[N9]
Biodiesel production grew by 50 percent in Germany in2004, bringing total world production to more than 2 bil-lion liters. Pure biodiesel (B100) in Germany enjoys a 100-percent fuel-tax exemption, and the country now has over1,500 fueling stations selling B100. Other primary biodieselproducers are France and Italy, with several other countriesproducing smaller amounts, including Austria, Belgium,the Czech Republic, Denmark, Indonesia, Malaysia, and the United States. Several countries are planning to beginbiodiesel production or to expand their existing capacity inthe coming few years.[N9]
Costs of the most common renewable energy applica-tions are shown in Table 2 (page 12). Many of these costs are
Figure 7. Share of Existing Solar Hot Water/Heating Capacity, Selected Countries, 2004
European Union 12.7%
Turkey 9.0%
Japan 7.0%
Israel 4.4.%Brazil 2.1%United States 1.8%Australia 1.4%India 0.9%South Africa 0.5%Other 1.7%
Figure 10. Annual Investment in Renewable Energy, 1995
Bill
ion
Dol
lars
Figure 1Share of Electricity by 2010
Figure 8. Solar Hot Water Existing per 1,000 Inhabitants
Israel
Cyprus
Greece
Austria
Turkey
Japan
Australia
China
Denmark
Germany
m2 /1
,000
inha
bita
nts
Figure 9. Fuel Ethanol Production, 2000 and 2004
China58.4%
0
100
200
300
400
500
600
700
800
35
Total (EU-25)
Czech RepublicUnited Kingdom
Slovak Republic
Biofuels0.2%Power
generation1.2%
Traditionalbiomass
9.0%
Renewables2.0%
Figure 3. Solar PV, Existing World Capacity, 1990–2004
1990 1992 1994 1996 1998 2000 2002 2004
2,000
4,000
3,500
3,000
2,500
,500
,000
500
0
Total
Grid-connectedonly
Figure 6. Wind Power Capacity, Top 10 Countries, 2004
Meg
awat
ts
Added in 2004
Germany
SpainUnite
d
StatesUnite
d
Kingdom
DenmarkIndia
Italy
Netherlands
JapanChina
JapanSpainUnitedStates
GermanyChinaEU-25DevelopingWorld
World
Gig
awat
ts
0
50
25
75 Small Hydro
0
5,000
10,000
15,000
20,000
2,050
2,070
8,100
390
10880
360 200 230 250 200

GLOBAL MARKET OVERVIEW RENEWABLES 2005 GLOBAL STATUS REPORT PAGE 11
still higher than conventional energy technologies. (Typicalconventional power generation costs are in the US$ 2–5
cents/kWh range for baseload power, but can beconsiderably higher for peak power and higherstill for off-grid diesel generators.*) Higher costsand other market barriers mean that most renew-ables continue to require policy support. However,economic competitiveness is not static: just asrenewables’ costs are declining, conventional tech-nology costs are declining as well (for examplewith improvements in gas turbine technology).The fundamental uncertainty about future com-petitiveness relates to future fossil fuel prices,which affect conventional power costs but not thecosts of renewables.
For the present, the International EnergyAgency has portrayed the cost-competitiveness of renewables in this way: “Except for largehydropower and combustible renewables andwaste plants, the average costs of renewable elec-tricity are not widely competitive with wholesaleelectricity prices. However, depending on thetechnology, application and site, costs are com-petitive with grid [retail] electricity or commer-cial heat production. Under best conditions—optimized system design, site and resource availability—electricity from biomass, smallhydropower, wind and geothermal plants canproduce electricity at costs ranging from 2–5cents/kWh. Some biomass applications are com-petitive as well as geothermal heat production in specific sites.” In regions where the technologyis well-established, solar water heaters are fullycompetitive with conventional water heaters,although less so in cooler climates where the solarresource is poorer and heating demand is higher.Grid-connected solar PV is not yet competitive,except in locations with extremely high retail
power rates (i.e., exceeding 20–25 cents/kWh). Ethanol inBrazil is now fully competitive with gasoline.†[N11]
Israel 4.4.%Brazil 2.1%United States 1.8%Australia 1.4%India 0.9%South Africa 0.5%Other 1.7%
1995 1996 1997 19991998 2000 2001 2002 20030
Bill
ion
Dol
lars
Figure 11. EU Renewable Energy Targets—Share of Electricity by 2010
0 20 40 60 80 1Percent
Some countries also have targets for shares of total energy by 2010:EU-25 - 12%Lithuania - 12%Poland - 7.5%Latvia - 6%Czech Rep. - 5–6%Germany - 4%
Figure 8. Solar Hot Water Existing per 1,000 Inhabitants
Israel
Cyprus
Greece
Austria
Turkey
Japan
Australia
China
Denmark
Germany
m2 /1
,000
inha
bita
nts
Figure 9. Fuel Ethanol Production, 2000 and 2004
Brazil United States China Other World0
Bill
ion
Lite
rs/Y
ear
China58.4%
0
100
200
300
400
500
600
700
800
0
5
10
15
20
25
30
35
2000 2004
5
10
15
Total (EU-25)Hungary
MaltaEstonia
LuxembourgBelgium
CyprusLithuania
PolandCzech RepublicUnited Kingdom
NetherlandsGermany
IrelandGreeceFrance
ItalyDenmark
SpainSlovak Republic
SloveniaFinland
PortugalLatvia
SwedenAustria
21.03.6 5.0 5.1 5.7 6.0 6.0 7.0 7.5 8.0 10.0 12.0 12.5 13.2 20.1 21.0 25.0 29.0 29.4 31.0 33.6 35.0
45.6 49.3 60.0 78.0
Baseline (actual)1997 Level
Target by 2010
* Unless otherwise noted, all dollar figures are in U.S. dollars.
† Cost comparisons are based on economic costs excluding external costs. Financial cost comparisons can be fairly complex, as they must take into accountpolicy support, subsidies, tax treatment, and other market conditions. Historical cost reductions are due to an array of factors beyond the scope of thisreport. As one example. Brazil’s ethanol costs have declined over more than two decades with increases in production efficiency and market growth.

PAGE 12 RENEWABLES 2005 GLOBAL STATUS REPORT GLOBAL MARKET OVERVIEW
Table 2. Status of Renewables Technologies—Characteristics and Cost
TypicalTypical Energy Costs
Technology Characteristics (cents/kWh) Cost Trends and Potential for Cost Reduction
Power Generation
Large hydro
Small hydro
On-shore wind
Off-shore wind
Biomass power
Geothermal power
Solar PV (module)
Rooftop solar PV
Solar thermal power (CSP)
Hot Water/Heating
Biomass heat
Solar hot water/heating
Geothermal heat
Biofuels
Ethanol
Biodiesel
Plant size:10 MW–18,000 MW
Plant size: 1–10 MW
Turbine size: 1–3 MWBlade diameter:60–100 m
Turbine size: 1.5–5 MWBlade diameter:70–125 m
Plant size: 1–20 MW
Plant size: 1–100 MWType: binary, single-flash, double-flash, ornatural steam
Cell type and efficiency:single-crystal: 17%,polycrystalline: 15%,thin film: 10–12%
Peak capacity: 2–5 kW
Plant size: 1–100 MWType: tower, dish, trough
Plant size: 1–20 MW
Size: 2–5 m2
Type: evacuatedtube/flat-plateService: hot water,space heating
Plant capacity:1–100 MWType: binary, single- anddouble-flash, naturalsteam, heat pumps
Feedstocks: sugar cane,sugar beets, corn, orwheat (and cellulose inthe future)
Feedstocks: soy, rape-seed, mustard seed, orwaste vegetable oils
3–4
4–7
4–6
6–10
5–12
4–7
—
20–40
12–18(trough)
1–6
2–25
0.5–5
25–30cents/litergasoline
equivalent
40–80cents/liter
dieselequivalent
Stable.
Stable.
Costs have declined by 12–18% with each doubling of global capaci-ty. Costs are now half those of 1990. Turbine size has increased from600–800 kW a decade ago. Future reductions from site optimization,improved blade/generator design, and electronics.
Market still small. Future cost reductions due to market maturity andtechnology improvement.
Stable.
Costs have declined since the 1970s. Costs for exploiting currently-economic resources could decline with improved exploration technol-ogy, cheaper drilling techniques, and better heat extraction.
Costs have declined by 20% for each doubling of installed capacity, orby about 5% per year. Costs rose in 2004 due to market factors.Future cost reductions due to materials, design, process, efficiency,and scale.
Continuing declines due to lower solar PV module costs and improve-ments in inverters and balance-of-system components.
Costs have fallen from about 44 cents/kWh for the first plants in the1980s. Future reductions due to scale and technology.
Stable.
Costs stable or moderately lower due to economies of scale, newmaterials, larger collectors, and quality improvements.
See geothermal power, above.
Declining costs in Brazil due to production efficiencies, now 25–30cents/equivalent-liter (sugar), but stable in the United States at 40–50cents (corn). Other feedstocks higher, up to 90 cents. Cost reductionsfor ethanol from cellulose are projected, from 53 cents today to 27cents post-2010; modest drops for other feedstocks.
Costs could decline to 35–70 cents/liter diesel equivalent post-2010for rapeseed and soy, and remain about 25 cents (currently) forbiodiesel from waste oil.

GLOBAL MARKET OVERVIEW RENEWABLES 2005 GLOBAL STATUS REPORT PAGE 13
Table 2. continued
TypicalTypical Energy Costs
Technology Characteristics (cents/kWh) Cost Trends and Potential for Cost Reduction
Rural (off-grid) Energy
Mini-hydro
Micro-hydro
Pico-hydro
Biogas digester
Biomass gasifier
Small wind turbine
Household wind turbine
Village-scale mini-grid
Solar home system
Note: All costs are economic costs, exclusive of subsidies and other policy incentives. Typical energy costs are under best conditions, includ-ing system design, siting, and resource availability. Some conditions can yield even lower costs, e.g. down to 2 cents/kWh for geothermaland large hydro and 3 cents/kWh for biomass power. Less-optimal conditions can yield costs substantially higher than the typical costsshown. Typical solar PV grid-connected costs are for 2,500 kWh/m2 per year, typical for most developing countries. Costs increase to 30–50cents/kWh for 1,500 kWh/m2 sites (i.e., Southern Europe) and to 50–80 cents for 1,000 kWh/m2 sites (i.e., UK).
Plant capacity:100–1,000 kW
Plant capacity: 1–100 kW
Plant capacity: 0.1–1 kW
Digester size: 6–8 m3
Size: 20–5,000 kW
Turbine size: 3–100 kW
Turbine size: 0.1–1 kW
System size:10–1,000 kWOptions: battery back-up or diesel
System size: 20–100 W
5–10
7–20
20–40
n/a
8–12
15–30
20–40
25–100
40–60
Stable.
Stable to moderately declining with efficiency improvements.
Stable to moderately declining with efficiency improvements.
Stable to moderately declining with economies of construction andservice infrastructure.
Excellent potential for cost reduction with further technology development.
Moderately declining with technology advances.
Moderately declining with technology advances.
Declining with reductions in solar and wind component costs.
Declining with reductions in solar component costs.

PAGE 14 RENEWABLES 2005 GLOBAL STATUS REPORT
n 2004, about $30 billion was investedin renewable energy capacity andinstallations. (See Figure 10.) An addi-tional $4–5 billion in new plant and
equipment was invested in 2004 by the solar PVmanufacturing industry, and at least several hun-dred million dollars was invested by the ethanolindustry in new production plants. These numberscompare to roughly $110–150 billion investedannually in power generation worldwide. Thus,renewables are now 20–25 percent of global power-sector investment. Indeed, the International EnergyAgency, in its most recent World Energy InvestmentOutlook, estimates that fully one-third of newpower generation investment in OECD countriesover the next thirty years will be renewable energy.Annual renewable energy investment has grownsteadily from about $7 billion in 1995. Investment shares in2004 were roughly $9.5 billion for wind power, $7 billion forsolar PV, $4.5 billion for small hydro power, $4 billion forsolar hot water/heating, and $5 billion for geothermal andbiomass power and heat. In addition to these investments,an estimated $20–25 billion is being invested in largehydropower annually.[N12]
Renewable energy investments now come from a highlydiverse range of public and private sources. Investmentflows are being aided by technology standardization andgrowing acceptance and familiarity by financiers at allscales, from commercial finance of hundred-million-dollarwind farms to household-scale micro-financing. One of themost recent trends is that large commercial banks are start-ing to notice renewable energy investment opportunities.Examples of large banks that are “mainstreaming” renew-able energy investments are HypoVereins Bank, Fortis,Dexia, Citigroup, ANZ Bank, Royal Bank of Canada, andTriodos Bank, all of which are very active in financingrenewable energy. Investments by traditional utility compa-nies, which historically as a group have been slow to con-sider renewables investments, are also becoming more“mainstreamed.” Examples of utilities active in renewableenergy include Electricité de France, Florida Power andLight (USA), Scottish Power, and Endesa (Spain).*
Other large investors are entering the renewable energymarket, including leading investment banks. There is agrowing belief in the mainstream investment communitythat renewable energy is a serious business opportunity. Forexample, Morgan Stanley is now investing in wind power
projects in Spain. Goldman Sachs, one of the world’s largestinvestment firms, bought Zilkha Renewable Energy, a wind-development firm currently developing 4 GW of windcapacity in the United States. GE commercial and consumerfinance arms have started financing renewable energy. Andcommercial re-insurers are developing new insurance prod-ucts targeting renewable energy.
Venture capital investors have also started to noticerenewable energy. Venture capital investments in U.S.-basedclean energy technology companies totaled almost $1 billionin 2004. In particular, solar PV saw a 100-percent com-pound annual growth in venture capital and equity invest-ment from 2001 to 2004. Venture capital is being drivenpartly by future market projections, some of which show the solar PV and wind industries growing to $40–50 billioneach sometime during 2010–2014.[N13]
Financing by public banking institutions has played an important role in stimulating private investments andindustry activity. The European Investment Bank is theleading public banking institution providing finance forrenewable energy, with finance averaging $630 million peryear during the three-year period 2002–2004 (almost all for projects in the EU). The European Investment Bankplans to double its share of energy-sector loans to renew-ables between 2002 and 2007, from 7 percent to 15 percentby 2007. The bank also plans to increase renewable power-generation lending to 50 percent of total financing for newelectricity-generation capacity in the EU by 2008–2010, upfrom the current 15 percent.[N14]
Multilateral, bilateral, and other public financing flows
2. INVESTMENT FLOWS
Figure 7. Share of Existing Solar Hot Water/Heating Capacity, Selected Countries, 2004
European Union 12.7%
Turkey 9.0%
Japan 7.0%
Israel 4.4.%Brazil 2.1%United States 1.8%Australia 1.4%India 0.9%South Africa 0.5%Other 1.7%
Figure 10. Annual Investment in Renewable Energy, 1995–2004
1995 1996 1997 19991998 2000 2001 2002 2003 20040
Bill
ion
Dol
lars
Figure 11. EU Renewable Energy Targets—Share of Electricity by 2010
0 20 40 60 80 100Percent
Some countries also have targets for shares of total energy by 2010:EU-25 - 12%Lithuania - 12%Poland - 7.5%Latvia - 6%Czech Rep. - 5–6%Germany - 4%
Figure 8. Solar Hot Water Existing per 1,000 Inhabitants
Israel
Cyprus
Greece
Austria
Turkey
Japan
Australia
China
Denmark
Germany
Figure 9. Fuel Ethanol Production, 2000 and 2004
Brazil United States China Other World0
China58.4%
2000 2004
5
10
15
20
25
30
35
Total (EU-25)Hungary
MaltaEstonia
LuxembourgBelgium
CyprusLithuania
PolandCzech RepublicUnited Kingdom
NetherlandsGermany
IrelandGreeceFrance
ItalyDenmark
SpainSlovak Republic
SloveniaFinland
PortugalLatvia
SwedenAustria
21.03.6 5.0 5.1 5.7 6.0 6.0 7.0 7.5 8.0 10.0 12.0 12.5 13.2 20.1 21.0 25.0 29.0 29.4 31.0 33.6 35.0
45.6 49.3 60.0 78.0
Baseline (actual)1997 Level
Target by 2010
* This report does not cover carbon finance or Clean Development Mechanism (CDM) projects. Subsequent editions can hopefully address these emergingfinancing vehicles. There were plans for renewable energy projects incorporating these financing vehicles in several countries, and countries were establishingadministrative rules and procedures.
I

INVESTMENT FLOWS RENEWABLES 2005 GLOBAL STATUS REPORT PAGE 15
for new renewables in developing countries have reachedalmost $500 million per year in recent years. A significantportion of these funds supports training, policy develop-ment, market facilitation, technical assistance, and othernon-investment needs. The three largest sources of fundshave been the German Development Finance Group (KfW),the World Bank Group, and the Global Environment Facil-ity (GEF). KfW approved about $180 million for renewablesin 2004, including $100 million from public budgetaryfunds and $80 million from market funds. The World BankGroup committed an average of $110 million per year tonew renewables during the three-year period 2002–2004.*The GEF allocated an average of $100 million each yearfrom 2002 to 2004 to co-finance renewable energy projectsimplemented by the World Bank, United Nations Develop-ment Programme (UNDP), United Nations EnvironmentProgramme (UNEP), and several other agencies. Indirect orassociated private-sector financing is often equal to or sev-eral times greater than the actual public finance from theseagencies, as many projects are explicitly designed to catalyzeprivate investment. In addition, recipient-country govern-ments also contribute co-financing to these developmentprojects.[N15]
Other sources of public financing include bilateral assis-tance agencies, United Nations agencies, and the contribu-tions of recipient-country governments to developmentassistance projects. Several agencies and governments areproviding aid for new renewables in the range of (typically)$5–25 million per year, including the Asian DevelopmentBank (ADB), the European Bank for Reconstruction and
Development (EBRD), the Inter-American DevelopmentBank (IDB), UNDP, UNEP, the U.N. Industrial Develop-ment Organization (UNIDO), Denmark (Danida), France(Ademe and FFEM), Germany (GTZ), Italy, Japan (JBIC),and Sweden (SIDA). Other donors contributing technicalassistance and financing on an annual basis include the U.N. Food and Agriculture Organization (FAO), Australia(AusAid), Canada (CIDA), the Netherlands (Novem),Switzerland (SDC), and the United Kingdom (DFID).Some of these donors are establishing specific-purposeinvestment funds and credit lines that combine additionalprivate financing.[N15]
These public investment flows have remained relativelyconstant over the past few years, although recent commit-ments by a number of organizations suggest the total willincrease in the coming years. In 2004, at the Renewables2004 conference in Bonn, Germany, 170 countries adoptedthe Bonn Action Programme, with many future commit-ments by governments, international organizations, andnon-governmental organizations. (See Sidebar 1.) At thesame time, the German government committed 500 millioneuros over five years to KfW for renewable energy andenergy efficiency investments in developing countries.Also in 2004, the World Bank Group committed to doublefinancing flows for new renewables and energy efficiencywithin five years, which would add another $150 million inannual financing for renewable energy. The EU, togetherwith the Johannesburg Renewable Energy Coalition (JREC),will establish a “Global Renewable Energy Fund of Funds”to provide patient equity capital, with initial financing of
SIDEBAR 1. Bonn Action Programme in International Context
An analysis of the Bonn Action Progamme adopted in 2004 gives five key metrics for the program’s content. Below, thesemetrics are compared with the existing global context. [N15b]
Metric Bonn Action Programme Content Global Context (2004)
1. Installed capacity Adds 163 GW of renewable electricity Existing global capacity of renewable energy capacity if fully implemented. was 160 GW (plus 720 GW for large hydro).
2. Investments Implies total investment of $326 billion. Global annual investment in renewable energy was $30 billion (plus $20–25 billion for large hydro).
3. CO2 emissions Implies CO2 reductions totaling 1.2 billion CO2 reduction from renewable energy was 0.9 billion tons/year by 2015. tons/year (plus 3.7 billion tons/year from large hydro).
4. Donor financing Donor funding pledged and needed totals Almost $500 million/year in donor financing flowed 16% of financing, or about $52 billion. to developing countries.
5. Access to Endorses Millennium Development Goal Tens of millions of rural homes served by small hydro, electricity in rural estimates that up to 1 billion people could 16 million using biogas, 2 million with solar home areas have access to energy services from lighting, and many others served by biomass gasifiers.
renewables by 2015.
* World Bank Group financing for new renewables plus average GEF co-financing of $45 million per year for World Bank Group projects (2002–2004) madetotal World Bank Group/GEF financing more than $155 million per year. The World Bank Group also committed an average of $170 million per year duringthe three-year period 2002–2004 to large hydropower (without GEF co-financing), bringing average annual World Bank Group/GEF financing for all renew-ables to more than $325 million.

PAGE 16 RENEWABLES 2005 GLOBAL STATUS REPORT INVESTMENT FLOWS
about 75 million euros.Local financing sources for renewable energy in devel-
oping countries, once the province of international develop-ment agencies, have also been growing. There is anincreasing emphasis by donors and market facilitators onhelping to increase these local financing sources for renew-able energy and finding ways to mitigate financing risks forprivate investors. One of the best examples is the IndiaRenewable Energy Development Agency (IREDA), whichhas provided almost $1.5 billion in financing for 2.5 GW of renewables since its inception in 1987. On the rural side,Grameen Shakti in Bangladesh, a local purveyor of creditand sales of rural solar home systems, is one of the bestknown examples. There are many others. The DevelopmentBank of Uganda is providing rural micro-loans with sup-port of the Shell Foundation. UNEP, the U.N. Foundation,and E+Co are experimenting with approaches to financingsmall- and medium-scale renewable energy enterprisesthrough the Rural Energy Enterprise Development (REED)program in Africa, Brazil, and China. Triodos Bank’s“Renewable Energy for Development Fund” provides seedcapital, loans, and business development support for renew-able energy entrepreneurs in Asia and Africa. In 2003, two ofthe largest commercial banks in India, Canara and SyndicateBanks, together with their regional associate banks, startedto provide thousands of loans for rural households to userenewable energy, offered through 2,000 participating bankbranches in two states. In general, capacity building forfinancial services for households and businesses has becomea higher priority of many agencies.
These financing flows are augmented and facilitated bythe efforts of many other industry associations, non-govern-mental organizations, international partnerships and net-works, and private foundations. These so-called “marketfacilitation organizations” number in the hundreds and areactive worldwide and locally. (See Note 45 for a listing ofwebsites.) Five examples of international partnerships arethe Global Village Energy Partnership (GVEP), the Renew-
able Energy and Energy Efficiency Partnership (REEEP), theGlobal Network on Energy for Sustainable Development(GNESD), the UNEP Sustainable Energy Finance Initiative,and the REN21 Renewable Energy Policy Network.
Government support for renewable energy was on the order of $10 billion in 2004 for the United States andEurope combined. Such support can take several forms.“On-budget” support includes such mechanisms as researchand development funding, direct investment, capital-costsubsidies, tax credits, and export credits.* Research anddevelopment is a significant part of on-budget support,averaging $730 million per year during 1999–2001 for allInternational Energy Agency countries. “Off-budget” sup-port includes the costs of market-based incentives and regu-latory mechanisms that do not materially affect governmentbudgets (for example, feed-in laws and renewables portfoliostandards). The European Environment Agency estimated atleast $0.8 billion in on-budget support and $6 billion in off-budget support for renewable energy in Europe in 2001.A large share of the off-budget support was due to feed-intariffs, with purchase obligations and competitive tenderingrepresenting other forms of off-budget support. In theUnited States, federal on-budget support for renewables was$1.1 billion in 1999, including federal ethanol tax exemp-tions of $720 million and $330 million in RD&D. By 2004,RD&D spending declined but ethanol tax exemptionsincreased to $1.7 billion, which along with the productiontax credit (perhaps another $200 million) increased totalon-budget support to over $2 billion per year. U.S. state-level policies and programs, including public benefit fundsproviding an estimated $300 million per year (off-budget),might add another $1 billion dollars or more. In compari-son with these figures, total energy subsidies/support forfossil fuels on a global basis are suggested by the UnitedNations and the International Energy Agency in the range of $150–250 billion per year, and for nuclear about $16 bil-lion per year.[N16]
* Export credits have rarely applied to renewables in the past, but this situation appears to be changing. The OECD recently decided to give special treatmentto renewable energy within the OECD Arrangement on Officially Supported Export Credits, including extending repayment terms from 12 to 15 years. Thisspecial status may help bring export credit agency terms in line with other financing going to developing country renewable energy projects, potentiallyincreasing export credit agency investment in renewables.

RENEWABLES 2005 GLOBAL STATUS REPORT PAGE 17
hese investment flows mean that renewableenergy has become big business. Worldwide, atleast 60 publicly traded renewable energy com-panies, or renewable energy divisions of major
companies, had a market capitalization greater than $40million in 2005. The estimated total market capitalizationof these companies and divisions was more than $25 billion.The next largest 100 renewable energy companies or divi-sions would add several billion dollars more of market capi-talization to this figure. Solar PV is becoming one of theworld’s fastest growing, most profitable industries. Capacityexpansion plans for 2005–2008 total several hundred mega-watts, and an estimated $5–7 billion of capital investmentwill be made in 2005.[N17]
Perhaps the best illustration of how renewable energyhas become big business is the entrance of the largest indus-try players into the wind power market, historically domi-nated by dedicated wind-turbine manufacturing companies.GE and Siemens are prominent examples of large electrical-equipment companies that have entered the wind market in recent years, both through acquisition (GE bought Enron Wind in 2003 and Siemens bought Bonus in 2004).In China, five of the largest electrical, aerospace, and powergeneration equipment companies began to develop windturbine technology in 2004. Four signed technology-trans-fer contracts with foreign companies and were planning toproduce their first prototype turbines in 2005. Such bigplayers are bringing new competencies to the market,including finance, marketing, and production scale, and are adding additional credibility to the technology.
The wind power industry produced more than 6,000wind turbines in 2004, at an average size of 1.25 MW each.The top six manufacturers are Vestas (Denmark, mergedwith NEG Micon in 2004), Gamesa (Spain), Enercon (Ger-many), GE Energy (USA), Siemens (Denmark, merged withBonus in 2004), and Suzlon (India). In China, there are two primary turbine manufacturers, Goldwind and Xi’anNordex, with market shares of 20 percent and 5 percentrespectively (75 percent of the market being imports).Global industry progress has been closely related to turbinesize, with the average installed turbine increasing from 500kW in 1995 to 1,300 kW in 2004. The U.S. and Europeanwind industries now produce turbines in the 1,000–3,000kW range, but production of 600–1,000 kW sizes is stillcommon in India and China. European manufacturers haveintroduced prototype wind turbines in the 5,000 kW range.Making larger turbines is still the number-one technologicalissue in the turbine industry. The industry has continued tomake innovations in materials, electronics, blade and gener-ator design, and site optimization, and these innovationsoffer further potential for cost reduction.[N18]
The solar PV industry celebrated its first gigawatt ofglobal cumulative production in 1999. Five years later, bythe end of 2004, cumulative production had quadrupled tomore than 4 gigawatts. Production expansion continuedaggressively around the world in 2004, and annual produc-tion exceeded 1,100 MW. Announced plans by major manu-facturers for 2005 included at least a 400 MW increase inproduction capacity and several hundred megawatts furthercapacity in the 2006–2008 period. The top three globalmanufacturers in 2004 were Sharp, Kyocera, and BP Solar(though rapid capacity expansions by many players lead tochanges in the top positions year to year).[N19]
China and other developing countries have emerged assolar PV manufacturers. Chinese module production capac-ity doubled during 2004, from 50 MW to 100 MW, and cellproduction capacity increased to 70 MW. Production capac-ity could double again in 2005 due to announced industryplans. India has 8 cell manufacturers and 14 module manu-facturers. India’s primary solar PV producer, Tata BP Solar,expanded production capacity from 8 MW in 2001 to 38MW in 2004. In the Philippines, Sun Power planned in 2004to double its cell production capacity to 50 MW. Solartronin Thailand announced plans for 20 MW cell productioncapacity by 2007. Across the whole industry, economiesfrom larger production scales, as well as design and processimprovements, promise further cost reductions.
Industries for biomass power and heat and small hydroare much more mature, localized, and diverse than those forwind and solar PV. Biomass heat and power investmentstend to be made by the same companies generating wastebiomass resources, such as timber and paper companies andsugar mills. European industry has maintained a leadingposition in the field of small hydropower manufacturing,with particular concern in recent years for upgrading andrefurbishing existing plants. Small hydro technologyimprovements are focused on exploiting low heads (lessthan 15 meters) and small capacities (less than 250 kW).China’s small hydro industry numbers at least 500 enter-prises producing hydro generators. In contrast, five largefirms dominate the international geothermal power indus-try (Ansaldo, Fuji, Mitsubishi, Ormat, and Toshiba).[N20,N21]
The global ethanol industry is centered in Brazil and theUnited States. There were more than 300 sugar mills/distill-eries producing ethanol in Brazil in 2004, and 39 new distillers were licensed in early 2005. In the United States,construction of 12 new ethanol plants was completed in2004, bringing the total to more than 80. Also in 2004, con-struction of 16 new plants was started. Several large ethanolplants will begin production in 2005 in Germany and theUnited States. Brazil’s ethanol industry has also become a
3. INDUSTRY TRENDS
T

PAGE 18 RENEWABLES 2005 GLOBAL STATUS REPORT INDUSTRY TRENDS
major ethanol exporter, accounting for about half of inter-national shipments of ethanol during 2004. There was alsoconsiderable biofuels trade (of both ethanol and biodiesel)within the EU, and several other countries planned toexpand their ethanol industries.[N22]
The sophistication of many segments of the renewable-energy industry increases year by year. For example, smallwind turbine manufacturers are offering easier set-up andhybridization options with solar and other technologies.The off-grid solar PV industry is beginning to develop stan-dardized “plug and play” packages for lanterns and full-scalehousehold systems. Some companies are innovating withpackaging hybrid systems; for example, one U.S. company is blending PV and small wind turbines on shipping con-tainers with advanced batteries and controls to offer com-plete pre-packaged systems. More sophisticated controls,performance monitoring, and communications are being
integrated into systems, allowing better energy accountingand more sophisticated billing and payment schemes.
The renewable energy industry continues to grow rap-idly. Direct jobs worldwide from renewable energy manu-facturing, operations, and maintenance exceeded 1.7 millionin 2004, including some 0.9 million for biofuels production.Indirect jobs are likely several times larger. These estimatesare preliminary, as published job estimates exist for only afew specific industries and countries. Examples of country-specific estimates include: 400,000 jobs in the Brazil ethanolindustry; 250,000 jobs in the China solar hot water indus-try; 130,000 jobs in Germany from all renewables; 75,000jobs in the European wind industry; 15,000 jobs in theEuropean solar PV industry; 12,000 jobs in the U.S. solar PVindustry; 11,000 jobs in the Nepal biogas industry; 3,400jobs in Japan from renewables; and 2,200 jobs in the EU forsmall hydro.*[N24]
* No estimates exist in the literature for total jobs from renewable energy worldwide. See Note 24 for details of the analysis used for this report, whichincludes small hydro, biomass power, wind power, geothermal power, solar PV, solar hot water, ethanol, and biodiesel, but does not include geothermal andbiomass heating.

RENEWABLES 2005 GLOBAL STATUS REPORT PAGE 19
olicies to promote renewable energyexisted in a few countries in the 1980sand early 1990s, but renewable energypolicy began to emerge in many more
countries, states, provinces, and cities during thelate 1990s and early 2000s. Many of these policieshave exerted substantial influence on the marketdevelopment reviewed in the previous section. Thissection discusses existing targets and policies topromote renewable power generation, solar hotwater/heating, and biofuels. It also discussesmunicipal-level policies and voluntary greenpower/pricing.*
It is beyond the scope of this report to providedetailed analysis of policy impacts and lessons.Nevertheless, the policy literature clearly showsthat policies have had a major impact on the speedand extent of renewable energy development,despite a myriad of design and implementationproblems. The International Energy Agencyobserved in 2004, in its milestone book on marketand policy trends in IEA countries, that significantmarket growth has always resulted from combina-tions of policies, rather than single policies, thatlongevity and predictability of policy support isimportant, that local and state/provincial authority andinvolvement are important, and that individual policymechanisms are evolving as countries gain more experi-ence. Although a wealth of experience exists for older poli-cies, the IEA suggests that it is still too soon to assess theimpacts of many policies because most have been estab-lished since 2000.
Policy Targets for Renewable Energy
Policy targets for renewable energy exist in at least 45 coun-tries worldwide. By mid-2005, at least 43 countries had anational target for renewable energy supply, including all 25 EU countries. (See Figure 11 and Table 3, page 20.) TheEU has Europe-wide targets as well: 21 percent of electricityand 12 percent of total energy by 2010. In addition to these43 countries, 18 U.S. states (and the District of Columbia)and 3 Canadian provinces have targets based on renewablesportfolio standards (although neither the United States nor
Canada has a national target). An additional 7 Canadianprovinces have planning targets. Most national targets arefor shares of electricity production, typically 5–30 percent.Electricity shares range from 1 percent to 78 percent. Othertargets are for shares of total primary energy supply, specificinstalled capacity figures, or total amounts of energy pro-duction from renewables, including heat. Most targets aimfor the 2010–2012 timeframe.[N25]
The 43 countries with national targets include 10 devel-oping countries: Brazil, China, the Dominican Republic,Egypt, India, Malaysia, Mali, the Philippines, South Africa,and Thailand. A few other developing countries are likely to announce targets in the near future. China’s target of 10percent of total power capacity by 2010 (excluding largehydropower) implies 60 GW of renewables capacity givenprojected electric-power growth. China also has targets for2020, including 10 percent of primary energy and 12.5 per-cent of power capacity, 270 million square meters of solarhot water, and 20 GW each of wind and biomass power.†
* This section is intended to be indicative of the overall landscape of policy activity. Policies listed are generally those that have been enacted by legislativebodies. Some of the policies listed may not yet be implemented, or are awaiting detailed implementing regulations. It is obviously difficult to capture everypolicy, so some policies may be unintentionally omitted or incorrectly listed. Some policies may also be discontinued or very recently enacted. Updates willbe posted to the Web-based notes for this section, which contain more policy details.
† China’s targets are present in a draft renewable energy development plan that is pending approval by the government, but were announced publicly at theRenewables 2004 conference in Bonn, Germany, in June 2004. The Chinese renewable energy law of February 2005 requires the government to publish therenewable energy development plan, including targets, by January 2006.
4. POLICY LANDSCAPE
P
Japan 7.0%
Israel 4.4.%Brazil 2.1%United States 1.8%Australia 1.4%India 0.9%South Africa 0.5%Other 1.7%
1995 1996 1997 19991998 2000 2001 2002 2003 20040
Bill
ion
Dol
lars
Figure 11. EU Renewable Energy Targets—Share of Electricity by 2010
0 20 40 60 80 100Percent
Some countries also have targets for shares of total energy by 2010:EU-25 - 12%Lithuania - 12%Poland - 7.5%Latvia - 6%Czech Rep. - 5–6%Germany - 4%
Figure 8. Solar Hot Water Existing per 1,000 Inhabitants
Israel
Cyprus
Greece
Austria
Turkey
Japan
Australia
China
Denmark
Germany
Figure 9. Fuel Ethanol Production, 2000 and 2004
Brazil United States China Other World0
China58.4%
2000 2004
5
10
15
20
25
Total (EU-25)Hungary
MaltaEstonia
LuxembourgBelgium
CyprusLithuania
PolandCzech RepublicUnited Kingdom
NetherlandsGermany
IrelandGreeceFrance
ItalyDenmark
SpainSlovak Republic
SloveniaFinland
PortugalLatvia
SwedenAustria
21.03.6 5.0 5.1 5.7 6.0 6.0 7.0 7.5 8.0 10.0 12.0 12.5 13.2 20.1 21.0 25.0 29.0 29.4 31.0 33.6 35.0
45.6 49.3 60.0 78.0
Baseline (actual)1997 Level
Target by 2010

PAGE 20 RENEWABLES 2005 GLOBAL STATUS REPORT POLICY LANDSCAPE
Thailand is targeting 8 percent of primary energy by 2011(excluding traditional biomass). India is expecting 10 per-cent of added electric power capacity, or at least 10 GW ofrenewables, by 2012.* The Philippines is targeting nearly 5GW total by 2013, or a doubling of existing capacity. SouthAfrica in 2003 set a target of 10 TWh of additional finalenergy from renewables by 2013, which would representabout 4 percent of power capacity. The Mexican legislaturewas considering in 2005 a new law on renewable energy thatwould include a national target.
Power Generation Promotion Policies
At least 48 countries—34 developed and transition coun-tries and 14 developing countries—have some type of pol-icy to promote renewable power generation. (See Table 4.)The most common existing policy is the feed-in law, whichhas been enacted in many new countries and regions inrecent years. The United States was the first country to enacta national feed-in law (PURPA), in 1978. (Several statesactively implemented PURPA but most implementation was discontinued in the 1990s.) Feed-in policies were next
adopted in Denmark, Germany, Greece, India, Italy, Spain,and Switzerland in the early 1990s. By 2005, at least 32countries and 5 states/provinces had adopted such policies,more than half of which have been enacted since 2002. (SeeTable 5, page 23.)
Among developing countries, India was the first toestablish feed-in tariffs, followed by Sri Lanka and Thailand(for small power producers only), Brazil, Indonesia, andNicaragua. Three states in India adopted new feed-in poli-cies in 2004, driven by a 2003 national law requiring newstate-level policies (the old feed-in laws during the 1990swere gradually discontinued). In the first half of 2005, feed-in policies were enacted in China, Ireland, Turkey, and theU.S. state of Washington. China’s feed-in policy was part ofa comprehensive renewable energy promotion law enactedin February 2005.[N26, N27]
Feed-in tariffs have clearly spurred innovation andincreased interest and investment, notably in Germany,Spain, and Denmark over the past several years. For exam-ple, power from eligible forms of renewable generationunder Germany’s feed-in law more than doubled between2000 and 2004, from 14 TWh to 37 TWh. In several coun-
Table 3. Non-EU Countries with Renewable Energy Targets
Country Target(s)
Australia 9.5 TWh of electricity annually by 2010.
Brazil 3.3 GW added by 2006 from wind, biomass, small hydro.
Canada 3.5% to 15% of electricity in 4 provinces; other types of targets in 6 provinces.
China 10% of electric power capacity by 2010 (expected 60 GW); 5% of primary energy by 2010 and 10%of primary energy by 2020.
Dominican Republic 500 MW wind power capacity by 2015.
Egypt 3% of electricity by 2010 and 14% by 2020.
India 10% of added electric power capacity during 2003–2012 (expected 10 GW).
Israel 2% of electricity by 2007; 5% of electricity by 2016.
Japan 1.35% of electricity by 2010, excluding geothermal and large hydro (RPS).
Korea 7% of electricity by 2010, including large hydro, and 1.3 GW of grid-connected solar PV by 2011,including 100,000 homes (0.3 GW).
Malaysia 5% of electricity by 2005.
Mali 15% of energy by 2020.
New Zealand 30 PJ of added capacity (including heat and transport fuels) by 2012.
Norway 7 TWh from heat and wind by 2010.
Philippines 4.7 GW total existing capacity by 2013.
Singapore 50,000 m2 (~35 MWth) of solar thermal systems by 2012.
South Africa 10 TWh added final energy by 2013.
Switzerland 3.5 TWh from electricity and heat by 2010.
Thailand 8% of total primary energy by 2011 (excluding traditional rural biomass).
United States 5% to 30% of electricity in 20 states (including DC).
* India’s national target is a planning or indicative target but is not backed by specific legislation.

POLICY LANDSCAPE RENEWABLES 2005 GLOBAL STATUS REPORT PAGE 21
Table 4. Renewable Energy Promotion Policies
Country
Developed and transition countries
Australia u u u uAustria u u u uBelgium u u u u uCanada (*) (*) u u u (*) u (*)Cyprus u uCzech Republic u u u u u uDenmark u u u uEstonia u uFinland u u u uFrance u u u u u u uGermany u u u u uGreece u u uHungary u u u uIreland u u u u uItaly u u u u uIsrael uJapan (*) u u u u uKorea u u uLatvia u uLithuania u u u uLuxembourg u u uMalta uNetherlands u u u u uNew Zealand u uNorway u u u uPoland u u u u uPortugal u u u uSlovak Republic u u uSlovenia uSpain u u u uSweden u u u u u u uSwitzerland uUnited Kingdom u u u uUnited States (*) (*) u u (*) (*) u (*) (*) (*)
Developing countries
Argentina u uBrazil u uCambodia uChina u u u u u uCosta Rica uGuatemala u u
Feed
-in ta
riff
Net
met
erin
g
Rene
wab
le p
ort-
folio
stan
dard
Capi
tal s
ubsid
ies,
gran
ts, o
r reb
ates
Inve
stm
ent e
xcise
,
or o
ther
tax
cred
itsSa
les t
ax, e
nerg
y ta
x,
or V
AT re
duct
ion
Trad
able
rene
wab
le
ener
gy c
ertifi
cate
sEn
ergy
pro
duct
ion
paym
ents
or t
ax c
redi
ts
Publ
ic in
vest
men
t,
loan
s, or
fina
ncin
gPu
blic
com
petit
ive
bidd
ing

PAGE 22 RENEWABLES 2005 GLOBAL STATUS REPORT POLICY LANDSCAPE
tries, feed-in policies have had the largest effect on windpower, but have also influenced biomass and small hydrodevelopment. (Most laws set a limit on maximum size ofeligible hydro, for example 5 MW in Germany.) Mostrecently, Spain’s feed-in tariff has helped new investmentplans for solar thermal power generation (decisions for two50 MW plants were expected in 2005).
Feed-in tariffs vary in design from country to country.Some policies apply only to certain technologies or maxi-mum capacity. Most policies establish different tariffs fordifferent technologies, usually related to the cost of genera-tion, for example distinguishing between off-shore and on-shore wind power. Some policies also differentiate tariffs bylocation/region, year of plant operation, and operationalseason of the year. Tariffs for a given plant may decline overtime, but typically last for 15–20 years. Some policies pro-vide a fixed tariff while others provide fixed premiumsadded to market- or cost-related tariffs (or both, as in thecase of Spain).
Renewables portfolio standard (RPS) policies areexpanding at the state/provincial level in the United States,Canada, and India. (See Table 6.) At least 32 states or
provinces have enacted RPS policies, half of these since2003. Eight new U.S. states (and the District of Columbia)enacted RPS policies in 2004–2005, bringing to 20 the num-ber of U.S. states with RPS. Likewise in India, five new statesenacted RPS policies in 2004–2005, bringing the total num-ber of states to six (the Indian 2003 Electricity Act allowsstates to set minimum shares from renewables). Canada hasthree provinces with RPS policies (and several more withplanning targets). Most of the above RPS policies requirerenewable power shares in the range of 5–20 percent, typi-cally by 2010 or 2012. Most RPS targets translate into largeexpected future investments. One study estimates that stateRPS laws currently existing in the United States wouldrequire an additional 52 GW of renewable energy by 2020,which would more than double existing U.S. renewablescapacity.*[N28]
There are also six countries with national RPS policies,all enacted since 2001. Australia’s RPS (2001) requires util-ity companies to submit a certain number of renewableenergy certificates each year (1.25 percent of generationwas required for 2004, or about 2,600 GWh total); thisrequirement will be adjusted each year to eventually lead
Table 4. continued
Country
India (*) (*) u u u u uIndonesia uMexico u uNicaragua u uPhilippines u u uSri Lanka uThailand u u u uTurkey u u
Notes: (a) Only enacted policies are included. However, for some policies shown, implementing regulations may not yet be developed oreffective, leading to lack of implementation or impacts. (b) Entries with an asterisk (*) mean that some states/provinces within these coun-tries have state/province-level policies but there is no national level policy. (c) Some policies shown may apply to other markets beside powergeneration. (d) The table omits policies known to be discontinued; for example Norway’s feed-in policy for wind discontinued in 2003,Denmark’s capital grants discontinued in 2002, and Belgium’s feed-in tariffs (Green Frank system) discontinued in 2003. (e) Several Africancountries have subsidy policies supporting modest amounts of rural solar PV, including Mali, Senegal, Tanzania, and Uganda (also micro-hydro). South Africa had a policy for subsidies to rural energy service concessions for solar PV that now appears dormant. (f) Several develop-ing countries are planning renewable energy strategies and/or are expected to enact new or additional policies in the future, includingAlgeria, Armenia, Colombia, Egypt, Guatemala, Jordan, Macedonia, Mexico, Peru, South Africa, Vietnam, and Yemen.
Feed
-in ta
riff
Net
met
erin
g
Rene
wab
le p
ort-
folio
stan
dard
Capi
tal s
ubsid
ies,
gran
ts, o
r reb
ates
Inve
stm
ent e
xcise
,
or o
ther
tax
cred
itsSa
les t
ax, e
nerg
y ta
x,
or V
AT re
duct
ion
Trad
able
rene
wab
le
ener
gy c
ertifi
cate
sEn
ergy
pro
duct
ion
paym
ents
or t
ax c
redi
ts
Publ
ic in
vest
men
t,
loan
s, or
fina
ncin
gPu
blic
com
petit
ive
bidd
ing
* RPS percentages don’t necessarily correspond to ambitiousness or level of effort required, as some states/provinces already have capacity close to their tar-gets, while others are far below their targets. Further, some RPS policies set upper limits on the size of hydro eligible to fulfill the requirement. See Note 25for a list of mandated percentages or capacity targets for individual countries.

POLICY LANDSCAPE RENEWABLES 2005 GLOBAL STATUS REPORT PAGE 23
to Australia’s national target of 9,500 GWh by 2010. TheUnited Kingdom’s RPS (2002) will lead to 10 percent by2010 and then to 15 percent by 2015, continuing to 2027.Japan’s RPS (2003) also requires a certain percentage fromutilities, which increases over time to reach 1.35 percent by
2010. Sweden’s RPS (2003)requires consumers, or electricitysuppliers on their behalf, to pur-chase a given annual percentage,which increases yearly, througheither electricity purchases orrenewable certificate purchases.(Sweden sets penalties for non-compliance at 150 percent of theaverage certificate price of theprior period.) Poland’s RPS (2004)will reach 7.5 percent by 2010.Thailand’s RPS (2004) requiresthat 5 percent of all additionalfuture generation capacity berenewables.*
There are many other forms of policy support for renewablepower generation, including directcapital investment subsidies orrebates, tax incentives and credits,sales tax and VAT exemptions,direct production payments or tax credits (i.e., per kWh), greencertificate trading, net metering,direct public investment or financ-ing, and public competitive bid-ding for specified quantities ofpower generation. (See Table 4,p. 21.) Some type of direct capitalinvestment subsidy, grant, orrebate is offered in at least 30countries. Tax incentives and credits are also common ways ofproviding financial support. MostU.S. states and at least 32 othercountries offer a variety of taxincentives and credits for renew-able energy.
Energy production paymentsor tax credits exist in several coun-tries, with the U.S. federal produc-tion tax credit most significant in this category. That credit hasapplied to more than 5,400 MW of wind power installed from 1995
to 2004. Indexed to inflation, that credit started at 1.5cents/kWh in 1994 and increased over time, through sev-eral expirations and renewals, to 1.9 cents/kWh by 2005,with expiration extended to 2007. The production taxcredit has helped to make wind power a “mainstream”
Table 5. Cumulative Number of Countries/States/Provinces Enacting Feed-in Policies
Year Cumulative Number Countries/States/Provinces Added That Year
1978 1 United States1990 2 Germany1991 3 Switzerland1992 4 Italy1993 6 Denmark, India1994 8 Spain, Greece1995 81996 81997 9 Sri Lanka1998 10 Sweden1999 13 Portugal, Norway, Slovenia2000 14 Thailand2001 16 France, Latvia2002 20 Austria, Brazil, Czech Republic, Indonesia, Lithuania2003 27 Cyprus, Estonia, Hungary, Korea, Slovak Republic,
Maharashtra (India)2004 33 Italy, Israel, Nicaragua, Prince Edward Island (Canada),
Andhra Pradesh and Madhya Pradesh (India)2005 37 Turkey, Washington (USA), Ireland, China
Note: Figure for 2005 is for first half of the year only.
Table 6. Cumulative Number of Countries/States/Provinces Enacting RPS Policies
Year Cumulative Number Countries/States/Provinces Added
1997 1 Massachusetts (USA)1998 3 Connecticut, Wisconsin (USA)1999 7 Maine, New Jersey, Texas (USA); Italy2001 12 Arizona, Hawaii, Nevada (USA); Flanders (Belgium);
Australia2002 16 California, New Mexico (USA); Wallonia (Belgium);
United Kingdom2003 20 Minnesota (USA); Japan; Sweden; Maharashtra (India)2004 34 Colorado, Maryland, New York, Pennsylvania, Rhode
Island (USA); Nova Scotia, Ontario, Prince EdwardIsland (Canada); Madhya Pradesh, Karnataka, AndhraPradesh, Orissa (India); Poland; Thailand
2005 38 District of Columbia, Montana, Delaware (USA); Gujarat (India)
* National targets from Table 3 and Figure 11 may be considered “binding,” “planning,” or “indicative” targets, but do not imply national RPS policies, whichare legal mandates on specific classes of utility companies or consumers.

PAGE 24 RENEWABLES 2005 GLOBAL STATUS REPORT POLICY LANDSCAPE
investment in the U.S. in recent years, capturing financierinterest in the sector. Other countries with productionincentives include Finland, the Netherlands, and Sweden.*
Policies to promote rooftop grid-connected solar PVexist in a few countries and utilize either capital subsidies orfeed-in tariffs, or both (along with net metering). Thesepolicies have been clearly responsible for the rapid growthof the grid-connected market in recent years. Japan’srooftop solar PV policies, which were to end in 2005, pro-vided capital subsidies which started at 50 percent in 1994but declined to around 10 percent by 2003 and 4 percent by2005. Those policies resulted in over 800 MW—more than200,000 homes. Germany, with more than 160,000 rooftopsolar homes and almost 700 MW installed, provides a guar-anteed feed-in tariff, and until 2003 also provided low-inter-est consumer loans. Continuing policies in California, otherU.S. states, and several other countries (including France,Greece, Italy, Korea, Luxembourg, the Netherlands, Portu-gal, and Spain) provide capital subsidies (typically 30–50percent) and/or favorable power purchase tariffs. Koreaexpects 300 MW by 2011 through its 100,000-rooftop pro-gram, which initially provides 70-percent capital subsidiesthat will decline over time. New solar PV rooftop programshave been announced in several countries, including Hun-gary and Thailand.[N29]
Some countries or states/provinces have establishedrenewable energy funds used to directly finance invest-ments, provide low-interest loans, or facilitate markets inother ways, for example through research, education, stan-dards, and investments in public facilities. The largest suchfunds are the so-called “public benefit funds” in 14 U.S.states. These funds, often applied to energy efficiency as wellas renewable energy, are collected from a variety of sources,with the most common being a surcharge on electricitysales. These 14 funds, all initiated between 1997 and 2001,are collecting and spending more than $300 million per yearon renewable energy. It is expected that they will collectupwards of $4 billion for renewable energy through 2012.The India Renewable Energy Development Agency (IREDA)similarly provides loans and other project financing. China’s2005 renewable energy law calls for establishing a fund, andMexico was considering a “green fund” in 2005 to financerenewable energy projects.[N30]
Net metering laws exist in at least 7 countries, 35 U.S.states, and several Canadian provinces. Four additional U.S.states had one or more electric utilities offering net meter-ing. A form of net metering is also occurring in Japan on avoluntary basis. Net metering laws are being enacted regu-larly, with six new U.S. states passing such laws in 2004.
Most recently, a 2005 U.S. federal law requires all U.S. elec-tric utilities to provide net metering within three years. Netmetering has been particularly instrumental in facilitatinggrid-connected solar PV markets in the United States andJapan.[N30]
Policies for competitive bidding of specified quantitiesof renewable generation, originally used in the United King-dom in the 1990s, now exist in at least seven other coun-tries: Canada, China, France, India, Ireland, Poland, and the United States. China bid and awarded 850 MW of windpower in 2003–2004 and planned another 450 MW of bid-ding in 2005. The province of Ontario in Canada bid 1,000MW of wind power in 2004, and other Canadian provinceswere following suit. Utilities in many countries use competi-tive bidding to meet RPS requirements.[N31]
Other policies include tradable renewable energy certifi-cates, typically used in conjunction with voluntary greenpower purchases or obligations under renewables portfoliostandards. At least 18 countries had schemes and/or marketsfor tradable certificates. Many other regulatory measures,such as building codes, administrative rules and procedures,and transmission access and pricing, also serve importantroles in promoting renewable power generation. Such regu-latory measures can be steps towards future renewableenergy markets, particularly in developing countries (Mex-ico and Turkey are examples of countries taking such regu-latory measures). Policies for power-sector restructuring,carbon taxes, fossil fuel taxes, and many others can alsoaffect the economic competitiveness of renewable energy.
Solar Hot Water/Heating Promotion Policies
The world’s largest market for solar hot water collectors isChina, with 80 percent of the global additions in 2004.China’s national goal is 65 million square meters by 2005(which was almost met in 2004) and 230 million squaremeters by 2015. With its origins in small towns and villagesin the 1980s, the market has been driven mainly by unmetdemand for hot water, economics, and systems that sell for a small fraction of prices found in developed countries.Although there are no explicit policies for promoting solarhot water in multi-storey urban buildings, building designand construction by developers has begun to incorporatesolar hot water as energy costs rise and public demandincreases, particularly during the current constructionboom. There are also government programs for technologystandards, building codes, and testing and certification cen-ters to help the industry mature.[N32]
* Energy production incentives, which offer producers a payment per unit of energy produced (i.e., kWh), may appear similar to, and even be called, feed-intariffs. The distinction is not simple, as the financing for production incentives may come from explicit utility surcharges or foregone tax revenues. The U.S.production tax credit could be considered a feed-in law under some definitions. The definition used here is that feed-in tariffs should be revenue neutral tothe government, with the difference paid implicitly by utility customers (as in the case of Germany and Spain), rather than explicitly through a special levy(as in the case of the Netherlands) or foregone tax revenue (as in the case of Finland).

POLICY LANDSCAPE RENEWABLES 2005 GLOBAL STATUS REPORT PAGE 25
Beyond China, at least 18 countries, and probably sev-eral more, provide capital grants, rebates, or investment taxcredits for solar hot water/heating investments, includingAustralia, Austria, Belgium, some Canadian provinces,Cyprus, Finland, France, Germany, Greece, Hungary, Japan,the Netherlands, New Zealand, Portugal, Spain, Sweden, theUnited Kingdom, many U.S. states, and the U.S. federal gov-ernment. Capital grants are typically 20–40 percent of sys-tem cost. Investment tax credits may allow deduction of allor part of the investment cost from tax liability. (Italy’srenewable energy certificates also apply to solar hot water,so-called “white certificates.”) Israel appears to be the onlycountry with a national-level policy mandating solar hotwater in new construction. Since 1980, most buildings inIsrael have been required to have solar hot water collectors.The technical requirements vary by size and type of build-ing. Certain industrial, medical, and high-rise buildings areexempt. The European Commission was to consider promo-tion policies for renewable heating, including solar, poten-tially leading to a new directive.
At the local level, a number of major cities around theworld have enacted ordinances requiring solar hot water innew buildings or providing incentives or subsidies for solarhot water investment. Examples are Barcelona (Spain),Oxford (UK), and Portland, Oregon (USA). Barcelona in particular has enacted one of the most far-reaching ofsuch policies. Starting in 2000, the Barcelona Solar Ther-mal Ordinance has represented a major milestone in urbanenergy policy. The ordinance requires all new buildingsabove a specific size category (292 MJ/day hot water energyconsumption) to provide at least 60 percent of theirdomestic hot water energy demand from solar thermal collectors. Swimming pool heating must be 100-percentsolar. Buildings undergoing major refurbishment are alsosubject to the ordinance. The size category means typicallythat all commercial buildings, and all residential buildingsof 16 or more households, are subject to the ordinance.Due to the ordinance, 40 percent of all new buildings nowinclude solar hot water, and per-capita installed capacity(m2/1,000 people) has leaped 15-fold, from 1.1 in 2000 to16.5 in 2004. The city’s objective is about 100,000 squaremeters installed by 2010.
Following Barcelona’s lead, other cities and towns inSpain adopted solar thermal ordinances as well, includingMadrid, Valencia, Seville, Burgos, and Pamplona. The stronginterest by municipalities prompted the Spanish Institutefor Energy Diversification and Saving (IDAE) in 2003 toelaborate a solar ordinance template, largely based on
Barcelona’s solar ordinance, which could be used by citiesand towns as a basis for their own such rules. By November2004, 34 municipalities and one region had adopted solarordinances, with additional ordinances in the pipeline for10 more regions (out of a total of 17). Results have been sig-nificant. For example, Pamplona’s solar ordinance, whichentered into force in mid-2004, caused a 50-percent increasein solar thermal collectors in one year. A nationwide solarordinance was under consideration and expected to beenacted in 2005.
Biofuels Promotion Policies
Brazil has been the world leader in promoting biofuels for 25 years under its “ProAlcool” program. Policies haveincluded blending mandates, retail distribution require-ments, production subsidies, and other measures. Since1975, Brazil has mandated that ethanol be blended with all gasoline sold. Although the required blend level isadjusted frequently, it has been in the range of 20–25 per-cent. All gas stations are required to sell gasohol (E25) andpure ethanol (E100). Tax preferences have been given tovehicles that run on pure ethanol. The recent introductionand soaring sales of so-called “flex-fuel” vehicles by severalautomakers was not driven primarily by policy, but thegovernment did extend the preferential vehicle licensingtax to cover flexible-fuel cars, beyond the original coverageof pure ethanol cars.* Brazil has more recently begun totarget increased use of biodiesel fuels, derived primarilyfrom domestically produced soybean oil. A recent law inBrazil allows blending of 2-percent biodiesel in diesel fuelssince January 2005. This percentage may be increased to 5percent or more by 2013.[N33]
In addition to Brazil, mandates for blending biofuelsinto vehicle fuels have been appearing in several other coun-tries in recent years. In particular, at least 20 states/provincesand two countries now have mandates for blending ethanoland/or biodiesel with all vehicle fuels sold. In India, the gov-ernment mandated 10-percent ethanol blending (E10) in 9out of 28 states and 4 out 7 federal territories (all sugar caneproducing areas), starting in 2003. In China, four provincesmandate E10 blending, and five additional provinces wereslated for a similar mandate in 2005.† In the United States,three states also mandate E10 blending: Hawaii (most gaso-line by 2006), Minnesota (increasing to 20 percent by 2013),and Montana. Minnesota also mandates 2-percent blendingof biodiesel (B2), a policy that other states and countries areconsidering. In Canada, the province of Ontario mandates
* This turning point, in which half of all new cars sales by 2005 were flex-fuel vehicles, was driven by the voluntary initiative of national automotive manu-facturers, lead by Volkswagen. Producing flex-fuel cars rather than separate pure-ethanol and gasohol models has allowed automakers to simplify supply andassembly chains.
† Due to poor cane crop yields during 2003–2004, India had to import ethanol in order to meet state blending targets, and has had to postpone broader targetsuntil sufficient supplies of domestic ethanol reappear on the market. Chinese provinces have also had to suspend blending mandates due to ethanol shortages.

PAGE 26 RENEWABLES 2005 GLOBAL STATUS REPORT POLICY LANDSCAPE
E5 (average) blending by 2007. National blending mandateshave appeared in Columbia (E10) and the DominicanRepublic (E15 and B2 by 2015). Thailand has a target forbiofuels as a share of total energy by 2011, for which it isconsidering E10 and B2 blending mandates. Japan is consid-ering an E5 blending mandate based on imports fromBrazil.[N33]
Tax incentives for biofuels are most prominent in theUnited States, where a number of policies have beenenacted at the state and federal levels over the past 25 years.The Energy Security Act of 1979 created a federal ethanoltax credit of up to 60 cents per gallon, proportional to theblend percentage of the fuel (e.g., 6 cents/gallon for E10).In 2004, this tax credit was extended through 2010. A taxcredit for biodiesel was also added, of about 1 cent per per-centage point of biodiesel blended (i.e., 2 cents per gallonfor B2). Several U.S. states also offer tax and other incen-tives for ethanol production and sales. Canada provides anational fuel tax exemption of 10 cents per liter, and manyprovinces offer similar or higher exemptions (up to 25cents/liter). A number of European countries provide fuelor VAT tax exemptions for biofuels, including Austria (95 percent exemption for biodiesel), France, Germany(100 percent exemption for biodiesel), Hungary, Italy (100 percent exemption for biodiesel), Spain, Sweden, andthe United Kingdom.
Several other European countries have been consideringbiofuels policies as part of efforts to achieve the EU biofuelstarget of 5.75 percent of transport fuels by 2010. An ECDirective in 2003 provided targets for each country to meetby 2005 (2 percent) and 2010 (5.75 percent). Although thetargets are voluntary, countries have had to submit plans formeeting targets, or justifications for why they won’t. SomeEU members have recently enacted biofuels promotion lawsor binding targets, including Hungary, which mandates 2percent of total energy from biofuels by 2010, and theNetherlands, with a target of 2 percent of transport fuels.
Green Power Purchasing and Utility Green Pricing
There were more than 4.5 million green power consumersin Europe, the United States, Canada, Australia, and Japan in 2004. Green power purchasing and utility green pricingprograms are growing, aided by a combination of support-ing policies, private initiatives, utility programs, and govern-ment purchases. The three main vehicles for green powerpurchases are utility green-pricing programs, competitive
retail sales by third-party producers allowed through elec-tricity deregulation (also called “green marketing”), andtradable renewable energy certificates. Community-organ-ized green power programs also exist in Japan. As marketsexpand, the price premiums for green power over conven-tional power have continued to decline. In the United States,retail green power premiums are now typically 1–3cents/kWh.[N34]
In Europe, green power purchasing and utility greenpricing have existed in some countries since the late 1990s.By 2004, there were almost 3 million green power con-sumers in the Netherlands, supported by a tax exemptionon green electricity purchases. Other countries in Europewith retail green power markets include Finland, Germany,Switzerland, and the United Kingdom. Germany’s greenpower market has grown steadily since 1998, with morethan 600,000 consumers purchasing 2,000 GWh in 2004.Eighteen European countries are members of RECS, arenewable energy certificates system founded in the late1990s to standardize and certify renewable energy certifi-cates and trading. By 2005, a cumulative total of 33,000GWh of renewable energy certificates had been issued, withnearly 13,000 GWh of certificates used for consumer pur-chases of green electricity.*
The United States has an estimated half-million greenpower consumers purchasing 4,500 GWh of power annu-ally. Green power purchasing began in earnest around1999. By 2004, at least 2 GW of additional renewableenergy capacity was built in the United States to accommo-date this market.† The federal government is the largestsingle buyer of green power, with the U.S. Air Force pur-chasing 320 GWh annually. By 2004, more than 600 utilitiesin 34 states had begun to offer green-pricing programs.Most of these offerings were voluntary, but regulationswere enacted in five states between 2001 and 2003 thatrequire utilities to offer green power products to their cus-tomers. Utility green pricing accounted for almost half ofgreen power sales in 2004.
Many large companies in the United States, from aero-space contractors to natural foods companies, are voluntar-ily buying green power products. Among these corporatebuyers are IBM, Dow, Dupont, Alcoa, Intel, HP, Interface,Johnson & Johnson, Pitney Bowes, Staples, Baxter, FedExKinkos, General Motors, and Toyota. Public and non-gov-ernmental initiatives have facilitated these buyers. The U. S.Environmental Protection Agency’s “Green Power Partner-ship” had 600 partners by 2005, purchasing 2,800 GWh ofgreen power annually. And a voluntary “Green-e” certifica-
* In the United Kingdom, the distinction between voluntary green power purchases and renewable energy obligations by utilities has been questioned.There are claims that green power voluntary purchases in the United Kingdom are not always “additional” to existing utility obligations. In Germany, morethan 50 percent of the green power market is served by hydropower plants, predominantly those put into operation well before the German electricity mar-ket was liberalized.
† Green power purchases in the United States are separate from and additional to any renewable energy mandates, for example renewables portfolio standards.

POLICY LANDSCAPE RENEWABLES 2005 GLOBAL STATUS REPORT PAGE 27
tion program has helped build credibility in the market.In Japan, there were an estimated 60,000 green power
consumer-participants by early 2005. These are utility cus-tomers who voluntarily contribute to green power throughcooperatives, community organizations, and utility pro-grams. Green power in Japan initially developed throughvoluntary community organizations. The first green powerprogram was initiated by a consumer’s cooperative union,Seikatsu Club Hokkaido. Working with the regional utility,the union collects electricity bills, along with voluntary con-tributions from its members and the general public, andinvests in renewable energy projects. Members can purchaseshares in wind power projects, thus creating the first “citi-zen-owned” wind turbines. Similar green funds have beenestablished elsewhere in Japan, and ten Japanese electricutilities now offer customers an option to contribute to agreen power fund to support wind and solar systems. As ofearly 2005, there were 57,000 customers making monthlyvoluntary contributions to their electricity bills.
Renewable energy certificate markets have also emergedin Japan. The Japan Natural Energy Company (JNEC) nowsells green power certificates to commercial and industrialcustomers, including more than 50 large Japanese companieslike Sony, Asahi, Toyota, and Hitachi. JNEC will sell certifi-cates to these companies representing a total of 60 GWh over15 years, at premiums of 2.4–3.4 cents/kWh (3–4 Yen/kWh).
Australia has over 100,000 green power consumers pur-
chasing from a variety of retailers. And green power pur-chasing is spreading to other countries. One example isChina, where twelve enterprises in Shanghai began to vol-untarily purchase green electricity from three local windfarms in 2005, the first such purchases in China. The pricepremium was high—6 cents/kWh (0.53 yuan) higher thanconventional power.
Municipal-Level Policies
Many local governments around the world are enactingtheir own renewable energy policies. Cities are settingfuture renewable energy targets and CO2 emissions-reduc-tions goals, enacting policies to support solar hot waterand/or rooftop solar PV, modifying their urban planningmethods or processes to incorporate future energy con-sumption, constructing demonstrations or pilot installa-tions, and enacting a variety of other policies andprograms. (See Table 7.)[N35]
A number of cities have decided to purchase greenpower for municipal government buildings and operations.Examples are Portland, Oregon, and Santa Monica, Califor-nia, in the United States, which purchase 100 percent oftheir power needs as green power. Other U.S. cities purchas-ing 10–20 percent of municipal government power areChicago, Los Angeles, Minneapolis, and San Diego.
Many cities are adopting future targets of 10–20 percent
Table 7. Selected Major Cities with Renewable Energy Goals and/or Policies
Renewable CO2 Policies for Policies Urban Planning,Energy Reduction for Solar for Pilots, and
City Goals Goals Hot Water Solar PV Other Policies
Adelaide, Australia u u uBarcelona, Spain u u u u uCape Town, South Africa u u uChicago, United States uDaegu, Korea u u uFreiburg, Germany u u u uGöteborg, Sweden uGwangju, Korea u u uThe Hague, Netherlands uHonolulu, United States uLinz, Austria uMinneapolis, United States u uOxford, United Kingdom u u u u uPortland, United States u u u u uQingdao, China uSan Francisco, United States uSanta Monica, United States uSapporo, Japan u uToronto, Canada uVancouver, Canada u

PAGE 28 RENEWABLES 2005 GLOBAL STATUS REPORT POLICY LANDSCAPE
of electricity from renewables for all consumers in the city,not just the municipal government. Examples are Adelaide,Australia; Cape Town, South Africa; Freiberg, Germany; andSacramento (California), United States. Targets typicallyaim for some year in the 2010–2020 timeframe. Some tar-gets are for share of total energy consumption, such asDaegu, Korea, with a target of 5 percent by 2012. Other city targets address installed capacity. Both Oxford, UnitedKingdom, and Cape Town, South Africa, are targeting 10percent of homes with solar hot water by 2010 (and solarPV as well in Oxford). Barcelona, Spain, is targeting 100,000square meters of solar hot water by 2010. Some local gov-ernments in the UK are requiring on-site renewables for allnew buildings over specific size thresholds.
Some cities have also proposed or adopted CO2 emis-sions-reduction goals, typically a 10–20 percent reductionover a baseline level (usually 1990 levels), consistent withthe form of Kyoto Protocol targets. (However, at the citylevel, such target setting is complicated by industrial pro-duction, as emissions associated with industry are not nec-essary attributable to residents of the city.) Examples areFreiburg, Germany (25 percent); Gwangju, Korea (20 per-cent); Sapporo, Japan (10 percent); Toronto, Canada (20percent for municipal government energy); and VancouverBC, Canada (6 percent). The Hague, Netherlands, plans formunicipal government consumption to be “CO2 neutral” by
2006 and for the whole city to be “CO2 neutral” in the longterm. Adelaide, Australia, plans “zero net emissions” by 2012in buildings and by 2020 in transport.
Urban planning that incorporates future clean-energyvisions is gaining hold in many cities, often with participa-tion from a variety of stakeholders. Göteborg, Sweden, is anexample of a city creating a long-term vision, through aproject called Göteborg 2050. That project is a collaborativeeffort between universities, the city government, and thecity’s energy utility. It includes research, scenario develop-ment, strategic planning, dialogue with the public, anddemonstration projects. In Japan, where renewable energypolicy has been quite active at the local level, 800 local gov-ernments have laid out future urban visions over the past 10years, with support from a national government program.These Japanese cities are creating advanced and uniquevisions taking into consideration their local characteristics,and incorporating renewable energy into their visions.
Cities worldwide are collectively organizing and partici-pating in a variety of global initiatives that support renew-able energy development at the local level, such as the Citiesfor Climate Protection campaign of ICLEI (Local Govern-ments for Sustainability), the International Solar Cities Ini-tiative, the European Solar Cities Initiative, the EuropeanGreen Cities Network, and the European Climate Alliance.

RENEWABLES 2005 GLOBAL STATUS REPORT PAGE 29
he most common applications of renewableenergy for rural (off-grid) energy services arecooking, lighting and other small electric needs,process motive power, water pumping, and
heating and cooling. These applications are described inTable 8 (page 30), which blends “first-generation” or “tradi-tional” applications and technologies (i.e., unprocessed biofuels and small-scale hydro) with “second-generation”applications and technologies (i.e., wind, solar PV, biomassgasification, and pico-scale hydro). Although much develop-ment attention has focused on second-generation technolo-gies, rural development professionals are continuallyreminding the development and renewable energy commu-nities about the continued importance of first-generationtechnologies, especially in the least-developed countries. Thissection discusses some of the rural energy applications fromTable 8 and then discusses rural electrification policy.[N36]
“Traditional” applications mean primarily burning fuelwood, agricultural and forestry wastes (residues), dung, andother unprocessed biomass fuels for home cooking andheating and other process-heating needs. Some biomass isconverted to charcoal and sold in commercial markets. Bio-mass accounts for a large share of total primary energy sup-ply in many developing countries. In 2001, this share was 49percent in Africa, 25 percent in Asia, and 18 percent in LatinAmerica. In 2000, households in sub-Saharan Africa con-sumed nearly 470 million tons of wood fuels (0.72 tons percapita) in the form of wood and charcoal. In comparison,India and China together consumed 340 million tons. Insub-Saharan Africa, wood or crop residues are the primarysource of household energy for 94 percent of rural house-holds and 41 percent of urban households. Charcoal is theprimary source of household energy for 4 percent of ruralhouseholds and 34 percent of urban households. Andkerosene is the primary source of household energy for 2percent of rural households and 13 percent of urban house-holds.[N37]
The costs and health impacts of traditional biomass use(and the corresponding benefits of improved biomass stovesand other technologies) are beyond the scope of this reportbut still highly significant. Much of the biomass fuel is col-lected outside of the commercial economy, with collectiontime being a large non-monetary expenditure, especially forwomen. Researchers Ezzati and Kammen, in a comprehen-sive literature review, state that “conservative estimates of
global mortality as a result of exposure to indoor air pollu-tion from solid fuels show that in 2000 between 1.5 millionand 2 million deaths were attributed to this risk factor,accounting for 3–4 percent of total mortalityworldwide.”[N37]
Cooking: Improved Biomass Cook Stoves
Improved biomass stoves save from 10–50 percent of bio-mass consumption for the same cooking service providedand can dramatically improve indoor air quality. Improvedstoves have been produced and commercialized to thelargest extent in China and India, where governments havepromoted their use, and in Kenya, where a large commercialmarket developed. There are 220 million improved stovesnow in use around the world, due to a variety of public programs and successful private markets over the past twodecades. This number compares with the roughly 570 mil-lion households worldwide that depend on traditional bio-mass as their primary cooking fuel. China’s 180 millionexisting improved stoves now represent about 95 percent of such households. India’s 34 million improved stoves rep-resent about 25 percent of such households.*[N38]
In Africa, research, dissemination, and commercializa-tion efforts over the past few decades have brought a rangeof improved charcoal—and now wood-burning—stovesinto use. Many of these stove designs, as well as the pro-grams and policies that have supported their commercial-ization, have been highly successful. There are now 5 millionimproved stoves in use. In Kenya, the Ceramic Jikko stove(KCJ) is found in more than half of all urban homes androughly 16–20 percent of rural homes. About one-third ofAfrican countries have programs for improved biomasscook-stoves, although there are few specific policies in place.Non-governmental organizations and small enterprises con-tinue to promote and market stoves as well.
Cooking and Lighting: Biogas Digesters
An estimated 16 million households worldwide receiveenergy for lighting and cooking from biogas produced inhousehold-scale plants (called anaerobic digesters). Thisincludes 12 million households in China, 3.7 million house-holds in India, and 140,000 households in Nepal. In addi-tion to providing energy for cooking and lighting, biogas
5. RURAL (OFF-GRID) RENEWABLE ENERGY
T
* Improved biomass cook stoves are more properly considered a fuel-efficiency technology rather than a renewable energy production technology.Nevertheless, they are clearly a form of rural renewable energy use, one with enormous scope and consequences of use. Policies and programs to promoteefficient stoves are therefore not renewable energy “promotion” policies, as is typical with other renewables covered in this report, but rather are designed toimprove the health, economic, and resource impacts of an existing renewable energy use (and thus closely linked to sustainable forestry and land manage-ment). The number of existing and operating improved stoves may be significantly less than reported figures given here; for example, in India some esti-mates say a majority of stoves have passed their useful lifetimes and no longer operate.

PAGE 30 RENEWABLES 2005 GLOBAL STATUS REPORT RURAL (OFF-GRID) RENEWABLE ENERGY
has improved the livelihood of rural households in indirectways. For example, analysis of the benefits of biogas inNepal shows a reduction of workload for women and girlsof 3 hours/day per household, annual savings of kerosene of 25 liters/household, and annual savings of fuel wood,agricultural waste, and dung of 3 tons/household.[N39]
In China, household-scale biogas for rural home light-ing and cooking is a widespread application. A typicaldigester, sized 6–8 cubic meters, produces 300 cubic metersof biogas per year and costs 1,500–2,000 RMB ($200–250),depending on the province. Because digesters are a simpletechnology, there is no need for advanced expertise, andthey can be supplied by local small companies. Farmers,after receiving proper training, can build and operate thedigesters themselves. A new government program, started in 2002, provides 1 billion RMB annually as subsidies tofarmers who build their own digester. The subsidy is 800RMB per digester. Some estimate that more than 1 millionbiogas digesters are being produced each year. Beyondhousehold scale, a few thousand medium and large-scaleindustrial biogas plants were operating in China, with arecent national biogas action plan expected to expand thenumbers of such plants.
In India, the Ministry of Non-conventional EnergySources has been promoting household-scale biogas plantssince the early 1980s. The ministry provides subsidies andfinancing for constructing and maintaining biogas plants,training, public awareness, technical centers, and support to
local implementing agencies. The well-known Khadi andVillage Industries commission also supports biogas plants.
In Nepal, the SNV/Biogas Support Programme has pro-vided technological innovation, financing, engineering, andmarket development for household-scale biogas plants(sized 4–20 cubic meters, with the most popular being 6cubic meters). During the program, 60 private biogas com-panies increased their technical and market capabilities, 100micro-credit organizations provided loans, quality standardswere adopted, and a permanent market facilitation organiza-tion, Biogas Sector Partnership/Nepal, has been created.
Electricity, Heat, and Motive Power: Biomass Gasification
Small-scale thermal biomass gasification is a growing com-mercial technology in some developing countries, notablyChina and India. Gas from a gasifier can be burned directlyfor heat or used in gas turbines or gas engines for electricityand/or motive power. In a few Chinese provinces, biogasfrom thermal gasifiers also provides cooking fuel throughpiped distribution networks. The total installed capacity ofgasifiers in India was estimated at 35 MW in 2002, and tenmanufacturers are selling small-scale gasifiers together withengines up to 300 kW. In the Philippines, gasifiers have beencoupled to dual-fuel diesel engines and used for rice-millingand irrigation since the 1980s. Gasifiers have also beendemonstrated in Indonesia, Thailand, and Sri Lanka.[N40]
Table 8. Common Existing Applications of Renewable Energy in Rural (Off-Grid) Areas
Energy Services Renewable Energy Applications Conventional Alternatives
Cooking (homes, commer-cial stoves and ovens)
Lighting and other small electric needs (homes, schools, street lighting, telecom, hand tools, vaccine storage)
Process motive power (small industry)
Water pumping (agriculture and drinking)
Heating and cooling (crop drying and other agricultural processing, hot water)
• biomass direct combustion (fuel wood, crop wastes, forest wastes, dung, charcoal, and other forms)
• biogas from household-scale digester• solar cookers
• hydropower (pico-scale, micro-scale, small-scale)• biogas from household-scale digester• small-scale biomass gasifier with gas engine• village-scale mini-grids and solar/wind hybrid systems • solar home systems
• small hydro with electric motor• biomass power generation and electric motor• biomass gasification with gas engine
• mechanical wind pumps• solar PV pumps
• biomass direct combustion• biogas from small- and medium-scale digesters• solar crop dryers• solar water heaters• ice making for food preservation
LPG, kerosene
candles, kerosene, batteries,central battery recharging,diesel generators
diesel engines and generators
diesel pumps
LPG, kerosene, diesel generators
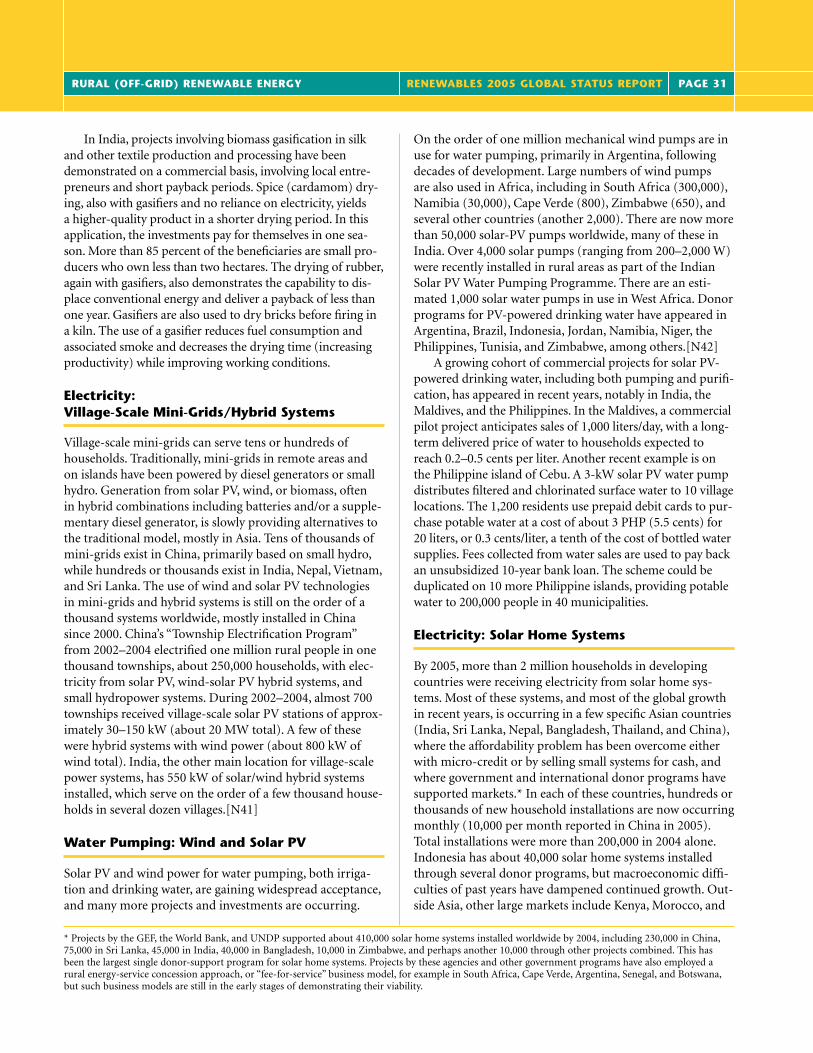
RURAL (OFF-GRID) RENEWABLE ENERGY RENEWABLES 2005 GLOBAL STATUS REPORT PAGE 31
In India, projects involving biomass gasification in silkand other textile production and processing have beendemonstrated on a commercial basis, involving local entre-preneurs and short payback periods. Spice (cardamom) dry-ing, also with gasifiers and no reliance on electricity, yields a higher-quality product in a shorter drying period. In thisapplication, the investments pay for themselves in one sea-son. More than 85 percent of the beneficiaries are small pro-ducers who own less than two hectares. The drying of rubber,again with gasifiers, also demonstrates the capability to dis-place conventional energy and deliver a payback of less thanone year. Gasifiers are also used to dry bricks before firing ina kiln. The use of a gasifier reduces fuel consumption andassociated smoke and decreases the drying time (increasingproductivity) while improving working conditions.
Electricity: Village-Scale Mini-Grids/Hybrid Systems
Village-scale mini-grids can serve tens or hundreds ofhouseholds. Traditionally, mini-grids in remote areas andon islands have been powered by diesel generators or smallhydro. Generation from solar PV, wind, or biomass, often in hybrid combinations including batteries and/or a supple-mentary diesel generator, is slowly providing alternatives tothe traditional model, mostly in Asia. Tens of thousands ofmini-grids exist in China, primarily based on small hydro,while hundreds or thousands exist in India, Nepal, Vietnam,and Sri Lanka. The use of wind and solar PV technologies in mini-grids and hybrid systems is still on the order of athousand systems worldwide, mostly installed in Chinasince 2000. China’s “Township Electrification Program”from 2002–2004 electrified one million rural people in onethousand townships, about 250,000 households, with elec-tricity from solar PV, wind-solar PV hybrid systems, andsmall hydropower systems. During 2002–2004, almost 700townships received village-scale solar PV stations of approx-imately 30–150 kW (about 20 MW total). A few of thesewere hybrid systems with wind power (about 800 kW ofwind total). India, the other main location for village-scalepower systems, has 550 kW of solar/wind hybrid systemsinstalled, which serve on the order of a few thousand house-holds in several dozen villages.[N41]
Water Pumping: Wind and Solar PV
Solar PV and wind power for water pumping, both irriga-tion and drinking water, are gaining widespread acceptance,and many more projects and investments are occurring.
On the order of one million mechanical wind pumps are in use for water pumping, primarily in Argentina, followingdecades of development. Large numbers of wind pumps are also used in Africa, including in South Africa (300,000),Namibia (30,000), Cape Verde (800), Zimbabwe (650), andseveral other countries (another 2,000). There are now morethan 50,000 solar-PV pumps worldwide, many of these inIndia. Over 4,000 solar pumps (ranging from 200–2,000 W)were recently installed in rural areas as part of the IndianSolar PV Water Pumping Programme. There are an esti-mated 1,000 solar water pumps in use in West Africa. Donorprograms for PV-powered drinking water have appeared inArgentina, Brazil, Indonesia, Jordan, Namibia, Niger, thePhilippines, Tunisia, and Zimbabwe, among others.[N42]
A growing cohort of commercial projects for solar PV-powered drinking water, including both pumping and purifi-cation, has appeared in recent years, notably in India, theMaldives, and the Philippines. In the Maldives, a commercialpilot project anticipates sales of 1,000 liters/day, with a long-term delivered price of water to households expected toreach 0.2–0.5 cents per liter. Another recent example is onthe Philippine island of Cebu. A 3-kW solar PV water pumpdistributes filtered and chlorinated surface water to 10 villagelocations. The 1,200 residents use prepaid debit cards to pur-chase potable water at a cost of about 3 PHP (5.5 cents) for20 liters, or 0.3 cents/liter, a tenth of the cost of bottled watersupplies. Fees collected from water sales are used to pay backan unsubsidized 10-year bank loan. The scheme could beduplicated on 10 more Philippine islands, providing potablewater to 200,000 people in 40 municipalities.
Electricity: Solar Home Systems
By 2005, more than 2 million households in developingcountries were receiving electricity from solar home sys-tems. Most of these systems, and most of the global growthin recent years, is occurring in a few specific Asian countries(India, Sri Lanka, Nepal, Bangladesh, Thailand, and China),where the affordability problem has been overcome eitherwith micro-credit or by selling small systems for cash, andwhere government and international donor programs havesupported markets.* In each of these countries, hundreds orthousands of new household installations are now occurringmonthly (10,000 per month reported in China in 2005).Total installations were more than 200,000 in 2004 alone.Indonesia has about 40,000 solar home systems installedthrough several donor programs, but macroeconomic diffi-culties of past years have dampened continued growth. Out-side Asia, other large markets include Kenya, Morocco, and
* Projects by the GEF, the World Bank, and UNDP supported about 410,000 solar home systems installed worldwide by 2004, including 230,000 in China,75,000 in Sri Lanka, 45,000 in India, 40,000 in Bangladesh, 10,000 in Zimbabwe, and perhaps another 10,000 through other projects combined. This hasbeen the largest single donor-support program for solar home systems. Projects by these agencies and other government programs have also employed arural energy-service concession approach, or “fee-for-service” business model, for example in South Africa, Cape Verde, Argentina, Senegal, and Botswana,but such business models are still in the early stages of demonstrating their viability.

PAGE 32 RENEWABLES 2005 GLOBAL STATUS REPORT RURAL (OFF-GRID) RENEWABLE ENERGY
Mexico. The plans of a number of Latin American countriesmay shift solar home system growth towards that region ifpromising approaches to affordability, including govern-ment subsidies and/or fee-for-service models, continue tobe followed.*[N43]
Africa, with its very low rural-electrification rates andlow per-capita income, has not seen significant growth insolar home systems, with the exception of a few countries.Kenya has 150,000 solar home systems, almost half of theinstalled base in Africa, and continuing market growth.Growth has been driven by cash sales of small modules tohouseholds in rural and peri-urban areas. Morocco is tar-geting 150,000 solar home systems by 2010. Uganda has amajor 10-year program that targets solar home systems andother productive uses in education and health care. SouthAfrica has been planning for several years to provide solarhome systems to 200,000 rural households through “fee-for-service” concessions operated by private firms. Other coun-tries like Mali, Tanzania, and Senegal are providing limitedsubsidies for rural renewables like solar home systems. Ingeneral, however, earlier expectations that millions ofhomes would obtain solar home systems in Africa havefailed to materialize. Affordability is still a critical issue, asthe cost of a typical low-end solar home system is high rela-tive to average incomes in most African countries.
Solar home systems sales by private dealers have been thecornerstone of markets in five countries: China, Sri Lanka,India, Bangladesh, and Kenya. In China and Kenya, systemsare almost exclusively sold for cash. In India, Sri Lanka, andBangladesh, credit sales have improved affordability and fostered markets. Significant innovation is occurring withNGO-based microfinance, dealer-supplied credit, and con-sumer credit through commercial banks. In India, along with many cash purchases, credit for solar home systemspurchases is now offered through more than 2,000 ruralbank branches as part of a commercial solar loan program.Indeed, the estimated 120,000 solar home systems sold oncredit in India, Sri Lanka, and Bangladesh during the pastfive years represents virtually the entire stock of credit-basedinstallations worldwide. Kenya also has a very active privatemarket, with more than 20 major PV import and manufac-turing companies, and hundreds of rural vendors and urbandistributors, many of which sell a range of brands.
Other Productive Uses of Heat and Electricity
Productive uses of heat and electricity for small-scale indus-try, agriculture, telecommunications, health, and educationin rural areas are a growing area of attention for applying
modern renewable energy technologies. Examples of indus-trial applications include silk production, brick making,rubber drying, handicraft production, sewing, welding, andwood working. Examples of agricultural and food process-ing applications include irrigation, food drying, grain mills,stoves and ovens, ice making, livestock fences, and milkchilling. Health applications include vaccine refrigerationand lighting. Communication applications include villagecinema, telephone, computers, and broadcast radio. Othercommunity applications include school and street lighting,and drinking water purification. Despite this diversity of potential applications, existing projects are still smalldemonstrations. For the most part, large-scale developmentof these applications on sustainable or commercially replic-able terms has yet to occur.
Even as applications of renewable electricity for lighting,water pumping, medical refrigeration, and motive power are beginning to receive greater attention, application ofmodern renewables to heating needs is still much less dis-cussed or practiced. Traditional biomass fuels are used toproduce heat and heat-related services such as cooking,space heating, crop drying, roasting, agricultural processing,kilns, ovens, and commercial food-processing. Applicationsof solar heating and advanced biomass technologies are justbeginning to attract the attention of the development com-munity. Developing-country governments are focusingmore on these areas as well. For example, the Indian govern-ment has launched comprehensive programs promotingbiomass for electricity, heat, and motive power in ruralareas, including combustion, co-generation, and gasifica-tion. These rural energy programs target all forms of house-hold, community, and productive needs in hundreds ofrural districts.
A good example of applications in health and educationis the World Bank/GEF Uganda Energy for Rural Transfor-mation project. The project is providing energy for medicalequipment, staff quarters, lighting, cold chain, sterilizing,and telecom, and demonstrating to the Ministry of Healththe viability of such applications. For education, solar PVwill power equipment for vocational training, lighting fornight classes, and staff housing. Other applications includewater pumping and small enterprises. Mexico’s “telesecun-daria” program is another good example. This program isdesigned to enhance rural schools through distance educa-tion programs, and many remote schools rely on solar PV to power communications and other equipment for dis-tance learning. In Guatemala, Honduras, and Bolivia, a new model for “telecenters” is emerging, combining public-service centers with for-profit telephone services.
Approaches to financing small and medium-scale enter-
* Solar home system totals include more than half a million households in India and other countries with “solar lanterns” in addition to fixed household-scale systems. Compact fluorescent lights are commonly used with solar home systems, but there is growing interest in low-wattage LEDs and cold-cathodefluorescent lamps for low-cost solar lanterns and solar home systems requiring less solar-PV capacity.

RURAL (OFF-GRID) RENEWABLE ENERGY RENEWABLES 2005 GLOBAL STATUS REPORT PAGE 33
prises engaged in renewable energy-related productive busi-ness have gained considerable attention in recent yearsthrough programs like the UNEP/UN Foundation “ruralenergy enterprise development” (REED) program in Africa,Brazil, and China and other finance initiatives. These enter-prises are providing a variety of services and products,including solar home systems, water pumping, solar cropdrying, biofuels-powered engines for grinding and milling,solar bakeries, biomass briquettes and pellets, and otherincome-generating uses. The number of such enterprises is growing in rural areas, led by both donor programs andgreater access to commercial bank credit.
Rural Electrification Policies and Programs
National rural electrification policies and programs,together with international donor programs, have employedrenewable energy as an adjunct to “access” strategies. Thatis, serving increasing percentages of rural populations whodon’t have access to central electric power networks. An esti-mated 360 million households worldwide still lack suchaccess. The main electrification options include power gridextension, diesel generators connected in mini-grids, renew-able energy connected in mini-grids (solar, wind, and/orbiomass gasification, sometimes combined with diesel), andhousehold-scale renewable energy (solar home systems andsmall wind turbines). Often the cost of traditional gridextension is prohibitive; in Kenya, for example, the averagecost of a new connection for a rural home is seven times the national per-capita income.[N44]
Interest in using renewable energy technologies to pro-vide electricity to rural and remote areas as a cost-effectivealternative to grid extension is gathering momentum inmany developing countries. At the same time, there is agrowing recognition that private investment alone is insuffi-cient, and that public subsidies and policies play a key role,justified by development goals and public mandates for uni-versal electricity access. “All our client countries in LatinAmerica have told us that they have realized that they needsubsidies and regulatory measures for reaching the ‘last 20percent’ of their rural unelectrified populations, includingwith renewable energy,” said a World Bank project manager.
Rural electrification programs in several countries, par-ticularly in Latin America, are explicitly incorporating large-
scale investment in solar home systems for some of thehomes to be electrified. Governments are recognizing geo-graphic rural areas that are non-viable for grid-extension,and enacting explicit policies and subsidies for renewablesin these areas to supplement line-extension electrificationprograms. For example, Brazil plans to electrify 2.5 millionhouseholds by 2008 under the “Luz para Todos” program(about 700,000 have already been electrified), and has tar-geted 200,000, or about 10 percent of these households forrenewable energy. As mentioned before, China’s “TownshipElectrification Program,” which was substantially completedduring 2004, provided power to 1 million people in ruralareas with renewable energy. The Indian government’s“Remote Village Electrification Programme” has identified18,000 villages for electrification, partly with renewableenergy technologies like biomass gasifiers.
Several other Latin American countries have recentlylaunched or revamped new rural electrification programs,including Bolivia, Chile, Guatemala, Mexico, Nicaragua,and Peru. Most of these countries have launched efforts to“mainstream” renewable energy as a standard option of newrural electrification efforts. For example, Chile has recentlyrecognized renewables as a key technology as it enters a sec-ond phase of a national rural electrification program. Giventhis planned scale-up of renewables for rural electrification,regulators and utilities have realized that legal and regula-tory frameworks need to be adopted quickly. Indeed, newlaws or regulations appeared during 2004 and 2005 inArgentina, Bolivia, Brazil, Chile, Guatemala, and Nicaragua.
Asian examples of countries with explicit mandates forrenewable energy for rural electrification include Bangla-desh, China, India, Nepal, the Philippines, Sri Lanka, Thai-land, and Vietnam. Some of these countries are financingprograms with multilateral assistance, as well as conduct-ing other technical assistance and support measures. ThePhilippines launched a strategy in 1999 to achieve fullrural village electrification by 2007, including renewableenergy explicitly in that strategy. Sri Lanka is targeting 85percent of the population with access to electricity and hasstarted to directly subsidize rural solar home systems.Thailand decided in 2003 to electrify the remaining300,000 off-grid households in the country with solarhome systems by the end of 2005, and accomplishedalmost half of that goal in 2004.

PAGE 34 RENEWABLES 2005 GLOBAL STATUS REPORT GLOSSARY
Biodiesel. A vehicle fuel for diesel-powered cars, trucks,buses, and other vehicles. Biodiesel is produced from oilseedcrops such as soy, rapeseed (canola), and mustard, or fromother vegetable oil sources such as waste cooking oil.
Biogas digester. Converts animal and plant wastes into gas usable for lighting, cooking, heating, and electricity generation.
Biomass power and heat. Power and/or heat generationfrom solid biomass, which includes forest product wastes,agricultural residues and waste, energy crops, and theorganic component of municipal solid waste and industrialwaste. Also includes power and process heat from biogas.
Capital subsidies or consumer grants. One-time paymentsby the government or utility to cover a percentage of thecapital cost of an investment, such as a solar hot water sys-tem or rooftop solar PV system.
Ethanol. A vehicle fuel made from biomass (typically corn,sugar cane, or wheat) that can replace ordinary gasoline inmodest percentages (see “gasohol”) or be used in pure formin specially modified vehicles.
Feed-in tariff. A policy that sets a fixed price at whichpower producers can sell renewable power into the electricpower network. Some policies provide a fixed tariff whileothers provide fixed premiums added to market- or cost-related tariffs. Some provide both.
Gasohol. A blend of gasoline and ethanol, typically 10–25percent ethanol (called E10, E25, etc.).
Geothermal power and heat. Heat energy emitted fromwithin the Earth, usually in the form of hot water or steam,which can be used to produce electricity or direct heat forbuildings, industry, and agriculture.
Gigawatt (GW)/Gigawatt-hour (GWh)/Gigawatt-thermal(GWth). See megawatt, kilowatt-hour, megawatt-thermal.
Green power purchasing. Voluntary purchases of greenpower by residential, commercial, government, or industrialcustomers, from utility companies (see “utility green pric-ing”), from a third-party renewable energy generator (alsocalled “green marketing”), or with “renewable energy certifi-cates.” With utility green pricing or competitive sales, a cus-tomer’s electricity demand is matched by an equivalentamount of renewable energy generation feeding into thepower grid. Green certificates allow the renewable energyproduction to be located anywhere.
Investment tax credit. Allows investments in renewableenergy to be fully or partially deducted from tax obligationsor income.
Kilowatt-hour (kWh). A unit of produced or consumedelectricity. Also the most common unit for the retail price of electricity, as in cents/kWh.
Large hydropower. Electricity from water flowing downhill,typically from behind a dam. No international consensusexists on the threshold that separates large from small hydropower, but the upper limit varies from 2.5–50 MW, with 10MW becoming more standard.
Megawatt (MW). A unit of power-generating capacity.Represents an instantaneous power flow and should not beconfused with units of produced energy (i.e., MWh, ormegawatt-hours).
Megawatt-thermal (MWth). A unit of heat-supply capacityused to measure the potential output from a heating plant,such as might supply a building or neighborhood. Morerecently used to measure the capacity of solar hotwater/heating installations. Represents an instantaneousheat flow and should not be confused with units of pro-duced heat (i.e., MWh(th), or megawatt-hours-thermal).
Modern biomass. Biomass-utilization technologies otherthan those defined for traditional biomass, such as biomassco-generation for power and heat, biomass gasification,biogas anaerobic digesters, and production of liquid bio-fuels for use in vehicles.
GLOSSARY

GLOSSARY RENEWABLES 2005 GLOBAL STATUS REPORT PAGE 35
Multilateral agency. Commonly refers to public agenciesthat work internationally to provide development, environ-mental, or financial assistance to developing countries, suchas the World Bank, or to broker international agreementsand treaties, such as the United Nations.
Net metering. Allows a two-way flow of electricity betweenthe electricity distribution grid and customers with theirown generation. When instantaneous consumption exceedsself-generation, the meter runs forward. When instanta-neous self-generation exceeds consumption, the meter runsbackward and power flows to the grid. The customer paysfor the net electricity used in each billing period and may beallowed to carry over net generation from month to month.
Production tax credit. Provides the investor or owner ofqualifying property with an annual tax credit based on theamount of electricity generated by that facility.
Renewable energy target. A commitment, plan, or goal by a country to achieve a certain level of renewable energy by afuture date. Some targets are legislated while others are setby regulatory agencies or ministries. Can take many formswith varying degrees of enforcement leverage. Also called“planning targets,”“development plans,” and “obligations.”
Renewables portfolio standard (RPS). A standard requir-ing that a minimum percentage of generation sold or capac-ity installed be provided by renewable energy. Obligatedutilities are required to ensure that the target is met, eitherthrough their generation, power purchase from other pro-ducers, or direct sales from third parties to the utility’s customers.
Small/mini/micro/pico hydropower. (See “largehydropower.”) Small hydropower is commonly defined asbelow 10 MW, mini below 1 MW, micro below 100 kW, andpico below 1 kW. Pico hydro will typically not involve a dambut just captures the power of flowing water.
Solar home system. A rooftop solar panel, battery, andcharge controller that can provide modest amounts ofpower to rural homes not connected to the electric grid.Typically provides an evening’s lighting (using efficientlights) and TV viewing from one day’s battery charging.
Solar hot water/heating. Rooftop solar collectors that heatwater and store it in a tank for use as domestic hot water orfor space heating.
Solar photovoltaic (PV) panel/module/cell. Converts sun-light into electricity. Cells are the basic building block,which is then manufactured into modules and panels.
Tradable renewable energy certificates. Each certificaterepresents the certified generation of one unit of renewableenergy (typically one MWh). These certificates allow tradingof renewable energy obligations among consumers and/orproducers, and in some markets like the United States allowanyone to purchase separately the green power “attributes”of renewable energy.
Traditional biomass. Unprocessed biomass, including agricultural waste, forest products waste, collected fuelwood, and animal dung, that is burned in stoves or furnacesto provide heat energy for cooking, heating, and agriculturaland industrial processing, typically in rural areas.
Utility green pricing. A utility offers its customers a choiceof power products, usually at differing prices, offering varying degrees of renewable energy content. The utilityguarantees to generate or purchase enough renewableenergy to meet the needs of all green power customers.

全球可再生能源状况报告
主要作者:Eric Martinot
清华大学 客座研究员
世界观察研究所 高级研究员
2005 年 10 月
Translation of the “Renewables 2005 Global Status Report” sponsored by REN21 Renewable Energy Policy Network (www.ren21.net)
and produced and published by Worldwatch Institute and GTZ GmbH.
Translation provided courtesy of Center for Renewable Energy Development and China General Certifcation Center
翻译:可再生能源发展中心 中国计量院鉴衡认证中心

REN21 21 世纪可再生能源政策网络
www.ren21.net 21 世纪可再生能源政策网络 REN21 是一个全球性的政策网络,旨在为国际可再生能源的领导层提供一个平台。它的
目标是在制定地方、国家、国际等层面的政策及决策上提供支持,使可再生能源在发展
中国家和工业化国家快速发展。 REN21 面向所有相关方和参与者提供服务,并是一个有能力且一直致力于创建一个促进
全世界可再生能源发展环境的网络,在此环境中思想和信息被分享、合作和行动得到鼓
励。REN21 将政府、国际机构和组织、合作伙伴以及政治层面的其他相关者以共同的基
础联系起来,它本身不是一个参与者,而是一个以对可再生能源的承诺为中心的各方面
关系疏导者。 建立一个全球性政策网络是在 2004 波恩国际可再生能源大会的政治宣言中 提出的,
2005 年 6 月在哥本哈根正式起动。 REN21 顾问委员会成员名单 Thomas Becker Jackie Jones Peter Rae
丹麦环境部 英国环境、食品、农村事务部 世界风能协会 Mohammed Berdai Stephen Karekezi Artur Runge-Metzger
摩洛哥可再生能源
发展中心 非洲能源政策研究网络 DG 环境:气候、臭氧和能源
欧盟 James Cameron Li Junfeng Jamal Saghir
气候变化基金 中国国家发改委,能源研究所
中国可再生能源专业委员会 世界银行能源与水局
Paulo Cypriano Susan McDade Steve Sawyer
巴西驻德国大使 联合国开发署,能源环境处 绿色和平组织,气候与能源组 Michael Eckhart Jennifer Morgan Ernst-Christoph Stolper
美国可再生能源理
事会 世界自然基金会气候变化项
目 可持续发展区域政府网络 (nrg4SD)
David Hales Paul Mubiru Griffin Thompson
世界观察研究所 乌干达能源和矿产发展部 美国国务院 Rainer Hinrichs-Rahlwes Rajendra Pachauri Arthouros Zervos
德国联邦环境、自然
保护和核安全部 意大利能源和资源研究会 欧洲可再生能源理事会
全球风能理事会 Neil Hirst Wolfgang Palz Ton van der Zon
国际能源机构能源
技术协作分部 世界可再生能源理事会 荷兰外交部 DGIS
Michael Hofmann Mark Radka Richard Hosier
德国联邦经济合作 联合国环境规划署技术、工业 全球环境基金
i
和发展部 和经济分部

ii
致谢
主要作者和研究者 Eric Martinot,世界观察研究所和清华大学 发起人 REN 可再生能源政策网络; 德国联邦环境、自然保护和核安全部; 德国联邦经济合作和发展部。 制作和出版人 世界观察研究所和德国技术合作公司 特别鸣谢 清华大学清华-BP 清洁能源研究与教育中心 研究员和区域通讯员 Kyung-Jin Boo (韩国能源经济研究会); John Michael Buethe (乔治敦大学); Odon de Buen (墨西哥国立自治
大学); Akanksha Chaurey (能源和资源研究会 (TERI); Red Constantino (绿色和平菲律宾); Jose Etcheverry(大卫铃木基金会); Uwe Fritsche (Öko-Institut); Daniele Guidi (Ecosoluzioni); Katja Hünecke (Öko-Institut); Tetsunari Iida (可持续能源政策研究会); Waeni Kithyoma (AFREPREN); Liu Pei (清华大学); Samuel Martin (亚洲科技学会); Jose Roberto Moreira (巴西生
物质用户络); Miquel Muñoz (巴塞罗那自治大学); Mika Obayashi (可持续能源政策研究会); Derrick Okello (AFREPREN); Kilian Reiche (世界银行); Michael Rogol (麻省理工学院和CLSA亚太市场); Ikuko Sasaki (可持续能源政策研究会); Janet Sawin (世界观察研究所); Klaus Schmidt (Öko-Institut); Peter Stair (世界观察研究会); Fabby Tumiwa (印度尼西亚电
力重建非政府工作组); Wang Yunbo (清华大学).
其他参与者 感谢以下各位奉献的时间、资料和评论:Molly Aeck (世界观察研究所); Lily Alisse;Rick Sellers;Lew Fulton;Till Stenzel (国际能源机构); Dennis Anderson;Jeremy Woods (伦敦帝国理工学院); Sven Anemüller(德国观察); Frederic Asseline (欧-中能源
和环境项目); Robert Bailis;Dan Kammen (加州大学伯
克利分校); Morgan Bazilian (爱尔兰可持续能源);
Jeff Bell (世界分散型能源联盟); Eldon Boes;Wendy Clark;Larry Flowers;Jean Ku;Bob McCormick;Tim Merrigan ;Kevin O’Connor, Kathy O’Dell; Ralph Overend;Jeannie Renne;Brian Smith;Blair Swezey (美国国家可再生能源实验室); John Byrne (特拉华大学); Anil Cabraal;Chas Feinstein;Doug Barnes;Subodh Mathur;Jamal Saghir;Xiaodong Wang;Chandra
Govindarajalu (世界银行);John Christensen (联合国环
境规划署); Christian de Gromard (法国FFEM); Nikhil Desai; Jens Drillisch;Marlis Kees ;Wolfgang Mostert; Hansjörg Müller ;Rolf Posorski;Paul Suding;Dieter Uh (德国技术合作公司); Christine Eibs-Singer (E+Co); Manfred Fischedick (Wuppertal Institute); Lisa Frantzis (Navigant 咨询机构); David Fridley;Ryan Wiser (劳伦
斯伯克利国家实验室); Chris Greacen (Palang Thai); Gu Shuhua (清华大学); Jan Hamrin;Lars Kvale; Ole Langniss; Dan Lieberman (资源解决中心); Miao Hong (世界银行/GEF中国可再生能源项目); Thomas Johansson (隆德大学); Dan Kammen (加州大学伯克利
分校); Stephen Karakezi(AFREPREN); Sivan Kartha (Tellus Institute); Jong-dall Kim (国立蔚山大学); June Koch (CMT 咨询机构); Li Hua (荷兰创新和可持续发
展局); Li Junfeng (中国可再生能源专业委员会); John Lund (国际地热协会和俄勒冈科技学院); Paul Maycock (PV新闻); Susan McDade (联合国开发署); Alan Miller ;Dana Younger (国际金融公司); Fred Morse (Morse Associates);Mark Radka;Eric Usher;NjeriWamukonya (联合国环境规划署); Venkata Ramana (温洛克国际); Oliver Schaefer;Arthouros Zervos (欧洲可再生能源理事会); Michael Schlup;Virginia Sonntag-O’Brien (BASE); Martin Schöpe(德国
联邦环境、自然保护和核安全部); Shi Pengfei;Qin Haiyan (中国风能协会); Judy Siegel(能源和安全集团); Scott Sklar (Stella 集团); Christof Tempe (Öko-Institut); Valérie Thill (欧洲投资银行); Molly Tirpak(ICF); Claudia von Fersen (KfW); Bill Wallace(UNDP/GEF 中国可再生能源项目); Wang Zhongying (国家发展和改
革委能源研究所); Werner Weiss(AEE INTEC); Christine Woerlen (GEF).

iii
目录 主要内容概要 .......................................................................................................................................................... iv 1. 全球市场概览 ...................................................................................................................................................... 1 2. 投资状况 ............................................................................................................................................................ 12 3. 工业发展趋势 .................................................................................................................................................... 16 4. 政策规划 ............................................................................................................................................................ 18
可再生能源的政策目标 ................................................................................................................................. 18 发电促进政策 ................................................................................................................................................. 19 太阳能热水/加热促进政策 ............................................................................................................................ 24 生物质燃料促进政策 ..................................................................................................................................... 25 绿色电力购买机制及电价形成机制 ............................................................................................................. 26 市级政策 ......................................................................................................................................................... 27
5. 农村 (离网)可再生能源 ................................................................................................................................... 29 名词解释 ................................................................................................................................................................. 35 注解 ......................................................................................................................................................................... 37 参考文献 ............................................................................................................................................................... 105 图示、表格和工具栏 图 1 2004 可再生能源占一次能源份额 .............................................................................................................. 8 图 2 2000—2004 可再生能源装机容量年平均增长率....................................................................................... 8 图 3 1990—2004 光伏装机容量 .......................................................................................................................... 9 图 4 1990—2004 风电装机容量 ........................................................................................................................... 9 图 5 2004 可再生能源装机容量 (欧盟、前 5 位国家及发展中国家)........................................................ 10 图 6 2004 风电装机容量前 10 位国家 ............................................................................................................... 10 图 7 2004 太阳能热水/供暖装机容量 ................................................................................................................ 11 图 9 2000 及 2004 年乙醇燃料产量 ................................................................................................................... 11 图 10 1995—2004 可再生能源年投资额 .............................................................................................................. 15 图 11 欧盟可再生能源目标 —— 2010 电力市场份额...................................................................................... 15 表 1:可再生能源数据指标............................................................................................................................................. 4 表 2:可再生能源技术现状——特点与成本 ................................................................................................................. 5 表 3:非欧盟国家的可再生能源目标 ........................................................................................................................... 19 表 4: 促进可再生能源政策 ........................................................................................................................................... 20 表 5:颁布了分类电价政策的国家/州/省的总数 ......................................................................................................... 22 表 6:颁布了 RPS 政策的国家/州/省的总数................................................................................................................ 23 表 7:部分有可再生能源目标和/或政策的主要城市 .................................................................................................. 27 表 8:农村地区(离网)现存常用可再生能源应用形式 ........................................................................................... 29 工具栏 1: 国际背景下的波恩行动计划 ........................................................................................................................ 13 引用说明:REN21 可再生能源政策网络“2005 全球可再生能源状况报告”。华盛顿特区,世界观察研究会

iv
主要内容概要
本报告提供了全球 2005 年可再生能源状况概述,内容涉及市场、投资、产业、政策和发展中国家的
农村(离网)可再生能源。本报告不提供分析、建议或推论。经过 100 多位研究人员数月的调研和复审,
本报告的误差已基本降至 低。REN21 将此报告视为积极交换观点和信息的一个良好开端。 本报告展示了一些关于可再生能源的令人吃惊的事实:这些事实反映出可再生能源的强劲增长趋势以
及相对于传统能源与日俱增的重要性。 2004 年全世界可再生能源领域的投资约为 300 亿美元(不包括大水电),而传统电力领域的投资大概
为 1500 亿美元。另外,大水电方面的投资为 200~250 亿美元,大部分发生在发展中国家。 全世界可再生能源总发电量是 160GW(不包括大水电),占全球发电量的 4%。其中发展中国家占 44
%,也就是 70GW。 不计大水电(其本身就占世界电力的 16%),2004 年全世界可再生能源发电量是世界核发电量的 1/5。 世界上发展 迅猛的能源技术是并网光伏(PV)发电。自 2000-2004 年其装机量年增长率为 60%。
其已在日本、德国及美国的 400 000 户屋顶安装。风能装机容量位居第二,年增长率达到 28%,德国
装机容量为世界第一,2004 年装机总容量为 17GW。 屋顶太阳能集热器为全世界将近 4 千万的家庭提供了热水,大部分是在中国;还有分布于 30 个国家
的 200 万个地热泵为建筑制热和制冷。尽管如此,全球生物质燃料供热量仍然五倍于太阳能和地热能
的总和。 2004 年生物质燃料(乙醇和生物柴油)的产量超过了 330 亿升,大约是全球消耗的 1 亿 2 千万亿升汽
油的 3%。2004 年巴西所有机动车(非柴油车)燃料的 44%由乙醇提供,美国所有售出汽油的 30%也混合了乙醇。
2004 年欧洲、美国、加拿大、澳大利亚和日本的绿电消费者超过 450 万,方式为基于零售渠道或认证
证书自愿购电。 2004 年全世界由可再生能源制造、运行和维护直接带来的就业机会就超过 170 万个。其中 90 万个由
生物质燃料生产提供。 可再生能源(尤其是小水电、生物质能和太阳能光伏)为发展中国家数千万的农村人口提供了电能、
热能、动能和提水,满足了农业、小工业、家庭、学校及其他社会需要。1600 万个家庭用沼气做饭和
照明,200 万个家庭在使用太阳能照明系统。 促进可再生能源的政策在过去几年中迅速发展,目前全世界已至少有 48 个国家制定了各种形式的可
再生能源促进政策,其中包括 14 个发展中国家。2005 年至少有 32 个国家和 5 个地区/省施行强制上网政
策(Feed-in Policy),其中一半以上从 2002 开始施行。至少有 32 个地区/省建立了可再生能源配额制(RPS),其中一半建立于 2003 年。还有 6 个国家于 2001 年确立了国家可再生能源配额制。至少 30 个国家提供了
直接资金投入补贴、赠款或折扣优惠。美国大多数的州以及其他至少 32 个国家为可再生能源提供了多种
形式的税收激励和减免制度。自 1995 年以来,超过 5.4GW 的风电装机受惠于美国联邦生产税减免制度。 全世界至少 45 个国家具有可再生能源发展的政策目标,包括 10 个发展中国家,欧盟 25 国和美国、
加拿大的很多州/省。大多数的目标是占发电量的份额,一般为到 2010-2012 年达到 5~30%。欧盟的目
标是到 2010 年可再生能源发电量占到总发电量的 21%,中国的目标是 10%(不包括大水电),这意味着
可再生能源发电量从目前的 37GW 提高到 2010 年的 60GW。 全世界很多市政当局也设定了未来可再生能源在政府能耗或城市能耗中所占的份额目标,一般为 10~
20%。许多城市制定了多种多样的旨在促进太阳能热水和太阳能光伏发展的政策,并将可再生能源纳入城
市规划。 巴西在过去 25 年中领导推动生物质液体燃料的发展,要求所有售出的汽油必须混合乙醇,所有的加
油站都同时供应纯乙醇和乙醇-汽油混合物。除了巴西,向机动车燃料中混合生物质燃料的规定在全世界至

v
少 20 个地区/省及两个国家(中国和印度)中实行。 可再生能源已成为一个大型产业。大型商业银行开始重视该市场,有几个已经将可再生能源投资作为
其贷款组合的主流。其它大的投资者也正在进入可再生能源市场,包括风险基金和数一数二的投资银行,
诸如摩根士丹利(Morgan Stanley)和高盛(Goldman Sachs)。近年来主要的投资和采购都发生在业界领先
的跨国公司,如通用电气、西门子、壳牌、英国石油、三洋和夏普(GE、Siemens、Shell、BP、Sanyo 和 Sharp)。中国五大电力设备和航空公司都已决定进军风电。综合来看,排名在前的 60 个可再生能源上市公司或大
型公司的可再生能源分部至少具有 250 亿美元的总市值。 在可再生能源项目、培训和市场支持方面,每年约有 5 亿美元的援助资金流入发展中国家。这些资助
的大部分来自德国复兴银行(KfW)、世界银行集团(WB)和全球环境基金(GEF),其余部分来自捐赠
和项目。 2004 年美国和欧洲为可再生能源提供的政府支持总和在百亿美元量级,方式有直接支持(预算内)和
基于市场的政策机制支持(预算外)。其中研发费用投入超过 7 亿美元。 很多可再生能源技术的成本随着技术进步和产业规模化而开始降低。太阳能和风能发电的成本都只是
10~15 年前的一半。很多可再生能源技术在良好的条件下可以同传统能源的零售甚至是批发的价格相竞
争,即便传统技术的成本也在降低(因燃料价格增长有所抵消)。 市场促进组织(MFOs)致力推动可再生能源市场、投资、产业化的增长,主要方式包括网络、信息
交换、市场研究、咨询、融资、政策建议及其他技术支持。粗略统计显示,全世界至少有 150 个这样的组
织,包括行业协会、非政府组织、多边和双边发展机构、国际合作伙伴、网络和政府机构。

1
1. 全球市场概览
世界一次能源使用中可再生能源比例达到 17%,其中包括传统生物质、大型水利发电及新兴可再生能
源(小水电、现代生物质、风能、太阳能、地热能和生物质燃料)*†(见图 1)。传统生物质主要用于家庭
炊事和取暖,其在全球一次能源使用中比例为 9%。由于更高效的使用方式或被新的能源形式所替代,传
统生物质所占比例增长缓慢,甚至在某些地区呈下降趋势。大型水利发电多见于发展中国家‡,所占比例接
近 6%,也同样增长缓慢。新兴可再生能源所占比例为 2%,但它在发达国家和部分发展中国家保持飞速增
长。显然,这三种形式的可再生能源具有各自的特点和发展趋势。该报告关注点将主要放在新兴可再生能
源,原因有两点:一是它们巨大的未来发展潜力;二是新兴可再生能源商业化应用的加速发展迫切需求市
场和政策的支持。§[注 1、2]** 可再生能源与传统燃料在四个不同市场存在竞争:发电、热水及取暖、交通运输燃料以及农村(离网)
能源(见表 1)。在发电方面,可再生能源在总装机容量中占有 4%,同时在全球总发电量中占 3%(未包括大
型水电)。太阳能、生物质能和地热能为数以千万计的建筑提供热水及取暖。太阳能集热器单独一项已在全
球约四千万家庭中使用。在供热方面,生物质能和地热能同时为工业、农业和家庭提供服务。交通运输用
生物质燃油市场份额虽然很小,但其比例也在增长。特别是在巴西,交通运输用生物质燃油占有巨大份额:
甘蔗中提取的乙醇现已为全巴西 44%的机动车(非柴油)提供燃料。在发展中国家,已有 1600 万家庭使用生
物质燃气替代煤油和其他炊用燃料满足照明及炊事需求;超过 200 万家庭使用太阳能光伏产品照明;越来
越多的小工业(如农产品加工)开始使用小型沼气池获取热能和动能。††[注 3] 世界上增长 快的能源技术就是光伏并网发电:其现有装机容量已从 2000 年初始时的 0.16GW 增至
2004 年末的 1.8GW,在 5 年期间年平均增长率达到 60% (见图 2、图 3) 。在这五年中,其他可再生能源
技术也同样快速增长,年平均增长率分别为:风能 28%(见图 4),生物质柴油 25%,太阳能热水器/供暖设
备 17%,离网光伏 17%,地热取暖 13%,乙醇燃料 11%。其它可再生能源发电技术,如生物质能、地热能
和小水电,相对比较成熟,增长率与传统能源相比相差不大,约为 2~4%。虽然没有相关数据支持,但生
物质供暖的增长实际也类似这些较成熟技术。另外,石油发电装机容量增长率约为 3~4%(在部分发展中国
家会高于此数字),大型水电年增长率为 2%,核能发电在 2000-2002 这三年期间年增长率为 1.6%。[注 3] 不算大型水电,2004 年世界范围内现存可再生能源发电总装机容量为 160GW(见图 5)。其中,小水电和风
力发电的比例为 2/3。需要说明的是,全球的发电总装机容量为 3 800GW。这 160GW 中有 77GW 在包括
中国的发展中国家,主要为生物质发电和小水电。欧盟共计有 57GW,主要为风力发电。另外,排名前五
位的国家分别是:中国(37GW),德国(20GW),美国(20GW),西班牙(10GW),日本(6GW)。[注 4、5]
* 除非特别说明,本文所用“可再生能源”均指“新的”可再生能源。目前暂时没有普遍接受的可再生能源的统一定义,但
使用“可再生能源”代指“新的”可再生能源是普遍认可的惯例。例如,BP 公司在其有关世界能源情况的年度统计评估报
告中规定“可再生能源”不包括大水电。大水电一般是指容量大于 10MW 的电站,但本报告中涉及的小水电统计数据包括
中国 50MW 水电站及巴西 30MW 水电站,因这两个国家所定的分界线分别为 50MW 及 30MW。 † 根据大水电及其他可再生能源技术归类方法的不同,可再生能源在全球一次能源中的份额亦可计为 13~14%。差别产生于
是否按照等效一次能源或等效电力计算,详细解释请参见注 2。 ‡ “发展中国家”并无定量区分标准,但一般指人均收入较低的国家。也有根据其是否为世界银行援助对象来加以界定。本
文所指发展中国家为非 OECD 国家及 OECD 成员国中的墨西哥和土耳其,但不包括俄罗斯及其他过渡之中的前计划经济国
家。 § 本报告仅涉及在全球较大范围商业化应用的可再生能源技术。许多其他技术也显现出较好的商业前景或已有少量商业化应
用,如主动太阳能制冷(亦称为“太阳能辅助建筑空调”),聚焦式太阳能发电(使用菲涅耳(Fresnel)透镜),海洋热能转化,
潮汐发电,波浪发电,热干/湿岩发电,从纤维素中提取乙醇等。据报告,太阳能炊具已在超过一百万家庭中应用,但尚无
数据用以预测其趋势。另外,被动太阳能供暖/制冷已被证明具有商业可行性,且已在建筑设计中广泛应用,但本报告中并
未涉及。本报告的后续版本可能会涵盖这些技术及应用。 ** 本报告中的注解及引用会在引用段落后用方括号括起,如:[注 1]。全部的注解及引用均可在 REN21 网站找到,具体链
接为 www.ren21.net/globalstatusreport. †† 离网光伏应用包括住宅、商业建筑、信标及通讯和消费类产品。2004 年,全球约有 70MW 用于消费类产品,80MW 用于
信标及通讯,180MW 用于住宅和商业建筑。

2
大型水利发电依然是低成本能源技术之一,但其引起的环境问题、居民安置问题、选址问题在很多国
家限制了它的进一步发展。2004 年,大型水利发电在全球总发电量中的比例已从 10 年前的 19%降至 16%。
截至 2004 年,大型水电累计总装机容量为 720GW,年平均增长率略高于 2%(发达国家为该数字的一半)。挪威是几个完全依靠水利发电的国家之一。2004 年水利发电量排名前五的国家分别是:加拿大(全球总量
的 12%),中国(11.7%),巴西(11.4%),美国(9.4%),俄罗斯(6.3%)。中国的水利发电与其快速增长的能源领
域同步发展。2004 年中国大型水利发电装机容量约为 8GW,使中国在总装机容量方面跃居世界第一
(74GW)。其它发展中国家在大型水利发电方面也有巨大投入,大量电站在建设之中。 在世界范围内,小水电的发展已超过一个世纪。中国拥有超过一半的世界小水电总装机容量。2004 年,中
国小水电建设迅猛发展,装机容量达到 4GW。其它在此方面积极努力的国家有澳大利亚、加拿大、印度、
尼泊尔和新西兰。小水电多用于自给型(非并网)村落发电,以替代柴油发电机或其它小规模电站,或为无
电农村人口供电。在过去几年中,为了减少对环境的影响,小水电使用新的技术和运作方式,将发展重点
放在电站与河流系统的环境集成方面。 风电市场主要集中在少数几个国家,其中 2004 年西班牙、德国、印度、美国和意大利在市场增长方
面处于领先地位(见图 6)。现在一些国家已经开始发展大规模商业市场,主要包括俄罗斯以及一些过渡性
国家,如中国、南非、巴西和墨西哥。就中国而言,历来的大部分风电投资来源于捐助或政府支持,但近
年来也在向私有投资转变。其它一些国家尚处在建设示范风电场的阶段,将在未来寻求发展商业化市场。
[注 6] 近海风电是一个新生市场。全球约有 600MW 的近海风力发电,它们全部位于欧洲。第一个大规模近
海风电场(170MW)于 2003 年在丹麦建成,而且欧洲还有 40GW 的庞大计划,主要位于德国、荷兰和英国。
[注 6] 生物质发电及供热在欧洲发展较慢,主要由澳大利亚、芬兰、德国和英国的发展推动。近年来在德国
迅猛发展的废弃木材利用现已趋于平缓,主要是由于大部分的原材料资源已被开发利用。英国 近在“混
合燃烧”(即在使用煤燃料的火电场混合使用少量生物质)方面有所增长。丹麦、芬兰、瑞典、美国和其他
几个 OECD 国家在生物质技术方面持续投入资金。在一些国家,利用生物质进行社区供暖及热电混合供应
也有所增长,其中包括澳大利亚和德国。在瑞典,生物质满足了超过 50%的社区供暖需求。在发展中国家
中,利用农业废弃物进行小规模供电采暖比较常见,例如利用米糠或椰壳。在拥有大规模制糖产业的国家,
如巴西、哥伦比亚、古巴、印度、菲律宾和泰国,利用甘蔗废弃物(蔗渣)热电联产的应用较为多见。逐
渐增长的小规模生物质气化应用正在农村市场寻找机会(在发达国家亦有高效组合循环生物质气化电站的
示范应用)。各国在生物能“联产”方面的兴趣也逐渐增加,该生产方式是指在一次生产过程中同时输出能
源及非能源产品(例如饲料和工业纤维)。[注 6] 类似小水电,地热能用于供电采暖也有一个世纪的历史。现今至少有 76 个国家使用地热取暖,24 个
国家使用地热发电。在 2000-2004 年间,地热发电容量增长超过 1GW,这些增长主要发生在法国、冰岛、
印度尼西亚、肯尼亚、墨西哥、菲律宾和俄罗斯。在发达国家中,地热发电主要集中于意大利、日本、新
西兰和美国。[注 6] 从 2000 年至 2005 年,地热直接取暖总量大约翻了两番,共增长 13GWth,其中至少 13 个国家是首次
进入地热领域。冰岛在地热直接取暖方面处于领先地位:地热满足了其 85%的采暖需求。自 2000 年,土
耳其在地热直接取暖方面增长了约 50%,现已能满足约 70 000 户家庭的采暖需求。现有的地热采暖设备约
有 50%为地热泵,也叫做地源热泵。这些设备的使用日益增多,主要用于建筑供暖、制冷。现有近 2 000 000热泵应用于 30 多个国家,主要为欧洲和美国。
通过支持性政策推动,并网光伏装机主要集中于 3 个国家:日本、德国和美国。截至 2004 年,在这 3个国家有超过 400 000 家庭安装了屋顶光伏,并为电网供电。2004 年,光伏市场增长了约 0.7GW,累计装
机容量从 1.1GW 增至 1.8GW。世界上建筑集成光伏的商业/公众示范应用也有所增长。典型范例包括:地
铁站(100kW)、加油站(30kW)、太阳能光伏生产车间(200kW)、消防队(100kW)、市政厅(50kW)、

3
展览中心(1000kW)、博物馆(10kW)、大学建筑(10kW)和监狱(70kW)。[注 7] 集中式太阳能热发电市场从上世纪 90 年代初就开始停滞不前,世界上仅有加利福尼亚建成了一座
350MW 的电站,也是由于那时加州优惠的税收政策。 近,以色列、西班牙和美国的一些商业计划又重
新唤起了人们的兴趣及相应的技术革新和潜在投资。2004 年,亚利桑那州开始建设一个 1MW 的抛物槽式
热电站,亦是继 90 年代加州 350MW 电站之后世界上第一个太阳能热电站。2005 年,由于有投资商正在
考虑建设 2 个 50MW 的项目,西班牙的市场开始涌现出来。一些发展中国家,如印度、埃及、墨西哥和摩
洛哥,开始计划通过多边合作建设相应项目,但其中一些项目还存在不确定性。 太阳能热水/供暖技术的应用日益广泛,其在中国、欧洲、以色列、土耳其和日本的热水/供暖市场份
额较大。几十个其他国家也具有相对较小的市场。中国占有全球安装总量的 60%(见图 7,图 8),欧盟占
有 11%,紧随其后的是土耳其 9%,日本 7%(所有数字仅针对涂层型集热器)。中国 2004 年总销量为 13 500 000 ㎡,增长幅度达到 26%。真空管太阳能热水器现占据中国市场的主导地位,在 2003 年市场份额就已达
到 88%,在日本,由于更新淘汰较少,现有市场开始下滑。在欧洲,2004 年安装总量为 1 600 000 ㎡,由
于存在旧系统的淘汰更新,该数字可能会有一定偏差。110 000 000 ㎡的集热器安装面积(77GWth 的供热
能力)为全球近 40 000 000 家庭提供太阳能热水,为全球约 1 600 000 000 家庭的 2.5%。*[注 8]
太阳能供暖正在一些国家开始发展,但主要应用依然是太阳能热水。在瑞典和澳大利亚,每年安装的
集热器有超过 50%的面积为热水/供暖组合系统。在德国,组合系统的份额为年安装总量的 25~30%。中国
有少于 5%的系统同时提供热水和采暖。
相对全球汽油 1 200 000 000 000 L 的年产量,生物质燃料在 2004 年的产量为 33 000 000 000(见
图 9)。巴西在过去 25 年中一直是乙醇燃料的世界领导者(和主要用户)。巴西 2004 年乙醇燃料产量为 15
000 000 000L,占世界总产量的近一半。巴西所有加油站同时销售纯乙醇(E95)、汽油醇、25%乙醇/75%
汽油混合燃料(E25)。2004 年在巴西,几乎与汽油相当的乙醇被用于机动车燃料(非柴油),所销售的混
合燃料中的乙醇及纯乙醇占所有机动车燃料的 44%。相对于汽油来说,乙醇燃料在 2005 年的需求相当强烈。
近年来,乙醇燃料全球交易量剧增,其中巴西为 大的出口国。2004 年巴西出口的 2 500 000 000L 乙醇
占全球交易量的一半多。[注 9]
巴西的交通运输燃料市场和机动车市场共同发展。继 90 年代纯乙醇燃油机动车销售锐减后,该市场
于 21 世纪初开始回暖,原因在于乙醇价格的大幅降低、汽油价格的上涨及巴西汽车制造商所谓“柔性燃
油(Flexible Fuel)”车的投产。这种汽车即可使用纯乙醇也可使用乙醇/汽油混合燃料。截至 2003 年,
大部分汽车制造商都有这种车型销售而且价格相对于纯乙醇燃料车和汽油车也有一定竞争力。柔性燃料车
被驾驶者广泛接受, 部分出于燃料供应不确定性的考虑(如1989年乙醇供应短缺及未来动荡的石油供应)。
柔性燃料汽车销售量迅速增长,截止 2005 年,巴西销售的汽车中有超过一半为柔性燃料车。[注 10]
美国为世界第二大乙醇燃料消费生产国。美国市场在 近一段时间呈现增长趋势。乙醇生产能力从
1996 年 4 000 000 000L/年增至 2004 年的 16 000 000 000L/年。近年的年增长率为 15~20%。截止 2005
年,有近 400 家加油站(大部分位于美国中西部偏北地区)销售 E85(85%乙醇与 15%汽油的混合物),更
有大量加油站销售汽油醇(E10)。2005 年,美国售出的 140 000 000 000G(加仑)机动车(非柴油)燃料
中的 3%为乙醇。另外,美国售出的汽油中有 30%混入乙醇(E10)以替代 MTBE(甲基叔丁基醚)作为汽油添
加剂。很多州已经要求停止使用 MTBE。其他生产乙醇燃料的国家有澳大利亚、加拿大、中国、哥伦比亚、
多米尼加共和国、法国、德国、印度、牙买加、马拉维、波兰、南非、西班牙、瑞典、泰国和赞比亚等。
[注 9]
2004 年,德国生物质柴油的产量增长了 50%,世界总产量增至 20 多亿升。纯生物质柴油(B100)在
德国享有燃油税全免的优惠,B100 在德国 1500 多家加油站有售。其他生物质柴油主要生产国有法国和意
* 太阳能热水/供暖一般称为“太阳能制热/制冷”,以指出太阳能制冷(太阳能辅助空调)亦是商业化技术。本报告使用太阳
能热水/供暖一词,原因在于太阳能热水器占总安装容量的绝大部分。世界范围内,特别是在欧洲,确有一些装机用于采暖,
但即使算上组合系统,供暖所占份额依然很小。太阳能制冷尚未开始大范围商业应用,但很多人都确信其前途光明。

4
大利。另有一些产量较小的国家,如澳大利亚、比利时、捷克共和国、丹麦、印度尼西亚、马来西亚和美
国等。一些国家计划在未来几年开始生产生物质柴油或扩大产能。[注 9]
表2为几种应用 广的可再生能源技术的成本数据,其中很多技术的应用成本仍高于传统能源技术(典
型传统能源技术基本负载用电成本在 2~5 美分/kWh,但高峰用电成本会相当高,离网柴油机*发电成本也
很高。)高成本及其他市场方面的障碍意味着大部分可再生能源技术依然需要政策支持。然而,两者经济
性方面的竞争并不是静态的:就在可再生能源技术成本降低的同时,传统技术成本也在下降(例如气燃机
技术的改进)。未来两者竞争力强弱的不确定性主要在于石油价格对传统能源成本的影响。
目前,国际能源机构对可再生能源成本价格竞争力的看法是:“除了大水电、燃烧用可再生能源和废
物处理厂,可再生能源电力的平均成本现在还无法与批发电价竞争。然而,根据所采用技术、具体应用和
地点的不同,某些可再生能源发电成本还是可与电网零售电价或商业采暖价格竞争的。在 理想情况下—
优系统设计、 佳地点和充足的资源—生物质发电、小水电、风电和地热发电的成本可降至 2~5 美分
/kWh。某些特定地点的生物质应用和地热供暖也很有价格竞争力。”太阳能热水器在技术成熟地区已与传
统热水器展开全面竞争,但在气候寒冷地区稍逊一筹。除了在某些零售电价极高(超过 20~25 美分/kWh)
的地区,并网光伏发电目前还缺乏竞争力。乙醇燃料在巴西已完全可与汽油展开竞争。†[注 11]
表 1:可再生能源数据指标
2004 年末装
机容量 比较指标
发电 (GW) 大水电 720小水电 61风电 c48 生物质发电 39 地热发电 8.9 离网光伏 2.2 并网光伏 1.8 太阳能热发电 0.4 海洋能(潮汐)发电 0.3 总计(除大水电)
160
世界总发电能力 = 3 800
热水/供暖 (GWth) 生物质供暖 220太阳能热水/供暖 77地热直接供暖 13地热泵 15
使用太阳能热水器的家庭 40 000 000使用地热泵的建筑 2 000 000
全世界共有家庭: 1 600 000 000
* 除非另外注明,价格数据均指美元。 † 成本比较基于经济成本,未计入外部成本。财务成本比较会相当复杂,因为须考虑因素包括政策支持、补贴、税务及其他
市场条件。历史成本降低是由一系列因素造成的,不在本报告讨论范围内。例如,由于生产效率提高及市场增长,巴西乙醇
燃料成本已持续 20 年走低。

5
交通运输用燃油 (升/年) 乙醇产量 31 000 000
000生物质柴油产量 2 200 000 0
00
汽油总产量 = 1 200 000 000
农村(离网)能源 家用沼气池 16 000 000
个
小型生物质气化器 n/a户用太阳能光伏系统 2 000 000 套
太阳能炊具 1 000 000 件
全部未接入电网家庭= 360 000 000
表 2:可再生能源技术现状——特点与成本
技术名称 特点 成本(美分/kWh)
成本走向及降低可能 发电 大水电 电站容量: 10
MW–18,000 MW 3–4 稳定
小水电 电站容量: 1–10 MW 4–7 稳定 陆地风能 风机功率: 1–3 MW
叶片尺寸: 60–100 m 4–6
全球装机容量每翻一番,成本降低 12~18%,现
已降至 1990 年的一半。风机功率相对于 10 年
前的 600~800kW 亦有较大提升。未来将通过优
选风场、改良叶片/电机设计和电子控制设备来
降低成本。 近海风能 风机功率: 1.5–5 MW
叶片尺寸: 70–125 m 6–10
市场依然较小。未来将通过培育市场及改良技
术来降低成本。 生物质发电 电站容量: 1–20 MW 5–12
稳定
地热发电 电站容量: 1–100 MW 类型: 双流式, 单闪
蒸式, 双闪蒸式, 自然蒸汽式
4–7
成本从 19 世纪 70 年代开始降低。通过先进的
勘探技术、低廉的钻井手段和高效的热利用,
成本可进一步降低。
太阳能光伏
(组件) 电池类型及效率 单晶硅: 17% 多晶硅: 15% 薄膜: 10–12%
--- 全球装机容量每翻一番,成本降低 20%,每年
约降低 5%。2004 年由于市场的影响,成本有所
提高。未来将通过在材料、设计、工艺、效率
和规模等方面做出改进来降低成本。 屋顶光伏 峰值功率: 2–5 kW 20–40
由于光伏组件价格降低、逆变器及系统平衡部
件的改进,成本持续走低。

6
太阳能热发
电 电站容量: 1–100 MW 类型: 塔式、碟式和
槽式
12–18 (槽式)
相对 19 世纪 80 年代第一座电站的 44 美分/kWh,成本已有所降低。通过扩大规模、改进技术,
成本将进一步降低。
热水/供暖 生物质供暖 电站容量: 1–20 MW 1–6 稳定 太阳能热水/供暖
面积: 2–5 m2 类型: 真空管/平板 功能: 热水/采暖
2–25 基本稳定。因规模效益、新材料应用、集热器
面积增大及质量提升,成本会有小幅降低。
地热供暖 电站容量: 1–100 MW 类型: 双流式, 单闪
蒸式, 双闪蒸式, 自然蒸汽式,热泵
0.5–5 参见地热发电部分
生物质燃料 乙醇 原料: 甘蔗, 糖用甜
菜, 谷物, 小麦 (未来将使用纤维素)
25–30 美分/等效汽
油升
在巴西,生产效率的提高使成本有所降低,现
价格为 25~30 美分/等效升(甘蔗提炼)。美国价
格则稳定于 40~50 美分(谷物提炼)。其他原
料则成本更高, 高至 90 美分。来源于纤维素
的乙醇将有望降低成本,预计 2010 年后,成本
将从今天的 53 美分降至 27 美分。其他原料的
成本会有些微降低。 生物质柴油 原料: 大豆, 油菜籽,
芥菜籽, 废弃植物油 40–80 美分/等效柴
油升 2010 年后,以油菜籽及大豆为原料的生物质柴
油的成本有望降至 35~70 美分/等效柴油升,而
以废弃植物油为原料的成本将保持现今的 25 美
分。 农村(离网)能源 微小水电 电站容量: 100–1,000
kW 5–10 稳定
超小水电 电站容量: 1–100 kW 7–20 因效率提升,成本稳步小幅走低。 极小水电 电站容量: 0.1–1
kW 20–40 因效率提升,成本稳步小幅走低。
沼气池 尺寸: 6–8 m3 n/a 因建造成本及产出结构的变化,成本稳步小幅
走低。 生物质气化
器 功率: 20–5,000 kW 8–12
通过技术改良,成本将可能大幅降低。
小风机 风机功率: 3–100 kW 15–30
技术进步可小幅降低成本。
户用风机 风机功率: 0.1–1 kW 20–40 技术进步可小幅降低成本。 乡镇规模小
电网 系统功率: 10–1,000 kW 后备系统: 蓄电池或
25–100 随太阳能及风能系统部件价格降低,成本也将
降低。

7
柴油机 户用太阳能
光伏系统 系统功率: 20–100 W 40–60 随太阳能系统部件价格降低,成本也将降低。
注:所有成本均指排除补贴和政策激励等因素的经济开销。表中成本数据亦是根据理想情况(系统设计、
选址及资源/原材料)计算。某些情况下成本会更低,如地热及大水电 低至 2 美分/kWh,生物质发电
低至 3 美分/kWh。较差条件下,成本可能会比表中数值高出很多。表中太阳能并网光伏成本是按大多数发
展中国家 2 500kWh/ m2 的年辐照度计算的。若年辐照度为 1 500kWh/ m2 (如南部欧洲),成本会升至 30~50美分/kWh,1000kWh/m2 则达到 50~80 美分/kWh。

Figure 1: Renewable Energy Contribution to Global Primary Energy, 2004
1: 2004
Traditional biomass
9.0%
Hot water/heating
/
0.7%
Power generation
1.2%
New Renewables
2.0%
Large hydro power
5.7%
Biofuels
0.2%


12
2. 投资状况 2004 年,约有 300 亿美元投向可再生能源扩容及安装(见图 10)。 除此以外,2004 年太阳能光伏制
造企业投资 40~50 亿美元用于建设新的工厂及购买设备,至少数亿美元投向乙醇产业用于建设新的工厂。
而全球每年在发电领域投资约 1100~1500 亿美元,因此可再生能源投资额占世界电力领域投资额的 20~25%。的确,国际能源机构在其 近的“世界能源投资展望”中预测在未来的三十年中 OECD 国家至少三
分之一的发电投资是可再生能源。可再生能源年投资额自 1995 年的约 70 亿美金稳步增长。2004 年,风
力发电投资额约为 95 亿美元,太阳能光伏投资额为 70 亿美元,小水电投资额为 45 亿美元,太阳能热利
用投资额为 40 亿美元,地热和生物质发电/供热的投资额为 50 亿美元,除此以外每年有大约 200~250亿美元投资于大型水电。[注 12]
目前可再生能源投资来自从公共到个人的多种渠道。,从千亿美元风电厂的商业投资到家庭规模的小
额贷款,投资得益于可再生能源技术的标准化及金融从业人员对可再生能源的认可和熟悉。 近的趋势之
一是大的商业银行开始注意到可再生能源的投资机会。这些大型银行,即所谓的“主流可再生能源投资机
构”的代表有 HypoVereins Bank, Fortis, Dexia, Citygroup, ANZ Bank, Royal Bank of Canada,和 Triodos Bank, 他们均活跃于可再生能源投资领域。 过往对可再生能源投资不甚感冒的传统电力公司现也逐渐成
为“主流”。活跃于可再生能源投资的电力公司有:法国电力、美国佛罗里达电力及照明公司、苏格兰电
力及西班牙的 Endesa 公司。* 其他大型投资者也正在进入可再生能源市场,包括业界领先的投资银行。主流的投资团体越来越相信
可再生能源是一个重要的商业机会。例如,摩根士丹利公司投资西班牙的风电厂项目,高盛银行,世界
大的投资机构之一,收购了 Zilkha 可再生能源公司(美国一家正在开发 4 兆瓦风机的风能开发公司)。GE的商业及消费者金融支持机构也开始了可再生能源投资。商业再保险机构正在针对可再生能源开发新的保
险产品。 风险资金投资者也开始注意到可再生能源。2004 年风险资金大约投资 10 亿美元于美国清洁能源技术
公司。尤其要指出的是,从 2001-2004 年太阳能光伏的风险投资及权益投资每年都有 100%的增长。驱
使风险资金投资可再生能源部分是由于其未来的市场前景,有资料显示在 2010-2014 年期间太阳能光伏
和风能市场将增至 400~500 亿美元。[注 13] 公立银行机构融资对刺激私人投资及行业积极性起到了非常重要的作用。欧洲投资银行是为可再生能
源提供融资的首要公立银行机构,在 2002-2004 三年间,每年平均提供 6.3 亿美元的融资额(几乎是欧
盟所有的项目)。欧洲投资银行计划在 2002-2007 年期间加倍其对能源领域中可再生能源的贷款,从 7%到 2007 年时的 15%。银行同时计划在 2008-2010 年对可再生能源发电的贷款增至欧盟新装机容量总投
资额的 50%,高于现在的 15%的比例。[注 14] 近几年在发展中国家为新的可再生能源进行的多边、双边及其他公共融资几乎每年都达到 5 亿美元。
这些资金很大一部分用于支持培训、政策开发、市场促进、技术援助和其他非投资需求。 大的三个资金
来源是德国复兴银行(KfW)、世界银行集团(WB)和全球环境基金(GEF)。2004 年 KfW 批准了大约
1.8 亿美元用于可再生能源,包括来自公共预算基金的 1 亿美元和来自市场基金的 8 千万美元。世界银行
承诺在 2002-2004 三年内平均每年向新兴可再生能源投资 1.1 亿美元。†GEF 则为 2002-2004 年可再
生能源共同投资项目分配了年均 1 亿美元,这些项目都是由世界银行、联合国开发署(UNDP)、联合国环
境规划署(UNEP)及其他一些机构共同实施的。间接的或联合的私人融资经常与来自这些机构的公共融
*此报告不包含碳基金或清洁发展机制(CDM)项目。以后的版本有望出现这些融资手段。在几个国家都有将这些用于可再
生能源融资手段进行一体化的计划,并且都建立了行政制度和程序。 †世界银行对新能源可再生能源的融资加上 GEF 每年对世界银行项目的 4500 万美元的共同投资将使世界银行/GEF 融资总量
达到每年 1.55 亿美元以上。世界银行也许诺 2002-2004 三年间平均每年向大水电投入 1.7 亿美元(不计 GEF),这样世界
银行/GEF 对所有可再生能源的年融资额将超过 3.25 亿美元。
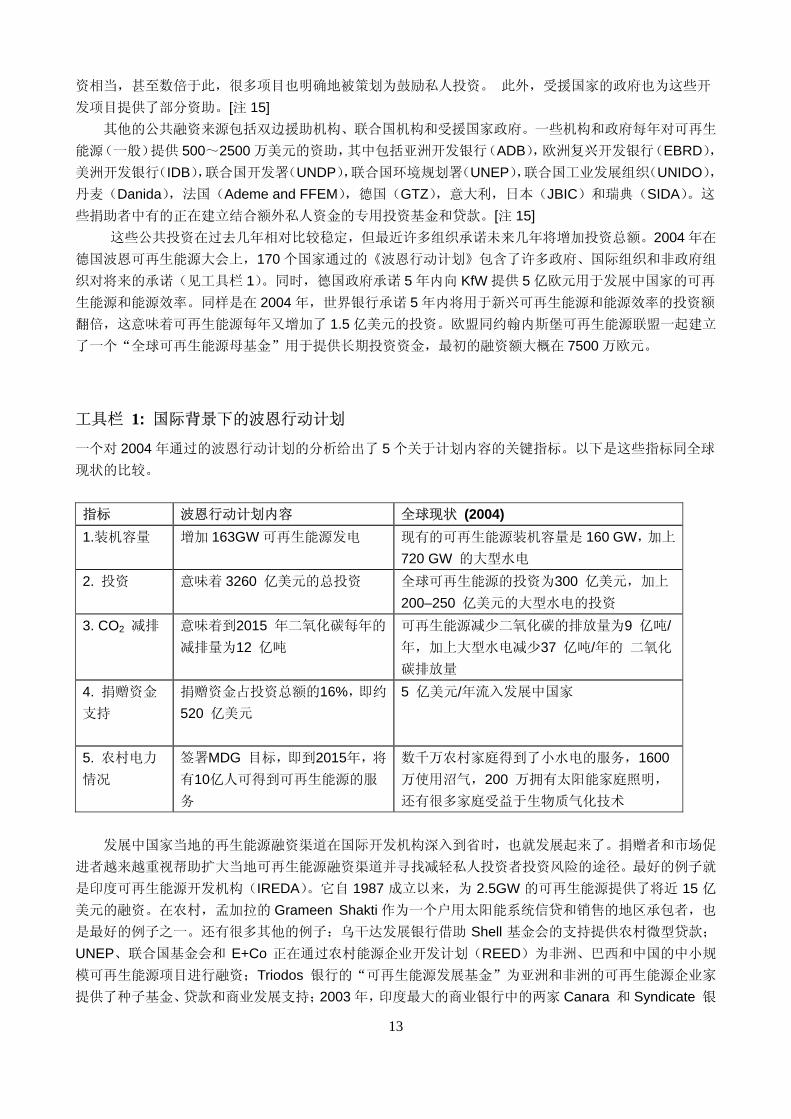
13
资相当,甚至数倍于此,很多项目也明确地被策划为鼓励私人投资。 此外,受援国家的政府也为这些开
发项目提供了部分资助。[注 15] 其他的公共融资来源包括双边援助机构、联合国机构和受援国家政府。一些机构和政府每年对可再生
能源(一般)提供 500~2500 万美元的资助,其中包括亚洲开发银行(ADB),欧洲复兴开发银行(EBRD),
美洲开发银行(IDB),联合国开发署(UNDP),联合国环境规划署(UNEP),联合国工业发展组织(UNIDO),
丹麦(Danida),法国(Ademe and FFEM),德国(GTZ),意大利,日本(JBIC)和瑞典(SIDA)。这
些捐助者中有的正在建立结合额外私人资金的专用投资基金和贷款。[注 15] 这些公共投资在过去几年相对比较稳定,但 近许多组织承诺未来几年将增加投资总额。2004 年在
德国波恩可再生能源大会上,170 个国家通过的《波恩行动计划》包含了许多政府、国际组织和非政府组
织对将来的承诺(见工具栏 1)。同时,德国政府承诺 5 年内向 KfW 提供 5 亿欧元用于发展中国家的可再
生能源和能源效率。同样是在 2004 年,世界银行承诺 5 年内将用于新兴可再生能源和能源效率的投资额
翻倍,这意味着可再生能源每年又增加了 1.5 亿美元的投资。欧盟同约翰内斯堡可再生能源联盟一起建立
了一个“全球可再生能源母基金”用于提供长期投资资金, 初的融资额大概在 7500 万欧元。
工具栏 1: 国际背景下的波恩行动计划
一个对 2004 年通过的波恩行动计划的分析给出了 5 个关于计划内容的关键指标。以下是这些指标同全球
现状的比较。 指标 波恩行动计划内容 全球现状 (2004) 1.装机容量 增加 163GW 可再生能源发电 现有的可再生能源装机容量是 160 GW,加上
720 GW 的大型水电 2. 投资 意味着 3260 亿美元的总投资
全球可再生能源的投资为300 亿美元,加上
200–250 亿美元的大型水电的投资 3. CO2 减排 意味着到2015 年二氧化碳每年的
减排量为12 亿吨
可再生能源减少二氧化碳的排放量为9 亿吨/年,加上大型水电减少37 亿吨/年的 二氧化
碳排放量 4. 捐赠资金
支持
捐赠资金占投资总额的16%,即约
520 亿美元
5 亿美元/年流入发展中国家
5. 农村电力
情况
签署MDG 目标,即到2015年,将
有10亿人可得到可再生能源的服
务
数千万农村家庭得到了小水电的服务,1600万使用沼气,200 万拥有太阳能家庭照明,
还有很多家庭受益于生物质气化技术 发展中国家当地的再生能源融资渠道在国际开发机构深入到省时,也就发展起来了。捐赠者和市场促
进者越来越重视帮助扩大当地可再生能源融资渠道并寻找减轻私人投资者投资风险的途径。 好的例子就
是印度可再生能源开发机构(IREDA)。它自 1987 成立以来,为 2.5GW 的可再生能源提供了将近 15 亿
美元的融资。在农村,孟加拉的 Grameen Shakti 作为一个户用太阳能系统信贷和销售的地区承包者,也
是 好的例子之一。还有很多其他的例子:乌干达发展银行借助 Shell 基金会的支持提供农村微型贷款;
UNEP、联合国基金会和 E+Co 正在通过农村能源企业开发计划(REED)为非洲、巴西和中国的中小规
模可再生能源项目进行融资;Triodos 银行的“可再生能源发展基金”为亚洲和非洲的可再生能源企业家
提供了种子基金、贷款和商业发展支持;2003 年,印度 大的商业银行中的两家 Canara 和 Syndicate 银

14
行连同他们的地区合作银行开始为农村家庭使用可再生能源提供千元贷款,两个州的 2000 个支行从始至
终地参与了活动。总之,针对家庭和商业金融服务的能力建设已经被许多机构优先考虑。 这些融资渠道通过许多其他的行业协会、非政府组织、国际合作者、网络以及私人基金会的努力会得
到扩张和促进。这些“市场促进组织”有数百个之多并且在世界上和地方上都很活跃。(见注 45 以获取这
些机构的网站列表)以下是五个国际合作伙伴:全球农村能源合作伙伴(GVEP)、可再生能源和能源效率
合作伙伴(REEEP)、全球能源可持续发展网络 (GNESD)、 UNEP 可持续能源资助计划和 REN21 可再
生能源政策网络。 美国和欧洲2004 年对可再生能源的政府支持在100 亿美元的量级。这些支持有多种形式,“预算内”
的支持包括像研发基金机制、直接投资、资本成本补贴、课税扣除和出口退税等形式。*研发是预算内支持
的重要一部分。1999-2001年期间,国际能源机构成员国每年平均共有7.3亿美元投入研发。“预算外”的
支持包括基于市场的激励和调节机制,这些支持不会影响政府预算(例如,强制上网政策和可再生能源配
额制)。欧洲环境署估计欧洲在2001年至少为可再生能源提供了8亿美元的预算内支持和60亿美元的预算外
支持。预算外支持的一大部分归因于强制上网,同时还有采购义务和竞争性投标等其他形式。美国1999年对可再生能源的联邦预算内支持是11亿美元,包括7.2亿美元的联邦乙醇减免税和3.3亿美元的研发利用。 2004年研发利用的开支降低了但乙醇免税增加至17亿美元,连同产品课税扣除(另有2亿美元),每年的预
算内支持超过了20亿美元。美国州立政策和计划可以另外增加10亿美元或更多,包括公共受益基金每年提
供的约3亿美元(预算外)。和这些数字相比,联合国和国际能源机构建议的全球基础上的化石燃料的能源
补贴/支持在每年1500~2500亿美元,而核能大约是每年160亿美元。[注16]
*出口信用以前很少应用于可再生能源,但是现在形势改变了。经济合作组织 近决定给予可再生能源特别的待遇,即在经
济合作组织内部正式支持出口信用,包括延长还款期限从 12~15 年。这个特殊的待遇可以帮助出口信用机构同其他参与发
展中国家可再生能源项目的资金协调一致,潜在地增加出口信用机构在可再生能源领域地投资。


16
3. 工业发展趋势 这些投资走向说明可再生能源现在已经成为一个很大的产业。全世界范围内,至少有 60 家可再生能
源上市公司或者大型公司的可再生能源部门 2005 年的市值已经超过了 4000 万美元, 据估计,这些公司和
部门的总市值已经超过 250 亿美元。除了这些公司,排名在前 100 位的的可再生能源公司和部门的总市值
也达到数十亿美元。光伏正在成为世界上增长速度 快,收益 多的一个产业。2005 年预计投资约 50~70亿美元,在 2005-2008 年期间产能将增加数百兆瓦。[注 17]
世界上 大的工业巨头开始进入风能市场,这个市场以前完全由专门制造风机的公司占据,这恰恰证
明可再生能源已经成为一个很大的产业。电气设备公司,如通用和西门子即是近年来进入风能市场的杰出
代表,进入方式都是并购 (通用在 2003 年收购了美国的 Enron Wind 公司,西门子在 2004 年收购了丹麦的
Bonus 公司)。而在中国,5 家 大的电气、航空和发电设备公司在 2004 年开始发展风机技术。他们已经和
国外公司签订了四份技术转让合同,并且计划在 2005 年生产出他们第一个风机原型。这些工业巨头的加
入,显然会在金融、销售和生产规模等方面带来新的竞争,同时也会增加这些的技术的可信度。 2004 年,风电工业生产了超过 6000 台风机,平均功率达到 1.25 兆瓦。排在前六位的生产厂家分别为:
Vestas (2004 年和丹麦的麦肯公司合并)、 Gamesa (西班牙)、Enercon (德国)、通用能源 (美国)、 西门子 (2000 年和丹麦 Bonus 公司合并)和 Suzlon (印度)。在中国,金风和西安维德是两个主要的风机生产厂家,
分别占据中国风机市场的 20%和 5% (进口占 75%)。风机规模的扩大,体现了全球工业的进步。从 1995 到
2004 年,风机的平均功率从原来的 500 千瓦增大到 1300 千瓦。美国和欧洲现已能生产 1000 千瓦到 3000千瓦规模的风机,欧洲的生产厂家甚至能生产出 5000 千瓦的风机原型。但在印度和中国,风机规模仍停
留在 600 千瓦到 1000 千瓦。风机产业中,制造规模更大的风机仍然是首要的技术。产业界也不断在材料、
电子、叶片和发电机设计以及优化安装位置等方面开发创新,这些创新为进一步降低成本提供了可能 [注18]。
光伏产业在 1999 年曾为总产量达到 1GW 而欢欣鼓舞,但在 5 年后的 2004 年年底,光伏产业累计产
量已经翻了四番,突破了 4GW。2004 年,全球总产量持续快速增长,年产量已超过 1100MW。根据大型
生产厂家发布的计划,2005 年全球产能至少增加 400MW,随后的三年(2006-2008)将再增加数百兆瓦。
2004 年全球前三位的生产厂商分别为:Sharp、Kyocera 和 BP Solar (但大量厂家的产能增长迅猛,排名因
此每年都有改变) 。[注 19] 中国和其他发展中国家也逐渐成为光伏产业的重要参与者。在光伏产业中,2004 年中国组件产能翻倍,
从原来的 50 兆瓦到现在的 100 兆瓦;电池片产能增加到 70 兆瓦。而且从发布的工业计划看,2005 年产能
将再次翻倍。印度有 8 个电池片生产厂家,14 个组件生产厂家。Tata BP Solar 作为印度主要的光伏生产厂
家,产能从 2001 年的 8MW 增至 2004 年的 38MW。菲律宾的 Sun Power 公司计划在 2004 年将电池片产能
翻倍,增加至 50MW。泰国的 Solartron 公司发布计划要在 2007 年使电池片产能达到 20MW。纵看整个产
业,设计和工艺的改进,还有大规模的生产,都会进一步的降低成本。 和风能和光伏相比,生物质发电和供热以及小水电产业已非常成熟,本地化和多样化程度较高。投资
生物质发电、供热多是木材厂、造纸厂和糖厂等产生生物质能源资源的厂家。欧洲继续保持着小水电领域
的主导地位,近些年则特别关注对现存电厂的升级和更新。低落差(低于 15 米)和小容量(小于 250 千瓦)发电是目前小水电主要需改进的技术。中国生产小水力发电机的厂家至少有 500 家,与之形成鲜明对比的是,
控制世界地热能工业的却只有五家大公司(Ansaldo、Fuji、Mitsubishi、Ormat 及 Toshiba)。 [注 20、21] 全球乙醇工业的中心在巴西和美国。2004 年,巴西生产乙醇的制糖厂/酿酒厂超过 300 家,2005 年年
初,又有 39 家新的酿酒厂注册。美国 2004 年有 12 家新的乙醇生产工厂建成,总数已经达到 80 家。同时
2004 年还有 16 家新的工厂开始动工。2005 年,德国和美国的几个大的乙醇生产工厂也开始投产。巴西已
成为主要的乙醇出口国,2004 年出口占世界乙醇交易量的一半。欧盟也有可观的生物质燃料(乙醇和生物
柴油)贸易量。其他几个国家也在计划发展它们的乙醇工业。 [注 22] 每年,可再生能源产业的各个环节日益完善。例如,小风机制造厂家提供更易装配、并具有太阳能以

17
及其他技术互补接口的产品。离网光伏产业开始开发用于太阳灯和户用系统的标准“即插即用”包。有些
公司正在开发互补系统打包。例如,一个美国公司将光伏和小风机在集装箱里进行组合,配上先进的电池
和控制,从而提供完全预封装系统。通过将更完善的控制系统、性能监测和通信都集成到系统里,使其实
现更好的耗电计量和更完善的记帐付费机制。 可再生能源产业持续快速增长,2004 年,全世界由可再生能源提供的制造、操作和维护等直接工作机
会已超过 170 万,其中 90 万来自生物质燃料产业。其提供的间接工作机会更是几倍于此。这只是粗略估
计,因为只有少数产业和国家发布了相关统计。这些统计包括:巴西乙醇产业的 40 万,中国太阳能热水
产业的 25 万,德国全部可再生能源的 13 万,欧洲风能产业的 7.5 万和光伏产业的 1.5 万,美国光伏产业
的 1.2 万,尼泊尔生物质燃气产业的 1.1 万,日本可再生能源的 3400 以及欧盟小水电的 2200。*[注 24]
* 文献中没有对全球可再生能源提供的工作机会的记载。注 24 有对此报告的详细分析,主要包括小水电、生物质发电,风
电,地热发电,光伏,太阳能热水,乙醇和生物柴油,但是不包括地热和生物质采暖。

18
4. 政策规划 在上世纪 80 年代和 90 年代初,只有少数几个国家制定了相关政策促进可再生能源发展。但是在 90
年代后期和本世纪初,许多国家、州、省和城市都制定了相关的可再生能源政策。由前文可知,这些政策
中很多都在市场发展中发挥了实际的作用。本节讨论现有的促进可再生发电,太阳能热水/供暖和生物质燃
料的目标和政策,也讨论地方性政策和自愿绿电/定价。* 本报告不详细分析政策的影响和教训。尽管存在无数的制定和执行问题,不过政策文件清楚表明,这
些政策还是主要影响可再生能源发展的速度和广度。国际能源机构在 2004 年关于 IEA 国家的市场和政策
趋势的重大事件纪事中评述:市场的显著增长不是某个单一政策作用的结果,而是各种政策综合作用的结
果;非常重要的还有政策支持的长期性、可预见性及当地、州/省以及有关的权力机构的积极参与;个别的
政策机制要推广到国家级,积累更多的经验。IEA 认为,虽然旧政策有着宝贵的经验,但是因为大部分的
政策都是在 2000 年后制定的,现在评估许多政策的作用为时尚早。 可再生能源的政策目标
全世界至少有 45 个国家制定了可再生能源的政策目标。在 2005 年中期,至少 43 个国家制订了支持
可再生能源的国家级目标,其中就包含所有 25 个欧盟成员国(见图 11 和表 3)。欧盟也制定了其欧洲发展目
标,即可再生能源达到总电力的 21%,总能源的 12%。除了这 43 个国家,美国的 18 个州(包括哥伦比亚
特区)和加拿大的 3 个省也制定了基于可再生能源配额制的目标(尽管美国和加拿大都没有一个全国性的目
标),加拿大的另外 7 个省也正在制定它们的目标。大部分的国家目标都是关于可再生发电所占份额,一般
这个份额范围是 5~30%,全球各个国家实际所占电量份额从 1%到 78%不等。有的目标是包括供暖在内的
占总的一次能源供应的份额,或具体的装机容量,或可再生能源的总产量。这些目标大部分都定在
2010–2012 期间实现。 [注 25] 在 43 个制订了国家级目标的国家中,有 10 个是发展中国家:巴西、中国、多米尼加共和国、埃及、
印度、马来西亚、马里、菲律宾、南非和泰国。一些其他发展中国家不久也将发布他们的目标。中国的目
标是到 2010 年,可再生能源占发电总装机容量的 10% (不包括大水电),这意味着 60GW 的可再生能源装
机容量。中国 2020 年的目标是可再生能源占一次能源的 10%,占发电装机容量的 12.5%,2 亿 7 千万平方
米太阳能热水器集热面积以及风电和生物质发电装机容量达到 20GW†。 泰国的目标是到 2011 年可再生能
源占一次能源的 8%(不包含传统的生物质能)。印度预期到 2012 年增加 10%的发电装机容量,或者至少
10GW 的可再生能源‡。菲律宾设定的目标是到 2013 年可再生能源达到 5GW 的总装机容量,或者是现有
容量的两倍。南非 2003 年设定的目标是到 2013 年来自可再生能源的发电量增加 10TWh,大概为总装机容
量的 4%。墨西哥立法部门正制定一个新的关于可再生能源的法律,其中将包含可再生能源的国家目标。
* 本节旨在说明全面的政策规划。列举的政策通常应该已经由立法机关颁布。有些列举的政策可能还没有开始执行,或者需
要详细的执行规则。掌握所有的政策显然太困难了,所以有些政策可能无意中遗漏了,或者列举的不正确。有些政策已经废
止,或者刚刚颁布不久。在网页注记中会对此节及时的更新,那会包含更多的政策细节。 †可再生能源发展计划草案中介绍了中国的目标,这个草案正在等待政府的批准。但在 2004 年 6 月德国波恩的 2004 年可再
生能源大会上已经公开宣布了中国的目标。2005 年 2 月制定的中国可再生能源法需要政府在 2006 年 1 月公布包括目标的可
再生能源发展计划后才能实行。 ‡ 印度国家目标是一个计划性或指导性的目标,但未得到法律的支持。.

19
表 3:非欧盟国家的可再生能源目标
国家 目标 澳大利亚 到 2010 年达到每年 9.5 TWh 巴西 到 2006 年风能,生物质能和小水电增加 3.3GW 加拿大 4 个省的目标是达到总电力的 3.5%~15%,6 个省实行其它形式的目标
中国 到 2010 年达到发电装机容量的 10%(预期 60GW),到 2010 年达到一次能源的
5%,到 2020 年达到一次能源的 10% 多米尼加共和
国 到 2015 年达到 500MW 的风电装机容量.
埃及 2010 年达到总电力的 3%,2020 年达到 14% 印度 在 2003 到 2012 年间增加 10%发电装机容量(期望值为 10GW). 以色列 2007 年达到总电量的 2%,2016 年达到总电量的 5% 日本 2010 年达到总电量的 1.35%,包括地热能和大水电(RPS)。
韩国 包括大水电,2010 年达到电力的 7%,2011 年达到 (0.3GW)的 1.3GW 的在网
光伏,包含 100,000 家家庭型。 马来西亚 2005 年达到总电量的 5%。 马里 2020 年达到总能源的 15%。 新西兰 2012 年总装机容量增加 30PJ(包括加热和交通燃料)。 挪威 2010 年集热和风能达到 7TWh。 菲律宾 到 2013 年具有 4.7GW 总容量。 新加坡 2012 年达到 50,000m2(~35MWth)的太阳能集热面积. 南非 2013 年增加 10TWh 终能源。 瑞士 2010 年达到 3.5TWh 的电力和集热。 泰国 2011 年占总的一次能源的 8%(包括传统的乡村生物质能)。 美国 在 20 个州占总电力的 5%到 30%(包含 DC)。
发电促进政策
全世界至少有 48 个国家(34 个发达或过渡性国家和 14 个发展中国家)制订了若干形式的可再生能源发
电促进政策(见表 4)。 常见的现有政策是分类电价法,近几年许多新的国家和地区都颁布这个法令。1978年,美国第一个颁布了全国分类电价法(PURPA)(一些州积极实施 PURPA,但是在 90 年代大部分都废止了)。90 年代初,丹麦、德国、希腊、印度、意大利、西班牙和瑞士相继采用分类电价政策。到 2005 年,至少
32 个国家和 5 个地区/省采用了这个政策,其中有一半国家和地区是 2002 年颁布的(见表 5)。

20
表 4: 促进可再生能源政策
国家 分
类
电
价
可再生
能源配
额制
资金
补助,
赠款
或优
惠
投资减
免, 或其它减
免措施
减少收
购税,能源税或
者 VAT税
可交易
的可再
生能源
证书
能源产
品补偿
或减税
净流量 公众投
资,贷款
或融资
公开竞
价
发达国家和过度国家 澳大利亚 X X X X 奥地利 X X X X 比利时 X X X X X 加拿大 (*) (*) X X X (*) X (*) 塞浦路斯 X X 捷克 X X X X X X 丹麦 X X X X 爱沙尼亚 X X 芬兰 X X X X 法国 X X X X X X X 德国 X X X X X 希腊 X X X 匈牙利 X X X X 爱尔兰 X X X X X 意大利 X X X X X 以色列 X 日本 (*) X X X X X 韩国 X X X 拉脱维亚 X X 立陶宛 X X X X 卢森堡公
国 X X X
马耳他 X 荷兰 X X X X X 新西兰 X X 挪威 X X X X 波兰 X X X X X 葡萄牙 X X X X 斯洛伐克 X X X 斯洛文利
亚 X
西班牙 X X X X

21
瑞典 X X X X X X X 瑞士 X 英国 X X X X 美国 (*) (*) X X (*) (*) X (*) (*) (*) 发展中国家 阿根廷 X X 巴西 X X 哥伦比亚 X 中国 X X X X X X 哥斯达黎
加 X
危地马它 X X 印度 (*) (*) X X X X X 印度尼西
亚 X
墨西哥 X X 尼加拉瓜 X X 菲律宾 X X X 斯里兰卡 X 泰国 X X X X 土耳其 X X
注: (a)表中只包含已颁布的政策。但是,因为具体的执行措施还没有建立或者生效,有些政策还没有执行
或者没产生作用。(b)加了(*)号的表示在这个国家只有有州/省级的政策,还没有全国性的政策。(c)表中的
有些政策不仅仅应用在发电,还应用于其它市场。(d)表中忽略已废止的政策,例如挪威 2003 年废止对风
能的分类电价政策,丹麦 2002 年废止的资金补贴政策和比利时 2003 年废止的分类电价政策(Green Frank system)。(e)有几个非洲国家执行补助政策支持小型乡村光伏(还有小水电),包括马里、塞内加尔、坦桑尼
亚和乌干达。南非给现在发展停滞不前的光伏技术制定了乡村能源特许服务的补助政策。(f)几个发展中国
家正在计划制定可再生年能源发展战略和/或预期不久将颁布新的补充政策,包括阿尔及利亚、亚美尼亚、
哥伦比亚、埃及、危地马拉、约旦、马其顿王国、墨西哥、秘鲁、南非、越南和也门。 发展中国家中,印度第一个建立了分类电价政策,接着是斯里兰卡和泰国(仅对小规模发电)、巴西、
印度尼西亚和尼加拉瓜。因为 2003 年印度需要新的地方性政策(旧的分类电价政策在 90 年代渐渐废止了),所以 2004 年,印度的三个地区采用了新的分类电价政策。2005 年上半年,中国、爱尔兰、土耳其和美国
的华盛顿颁布了各自的分类电价政策。中国的分类电价政策是 2005 年 2 月颁布的促进可再生能源的综合
法律的一部分。[注 26、27] 在过去的几年里,特别是在德国、西班牙和丹麦等国家,分类电价政策明显的带动了创新,提高了投
资者的兴趣,增加了投资。例如,在分类电价法的带动下,德国符合规定的可再生能源发电 2004 年比 2000年增加了一倍多,分别是 37TWh 和 14 TWh。在有些国家,分类电价政策对风能产生的影响 大,同时也
影响着生物质能和小水电的发展(大部分法律限定了适用的水电的 大规模,例如德国是 5MW)。就在 近,
西班牙的分类电价政策给新的太阳能热发电的投资计划提供了很大的帮助(预期决定在 2005 年建成两个
50MW 的电厂)。

22
表 5:颁布了分类电价政策的国家/州/省的总数
年份 国家/州/省的总数 该年新增的国家/州/省 1978 1 美国
... 1990 2 德国 1991 3 瑞士 1992 4 意大利 1993 6 丹麦,印度 1994 8 西班牙,希腊 1995 8 1996 8 1997 9 斯里兰卡 1998 10 瑞典 1999 13 葡萄牙,挪威,斯洛文尼亚 2000 14 泰国 2001 16 法国,拉脱维亚 2002 20 奥地利,巴西,捷克,印尼立陶宛 2003 27 塞浦路斯,爱沙尼亚,匈牙利,韩国,斯洛
伐克,马哈拉施特拉(印度) 2004 33 意大利,以色列,尼加拉瓜,爱德华王子岛
省(加拿大),安得拉邦省和中央邦省(印度) 2005 (上半年) 37 土耳其,华盛顿(美国),爱尔兰,中国
各个国家的分类电价政策各不相同,有些政策仅仅应用于特定的技术或者 大容量的发电技术。大部
分政策通常根据发电的成本,对不同的技术制定不同的返税,比如离岸风电和在岸风电的政策就不尽相同。
有些政策也区分位置/地区,电厂运转的年份和当年的季节。对于某一电厂的返税会随着时间减少,一般持
续 15~20 年。有些政策提供固定的返税,但是其他的政策根据市场或成本相关的返税提供固定的补贴(或者
两种政策同时实行,例如西班牙)。 在美国、加拿大和印度,可再生能源配额政策(RPS)正在推广到地方/省级(见表 6)。至少 32 个地区或
省已经颁布了 RPS 政策,有一半地区是从 2003 年开始颁布的。2004-2005 年,美国有 8 个州颁布了 RPS政策,使美国施行 RPS 政策的州达到 20 个。同样,在 2004–2005,印度有 5 个州颁布了 RPS 政策,使印
度实行 RPS 政策的州达到 6 个(印度 2003 年的电力法规定印度的州可自己设定电力占可再生能源的 小的
份额)。加拿大有三个省在实行 RPS 政策(更多其他的省正在制定目标)。上述的大部分 RPS 政策要求可再
生电力所占份额范围为 5~20%,一般要求于 2010–2012 年间实现。现在大部分的 RPS 政策的目标都转变
成吸引更多的未来投资。有研究表明美国现有的州立 RPS 法律要求到 2020 年增加 52GW 的可再生能源,
这是其现在可再生能源的两倍多*[注 28]
* RPS 的比例高低不应与投入力度或努力程度相关联,因为有些州/省已经很接近他们的目标,但是其它有些地方却离他们
的目标很远。更进一步的是,有些 RPS 政策对符合要求的合格水电制定了上限。参见注 25 有关单个国家的要求的百分比或
容量目标的列表。

23
表 6:颁布了 RPS 政策的国家/州/省的总数
年份 国家/州/省的总数 该年新增的国家/州/省 1997 1 马萨诸塞州(美国) 1998 3 康涅狄格州,威斯康星州(美国) 1999 7 缅因州,新泽西州,得克萨斯州(美国),意大利 2001 12 亚利桑那州,夏威夷,内华达州(美国),佛兰德斯(比
利时),澳大利亚 2002 16 加利福尼亚,新墨西哥(美国),瓦龙(比利时),英国 2003 20 明尼苏达州(美国),日本,瑞典,马哈拉施特拉(印度)2004 34 科罗拉多州,马里兰,纽约,宾尼法尼亚, 罗德岛(美
国); 新斯科舍,安大略湖,爱德华王子岛省(加拿大), 中央邦省,马哈拉施特拉省,安得拉邦省,奥里萨邦(印度),波兰,泰国
2005 38 哥伦比亚特区,蒙大纳,特拉华(美国),古吉拉特(印度)
全球有六个国家同时在 2001 年实施 RPS 国家政策。澳大利亚的 RPS(2001)政策要求电力公司每年提
交一定数量的可再生能源证书(2004 年达到要求产电的 1.25%,或者大约 2600GWh 的总电量)。这些要求
每年都会有所调整,但 终要在 2010 年达到 9500GWh 的国家目标。英国的 RPS 政策(2002)要求到 2010年达到总电量的 10%,在 2015 年达到 15%,直到 2027 年。日本的 RPS(2003)政策同样要求电力公司提供
一定的比例,这个比例将随着时间增长,并在 2010 年达到总电量 1.35%。瑞典的 RPS(2003)政策要求消费
者或者供电者通过购买电力或者购买可再生能源证书完成指定份额,该份额将逐年增长(瑞典对违规者按照
平均认证价格的 150%进行惩罚)。波兰的 RPS(2004)政策要求在 2010 年达到总电量的 7.5%。泰国的 RPS (2004)政策要求新增的产能中 5%是可再生能源。*
现今可再生能源发电的政策支持存在许多形式,如直接的投资补贴或者优惠、税收激励和减免、销售
税和 VAT 税的免除,直接产品支付或者减税(按每 kWh)、绿色证书交易、净流量、直接公共投资或融资和
定量发电公开竞价(见表 4)。目前至少有 30 个国家提供各种形式的投资补贴、赠款或者优惠。其他财政支
持的方式通常还包括税收鼓励和减免,美国大多数的州和其它至少 32 个国家都为可再生能源提供税收鼓
励和减免的政策。 一些国家正在实行发电量支付或减免税政策。这方面美国联邦实行的生产税减免政策做的尤为突出。
从 1995 年到 2004 年,超过 5400MW 的风电装机容量受益于减免税政策。随通货膨胀,1994 年开始是 1.5美分/kWh 的减税随着时间增加, 终在 2005 年减税增加到 1.9 美分/kWh,其间还经历几次废止和再施行。
现在施行的将在 2007 年终止。生产减税吸引了金融家在风电方面的兴趣,使风电成为美国近年来一个“主
流”投资方向。其它实行生产激励政策的国家有芬兰、荷兰和瑞典。† 一些国家实行资本补贴、分类电价政策或两个政策同时实行(同时实行净流量政策),来促进屋顶并网
* 表 3 和图 11 中的国家目标可以认为是“将要达成”,“计划中的”或“预计的”目标,但是并不代表对指定级别的电力公司或者
消费者具有法律效力的国家 RPS 政策。 † 能源生产激励政策按单位产能(也就是 kWh)给生产者提供一定的费用,和分类电价政策很相像,有时候甚至就被称作分类
电价政策。但是两者间还是有较大区别的,因为生产激励的资金来自电力附加费或者先前的税收。美国的生产税减免制度在
某些定义中可以看成购电法。但我们这里使用的定义是:分类电价是与政府无关的收入,这种税收由大众用户自己直接支付
(德国和西班牙的情况),而不是通过专项税(荷兰的情况)或者已收税款(芬兰的情况).

24
光伏。这些政策无疑对近年来并网市场的迅速增长起了很大的作用。日本的屋顶光伏政策本定于 2005 年
结束。其在 1994 年提供的资金补贴是 50%,到 2003 年下降到 10%左右,2005 年是下降到 4%左右。这些
政策影响了 20 多万个家庭及 800 MW 的装机。德国现有超过 16 万家庭在其屋顶安装了太阳能光伏发电设
备,总装机容量达到了 700MW。德国施行一种 低限价的分类电价政策,并为消费者提供低息贷款直至
2003 年。其它持续实行这种政策的地方还有加利福尼亚及美国一些其它州和其它几个国家(包括法国、希
腊、意大利、韩国、卢森堡、荷兰、葡萄牙和西班牙),他们提供投资补贴(一般为 30~50%)以及/或者利于
电力购买的税制。韩国进行的“百万屋顶”计划预期到 2011 年屋顶光伏达到 300 MW,开始提供 70%的资
本补贴,然后随着时间逐渐降低。包括匈牙利和泰国在内的几个国家已经宣布实行新屋顶光伏计划。[注29]
有些国家或州/省已经建立了可再生能源基金用来直接进行金融投资,或提供低息贷款,或以其它方式
如研究、教育、制定标准和投资公共设施等推动市场发展。该类基金 大者是美国 14 个州建立的“公共
利益基金”。这些基金不仅用于可再生能源,还用于提高能源效率。基金的来源多种多样, 常见的是收
取购电附加费。这 14 个基金在 1997—2001 年间开始启动,并且每年集资及花费在可再生能源上的款项超
过 3 亿美元。预计在 2012 年他们将为可再生能源汇集超过 40 亿美元的资金。与这些基金的功能类似,印
度可再生能源开发机构(IREDA)也提供贷款和项目融资。2005 年,中国的可再生能源法也呼吁建立一个这
样的基金。墨西哥也考虑在 2005 年建立“绿色基金”,为可再生能源项目提供融资。[注 30] 全球至少有 7 个国家及美国 35 个州和加拿大若干省执行净流量政策。美国另外的四个州有一个或多
个电力公司提供净流量服务。日本也施行一种基于自愿的净流量政策。该法律正在陆续被颁布施行:2004年,美国又有六个州通过了净流量法。就在 近,一个 2005 年颁布的美国联邦法律要求所有美国电力公
司必须在三年内提供净流量服务。净流量法在促进美国和日本并网光伏市场方面成效卓著。[注 30] 在 90 年代,英国开始使用可再生能源发电的特许权招标制度。现在实行这个制度的国家至少有以下
七个:加拿大、中国、法国、印度、爱尔兰、波兰和美国。中国在 2003—2004 年间通过特许权招投标共
建设了 850MW 的风电项目,并计划在 2005 年通过该方式建设共计 450MW 的项目。2004 年加拿大安大
略省通过特许权招标建设了 1000MW 的风电项目,其它各省也开始采用此方式。而许多国家的电力公司也
通过参与特许权投标以达到 RPS 的要求。 [注 31] 包括可交易可再生能源证书政策在内的其它政策,一般与自愿绿电购买政策或可再生能源配额制结合
使用。至少 18 个国家有证书交易的模式和/或市场。许多其它规章制度手段,如建筑规范、监管规则和程
序以及输电途径和定价等,在促进可再生能源发电方面也有重要作用。这些规章制度手段是走向未来可再
生能源市场的途径之一,对发展中国家来说更是如此(例如,墨西哥和土耳其正在采取这种手段)。电力部
门结构调整、碳排放税、矿物燃料税等方面的政策也会影响可再生能源的经济竞争力。 太阳能热水/加热促进政策
世界 大的太阳能热水器市场在中国,2004 年其已占全球市场的 80%。中国的国家目标是 2005 年达
到 6500 万平方米的太阳能集热面积(2004 年几乎已经达到这个目标),到 2015 年这个数字将增加到 2 亿 3千万平方米。80 年代,太阳能热水器在小型村镇中开始应用。该市场主要由以下因素推动:热水的大量需
求、经济性及远低于发达国家价格的热水器系统。虽然没有相关促进政策推动太阳能热水器在城市多层建
筑中应用,但随着能源价格的上升及公共需求的增加,特别是在当前建筑业非常景气的时期,开发商在设
计和建设阶段已经开始考虑安装太阳能热水器。有关技术标准,建筑规范及测试和认证中心等政府项目也
在帮助这个产业走向成熟。[注 32] 除了中国,有 18 个或更多的国家为太阳能热水/供暖的投资提供赠款、优惠或投资税减免等支持。这
些国家包括澳大利亚、奥地利、比利时、加拿大的某些省、塞浦路斯、芬兰、法国、德国、希腊、匈牙利、
日本、荷兰、新西兰、葡萄牙、西班牙、瑞典、英国、美国的很多州和美国联邦政府。赠款一般为系统成
本的 20~40%。投资税减免政策会减除全部或部分的投资纳税义务。(意大利的可再生能源证书同样适用于
太阳能热水,即所谓的“白色认证”。) 以色列是唯一一个制订国家政策要求在新建筑中使用太阳能热水器

25
的国家。自 1980 年以来,以色列的大部分建筑都被要求安装太阳能热水器。技术要求随建筑物规模和类
型不同而不同,如某些工业、医疗和高层建筑物可免于安装。欧盟正考虑制定太阳能等可再生能源供热技
术的促进政策,有可能为此出台一个新的指令。 世界上许多大城市颁布了地方层面的法令,要求新建筑中必须安装太阳能热水器,或者对太阳能热水
器投资提供激励或补助,如巴塞罗那(西班牙)、牛津(英国)以及波特兰和俄勒冈(美国)。其中巴塞罗那颁
布了一项长远政策。从 2000 年开始的巴塞罗那太阳热能法令成为城市能源政策一个重要里程碑。该法令
要求:一旦新建筑的规模超过指定值(292 MJ/天的热水能耗),那么其热水能耗至少有 60%应由太阳能热水
器提供的;游泳池加热必须是 100%的太阳能。大规模整修的建筑一样适用于这个法令。规模类别中表明,
所有商业建筑和 16 户或更多的住宅建筑,都适用于该法令。由于这个法令的执行,现在 40%的新建筑都
安装了太阳能热水器,并且人均装机容量(m2/1 000 人)有了 15 倍的巨大飞跃:从 2000 年的 1.1 增长到 2004年的 16.5。该城市的目标是到 2010 年安装的集热器面积达到约 10 万平方米。
由于巴塞罗那的带头作用,西班牙的其它市镇也开始采用太阳热能法令,其中包括马德里、巴伦西亚、
塞维利亚、布尔戈斯和潘普洛纳。市政当局的强烈兴趣促使 IDEA 在 2003 年基于巴塞罗那的太阳热能法令
精心制作了一个太阳热能法令的模版,这个模板可以作为城市和乡镇制订自己的法令的基础。到 2004 年
11 月,34 个直辖市和一个区采用了太阳热能法令,另有 10 个区(总数为 17)正在制定之中。这些法令的采
用意义重大。例如,潘普洛纳的太阳能法令在 2004 年中期生效,致使太阳集热器的使用在一年里增加了
50%。一个全国性的太阳能法令正在考虑之中,并准备于 2005 年颁布实施。 生物质燃料促进政策
巴西的”ProAlcool”项目已经进行了 25 年,这使巴西在生物质燃料领域具有领先地位。”ProAlcool”项目中的政策包含强制混合要求、零售分销要求、生产补贴以及其它措施。自 1975 年以来,巴西要求在所
有出售的汽油中混合乙醇。虽然混合程度频繁地在调整,但是基本都保持在 20~25%的范围内,所有加油
站都要求出售混合乙醇的燃料(E25)和纯乙醇(E100)。而使用纯乙醇的车辆则享有优惠的税率。几家汽车制
造厂制造的“灵活燃料”车辆新近上市,并且非常畅销,首要的因素不是政府制定了对应的政策,而只是
因为政府对车辆执照税特惠政策的范围的扩大,除了原先包括的纯乙醇燃料车辆*,现在也包括了使用灵活
燃料的车辆。巴西 近开始在其国内着力推广使用生物柴油,来源主要是其国内豆油生产过程。巴西新近
通过的一个法律允许从 2005 年 1 月开始,在柴油燃料中混合 2%的生物柴油。这个比例可能还会在 2013年增加到 5%或者更多[注 33]。
近些年,除巴西之外,其他几个国家也要求在车辆燃料中混合生物质燃料。需要特别提出的是,至少
20 个州/省和 2 个国家已经要求在所有出售的车辆燃料中混合乙醇和/或生物质柴油。从 2003 年开始,印度
政府要求,所有 28 个州中的 9 个州和 7 个联邦地区中的 4 个地区(均为甘蔗产区)在车辆燃料中混合 10%的
乙醇(E10)。在中国,已经有四个省要求进行 E10 燃料混合,2005 年另外五个省将执行类似的政策。在美
国†,有三个州也进行 E10 燃料混和,他们分别为夏威夷(2006 以前主要还是汽油)、明尼苏达(在 2013 年增
加到 20%)和蒙大拿。在其它州和国家正在考虑 2%的生物柴油混合(B2)政策时,明尼苏达目前已经要求实
行这个政策了。加拿大的安大略省要求在 2007 年以前实行 E5(平均)燃料混和。哥伦比亚(E10)和多米尼加
共和国(2015 以前实行 E15 和 B2 混合)在要求执行全国性的燃料混和政策。泰国制订了一个 2011 年的生物
质燃料占总能量的份额的目标,为此泰国正在考虑 E10 和 B2 混和的政策。在从巴西进口的基础上,日本
正在考虑 E5 混和政策。[注 33] 美国在生物质燃料税收激励方面 为突出。过去 25 年中,许多州级和联邦级的政策已经颁布。1979
年颁布的能源安全法规定,联邦乙醇减税额 高为 60 美分/加仑,该额度正比于混合的百分比(例如,E10
*由大众汽车(Volkswagen)领导的巴西汽车制造厂商的自愿举措推动这个转折点: 2005 年销售的新车一半是灵活燃料车辆。
通过推行灵活燃料汽车而不是单一的纯乙醇汽车或汽油汽车,汽车制造商简化了供应链及配件。 † 由于 2003 年到 2004 年甘蔗减产,印度只有进口乙醇来实现国家混合燃料目标。而且推迟了下一步目标的实现,直到国内
的乙醇供应满足市场需求。中国各省因为乙醇短缺也不得不暂停混合燃料强制要求。

26
混合的燃料为 6 美分/加仑)。在 2004 年,通过法案使这种减税制度延长到 2010 年。现在增加了对生物柴
油的减税,大约每百分比的混合生物柴油就有 1 美分的减税(也就是说,B2 混合的每加仑为 2 美分)。美国
有若干个州也为乙醇生产和销售提供减税和其它激励措施。加拿大提供 10 美分/公升的国家燃料免税,许
多省提供相近的或更高的免税( 高为 25 美分/公升)。很多欧洲国家针对生物质燃料减免燃料税或 VAT。这些国家包括奥地利(生物质燃料免税 95%)、法国、德国(生物质燃料免税 100%)、匈牙利、意大利(生物质
燃料免税 100%)、西班牙、瑞典和英国。 欧盟的目标是在 2010 年前使生物质燃料占运输燃料的份额变为 5.75%。有几个欧洲国家正在考虑施行
相关政策,帮助欧盟达成这一目标。2003 年,欧盟委员会的一个指令给每个国家设定了 2005 年(2%)和 2010年(5.75%)的目标。虽然目标的达成是自愿的,但是每个国家要么递交达成目标的计划,要么解释他们为甚
么不能达成目标的原因。有些欧盟成员国 近颁布了促进生物质燃料的法律或将要达成的目标,其中包括
匈牙利的 2010 年生物质燃料达到总能量的 2%的目标和荷兰的生物质燃料达到运输燃料的 2%的目标。 绿色电力购买机制及电价形成机制
在 2004 年,欧洲、美国、加拿大、澳洲和日本有超过 450 万绿色电力消费者。在政策支持、私有资
金参与、公共计划以及政府购买等方面的联合援助下,绿色电力购买机制及电价形成机制的工程正在稳步
前进。带动绿色电力购买机制及电价形成机制前进的三大因素分别是:电力公司绿电销售、在取消电力管
制条件下通过第三方制造者开展的竞争性零售(亦称为“绿电营销”)以及可交易可再生能源证书。日本
也存在社会组织的绿电项目。随着市场扩展,绿色电力对于常规电力差价在继续下降。在美国,零售绿色
电力差价一般为 1~3 美分/kWh。 [注 34] 在欧洲,自 90 年代后期,有些国家就存在绿色电力购买机制及电价形成机制。截至 2004 年,在绿色
电力购买的免税支持下,荷兰已有近 300 万绿色电力消费者。其它有绿色电力零售市场的欧洲国家有芬兰、
德国、瑞士和英国。自 1998 年以来,德国的绿色电力市场一直在平稳地增长。2004 年就有 60 多万的消费
者购买了约 2000GWh 的绿色电力。RECS 是一个在 90 年代后期建立的可再生能源认证体系,旨在规范和
认证可再生能源证书和交易市场,其成员中有 18 个欧洲国家。到 2005 年,发放的可再生能源证书累计已
达到 33000GWh,其中大约 13000GWh 的证书用于绿电交易*。 美国估计每年有 50万绿色电力消费者,购买电力达到 4500GWh。绿色电力购买正式开展时间约为 1999
年。2004 年,美国可再生能源发电至少扩容了 2GW 以填补这个市场。†联邦政府是绿色电力 大的单一买
家:美国空军每年购买的绿色电力就有 320GWh。到 2004 年,34 个州中超过 600 家电力公司已开始提供
绿电销售服务。其中大部分公司都是自愿提供该服务的,但是在 2001 到 2003 年间,美国的 5 个州颁布法
规,要求电力公司为消费者提供绿电产品。2004 年,电力公司绿电销售几乎占据了绿色电力销售的一半。 许多美国的大公司,从航空航天承包商到天然食品公司,都自愿购买绿色电力产品。这些公司买家包
括 IBM、Dow、Dupont、Alcoa、Intel、HP、Interface、Johnson&Johnson、Pitney Bowes、Staples、Baxter、FedEx Kinkos、General Motors 和 Toyota。公共的和非政府的举措也给这些买家带来便利。美国环境保护局
的“绿色电力伙伴关系”在 2005 年已有 600 个成员,每年购买绿色电力达到 2800GWh。“Green-e”自愿
认证项目在建立市场信誉方面也有所助益。 在日本,至 2005 年初,估计有 6 万绿色电力的消费者。他们都是电力公司的顾客,并通过合作制、
社区组织和公共项目等形式自愿为绿色电力贡献力量。日本的绿色电力 初是通过社区义务组织发展起来
的。北海道生活俱乐部(Seikatsu Club)是一个消费者合作联盟,它启动了日本第一个绿色电力项目。在
联盟成员和大众的的义务协助下,联盟和当地电力公司一起收缴电费,并投资可再生能源项目。成员能够
购买风电项目的股份,这样产生了第一个“民有”风机。日本别的地方也建立了类似的绿色基金,现在十
* 在英国,自愿绿色电力购买和电力公司的可再生能源义务的差别受到质疑。据称,英国的绿色能源自愿购买政策并不总是
现有电力义务的补充。现在在德国,超过 50%的绿色电力市场是靠水电支撑的,大部分恰在德国电力市场自由化之前投入
使用。 † 美国的绿色能源购买政策既独立于任何可再生能源政策,又是这些可再生能源政策的补充,如可再生能源配额制。

27
个日本电力公司让顾客自己选择是否捐助绿色电力基金,以支持风能和太阳能系统的发展。就在 2005 年
初,已经有 57 000 名顾客每月通过缴纳电费自愿捐助绿电基金。 日本可再生能源认证市场也开始形成。日本的天然能源公司(JNEC)对商业和工业客户出售绿色电力证
书,这些客户包括 50 多家日本大公司,象索尼、Asahi、Toyota 和日立。JNEC 将在 15 年内向这些公司出
售约 60GWh 的绿电证书,价格比传统电力高出 2.4~3.4 美分/kWh(3~4 日元/kWh)。 澳洲有超过 10 万消费者从各种零售商购买绿色电力。绿色电力购买正在传播到其它国家。中国就是
一个例子:2005 年十二家上海企业自愿从三个当地风电厂购买绿色电力,这在中国尚属首次。而且其价格
差额非常高:比传统电力高出 6 美分/kWh(0.53 元/kWh)。 市级政策
全球范围的许多市政府颁布了他们自己的可再生能源政策。许多城市设定了未来可再生能源发展目标
和二氧化碳减排目标,颁布了太阳能热水和/或屋顶光伏的促进政策,修改了城市规划方法或程序以将未来
能耗纳入考虑,开展了示范或试点项目,制定了多种多样的促进政策并实施了众多项目。 (参见表 7)[注35]
表 7:部分有可再生能源目标和/或政策的主要城市
城市
可再生能源
目标 降低 CO2 的目标
太阳能热水
器政策 光伏政策 城市试验计划和吉
他政策 阿德莱德,澳大利亚 X X X 巴塞罗那,西班牙 X X X X X 开普顿, 南非 X X X 芝加哥,美国 X 大丘,韩国 X X X 弗莱堡,德国 X X X X 哥德堡,瑞典 X 光州, 韩国 X X X 海牙,荷兰 X 檀香山,美国 X 林茨,奥地利 X 明尼亚波利斯,美国 X X 牛津,英国 X X X X X 波特兰,美国 X X X X X 青岛,中国 X 旧金山,美国 X 圣·莫尼卡,美国 X 札幌,日本 X X 多伦多,加拿大 X 范库弗峰,加拿大 X
很多城市已决定为市政建筑和活动购买绿色电力。如美国的波特兰、俄勒冈、圣莫尼卡和加利福尼亚,
这些市政府 100%使用绿色电力以满足其能源需求。其它美国城市如芝加哥、洛杉矶、明尼亚波利斯和圣
地亚哥,其市政电力需求的 10~20%来自绿色电力。 许多城市的未来目标是可再生能源发电占城市总需求的 10~20%,而不仅仅只是政府用电。其中包括
澳大利亚阿德莱德、、南非开普顿、德国弗莱堡和美国萨加门多(加利福尼亚)。实现这个目标的时间一般设

28
定在 2010 年到 2020 年。有些城市的目标是总能耗中可再生能源所占份额,譬如韩国大邱的目标是 2012年份额达到 5%。有些城市的目标是装机容量。英国牛津以及南非开普顿等城市的目标是到 2010 年 10%的
家庭安装太阳能热水器 (牛津的光伏有同样的目标)。西班牙的巴塞罗那目标为 2010 年太阳能集热器面积
达到 10 万平方米。有些英国的城市政府要求超过指定规模的新建筑都要配套安装可再生能源设备。 有些城市提出或采用二氧化碳减排目标,一般为相对于基准水平(通常为 1990 年的水平)减少 10~20%,
这与京都议定书目标的形式相一致。(然而,在城市层面,工业排放和城市居民没有必然的联系,所以这样
的目标设置会因为工业生产而过于复杂化。) 这样的城市有德国的弗莱堡(25%)、韩国的光州(20%)、日本
的札幌(10%)、加拿大的多伦多(市政府的二氧化碳排放量减少 20%)和温哥华(6%)。荷兰的海牙计划到 2006年市政府能耗实现“碳平衡(CO2 Neutral)”;整个城市能耗实现“碳平衡”为其长期目标。澳洲的阿德莱
德计划 2012 年实现建筑“零排放(zero net emissions)”,2020 年实现交通运输“零排放”。 在各相关方的参与支持下,许多城市已在市政规划中将未来清洁能源纳入考虑。典型的例子是瑞典的
哥德堡,它通过名为哥德堡 2050 的项目为城市制定长远规划。该项目需要大学、市政府和城市能源公共
事业公司的共同努力。内容含有研究、前景规划、战略规划、公众对话和示范项目。日本的可再生能源政
策在地方层面非常活跃。在国家政府的一个项目支持下,800 个地方政府在过去 10 年中分别规划了各自的
城市发展远景。这些日本城市根据各自特点,结合可再生能源创造了一个超前而独特的前景。 全球城市共同组织并参与了各种支持当地可再生能源发展的全球性组织,譬如 ICLEI 城市气候保护活
动、联合国太阳能城市促进会、欧洲绿色城市网和欧洲气候联盟。

29
5. 农村 (离网)可再生能源 农村(离网)可再生能源 常见的应用形式是炊事、照明和其他小规模用电、产生原动力、提水、供热和
制冷。表 8 列出了这些应用形式,其中包括“第一代”或“传统”应用及技术(即原始生物质燃料和小规
模水电)和“第二代”应用及技术(即风能、光伏发电、生物质气化和超小规模水电)。尽管发展的重心
更多的放在了“第二代”技术上,农村发展问题专家还是不断提醒关注发展问题和可再生能源问题的各界
人士:第一代技术依然具有十分重要的作用,特别是在 不发达国家。这一部分讨论了表 8 中的部分农村
能源应用,以及农村电气化政策。[注 36]
表 8:农村地区(离网)现存常用可再生能源应用形式
用途 应用的可再生能源 替代的传统能源 炊事 (家庭和商业用)
生物质直接燃烧(薪柴, 秸秆, 森林废物, 粪, 木炭和其他形式)
家庭沼气池生产沼气 太阳能炊具
液化石油气,煤油
照明和其他小规模用
电 (家庭,学校,街道照
明,通讯,手工工具,
保存疫苗)
水电(超小规模,微小规模,小规模) 家庭沼气池生产沼气 带内燃机的小规模生物质气化炉 村级电网和风/光互补系统 户用太阳能系统
蜡烛,煤油,电池,
中央电池,柴油发
电机
产生原动力(小规模工
业) 配有电动机的小型水电 生物质发电和电动机 带内燃机的生物质燃气发生装置
柴油发电机和发
动机
提水(农业和饮用) 风力机械提水 光伏发电提水机
柴油提水机
供热和制冷 (农作物干燥和其他农
业加工,热水)
生物质直接燃烧 小规模和中等规模的沼气池生产沼气 太阳能农作物干燥机 太阳能热水器 制冰以保存食物
液化石油气,煤
油,柴油发电机
“传统”应用主要指燃烧薪柴、农业和森林废物(残渣)、粪便和其他未处理的生物质燃料供家庭炊事、
供热和其他加热需要。部分生物质能转换为木炭在市场上出售。在许多发展中国家,生物质能占有能源供
应的大部分份额。2001 年,非洲是 49 %,亚洲是 25%,拉丁美洲是 18%。2000 年,撒哈拉以南非洲国家
消耗了将近 4 亿 7 千万吨薪柴(人均 0.72 吨),包括木头和木炭。与之相比,印度和中国一共消耗了 3 亿
4 千万吨。撒哈拉以南非洲国家, 木头或者秸秆是 94%的农村家庭和 41%城市家庭的主要的家庭能源来源。
木炭是 4%的农村家庭和 34%城市家庭的主要的家庭能源来源。煤油是 2%的农村家庭和 13%城市家庭的主
要的家庭能源来源。[注 37]
使用传统生物质能的代价和健康影响(以及改进生物质能炉灶和其他技术带来的相应好处)虽然不包
括在本报告的内容中,但是仍然十分重要。由于收集时间是一种大量的非货币性支出,尤其是对妇女来说,

30
大部分生物质燃料的收集被排除在商业经济体系之外。Ezzati 和 Kammen 研究员在一份全面的现状研究
报告中指出,全球由于暴露在固体燃料产生的室内空气污染中而导致死亡的人数的保守估计显示,2000 年,
这一风险因素导致了 150 万到 200 万的死亡, 占全球死亡人数的 3~4%。[注 37] 炊事: 改进的生物质燃料炉
改进的生物质燃料炉不仅可以节约 10~50%的生物质消耗,而且可以极大的提高室内空气质量。在中
国和印度,由于政府的推广,节能炉在大部分地区都有生产和销售。在肯尼亚,已经形成了大规模的商业
化市场。目前,由于过去 20 年中多种公共项目的进行和私有市场的成功,全球一共有 2 亿 2 千万节能炉
在使用。而全球有将近 5 亿 7 千万家庭把传统生物质作为主要炊事燃料,中国现有的 1 亿 8 千万使用节能
炉的家庭占这种家庭的 9 5%,印度的 3 千 4 百万节能炉使用节能炉的家庭占这种家庭的 25%。*[注 38]
在非洲,在过去的几十年间,研究,传播和商业化努力带来了一定范围内节能炭炉——现在是木柴炉
——的使用。大多数炉子的设计,以及支持其商业化的项目和政策都非常成功。目前有 5 百万节能炉在使
用。在肯尼亚,超过半数的城市家庭和将近 16~20%的农村家庭使用陶瓷的 Jikko 炉(KCJ)。虽然几乎没
有适当的政策,但是大约三分之一的非洲国家有改进生物质炊事炉的项目。同时非政府组织和小企业也在
继续推广和市场化节能炉。 炊事和照明:沼气池
估计全球有 1 千 6 百万家庭将家庭规模的设备(所谓的厌氧反应容器)产生的沼气用于照明和炊事。
其中包括中国的 1 千 2 百万家庭,印度的 3 百 70 万,和尼泊尔的 14 万。除去照明和炊事,沼气直接改善
了农村家庭的生活。比如,对尼泊尔沼气效益的分析显示,它使妇女和女孩每天减少了 3 小时的家务劳动
时间,一年每户节约 25 升煤油,3 吨薪柴,农业废物和粪便。[注 39]
在中国,照明和炊事用家庭规模沼气推广很快。一个典型的沼气池容积为 6 到 8 立方米,一年可以产
生 300 立方米的沼气,根据各省的情况,成本为 1500 到 2000 人民币(200~250 美元)。由于沼气是一种
简单的技术,不需要高级的专业人士,因此可由当地小公司负责建造。农民在经过适当的培训后也可自己
建造沼气池生产沼气。一个 2002 年启动的政府项目每年提供 10 亿人民币补贴自建沼气池的农民家庭。补
贴额度为每个沼气池 800 人民币。有人估计每年有 1 百多万个沼气池建成。除了家庭规模的,中国还有几
千个中等和大规模的工业沼气厂。 近的国家沼气行动计划的目的就是增加这种工厂的数量。
在印度,从 20 世纪 80 年代早期开始,非传统能源部一直在推广家庭规模的沼气生产。非传统能源部
给沼气池建造和维护,培训,公众意识培养和技术中心建设等活动提供津贴和资金,并支持当地执行机构。
著名的印度土布和乡村工业委员会也支持沼气生产。
在尼泊尔,SNV/生物质燃气支持项目为家庭规模沼气厂(4~20 立方米,普遍为 6 立方米)提供新技
术,资金,工程和市场开发。通过这个项目,60 个私有沼气公司提高了他们的技术和市场能力,100 个小
规模的信贷机构提供了贷款,采用了质量标准,创建了一个长期的市场促进机构,生物质燃气合作伙伴/
* 与其说改进的生物质能炉是一项可再生能源产品技术,不如说它是一种燃效技术。不过,它明显是一种农村可再生能源利
用的形式,范围广大,效果明显。促进高效炉的政策和项目,不像本报告中其他可再生能源政策一样是可再生能源“促进”
政策,而是一个改善健康、经济和现有可再生能源资源压力的政策。(因此与可持续的森林和土地经营紧密相关。)目前正在
使用的节能炉的数量可能比本报告中的数量少很多,例如,印度的一些评估报告说大多数炉子已经过了使用期,不能用了)

31
尼泊尔。 电能,热能和动能:生物质气化
小规模热生物质气化在一些发展中国家,特别是中国和印度,是一种新兴的商业技术。气化炉产生的
气体可以直接燃烧供热,或者用于内燃机或气体发动机产生电能或动能。在少数中国省份,热气化炉产生
的生物质燃气还可以通过管道网络供炊事使用。 印度 2002 年气化炉的总装机容量约为 35MW,共有 10个制造商生产小规模气化炉和 大 200kW 的配套发动机。在菲律宾,从 20 世纪 80 年代开始,气化炉与
双燃料柴油机结合起来,用于磨米和灌溉。气化炉还在印度尼西亚、泰国和斯里兰卡被示范应用。[注 40]
在印度,包括丝绸和其他纺织品生产和处理中的生物质气化的项目在商业化的基础上被示范应用,商
业化是指本地生产商和短还款期。使用气化炉而不是电的香料(豆蔻)干燥,干燥周期短,产品质量高。
在这种应用中,投资人一个季度就收回了投资。多于 85%的受益人是拥有少于 2 公顷作物的小生产者。用
气化炉的橡胶干燥也说明了其代替传统能源和一年内收回投资的能力。气化器还可以用于在入窑前干燥砖
块,这种应用减少了燃料消耗和产生的烟,在改善工作条件的同时减少了干燥时间(意味着产量增加)。 电力: 村级小型混合电网系统
村级小型混合电网系统能为数十乃至数百家庭服务。 传统上, 小型混合电网多见于偏远地区和海岛,
并由柴油发电器或小水力发电供给动力。在亚洲大部分地区,光伏发电, 风, 或生物质能发电, 通常以组合
的形式,包括电池和/或一台备用柴油发电器, 正在慢慢地代替传统模型。成千上万个主要依赖于小水力发
电的小型混合电网系统存在于中国, 印度、 尼泊尔、 越南和斯里南卡有数以万计的同样系统。中国 2000年前就在使用的风电和光伏发电技术,现在仍在小型混合电网体系中占主要地位。中国的"村镇电气化工
程" 从 2002 到 2004 年间,以光伏发电、 风/光互补系统和小水力发电系统,为大约 250 000 个家庭和一
千个村镇的一百万农村人口提供了电力。 在 2002 到 2004 年间, 几乎 700 个小镇建成大约 30~150 KW 的
村级太阳能电站 (总数大约 20 MW) ,其中一部分使用风光互补系统(大约共计 800 千瓦风能)。在印度, 安装了 550 KW 风光互补系统。其作为另一为村级电网供电的主要途径,为数十个村庄的数千家庭提供电力。
[注 41] 提水: 风能及光伏发电
光伏发电和风能广泛用于提水动力,包括灌溉和饮用。并且有许多项目和投资正在建设之中。经过几十
年的发展,大约一百万机械风力提水机在使用, 主要在阿根廷。大量的风力提水机在非洲使用:南非(300 000)、 纳米比亚(30 000)、 佛得角(800)、 津巴布韦(650)及其它国家(2 000)。全世界现在有超过 50 000 台光伏发电提水机, 大部分在印度。 印度 近在其乡村地区安装了 4 000 台光伏提水机(范围从 200 W 到 2 000 W),这也是印度光伏发电提水机计划(Indian Solar PV Water Pumping Programme)的一部分。估计有
1 000 个太阳能提水机在非洲西部使用。为饮用供水提供太阳能动力的援助工程正在阿根廷、巴西、印度
尼西亚、乔丹、纳米比亚、尼日尔、菲律宾、突尼斯和津巴布韦等国家开展。[注 42]
近年来,面向商业的光伏发电饮用供水(提水和净化)项目的支持者有所增加。比较著名的是在印度、
马尔代夫和菲律宾。在马尔代夫, 一个商业示范项目正在实行,目标是家庭用水的价格达到每公升 0.2~0.5美分,销售量达到 1 000 公升/天。另一个近期的例子是在菲律宾宿务岛:一台 3 千瓦光伏发电提水机为 10个村庄提供经过过滤和氯化的水。1 200 位居民通过预付转账卡购买饮用水,价格大约是每 20 公升 3 PHP

32
(5.5 美分), 或每公升 0.3 美分, 是瓶装水价格的十分之一。水的销售收入被用于支付 10 年的无补贴银行
贷款。该模式可应用于菲律宾的 10 多 个海岛, 为 40 个城市中的 200 000 人口提供饮用水。 电力:户用太阳能光伏系统
截至 2005 年, 发展中国家共有超过 2 百万家庭安装了户用太阳能光伏系统。 近年来,大部分已安装
及新安装的户用系统都在以下几个亚洲国家:印度、斯里南卡、尼泊尔、孟加拉国、泰国和中国。当地民
众支付能力问题由小额信用贷款解决或销售符合当地购买能力的小型系统,另外政府和国际捐赠项目也起
了支持作用。在这些国家中, 每月有成百上千个家庭安装这种系统(根据报告,2005 年在中国每月就有 10 000 个);2004 年一年的总安装量就超过 200 000 套。通过几个捐赠项目,印度尼西亚安装了大约 40 000 个户用太阳能光伏系统,但去年的宏观经济困难挫伤了这种持续成长。除了亚洲地区,肯尼亚、 摩洛哥和
墨西哥也有较大的市场。一些拉美国家也计划推行户用太阳能光伏系统。如果他们的购买力问题能够得到
很好解决(通过政府补贴和/或服务费模式),未来户用系统的增长将主要发生在拉美地区。*[注 43]
在非洲, 因为它的农村电气化程度及国民平均收入都很低,在户用光伏系统的新装数量上没有显著增
长,但有若干国家不在此列。肯尼亚现有 150 000 套户用光伏系统, 占整个非洲几乎一半的安装量, 并且
有市场还在增长。在农村和郊区,符合购买力的小型系统推动了市场的增长。摩洛哥计划在 2010 年以前
安装 150 000 套户用光伏系统。乌干达有一个关于户用光伏系统和其它教育和医疗保健产品的十年计划。 南非已经筹划多年,希望由私营企业通过"服务费"的方式为 200 000 个农村家庭提供户用光伏系统。马里、
坦桑尼亚和塞内加尔等国家,为农村地区使用诸如太阳能光伏等可再生能源户用系统提供有限补贴。但总的
来看,早先的让非洲数百万家庭安装户用光伏系统的愿望并未实现。原因主要在于支付能力问题, 因为一
个典型的低端户用光伏系统的费用相对多数非洲国家居民的平均收入仍然偏高。
户用太阳能光伏系统的私营经销模式已经在五个国家成为市场基石:中国、斯里南卡、印度、孟加拉
国和肯尼亚。 在中国和肯尼亚, 系统几乎完全以现金支付的方式销售。在印度、斯里南卡和孟加拉国, 赊销方式一定程度上解决了支付能力问题,并推动了市场发展。众多新的购买方式涌现出来,如基于非政府
组织的小额融资、经销商信贷和商业银行消费信贷等。 在印度, 伴随着大量的现金购买, 作为商业太阳能
贷款计划的一部分,超过 2 000 个农业银行分支机构为户用光伏系统提供信贷。实际上, 过去五年间,印
度、斯里南卡和孟加拉国通过信贷销售的 120 000 套户用系统也就是全世界所有基于信贷销售的系统。 肯尼亚也有一个非常活跃的私营市场, 有超过 20 个主要的光伏进口和制造企业、上百个农村销售商以及城市
分销商, 他们中的大多数出售一系列品牌的户用系统。 电能及热能的其他生产用途
在农村,现代可再生能源技术日益关注小规模工业、农业、电信、医疗保健和教育等领域的电能及热
能需求。工业应用包括丝绸生产、制砖、 橡胶干燥、工艺品生产、缝纫、焊接和木材加工。 农业和食品
加工应用包括灌溉、食品干燥、磨房、 火炉和烤箱、 制冰、圈养家畜和牛奶冷藏。医疗保健应用包括疫
苗冷藏和照明。沟通应用包括影院、电话、计算机和广播。其它社区应用包括学校、街道照明和饮用水净
化。与这些多种多样的应用潜力相比,现有的项目只是很少的一部分。很大程度上,这些应用在长期的或
商用方面的大规模发展尚未开始。 * 户用太阳能光伏系统不仅包含固定系统,还包含“太阳灯”。印度及一些国家有超过 500 000 家庭使用太阳灯。户用太阳
能系统主要使用节能荧光灯。但低电压 LED 及冷阴极荧光灯的使用也日益增多,它们主要用于低成本太阳灯及某些小功率
户用太阳能系统。

33
用于照明、提水、医疗冷藏和动力等方面的可再生能源供电开始受到广泛关注, 但供热方面的新兴可
再生能源应用仍然很少被谈及或被付诸实践。传统的生物质燃料被用于供热和热能相关应用,譬如炊事、
供暖、农作物烘干、烘烤、农产品加工、窑炉、烤箱和商用食物加工。太阳能发热的应用和先进的生物质
技术正开始受到关注。发展中国家政府也在这些领域投入了更多的注意力。 例如, 印度政府实施了一个综
合计划,用于促进在农村以燃烧,混用和气化等方式使用生物质供热、发电和提供动力。这些农村能源项
目的目标是满足数百农村各种形式的的家庭、社区和生产方面的能源需求。
在健康和教育方面的应用的一个成功例子是世界银行和全球环境基金会合作的乌干达农村改革能源
项目。该项目为医疗设备、职员住所、照明、冷却系统、消毒和电信提供能量, 并且将这些多种多样的应
用展示给卫生部。在教育方面,光伏发电系统为职业训练提供能源设备, 为夜校和职员提供住房照明。 其它应用包括提水和小企业。墨西哥的"telesecundaria" 节目就是另一个成功例子。这个节目的目的是提高农
村学校远程教育节目的水平,而许多遥远的学校依靠光伏发电供给通信设备和其它远程教育设备的动力。 在危地马拉, 洪都拉斯和玻利维亚, 出现了一个为"telecenters" 设计的新形式,把公共服务中心和赢利电话
服务结合了起来。
近年来,通过 UNEP/联合国基金组织在非洲, 巴西, 和中国及其他财政创始国发起的"农村能源企业发
展"项目,中小规模的企业参与可更新能源的相关产品生产的资金来源获得了相当大的关注。这些企业提
供各种各样的服务和产品, 包括太阳家庭系统,提水机, 太阳能作物干燥,用于研磨和碾碎的生物质燃料动
力机械, 太阳能面包店, 生物质能冰砖和药丸, 和其它有收入的用途。在乡村,随着捐赠计划和商业银行贷
款的增加,这样的企业的数量在增长。 农村电气化政策和项目
国家农村电气化政策和项目, 与国际援助项目一起, 使可再生能源作为附属"获得"战略。即,满足那些
需求仍在增长,但却不能纳入中央电网考虑范围的农村人口获得电力的要求。估计全世界 3 亿 6 千万个家
庭仍然缺乏这种获得。 主要电气化选择包括力电力网络引伸, 连接在微型网络的柴油发电机, 连接在微型
网络的可再生能源(太阳, 风, 并且和生物质气化, 有时与柴油结合), 以及家庭规模的可再生能源(户用光
伏系统和小风机) 。通常传统电网接入的费用是高昂的; 在肯尼亚, 例如, 为一个农村家新连接的平均费用
是全国国民平均收入的七倍。[注 44]
许多发展中国家都把兴趣集中在对农村和偏远地区使用可再生源技术供电,作为一个拓展电网的有效
途径。 同时, 越来越认识到, 私人单独投资是不够的,政府补助和政策还应扮演关键角色, 这一点由普遍使
用电力的发展目标和公共要求证明了。“我们在拉丁美洲的所有国家客户告诉我们, 他们意识到他们需要补
贴和管理措施使农村 后 20%用不上电人口用上电, 包括利用可再生能源,"世界银行项目负责人说。
在几个国家,特别在拉丁美洲,农村电气化工程,明确地大规模集中投资在家庭太阳能系统,为一些家
庭提供电能。 政府逐渐发现边远地区不适合接入电网, 并且正在为在这些区域利用可再生能源代替拓展电
网制定明确的政策和补贴。 例如, 巴西计划到 2008 年可由"Luz para Todos"项目向 250 万个家庭供电(大约
700 000 已经供电), 并且计划 200000 户或大约这些家庭的 10% 使用可再生能源。如前面所提, 中国的"村镇电气化工程,"将在 2004 年大部分完成, 为乡村 1 百万居民提供可再生能源作为动力。 印度政府的"边远
乡村电气化工程" 确认了 18 000 个村庄为电气化目标, 部分由可再生能源技术尤其是生物质能气化提供。

34
几个其它拉丁美洲国家 近建立或修改了的新农村电气化项目, 包括玻利维亚, 智利, 危地马拉, 墨西哥, 尼加拉瓜, 还有秘鲁。 大多这些国家把"主流" 可再生能源作为新农村电化的一个标准选择。 例如, 智利 近确定可再生能源为国家农村电气化工程第二个阶段的关键技术。假设这建立了可再生能源用于乡
村电气化的规划,管理者意识到, 法律和管理框架需要尽快健全。的确, 阿根廷, 玻利维亚, 巴西, 智利, 危地马拉还有尼加拉瓜都于 2004 年和 2005 年期间出台了新的法律法规。
在亚洲,明确规定用可再生能源实现农村电气化的国家包括孟加拉国, 中国, 印度, 尼泊尔, 菲律宾, 斯里南卡, 泰国和越南。 部分国家是投资多边协助的项目,同时提供其它技术协助和支持方法。1999 年
菲律宾制定了一个在 2007 年以前实现全部乡村电气化的战略,在那个战略中明确的包括使用可再生能源。 斯里兰卡的目标是 85%人口可获得电力使用,目前已经直接补贴农村户用光伏系统。 2003 年泰国决定在
2005 年底,使还未供电的 300 000 个农村家庭以太阳能为家庭能源系统,到 2004 年这个目标几乎已完成一
半。

35
名词解释 生物质柴油 轿车, 卡车, 公共汽车, 以及其它柴油发动机车的燃料。生物柴油由油籽种子庄稼生产,譬如
大豆, 油菜籽, 芥末, 或者其它植物油来源比如废炊事用油。 沼气池 把动物和植物废物转换成气体,用于照明, 炊事, 加热, 以及发电。 生物质动力和供热 固体生物提供的力量和/或热, 包括林产品废物, 农业残渣和废物, 能源用庄稼, 以及
城市政固体垃圾和工业垃圾有机组分。其中包括沼气产生的动力和过程热。 资本补贴或消费者津贴 一项投资中由政府或公共事业投资所占的资本成本的百分比, 譬如太阳能热水系
统或屋顶太阳能光伏电池系统。 乙醇 由生物质 (典型地有玉米,糖甘蔗, 或麦子) 制成的车用燃料,可能在适当比例的替换普通的汽油(参见汽油-乙醇混合燃料), 或单独用于特殊改造过的机动车。 分类电价 供电商以一个固定的价格把可再生能源电力卖给电网的政策。 或者指定固定的税额,或者给市
场或者成本相关的税指定固定的补贴。或者两项都有。 汽油-乙醇混合燃料 汽油和酒精的混合物, 一般是 10~25%的酒精(所谓的 E10、E25 等)。 地热发电和供热 从地球内部散发的热能, 通常以热水或蒸汽的形式, 可用于发电或直接为建筑、工业以及
农业供热。 吉瓦(GW)/ 吉瓦时(GWh)/ 吉瓦(热)(GWth) 参见兆瓦, 千瓦时, 兆瓦(热)。 绿电购买 居民、商业界、政府或工业界从电力公司(参见"公共绿色电价")或第三方可再生能源发电者(也叫
做"绿色销售")自愿购买绿色电能或者“可再生能源证书”。通过绿电价格或销售等方面的竞争,顾客的电
力需求与同等数量的并网可再生能源电力匹配。绿电证书允许在任何地方生产可再生能源。 投资税减免 允许在可再生能源领域的投资在义务税或者所得税方面部分或全部减免。 千瓦时(kWh) 生产或消耗的电的单位。 常用的零售电价的单位为美分/kWh 。 大水电 水从高处流下产生的电能, 一般是从水坝上。没有区分大小的国际通用界限,上限一般在 2.5MW到 50 MW 之间。10MW 正在成为标准值。 兆瓦(MW) 发电能力的单位。 代表瞬间功率流, 不能与产生的能量混淆(如 MWh, 或兆瓦时) 。 兆瓦(热)(MWth) 热供应能力的单位,用来测量供热厂的潜在产能,比如可能供应建筑或小区。 近
经常用于测量太阳能热水/供暖设备。代表瞬间热流, 不能与产生的热量的单位混淆(即 MWh(th), 或兆瓦
时(热)) 。 现代生物质 生物质应用技术,但不是传统定义上的生物质。如生物质热电联产,生物质气化, 生物质厌氧
沼气池, 以及机动车用液体生物质燃料的生产。 多边代理机构 通常指在全球范围内为发展中国家提供发展、 环境或经济援助的公共机构, 比如世界银行; 或设定国际协定和条约, 比如联合国。 净流量 允许电流在电网和可以自己发电的用户之间双向流动。当瞬间消耗电量超过自产电量时,电流从
电网流向用户(正向),当瞬间自产电流超过消耗电量时,电流从用户流向电网。用户在一个结账周期内
支付净流量的费用,而且可以按月延期。 生产税减免 以该电厂生产的电量为基础,为投资者或者合乎要求的财产的所有者提供年度税收减免。 可再生能源目标 国家为了在远期达到可再造能源发展的某一水平所作的承诺, 计划或目的。某些目标成为
了法律,其他的由管理机构或政府部门制定。可以根据强制程度的不同而采取不同的形式。也叫做“规划
目标”,“发展规划”和“义务”。 可再生能源配额制(RPS)所售电量或者装机容量中可再生能源发电要求占到的 小比例。要求公共事业用
户必须保证达到这个目标,可以是自己发的电,也可以从其他生产者处购电,也可以从第三方直接卖给公
共事业用户。 小/微小/超小/极小水电 (参见大水电) 小水电通常被定义为在 10 兆瓦以下的水电, 微小水电在 1 兆瓦以下,

36
超小在 100 千瓦以下, 极小在 1 千瓦以下。 极小水电一般没有水坝,仅仅靠水流的能量发电。 户用太阳能系统 可为农村家庭提供相当数量的电能而没有联网的屋顶太阳能板、电池、充电控制器等。
一般充电一天可以提供一晚上的照明(使用高效灯)和电视用电。 太阳能热水/供热 可以加热水并储存起来提供生活热水或者取暖的屋顶太阳能采集器。 太阳光伏电池板/组件/电池 把太阳能转换成电能。电池是基本组成部分,包括在板和组件中。 可交易可再生能源证书 每个证书代表通过认证的一个单位的可再生能源产生的电量(一般是一个兆瓦
时)。证书允许在用户和/或生产者之间交易使用可再生能源的义务。在一些地方的市场上,比如说美国,
允许任何人单独购买包含可再生能源电力的“绿点”。 传统生物质 未加工的生物质,包括农业废物、林产品废物、收集的薪材以及动物粪便。通过燃烧为炊事、
取暖、农业和工业加工提供热能, 一般在农村地区。 绿电上网电价 电力公司以不同价格为其顾客提供不同比例的可再生能源电力,并且保证自产或购买满足
所有顾客所需的绿电。

37
RENEWABLES 2005 GLOBAL STATUS REPORT
Notes and References Companion Document
October 20, 2005 Version
Companion to the main report: www.ren21.net/globalstatusreport
NOTES
N1. Coverage of Report and General Notes.................................................................................................39
N2. Primary Energy from Renewable Energy.............................................................................................39
Table N2. Relative Energy Contribution of Different Forms of Renewable Energy, 2004
N3. Added and Existing Capacities and Growth Rates...............................................................................41
Table N3. Renewable Energy Capacities and Installations, 2004
N4. Electric Power Capacities .......................................................................................................................44
Table N4. New Renewable Electric Power Capacity, GW existing as of 2004
N5. Large Hydropower Capacity and Growth Rate ...................................................................................45
N6. Wind, Geothermal, Biomass Power .......................................................................................................46
Table N6. Added and Existing Wind Power, Top 10 Countries, 2004
N7. Grid-Connected Solar PV.......................................................................................................................47
Table N7. Grid-Connected Solar Rooftop Programs, 2004
N8. Solar Hot Water/Heating ........................................................................................................................49
Table N8a: Solar Hot Water Installed Per-Capita, Top 10 Countries, 2004
Table N8b: Solar Hot Water Installed Capacity, Top 10 Countries/EU and World Total, 2004
N9. Ethanol and Biodiesel..............................................................................................................................51
Table N9. Biofuels Production, Top 12 Countries, 2004
N10. Ethanol in Brazil....................................................................................................................................52
N11. Renewable Energy Cost Comparisons.................................................................................................53
Table N11a. Power Generation Costs, 2002 and Projections for 2010
Table N11b. Costs of Renewable Energy Compared with Fossil Fuels and Nuclear Power
N12. Global Investment in Renewable Energy ............................................................................................54
N13. Private Financing and Venture Capital ...............................................................................................57
N14. Public Financing ....................................................................................................................................57
N15. Multilateral and Bilateral Financing for Developing Countries .......................................................57
Table N15. Overseas Development Assistance for Renewable Energy, 1999-2003
N15b. Bonn Action Program in International Context ...............................................................................59
N16. R&D Spending and Subsidies...............................................................................................................60
N17. Market Capitalization and Top 60 Publicly-Traded Companies.......................................................62
N18. Wind Power Industry and Costs ..........................................................................................................64
N19. Solar PV Costs, Industry, and Production Capacity Expansion .......................................................65
Table N19. Solar PV Production Capacity Expansion
N20. Biomass...................................................................................................................................................68
N21. Geothermal.............................................................................................................................................69
N22. Biofuels ...................................................................................................................................................69
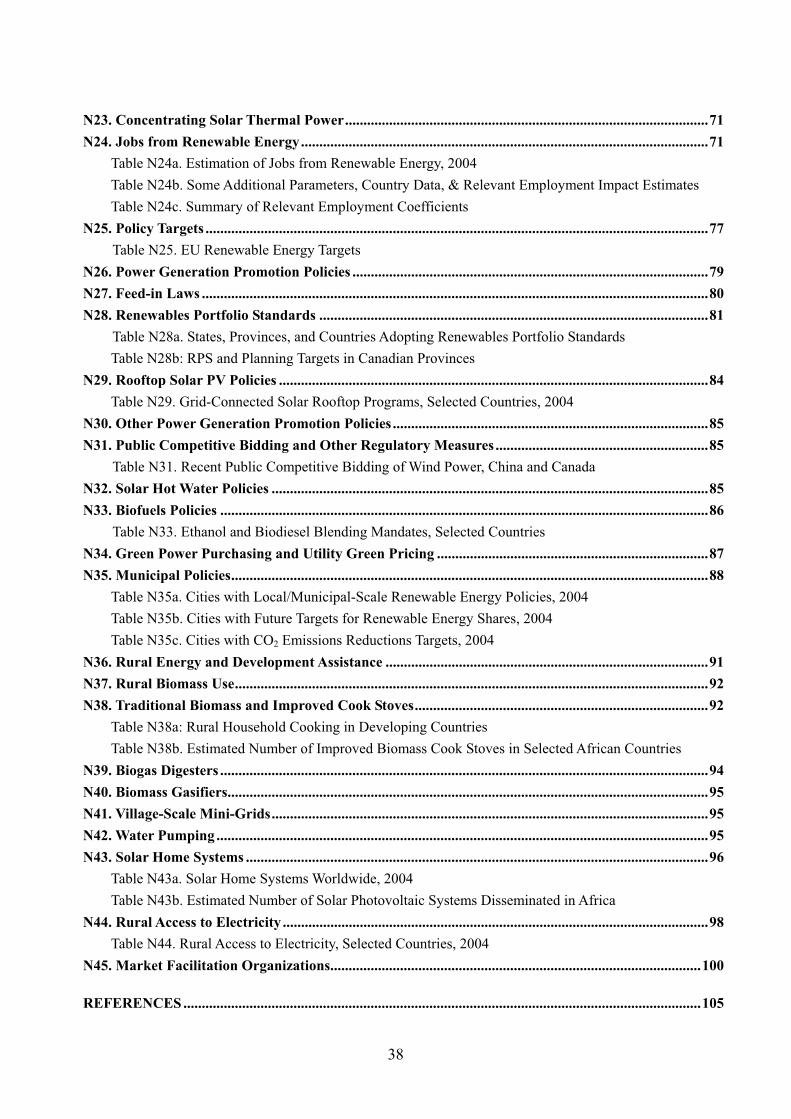
38
N23. Concentrating Solar Thermal Power...................................................................................................71
N24. Jobs from Renewable Energy...............................................................................................................71
Table N24a. Estimation of Jobs from Renewable Energy, 2004
Table N24b. Some Additional Parameters, Country Data, & Relevant Employment Impact Estimates
Table N24c. Summary of Relevant Employment Coefficients
N25. Policy Targets .........................................................................................................................................77
Table N25. EU Renewable Energy Targets
N26. Power Generation Promotion Policies .................................................................................................79
N27. Feed-in Laws ..........................................................................................................................................80
N28. Renewables Portfolio Standards ..........................................................................................................81
Table N28a. States, Provinces, and Countries Adopting Renewables Portfolio Standards
Table N28b: RPS and Planning Targets in Canadian Provinces
N29. Rooftop Solar PV Policies .....................................................................................................................84
Table N29. Grid-Connected Solar Rooftop Programs, Selected Countries, 2004
N30. Other Power Generation Promotion Policies ......................................................................................85
N31. Public Competitive Bidding and Other Regulatory Measures ..........................................................85
Table N31. Recent Public Competitive Bidding of Wind Power, China and Canada
N32. Solar Hot Water Policies .......................................................................................................................85
N33. Biofuels Policies .....................................................................................................................................86
Table N33. Ethanol and Biodiesel Blending Mandates, Selected Countries
N34. Green Power Purchasing and Utility Green Pricing ..........................................................................87
N35. Municipal Policies..................................................................................................................................88
Table N35a. Cities with Local/Municipal-Scale Renewable Energy Policies, 2004
Table N35b. Cities with Future Targets for Renewable Energy Shares, 2004
Table N35c. Cities with CO2 Emissions Reductions Targets, 2004
N36. Rural Energy and Development Assistance ........................................................................................91
N37. Rural Biomass Use.................................................................................................................................92
N38. Traditional Biomass and Improved Cook Stoves................................................................................92
Table N38a: Rural Household Cooking in Developing Countries
Table N38b. Estimated Number of Improved Biomass Cook Stoves in Selected African Countries
N39. Biogas Digesters .....................................................................................................................................94
N40. Biomass Gasifiers...................................................................................................................................95
N41. Village-Scale Mini-Grids.......................................................................................................................95
N42. Water Pumping ......................................................................................................................................95
N43. Solar Home Systems ..............................................................................................................................96
Table N43a. Solar Home Systems Worldwide, 2004
Table N43b. Estimated Number of Solar Photovoltaic Systems Disseminated in Africa
N44. Rural Access to Electricity ....................................................................................................................98
Table N44. Rural Access to Electricity, Selected Countries, 2004
N45. Market Facilitation Organizations.....................................................................................................100
REFERENCES .............................................................................................................................................105

39
[N1] Coverage of Report and General Notes
Most figures of global capacity, growth, and investment are not exact, but rather approximate to two significant
digits at most (i.e., 630 but not 632; 1,300 but not 1,350, etc.). Sometimes only one-and-half significant digits
may apply; for example, a number could be given as 15 rather than 10 or 20, but 17 would be too precise based
on the data available and assumptions made.
This report generally covers those technologies with high technology maturity and either high or low levels of
market maturity. These categories follow an analysis by Navigant Consulting, which groups renewable power
generation technologies into three categories: 1.High technology maturity and high market maturity: small
hydro, biomass direct combustion, landfill gas, geothermal, and on-shore wind (just emerging into high market
maturity); 2.High technology maturity but low market maturity: biomass co-firing, crystalline silicon PV,
waste-to-energy (combustion), anaerobic digester biogas, parabolic trough solar thermal power (just emerging
into high technology maturity), and offshore wind (just emerging into high technology maturity); 3. Low
technology maturity and low market maturity (technologies to watch): tidal barrage, thin-film PV, concentrating
PV, biomass integrated gasification combined-cycle (BIG/GT), dish stirling, wave power, solar thermal power
tower, biomass pyrolysis, tidal current OTEC, and nano solar cells.
This report does not cover policies and activities related to technology transfer, capacity building, carbon
finance, and CDM projects. Hopefully subsequent editions, if published, could cover these topics.
For a general treatment of market, policies, and barriers to renewable energy, see IEA 2004b; EREC 2004;
Beck & Martinot 2004; Komar 2004; Fulton et al. 2004; UNDP et al. 2000; Goldemberg & Johansson 2004;
Johansson & Turkenburg 2004; Sawin & Flavin 2004; and Sawin 2004.
[N2] Primary Energy from Renewable Energy
Table N2 shows the relative energy contributions from new renewables, large hydro, and traditional rural
biomass. The primary energy attributed to electricity supply is adjusted to reflect fossil fuel energy required to
produce an equivalent about of electricity. This type of adjustment is made in some but not all published global
energy statistics. The best example is BP’s annual Statistical Review of World Energy. In BP statistics, “the
primary energy value of hydroelectricity generation has been derived by calculating the equivalent amount of
fossil fuel required to generate the same volume of electricity in a thermal power station, assuming a
conversion efficiency of 38% (the average for OECD thermal power generation)” (BP 2005). BP gives
hydropower as 634 Mtoe in 2004, or 6.2% of global primary commercial energy. Other statistics not using this
methodology will give hydropower as 2.4% of global primary commercial energy, so there will be significant
discrepancies between numbers here and some other published numbers. In addition, this correction makes total
primary energy higher, with BP’s number of 10,224 Mtoe commercial primary energy in 2004 higher than
some other published figures.

40
Traditional biomass was given as 1,035 Mtoe for 1999 from World Resources 2002-2004, Table 8 (UNDP et al.
2002). Assuming 2% growth per year in traditional biomass use gives 1,140 Mtoe for 2004. This reflects
population growth minus fuel switching minus more efficient use of resources. There are no definitive sources
of information on traditional biomass use, and a fairly wide range of estimates can be found, reflecting the
plausible range of assumptions, methodologies, and data quality. Traditional biomass fuels are commonly
estimated in the literature at 9-10% of global primary energy (see Goldemberg & Johansson 2004; Kartha et al.
2004). The typical range in the literature for traditional biomass is 28-48 EJ. The WRI estimate of 1,035 Mtoe
for 1999 is 43 EJ, which is at the higher end of the range. Goldemberg & Johansson 2004 give 950 Mtoe for
2001 (Figure 5), which is 40 EJ. Applying 2% growth from 2001 to 2004 would give 1,010 Mtoe in 2004,
which is the figure assumed for purposes of this report. There is no consensus on how fast traditional biomass
use is growing. Traditional biomass users should grow at the rate of growth of rural populations in developing
countries, except for those countries where adoption of modern fuels in rural areas is becoming more
widespread. Growth of biomass fuel use will be related, but not the same.
So total world primary energy in 2004 was 10,224 Mtoe (commercial) + 1,010 Mtoe (traditional) = 11,234
Mtoe. Renewables share of 1,876 Mtoe is 16.7%. (1 Mtoe = 41.9 PJ).
Electricity production from renewables in Table N2 is calculated from capacity figures in Table N2 by scaling
energy production figures provided in Table 4 of Johansson & Turkenburg 2004, which gives 2001 figures of
2600 TWh large hydro from 690 GW, 43 TWh wind from 23 GWe, 170 TWh biomass electricity from 40 GWe,
730 TWh biomass heat from 210 GWth, 53 TWh geothermal from 8 GW, 55 TWh geothermal heat from 16
GWth, 57 TWh solar hot water from 95 million m2, 450 PJ ethanol from 19 billion liters/year, and 45 PJ from
1.2 billion liters/year. Thus, average capacity factors in 2004 are assumed similar to those implied by Johansson
& Turkenburg for 2001.
Energy content of avoided fossil fuels for Table N2 assumes global average power generation efficiency from
fossil fuels of 36% (BP’s Statistical Review of World Energy uses 38% as the average for OECD thermal power
generation in their primary energy conversion, but developing countries will be less). Energy content of
avoided fossil fuels assumed to be parity for biofuels and hot water/heating.
BP (2005) shows 17,450 TWh of electricity produced worldwide in 2004. Large hydro, at 2,800 TWh, is 16.0%.
Renewables, at 540 TWh, are 3.1%. World electricity production in 1994 was 12,850 TWh and large hydro was
2,380 TWh, so the share of large hydro in 1994 was 18.5%.
IAEA (2005) gives electricity production from nuclear power at 2,619 TWh in 2004. The estimated 550 TWh
from renewables (excluding large hydro) in 2004 (see Table N2) is 21% of this figure.

41
Table N2. Relative Energy Contribution of Different Forms of Renewable Energy, 2004
Primary energy supply based on
direct energy output
natural units Mtoe
Adjusted energy supply
based on energy content
of avoided fossil fuels
(Mtoe)
Share of total
renewable energy
supply
Power generation
Biomass power 150 TWh 12.9 35.8
Wind power 95 TWh 8.2 22.7
Small hydro 240 TWh 20.6 57.3
Geothermal power 60 TWh 5.2 14.3
Total 130 6.9%
Hot water/heating
Solar hot water 290 PJ 6.9
Geothermal heat 200 PJ 4.8
Biomass heat 2,600 PJ 62.1
Total 73.7 73.7 3.9%
Biofuels
Ethanol 700 PJ 16.7
Biodiesel 80 PJ 1.9
Total 18.6 18.6 1.0%
Other renewables
Traditional biomass 1,010 1,010 53.8%
Large hydro power 2,700 TWh 232 644 34.3%
Total
Total 1,876 100%
[N3] Added and Existing Capacities and Growth Rates
Table N3 presents installed capacities, added capacities, and growth rates of renewable energy. Growth rates are
author’s estimates based on compilations of global installed capacity figures for all renewable technologies
from 1995 to 2004. According to compiled figures, grid-connected solar PV grew from 190 MW in 1999 to
1,760 MW in 2004, and 630 MW were added in 2004 (adapted from Maycock 2003, 2004, 2005a). Off-grid
solar grew from 990 MW to 2,200 MW (same). Wind power grew from 13.5 GW to 48 GW (GWEC 2005 and
BTM Consult 2005). Ethanol grew from 18.8 billion liters to 31 billion liters (author’s spreadsheet based on
Lichts 2005 and other data). Biodiesel grew from 0.7 billion liters/year to 2.3 billion liters/year (same).
Geothermal power grew from 8.0 GW in 2000 to 8.9 GW in 2005 (Lund 2005a). Geothermal heat grew from
15.2 GWth in 2000 to 27.8 GWth in 2005 (same). The average growth rate for the five-year period 2000-2004
is calculated as the average compound rate for each of the five years, using end-1999 data and end-2004 data.

42
The table is compiled from author’s database of country-by-country capacities and installations by year,
including data from individual country statistics and submissions from report contributors, also AWEA 2005 ;
EWEA 2005a; GWEC 2005; EREC 2004; Maycock 2004 and 2005a; Fulton 2004 plus updates; Lichts 2005;
Weiss et al. 2005; ESTIF 2005; Johansson & Turkenburg 2004; Martinot et al. 2002 plus updates; Martinot
2004a; Karekezi et al. 2004; IEA 2004a; IEA 2004c; Graham 2001; TERI 2001; D’Sa & Murthy 2004;
Goldemberg and Johansson 2004; World Geothermal Council 2005; and Lund 2005a and 2005b.
Table N3. Renewable Energy Capacities and Installations, 2004
Added
during
2004
Existing at
end of 2004
Growth rate of
existing in
2004
Average
growth rate
2000-2004
Power generation
Large hydro power --- 740 GW --- 2%
Wind turbines 8.1 GW 48 GW 20% 29%
Small hydro power 4.5 GW 61 GW 8% 7%
Biomass power --- 39 GW --- 3%
(GW) 0.63 GW 1.8 GW 54% 61%Solar PV, grid-connected
(homes) 150,000 400,000 --- ---
Solar PV, off-grid 0.33 GW 2.2 GW 17% 17%
Geothermal power --- 8.9 GW --- 2.4%
Solar thermal power --- 0.4 GW --- ---
Ocean (tidal) power --- 0.3 GW --- ---
Hot water/space heating
Biomass heating --- 220 GWth --- 2%
(GWth) 12 GWth 77 GWth --- ---
(m2) 17 mil m2 110mil m2 17% 17%
Solar collectors for hot
water and space
heating, glazed (homes) 6.5 million 39 million --- ---
Geothermal heating --- 28 GWth --- 13%
Transport fuels
Ethanol production 2.3 billion
liters/year
31 billion
liters/yr
8% 11%
Biodiesel production 0.4 billion
liters/year
2.2 billion
liters/yr
26% 25%
Rural household energy
(total, all types) --- 570 million --- ---Biomass
cooking
stoves in use
(“improved” types) --- 220 million --- ---
Household-scale biogas digesters in use --- 16 million --- ---
Household-scale solar PV systems in
use
0.3 million 2 million --- ---

43
Notes:
(a) PV existing capacity is based on cumulative production since 1990, neglecting retirements.
(b) Number of homes for solar hot water collectors estimated based on 2.5 m2/home average for developing
countries and 4 m2/home for developed countries, neglecting commercial use. Li (2002) suggests closer to 2 m2
in China, the largest market, so the actual number of homes is probably higher than the figures in the table.
(c) Total number of biomass cooking stoves is estimated based on assuming 4.4 persons per household and 2.4
billion people still using traditional biomass. Improved biomass cooking stoves based on Martinot et al. 2002
with updates from Karekezi et al. 2004, IEA 2002a, Graham 2001, TERI 2001, and D’Sa & Murthy 2004, but
still reflect figures that are at least a few years old.
(d) Biomass power-generation capacity figures do not include electricity from municipal solid waste (MSW).
Many sources include MSW in biomass figures, although there is no universally accepted definition. If MSW
were to be included in the numbers in this table, biomass power generation might increase from 36 GW to
43-45 GW. OECD power generation from MSW was 6.7 GW in 2002 (IEA 2005a). Developing country
numbers for MSW are difficult to estimate.
(e) Growth rates for biomass heating and large hydro are taken from Johansson & Turkenburg 2004 and reflect
growth rates for the period 1997-2001. More recent worldwide growth rates are not available. The average
annual capacity increase for all hydro in OECD countries was 1.2% from 1990-2002 (IEA 2004a).
(f) Geothermal heat figures include shallow geothermal energy and geothermal heat pumps.
(g) “---” means data not available or not reliable enough to state.
(h) Total installation of solar PV in 2004 was reported by Maycock (2005b) as 960 MW compared to total solar
PV production of 1,100 MW.
(i) The “hot water/heating” category includes solar hot water, solar space heating, and solar cooling in
residential, commercial, and industrial applications. The number of homes shown in the table assumes that a
high proportion of installed capacity is for residential solar hot water systems. Active solar space heating is
provided by a significant share of installations in some countries, although not in China, which is now
two-thirds of the global market. Technically, this category is called “Solar Heating and Cooling” by the
International Energy Agency, but this report uses the terminology “solar hot water/heating.”
(j) Geothermal power capacity has grown by an average of 2.4% from 2000-2004. Geothermal heating capacity
has grown by an average of 12.9% from 2000-2004 (World Geothermal Council 2005 and Lund 2005a.
(k) Solar hot water household estimation: 2.4 m2/system in China (70% of systems sold are small 2 m2 size)
and 3.8 m2/system in rest of world. So 13.5 million in China equals 5.6 million homes, and 3.5 millon m2
elsewhere equals 0.9 million homes. 64 million m2 in China equals 26.7 million homes, and 46 million m2
elsewhere equals 12.1 million homes.
(l) SHW growth rate for 2004 is net, based on annual additions minus retirements.
(m) Solar PV for off-grid includes residential, commercial, signal, and communications, and consumer products.
In 2004 globally, there were 70 MW used for consumer products, 80 MW used for signal and communications,
and 180 MW used for residential and commercial off-grid applications (Maycock 2005a).
(n) Where 2004 data are not available, 2004 numbers are determined based on assumed growth rates from
year(s) of last reported data and considering differing or conflicting data from multiple sources.
(o) Solar PV is separated into grid-connected and off-grid to reflect the different market characteristics of each
application, such as costs relative to competing alternatives and types of policy support.

44
(p) Lund (2005) reports 1.7 million geothermal heat pumps with 56% of total geothermal heat capacity (27,600
GWth). But he notes the data are incomplete. Geothermal heat pumps grew by 24% per year from 2000-2005,
a tripling of capacity in five years.
[N4] Electric Power Capacities
Table N4 presents installed electric power capacities. The table is based on author’s database compiled from
individual country statistics and submissions from report contributors, also IEA 2003a, 2004b; IEA 2004c;
EREC 2004; AWEA 2005; EWEA 2005; GWEC 2005; Maycock 2004 and 2005a; Johansson & Turkenburg
2004; Martinot et al. 2002 plus updates; Martinot 2004a. Many figures in the table are approximate, valid at
best to two significant figures. These sources also provide information for much of the capacity discussion of
Section 1.
Small hydro totals reflect reported small hydro, generally according to a definition of 10 MW, but higher in
some countries such as China, which officially defines small hydro as less than 50 MW.
Municipal solid waste is commonly reported in biomass power generation statistics for OECD countries.
However, municipal solid waste is not included in the biomass power generation capacity figures here because
equivalent statistics from developing countries are not available and because municipal solid waste is not
considered a form of renewable energy by some. There was 6.7 GW of municipal solid waste in OECD
countries in 2002 (IEA 2004a), so including this figure increases world total biomass power capacity to 46 GW.
Table N4. New Renewable Electric Power Capacity, GW existing as of 2004
Technology
World
Total
Developing
Countries EU-25 China Germany U.S. Spain Japan
Small hydropower 61 39 13 34 1.6 3.0 1.6 3.5
Wind power 48 4.3 34.2 0.8 16.6 6.7 8.3 0.9
Biomass power 39 22 8 2.3 0.9 7.2 0.3 > 0.1
Geothermal power 8.9 4.5 0.8 < 0.1 0 2.5 0 0.5
Solar photovoltaic-grid 1.8 0 0.9 0 0.7 0.1 0 0.8
Solar thermal electric 0.4 0 0 0 0 0.4 0 0
Ocean (tidal) power 0.3 0 0.3 0 0 0 0 0
Total renewable power
capacity (excluding
large hydro)
160 70 57 37 20 20 10 6
For comparison:
Large hydropower 740 330 90 70 n/a 90 n/a 45
Total electric power
capacity
3,800 1,400 580 440 n/a 860 n/a 260

45
Notes:
(a) There is no international consensus on the definition of small hydropower (SHP). In China, it officially
refers to capacities of up to 50 MW, in India up to 15 MW, and in Brazil up to 30 MW. In Europe, capacity of
up to 10 MW total is becoming generally accepted by ESHA (European Small Hydropower Association) and
the European Commission. Many published figures for small hydropower apply a definition of 10 MW
maximum, which tends to exclude capacity from China, Brazil, and some other countries. Thus other published
figures can be substantially smaller than the figures presented here, which represent data according to each
country’s definition.
(b) Grid-connected solar PV exists in small quantities of a few MW in some other countries, primarily as small
demonstration projects. Zero is given in the table because these numbers are much smaller than 0.1 GW, thus
not significant enough to register.
(c) Comparison of “new” renewable power capacity to total electric power capacity does not provide a good
comparison of actual energy produced. Capacity factors for conventional electric power generation are much
higher than for most “new” renewable energy sources. So even though global “new” renewable capacity is
roughly 4% of the world total capacity, electricity produced from renewables is about 2% of world total
electricity production.
(d) These figures should not be compared with previous versions of this table or similar tables to get growth
rates. Adjustments from previous versions are a combination of real growth plus adjustment due to improved
data.
[N5] Large Hydropower Capacity and Growth Rate
IEA (2004c) shows OECD hydro was 393.8 GW in 1999 and increased to 407.9 GW in 2002, for a 1.2% annual
growth rate for the three-year period 2000-2002, or an average of 4.7 GW per year. China’s large hydro
capacity has been increasing by 6-8 GW per year in recent years. (China installed 7.6 GW of large hydro
capacity in 2004, according to Water Conservation Information Network (www.hwcc.gov.cn). China’s total
hydro capacity went from 53 GW in 1999 to 105 GW in 2004, with 14 GW of the increase being small hydro.
So large hydro increased by 38 GW, or 7.5 GW per year average during the five-year period 2000-2004.) Other
developing countries probably represent another 3-5 GW per year, for total capacity additions of probably
14-16 GW per year. Thus, given the current installed large hydro capacity of 760 GW, the global average
growth rate is on the order of 2%.
US EIA International Energy Annual 2003 (EIA 2005a) gives world total of 15,852 TWh of electric power
generation in 2003, including 2,654 TWh from all hydro. Allowing for 3% annual growth in 2004 (2% for
hydro) results in 16,328 TWh total and 2,707 TWh for all hydro in 2004. Subtracting 160 TWh of small hydro
from this (assuming a third of small hydro doesn’t appear in global statistics), gives 2,540 TWh large hydro in
2004. EIA gives 2,461 TWh hydro in 1995 and 12,634 GWh total generation. Total hydro is thus 16.6% of
global total for 2004 and 19.5% in 1995. Subtracting small hydro, large hydro alone is roughly 16% in 2004
and 19% in 1995.

46
Altinbilek et al. 2004 gives 730 GW and 2,650 GWh of hydro worldwide based on a 2003 source, so this
number is presumed to be 2002 data. This is consistent with an IEA (2004b) figure of 2,676 TWh of hydro in
2002. Given the other sources, this number appears correct for large hydro, excluding all (or most) of small
hydro. Allowing a 2% growth rate in 2003 and 2004 gives 760 GW in 2004.
Hydropower production statistics for 2004 from BP (2005).
There is a basic conflict between hydro statistics reported by the International Hydropower Association and
World Energy Council, and those from the International Energy Agency. IHA and WEC statistics suggest total
hydro worldwide was around 750 GW in 2004. The IEA shows hydro in OECD at 425 GW in 2002, which
when added to reported small and large hydro in developing countries from several sources yields a total in the
range of 800-820 GW allowing for modest growth since 2000 (most other data are for 1999-2000). It is
believed that the former set of statistics misses some installed capacity due to reporting channels used. This
report places more credibility in the later set of figures, with a total of 800 GW hydro, 740 GW large hydro, and
60 GW small hydro.
[N6] Wind, Geothermal, Biomass Power
Table N6 shows added and existing wind power. There is some variation of statistics depending on source, with
data from the Global Wind Energy Council (2005) and BTM Consult (Cameron 2005) differing by about 200
MW world total added in 2004 and also in cumulative existing capacity (EWEA cites GWEC data of 47,317
MW total installed at end of 2004). Other sources include the AWEA (2005) and EWEA (2005a).
Offshore wind power 0.6 GW installed comes from New Energy Finance, www.newenergyfinance.com, as
reported in RenewableEnergyAccess.com, “Blustery Conditions for European Wind Power
New Energy Finance White Paper Outlines Difficulties in European Wind Power Market,” 22 July 2005.
www.newenergyfinance.com/NEF/HTML/Press/Offshore-wind-funding.pdf and
www.renewableenergyaccess.com/rea/news/story?id=34645. (Note: China is also beginning to develop
off-shore wind, with plans for the first wind farm off-shore of Shanghai in 2006.)
Information on biomass power and heat from IEA (2004b), Kartha et al. (2004), and submissions from report
contributors. Also IEA 2005c.
Information on geothermal power and heat from Lund (2005a and 2005b). Information on biomass power
generation is the most difficult to develop and generally relies on more informal data collection from in-country
sources. In reporting on geothermal heating, Lund notes: “the world direct utilization of geothermal energy is
difficult to determine; as, there are many diverse uses of the energy and these are sometimes small and located
in remote areas. Finding someone, or even a group of people in a country who are knowledgeable on all the
direct uses is difficult. In addition, even if the use can be determined, the flow rates and temperatures are
usually not known or reported; thus, the capacity and energy use can only be estimated. This is especially true
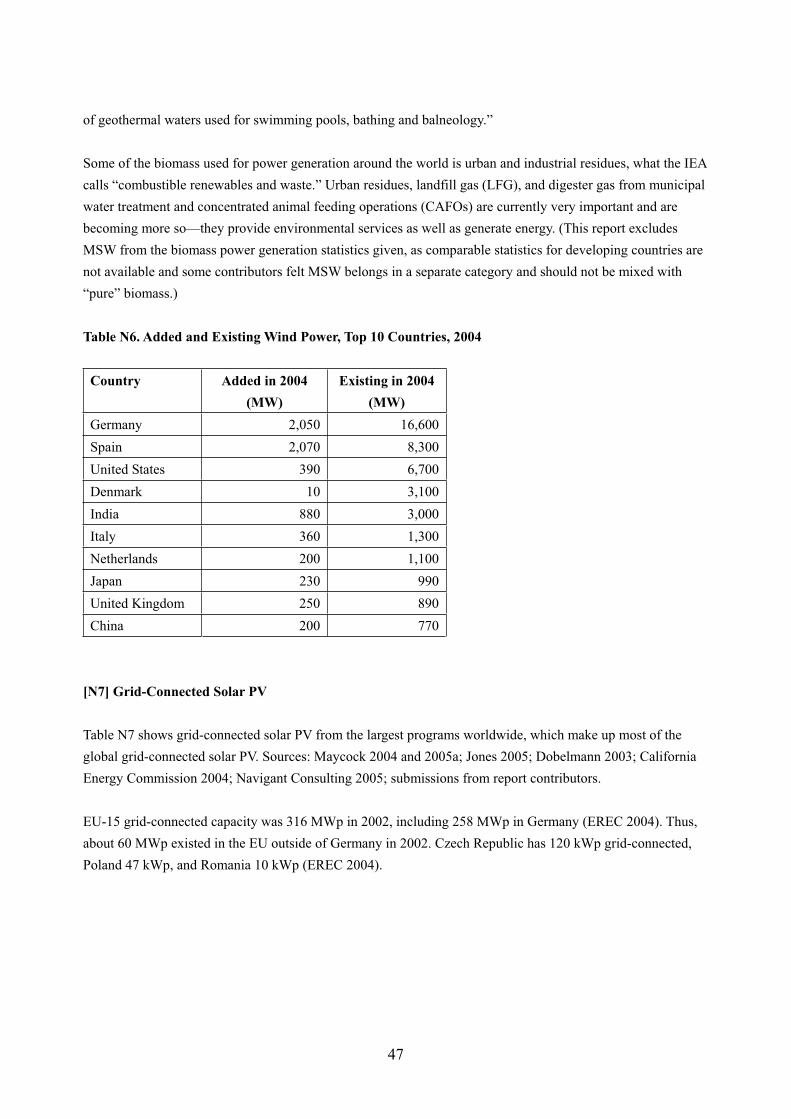
47
of geothermal waters used for swimming pools, bathing and balneology.”
Some of the biomass used for power generation around the world is urban and industrial residues, what the IEA
calls “combustible renewables and waste.” Urban residues, landfill gas (LFG), and digester gas from municipal
water treatment and concentrated animal feeding operations (CAFOs) are currently very important and are
becoming more so—they provide environmental services as well as generate energy. (This report excludes
MSW from the biomass power generation statistics given, as comparable statistics for developing countries are
not available and some contributors felt MSW belongs in a separate category and should not be mixed with
“pure” biomass.)
Table N6. Added and Existing Wind Power, Top 10 Countries, 2004
Country Added in 2004
(MW)
Existing in 2004
(MW)
Germany 2,050 16,600
Spain 2,070 8,300
United States 390 6,700
Denmark 10 3,100
India 880 3,000
Italy 360 1,300
Netherlands 200 1,100
Japan 230 990
United Kingdom 250 890
China 200 770
[N7] Grid-Connected Solar PV
Table N7 shows grid-connected solar PV from the largest programs worldwide, which make up most of the
global grid-connected solar PV. Sources: Maycock 2004 and 2005a; Jones 2005; Dobelmann 2003; California
Energy Commission 2004; Navigant Consulting 2005; submissions from report contributors.
EU-15 grid-connected capacity was 316 MWp in 2002, including 258 MWp in Germany (EREC 2004). Thus,
about 60 MWp existed in the EU outside of Germany in 2002. Czech Republic has 120 kWp grid-connected,
Poland 47 kWp, and Romania 10 kWp (EREC 2004).

48
Table N7. Grid-Connected Solar Rooftop Programs, 2004
Program
and start
year
Cumulative
homes
as of 2004
Cumulative
installations
as of 2004
Installations
added in
2003
Installations
added in
2004
Supporting policies
Japan
(1994-2005)
200,000 800 MWp 190 MWp 260 MWp “Sunshine program” capital
subsidy started at 50% in 1994,
declining to about 10% by
2003.
Germany
(1999-2003)
150,000 680 MWp 140 MWp 300 MWp “100,000 roofs program”
provided low-interest loans for
households and 50 eurocents
per kWh feed-in tariff through
2003. Since 2004, market
supported by feed-in tariffs of
45-62 eurocents/kWh.
California
programs
(1998-)
15,000 95 MWp 27 MWp 36 MWp State program capital subsidy
of $4.50/W(AC) declined to
$3.50/W(AC). There are also
municipal utility (SMUD,
LADWP) and utility RPS
programs.
Notes:
(a) California reports total number of installations, which includes both residential and commercial, but the
number of residential installations is assumed to be much higher than the number of commercial installations.
The number of homes reported is consistent with an average of 4 kW/home and residential being more than
half of total installed capacity in 2004.
(b) Assumption of 4 kW/home for new 2004 installations in Japan and Germany. Cumulative homes for 2003
estimated at 170,000 in Japan and 65,000 in Germany based on prior reports of homes and capacity.
(c) On-grid solar PV capacity in Europe was 480 MWp in 2003, of which 375 MW was in Germany. The
Netherlands was the major contributor, with 44 MW in 2003. So additional on-grid capacity in Europe in 2004,
besides Germany, was probably about 110 MW.
(d) Korea in 2005 announced a 100,000 rooftop program targeting 0.3 GW of solar PV by 2011.
(e) Thailand has had a small rooftop solar PV program. As of July 2004, 67 kWp were installed, subsidized by
EPPO.
(f) Japan’s program was due to end in 2005. In 2004, Japan had 1,100 MWp of installed PV, 800 MWp for
homes and 300 MWp for commercial and public buildings and other uses (not clear what fraction is
grid-connected).

49
[N8] Solar Hot Water/Heating
Table N8a: Solar Hot Water Installed Per-Capita, Top 10 Countries, 2004
Country Installations
(m2/1000 inhabitants)
Israel 740
Cyprus 620
Greece 260
Austria 260
Turkey 140
Japan 100
Australia 70
Germany 70
Denmark 60
China 50
Note: This table excludes Barbados and other small island nations with population less than 500,000. Barbados
has 277,000 inhabitants and at least 35,000 SWH systems. The indicator would be around 250 m2/1,000
inhabitants and this means Barbados would rank 5 of the top 10.
Source: Weiss et al. 2005; Li 2002 and 2005; ESTIF 2004 and 2005; Martinot 2004a; Karekezi & Kithyoma
2005; submissions from report contributors.
Table N8b: Solar Hot Water Installed Capacity, Top 10 Countries/EU and World Total, 2004
Country/EU Existing 2003
(million m2)
Additions 2004
(million m2)
Existing 2004
(million m2)
Existing 2004
(GWth)
China 50.8 13.5 64.3 45.0
EU 13.1 1.6 14.0 9.8
Turkey 9.5 0.8 9.8 6.9
Japan 7.9 0.3 7.7 5.4
Israel 4.7 0.4 4.9 3.4
Brazil 2.2 0.2 2.4 1.6
United States 2.1 0.05 2.0 1.4
Australia 1.4 0.1 1.5 1.1
India 0.9 0.1 1.0 0.7
South Africa 0.5 -- 0.5 0.4
(other countries) < 2 -- < 2 < 1.5
World Total 95 17 110 77
Notes:
(a) Figures exclude passive (swimming pool) heating, which is considered a separate application from domestic
hot water and space heating.

50
(b) Retirements are difficult to estimate for some countries, so all figures are approximate. The totals here
reflect 2 million m2 of retirements in 2004, not including China.
(c) The International Energy Agency's Solar Heating and Cooling Program (IEA-SHC) recommended in
December 2004 that SHW be reported in GWth (gigawatt thermies), with a standard conversion factor of 0.7
GWth per million m2.
(d) Additions for 2004 and existing 2004 for Turkey, Israel, United States, Australia, India, and Egypt are
extrapolations based on actual 2003 installations. A 5% retirement rate of existing stock is assumed in the
extrapolation. The resulting global total checks against estimates of 2004 by Weiss et al. 2005.
(e) Modeling retirements in Japan is a complicating factor in both Japanese and global totals, as retirements
have been high relative to new installations for the past several years. Weiss et al. 2005 have a total about 4.5
million m2 higher than the figure used here for Japan in 2003, but the lower number used here is based on
another model of retirements by Japanese researchers consulted for this report (also see the reference: Solar
System Development Association website, www.ssda.or.jp/index.php). The global total of 110 million m2 (77
GWth) would be 115 million m2 (80 GWth) using the higher number for Japan.
(f) About 1.5 million is estimated to be installed in Africa, primarily in South Africa, Egypt, and Niger
(Karekezi & Kithyoma 2005).
(g) Solar hot water numbers in a given year must account for both additions and retirements. Retirements are
modelled and estimated by various organizations in different ways, and so figures are not always compatible,
particularly for countries with long-standing markets in which many systems are now reaching the end of their
service life. In particular, there is a large discrepancy as to how to account for retirements in Japan, leading to a
large divergence between figures published by the IEA (Weiss et al. 2005), which give 12.4 million m2 in 2004,
and those provided by other Japanese sources, which give 7.7 million m2 in 2004. The lower figure is used in
this report.
Sources: Weiss et al. 2005; Li 2002 and 2005; ESTIF 2004 and 2005; Martinot 2004a; EurObserv’ER 2005b;
Karekezi & Kithyoma 2005; submissions from report contributors.
The solar thermal industry in Europe will install 1.2 GWth of capacity during 2005 according to the latest
statistics from the European Solar Thermal Industry Federation. See story at ReFocus, at
www.sparksdata.co.uk/refocus/fp_showdoc.asp?docid=83735293&accnum=1&topics=

51
[N9] Ethanol and Biodiesel
Table N9. Biofuels Production, Top 12 Countries, 2004 (billion liters)
Country
Ethanol
(billion liters)
Biodiesel
(billion liters)
Brazil 15 ---
United States 13 0.1
China 2 ---
Germany 0.02 1.1
France 0.1 0.4
Italy --- 0.35
Canada 0.2 ---
Thailand 0.2 ---
Spain 0.2 ---
Denmark --- 0.08
Czech Republic --- 0.07
Australia 0.07 ---
World Total 31 2.2
Notes:
(a) Ethanol figures do not include production of ETBE in Europe, which was about 0.7 billion liters in 2004.
(b) Finland plans to build a biodiesel production plant of 170,000 tons/year capacity by 2007, which would put
it in fourth place in Europe behind Germany, France, and Italy.
(c) Fulton et al. 2004 gives Germany 2002 biodiesel capacity as 750,000 liters/year and sales as 550,000
liters/year. Production was 550,000 tons in 2002; 720,000 tons in 2003; and 1 million tons in 2004 from
EurObserv’ER 2005a.
(e) Germany added 0.3 billion liters/year biodiesel production capacity in 2004, and 0.1 billion l/yr for ethanol.
(f) Ethanol in the United States, 2005 figures, from presentation by Brian Jennings, Executive Vice President,
American Coalition for Ethanol (Jennings 2005). Jennings gives 3.4 billion gallons produced in 2004, or 13
billion liters. Also same from the Renewable Fuels Association (www.ethanolrfa.org/pr050223.html), an
increase of 21 percent from 2.8 billion gallons (10.6 billion liters) in 2003.
Sources: Adapted from Fulton et al. 2004; Lichts 2005; EurObserv’ER 2005a; US Renewables Fuels
Association (www.ethanolrfa.org); IEA 2004d; and submissions by report contributors.
Australia Ethanol Limited gives 70 million liters/year produced in Australia (presumed current), and Fulton et
al. (2004) gives 40 million in 2002.
In Spain, there are currently two ethanol production facilities, one in Cartagena, with capacity of 100 million
liters, and the other in Teixeiro, with capacity of 126 million liters (IEA 2005c)
Other countries in Europe have also decided to go into biodiesel production. Spain started up its biggest

52
biodiesel production unit (250,000 tons) last May in the region of Cartagena. The company, called Biodiesel
Production, is part of the German group Sauter and has invested 50 million euros in this project. A first 100-ton
biodiesel production unit will also be put into service in Portugal next August. The Ibersol company, a
subsidiary of the German food group Nutas, is responsible for this 25 million euro investment. Other units are
also under construction or in project stage in the United Kingdom and Finland.
In Canada, there are currently more than 1,000 retail locations selling ethanol-blended gasoline in six provinces.
Approximately 7 percent of gasoline sold in Canada is currently blended with ethanol. Ethanol production is
expected to grow to 1.4 billion liters to meet the Government of Canada's target of 35 percent of Canadian
gasoline containing 10 percent ethanol by 2010. This target means that ethanol production will have to increase
from production of 200 million liters per year (2004) to 1.4 billion liters per year. To reach that target the
federal government, through Natural Resources Canada, has implemented an Ethanol Expansion Program (EEP)
that provides funding for construction of new ethanol plants or plant expansions. Under the first round of EEP
CDN, $72 million in contributions has been allocated to six projects across Canada, and in the second round an
additional CDN$46 million have recently been allocated. In addition to EEP the federal government provides
an exemption on its gasoline excise tax of $0.10 per liter of ethanol. At the provincial level, Manitoba provides
the greatest exemption of the provinces at $0.25 per liter of ethanol produced and consumed in the province,
British Columbia $0.11 /liter (when a plant is built in BC), Alberta $0.09 /liter (no restriction on ethanol
source), Saskatchewan $0.15 /liter (ethanol must be produced/consumed in SK), Manitoba $0.25 /liter (ethanol
must be produced/consumed in MB), Ontario $0.147 /liter (no restriction on ethanol source), Quebec $0.198
/liter (when plant is built in QC). (www.nrcan-rncan.gc.ca/media/newsreleases/2005/200550a_e.htm and other
sources).
This report generally compares ethanol and gasoline based on equivalent energy content rather than volumetric
equivalents. It may be that some of the comparisons mistakenly are based on volumetric equivalents, since
source material sometimes isn’t clear. The energy content of ethanol is only 70% or so of gasoline on a
volumetric basis.
Liquid fuels from biomass have major impacts on land use, farm policy (which in turn bears indirectly on the
poor agricultural countries in the developing world), and food pricing. Corn farmers in the U.S. appreciate the
fact that in 2003 the substitution of 1.5% of gasoline on an energy basis consumed 14% of the corn crop. In
2005, due to demand for ethanol there was a savage spike in sugar prices. In Brazil, ethanol production
fluctuates with sugar prices; when sugar prices are low more ethanol is produced, and when high less ethanol is
produced. Fulton et al. (2004) covers the food and land issues.
[N10] Ethanol in Brazil
Total ethanol consumption by cars in Brazil was 12.5 billion liters in 2004, 5.22 as hydrated, used in neat
ethanol and flex-fuel cars, and 7.22 as anhydrous, blended to gasoline. Total gasoline for road use (essentially
cars, since almost no truck uses gasoline) in 2004 was 15.8 billion liters. Thus, on a volume basis, gasoline
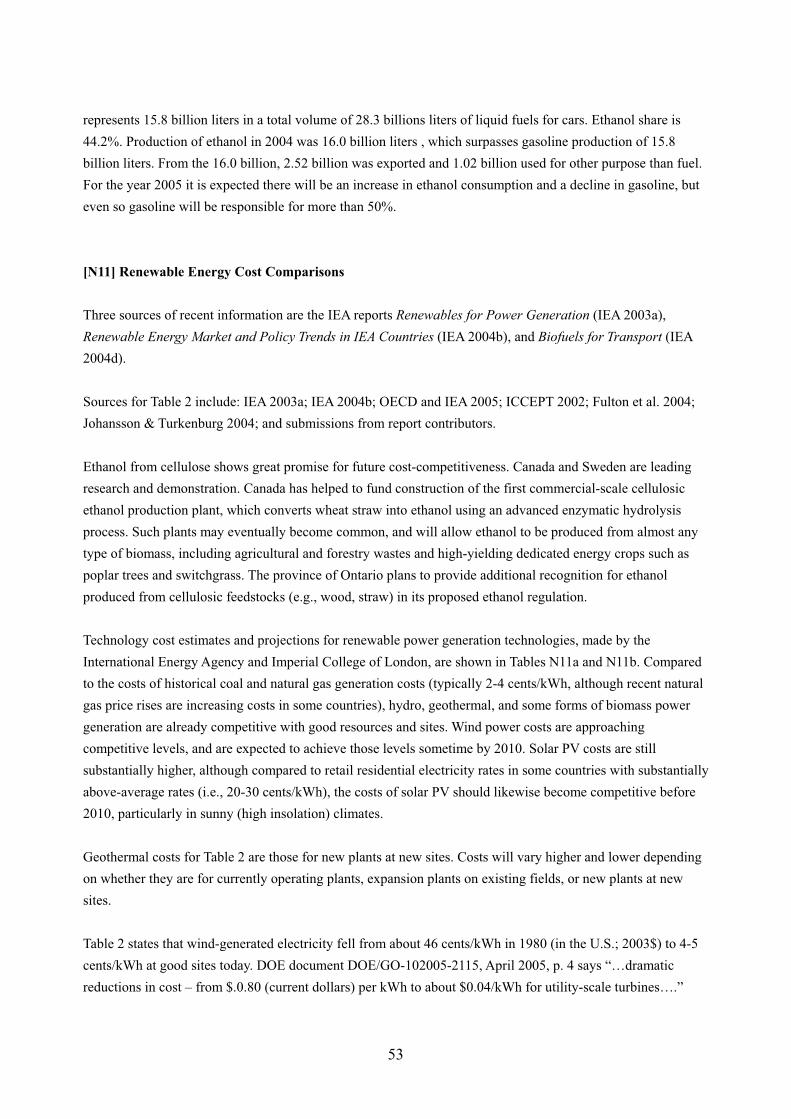
53
represents 15.8 billion liters in a total volume of 28.3 billions liters of liquid fuels for cars. Ethanol share is
44.2%. Production of ethanol in 2004 was 16.0 billion liters , which surpasses gasoline production of 15.8
billion liters. From the 16.0 billion, 2.52 billion was exported and 1.02 billion used for other purpose than fuel.
For the year 2005 it is expected there will be an increase in ethanol consumption and a decline in gasoline, but
even so gasoline will be responsible for more than 50%.
[N11] Renewable Energy Cost Comparisons
Three sources of recent information are the IEA reports Renewables for Power Generation (IEA 2003a),
Renewable Energy Market and Policy Trends in IEA Countries (IEA 2004b), and Biofuels for Transport (IEA
2004d).
Sources for Table 2 include: IEA 2003a; IEA 2004b; OECD and IEA 2005; ICCEPT 2002; Fulton et al. 2004;
Johansson & Turkenburg 2004; and submissions from report contributors.
Ethanol from cellulose shows great promise for future cost-competitiveness. Canada and Sweden are leading
research and demonstration. Canada has helped to fund construction of the first commercial-scale cellulosic
ethanol production plant, which converts wheat straw into ethanol using an advanced enzymatic hydrolysis
process. Such plants may eventually become common, and will allow ethanol to be produced from almost any
type of biomass, including agricultural and forestry wastes and high-yielding dedicated energy crops such as
poplar trees and switchgrass. The province of Ontario plans to provide additional recognition for ethanol
produced from cellulosic feedstocks (e.g., wood, straw) in its proposed ethanol regulation.
Technology cost estimates and projections for renewable power generation technologies, made by the
International Energy Agency and Imperial College of London, are shown in Tables N11a and N11b. Compared
to the costs of historical coal and natural gas generation costs (typically 2-4 cents/kWh, although recent natural
gas price rises are increasing costs in some countries), hydro, geothermal, and some forms of biomass power
generation are already competitive with good resources and sites. Wind power costs are approaching
competitive levels, and are expected to achieve those levels sometime by 2010. Solar PV costs are still
substantially higher, although compared to retail residential electricity rates in some countries with substantially
above-average rates (i.e., 20-30 cents/kWh), the costs of solar PV should likewise become competitive before
2010, particularly in sunny (high insolation) climates.
Geothermal costs for Table 2 are those for new plants at new sites. Costs will vary higher and lower depending
on whether they are for currently operating plants, expansion plants on existing fields, or new plants at new
sites.
Table 2 states that wind-generated electricity fell from about 46 cents/kWh in 1980 (in the U.S.; 2003$) to 4-5
cents/kWh at good sites today. DOE document DOE/GO-102005-2115, April 2005, p. 4 says “…dramatic
reductions in cost – from $.0.80 (current dollars) per kWh to about $0.04/kWh for utility-scale turbines….”

54
Also, the statement in Table 2, “how to make the machines bigger is still the number one technological issue in
the turbine industry,” oversimplifies the technical challenges facing the wind industry.
Table N11a. Power Generation Costs, 2002 and Projections for 2010
Capital
costs
($/kW)
Low-side
generation
costs
(cents/kWh)
High-side
generation
costs
(cents/kWh)
Low-side
generation
costs by 2010
Small hydro power 1,000-5,000 2-3 9-15 2
Solar PV power 4,500-7,000 18-20 25-80 10-15
Concentrating solar power 3,000-6,000 10-15 20-25 6-8
Biopower 500-4,000 2-3 10-15 2
Geothermal power 1,200-5,000 2-5 6-12 2-3
Wind power 850-1,700 3-5 10-12 2-4
Source: IEA 2003a
[N12] Global Investment in Renewable Energy
Investment figure of $30 billion/year developed from database of installed capacity by technology for the
period 1995-2004, as used for Martinot 2004a, along with submissions from report contributors, using global
average capacity costs (installed costs, including balance of plant for solar PV). Further details of cost estimates
taken from the literature and explanations of cost assumptions used for those papers are available at
www.martinot.info/markets.htm.
Typical investment costs for 2004 were estimated as follows:
SHW in China: $150/m2
SHW elsewhere: $800/m2
Wind: $1,200/kW
Solar PV (installed): $7,000/kW
Geothermal heat: $500/kWth
Geothermal power: $1,600/kW
Biomass heat: $200/kWth
Biomass power: $2,000/kW
Small hydro in China: $900/kW
Small hydro elsewhere: $1,300/kW
Large hydro in China: $1,400/kW
Large hydro elsewhere: $2,000/kW
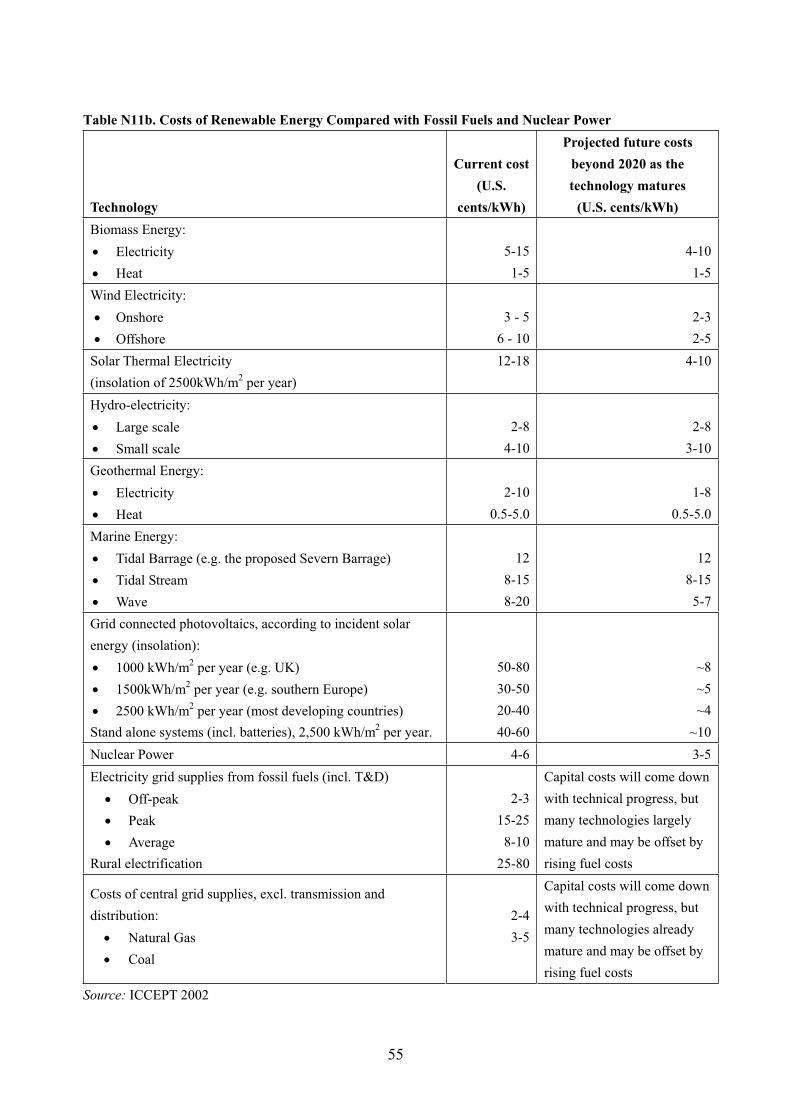
55
Table N11b. Costs of Renewable Energy Compared with Fossil Fuels and Nuclear Power
Technology
Current cost
(U.S.
cents/kWh)
Projected future costs
beyond 2020 as the
technology matures
(U.S. cents/kWh)
Biomass Energy:
Electricity
Heat
5-15
1-5
4-10
1-5
Wind Electricity:
Onshore
Offshore
3 - 5
6 - 10
2-3
2-5
Solar Thermal Electricity
(insolation of 2500kWh/m2 per year)
12-18 4-10
Hydro-electricity:
Large scale
Small scale
2-8
4-10
2-8
3-10
Geothermal Energy:
Electricity
Heat
2-10
0.5-5.0
1-8
0.5-5.0
Marine Energy:
Tidal Barrage (e.g. the proposed Severn Barrage)
Tidal Stream
Wave
12
8-15
8-20
12
8-15
5-7
Grid connected photovoltaics, according to incident solar
energy (insolation):
1000 kWh/m2 per year (e.g. UK)
1500kWh/m2 per year (e.g. southern Europe)
2500 kWh/m2 per year (most developing countries)
Stand alone systems (incl. batteries), 2,500 kWh/m2 per year.
50-80
30-50
20-40
40-60
~8
~5
~4
~10
Nuclear Power 4-6 3-5
Electricity grid supplies from fossil fuels (incl. T&D)
Off-peak
Peak
Average
Rural electrification
2-3
15-25
8-10
25-80
Capital costs will come down
with technical progress, but
many technologies largely
mature and may be offset by
rising fuel costs
Costs of central grid supplies, excl. transmission and
distribution:
Natural Gas
Coal
2-4
3-5
Capital costs will come down
with technical progress, but
many technologies already
mature and may be offset by
rising fuel costs
Source: ICCEPT 2002

56
Wind power costs from previous years might justify a figure than $1,200/kW, but in 2004 wind power costs
rose, some said to more typically $1,300/kW, due to higher steel prices from high global demand for steel.
Canada reported $1,500/kW in 2004 (according to a private communication with the Canadian Wind Energy
Association). Solar PV prices also increased in 2004. Solar PV prices in 2004 in California were reported at
$9,000/kWp installed. Canada solar PV prices in 2004 were reported at $8,000/kWp. However, the assumption
of $7,000/kWp was left unchanged from 2003.
Solar hot water costs in China for 2002 were reported by Li (2005). Over 70% of solar hot water heaters were
sold in 2002 at prices less than 1,500 RMB ($180) and the lowest-cost heaters typically comprise 2 m2 of
collector area. This would imply a cost of $90/m2. A further 26% of products are sold between RMB
2,200-3,000 ($270-360), probably implying costs of $100-120/m2. High-end systems, still a small market share,
sell for $300/m2. The China SHW industry in 2000 had 6 million m2 production and $750 million revenue, or
an average of $125/m2 in revenue. This has probably increased since 2000 as larger and more expensive
systems capture more of the market. Another expert source gives 1,000-1,500 RMB/m2 as typical costs, or
$120-180/m2. An average cost of $150/m2 is assumed for solar hot water collectors in China, for purposes of
calculating global investment figures. This is still much lower than estimated costs in Europe and other
developed countries.
Small hydropower costs in China are reported from one Chinese source as 3,000-6,000 RMB/kW, or
$370-740/kW. This is significantly lower than small hydro costs elsewhere. But others have questioned such
low figures, so $900/kW is used.
Cost data from a variety of sources, including Johansson & Turkenburg 2004, Turkenburg et al. 2000, EC
2002a, IEA 2004b, IEA 2003a, and ICCEPT 2002. EC CORDIS cost data from Section 1.9 on geothermal
energy (12/20/02), Section 1.10 on photovoltaics (12/23/02), Section 1.11 on small hydropower (12/20/02),
Section 1.12 on solar heating and cooling (12/20/02), Section 1.15 on wind energy (12/23/02) and Section 1.3
on CHP microturbines (12/18/02).
Investment of $4-5 billion for capital expenditures in 2004 by the solar PV industry is estimated by Michael
Rogol, MIT, and CLSA Asia-Pacific (personal communication). See also CLSA Asia-Pacific Markets (2004).
Some of this investment will not immediately translate into increased production in 2005 due to time required
to get some capacity up-and-running (e.g. silicon production capacity takes 18-24 months or longer to reach
full production) and due to constraints on silicon availability (e.g. significant portion of Chinese ingot growth
capacity is idle). Rogol also estimates the figure will be $5-7 billion for 2005.
Comparisons with global investment in power generation are rough estimates based on 2.5-3% average growth
in power generation worldwide and personal communications with experts. Some experts believe the total may
be much higher than $150 billion, perhaps closer to $400 billion for the entire power sector, including
transmission and distribution and fossil fuel supply chains. Comparisons of renewables power generation
investment with global power generation investment exclude transmission and distribution investment and
fossil fuel supply chains, which might mean the comparison is too favorable to renewable energy.

57
[N13] Private Financing and Venture Capital
Venture capital investment from Makower et al. (2005) and Liebreich & Aydinoglu (2005). CLSA Asia-Pacific
Markets projections from CLSA Asia-Pacific Markets (2004). An updated version was available in mid-2005.
New Energy Finance, Ltd. (2005) analyzed 201 venture capital investment rounds from 2001 to 2004, covering
total estimated investment of $2.2 billion, including about $1.2 billion in efficiency, fuel cells, and hydrogen.
Investment increased from $414 million in 2003 to $958 million in 2004, although it is not clear how much of
the increase was for renewable energy.
[N14] Public Financing
EIB total financing for renewables was reported by EIB as € 91 million in 2000, € 180 million in 2001, €682
million in 2002, € 414 million in 2003, and €469 million in 2004. The average for 2002-2004 is € 520 million.
Converting to USD at an average exchange rate of $1.20 yields $630 million. EIB is a public sector institution
in the sense that it is owned by the EU Member States. However, it raises its resources on capital markets. It
only has access to "public money"—funds that come from government budgets—in the case of its financing
operations under the Cotonou Agreement's Investment Facility in the African, Carribbean and Pacific (ACP)
Countries. The Investment Facility resources in fact come from the European Development Fund financed by
the EU Member States. Source: personal communication with EIB, 2005.
For information on EIB renewable energy lending between 1999 and 2003, see:
http://www.eib.org/Attachments/thematic/renewable_energy_en.pdf
All exchange rate conversions done using € 1 = $1.20, the rate as of July 2005, and are thus conversions into
current 2005 dollars rather than 2002, 2003, or 2004 dollars.
[N15] Multilateral and Bilateral Financing for Developing Countries
From 1990-2004, the World Bank Group committed $1.8 billion to new renewables, which along with
co-financing of $450 million from the Global Environment Facility, resulted in $2.3 billion World Bank/GEF
combined financing for new renewables. The World Bank also committed $3.9 billion to large hydro (>10 MW)
during this period (World Bank 2005, Table 1). Thus, average World Bank Group financing for new renewables
has historically been about $120 million per year (excluding GEF financing). This average has remained in
recent years. During the three-year period 2002-2004, the World Bank Group committed an average of $113
million per year to new renewables ($338 million committed to new renewables by IBRD, MIGA, IFC, IDA,
and carbon finance in 2002-2004 per Table 3, Annex 2). Associated with those commitments was GEF
co-financing averaging $43 million per year during the three-year period 2002-2004. The World Bank Group
also committed an average of $166 million per year to large hydro during the three-year period 2002-2004 (no

58
GEF co-financing involved). Thus total World Bank/GEF financing for all renewables during the three-year
period 2002-2004 averaged $320 million per year. (Note: “World Bank Group commitment” as used in World
Bank 2005 includes allocations by the GEF. This report separates the two agencies and reports on their
commitments separately.)
World Bank and GEF projects often include non-renewables components, or are blended with energy efficiency
components, making it difficult to analytically separate out the renewable energy finance from other finance.
Reported figures by these agencies are subject to such analytical uncertainties, and it is possible that
non-renewables finance from a few projects is included in reported renewables totals.
GEF-reported financing figures for renewable energy include fees paid to the GEF implementing agencies. If
such fees are excluded, GEF financing would average closer to $90 million per year for the three-year period
2002-2004 rather than $100 million per year. Some discrepancies may exist with other reported figures because
this report totals by calendar year, while the GEF totals by fiscal year.
From 1999 to 2002, OECD DAC overseas development assistance averaged about $130 million/year for
non-hydro renewables and about $400 million/year for hydro (OECD DAC, cited in Saghir 2005; OECD DAC
2005). Total official development assistance (ODA) for hydro averaged more than $420 million per year during
the five-year period 1999-2003. Donor statistics are from OECD DAC (2005) and include all forms of reported
donor assistance to developing countries.
Table N15. Overseas Development Assistance for Renewable Energy, 1999-2003
1999 2000 2001 2002 2003
(million dollars)
Hydro 244 368 584 694 239
Geothermal 33 0.3 0 1.7 0.2
Solar 8 13 197 32 50
Wind 33 3 31 53 151
Ocean 0 0.003 0 0 0
Biomass 0.9 8.4 3.8 10.4 1.5
Total non-hydro 75 25 232 97 203
Note: Average for period for non-hydro new renewables is $130 million/year, for hydro $420 million/year.
Source: OECD DAC 2005.
Financing amounts based on e-mail queries and interviews with agency officials and a variety of unpublished
sources. The $500 million public financing for developing countries only includes public funds from
projects—grants, loans, and other financing from governments, international agencies, or other public sources.
These are often called “budgetary funds.” Figures do not include private financing tied to projects, often called
“private financing” or “market funds.”

59
Source for OECD Agreement on Officially Support Export Credits: OECD 2005. Sources for future multilateral
commitments: email inquires and interviews with development agency officials; OECD 2005; submissions by
report contributors.
In 2004, KfW approved about € 151 million for renewable energy, of which € 81.6 million were “budget funds”
and € 69.3 million were “market funds.” The budget funds are considered public-source investment and the
market funds are considered private-source investment. Source: KfW, personal communication. Use mid-2005
exchange rate of € 1 = $1.20 for conversions into dollar equivalent.
[N15b] Bonn Action Programme in International Context
Source for the content analysis of the Action Programme is Fritsche & Kristensen 2005.
There are no global estimates for CO2 emissions reductions from renewables in the literature, so a rough
estimation was made for power generation. Analysis of global CO2 emissions is approximate and does not
include rural energy technologies like solar home systems and biogas digesters (which are orders of magnitude
lower than the other numbers here).
Power generation avoided CO2 emissions calculated at 0.6 billion tons CO2/year for new renewables, excluding
biofuels and heating, and 3.6 billion tons/year for large hydro (based on 720 GW). Assumptions for power
generation: (a) Large hydro replaces baseload power, i.e. coal. (b) Small shares of gas-CC are offset by similar
shares of lignite. (c) Small hydro is same as large hydro. (d) Wind replaces intermediate load, i.e. 50% from
coal and 50% from gas-CC in OECD, and 50% from coal and 50% oil-fired GT in developing countries. (e)
Biomass replaces 50% baseload and 50% intermediate load. Same assumptions on mix for all countries. (f)
Geothermal replaces 100% baseload. (g) Solar PV replaces 100% peak load from 50% gas-CC and 50%
oil-fired GT. (h) Solar-thermal replaces 50% intermediate load and 50% peak load. (i) Ocean tidal replaces
100% baseload. Emissions factors (CO2 eq in g/kWhel): 1,040 for coal in developing countries; 1,050 for coal
in OECD; 451 for gas-CC; and 1,141 for oil-GT. Capacity factors: large hydro 68%, small hydro 57%, wind
23%, biomass 51%, geothermal 74%, solar-PV 11%, solar-thermal 23%, and ocean tidal 68%.
Solar hot water was probably around 25-30 million tons avoided CO2/year in 2004. Weiss et al. (2004) give 15
million tons CO2/year from all SHW, excluding unglazed, in 2001, with 70 million m2 installed. Installed
increased by 60% by 2004, to 110 million m2. China reported 13 million tons CO2 from solar hot water in 2003,
with 52 million m2 installed.
Geothermal heat supply is about two-thirds of solar hot water on a thermal output basis, and thus might be 20
million tons/year. Biomass heating is about 70% more than biomass power generation on an equivalent energy
basis, and since much biomass is combined heat and power, the same fossil fuels would be displaced for both.
Addition analysis for hot water/heating and gives about 0.2 billion tons CO2/year total.

60
Biofuels probably add another 100-120 million tons/year. Rossillo-Calle & Cortez (1998) estimated 46 million
tons CO2/year avoided from Brazil biomass in 1998-1999, when production was 15 billion liters, about the
same as today. The global biofuels market is now more than twice as large as Brazil.
[N16] R&D Spending and Subsidies
The IEA RD&D database for all IEA countries (IEA 2005d) gives $352 million, $364 million, and $356 million
for solar RD&D for the years 1999-2001 (using data based on exchange rates rather than PPP). Total of all solar,
wind, ocean, biomass, small hydro, and geothermal for these three years is $2,165 million, for an average of
$720 million per year. Of this number, about $250 million was accounted for by the United States, and another
$130 million by Japan, with the remaining $340 million by European countries. RD&D on large hydro for all
IEA countries averaged $10 million per year. All numbers are slightly lower if PPP is used rather than exchange
rates. There is a large discrepancy in reported RD&D for the U.S. in 1999 by the IEA, which gives $280
million, and the U.S. Energy Information Administration (1999), which gives $327 million.
Estimates of global subsidies for fossil fuels and nuclear power taken from UNEP & IEA (2002). Also,
Johansson and Turkenburg2004 say “at present, subsidies to conventional energy are on the order of $250
billion per year” (p.29). Earthtrack (earthtrack.net) has a comprehensive set of references on subsidy policies
and estimates.
Goldberg (2000) gives U.S. federal subsidy estimates for the period 1943-1999 (cumulative) of $5.7 billion
(1999 dollars) for wind, solar, and solar thermal power. Another $1.6 billion is estimated for subsidies to
hydropower during the same period. One source cited (EIA 1999) gives $1.1 billion subsidies for renewables in
1999 alone, including hydropower. This represents federal on-budget, for direct payments, tax expenditures,
and research and development. It includes $725 million for ethanol excise tax exemption, $327 million for
R&D, $15 million on income tax exemptions, and $4 million on direct expenditures. Ritschel & Smestad (2003)
cite $135 million per year in California public benefit fund support for renewables in the late 1990s. They also
quote $9 billion for global subsidies to renewable energy and energy efficiency, compared to $150 billion for
fossil fuels and $16 billion for nuclear power, citing van Beers & de Moore (2001). In the United States, public
benefit funds in more than a dozen states are spending $300 million per year on renewables (Martinot et al.
2005).
The OECD defines subsidies as: “any measure that keeps prices for consumers below market levels, or for
producers above market levels or that reduces costs for consumers and producers.” EEA (2004) notes that
energy subsidy definitions that refer only to a direct cash payment to an energy producer or consumer ignore a
range of other indirect support mechanisms, including tax measures, and the effects of trade restrictions and
other government interventions (such as purchase obligations and price controls) on prices received by
producers and paid by consumers.
EEA (2004): Off-budget subsidies are typically transfers to energy producers and consumers that do not appear
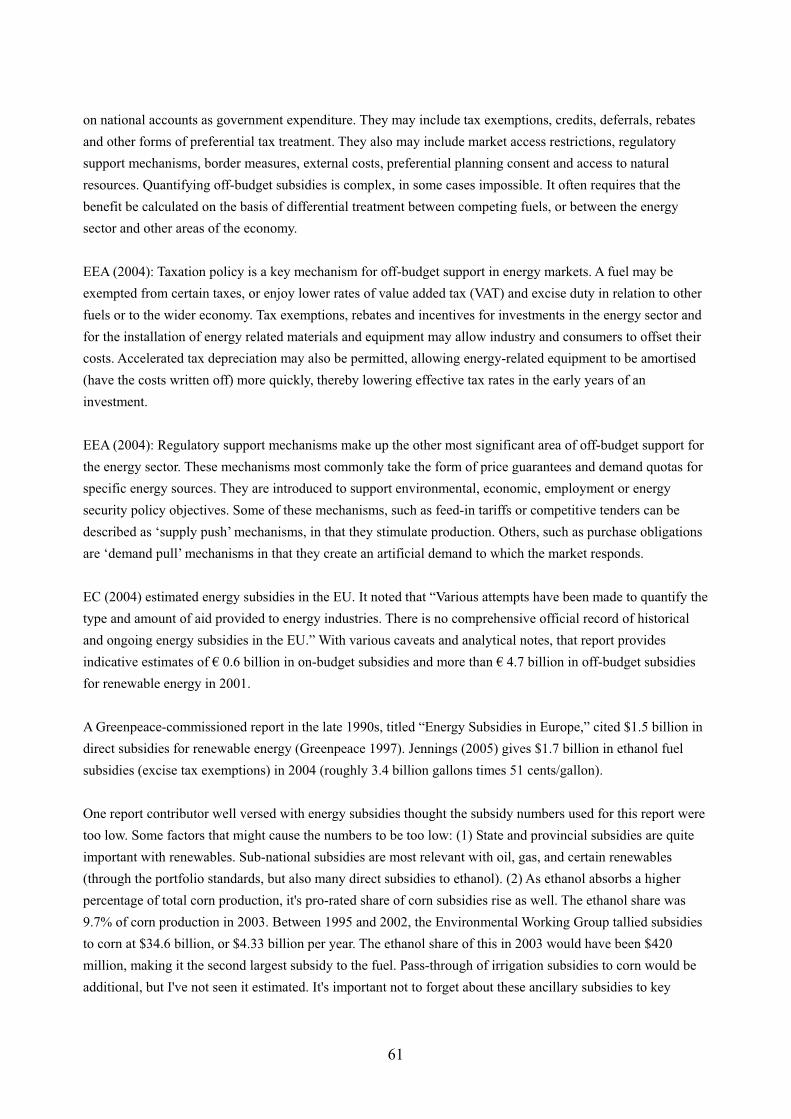
61
on national accounts as government expenditure. They may include tax exemptions, credits, deferrals, rebates
and other forms of preferential tax treatment. They also may include market access restrictions, regulatory
support mechanisms, border measures, external costs, preferential planning consent and access to natural
resources. Quantifying off-budget subsidies is complex, in some cases impossible. It often requires that the
benefit be calculated on the basis of differential treatment between competing fuels, or between the energy
sector and other areas of the economy.
EEA (2004): Taxation policy is a key mechanism for off-budget support in energy markets. A fuel may be
exempted from certain taxes, or enjoy lower rates of value added tax (VAT) and excise duty in relation to other
fuels or to the wider economy. Tax exemptions, rebates and incentives for investments in the energy sector and
for the installation of energy related materials and equipment may allow industry and consumers to offset their
costs. Accelerated tax depreciation may also be permitted, allowing energy-related equipment to be amortised
(have the costs written off) more quickly, thereby lowering effective tax rates in the early years of an
investment.
EEA (2004): Regulatory support mechanisms make up the other most significant area of off-budget support for
the energy sector. These mechanisms most commonly take the form of price guarantees and demand quotas for
specific energy sources. They are introduced to support environmental, economic, employment or energy
security policy objectives. Some of these mechanisms, such as feed-in tariffs or competitive tenders can be
described as ‘supply push’ mechanisms, in that they stimulate production. Others, such as purchase obligations
are ‘demand pull’ mechanisms in that they create an artificial demand to which the market responds.
EC (2004) estimated energy subsidies in the EU. It noted that “Various attempts have been made to quantify the
type and amount of aid provided to energy industries. There is no comprehensive official record of historical
and ongoing energy subsidies in the EU.” With various caveats and analytical notes, that report provides
indicative estimates of € 0.6 billion in on-budget subsidies and more than € 4.7 billion in off-budget subsidies
for renewable energy in 2001.
A Greenpeace-commissioned report in the late 1990s, titled “Energy Subsidies in Europe,” cited $1.5 billion in
direct subsidies for renewable energy (Greenpeace 1997). Jennings (2005) gives $1.7 billion in ethanol fuel
subsidies (excise tax exemptions) in 2004 (roughly 3.4 billion gallons times 51 cents/gallon).
One report contributor well versed with energy subsidies thought the subsidy numbers used for this report were
too low. Some factors that might cause the numbers to be too low: (1) State and provincial subsidies are quite
important with renewables. Sub-national subsidies are most relevant with oil, gas, and certain renewables
(through the portfolio standards, but also many direct subsidies to ethanol). (2) As ethanol absorbs a higher
percentage of total corn production, it's pro-rated share of corn subsidies rise as well. The ethanol share was
9.7% of corn production in 2003. Between 1995 and 2002, the Environmental Working Group tallied subsidies
to corn at $34.6 billion, or $4.33 billion per year. The ethanol share of this in 2003 would have been $420
million, making it the second largest subsidy to the fuel. Pass-through of irrigation subsidies to corn would be
additional, but I've not seen it estimated. It's important not to forget about these ancillary subsidies to key

62
feedstocks, be they corn or uranium. (3) Tax-exempt debt used for energy purposes are often ignored in many
public accountings of subsidization. Sometimes they pick up tax-exempt private activity bonds, but if the
facility is municipally-owned the subsidies are often lumped in with all tax-exempt debt issued by states.
Tax-exempt debt is used for WTE plants and landfills (affecting the cost of landfill-gas-to-energy), and perhaps
for other projects classed as renewable energy as well. (4) Large scale hydro continues to receive large and
varied subsidies associated with the government ownership that they often entail. Low market interest rates
tend to reduce the value of some of these subsidies, since historically they had very long term bonds at fixed
low interest rates. Such contracts deviate less from market conditions during low interest rate periods. For this
reason, dam financing subsidies to hydro may be lower than in the past, though other forms of support still
exist. It is not clear if some of the subsidy numbers include large hydro or not.
Global subsidy estimates are highly uncertain. If they are done by aggregating the various existing studies, they
generally suffer from large inaccuracies associated with double-counting and non-systematic valuation methods.
Often, very large but more complicated value transfers are missing entirely from at least a portion of the studies.
This may include incomplete evaluation of tax breaks and loan guarantees; and exclusion of programs of are of
large benefit to particular fuels, but not solely targeted to them. Shifting of accident or cleanup liability to the
public sector is also commonly missing. If they are generated using price-gap methods for multiple countries
(the gap between the domestic price and the world price for a fuel), they will pick up only the portion of
subsidies that affect domestic prices, totally missing the support that leaks to other factors of production.
It is possible that many of these problems underlie what seems a low global value for nuclear subsidies of $16
billion per year. That is roughly what some estimated in the U.S. alone during the early 1990s, and accident
liability caps outside of the U.S. are even more generous to producers than Price-Anderson is inside. Thus,
the real value of nuclear subsidies is most likely much higher. Investment incentives, sovereign guarantees or
guaranteed purchase contracts, accident liability caps, public responsibility for waste management, losses on
uranium enrichment, and support for uranium mining are all common subsidies to the sector. Most likely many
of these are missing from the $16 billion figure. It's also useful to be clear about separating fusion and fission
subsidies, as the former is pretty much basic research while the latter is a market-distorting subsidy—even if
supporting new reactor designs.
For the fossil fuels, a check to see if estimates include any allowance regarding research on externalities (such
as climate change) or energy security (such as securing key infrastructure or shipping; or oil stockpiling) would
be warranted. These are big-ticket items generally ignored in most subsidy studies.
[N17] Market Capitalization and Top 60 Publicly-Traded Companies
The following companies represent a preliminary list of companies that meet the following criteria: (1) publicly
traded stock, and (2) more then US$40 million in market capitalization attributable to renewable energy. This
list is provisional and may inadvertently exclude stocks that meet these criteria. Market capitalization
attributable to renewable energy is a rough estimate. For “pure play” renewable energy stocks (stocks that have

63
bulk of earnings from renewables), market capitalization is assumed to be 100% attributable to renewable
energy. For companies engaged in renewable energy as a minority of earnings, we have made rough estimate of
earnings from renewable energy, divided this by total earnings and multiplied this percentage by total market
capitalization to derive a rough estimate of renewable energy market capitalization. In cases where this was not
possible due to information being either confidential or not available, we made an outside-in estimate of
renewable energy capacity, revenue and operating profit. We then took the ratio of renewable energy operating
profit by the company's total operating profit, then multiplied this ratio by the total market capitalization.
Categories of renewable energy included in this list include bio fuels/biomass, geothermal, hydro, solar, wave
and wind energy. Sources include: Bloomberg, MarketWatch.com, CLSA Asia-Pacific Markets,
InvestGreen.com, Investext, Reuters, and company data. List compiled by John Michael Buethe (Georgetown
University) and CLSA Asia-Pacific Markets.
Acciona (Spain), Alliant Energy (USA), Automation Tooling Systems (Canada), Bharat Heavy Electricals
(India), Boralex (Canada), BP (UK), Brascan (Canada), British Energy (UK), Calpine (USA), Carmanah
Technologies (Canada), Conergy (Germany), Corning (USA), Cypress Semiconductor (USA), Daystar (USA),
E.On Energie (Germany), Endesa (Spain), ENEL (Italy), Energy Developments (Australia), Enersis (Chile),
Eni (Italy), Evergreen Solar (USA), Florida Power & Light Energy (USA), Gamesa Energia (Spain), General
Electric/GE Wind (USA), Geodynamics (Australia), Greentech Energy Systems (USA), Ishikawajima-Harima
Heavy Industries (Japan), Japan Wind Development (Japan), Kaneka SolarTech (Japan), Kyocera (Japan),
Marubeni (Japan), Mitsubishi Electric (Japan), Mitsubishi Heavy Industries (Japan), Nordex Energy (Germany),
Novera Energy (Australia), Omron (Japan), Ormat Technologies (USA), Pacific Hydro (Australia), Pfleiderer
(Germany), Repower Systems (Germany), RWE (Germany), SAG Solarstrom (Germany), Sanyo (Japan),
Scottish Power (UK), Sekisui Chemical (Japan), Sharp (Japan), Shell (UK), Solar Integrated Technologies
(UK), Solar-Fabrik (Germany), Solarparc (Germany), SolarWorld (Germany), Solon (Germany), Spire (USA),
Sunways AG Photovoltaic Technology (Germany), Talisman Energy (Canada), Tokuyama (Japan),
TransCanada (Canada), TXU (USA), Vestas (Denmark), XCEL Energy (USA).
In addition to these companies with publicly-traded stock, there are many other companies involved in
renewable energy, such as private unlisted companies and public utilities, that are not traded on stock
exchanges. There were no clear criteria or data available to include these companies in an expanded list for this
version of the report. Prominent examples of such companies include Iberdrola of Spain, Nuon and Essent of
the Netherlands, Electricité de France, Hydro Quebec of Canada, Hydro Tasmania of Australia, Norsk Hydro
and SN Power of Norway, and Enercon of Germany. It also excludes project developers that may not have large
capital bases but still are major players in the renewables industry. Examples include Zilkha Renewables of the
United States (owned by Goldman Sachs), Clipper Windpower and AES of the United States (which just
bought Seawest), Eurus of Japan, and many others. There is also the issue of renewable energy value chains
and what part of the value chain constitutes a renewable energy business—such as PV silicon wafer
manufacturers, manufacturing equipment suppliers, and wind turbine blade manufacturers like LM Glasfibre of
Denmark. Future versions of the status report could attempt to create a more comprehensive list.

64
[N18] Wind Power Industry and Costs
Wind technologies fall into two distinct types: large turbines, designed to supply electricity to the grid,
typically 1-3 MW rated capacity with blade diameters of 60-100 meters, and small turbines rated from around 3
kW up to around 100 kW. As wind technology has matured, large wind turbines have become increasingly
standardized. All are now broadly similar three bladed designs. However, the potential for innovation has not
been exhausted. There is scope for cost reductions through site optimization and innovations in blade and
generator design and in grid connection using power electronics. Offshore wind power is still in its infancy and
large potential cost reductions exist.
Typical wind turbines produced today are in the 1-3 MW scale, although the 600 kW scale is still common in
India and China. European manufacturers have introduced new wind-turbines in the 5 MW range, and achieved
an evolution of cost per kW of installed capacity from 1,650 Euro/kW in 1986 to about 850 Euro/kW in 2004.
At present little offshore wind capacity is installed anywhere in the world. As with onshore developments
during the 1990s, Europe is the lead, with all the world’s operating offshore capacity and ambitious plans for
future development in the 2006-2007 timeframe. The first large-scale offshore wind farm (160 MW) was
completed in 2002 in Denmark.
Wind technology costs have declined 12-18% for each doubling of global capacity, with costs of
wind-generated electricity falling from about 46 cents/kWh in 1980 (in the US; 2003$) to 4-5 cents/kWh at
good sites today. Technology development and cost reduction have been driven primarily by feed-in policies in
just a few countries: Germany, Denmark, and Spain. The German Wind Energy Association (BWE) estimated
that the costs of wind power in Germany fell in real terms by 55% between 1991 and 2004.
How to make the machines bigger is still the number-one technological issue in the turbine industry, with the
current philosophy being that the larger the turbine, the greater its cost effectiveness. The average size of
turbines installed increased by only around 3% to 1.25 MW in 2004, with the three-blade, three-stage gear box
design remaining the most popular. Some progress is being made in producing a single-geared generator, with
German company Enercon being the only one to commercially produce them at present. 5 MW turbines
remained the largest available but so far only three prototype units have been installed worldwide. (Cameron
2005).
During 2003-2004, there were six competitively-bid wind projects in China and Canada , totaling almost 2,000
MW, that show winning-bid prices from 4.1-4.8 eurocents/kWh, considerably lower than most present feed-in
tariffs (see Table N31). However, competitive bidding in new markets may not reflect commercially viable
prices if aspiring market entrants underbid to gain market entry or mis-bid due to insufficient experience.
Wind power markets remain fragmented by country. That is, the wind market is not yet a global market but
really a collection of national markets, each growing fairly independently. Wind power has become a
mainstream commercial investment in about 8-10 primary countries (including Denmark, Germany, India, Italy,
Netherlands, Spain, the United Kingdom, and the United States) (Figure 6). Several countries are now taking
65
their first steps to develop large-scale commercial markets, including Russia and other transition countries of
Europe, China, South Africa, Brazil, and Mexico. In the case of China, most wind power investments
historically have been donor or government driven, but a shift to private investors has been underway in recent
years. Several other countries are at the stage of demonstrating wind farm installations, looking to develop
commercial markets in the future.
The global market for small-scale wind turbines has been growing rapidly in recent years. Small-scale wind
turbines (typically 100-1,000 W) provide power for homes and remote locations. The largest installed base of
small-scale turbines is an estimated 230,000 in Inner Mongolia in China, for household use. Sales of small
wind turbines were estimated to be 13,000 in 2005, totaling 14 MW (an average of 1 kW per turbine), bringing
total small wind capacity to 30 MW. Manufacturers are aiming to reduce hardware costs by 20 percent to
$1,700 per installed kW by 2010; and the average size of small wind turbines has doubled from 500 W in 1990
to 1 kW in 2004.
[N19] Solar PV Costs, Industry, and Production Capacity Expansion
The three main types of solar PV in commercial production are single-crystal, polycrystalline, and thin film.
Japanese single-crystal solar cell technology has seen its module conversion efficiency improve from 6% in
1963 to over 17% today. The average efficiency of polycrystalline silicon cells is approaching 15%, and of thin
film 10-12%. Still under development are the super-thin flexible cell, which has attained 38% efficiency, and
the condensed type, which has attained 28.5%.
Since 1976, costs have dropped about 20% for each doubling of installed PV capacity, or about 5%/year.
(Module prices have fallen from $30/W in 1975 to close to $3/W today. Costs rose slightly in 2004 due to high
demand (which outpaced supply) and the rising cost of silicon. Rooftop PV systems currently cost around
$6,000-$9,000 per kW installed.
The potential for further cost reductions as markets expand is appreciable. The technologies are small-scale and
modular, and the scale economies of batch production and new manufacturing techniques have been barely
exploited. In addition, conversion efficiencies of PV modules have seen continuous improvement through the
use of new materials and cell designs. One of the issues for the future of PV is whether and how fast crystalline
silicon can be replaced by high-volume, low-cost thin-film production.
Global solar PV module prices reached a low of $2.60/Wp in 2002/2003 (Sharp), but have since rebounded to
average of about $3.25/Wp in 2004. But grid-connected installed prices remained flat (about $5.50/AC-watt in
Japan and $6.50-8.00/AC-watt in the U.S.). One reason for module price increases is the rising cost of silicon
due to high demand (coupled with the industry’s traditional reliance on computer-industry scrap silicon).
Another reason is simply high demand relative to existing production. In China, solar PV module prices
declined from an average of $5/Wp in 2000 to $3.50/Wp in 2003, but rose again to $4/Wp in 2004 due to raw
material shortages and increased demand relative to supply. The high prices in 2004 were spurring many new

66
manufacturers to get into the solar PV business, as profits were also high.
The PV industry celebrated its first gigawatt of global installed capacity in 1999. Five years later, by the end of
2004, this capacity had quadrupled to more than 4 GW. Solar PV market growth has very much been influenced
by the grid-connected rooftop programs in Japan, Germany, and the U.S. state of California since the
mid-1990s. Indeed, without these programs, the solar PV industry would likely be several years behind where it
is today.
Investment in solar PV production capacity is growing in both capacity and plant scale. World solar PV
production grew from 740 MW in 2003 to 1,150 MW in 2004. In 2004, U.S. solar PV production increased
39% even as its share of global production fell to 11%. Japanese production topped 600 MW. German
production was up 66%, representing 60% of total European production. Production expansion continued
aggressively around the world in 2004 (Table N19).
China and other developing countries have emerged as major solar PV manufacturers. As of 2004, China had
70 MW of cell production capacity and 100 MW of module production capacity, compared to the world total
module production capacity of 1,150 MW. Chinese module production capacity doubled during 2004, from 50
MW in 2003. (China’s domestic PV market was 20 MW in 2004, so most production is exported.) Production
capacity could double again in 2005, as the Nanjing PV-Tech Co. launched construction of China’s largest PV
cell production facility, with 100 MW capacity, in early 2005. The Nanjing plant is scheduled to be finished by
the end of 2005. Also, Chinese Electrical Equipment Group Ltd. plans to invest in new solar cell production
capacity of 600 MW by 2008.
Other developing countries are also emerging as solar PV manufacturers. India’s primary solar PV producer is
Tata BP solar, which expanded production capacity from 8 MW in 2001 to 38 MW in 2004. Central Electronics,
Bharat Heavy Electrical, and WEBEL Solar are other leading solar cell/module manufacturers in India. In the
Philippines, Sun Power doubled its production capacity to 50 MW in 2004. In Thailand in 2004, Solartron PLC,
a solar-cell module assembler, announced plans to develop the country's first commercial solar cell
manufacturing facility, with annual capacity of 20 MW, to start production in 2007.
Future plans for production expansion by the major solar PV manufacturers, as well as major new entrants, are
also impressive. Announced plans by major manufacturers for 2005 included at least 400 MW increase in
production capacity and several hundred megawatts further capacity in the 2006-08 period (Table N19).
Table N19. Solar PV Production Capacity Expansion
Company
(in order of PV
News 2004 rank) Expansion in 2004/early 2005 Future Plans
1. Sharp
(Japan)
Increased capacity at Katsuragi
Plant, bringing annual capacity from

67
315 MW to 400 MW. New line
represents investment of 5 billion
Yen (US$50 million).
2. Kyocera
(Japan)
Capacity increased to 120 MW, from
72 MW in 2003. Opened new
assembly plant in Mexico; increased
production at facilities in Japan and
Czech Republic to 24 MW.
Plans to double PV module manufacturing
capacity to 240 MW/year during 2005. Mexico
plant expected to reach annual production of 36
MW in 2005.
3. BP Solar
(United States,
Spain, Australia,
Malaysia, Hong
Kong, India)
15 MW increase in 2004. BP total
global manufacturing capacity has
increased from 34 MW in 1999 to 90
MW in 2004.
Plans to increase global production capacity
from 90 MW to 200 MW by end-2006. Global
expansion will include increase from 40 to 50
MW in Sydney, Australia; investment of Aus$8
million (about US$6.33 million). And more than
$25 million to expand Frederick, MD, USA
facility from 20 MW to 40MW.
4. Mitsubishi
(Japan)
Total annual production capacity
grew from 35 MW in Jan. 2003, to
50 MW in Sept. 2003, and to 90 MW
in June 2004.
Will expand annual production capacity of PV
cells and modules at Nakatsugawa and Kyoto
Works from 90 MW to 135 MW by mid-2005
and planning to reach 230 MW by 2006. Will
invest 3.3 billion Yen ($30 million) in new
equipment.
5. Q Cell
(Germany)
European production increased from
28 to 75 MW, making Q Cell the
number-one producer in Europe.
6. Shell Solar
(U.S., Germany,
Netherlands)
72 MW produced.
7. Sanyo (Japan) Expanded to 150 MW in Osaka, with
7.5 billion Yen (US$70 million)
investment in 2004.
New plant in Hungary will be 50 MW by
mid-2005 and 100 MW by 2006.
8. Isofoton
(Spain)
Number two in Europe; increased
production from 35 MW in 2003 to
53 MW in 2004.
9. RWE Schott
Solar (Germany)
Produced more than 50 MW in 2004. Committed to 40 MW increase at facility in
Bavaria, bringing total production to 100 MW.
10. Deutsche
Shell (Germany)
Production up from 17 MW in 2003
to 24 MW in 2004.
SolarWorld AG
(Germany)
Increasing production capacity by 40 MW for
total of 120 MW. Plan to double solar silicon PV
manufacturing from 120 MW to 220 MW by end
of 2006; have secured financing package of

68
some € 80 million (US$100 million). Expect to
reach at least 150 MW in 2005.
Photovoltech 13 MW produced. Will increase cell production at Belgium facility
from 13 MW to almost 80 MW in 2006.
Sun Power
(Philippines,
China)
Doubled Philippine cell production
to 50 MW.
Suntech
(China)
Increased production, with 50 MW
planned by 2004.
Nanjing PV-Tech
Co., Ltd (China)
(also Chinese
Electrical
Equipment Group
Co.)
(not yet operating) In March 2005, launched construction of China’s
largest and most advanced solar production
facility, in Nanjing. Expect 100 MW of
production capacity in place by end of 2005.
Plans to produce 600 MW solar cells by 2008.
Motech
(Taiwan)
Production up by 106% to 35 MW in
2004.
Evergreen Solar
(United States)
Increased solar string production
capacity in Massachusetts to 15 MW.
Announced 30-MW plant in Germany with
Q-Cells as partner
First Solar - AZ
(USA)
6 MW produced. Plans to triple the output of its Ohio facility, to
bring thin-film solar PV production to 40
MW/year by 2006, and 75 MW by 2007.
[N20] Biomass
Cost reductions have been achieved in the area of small- to medium-scale steam turbines for biomass-based
co-generation (mainly from woody residues) in Germany and Finland, and for “new” smaller-scale
co-generation technologies like ORC and stirling engines (mainly Austria and Germany). Currently, plants of
this type are estimated to deliver energy at a cost between $0.07/kWh (a CHP scheme) and $0.12/kWh
(electricity only). Engineering assessment suggests that capital costs could be reduced by half through
replication and economies of scale once the plants enter early commercial application. Much lower costs could
be achieved in co-firing applications, where suitable quantities of biomass can be supplied to existing coal
plants for example.
The largest potential for cost reduction lies with gasification technologies. Costs of advanced biomass gasifiers
are dropping to 10-12 cents/kWh for megawatt-scale gasifiers. Small-scale gasification of biomass still lacks
development, but from RT&D in the area of biofuels (BtL schemes), positive impacts are expected to medium-
to large-sized gasification and, hence, for efficient biomass-based electricity generation using gas turbines and
combined cycles. China and Europe are both leaders in small-scale gasification technology.

69
Rural biomass pelleting for heat and power. The most prominent development in Europe is the rapid
introduction of pellet heating systems, mainly in Finland and Sweden, and to a smaller extent in Austria,
Germany, and the UK. Cost reductions per unit of installed kWth could be achieved by some 10%, and logistics
to deliver pelletized fuels to customers improved significantly. In developing countries, rural use of biomass for
power generation and heating could be on the verge of wide-scale commercial use because of deployment of
pelleting and briqueting technologies. These technologies improve portability, reliability, and range of
feedstocks. (E.g. Project in Bangalore to palletize agricultural waste and gasify it and a mobile pelletizing
process technologies being developed in China.)
[N21] Geothermal
Geothermal energy has been used for electricity generation and heat for about 100 years. Electricity generation
from geothermal sources can take place at various temperatures, starting from below 100 °C (“Binary” power
plants, ORC or Kalina-cycle) to high-temperature steam plants with more than 300 °C steam temperature. The
distribution of power plant types in terms of installed power is the following: Natural steam 29%, single flash
37%, double flash 25%, binary 8%, and back-pressure 1%. For heat production, hydro-thermal resources are
commonly used for district heating, and CHP plants.
Natural steam or hydrothermal resources are easiest to exploit, typically located at depths of 1-4 km and
containing steam or liquid hot water. Molten rocks (magma systems) may also be accessed in the future at
greater depths (up to 7 km) as can hot dry/wet rocks at 4-8 km, depending on the temperature gradient. The hot
dry/wet rocks concept, more generally called “enhanced geothermal systems,” has been proven successfully in
a European test facility. Hot dry/wet rock resources are much more abundant, and are in principle available
everywhere just by drilling sufficiently deep to produce rock temperature useful for heat extraction.
Geothermal heat pumps, also called ground source heat pumps (GSHP), are increasingly being used for
building heating and cooling. Ground couplings include borehole heat exchangers (vertical loops), groundwater
wells, horizontal loops in the soil, and similar techniques.
The main technical challenges being addressed for reducing costs and opening up new resources include
cheaper driller techniques (drilling typically accounts for half of the capital costs), remote detection of
producing zones during exploration, well-stimulation measures or ‘heat mining’ to extract the heat more
extensively and efficiently, and better power conversion technology.
[N22] Biofuels
Ethanol is the most common biofuel, accounting for more than 90% of the total usage. Ethanol is most
frequently used in low-concentration blends with petroleum gasoline. In North America and parts of Europe,
blends of 5-10% (E5 and E10) are common, and selected filling stations in a few major metropolitan areas sell

70
E85 for “flexible fuel” vehicles that can run on either gasoline or ethanol. The warm climate of Brazil also
makes feasible the use of E95, and an increasing number of vehicles capable of using that fuel are being sold.
ETBE, a mixture of ethanol and isobutylene (petrochemical), is used in low-concentration gasoline blends up to
about 8-10% in fuels in parts of Europe, particularly France and Spain. (ETBE is “25% renewable” on a carbon
atom basis and some question whether it should be considered a renewable fuel.)
In the U.S., construction of 12 new ethanol plants was completed in 2004, bringing the total to more than 80
plants. Also in 2004, construction of 16 new plants was started. More and more states are requiring that use of
MTBE as a gasoline oxygenator be discontinued, due to its toxicity and contamination of drinking water, and
ethanol is being used as a substitute. Consequently, by 2004, over 30% of all gasoline sold in the U.S. was
being blended with ethanol as a substitute oxygenator (Renewable Fuels Association 2005).
There were more than 300 sugar mills/distilleries producing ethanol, served by a plantation area of 5.4 million
hectares. In early 2005, 39 new distillers were licensed. As production increases, some even expect that ethanol
exports could reach 6 billion liters/year by 2010. Several larger bioethanol plants will begin production in 2005
in Germany and the United States. Projections for the global market are for 60-75 billion liters/year by 2010.
Ethanol prices in Brazil have steadily fallen. Prices (in 2002 US$) fell from $11/GJ in 1980 to $5/GJ in 2002,
and since 1999 have been equal to or below the equivalent Rotterdam gasoline price (Goldemberg et al. 2004).
Ethanol is now very competitive with gasoline. Cost reductions have been driven by Brazil and U.S. policies
and also improvements in production efficiencies with additional investments and technology advances.
Ethanol from cellulose shows great promise for the future. Canada has led research in this field, and has helped
to fund construction of the first commercial-scale cellulosic ethanol production plant, which converts wheat
straw into ethanol using an advanced enzymatic hydrolysis process. Such plants may eventually become
common, and will allow ethanol to be produced from almost any type of biomass, including agricultural and
forestry wastes and high-yielding dedicated energy crops such as poplar trees and switchgrass.
International biofuels trade has expanded rapidly during the past few years. World ethanol trade volume hit a
record level in 2004, reaching nearly 4.9 billion liters, compared with 3.7 billion liters in 2003. Brazil is by far
the biggest exporter, accounting for about half of international shipments of ethanol during 2004. Japan and the
U.S. were the largest importers, with India close behind. However, Brazilian ethanol prices during 2004 were
near historic lows, fuelling trade, and higher ethanol prices likely during 2005 could slow or even reverse this
trend, at least in the short term. There was also considerable biofuels trade (of both ethanol and biodiesel)
within the EU (between various member countries), and growth in intra-EU trade appears likely to continue
with the 10 new members beginning to play an active role.
Biodiesel was not produced in significant quantities anywhere in the world prior to 1996. By 2004, biodiesel
markets had developed in seven primary countries (Austria, Belgium, France, Germany, Italy, Indonesia, and
Malaysia). Germany has been the biggest biodiesel producer, with about 2 billion liters capacity on line or

71
under construction. France, Italy, and the UK are the next largest producers.
A biodiesel market is emerging in the U.S., with currently between 20 and 25 biodiesel production sites, with
an estimated production capacity over 150 million gallons per year. An additional 100 million gallons of annual
capacity is under construction or has been announced. Sales of biodiesel exceeded 30 million gallons in 2004,
and are expected to more than double in 2005 due to tax incentives. A recent example of expansion is a
15-million-gallon-per-year biodiesel production plant planned for Missouri by Mid-America Biofuels. The
plant will use the soybean oil from nearly 10 million bushels of soybeans grown in the state, representing
approximately 7 percent of Missouri's average annual harvest.
India has been examining for quite some time the supply of ethanol-blended petrol in the country. In order to
ascertain financial and operational aspects of blending 5% ethanol with petrol, the government had launched
three pilot projects in different states during 2001 and these pilot projects were supplying 5%
ethanol-doped-petrol only to the retail outlets under their respective supply areas. The Society for Indian
Automobile Manufacturers (SIAM) has confirmed the acceptance for use of 5% ethanol-blended petrol in
vehicles. State governments of major sugar producing states and representatives of sugar/distillery industries
have confirmed availability/capacity to produce ethanol. An expert group established by the government
recommended blending of ethanol with petrol at supply locations (terminals/depots) of oil companies. In 2003,
the government resolved that 5% ethanol-blended petrol would be supplied in the nine states and four union
territories. For biodiesel, a national program aims to produce enough oil seeds for the production of biodiesel in
sufficient quantities to enable its blending with diesel to the extent of 20%. Pilot projects and analyses of
feed-stock collection and plantations were ongoing.
[N23] Concentrating Solar Thermal Power
In Europe, research and development for concentrating SEGS was significantly increased in 2003 and 2004.
New designs using Fresnel reflectors are being proposed, promising 20% cost reductions as compared to the
standard parabolic trough and tower concepts. Performance of trough receiver tubes continues to increase,
thermal storage continues to be developed for trough systems, and advanced stirling dishes are under test at
some laboratories.
[N24] Jobs from Renewable Energy
We conducted a literature review of analytical factors for jobs-per-existing-capacity and jobs-per-unit of
produced capacity (Table N24c). We then totalled the jobs based on existing installed capacity in 2004 and new
manufactured/installed capacity in 2004 (Table N24a). In general, employment impacts of renewable energy
development are difficult to measure in a precise way, especially if total employment figures—including both
direct and indirect jobs—are to be estimated. A proper approach would be to build input-output analysis models,
an analytic tool that macroeconomists use to derive employment multipliers with which to predict the number

72
of jobs (direct and indirect) created by sales increases from a given sector or industry. The simplified alternative
adopted here is to use analytical approaches to define employment coefficients, generally based on (a)
information on labor time needed for a unit of power (i.e. person-years per MW), or (b) data on expenditure
necessary to support a full-time job annually (person-years/USD invested).
Table N24a. Estimation of Jobs from Renewable Energy, 2004
Technology
Global capacity
(MW as of 2004)
Additional
capacity in 2004
(MW)
Current employment
in manufacturing
(person-years in 2004)
Current
employment
in O&M
(jobs)
Small
hydropower
62,000 5,000 56,500 13,640
Wind power 48,000 8,200 31,160 – 60,680 4,800 – 9,600
Biomass power 38,000 800 1,600 – 6,800 12,160 – 79,040
Geothermal
power
9,000 200 800 – 3,500 15,300
Solar PV 4,000 900 22,590* - 29,097 4,000 – 10,000
Solar thermal
(hot water)**
116 million m2 18 million m2 13,6056 381,150
Solar thermal
electric power
400 -- -- 280
Ocean (tidal)
power
300 -- -- 30
Total 249,000 – 293,000 431,000 – 509,000
Ethanol
production
-- 32 billion liters 902,000 direct jobs***
Biodiesel
production
2.2 billion liters 31,000 direct jobs****
(*) = This low estimate is obtained with the parameter from Pembina Institute (2004), as the lower figure from
Greenpeace does not account for installation labor.
(**) = These estimates are obtained by using coefficients derived from 2000 Chinese industry data (see Table
N24c) for Chinese production and de-rated (30% lower) coefficients for the production capacity of the other
countries assuming higher labor productivity.
(***) = Estimated global direct jobs obtained by applying the Brazilian employment coefficient of Table N24c
to production in Brazil (14 billion liters), China (2 bill. ltrs.) and others (1 bill. ltrs.), and a 30% discounted
coefficient to take into account the less labor-intensive U.S. production (14 bill. ltrs.).
(****) = Estimated assuming jobs in biodiesel production are half of the jobs in ethanol production, per liter
produced.

73
Table N24b. Some Additional Parameters, Country Data, and Relevant Employment Impact Estimates
Technology
Manufacturing &
Installation O&M Source & Notes
Wind 2.6 Jobs/MW 0.3 Jobs/MW
Geothermal 4.0 Jobs/MW 1.7 Jobs/MW
Solar PV 7.1 Jobs/MW 0.1 Jobs/MW
Biomass 3.7 Jobs/MW 2.3 Jobs/MW
EPRI, 2001
Wind 7.75 person-years/MW
Geothermal 41.57 person-years/MW
Solar PV 5.2 person-years/MW
Biomass 56 person-years/MW
Heavner & Del Chiaro 2003–2005 estimates
Using EPRI factors (time adjusted), authors
calculate total employment impacts for
2004-2017 (in person-years) in California, with
an assumption that only 30% of manufacturing
is locally provided. Here, the person-year/MW
parameters are derived from their 2005
estimated scenario of added capacity.
Wind 17
person-years/MW
5
person-years/MW
EWEA 2003.
Figures derived from an Input-Output model.
Solar PV 20 Jobs/MW 30 Jobs/MW EPIA 2004.
Information on existing direct employment in
Europe (the 30 jobs/MW figure includes
installation, consulting, retail, and other
services)
Small hydro 2,200 (1,200 manufacturing + 1,000
consulting and research) people
employed in Europe in 2002
ESHA, www.esha.be/
Solar thermal
power
356 person-years employed in U.S. in
2002
Data from US DOE, EIA
Solar thermal
power
16.33
person-years/MWe
1.58
person-years/MWe
Schwer & Riddel 2004.
Estimated employment impacts of 3 x 100 MWe
concentrating solar plants in Nevada.
Additional Explanatory Notes:
Methodological premise. Employment impacts of renewable energy development are difficult to measure in a
precise way, especially if total employment figures—including both direct and indirect jobs—are to be
estimated. A proper approach would be to build Input-Output analysis models (see note-f below), an analytic
tool that macroeconomists use to derive employment multipliers with which to predict the number of jobs
(direct and indirect) created by sales increases from a given sector or industry. A simplified alternative is to use
analytical approaches to define employment coefficients, generally based on (a) information on labor time
needed for a unit of power (i.e. person-years per MW), or (b) data on expenditure necessary to support a

74
full-time job annually (person-years/USD invested).
Table N24c summarizes some of the most relevant employment coefficients developed by analysts. The
following points summarize additional explanatory elements on the employment impact parameters and
estimates presented:
(a) Most of the studies in the literature focus on direct jobs that is, employment generated within the renewable
energy industry chain, usually disaggregated in the following categories: manufacturing, construction and
installation, operation and maintenance, and fuel collection. They therefore do not count the indirect jobs, that
is, those jobs created in the economy by multiplier effects in the renewable energy sectors.
(b) There are different ways to build employment impact indicators. Many studies report on employment in the
manufacturing and installation segment in terms of person-years per MW, that is the amount of labor time
required to manufacture equipment (or build a power plant) equivalent to MW of power. In Tables N24b and
N24c, this indicator has been selected to offer the picture of how many full-time employees were working in
renewable energy manufacturing and installation in 2004. For this reason, whenever possible, other
employment coefficients from the literature were adapted to person-years values. The indicator Jobs per MW is
used in Table N24c with regards to the O&M and fuel collection segments of labor, it refers to permanent
employment, that is the number of laborers needed continuously to support the ongoing operation of a power
plant with a maximum output of one MW.
(c) Generally the employment created is measured against the power capacity installed (MWp), as it is in this
report, but an alternative may be to consider as common denominator the average power capacity (MWa), the
power capacity de-rated for taking into account the capacity factor of each energy technology. This way an
indicator that standardizes the actual energy outputs is obtained and values referring to employment impacts of
different RE technologies can be compared.
(d) Table N24a reports the range of values of estimated employment obtained by using the lowest and the
highest employment coefficients of Table N24c for each technology. While for solar hot water heaters there are
not many employment studies and parameters available, it should be noted that the Chinese industry is
representative of the largest production (72% of global production in 2004). Therefore the choice was to use
Chinese industry data to derive employment coefficients and adjust them to account for lower labor intensity
for the non Chinese production figures. As for biofuels, the employment parameter (Table N24c) and the
estimate figure (Table N24a) refer to total direct employment in the relevant agriculture and industrial sectors,
thus it is presented separately from the other employment estimates.
(e) All figures estimating the labor requirement of renewable energy presented in Table N24c have been
developed in the OECD countries, except for solar heating and biofuels. It can be recognized that in a
developing country context the same processes and markets can be more labor intensive per MW, thus leading
in a probable underestimation of global employment when applied to global renewable energy capacity figures
in Table N24a.
(f) For further reference, see MITRE Project (EC 2002b) for a good example of this method applied to the
growth scenarios of renewables across technologies and within EU 15 member states: starting from SAFIRE
model of market penetration for the different RE technologies, an input-output model named RIOT
(Renewables Enhanced Input Output Tables) was used to calculate production functions representing the value

75
of inputs (including employment) needed from the different sectors of the economy to obtain a unit of energy
from different energy sources (both conventional and renewables). These parameters were then used to model
net employment impacts (including the substitution of conventional energy sector jobs) in the scenarios at 2010
and 2020.
Table N24c. Summary of Relevant Employment Coefficients
Estimates of Employment
Coefficients
Technology
Manufacturing &
Installation
(person-yrs/MWp)
O&M and
Service
(Jobs/MWp) Source
Type of study, type of impact, and
basic assumptions
Small hydro 11.30 0.22 Pembina
Institute 2004
Data from industry interviews and
literature review; direct impacts only.
3.80 0.10 Singh et al.
2001 (REPP)
Analytical study from industry
survey of labor requirements for a
37.5 MW wind farm with 30%
capacity factor; direct
employment impacts.
7.40 0.20 Heavner &
Churchill
2002
Direct employment impacts projected
from planned projects by California
Energy Commission.
6.0 (100-450 per
TWh)
ECOTEC
2002
Based on information from EWEA,
citing 20,000 direct jobs in wind
industry in Europe in 2001.
Wind
3.92 0.10 Pembina
Institute 2004
Data from industry interviews and
literature review; direct impacts only.
8.5 0.32 – 2.08* Singh et al.
2001 (REPP)
Analytical study from industry survey
of labor requirements for a set of
co-firing plants (100 MW-750 MW)
and several biofuels; direct
employment impacts.
Biomass
2.0 0.95* Pembina
Institute 2004
Data from industry interviews and
literature review; direct impacts only.
4.0 1.70 Pembina
Institute 2004
Data from industry interviews and
literature review; direct impacts only.
Geothermal
17.50 1.70 Heavner &
Churchill
2002
Direct employment impacts projected
from planned projects by California
Energy Commission.
Solar PV 32.33 2.25 Singh et al.
2001 (REPP)
Analytical study from industry survey
of labor requirements for a 2 kWp

76
solar roof market; direct employment
impacts.
25.10 2.5 Pembina
Institute 2004
Data from industry interviews and
literature review; direct impacts only.
17.0** 1.0 (O&M) +
30.0
(installation,
retailing,
other)
Greenpeace
& EPIA 2005
These parameters have been developed
with EPIA for a scenario analysis of
direct employment in Europe.
6.25 0.70 US DOE
1997
Derived from information on the 9
plants (350 MW) of solar thermal
electricity generation in California.
Solar
thermal
power
20.0 per GWh 1.0 per GWh GAC 2005 Gross direct and indirect employment
estimates from I-O model developed in
Germany.
Solar hot
water (***) 8,330 per mill. m2 3,850 per
mill. m2
Author
estimates
Derived from 2000 Chinese industry
figures, assuming 1/3 of employment
absorbed by manufacturing and 2/3 by
O&M.
Ocean
(tidal) power
4.22 0.10 Pembina
Institute 2004
Data from industry interviews and
literature review; direct impacts only.
Biofuel
(ethanol)
33 direct jobs per million liters of
production
Goldemberg
2004
Estimated starting from data and
parameters developed by UNICA,
Brazilian sugar cane producers
association.
Notes:
(*) = Includes fuel collection and processing activities.
(**) = Does not include installation of PV systems, accounted for together with the O&M figure.
(***) = Parameters estimated by the authors based on data collected from the Chinese solar water heaters
industry (6 mill. m2 of annual production and 26 mill. m2 of installed systems in 2000), which by 2004 had
grown to account for about 70% of world annual production (13 mill. m2 annual production and 65 mill. m2 of
installed systems).
Sources: Adapted from all sources indicated in 3rd column and from Kammen et al. 2004.
Individual jobs estimates:
The China solar hot water industry employed 200,000 people in 2002, with a market size of 40 million installed
and 12 million produced annually (Li 2005). The top eight manufacturers are Himin, Tsinghua Yang AGuang,
Linuo Paradigma, Tianpu, Hua Yang, Mei Da, Sunpu, and Five Star. Considering growth in the market and
installed base, by 2004 there may have been at least 250,000 employed.

77
Europe wind power jobs from Global Wind Energy Council. Nepal biogas industry from Nepal Biogas Support
Programme. Other jobs estimates from report contributors. Europe small hydro and solar PV jobs from EREC
2004.
Sources for job estimation parameters and methods: EC 2002b; ECOTEC 2002; GAC 2005; Goldemberg 2004;
Heavner & Churchill 2002; Kammen et al. 2004; Pembina Institute 2004; Schwer & Riddel 2004; and US DOE
1997.
[N25] Policy Targets
Sources for Table 3 and Figure 11 are: IEA, OECD, and JREC policy databases (IEA 2005a and 2005b);
DSIRE database (DSIRE 2005); Li 2002 and 2005; Sawin and Flavin 2004; Thailand DEDE 2004; South
Africa Department of Minerals and Energy 2003; and many other submissions from report contributors.
Some of these targets are not legally binding within the countries concerned, but are rather indicative or
planning targets. Some targets may include capacity or energy from large hydropower.
China’s targets are from the draft renewable energy development plan being prepared by NDRC. The plan has
not yet been approved by the government. The Chinese renewable energy law from February 2005 requires
NDRC to publish the renewable energy development plan, including targets, by January 2006. Targets also
include 140 million m2 of solar hot water by 2010, 270 million m2 of solar hot water by 2020, 20 GW of wind
by 2020, and 20 GW of biomass by 2020, and 12.5% of total electric power capacity by 2020 (which would be
an anticipated 125 GW out of 1,000 GW). China’s target of 10% of total installed electricity from renewable
energy, excluding large hydro, would mean 60 GW of renewables out of 600 GW total power capacity. In
relation to the target of 5% total primary energy by 2010, China today stands at approximately 3.3-3.5% of total
primary energy from renewables (excluding large hydropower).
In 2004, Korea established a goal of 1.3 GW of grid-connected solar PV by 2011. This follows a previously
announced target of 100,000 solar PV homes by 2011, an expected 300 MW.
Korea’s target of 7% electricity by 2011 includes large hydropower. Excluding large hydropower, the target
becomes 5.6%.
Japan also has targets of 4.8 GW from solar PV and 3 GW from wind. Although these targets remain “on the
books,” they have been eclipsed by the RPS policy of 1.35% and are no longer regarded as primary.
EU data also from EC 2004a and 2004b, which provide the best overview of EU policy targets..
Note: The percentage contributions of RES-E are based on the national production of RES-E divided by the
gross national electricity consumption. For the EU15, the reference year is 1997. For the EU10 (Czech
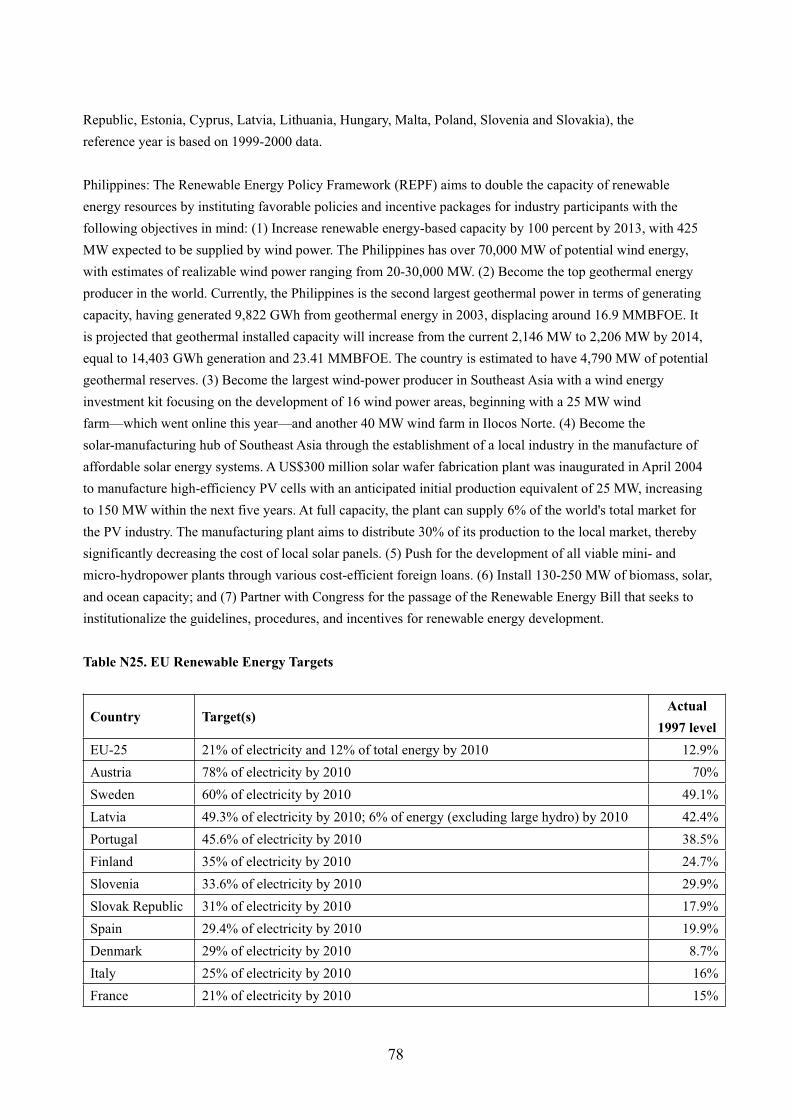
78
Republic, Estonia, Cyprus, Latvia, Lithuania, Hungary, Malta, Poland, Slovenia and Slovakia), the
reference year is based on 1999-2000 data.
Philippines: The Renewable Energy Policy Framework (REPF) aims to double the capacity of renewable
energy resources by instituting favorable policies and incentive packages for industry participants with the
following objectives in mind: (1) Increase renewable energy-based capacity by 100 percent by 2013, with 425
MW expected to be supplied by wind power. The Philippines has over 70,000 MW of potential wind energy,
with estimates of realizable wind power ranging from 20-30,000 MW. (2) Become the top geothermal energy
producer in the world. Currently, the Philippines is the second largest geothermal power in terms of generating
capacity, having generated 9,822 GWh from geothermal energy in 2003, displacing around 16.9 MMBFOE. It
is projected that geothermal installed capacity will increase from the current 2,146 MW to 2,206 MW by 2014,
equal to 14,403 GWh generation and 23.41 MMBFOE. The country is estimated to have 4,790 MW of potential
geothermal reserves. (3) Become the largest wind-power producer in Southeast Asia with a wind energy
investment kit focusing on the development of 16 wind power areas, beginning with a 25 MW wind
farm—which went online this year—and another 40 MW wind farm in Ilocos Norte. (4) Become the
solar-manufacturing hub of Southeast Asia through the establishment of a local industry in the manufacture of
affordable solar energy systems. A US$300 million solar wafer fabrication plant was inaugurated in April 2004
to manufacture high-efficiency PV cells with an anticipated initial production equivalent of 25 MW, increasing
to 150 MW within the next five years. At full capacity, the plant can supply 6% of the world's total market for
the PV industry. The manufacturing plant aims to distribute 30% of its production to the local market, thereby
significantly decreasing the cost of local solar panels. (5) Push for the development of all viable mini- and
micro-hydropower plants through various cost-efficient foreign loans. (6) Install 130-250 MW of biomass, solar,
and ocean capacity; and (7) Partner with Congress for the passage of the Renewable Energy Bill that seeks to
institutionalize the guidelines, procedures, and incentives for renewable energy development.
Table N25. EU Renewable Energy Targets
Country Target(s) Actual
1997 level
EU-25 21% of electricity and 12% of total energy by 2010 12.9%
Austria 78% of electricity by 2010 70%
Sweden 60% of electricity by 2010 49.1%
Latvia 49.3% of electricity by 2010; 6% of energy (excluding large hydro) by 2010 42.4%
Portugal 45.6% of electricity by 2010 38.5%
Finland 35% of electricity by 2010 24.7%
Slovenia 33.6% of electricity by 2010 29.9%
Slovak Republic 31% of electricity by 2010 17.9%
Spain 29.4% of electricity by 2010 19.9%
Denmark 29% of electricity by 2010 8.7%
Italy 25% of electricity by 2010 16%
France 21% of electricity by 2010 15%

79
Greece 20.1% of electricity by 2010 8.6%
Ireland 13.2% of electricity by 2010 3.6%
Germany 12.5% of electricity and 4% of energy by 2010; 20% of electricity by 2020 4.5%
Netherlands 12% of electricity by 2010 3.5%
United Kingdom 10% of electricity by 2010 1.7%
Czech Republic 8% of electricity by 2010; 5-6 % of energy by 2010; 8-10% of energy by 2020 3.8%
Poland 7.5% of electricity by 2010; 7.5% of energy by 2010; 14 % of energy by 2020 1.6%
Lithuania 7% of electricity by 2010; 12% of energy by 2010 3.3%
Belgium 6% of electricity by 2010 1.1%
Cyprus 6% of electricity by 2010 0.05%
Luxembourg 5.7% of electricity by 2010 2.1%
Estonia 5.1% of electricity by 2010 0.2%
Malta 5% of electricity by 2010 0%
Hungary 3.6% of electricity by 2010 0.7%
Note: Portugal’s 35.6% target, Finland’s 35% target, and the Netherlands’ 12% target from IEA JREC database.
Portugal’s original target was 39%, Finland’s was 31.5% and the Netherlands’ was 9%.
[N26] Power Generation Promotion Policies
Sources for Table 4: IEA, OECD, and JREC databases (IEA 2005a and 2005b); IEA 2004b; Sawin & Flavin
2004; Wahnschafft & Soltau 2004; Johansson & Turkenburg 2004; Martinot et al. 2005; Beck & Martinot 2004;
Osafo & Martinot 2003; Thailand DEDE 2004; Tumiwa 2005; Rousseff 2005; Austrian Energy Agency 2005;
Stenzil et al. 2003; EWEA 2005c; EAEF 2005; EEA 2004; ECN Renewable Energy Policy Info website (and
Vries et al. 2003) (www.renewable-energy-policy.info); country references noted in country data section;
submissions from report contributors. IEA 2004b in particular contains a wealth of historical and current
information on IEA country policies. EU data also from EC 2004a and 2004b.
Notes for Table 4:
(a) Entries with an asterisk (*) mean that some states/provinces within these countries have state/province-level
policies but there is no national-level policy. See separate table for RPS policies by state/province. In the case
of Inida, however, the Electricity Act of 2003 mandates state-level policies, and states are developing different
combinations of policies, including feed-in tariffs and RPS. Even though this could not be considered a
“national feed-in law,” the mandate is having a similar effect.
(b) Japan’s net metering is voluntary by utilities and features separate buy/sell transactions, although the selling
price is typically the same as the purchase price. Japan’s feed-in tariffs are also voluntary by utilities, and some
utilities have switching to annual caps with bidding.
(c) Spain’s feed-in tariff system incorporates both fixed total prices and price premiums added to variable-cost
components of electricity tariffs.
(d) Some policies listed may not be active or may not have associated implementing regulations developed. It is
very difficult to separate active, inactive, and “not yet implemented” policies without extremely detailed data

80
gathering. So the table reflects enacted policies, and the information it portrays should be considered as
“notional” rather than “definitive.”
(e) Mexico has an atypical form of net metering that allows intermittent self-generators access to the grid for
surplus self-generation, to be used at other times of the day, subject to certain limits based on local utility
marginal costs. Mexico also allows wheeling costs to be based on average plant capacity factor.
(f) Norway had a type of feed-in policy (added premium) for wind power, but this was discontinued in 2003.
[N27] Feed-in Laws
Sources for Table 7: IEA OECD Policies database (IEA 2005a); IEA 2004b; Sawin & Flavin 2004; other
sources from Table 10; REAccess 5/10/05 for United States, Washington State; REAccess 5/16/05 for Turkey;
Austrian Energy Agency 2005; ECN Renewable Energy Policy Info website
(www.renewable-energy-policy.info); country references noted in country data section; submissions from report
contributors.
Italy adopted CIP6/92 from 1992 to 1995. Denmark, Spain, and Portugal all had forms of feed-in policies
earlier than those shown in Figure 12, but the dates in Figure 12 reflect the modern versions of the laws that are
credited with the major market impacts which have taken place. Other countries also had earlier pre-cursor
feed-in policies that might be considered the original legislative enactment.
Notes for Table 7
(a) Tariffs can vary depending on size of plant, region of plant, whether onshore or offshore in the case of wind,
year of commissioning of plant, season of operation in which the tariff is paid (summer vs. winter), and/or year
of plant’s operational life in which the tariff is paid. Some tariffs decline substantially or become invalid after a
certain year of plant operation, and this varies widely by country. Ranges given reflect typical prices
considering these factors, for Germany in 2004 and for other countries in 2002-2004.
(b) Germany’s feed-in law has undergone continuous updating, reflecting changing conditions, objectives, and
technology characteristics and costs, first in 1994, and then in 1998, 2000, and 2004.
(c) Denmark’s price figures are from the old pricing system before feed-in tariff was suspended in 2003.
(d) “---” means law does not cover that technology.
(e) Some tariffs have upper limits to plant size. Czech Republic and Slovenia limit small hydro to 10 MW.
Latvia limits small hydro to 2MW. Indonesia limits all plants to 1 MW.
(f) Spain’s feed-in tariff system incorporates both fixed total prices and price premiums added to variable-cost
components of electricity tariffs.
(g) In India, national feed-in tariffs (common guidelines to all states for a minimum buy-back rate of Rs.
2.25/kWh in order to bring uniformity) were declared by MNES in 1993. However, two states, Gujarat and
Tamil Nadu, were offering attractive buy-back rates even earlier in order to attract private sector investment in
wind (MNES annual reports for 1991-1994). Similarly, Maharastra and Tamil Nadu had promotional policies
for bagasse-based cogeneration. Tamil Nadu had evolved a scheme in 1988 (TNEB-Tamil Nadu Electricity
Board Notification dated 12 December 1988) called "Power feed scheme" permitting co-generators and

81
private-sector power producers of 2 MW capacity and greater to sell surplus power to the grid. It covered
co-generation units, mini- and micro-hydro, wind farms, and diesel/gas turbines. The power purchase rate for
this scheme in 1990-91 was Rs. 1.00 per unit subject to yearly review. MSEB (Maharashtra State Electricity
Board), on the other hand, offered Rs. 1.20 per unit with periodic revisions. (Source for both the above is
Winrock International & IDEA 1993.)
(h) India’s Electricity Act of 2003 mandates national targets by 2012 and provides guidelines for fixing RPS
and feed-in tariffs for each state.
(i) PURPA was first enacted in the U.S. in 1978 and actively implemented by many states during the 1980s. By
the 1990s, fewer states still had active PURPA implementation, although currently several states still implement
PURPA as a feed-in tariff for small projects; examples of this exist in Idaho, Minnesota, and Oregon.
(j) Some countries have feed-in tariffs that apply only to solar PV.
(k) Turkey Adopts National Feed-in Law for Renewables, news item at REAccess.com, 16 May 2005, at
www.renewableenergyaccess.com/rea/news/story?id=29822
(l) Slovakia: Feed-in-Tariffs for Green Electricity 2006 issued. In June 2005, the Slovak Regulator has issued
the
feed-in-tariffs for Electricity from Renewable Energy Sources and CHP for the year 2006. This latest decree
brings about considerably higher tariffs, as compared to the current regulation. For example, the tariff for
electricity from newly installed wind power plants put into operation after January 1st, 2005, is fixed with
2,800 Slovak Crowns per MWh (about 72 Euro). These tariffs are set by the Regulatory Office for one year. A
complete table with the tariffs is now online on enerCEE:
www.energyagency.at/enercee/sk/supplybycarrier.htm#res
[N28] Renewables Portfolio Standards
RPS information comes from DSIRE database; Martinot et al. 2005; IEA 2004b; Pollution Probe 2004; Linden
et al. 2005; ECN Renewable Energy Policy Info website (www.renewable-energy-policy.info); submissions
from report contributors.
Some RPS targets include large hydro, for example in Wisconsin, Maine, New Jersey, Texas, Hawaii, Maryland,
New York, Pennsylvania, District of Columbia, and British Columbia, while other targets restrict renewables to
a certain maximum size, with the maximum usually falling between 1-30 MW.
A 2005 study by Global Energy Decisions estimated that state RPS laws currently existing in the United States
would require an additional 52 GW of renewable energy by 2020, which would more than double existing U.S.
renewables capacity.

82
Table N28a. States, Provinces, and Countries Adopting Renewables Portfolio Standards
Year Enacted State/Province/Country Final Target
1997 Massachusetts, USA 4% by 2009 then +1%/yr
Connecticut, USA 10% by 2010 1998
Wisconsin, USA 2.2% by 2011
Maine, USA 30% ongoing
New Jersey, USA 6.5% by 2008
Texas, USA 2,880 MW by 2009
1999
Italy 2% from 2002
Arizona, USA 1.1% by 2007-2012
Hawaii, USA 20% by 2020
Nevada, USA 15% by 2013
Australia 1.25% in 2004, increasing through 2010 to meet
national target of 9,500 GWh/year
2001
Flanders, Belgium 6% by 2010
California, USA 20% by 2017
New Mexico, USA 10% by 2011
United Kingdom 10% by 2010 and 15% by 2015
2002
Wallonia, Belgium 12% by 2010
Minnesota, USA 10% by 2015
Japan 1.35% by 2010
Sweden 16.9% by 2010
2003
Maharashtra, India compulsory but no percentage
Colorado, USA 15% by 2015
Maryland, USA 7.5% by 2019
New York, USA 24% by 2013
Pennsylvania, USA 8% by 2020
Rhode Island, USA 16% by 2019
Madhya Pradesh, India 0.5%
Karnataka, India 5-10%
Andhra Pradesh, India to be set
Orissa, India 2 million kWh by 2006-2007
Poland 7.5% by 2010
Nova Scotia (Canada) 5% by 2010
Ontario (Canada) 10% by 2010
Prince Edward Is. (Canada) 15% by 2010, 100% by 2015
2004
Thailand 5% of future new generation added
District of Columbia, USA 11% by 2022 2005
Gujarat, India 5% by 2010
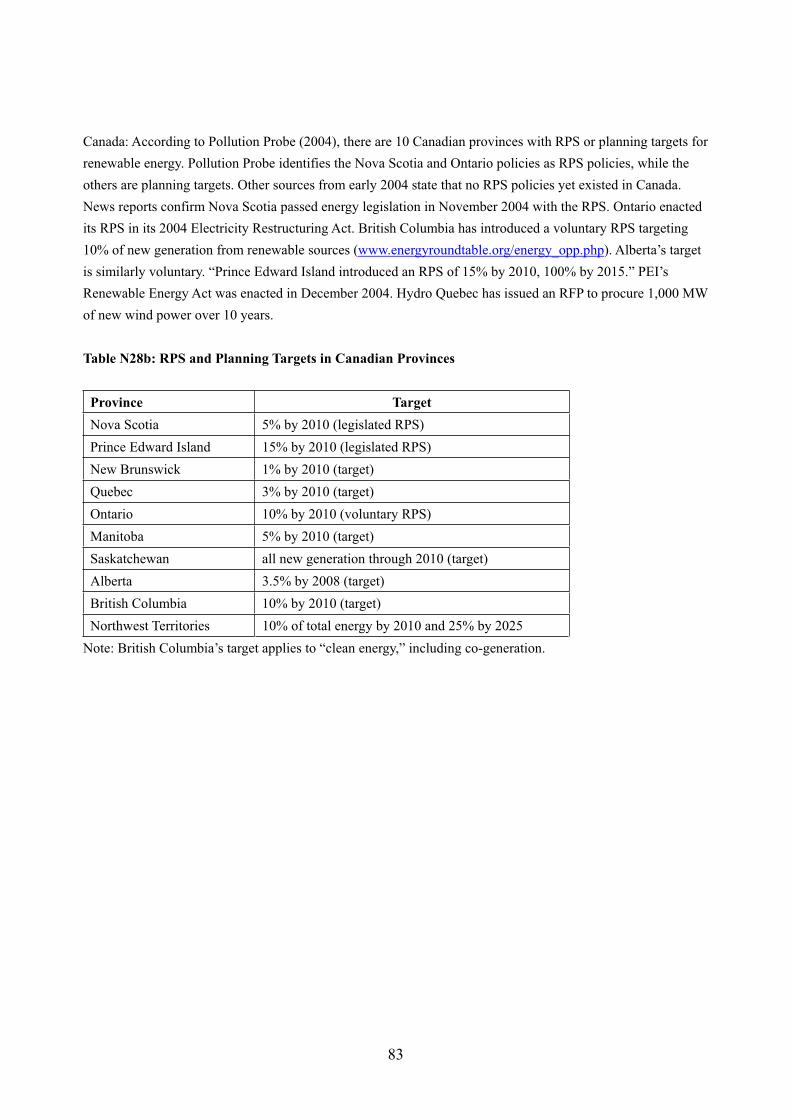
83
Canada: According to Pollution Probe (2004), there are 10 Canadian provinces with RPS or planning targets for
renewable energy. Pollution Probe identifies the Nova Scotia and Ontario policies as RPS policies, while the
others are planning targets. Other sources from early 2004 state that no RPS policies yet existed in Canada.
News reports confirm Nova Scotia passed energy legislation in November 2004 with the RPS. Ontario enacted
its RPS in its 2004 Electricity Restructuring Act. British Columbia has introduced a voluntary RPS targeting
10% of new generation from renewable sources (www.energyroundtable.org/energy_opp.php). Alberta’s target
is similarly voluntary. “Prince Edward Island introduced an RPS of 15% by 2010, 100% by 2015.” PEI’s
Renewable Energy Act was enacted in December 2004. Hydro Quebec has issued an RFP to procure 1,000 MW
of new wind power over 10 years.
Table N28b: RPS and Planning Targets in Canadian Provinces
Province Target
Nova Scotia 5% by 2010 (legislated RPS)
Prince Edward Island 15% by 2010 (legislated RPS)
New Brunswick 1% by 2010 (target)
Quebec 3% by 2010 (target)
Ontario 10% by 2010 (voluntary RPS)
Manitoba 5% by 2010 (target)
Saskatchewan all new generation through 2010 (target)
Alberta 3.5% by 2008 (target)
British Columbia 10% by 2010 (target)
Northwest Territories 10% of total energy by 2010 and 25% by 2025
Note: British Columbia’s target applies to “clean energy,” including co-generation.
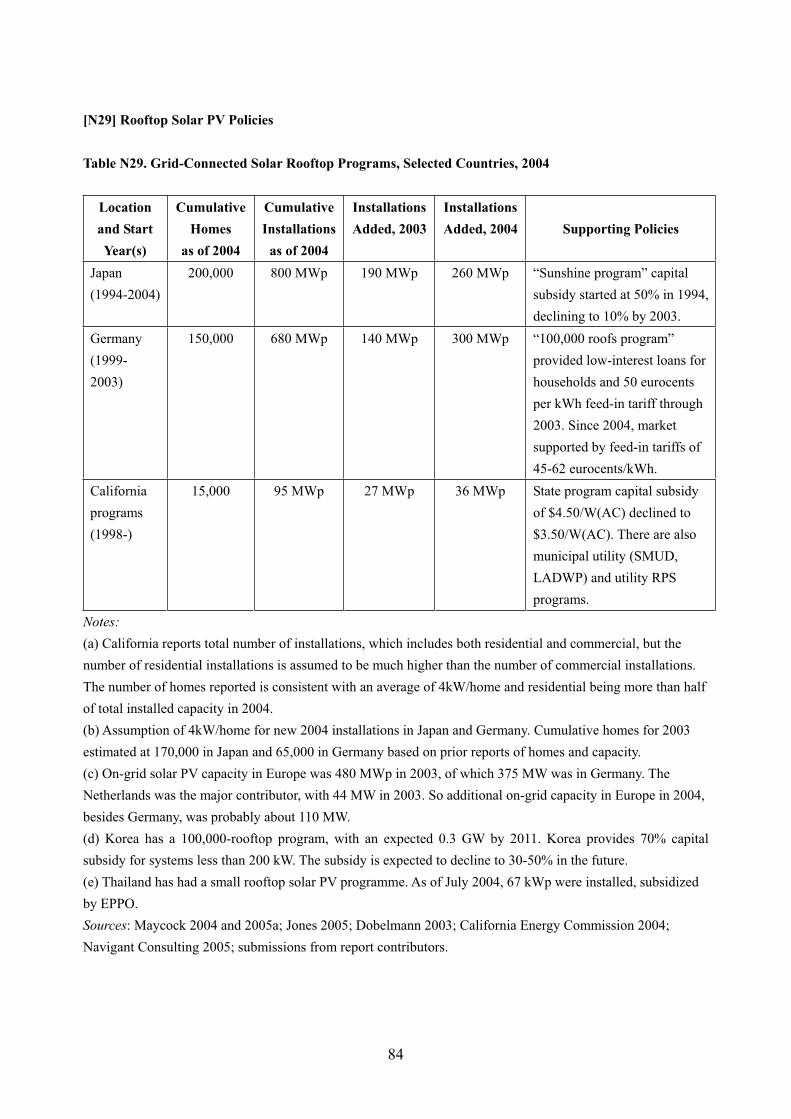
84
[N29] Rooftop Solar PV Policies
Table N29. Grid-Connected Solar Rooftop Programs, Selected Countries, 2004
Location
and Start
Year(s)
Cumulative
Homes
as of 2004
Cumulative
Installations
as of 2004
Installations
Added, 2003
Installations
Added, 2004 Supporting Policies
Japan
(1994-2004)
200,000 800 MWp 190 MWp 260 MWp “Sunshine program” capital
subsidy started at 50% in 1994,
declining to 10% by 2003.
Germany
(1999-
2003)
150,000 680 MWp 140 MWp 300 MWp “100,000 roofs program”
provided low-interest loans for
households and 50 eurocents
per kWh feed-in tariff through
2003. Since 2004, market
supported by feed-in tariffs of
45-62 eurocents/kWh.
California
programs
(1998-)
15,000 95 MWp 27 MWp 36 MWp State program capital subsidy
of $4.50/W(AC) declined to
$3.50/W(AC). There are also
municipal utility (SMUD,
LADWP) and utility RPS
programs.
Notes:
(a) California reports total number of installations, which includes both residential and commercial, but the
number of residential installations is assumed to be much higher than the number of commercial installations.
The number of homes reported is consistent with an average of 4kW/home and residential being more than half
of total installed capacity in 2004.
(b) Assumption of 4kW/home for new 2004 installations in Japan and Germany. Cumulative homes for 2003
estimated at 170,000 in Japan and 65,000 in Germany based on prior reports of homes and capacity.
(c) On-grid solar PV capacity in Europe was 480 MWp in 2003, of which 375 MW was in Germany. The
Netherlands was the major contributor, with 44 MW in 2003. So additional on-grid capacity in Europe in 2004,
besides Germany, was probably about 110 MW.
(d) Korea has a 100,000-rooftop program, with an expected 0.3 GW by 2011. Korea provides 70% capital
subsidy for systems less than 200 kW. The subsidy is expected to decline to 30-50% in the future.
(e) Thailand has had a small rooftop solar PV programme. As of July 2004, 67 kWp were installed, subsidized
by EPPO.
Sources: Maycock 2004 and 2005a; Jones 2005; Dobelmann 2003; California Energy Commission 2004;
Navigant Consulting 2005; submissions from report contributors.

85
[N30] Other Power Generation Promotion Policies
See Martinot et al. (2005) for further details and full references on U.S. public benefit funds (available at
www.resource-solutions.org).
Net metering policies from Martinot et al. (2005), plus IEA and JREC policy databases (IEA 2005a and 2005b)
and submissions from report contributors.
[N31] Public Competitive Bidding and Other Regulatory Measures
Many broad policies for power sector reform/restructuring also affect renewable energy in significant ways,
beyond the administrative measures specifically targeting renewable energy. Such policies are beyond the scope
of this report, but good discussion can be found in Beck & Martinot (2004).
Table N31. Recent Public Competitive Bidding of Wind Power, China and Canada
Country (Year) Bidding
Award Prices
(local currency)
Award Prices
(U.S. cents)
Canada (2004) 1,000 MW in Quebec CAN 6.5 cents/kWh 5.2 cents/kWh
China (2004) 100 MW in Inner Mongolia
100-200 MW in Jilin
100-200 MW in Jilin
100-150 MW in Jiangsu
CNY 0.382/kWh
CNY 0.509/kWh
CNY 0.509/kWh
CNY 0.519/kWh
4.6 cents/kWh
6.1 cents/kWh
6.1 cents/kWh
6.2 cents/kWh
China (2003) 100 MW in Jiangsu
100 MW in Guangdong
CNY 0.437/kWh
CNY 0.501/kWh
5.3 cents/kWh
6.1 cents/kWh
Notes:
(a) Project size ranges in China reflect optional additional capacity expansions that can take place after the
initial development of 100 MW in each project.
(b) An additional three concessions for 450 MW of bidding in 2005 was mentioned in Ku et al. 2005.
(c) Details of Ontario’s programs can be found on the Ontario Power Authority Web site,
www.ontarioelectricityrfp.ca.
(d) Exchange rates used are 1.24 CAN and 8.28 CNY.
Sources: Ku et al. 2005; submissions from report contributors.
[N32] Solar Hot Water Policies
More information on China can be found in Li (2005).
For more information about solar hot water policies in Spain, see: Instituto para la Diversificación y Ahorro de

86
la Energía (Institute for Energy Diversification and Saving), at www.idae.es and Comision Nacional de la
Energia (National Energy Commission), www.cne.es and www.energias-renovables.com
For specialized news group on renewables in Spain, see:
www.energias-renovables.com/paginas/Contenidosecciones.asp?Id=5993 and
www.energias-renovables.com/paginas/Contenidosecciones.asp?ID=5202&Tipo=&Nombre=Solar%20t%C3%
83%C2%A9rmica
Agència d’Energia de Barcelona (Barcelona Energy Agency), at www.barcelonaenergia.com
For Barcelona Solar Ordinance, see www.barcelonaenergia.com/cas/observatorio/ost/ost.htm
[N33] Biofuels Policies
Table N33. Ethanol and Biodiesel Blending Mandates, Selected Countries
Year
Enacted Country/State/Province
Ethanol Blend
(percentage)
Biodiesel Blend
(percentage)
1975 Brazil (national) 22-25% 2% by 2005
1997 United States (state of Minnesota) 10%
20% by 2013
2% (future)
--- Dominican Republic (national) 15% by 2015 5% by 2015
--- China (provinces of Heilongjiang, Jilin,
Liaoning, and Henan)
10% ---
2003 India (9 states and 7 federal territories) 5% ---
United States (state of Hawaii) 10% by 2006 --- 2004
Columbia (national) 10%
Canada (province of Ontario) 5% by 2007 2005
United States (state of Montana) 10%
Note: As part of Thailand’s national 8% of energy target by 2011, biomass transport fuels are targeted at 1570
ktoe/year, which could be achieved by 3 million liters/day of ethanol and 2.4 million liters/day of biodiesel. But
it is still unclear what the actual blending mandates will be.
Sources: Submissions from report contributors. Some of the information is inadequately verified.
In Canada, the province of Ontario announced in 2004 that it intends to require that all gasoline sold there must
contain an average of 5% ethanol by 2007. The province of Saskatchewan enacted an ethanol fuel act in 2002
that creates the legal framework to mandate ethanol blending with gasoline and is planning to move in that
direction in 2005; the province of Manitoba is also considering enacting a policy to support ethanol blending.

87
[N34] Green Power Purchasing and Utility Green Pricing
Recent data on green power customers are not readily available. Most recent data show 600,000 green power
customers in Germany (almost double from 2002) and almost 3 million in the Netherlands. According to some
sources, Netherlands as of the end of 2003 was 2.2 million. UK and the Switzerland are almost the same
number in 2004 as of the end of 2002, they were 45,000 and 46,000 for each.
http://www.greenprices.com gives roughly 4 million green power customers total in Europe. Individual county
numbers for Europe totaled together give a slightly smaller number, perhaps 3.7 or 3.8 million.
Bird et al. (2002) gives these totals of green power consumers for 2002: Australia: 60,000; Canada: 6,000;
Finland: 8,000 in 2001; Germany: 325,000 (including 250,000 large hydro); Japan: 38,000; Netherlands:
775,000; Sweden: 9,000 GWh; Switzerland: 46,000; and United Kingdom: 50,000. Australia government (2004)
gives 70,000 green power consumers.
Sources for green power include: Bird et al. 2002, Bird & Swezey 2004, Martinot et al. 2005, and submissions
from report contributors.
An important distinction to make in considering numbers of green power customers is what percentage of these
purchases are for new renewables and thus are serving to expand the deployment of renewable power
generation. Many of the European purchases are for existing large hydro at prices on par with conventional
energy, while the U.S. EPA Green Power Partnership has strict eligibility criteria for new renewables content
(minimum 50% new).
See FOE (2004), which says that only "retired" ROCs in the UK are really comparable to U.S. voluntary
products; most Green Power buyers in the UK are merely subsidizing the utility's need to buy some renewables.
The Shanghai electricity comes from a 3.4 MW wind farm in Fengxian District, with another 20 MW of wind
power capacity coming on line in mid-2005 in two other wind farms. The first round of green electricity
purchases by these 12 enterprises is equal to 50% of the power output from these 3 wind farms. (News release
from the Shanghai Energy Conservation Supervision Center, 12 June 2005.)
The consumer’s cooperative union in Japan that initiated green power in 1999 was the Seikatsu Club Hokkaido
(SCH). Together with a regional utility, SCH established a fund to support the development of new wind
projects in the region. Under the program, SCH collects electricity bills instead of the utility, and the members
who joined the program can make contributions by adding 5% to their electricity bills. SCH also established the
Hokkaido Green Fund (HGF) for contributions from non-members. In turn, the Hokkaido Green Fund
established Hokkaido Civic Wind Co. to allow members to purchase shares of wind projects in return for
dividends from the sale of electricity from the wind turbines. Thus was built the first “citizen-owned” wind
turbine in 2001. By early 2005, the Hokkaido Civic Wind Co. had invested in 7 MW of wind capacity. After
this program, HGF and the Institute for Sustainable Energy Policies established the Japan Green Fund Co. to
allow further citizen investments in renewable energy. By 2005, the Japan Green Fund had constructed five
wind turbines. And by early 2005, there were 1,300 members of HGF’s green pricing program.

88
[N35] Municipal Policies
Table N35a. Cities with Local/Municipal-Scale Renewable Energy Policies, 2004
City
RE
Goals
CO2
Goals
SHW Solar
PV
Planning Demos Other
Adelaide, Australia X X X X
Barcelona, Spain X X X X X X X
Cape Town, South Africa X X X
Chicago, United States X
Daegu, Korea X X X X
Freiburg, Germany X X X X X
Gelsenkirchen, Germany X X
Goteborg, Sweden X X
Gwangju, Korea X X X
The Hague, Netherlands X
Honolulu, United States X
Linz, Austria X
Madison (WI), United States X
Minneapolis, United States X X
Oxford, United Kingdom X X X X X
Portland, United States X X X X X X
Qingdao, China X X
San Diego, United States X
San Francisco, United States X
Santa Monica, United States X X
Sapporo, Japan X X X
Toronto, Canada X
Vancouver, Canada X
Notes:
(a) “X’ indicates significant activity in the given category.
(b) Categories are defined as follows: “RE goals” means targets or goals set for the future share of energy from
renewable energy; “CO2 goals” means future CO2 emissions targets set, usually on a city-wide or per-capita
basis; “SHW” means policies and/or incentives for solar hot water enacted; “Solar PV” means policies and/or
incentives for solar power enacted; “Planning” means overall urban planning approaches considering future
energy consumption and sources; “Demos” means specific projects or one-time demonstrations subsidized by
public funds; and “Other” means other policies or programs.
Sources: International Solar Cities Initiative, www.solarcities.or.kr, and www.martinot.info/solarcities.htm,
December 2004, with updates from DSIRE database and submissions from report contributors. Barcelona
energy improvement plan at www.barcelonaenergia.com.

89
Table N35b. Cities with Future Targets for Renewable Energy Shares, 2004
City
RE share of
municipal
electricity
consumption
RE share of
total city
electricity
consumption
Other targets
Adelaide, Australia 15% by 2014
Aspen (CO), United States 50% currently
Austin (TX), United States 20% by 2020
Cape Town, South Africa 10% by 2020 10% of homes by 2010
have SHW
Chicago (IL), United States 20% by 2006
10% currently
Daegu, Korea 5% of total energy by
2012
Ft. Collins (CO), United States 15% by 2017
Freiburg, Germany 10% by 2010
4% currently
Gwangju, Korea 2% of total energy by
2020
Los Angeles (CA), United States 20% currently
Minneapolis (MN), United States 10% currently
Oxford, United Kingdom 10% of homes by 2010
have SHW and/or solar
PV
Portland (OR), United States 100% by 2010
Sacramento (CA), United States 20% by 2011
San Diego (CA), United States 23% currently
San Francisco (CA), United States 1 MW/year added
Santa Monica (CA), United States 100% currently
Note: Austin’s target includes energy efficiency improvements.
Sources: International Solar Cities Initiative, www.solarcities.or.kr; www.martinot.info/solarcities.htm,
December 2004; DSIRE database.

90
Table N35c. Cities with CO2 Emissions Reductions Targets, 2004
City Target
Adelaide, Australia Zero net emissions by 2012 in buildings
Zero net emissions by 2020 in transport
Calgary, Canada 6% reduction from 1990 levels for corporate and community emissions
Freiburg, Germany 25% below 1992 levels by 2010
Gwangju, Korea 20% below baseline levels by 2020
The Hague, Netherlands City government "CO2 neutral" by 2006; whole city "CO2 neutral" in long
term
Portland (OR), United States 10% below 1990 levels by 2010
Sapporo, Japan 10% below 1990 levels by 2012
Sudbury, Canada >30% reduction below 1990 levels
Toronto, Canada Municipal energy 20% below 1990 levels by 2005
Vancouver (BC), Canada 6% below 1990 levels by 2012 and municipal energy 20% below by 2010
Notes:
(a) Calgary: GHG reduction goal is 6% reduction from 1990 levels for corporate emissions, and 6% reduction
from 1990 levels for community emissions.
(b) Sudbury: GHG reduction goal is 574,800 tons of GHGs per year (77% through energy, 10% through
transportation, 13% through solid waste). This translates into a target of more than a 30% reduction below 1990
levels.
(c) Toronto: GHG reduction goal is 20% from 1990 levels for corporate emissions, 6% for community
emissions.
Sources: International Solar Cities Initiative, www.solarcities.or.kr; www.martinot.info/solarcities.htm,
December 2004; DSIRE database; submissions by report contributors. Vancouver CO2 reduction goal from
http://vancouver.ca/sustainability/coolvancouver/backgrounder.htm; Toronto CO2 reduction goal from
www.city.toronto.on.ca/taf
(San Francisco, CA, Refocus Weekly, 15 June 2005) Politicians from 50 of the largest cities in the world have
signed a treaty to source 10% of their city’s peak electric load from renewable energies. The non-binding
‘Urban Environmental Accord’ was signed at the United Nations World Environment Day conference in San
Francisco. The accord lists 21 specific actions, topped by an action item to “adopt and implement a policy to
increase the use of renewable energy to meet 10% of the city’s peak electric load within seven years.” The
mayors agreed to adopt municipal plans to reduce GHG emissions by 25% by 2030, including a system for
accounting and auditing greenhouse gas emissions. Signatories include Jakarta, Delhi, Istanbul, London, Seattle,
Melbourne, Kampala, Zurich, Dhaka, Moscow, Rio de Janeiro, Copenhagen and Islamabad. Available at
www.wed2005.org/pdfs/Accords_v5.25.pdf?PHPSESSID=d3f44c0bb102b22541fbf9f35b268650
“Green Cities Declaration” (see PDF file)

91
[N36] Rural Energy and Development Assistance
For basic references and sources on rural energy, see World Bank 1996, UNDP et al. 2000, and Goldemberg &
Johansson 2004.
For information on the World Bank’s renewable energy strategies, see:
World Bank Renewable Energy Action Plan, described in World Bank’s RE/EE Annual Report, at
http://siteresources.worldbank.org/INTENERGY/Resources/335544-1111615897422/Annual_Report_
Final.pdf;
World Bank, “Fuel for Thought: Environmental Strategy for the Energy Sector.” (2000 strategy paper),
at
http://www-wds.worldbank.org/servlet/WDSServlet?pcont=details&eid=000094946_0008040539585
“The Strategy of the World Bank in Financing Renewable Energy Projects in South Asia,” at
www.worldenergy.org/wec-geis/publications/reports/renewable/annexes/annex_2.asp#strategy
For information about ASTAE, see www.worldbank.org/astae.
For Global Environment Facility-related information, see:
GEF project briefs and documents, at www.gefweb.org.
Other GEF monitoring and evaluation reports, at:
http://thegef.org/MonitoringandEvaluation/METhemesTopics/METClimateChange/metclimatechange
.html
GEF, Office of Monitoring and Evaluation. 2004. Climate Change Program Study. Washington, DC,
at
http://thegef.org/MonitoringandEvaluation/METhemesTopics/METClimateChange/2004_ClimateCha
nge.pdf
For information about UNEP, see:
Rural Energy Enterprise Development Programme, at
www.uneptie.org/energy/projects/REED/REED_index.htm, www.b-reed.org, and www.c-reed.org
UNEP Sustainable Energy Finance Initiative, at www.sefi.unep.org
UNEP Activities on Renewable Energy, at www.uneptie.org/energy/act/re
For information on UNIDO see: UNIDO initiative on rural energy for productive use, at
www.unido.org/doc/24839 (lists UNIDO projects by technology type)
For information on African Development Bank, see “Renewable Energy Summary,” at
www.afdb.org/en/what_s_new/events/s_minaire_sur_l_nergie_olienne_octobre_2004/adb_intervention_in_rene
wable_energy
The Asian Development Bank (ADB) is currently developing a renewable energy operational and strategic

92
action plan to promote renewable energy by building a pipeline of feasible renewable energy projects. The
ADB established a Renewable Energy, Energy Efficiency and Climate Change (REACH) Program
(www.adb.org/reach), which supports capacity building, institutional development, and project development
activities in the area of energy efficiency and renewables, in 15 DMCs of Asia. It is expected that these
technical assistance interventions will lead to increased lending in the area of renewable energy and energy
efficiency.
[N37] Rural Biomass Use
Further references on rural biomass use include Kartha and Larson 2000; Kartha et al. 2004; Bailis et al. 2005;
Karekezi & Kithyoma 2005; and Elauria et al. 2002.
All data on biomass consumption and rural household energy is from Bailis et al. 2005. Information on the
health impact of traditional biomass use is from Ezzati & Kammen 2002.
Biomass energy is used extensively as fuel in the Philippines, particularly in the residential and industrial
sectors. The types of fuel used in the country are: wood fuel, wood wastes, and other agricultural residues such
as sugar cane bagasse, coconut husk and shell, rice-hull, and industrial and animal wastes. The residential
sector accounted for about 70% of biomass use, with cooking as the major end-use. The shares of various
biomass fuels consumed in the residential sector are 77 % wood fuel, about 19% agricultural
residues, 4% charcoal, and 0.4 % animal manure in the form of biogas. Biomass consumption in the industrial
sector is mainly for steam and power generation, which consumed about 84% of the total consumption of the
sector while baking and commercial cooking used about 1%. The remaining 15% is used in commercial
applications such as fish- and crop-drying, ceramic processing, food manufacturing,
metal works, and brick-making. Applications of biomass energy systems are dominated by ovens/kilns/furnaces
and biomass dryers, roughly 15,000 of each in 1997, along with about 5,000 cook stoves and on the order of
hundreds of biomass-fired boilers and biogas systems, and a few dozen gasifiers (Elauria et al. 2002).
[N38] Traditional Biomass and Improved Cook Stoves
Cook stove data from Li & Shi 2005, AFRENPREN 2004, and Kammen 2005. Kammen (2005) notes that in
Kenya, the Ceramic Jikko stove (KCJ) is found in over 50% of all urban homes, and roughly 16-20% of rural
homes.
China’s National Improved Stove Program operated during the 1980s and 1990s. For a description, see
http://ehs.sph.berkeley.edu/hem/page.asp?id=29.
India’s National Program on Improved Cookstoves lasted from 1985-2002, provided over 100 different models,
and provided a 50-75% direct cash subsidy. The cost of each cook stove was $2-6. Reported lab efficiencies

93
were 20-45% (compared with traditional stove efficiencies of 5-10%). Source: Maithel 2005.
Table N38a: Rural Household Cooking in Developing Countries
Country/Region Households using traditional
biomass for cooking/heating
(million)
Improved (more efficient)
biomass stoves in use
(million)
Africa 130 5
China 190 180
Indonesia 35 n/a
Rest of Asia 30 1
India 130 34
Rest of S. Asia 30 n/a
Latin America 20 n/a
Total 570 220
Notes:
(a) Figures are approximate, based on assumption of 4.4 persons per household for all regions (Worldwatch
Institute 2004). Most data are for 2000.
(b) The biggest improved cook stove (ICS) programs of the world are being undertaken in China where 177
million stoves have been installed so far, covering 76% of rural households and in India where about 30.9
million improved stoves were installed by 1999, covering 23% of rural households (Bhattacharya 2002).
(c) Biomass, mostly traditional use, accounts for a large share of total primary energy supply in many
developing countries. In 2001, this share was 49% in Africa, 25% in Asia, and 18% in Latin America.
“Traditional use” means burning wood, agricultural waste, and dung for home cooking and heating fuel plus for
process heat. Often the biomass fuel itself is “free,” insofar as there is no direct monetary cost, although large
amounts of time, particularly for women, may be used to collect it. A share of biomass is converted to charcoal,
which is then sold commercially for the same uses. (IEA 2003a; Karekezi et al. 2004)
(d) Developing countries at large depend on traditional biomass fuels (charcoal, fuel wood, agricultural
residues, and animal dung) for just over 26% of their total fuel mix (Johansson & Goldemberg 2004; Figures
1.2 and 1.4, pp. 26-27). Sub-Saharan Africa relies on these same fuels for over 61% of total energy supply
(UNDP et al. 2000, Fig. 7, p. 29; McDade 2004).
(e) In China, by the early 1990s, 130 million improved stoves had been installed under the National Improved
Stoves Program (Sinton et al. 2004). This figure increased to 177 million by 2000 (Bhattacharya 2002).
(f) In India, an estimated 130 million rural households use biomass as the primary fuel for cooking. This
compares with about 7 million rural households that use LPG for cooking and about 2 million that rely on
kerosene. In India, 700 million people live in homes where biomass is the primary fuel for cooking. However,
only about 33.6 million, or 17.5% of all Indian homes, use LPG as their primary cooking fuel, with 90% of
rural homes still dependent on some form of biomass. (D’Sa & Murthy 2004).
(g) Roughly two-thirds of African households, more than 580 million people, depend on wood fuels for their
daily cooking and heating needs (Utria 2004).
(h) Currently, about one-fourth of Mexican households (27.2 million people) cook with fuel wood, either

94
exclusively (18.7 million people) or in combination with LPG (8.5 million). Fuel wood use is concentrated
within rural and peri-urban households. Fuel wood is still the main residential fuel in Mexico, accounting for
approximately 50% of total energy use and 80% within rural households. Despite the rapid urbanization
process that has taken place in Mexico in the last 30 years the use of fuel wood has remained virtually constant
with an increasing share of mixed fuel wood-LPG users in total consumption (Masera et al. 2005).
Sources: Karekezi et al. 2004, IEA 2002a, Graham 2001, TERI 2001, and D’Sa & Murthy 2004.
Table N38b. Estimated Number of Improved Biomass Cook Stoves in Selected African Countries, 2001
Country Number of Improved Stoves
Kenya 3,136,739
South Africa 1,250,000
Niger 200,000
Burkina Faso 200,000
Tanzania 54,000
Uganda 52,000
Eritrea 50,000
Ethiopia 45,000
Sudan 28,000
Zimbabwe 20,880
Malawi 3,700
Botswana 1,500
Sources: AFREPREN 2004; African Ministerial Meeting on Energy Proceedings 2004; Kammen 2005.
In Africa, regional organizations like the Southern African Development Community (SADC) have put in place
a number of key interventions aimed at ensuring the sustainable use of energy resources. Since 1997, SADC
started the Programme for Biomass Energy Conservation in Southern Africa (ProBEC) which is implemented
by GTZ. In addition to the German Government, other donors committed to co-funding the program include the
Dutch Ministry for Foreign Affairs (DGIS), UNDP-GEF, and the EU Energy Initiative. The purpose of the
program is the adaptation and development of efficient technologies and management strategies for biomass
energy consumption in households and small businesses in order to use the available resources sustainably. An
expansion of ProBEC to the rest of the continent is requested by the NEPAD Action Plan (iii energy, para 110),
endorsed by the African Union Summit in Mozambique in July 2003.
[N39] Biogas Digesters
Information on biogas digesters is from: the Biogas Support Programme Nepal 2005; Martinot et al. 2002;
Bhattacharya 2002; Karekezi et al. 2004; Graham 2001; TERI 2001; D’Sa and Murthy 2004; China national
biogas action plan; and submissions from report contributors.

95
[N40] Biomass Gasifiers
Information primarily from Bhattacharya 2002.
Note: This report does not cover the lessons and operational experience of different renewable energy
technologies, although that is an important subject. For example, dual-fuel gasifiers in the Philippines suffered
from low acceptability due to technical problems such as gas-cleaning, lack of consumer acceptance, and lower
petroleum prices (Elauria et al. 2002).
[N41] Village-Scale Mini-Grids
Historical data from Martinot et al. 2002. Updates for China and India’s installations and programs from
submissions by report contributors and from Ma 2004 and Li & Shi 2005. See also NREL 2004 for China
program information.
[N42] Water Pumping
Estimates are from the Indian Renewable Energy Development Agency (IREDA) (TERI, personal
communication May 2005); Karekezi & Kithyoma 2005; and Martinot et al. 2002. Results reported are from
GTZ projects. Original sources from Martinot et al. 2002.
Donor programs have demonstrated that PV-powered pumps can be economically competitive with
conventional diesel pumps, in smaller villages up to 2,000 inhabitants. Pumping costs range from
$0.30-1.00/m3 (0.03-0.1 cents/liter), according to GTZ.
Commercial project examples are being conducted by a subsidiary of Australia’s SOLCO in the case of the
Maldives and by U.S.-based Worldwater Corporation in the case of the Philippines.

96
[N43] Solar Home Systems
Table N43a. Solar Home Systems Worldwide, 2004
Country/Region Added in 2004
Existing in 2004
(at least) Sources
China >130,000 450,000-500,000 CREDP 2004; task managers; Martinot
et al. 2002
Sub-Saharan Africa 460,000 AFRENPREN 2004; Kammen 2005
India 20,000 310,000 SHS
(+ 510,000 solar
lanterns)
TERI, as of March 2004
Sri Lanka 15,000-20,000 75,000 World Bank/GEF project;
www.energyservices.lk
Thailand 100,000 100,000 New program for 2004-2005
Bangladesh 15,000-20,000 40,000 World Bank/GEF project and Grameen
Shakti
Mexico >80,000 Huacuz 2000
Other Latin America 50,000
Morocco >80,000 Martinot et al. 2002; data are for 1995
Indonesia 40,000 Tumiwa 2005
Nepal 16,000 80,000 Rai 2004; World Bank [which year?]]
Vietnam 5,000
Others 50,000
Total >320,000 ~ 2 million
Notes:
(a) China: The China REDP project had installed 234,000 systems as of December 2004, 130,000 of these in
2004 and most of the remaining 100,000 in 2003. China had 150,000 SHS as of 2000 (Martinot et al. 2002). Li
et al. (2005) say there is 30 MW of PV in off-grid applications. The Township Electrification program added 20
MW of hybrid systems. 10 MW of SHS, assuming 25W systems, is 400,000. 2002 = 83,000 SHS installed,
2003 = 75,000 installed, 2004 = 130,000 systems installed (+ non-REDP). Assuming 50,000 in 2001, then 2004
existing = 478,000. By end-2003, 410,000 cumulative in six Western provinces, per REDP report. This comes
to a total of 540,000 by end-2004.
(b) Sri Lanka and Bangladesh: As of March 2005, World Bank projects in Bangladesh had installed
30,000-40,000 systems, and Sri Lanka RERD had installed 42,000 systems (see www.energyservices.lk). Sri
Lanka had 3,000 systems as of 2000, and the first RERD project added 30,000 systems.
(c) Thailand: A new government program to electrify the remaining rural households of the country installed at
least 100,000 in 2004 and planned to complete a 300,000-system program in 2005. Prior to 2004, there were no
SHS in Thailand.
(d) Large numbers of installed solar home systems, estimated at 10-20% by some and even higher percentages
by others, may not actually be operational due to lack of service and spare parts, among other reasons (Martinot

97
et al. 2002).
(e) China installed about 40,000 systems from 2000-03 through pilot projects of the “Brightness” program. This
was in addition to 230,000 systems installed through the World Bank/GEF Renewable Energy Development
Project in 2002-04.
Sources: As given in table, plus submissions from report contributors. See also Martinot et al. 2002 and
Niewenhaut et al. 2000.
In Kenya, government and donor projects remain a steady source of income for some PV businesses. There are
more than 20 major PV import and manufacturing companies, and hundreds of rural vendors, many of which
sell a range of brands. Rural vendors sell about half of the household-size modules; the other half are purchased
directly from distributors in major cities. After an initial market fueled by donor aid and government programs
in the early 1990s, by the mid-1990s commercial sales of solar PV for household use had surpassed other uses,
and those sales continued to dominate the Kenyan PV market.
India commercial bank program: In 2003, UNEP initiated a credit facility in Southern India to help rural
households finance the purchase of solar home systems. Two of India’s largest banks, Canara Bank and
Syndicate Bank, along with their eight associate Regional Rural Banks (or Grameen Banks), established a Solar
Loan Programme through their branch offices across Karnataka State and part of neighboring Kerala State.
Previous to this program, only about 1,400 SHS had been financed in Karnataka. In addition to providing
financial support in the form of interest rate subsidies for borrowers, the program provides assistance with
technical issues, vendor qualification, and other activities to develop the institutional capacity for this type of
finance. As of January 2005, the programme had financed nearly 12,000 loans (homes), through more than
2,000 participating bank branches. Sales volume had reached 1,000 systems per month. The fastest growth in
loans is currently in rural areas, thanks in part to the increasing participation of the nine Grameen banks. The
three-year program is on target to finance 20,000-25,000 solar home systems, making it one of the largest SHS
loan programs globally. In response, other Indian banks have recently launched competing SHS loan programs.
(*) Program supported by the United Nations Foundation and the Shell Foundation.
Table N43b. Estimated Number of Solar Photovoltaic Systems Disseminated in Africa
Country Number of Systems Estimated Installed Capacity
(kWp)
Kenya 150,000 3,600
Zimbabwe 84,500 1,689
Botswana 5,700 1,500
Ethiopia 5,000 1,200
Zambia 5,000 400
Eritrea 2,000 400
Tanzania 2,000 300
Uganda 3,000 152
Mozambique (1000) 100

98
Swaziland 1,000 50
Malawi 900 40
Angola (200) 10
South Africa 150,000 8
Total 410,000
Source: AFREPREN 2004
[N44] Rural Access to Electricity
Table N44. Rural Access to Electricity, Selected Countries, 2004
Country
Share of rural
households electrified
(percent)
Number of rural
households remaining
unelectrified
China 98 7 million
(30 million people,
29,000 villages)
Thailand 97 0.3 million
Costa Rica 90
Mexico 84 1 million
Cuba 80
Viet Nam 80 3.5 million
Brazil 70 2.5 million
(12 million people)
Philippines 60 3 million
South Africa 50 2 million
India 44 78 million
Sri Lanka 30 2 million
Bangladesh 19 18 million
Zimbabwe 19
Ghana 17
Nepal 15
Tanzania 2 > 3 million
Kenya 2 > 4 million
Ethiopia 1 < 7 million
Mali 1
Uganda 1 >3.5 million
World Total 350 million
(1.6 billion people)

99
Notes:
(a) By 2004, the most common number cited for number of people without access to electricity was 1.6 billion
(see Goldemberg et al. 2004). This number used to be cited as 2 billion, but was revised downward in recent
years due to analytical refinements. Assuming 4.4 people per household in developing countries (Worldwatch
Institute 2004), this comes to 360 million households. It appears from the data above, in comparison with
previously published statistics, that progress in several countries with rural electrification, including China and
India, has reduced this number significantly. The 14 countries listed in this table represent a majority of the
population in developing countries, yet show only 135 million households unelectrified.
(b) Only 1% of the rural households in Kenya and Uganda has access to electricity. This percentage has been
relatively constant over the past decade (Karekezi & Kimani 2004).
(c) Rural household access to electricity in India was 33% in 2001-02 (Sihag et al. 2004).
(d) Annual rural connection rates vary, and a global estimate does not exist. In Kenya, roughly 3,000-4,000
rural households were receiving new electricity connections each year in the early 2000s.
(e) Rural access to electricity, rather than both rural and urban combined, is more appropriate to compare with
renewable energy, since renewables will not be a competitive option for access in urban (peri-urban) areas close
to existing electric grids. Rural-access percentages are harder to find in the literature than just the overall
electrification rate for a country.
Sources: Karekezi & Kimani 2004 and 2005; D’Sa & Murthy 2004; AFREPREN 2004; Sihag et al. 2004;
Goldemberg, et al. 2004; Krause & Nordstrom 2004; ESMAP 2002; World Bank 2004; India 2001 census;
contributions and updates from report researchers and contributors.

100
[N45] Market Facilitation Organizations
Note: This listing is a work in progress and further updates are expected.
Industry Associations
American Biomass Association www.biomass.org
American Council for Renewable Energy (ACORE) www.american-renewables.org
American Wind Energy Association (AWEA) www.awea.org
Australian Wind Energy Association www.auswea.com.au
Brazilian Renewable Energy Companies Association www.brsolar.com.br
British Association for Biofuels and Oils www.biodiesel.co.uk
British Biogen www.britishbiogen.co.uk
British Photovoltaic Association www.pv-uk.org.uk
British Wind Energy Association (BWEA) www.bwea.com
Business Council for Sustainable Energy (BCSE) www.bcse.org
Canadian Solar Industries Association (CANSIA) www.cansia.org
Canadian Wind Energy Association (CANWEA) www.canwea.ca
China Renewable Energy Industries Association (CREIA) www.creia.net
Danish Wind Industry Association www.windpower.org
European Biomass Association www.ecop.ucl.ac.be/aebiom
European Biomass Industry Association (EUBIA) www.eubia.org
European Geothermal Energy Council (EGEC) www.geothermie.de
European Photovoltaic Industry Association www.epia.org
European Renewable Energy Council (EREC) www.erec-renewables.org
European Renewable Energy Federation (EREF) www.eref-europe.org
European Small Hydro Association (ESHA) www.esha.be
European Solar Thermal Industry Federation (ESTIF) www.estif.org
European Wind Energy Association (EWEA) www.ewea.org
Finnish Wind Power Association (FWPA) www.tuulivoimayhdistys.fi
German Energy Agency (DENA) www.deutsche-energie-agentur.de
German Renewable Energy Association www.bee-ev.de/
German Industry Assoc. for the Promotion of Rural Electrification. www.cle-export.de/
German Solar Industry Association www.bsi-solar.de
German Wind Energy Association www.wind-energie.de
Global Wind Energy Council (GWEC) www.gwec.net
Indian Wind Energy Association www.inwea.org
Indian Wind Turbine Manufacturers Association www.indianwindpower.com
(India) Wind Power Developers Association [n/a]
International Geothermal Association (IGA) http://iga.igg.cnr.it/index.php
Irish Wind Energy Association (IWEA) www.iwea.org

101
Japanese Wind Power Association www.jwpa.jp
Japanese Wind Energy Association http://ppd.jsf.or.jp/jwea
Sustainable Energy Industries Association (Australia) www.seia.com.au
Sustainable Energy Ireland (SEI) www.irish-energy.ir
Solar Energy Industries Association (SEIA) www.seia.org
Swiss Wind Energy Association www.suisse-eole.ch
World Wind Energy Association (WWEA) www.wwindea.org
NGOs
African Energy Policy Research Network (AFREPREN) www.afrepren.org
ASEAN Centre for Energy www.aseanenergy.org
Association for the Promotion of Renewable Energy www.apere.org
Austrian Biofuels Institute www.biodiesel.at
Australian and New Zealand Solar Energy Society (ANZSES) www.anzses.org
Basel Agency for Sustainable Energy (BASE) www.energy-base.org
Bioenergy Austria www.bioenergy.at
Biomass Users Network Brazil (BUN) www.cenbio.org.br
Biomass Users Network Central America www.bun-ca.org
Canadian Association for Renewable Energy www.renewables.ca
Center for Resource Solutions www.resource-solutions.org
Cogen Europe www.cogen.org
Energieverwertungsagentur-Eva www.eva.wsr.ac.at
European Renewable Energy Exchange www.eurorex.com
Eurosolar www.eurosolar.org
Greenpeace International www.greenpeace.org
India (Kerala) Renewable Energy Center www.mithradham.org
Intermediate Technology Development Group www.itdg.org
International Institute for Energy Conservation (IIEC) www.iiec.org
International Solar Energy Society (ISES) www.ises.org
Mali Folkecenter www.malifolkecenter.org
MicroEnergy International http://microenergy-international.com
Mosaico Network www.mosaiconetwork.org
Organizations for the Promotion of Energy Technologies (OPET) www.cordis.lu/opet
Photovoltaics Global Approval Program (PV GAP) www.pvgap.org
Renewable Energy Policy Project (REPP) www.crest.org
Solar Electric Light Fund (SELF) www.self.org
Winrock International www.winrock.org
World Alliance for Decentralized Energy (WADE) www.localpower.org
World Business Council for Sustainable Development (WBCSD) www.wbcsd.org
World Resources Institute (WRI) www.wri.org

102
World Wildlife Fund (WWF) www.wwf.org
Worldwatch Institute (WWI) www.worldwatch.org
Brahmakumaris (India) www.brahmakumaris.com.au
Ramakrishna Mission (India) www.rkmcnarendrapur.org
Planters Energy Network (India) [n/a]
Social Works and Research Centre (India) www.barefootcollege.org
Ladhakh Ecological Development Group (India) [n/a]
Solar Energy Society of India [n/a]
International Partnerships and Networks
African Energy Policy Research Network (AFREPREN) www.afrepren.org
European Green Cities Network www.greencity.dk
European Renewable Energy Research Centers Agency (EUREC) www.eurec.be
European Solar Cities Initiative www.eu-solarcities.org
e7 Network of Expertise for the Global Environment www.e7.org
Global Network on Energy for Sustainable Development (GNESD) www.gnesd.org
Global Village Energy Partnership (GVEP) www.gvep.org
International Network for Sustainable Energy (INFORSE) www.inforse.org
International Solar Cities Initiative (ISCI) www.solarcities.or.kr
Mosaico Sustainable Agriculture and Infrastructure Network www.mosaiconetwork.org
Renewable Energy and Energy Efficiency Partnership (REEEP) www.reeep.org
Renewable Energy Policy Network for the 21st Century (REN21) www.ren21.net
UNEP Sustainable Energy Finance Initiative (SEFI) www.sefi.unep.org
World Council for Renewable Energy (WCRE) www.wcre.org
World Energy Council (WEC) www.worldenergy.org
World Renewable Energy Network (WREN) www.wren.org
International Agencies
Asian Development Bank www.adb.org
African Development Bank www.afdb.org
European Bank for Reconstruction and Development www.ebrd.org
European Investment Bank www.eib.org
Food and Agricultural Organization of the UN www.fao.org
Global Environment Facility www.gefweb.org
Inter-American Development Bank www.iadb.org
International Energy Agency www.iea.org
UN Asian and Pacific Centre for Transfer of Technology (APCTT) www.apctt.org
UN Department of Economic and Social Affairs (UNDESA) www.un.org/esa/desa.htm
UN Development Programme www.undp.org

103
UN Economic and Social Commission for Asia-Pacific (ESCAP) www.unescap.org
UN Environment Programme www.unep.org
UN Industrial Development Organization www.unido.org
World Bank Group www.worldbank.org
Bilateral Aid Agencies
Australia AusAID www.ausaid.gov.au
Canada International Development Agency (CIDA) www.acdi-cida.gc.ca/home
Danish International Development Assistance (DANIDA) www.um.dk
French Fund for the Global Environment (FFEM) www.ffem.net
French Agency for Environment and Energy Management (Ademe) www.ademe.fr
German Agency for Technical Cooperation (GTZ) www.gtz.de
German Development Finance Group (KfW) www.kfw.de
Netherlands Agency for Energy and the Environment (Novem) www.novem.org
Swedish Energy Agency (STEM) www.stem.se/english
UK Carbon Trust www.thecarbontrust.co.uk
UK Department for International Development (DFID) www.dfid.gov.uk
US Agency for International Development www.usaid.gov
US Environmental Protection Agency www.epa.gov
National Government Agencies
Brazil Ministry of Mines and Energy www.mme.gov.br
Brazilian Electricity Regulatory Agency www.aneel.gov.br
Canada Sustainable Development Technology Canada (SDTC) www.sdtc.ca
China National Development and Reform Commission (NDRC) www.ndrc.gov.cn
German Federal Ministry for the Environment,
Nature Conservation and Nuclear Safety (BMU) www.erneuerbare-energien.de
India Ministry for Non-Conventional Energy Sources (MNES) www.mnes.gov.in
India Renewable Energy Development Agency (IREDA) www.ireda.in
Japan New Energy and Industrial Tech. Develop. Org. (NEDO) www.nedo.go.jp
Netherlands Senter Novem www.senternovem.nl
New Zealand Energy Effic. and Conservation Authority (EECA) www.eeca.govt.nz
Thailand Department of Alternative Energy and Efficiency www.dede.go.th
US Department of Energy (USDOE) www.eere.doe.gov
State/Provincial Government Agencies [for future development; one example below]
California Energy Commission www.energy.ca.gov/renewables

104

105
REFERENCES
In addition to the sources listed below, the following online magazines and journals were used in collecting
current information:
Energy for Sustainable Development www.ieiglobal.org/esd.html
Energy Policy www.elsevier.com/locate/enpol
GVEP electronic newsletter www.rsvp.nrel.gov/asp/newsletter_search.asp
Photon magazine www.photon-magazine.com
Renewable Energy World www.jxj.com/magsandj/rew
RenewableEnergyAccess.com www.renewableenergyaccess.com
REFocus www.re-focus.net
Renewable Energy Portal www.odysen.com
Solar Buzz www.solarbuzz.com
Acker, R. & Kammen, D.M. (1996). The Quiet (Energy) Revolution: The Diffusion of Photovoltaic Power Systems in Kenya. Energy Policy 24: 81-111.
AFREPREN (African Energy Policy Research Network). (2004). Energy Data and Terminology Handbook.Occasional Paper 23. Nairobi.
Allderdice, A. & Rogers, J.H. (2000). Renewable Energy for Microenterprise. Golden, CO: National Renewable Energy Laboratory. www.nrel.gov/villagepower/vpconference/vp2000/handbooks/microenterprise_handbook.pdf.
Altinbilek, D., Seelos, K., & Taylor, R. (2004). Hydropower’s Role in Delivering Sustainability. Presentation at 19th World Energy Congress, Sydney, Australia 5-9 September 2004.
Austrian Energy Agency. (2005). News and background information on renewable energy in Central and Eastern Europe. enerCEE.net. www.eva.ac.at/enercee/index.htm.
AWEA (American Wind Energy Association). (2005). Global wind power continues expansion. News release. 4 March 2005.
Ayoub, J. & Dignard Bailey, L. (2003). Photovoltaic Technology Status and Prospects: Canadian Annual
Report 2003. Ottawa: Natural Resources Canada. http://cetc-varennes.nrcan.gc.ca/en/er_re/pva_sapv/p_p.html.
Bacon, R.W. & Besant-Jones, J. (2001). Global electric power reform, privatization, and liberalization of the electric power industry in developing countries. Annual Review of Energy and the Environment 26: 331-59.
Bailis, R., Ezzati, M., & Kammen, D.M. (2005). Mortality and Greenhouse Gas Impacts of Biomass and Petroleum Energy Futures in Africa. Science 308: 98-103.
Balce, G..R., Tjaroko, T.S., & Zamora, C.G.. (2003). Overview of Biomass for Power Generation in Southeast
Asia. Jakarta: ASEAN Center for Energy.
Bartle, A. (2003). Hydro and dams gain more universal support. International Journal on Hydropower and
Dams 10(1): 3-9.
Beck, F. & Martinot, E. (2004). Renewable energy policies and barriers. Encyclopedia of Energy. San Diego: Academic Press/Elsevier Science.
Bhattacharya, S.C. (2002). Biomass energy in Asia: a review of status, technologies and policies in Asia. Energy for Sustainable Development 6(3): 5-10.

106
Biogas Support Programme Nepal. (2005). Biogas Nepal 2004. Kathmandu: Alternative Energy Promotion Centre.
Bird, L. & Swezey, B. (2004). Green Power Marketing in the United States: A Status Report (Seventh Edition). NREL/TP-620-36823. Golden, CO: National Renewable Energy Laboratory (NREL).
Bird, L., Wüstenhagen R., & Aabakken, J. (2002). Green Power Marketing Abroad: Recent Experience and Trends. NREL/TP-620-32155. Golden, CO: NREL.
Bolinger, M. et al. (2001). States emerge as clean energy investors: a review of state support for renewable energy. The Electricity Journal. November: 82-95.
Boo, K., Yoo J., & Kim, K. (2004). New & Renewable Energy Policy in Korea Since the WSSD. Paper prepared for Regional Conference for Asia and the Pacific on Renewable Energies 2004, Bangkok, Thailand, 25-26 March.
BP. (2005). Statistical Review of World Energy 2005. London. www.bp.com/genericsection.do?categoryId=92&contentId=7005893
BTM Consult. (2005). Global Wind Market Report. Ringkobing, Denmark.
Cabraal, R.A., Barnes, D.F., & Agarwal, S.G. (2005). A New Approach to the Productive Uses of Energy for Rural Development. Draft manuscript. Washington, DC: World Bank.
California Energy Commission. (2003). “Distributed energy resources.” www.energy.ca.gov. Viewed 26 January 2003.
California Energy Commission. (2004). Grid-Connected PV Capacity (kW) Installed in California. Sacramento. www.energy.ca.gov/renewables/documents/2003-07-31_GRID_PV.PDF
Calle, R. (1999). Sweet future? Brazil’s ethanol fuel programme. Renewable Energy World 2(5): 46-53.
Cameron, A. (2005). Steady as she goes. The BTM world market update. Renewable Energy World 8(4): 134-145.
CEC (Commission of the European Communities). (2004a). Communication of the Commission to the Council and the European Parliament: The Share of Renewable Energies in the EU, COM(2004) 366 final. Brussels.
CEC (2004b). The share of renewable energy in the EU: Country Profiles. Overview of Renewable Energy Sources in the Enlarged European Union. Brussels. http://europa.eu.int/comm/energy/res/documents/country_profiles/2004_0547_sec_country_profiles_en.pdf
CLSA Asia-Pacific Markets. (2004). Sunscreen: Investment Opportunities in Solar Power. Solar power sector outlook. www.clsa.com.
CREDP (China Rural Energy Development Programme). (2004.) PV Industry Report. Beijing: World Bank.
CREIA (China Renewable Industries Association). (2001). New and renewable sources of energy in China—technologies and products. Beijing.
CRESP (China World Bank/GEF Renewable Energy Scale-up Program). (2004). Chinese PV Industry Development Report. Washington, DC: World Bank and GEF.
CRESP. (2005). Wind Power Industry Development in China. Draft report. Beijing.
Cropper, M. & Jollie, D. (2002). Fuel Cell Systems: A Survey of Worldwide Activity. Fuel Cell Today. 14 November. www.fuelcelltoday.com/FuelCellToday/FCTFiles/FCTArticleFiles/Article_528_WorldwideSurvey1102.pdf
de Vries, E. (2005). Thinking bigger: Are there limits to turbine size? Renewable Energy World 8(3): 42-55.
Dickson, M.H. & Fanelli, M. (2004). What is Geothermal Energy? Pisa, Italy: Instituto di Geoscienze e Georisorse, CNR. http://iga.igg.cnr.it/geo/geoenergy.php

107
Diesel and Gas Turbine Worldwide. (2002). 2002 power generation order survey. www.dieselpub.com/ww/surveys.asp
Dobelmann, J.K. (2003). Germany’s Solar Success—the 100,000 roofs programme reviewed. Renewable
Energy World 6(6): 68-79.
D’Sa, A. & Murthy, N. (2004). LPG as a cooking fuel option for India. Energy for Sustainable Development
8(3): 91-106.
DSIRE (Database of State Incentives for Renewable Energy). (2005). New York: Interstate Renewable Energy Council. www.dsireusa.org
Duke, R.D., Jacobson, A., & Kammen, D.M. (2002). Product quality in the Kenyan solar home industry. Energy Policy 30(6): 477-99.
Duke, R.D. & Kammen, D.M. (2005). Energy for Development: Solar Home Systems in Africa and Global Carbon Emissions. In P.S. Low (Ed.), Climate Change for Africa: Science, Technology, Policy and
Capacity Building. Dordrecht: Kluwer Academic Publishers, pp. 250-66.
Dunn, S. (2000). Micropower: The Next Electrical Era. Worldwatch Paper 151. Washington, DC: Worldwatch Institute.
EAEF (EC-ASEAN Energy Facility). (2005). Policy Review of Renewable Energy Sources and Energy Efficiency in the European Union and its Member States. Report from Project 62- 2003: Capacity Building in Formulating Harmonised Policy Instruments for the Promotion of Renewable Energy and Energy Efficiency in the ASEAN Member Countries. Publication EuropeAid/116832/D/G/Multi. www.aseanenergy.org/eaef
EBRD (European Bank for Reconstruction and Development). (2004). Consultation workshops for supporting the development of a new EBRD Energy Policy. Discussion Paper. London.
EC (European Commission), Community Research and Development Information Service (CORDIS). (2002a). Energy Technology Indicators. www.cordis.lu/eesd/src/indicators.htm
EC. (2002b). MITRE project Web site. www.mitre.energyprojects.net (obsolete link).
EC. (2004). The Share of Renewable Energy in the EU: Country Profiles.
ECOTEC Research & Consulting Ltd. (2002). Renewable Energy Sector in the EU: its Employment and Export Potential. A final report to the DG Environment of the European Commission. Birmingham, UK. http://europa.eu.int/comm/environment/enveco/industry_employment/ecotec_renewable_energy.pdf
Edjekumhene, I. (2000). Status of Renewable Energy and Energy Efficiency Systems in West Africa. Kumasi, Ghana: Kumasi Institute of Technology and Environment. www.reeep.org/media/downloadable_documents/WE%20background%20paper.pdf
Edjekumhene, I. & Dubash, N. (2002). Ghana: Achieving Public Benefits by Default. In N. Dubash (Ed.),Power Politics: Equity and Environment in Electricity Reform. Washington, DC: World Resources Institute.
EEA (European Environment Agency). (2004). Energy subsidies in the European Union: A brief overview. Copenhagen. http://reports.eea.eu.int/technical_report_2004_1/en
EIB (European Investment Bank). (2004). The Extractive Industries Review (EIR)—The Position of the European Investment Bank. Luxembourg. www.eib.eu.int/Attachments/thematic/extractive_industries_en.pdf
Elauria, J.C., Castro, M.L.Y., & Elauria, M.M. (2002). Biomass energy technologies in the Philippines: a barrier and policy analysis. Energy for Sustainable Development 6(3): 40-49.
EPIA (European Photovoltaic Industry Association). (2004). Photovoltaic Energy Barometer 2004.www.epia.org
EPRI (Electric Power Research Institute). (2001). California Renewable Technology Market and Benefits Assessment. Prepared for the California Energy Commission. Palo Alto, CA.

108
EREC (European Renewable Energy Council). (2004). Renewable Energy Target for Europe—20% by 2020. Briefing paper. Brussels. www.erec-renewables.org/documents/Berlin_2004/targets/EREC_Targets_2020_def.pdf
EREC. (2004). Renewable Energy in Europe: Building Markets and Capacity. Brussels. www.erec-renewables.org/documents/RES_in_EUandCC/ExecutiveSummary.pdf
Ergeneman, A. (2003). Dissemination of Improved Cookstoves in Rural Areas of Developing World: Recommendation for the Eritrea Dissemination of Improved Stoves Program. Asmara, Eritrea: Eritrea Energy Research and Training Center. www.punchdown.org/rvb/mogogo/EriStoveAPA_Report.pdf
ESHA (European Small Hydro Association). (2005). Data on small hydro. www.esha.be
ESMAP (Energy Sector Management Assistance Program). (2002). Rural Electrification and Development in the Philippines: Measuring the Social and Economic Benefits. Washington, DC: World Bank. www.worldbank.org/html/fpd/esmap/pdfs/255-02.pdf
ESMAP. (2005). Brazil Background Study for a National Rural Electrification Strategy: Aiming for Universal Access. Washington, DC: World Bank. http://wbln0018.worldbank.org/esmap/site.nsf/files/066-05+Brazil+Final.pdf/$FILE/066-05+Brazil+Final.pdf
ESTIF (European Solar Thermal Industry Federation). (2004). Solar Thermal Markets in Europe: Trends and Market Statistics 2003. Brussels. www.estif.org/fileadmin/downloads/Solar_Thermal_Markets_in_Europe_2003.pdf
ESTIF. (2005). Solar Thermal Markets in Europe. Brussels. www.estif.org/fileadmin/downloads/Solar_Thermal_Markets_in_Europe_2004.pdf
EurObserv’ER. (2005a). Biofuels Barometer. Systemes Solaires 167: 39-50. www.energies-renouvelables.org/observ-er/stat_baro/comm/baro167b.pdf
EurObserv’ER. (2005b). Solar Thermal Barometer. Systemes Solaires 168: 39-56. http://www.energies-renouvelables.org/observ-er/stat_baro/eufores/baro168.pdf
EurObserv'ER & EdF. (2000). Worldwide electricity production from renewable energy sources. Paris: Systemes Solaires.
European PV industry meets on a high. (2001, November). Renewable Energy Report, p. 30.
European Wind Energy Association (EWEA) & Greenpeace International. (2002). Wind Force 12: A Blueprint to Achieve 12% of the World's Electricity from Wind Power by 2020. Brussels. www.ewea.org/documents/WF12-2004_eng.pdf
EWEA. (2003). Wind Energy—The Facts. Brussels. www.ewea.org/06projects_events/proj_WEfacts.htm
EWEA. (2005a). Wind Market Report. Brussels.
EWEA. (2005b). Data on Wind Energy in Europe. Brussels
EWEA (2005c). Support Schemes for Renewable Energy: A Comparative Analysis of Payment Mechanisms in the EU. Brussels.
Ezzati, M. & Kammen, D.M. (2002). Household energy, indoor air pollution, and health in developing countries: knowledge base for effective interventions. Annual Review of Energy and Environment 27: 233-70.
Ferrey, S. (2004). Small Power Purchase Agreement Application for Renewable Energy Development: Lessons from Five Asian Countries. Washington, DC: World Bank Asia Alternative Energy Program. http://siteresources.worldbank.org/INTEAPREGTOPENERGY/Resources/Power-Purchase.pdf
Fishbein, R. (2003). Survey of Productive Uses of Electricity in Rural Areas. Washington, DC: World Bank. www.martinot.info/Fishbein_WB.pdf
FOE (Friends of the Earth UK). (2004). Friends of the Earth Guide to Green Electricity Tariffs 2004. London. www.foe.co.uk/resource/factsheets/green_electricity_tariffs_2004.pdf

109
Food and Agriculture Organization of the United Nations (FAO). (2004). Overview of FAO’s approach to Bioenergy. Presentation at Business Forum on Bioenergy Trade, Rome, Italy, October 2004.
Food and Agriculture Organization of the United Nations (FAO). (2005, March). Interdepartmental Bioenergy Programme. Rome: FAO Sustainable Development Department. www.fao.org/WAICENT/FAOINFO/SUSTDEV/dim_en2/en2_050302a1_en.htm
Forecasts paint rosy picture for global wind power. (2002, May). Renewable Energy Report, p.4.
Friedman, D. (2003). A new road: the technology and potential of hybrid vehicles. Boston, MA: Union of Concerned Scientists.
Fritsche, U. & Kristensen, S. (2005). Content analysis of the International Action Programme of the International Conference for Renewable Energies, Renewables 2004, Bonn, Germany, 1-4 June 2004. www.renewables2004.net
Fulton, L. (2004). Driving ahead—biofuels for transport around the world. Renewable Energy World 7(4): 180-189.
Fulton, L., Howes, T., & Hardy J. (2004). Biofuels for Transport: An International Perspective. Paris: International Energy Agency.
GAC (German Aerospace Center). (2005). Concentrating Solar Power for Mediterranean Region. Study commissioned by Federal Ministry for the Environment, Nature Conservation and Nuclear Safety, Germany. Stuttgart. www.dlr.de/tt/med-csp
Geller, H. (2003). Energy Revolution: Policies for a Sustainable Future. Washington, DC: Island Press.
German Federal Ministry for the Environment, Nature Conservation and Nuclear Safety. (2002). Environmental Policy: Renewable Energy—Current German and European Legislation and More. Publication 6108. Berlin.
German Federal Ministry for the Environment, Nature Conservation and Nuclear Safety. (2004). General Explanations on the Renewable Energy Sources Act (as of 21 July 2004). Berlin.
German Federal Ministry for the Environment, Nature Conservation and Nuclear Safety. (2004, May). Renewable Energies. Berlin.
Global Energy Decisions, with contributions from Palmer Bellevue and Bio Economic Research Associates. (2005, 15 March). Renewable Energy: The Bottom Line. Boulder, CO.
Goldberg, M. (2000). Federal Energy Subsidies: Not All Technologies Are Created Equal. Renewable Energy Policy Project (REPP) Research Report No. 11. Washington, DC: REPP. www.repp.org/repp_pubs/pdf/subsidies.pdf
Goldemberg J. (2004). The Case for Renewable Energies. Thematic background paper for Bonn International Conference for Renewable Energy, Bonn, February 2004. www.renewables2004.de
Goldemberg, J., Coelho, S.T., Nastari, P.M., & Lucon, O. (2004). ‘‘Ethanol learning curve—the Brazilian experience. Biomass and Bioenergy 26: 301-04.
Goldemberg, J. & Johansson, T. (Eds.). (2004). World Energy Assessment Overview (2004 Update). New York: U.N. Development Programme (UNDP), U.N. Department of Economic and Social Affairs (UNDESA), and World Energy Council. www.undp.org/energy/docs/WEAOU_full.pdf
Goldemberg, J., Johansson, T., Reddy, A. & Williams, R. (2004). A global clean cooking fuel initiative. Energy for Sustainable Development 8(3): 5-12.
Goldemberg, J., La Rovere, E.L., & Coelho, S.T. (2004). Expanding access to electricity in Brazil. Energy for
Sustainable Development 8(4): 86-95. www.ieiglobal.org/ESDVol8No4/brazil.pdf
Goldemberg, J., Martinot, E. & Miller, A. (2002). Energy Since Rio: Achievements and Promising Strategies. Washington, DC: Global Environment Facility (GEF).
Gouchoe, S., Everette, V. & Haynes, R. (2002). Case Studies on the Effectiveness of State Financial Incentives for Renewable Energy. NREL/SR-620-32819. Golden, CO: NREL.

110
Graham, J. (2001, April). Ripening RE markets: capacity building for the rapid commercialisation of RE in China. REFOCUS, pp. 18-23.
Greenpeace. (1997). The Subsidy Scandal. http://archive.greenpeace.org/comms/97/climate/eusub.html
Greenpeace & EPIA. (2005). Solar Generation – Solar Electricity for over 1 Billion People and 2 Million Jobs by 2020. Amsterdam and Brussels. www.greenpeace.org/raw/content/international/press/reports/solar-generation-ii.pdfr
GTZ (Deutsche Gesellschaft für Technische Zusammenarbeit) GmbH. (2004, June). Energy-policy Framework Conditions for Electricity and Renewable Energies—21 Country Analyses. Eschborn. www2.gtz.de/wind/download/TERNA_Study_2004_06_04.pdf
GWEC (Global Wind Energy Council). (2005, 6 June). Global Wind Power Continues Expansion. News release. www.gwec.net
Heavner, B. & Churchill, S. (2002). Renewables Work: Job Growth from Renewable Energy Development in California. Sacramento: CALPIRG Charitable Trust. www.calpirg.org/reports/renewableswork.pdf
Heavner, B. & Del Chiaro, B. (2003). Renewable Energy and Jobs: Employment Impacts of Developing Markets for Renewables in California. Los Angeles: Environment California Research & Policy Center. www.environmentcalifornia.org/reports/renewables_jobs_7_03.pdf
Hoffmann, W. (2005). A clear vision: EPIA sets its sights on PV technology to 2030 and beyond. Renewable
Energy World 8(3): 56-69.
HRC (Hangzhou (China) Regional Center for Small Hydro Power). (2004). A survey of SHP development in China. Small Hydro Power News 20(75): 2-8.
Huacuz, J. (2000). Photovoltaic rural electrification in Mexico: summary of activities and lessons learned. Presented at “Making a Difference in Emerging PV Markets: Strategies to Promote Photovoltaic Energy Generation,” Marrakech, Morocco. Washington, DC: GEF.
IAEA (International Atomic Energy Agency). (2004). Energy, Electricity, and Nuclear Power Estimates for the Period up to 2030. Reference Data Series No. 1. July 2005 Edition. www-pub.iaea.org/MTCD/publications/PDF/RDS1-25_web.pdf
ICCEPT (Imperial College Centre for Energy Policy and Technology). (2002). Assessment of Technological Options to Address Climate Change. A Report for the Prime Minister’s Strategy Unit. London. www.iccept.ic.ac.uk/pdfs/Tech%20initiative%20ICCEPT%20FINAL.pdf
IEA (International Energy Agency). (1998-2002). World Energy Outlook. Paris.
IEA. (2000). Experience Curves for Energy Technology Policy. Paris.
IEA. (2002a). Renewables Information 2002. Paris.
IEA. (2002b). Trends in Photovoltaic Applications in Selected IEA Countries Between 1992 and 2001. IEA-PVPS T1-11. Paris: IEA Photovoltaic Power Systems Programme.
IEA. (2003a). Renewables for Power Generation: Status and Prospects. Paris.
IEA. (2003b). Renewables Information 2003. Paris.
IEA. (2003c). World Energy Investment Outlook: 2003 Insights. Paris.
IEA. (2003d). Electricity Information 2003 (with 2002 data). Paris.
IEA. (2003e). Renewable Energy in Russia. Paris.
IEA. (2004a). Renewables Information 2004. Paris.
IEA. (2004b). Renewable Energy: Market and Policy Trends in IEA Countries. Paris.
IEA. (2004c). Electricity Information 2004. Paris
IEA. (2004d). Biofuels for Transport. T39:2004:01. Paris: IEA Bioenergy Task 39. www.ieabioenergy.com/media/43_BiofuelsforTransport-Final.pdf

111
IEA. (2005a). Renewable Energy Policies & Measures Database for IEA Member Countries. Paris. www.iea.org/dbtw-wpd/textbase/pamsdb/search.aspx?mode=re
IEA. (2005b). JREC Renewable Energy Policies and Measures Database. Paris. Note: JREC is the Johannesburg Renewable Energy Coalition formed at the 2002 World Summit for Sustainable Development. www.iea.org/dbtw-wpd/textbase/pamsdb/jr.aspx
IEA. (2005c). Global Bioresources Project. Unpublished document. Paris: IEA Renewable Energy Unit.
IEA. (2005d). RD&D Database. Paris. http://www.iea.org/textbase/stats/rd.asp
IREDA (Indian Renewable Energy Development Agency Ltd.). (2004). Operating statistics. New Delhi.
Islam, M., Fartaj, A. & Ting, D. (2004). Current utilization and future prospects of emerging renewable energy applications in Canada. Renewable and Sustainable Energy Reviews 8(6): 493-519.
Jäger-Waldau, A. (Ed.). (2004). Status Report 2004—Energy End-use Efficiency and Electricity from Biomass, Wind and Photovoltaics in the European Union. Ispra, Italy. Institute for Environment and Sustainability—European Commission Joint Research Centre (IES-JRC). http://streference.jrc.cec.eu.int/pdf/RE%20Status%20Report%202004.pdf
Jennings, B. (2005). The U.S. Ethanol Industry: Exceeding Expectations. Presentation at South Dakota Public Utilities Commission Energy Conference, Pierre, South Dakota, 20 April 2005. www.state.sd.us/puc/pucevents/Energy%20Conf%20Presentations/Brian%20Jennings-%20US%20Ethanol%20Industry.pdf
Johansson, T. & Turkenburg, W. (2004). Policies for renewable energy in the European Union and its member states: an overview. Energy for Sustainable Development 8(1): 5-24.
Jones, J. (2004). Onward and Upward: Trends in BTM’s World Market Update. Renewable Energy World 7(4): 58-73.
Jones, J. (2005). Japan’s PV Market—growth without subsidies? Renewable Energy World 8(2): 36-41.
Kammen, D. (2005). Renewable Energy Technology and Policy Successes in Developing Nations: The Kenyan Solar Photovoltaics Story and Improved Stoves in Africa. Berkeley, CA: University of California Berkeley, Energy and Resources Group.
Kammen, D., Kapadia, K., & Fripp, M. (2004.) Putting Renewables to Work: How Many Jobs Can the Clean Energy Industry Generate? Berkeley, CA: University of California at Berkeley, Energy and Resources Group. http://ist-socrates.berkeley.edu/~rael/renewables.jobs.pdf
Karekezi, S. & Kimani, J. (2004). Have power sector reforms increased access to electricity among the poor in East Africa? Energy for Sustainable Development 8(4): 10-25.
Karekezi, S. & Kimani, J. (2005). Do the Poor Benefit from Power Sector Reform? Nairobi: AFREPREN.
Karekezi, S. & Kithyoma, W. (2005). Introduction to Renewable Energy in Africa: Opportunities and Constraints. Nairobi: AFREPREN.
Karekezi, S., Lata, K. & Coelho, S.T. (2004). Traditional Biomass Energy: Improving Its Use and Moving to Modern Energy Use. Thematic Background Paper for Renewables 2004 conference, Bonn, Germany, June 1-4. www.renewables2004.de
Karekezi S., Mapako, M., & Teferra, M.(Eds). (2002). Energy Policy Journal. Special Issue. 30(11-12). Oxford: Elsevier Science Limited.
Karekezi, S. & Ranja, T. (1997). Renewable Energy Technologies in Africa. London: AFREPREN/SEI and Zed Books.
Kartha, S. & Larson, E.D. (2000). Bioenergy Primer: Modernized Biomass Energy for Sustainable
Development. New York: UNDP.
Kartha, S., Leach, G., & Rajan, S.C. (2004). Advancing Bioenergy for Sustainable Development: Roles for Policymakers and Entrepreneurs. Report prepared for ESMAP, World Bank. Stockholm: Stockholm Environment Institute.

112
Kishore, V.V.N., Bandari, P.M., & Gupta P. (2004). Biomass energy technologies for rural infrastructure and village power—opportunities and challenges in the context of global climate change concerns. Energy
Policy 32: 801-810.
Komar, P. (2004). Renewable Energy Policy. New York: Diebold Institute for Public Policy Studies.
Krause, M. & Nordstrom, S. (Eds.). (2004). Solar Photovoltaics in Africa: Experiences with Financing and Delivery Models. New York: UNDP & GEF. www.undp.org/gef/undp-gef_publications/publications/solarphotovoltaics_africa.pdf
Ku, J., Lew, D., Shi, P. & Wallace, W. (2005). Accelerating wind development: the future is now. Renewable
Energy World 8(4): 212-223.
Ku, J., Lew, D., & Ma, S. (2003, Sept-Oct). Sending electricity to townships. Renewable Energy World, pp.
56-67. www.nrel.gov/environment/pdfs/pubs_sending_electricity.pdf
Kumar, A. (2003). SHP: Potential, technology, and environment. Small Hydro Power News 20(73): 14-16.
Lertsuridej, P. (2004a). Policy on New and Renewable Energy Technology Promotion in Thailand. Technical Digest of International PVSEC-14, Bangkok, Thailand, March 2004.
Lertsuridej, P. (2004b). Renewable Energy for Sustainable Development: A Global Challenge. Presented at the International Conference for Renewable Energy, Bonn, Germany, June 2004.
Lichts, F.O. (2005). World Ethanol & Biofuels Report 2005. www.fo-licht.com
Li, H. (2002). China's solar thermal industry. Renewable Energy World 5(4): 99-107.
Li, H. (2005). From quantity to quality: how China’s solar thermal industry will need to face up to market challenges. Renewable Energy World 8(1).
Li, J., Jingli, S., & Wallace, W. (2002). Market potential of PV village power in China. In Proceedings of the PV in Europe: from PV to Energy Solutions conference and exhibition, Rome, Italy, 7-11 October 2002.
Li, J. & Shi L. (Eds.). (2005). Overview of Renewable Energy in China 2005. China Renewable Energy Industries Association, CREDP, and China UNDP/GEF Renewable Energy Capacity Building Project. Beijing.
Liebreich, M. & Aydinoglu, B. (2005, 11 May). New and renewable energy technology—trends in venture capital investment. www.energypulse.net
Linden, N.H. van der et al. (2005). Review of international experience with renewable energy obligation support mechanisms. ECN-C--05-025. Petten, The Netherlands: ECN Policy Studies.
Lund, J. (2000). World status of geothermal energy use: past and potential. Renewable Energy World 3(4): 122-31.
Lund, J. (2005a). Worldwide Utilization of Geothermal Energy 2005. Klamath Falls, OR: Oregon Institute of Technology.
Lund, J. (2005b). 100 years of renewable electricity—geothermal power production. Renewable Energy World
8(4): 252-259.
Luo Z. & Shi L. (2004). Solar Hot Water Industry in China 2001-2003. China UNDP/China Renewable Energy Capacity Building Project, Beijing. [In Chinese]
Ma, S. (2004.) The China Township Electrification Program. Presentation at Renewables 2004 conference, Bonn, Germany, June 2004.
Maithel, S. (2005). Experience & Learning from Indian National Cookstoves Programme. Presentation at Ministry of Agriculture, Beijing, China, 14-16 January 2005.
Makower, J., Pernick, R. & Wilder, C. (2005). Clean Energy Trends 2005.www.cleanedge.com/reports/trends2005.pdf.
Martinot, E. (2004a). Indicators of investment and capacity for renewable energy. Renewable Energy World
7(5): 35-37. www.jxj.com/magsandj/rew/2004_05/indicators_of_investment.html

113
Martinot, E. (2004b). Solar (and Sustainable) Cities. www.martinot.info/solarcities.htm.
Martinot, E. (2005). Organizations engaged in renewable energy. www.martinot.info/organizations.htm.
Martinot, E. et al. (2002). Renewable energy markets in developing countries. Annual Review of Energy and
the Environment 27: 309-48. www.martinot.info/Martinot_et_al_AR27.pdf
Martinot, E. & Reiche, K. (2000). Regulatory Approaches to Rural Electrification and Renewable Energy: Case Studies from Six Developing Countries. Washington, DC: World Bank.
Martinot, E., Wiser, R. & Hamrin, J. (2005). Renewable Energy Markets and Policies in the United States. San Francisco: Center for Resource Solutions. www.martinot.info/Martinot_et_al_CRS.pdf
Masera, O., Díaz R. & Berrueta V. (2005). From cookstoves to cooking systems: the integrated program on sustainable household energy use in Mexico. Energy for Sustainable Development 9(1): 25-36. www.ieiglobal.org/ESDVol9No1%5Cmexicoprogram.pdf
Maycock, P. (2001). The PV boom—where Germany and Japan lead, will California follow? Renewable
Energy World 4(4): 144-63.
Maycock, P. (2002). The world PV market. Renewable Energy World 5(4): 146-61.
Maycock, P. (2003). PV market update. Renewable Energy World 6(4): 84-101.
Maycock, P. (2004). PV market update. Renewable Energy World 7(4): 86-101.
Maycock, P. (2005a). PV market update—global PV production continues to increase. Renewable Energy
World 8(4): 86-99.
Maycock, P. (2005b, March). Solar PV production statistics for 2004 PV News 24(3).
McDade, S. (2004). Fueling development: the role of LPG in poverty reduction and growth. Energy for
Sustainable Development 8(3): 74-81.
Milton, S. & Kauffman, S. (2005). Solar water heating trades up: the role for carbon finance. Renewable
Energy World 8(3): 92-99.
Morrison, G. & Wood, B. (2000). Packaged solar water heating technology: twenty years of progress. Renewable Energy World 3(4): 171-83.
Navigant Consulting. (2005). Personal communication from Lisa Franztis.
New Energy Finance, Ltd. (2005). New and renewable energy technology—trends in venture capital investment. Venture Economics [issue unknown]
Niewenhaut, F.D.J. et al. (2000). Monitoring and Evaluation of Solar Home Systems: Experiences with Applications of Solar PV for Households in Developing Countries. Petten, Netherlands: Netherlands Energy Research Institute (ECN).
NREL (National Renewable Energy Laboratory). (2004). The China Township Electrification Program. Golden, CO.
OECD (Organisation for Economic Co-operation and Development). (2005). Arrangement on Officially Supported Export Credits, Agreement on Special Financial Terms and Conditions for Renewable Energies and Water Projects. TD/PG(2005)19. Paris. http://webdomino1.oecd.org/olis/2005doc.nsf/0/33016f08c238254dc125700000410aa5/$FILE/JT00184128.PDF
OECD DAC (Development Co-operation Directorate). (2005). International Development Statistics (IDS) online. Electronic database. www.oecd.org/dac/stats/idsonline.
OECD Nuclear Energy Agency & IEA. (2005). Projected Costs of Generating Electricity—2005 Update. Paris.
Öko-Institut e.V.—Institut für angewandte Ökologie (ÖKO). (2004). Bioenergy—New Growth for Germany.Supported by the Federal Ministry for the Environment, Nature Conservation and Nuclear Safety, Germany. Freiburg—Darmstat—Berlin. www.bmu.de/files/pdfs/allgemein/application/pdf/bioenergie_uk.pdf
Osafo, Y. & Martinot, E. (2003). An inventory of renewable energy policies in developing countries. Working

114
draft. Washington, DC: GEF.
Pandit, N. & Pantar, M. (2004). Scale-up strategies for solar-thermal boiler feed-water preheating systems. The Bulletin on Energy Efficiency 4(4):17-19.
Pembina Institute. (2004). Canadian Renewable Electricity Development: Employment Impacts. Prepared for Clean Air Renewable Energy Coalition. www.cleanairrenewableenergycoalition.com/documents/FINAL%20Employment%20Predictions%20-%20Oct%2028.pdf
Photon International. (2003). Solar cell production increases significantly in 2002. March 2003 issue and web site news posting for March 3.
Pollution Probe. (2004). Targets and activities for electricity generation using green power by province and territory. Toronto, Canada. www.pollutionprobe.org/whatwedo/greenpower/provtargetgrnpower.pdf
Rai, S. (2004). Sustainable dissemination of solar home systems for rural development: experiences in Nepal. Energy for Sustainable Development 8(2):47-50. www.ieiglobal.org/ESDVol8No2/solarnepal.pdf
Reiche, D. (Ed.). (2002). Handbook of Renewable Energies in the European Union: Case Studies of all Member States. Bern, Switzerland: Peter Lang Publishing.
Renewable energy law website (maintained by a law firm). http://renewableenergylaw.blogspot.com
Renewable energy organization database (author unknown). www.yesweb.org/gkr/gkrfiles/rdbase.pdf
Renewable Fuels Association. (2005). Homegrown for the Homeland—Ethanol Industry Outlook 2005. Washington, DC. www.ethanolrfa.org/outlook2005.html
Ritschel, A. & Smestad, G. P. (2003). Energy subsidies in California’s electricity market deregulation. Energy
Policy 31: 1379-91.
Rossillo-Calle F. & Cortez, L.A.B. (1998). Towards Pro-Alcool II: a review of the Brazilian bioethanol programme. Biomass Bioenergy 14(2): 115-124.
Rousseff, D. (2005). Renewable Energy and Energy Efficiency Financing and Policy Network Forum. Presentation at World Bank Energy Week, World Bank, Washington, DC, 11 March 2005.
Saghir, J. (2005). The global investment challenge—financing the growth of renewable energies in developing countries. Renewable Energy World 8(4): 196-211.
Sawin, J. (2001). The Role of Government in the Development and Diffusion of Renewable Energy Technologies: Wind Power in the United States, California, Denmark and Germany. Doctoral Dissertation. Fletcher School of Law and Diplomacy, Tufts University. Ann Arbor, MI: UMI/Proquest.
Sawin, J. (2004). Mainstreaming Renewable Energy in the 21st Century. Worldwatch Paper 169. Washington,
DC: Worldwatch Institute.
Sawin, J. & Flavin, C. (2004). National Policy Instruments: Policy Lessons for the Advancement & Diffusion of Renewable Energy Technologies Around the World. Thematic Background Paper for Renewables 2004 conference, Bonn, Germany, June 2004. www.renewables2004.de/pdf/tbp/TBP03-policies.pdf
Schwer, R.K. & Riddel, M. (2004). Potential Economic Impact of Constructing and Operating Solar Power Generation Facilities in Nevada. Prepared by the University of Nevada Center for Business and Economic Research for NREL. Golden, CO. www.nrel.gov/docs/fy04osti/35037.pdf
Sellers, R. (2003). The potential of second generation renewable energy. SDI 13-03/03. www.sustdev.org
Sihag, A.R., Mishra, N. & Sharma, V. (2004). Impact of power sector reform on the poor: case-studies of South and South-East Asia. Energy for Sustainable Development 8(4): 54-73.
Singh, V., with BBC Research and Consulting & Fehrs, J. (2001). The work that goes into renewable energy. Washington, DC: Renewable Energy Policy Project (REPP).
Singh, V. (2001). Blending wind and solar into the diesel generator market. REPP Research Report No. 12. Washington, DC: REPP.

115
Sinton, J.E. et al. (2004). An assessment of programs to promote improved household stoves in China. Energy
for Sustainable Development 8(3): 33-52.
Solar thermal sets new record. (2002, November). Renewable Energy Report, p.18.
South Africa Department of Minerals and Energy. (2003). White Paper on Renewable Energy. Pretoria.
Stenzil, T., Foxton, T. & Gross, R. (2003). Review of renewable energy development in Europe and the US. London: ICCEPT.
TERI (The Energy Resources Institute). (2001). Unpublished material on renewable energy in India used in preparing Martinot et al. 2002.
Thailand DEDE (Department of Alternative Energy Development and Efficiency). (2004). Renewable Energy in Thailand: Ethanol and Biodiesel. Prepared for Conference on Biofuels: Challenges for Asia Future, Bangkok, 30 August 2004.
Tumiwa, F. (2005). Renewable Energy in Indonesia: A review of 25 years experience and the way forward. Paper prepared for Asia-Pacific Green Network Conference, Kyoto, Japan, 11-13 February 2005. Working Group on Power Sector Restructuring, Jakarta.
Turkenburg, W. et al. (2000). Renewable energy technologies. In UNDP, United Nations Department of Economic and Social Affairs (UNDESA), and World Energy Council, World Energy Assessment. New York: UNDP.
UNDESA. (2002). Energy Statistics Yearbook 2000. New York.
UNDP/GEF Capacity Building for Renewable Energy in China Project (2004). Overview of Renewable Energy Development in China. Project Management Office, Beijing.
UNDP, UNDESA, and World Energy Council. (2000). World Energy Assessment. New York: UNDP.
UNDP, U.N. Environment Programme (UNEP), World Bank, and World Resources Institute. (2002). World
Resources 2002-2004. Washington, DC. http://pubs.wri.org/pubs_pdf.cfm?PubID=3764
UNEP. (2000). Natural Selection: Evolving Choices for Renewable Energy Technology and Policy. Paris. www.unep.fr/energy/publications/pdfs/naturalselection.pdf
UNEP. (2004). Financial Risk Management Instruments for Renewable Energy Projects. Summary document. Paris. www.uneptie.org/energy/publications/pdfs/RE_Risk_Manag.pdf
UNEP. (2005). Indian Solar Loan Programme Overview and Performance Report. Paris. www.uneptie.org/energy/act/fin/india/docs/IndSolLoanReview.pdf
UNEP & E+Co. (2005, March). The REED Report. Rural Energy Enterprise Development. www.areed.org
UNEP & IEA. (2002). Reforming Energy Subsidies. Paris. www.uneptie.org/energy/publications/pdfs/En-SubsidiesReform.pdf
UNEP & United Nations Foundation. (2003). Open for Business: Entrepreneurs, Clean Energy, and Sustainable Development. Paris. www.unep.fr/energy/publications/pdfs/Open%20For%20Business.pdf
UNESCO (United Nations Educational, Scientific, and Cultural Organization). (2005). Regional Energy Database—Renewable Energy and Energy Efficiency. Klong Luang, Thailand: Asian Institute of Technology. www.serd.ait.ac.th/ep/red/REDHome.htm
United Kingdom DFID (Department for International Development). (2002). Energy for the Poor. London.
Winrock International & International Development and Energy Associates, Inc. (IDEA) (1993, May). Advancing Cogeneration in the Indian Sugar Industry. Report prepared for USAID/New Delhi and the Office of Energy and Infrastructure, Bureau for Research and Development, United States Agency for International Development. www.weea.org/USAID%20Reports/Documents/Indian%20Sugar%20Industry.pdf
U.S. Department of Transportation, Bureau of Transportation Statistics. (1999). G-7 Countries: Transportation Highlights. Washington, DC.

116
US DOE (U.S. Department of Energy). (1997). Dollars from Sense—The Economic Benefits of Renewable Energy. Produced by NREL. Washington, DC. www.nrel.gov/docs/legosti/fy97/20505.pdf
US DOE, Energy Information Administration (EIA). (1999). Federal Financial Interventions and Subsidies in Energy Markets 1999: Primary Energy. Washington, DC. www.eia.doe.gov/oiaf/servicerpt/subsidy/pdf/sroiaf(99)03.pdf
US DOE, EIA. (2003-2004). Country analysis briefs, Various developing countries. Washington, DC. www.eia.doe.gov/emeu/cabs/
US DOE, EIA. (2004a). International Energy Annual 2002. Washington, DC.
US DOE, EIA. (2004b). Energy Use and Carbon Dioxide Emissions, 1980-2001. Washington, DC.
US DOE, EIA. (2005a). International Energy Annual 2004. Washington, DC.
US DOE, EIA. (2005b). Assumptions to the Annual Energy Outlook 2005. www.eia.doe.gov.
US DOE, EIA. (2005c). Policies to Promote Non-hydro Renewable Energy in the United States and Selected Countries. Washington, DC.
U.S. Environmental Protection Agency. (2004, November). Green power partnership, market indicators briefing. With data from Lori Bird, NREL.
Utria, B. (2004). Ethanol and gelfuel: clean renewable cooking fuels for poverty alleviation in Africa. Energy
for Sustainable Development 8(3): 107-114.
van Beers, C. & de Moore, A. (2001). Public Subsidies and Policy Failures: How Subsidies Distort the Natural
Environment, Equity, and Trade, and How to Reform Them. Cheltenham, UK: Edward Elgar Publishing Ltd.
van Campen, B., Guidi, D. & Best, G.. (2000). Solar Photovoltaics for Sustainable Agriculture and Rural Development Rome: FAO. http://www.fao.org/sd/EGdirect/EGre0057.htm
Vries, H.J. de et al. (2003). Renewable electricity policies in Europe: Country fact sheets 2003. ECN BS: ECN-C--03-071. Petten, The Netherlands: ECN Policy Studies
WADE (World Alliance on Decentralized Energy). (2004). Bagasse Cogeneration—Global Review and Potential. Edinburgh, Scotland, UK. www.localpower.org/documents_pub/report_bagasse_cogeneration.pdf
WADE. (2005). World Survey of Decentralized Energy 2005. Edinburgh, Scotland, UK. www.localpower.org/documents_pub/report_worldsurvey05.pdf
Wahnschafft, R. & Soltau, F. (2004). Accelerating Market Growth for Electricity from Renewables: Legislative Tools and Regulatory Measures. In “Words into Action,” published for Renewables 2004 conference, Bonn, Germany, June 2004. www.renewables2004.de
Walubengo, D. (1995). Commercialization of improved stoves: The case of the Kenya Ceramic Jiko (KCJ). In Westhoff, B. & Germann, D. (Eds.), Stove Images: A Documentation of Improved and Traditional Stoves
in Africa, Asia, and Latin America. Brussels: Commission of the European Communities.
Weiss, W. (2002). Time to come in from the cold? The solar thermal market in Europe. Renewable Energy
World 5(4): 90-97.
Weiss, W. (2004). Solar heating systems status and recent development. Renewable Energy World 7(4):214-225.
Weiss, W., Bergmann, I. & Faninger, G..( 2004). Solar Heating Worldwide: Markets and Contribution to Energy Supply 2001. Paris: IEA Solar Heating and Cooling Programme. www.iea-shc.org/outputs/activities/iea_shc_solar_heating_worldwide_2001.pdf
Weiss, W., Bergmann, I. & Faninger, G.. (2005). Solar Heating Worldwide: Markets and Contribution to Energy Supply 2003. Paris: IEA, Solar Heating and Cooling Programme. www.iea-shc.org/welcome/IEASHCSolarHeatingWorldwide2003.pdf
Wenzlawski, H. (2003). The Global CSP Market—Its Industry, Structure and Decision Mechanisms. Master's
117
Thesis. Hamburg, Germany: University of Hamburg. www.martinot.info/Wenzlawski_UH.pdf
Williams, R.H. et al. (2000). Advanced energy supply technologies. In UNDP, UNDESA, and World Energy Council, World Energy Assessment. New York: UNDP.
Wimmer, N. & Barua, D.C. (2004). Microfinance for Solar Energy in Rural Areas. In “Words into Action,” published for the Renewables 2004 conference, Bonn, Germany, June 2004. www.renewables2004.de
Wind Market Status. (2004, March). Windpower Monthly, pp. 45-90.
Winrock International. (2001). Renewable Energy State of the Industry Report # 3. Arlington, VA. www.winrock.org/GENERAL/Publications/State_of_Industry_3.pdf
Wiser, R., Bolinger, M., Milford, L., Porter, K. & Clark, R. (2002). Innovation, Renewable Energy, and State Investment: Case Studies of Leading Clean Energy Funds. LBNL-51493. Berkeley, CA: Lawrence Berkeley National Laboratory.
Wiser, R., Murray, C., Hamrin, J. & Weston, R. (2003). International Experience with Public Benefits Funds: A Focus on Renewable Energy and Energy Efficiency. San Francisco: Energy Foundation.
Wongsapai, W. (2004a.) Electricity from Solar Energy in Thailand (1). Matichon Weekly, 24(1245): 29-30 (in Thai).
Wongsapai, W. (2004b). Electricity from Solar Energy in Thailand (2). Matichon Weekly, 24(1246): 36 (in Thai).
Wood, E. (2005). Jobs in the renewable energy economy: can the sector become a significant employer in the U.S.? Renewable Energy World 8(3): 32-41.
World Bank. (1996). Rural Energy and Development: Improving Energy Supplies for Two Billion People.
Washington, DC.
World Bank. (2004). World Development Indicators. Washington, DC.
World Bank. (2005). World Bank Group Progress on Renewable Energy and Energy Efficiency: 1990–2004. Washington, DC: The World Bank Group, Energy and Mining Sector Board.
World Energy Council. (2001a). Performance of Generating Plant 2001. London.
World Energy Council. (2001b). Survey of Energy Resources. London.
World Energy Council. (2004). Survey of World Energy Resources. London.
World Geothermal Council. (2005). Data on global geothermal use, mostly for 2000. www.geothermal.org
Worldwatch Institute. (2002). Vital Signs 2002. New York: W.W. Norton & Company.
Worldwatch Institute. (2004). Housing. In Good Stuff: A Behind-the-Scenes Guide to the Things We Buy.Washington, DC. www.worldwatch.org/pubs/goodstuff/housing
World Wide Fund for Nature (WWF). (2004). Progress Report on the EU Renewable Electricity Directive in Accession Countries. Gland, Switzerland.

GLOBALER STATUSBERICHT 2005
ERNEUERBARE ENERGIEN
Dieser Bericht sowie seine Übersetzung ins Deutsche wurden gefördert durch:
GLOBALER STATUSBERICHT 2005
ERNEUERBARE ENERGIEN
Bericht des Worldwatch Institute für das REN21-Netzwerk
Hauptautor: Eric Martinotwww.ren21.net

Renewable Energy Policy Network für das 21. Jahrhundert
REN21 ist ein globales Politiknetzwerk, das ein Forum für führende Initiativen im Bereich erneuerbare Energien auf internatio-naler Ebene bieten soll. Ziel ist es, durch Unterstützung politischer Entwicklungen und Entscheidungsprozesse auf regionaler, natio-naler und internationaler Ebene den schnellen Ausbau der erneuerbaren Energien in Entwicklungs- und Industrieländern zuermöglichen.
REN21 steht als Netzwerk engagierter und fähiger Köpfe allen relevanten Akteuren im Bereich erneuerbare Energien offen. DieInitiative ist geprägt von einem offenen Ideen- und Informationsaustausch, in dem weltweit Kooperationen und Maßnahmen zurFörderung der erneuerbaren Energien unterstützt werden. REN21 schafft ein gemeinsames Forum für Regierungen, internationaleEinrichtungen und Organisationen, Partnerschaften und Initiativen und andere Akteure auf politischer Ebene und verbindet sie mitden Menschen vor Ort. REN21 ist selbst kein Akteur, sondern ein Netzwerk von sich ständig weiter entwickelnden Beziehungen,dessen Hauptantriebskraft das Engagement für erneuerbare Energien ist.
Die Einrichtung eines globalen Politiknetzwerks war Bestandteil der Politischen Erklärung der Internationalen Konferenz fürErneuerbare Energien, die 2004 in Bonn stattfand (Renewables 2004), der offizielle Startschuss für das Netzwerk fiel im Juni 2005 inKopenhagen.
Thomas Becker UmweltministeriumDänemark
Mohammed Berdai Centre de Développement des EnergiesRenouvelables Marokko
James CameronClimate Change Capital
Paulo CyprianoBrasilianische Botschaft in Deutschland
Michael EckhartAmerican Council on Renewable Energy
David HalesWorldwatch Institute
Rainer Hinrichs-Rahlwes Bundesministerium für Umwelt,Naturschutz und ReaktorsicherheitDeutschland
Neil HirstEnergy Technology Collaboration DivisionInternationale Energieagentur
Michael HofmannBundesministerium für wirtschaftlicheZusammenarbeit und EntwicklungDeutschland
Richard HosierGlobal Environment Facility
Jackie JonesDepartment for Environment, Food and Rural AffairsGroßbritannien
Stephen KarekeziAfrican Energy Policy Research Network
Li JunfengNational Development and ReformCommission, Energy Research InstituteChinese Renewable Energy IndustriesAssociationChina
Susan McDadeEnergy Environment GroupUN-Entwicklungsprogramm
Jennifer Morgan Climate Change Programme, WWF
Paul Mubiru Ministerium für Energie und BodenschätzeUganda
Rajendra PachauriThe Energy and Resource InstituteIndia
Wolfgang PalzWorld Council for Renewable Energy
Mark RadkaDivision of Technology, Industry and EconomicsUN-Umweltprogramm
Peter RaeWorld Wind Energy Association
Artur Runge-Metzger DG Umwelt: Klima, Ozon und EnergieEuropäische Kommission
Jamal Saghir Energy and WaterWeltbank
Steve SawyerClimate and EnergyGreenpeace
Ernst-Christoph StolperNetwork of Regional Governments for Sustainable Developmentnrg4SD
Griffin ThompsonAußenministeriumUSA
Arthouros ZervosEuropean Renewable Energy CouncilGlobal Wind Energy Council
Ton van der ZonAußenministerium, DGISNiederlande
Vorgeschlagene Zitierweise
REN21 Renewable Energy Policy Network. 2005. „Globaler Statusbericht 2005 Erneuerbare Energien“. Washington, DC: Worldwatch Institute.
REN21 Lenkungsausschuss
www.ren21.net
060131.ps - 2/1/2006 10:38 AM

SEITE 2 ERNEUERBARE ENERGIEN 2005 GLOBALER STATUSBERICHT
Hauptautor, wissenschaftlicher Leiter
Eric Martinot, Worldwatch Institute und TsinghuaUniversität
Unterstützt durch
REN21 Renewable Energy Policy Network; Bundes-ministerium für Umwelt, Naturschutz und Reaktorsicher-heit; Bundesministerium für wirtschaftliche Zusammen-arbeit und Entwicklung
Erstellt und herausgegeben von
Worldwatch Institute und GTZ GmbH
Besonderer Dank
Tsinghua-BP Clean Energy Research and Education Center,Tsinghua University
Forscher, regionale Partner
Kyung-Jin Boo (Korean Energy Economics Institute); JohnMichael Buethe (Georgetown University); Odon de Buen(Nationale Autonome Universität von Mexiko); AkankshaChaurey (The Energy and Resources Institute (TERI)); RedConstantino (Greenpeace Philippines); Jose Etcheverry(David Suzuki Foundation); Uwe Fritsche (Öko-Institut);Daniele Guidi (Ecosoluzioni); Katja Hünecke (Öko-Institut); Tetsunari Iida (Institute for Sustainable EnergyPolicies); Waeni Kithyoma (AFREPREN); Liu Pei (TsinghuaUniversity); Samuel Martin (Asian Institute of Technology);Miquel Muñoz (Autonome Universität Barcelona); JoseRoberto Moreira (Biomass Users Network Brazil); MikaObayashi (Institute for Sustainable Energy Policies); DerrickOkello (AFREPREN); Michael Rogol (MassachusettsInstitute of Technology und CLSA Asia Pacific Markets);Kilian Reiche (Weltbank); Ikuko Sasaki (Institute forSustainable Energy Policies); Janet Sawin (WorldwatchInstitute); Klaus Schmidt (Öko-Institut); Peter Stair(Worldwatch Institute); Fabby Tumiwa (Indonesia NGOsWorking Group on Power Sector Restructuring); WangYunbo (Tsinghua University).
Sonstige Mitwirkende
Dank gebührt den nachstehend genannten Personen, dieuns mit ihrer Zeit, Sachbeiträgen und/oder redaktionellenAnmerkungen unterstützt haben: Molly Aeck (WorldwatchInstitute); Lily Alisse (Internationale Energieagentur);Dennis Anderson (Imperial College of London); SvenAnemüller (Germanwatch); Frederic Asseline (EU-ChinaEnergy and Environment Programme); Doug Barnes(Weltbank); Robert Bailis (Universität von Kalifornien in
Berkeley); Morgan Bazilian (Sustainable Energy Ireland); JeffBell (World Alliance for Decentralized Energy); Eldon Boes(NREL); John Byrne (Universität Delaware); Anil Cabraal(Weltbank); John Christensen (UN-Entwicklungspro-gramm); Wendy Clark (NREL); Christian de Gromard(französische FFEM); Nikhil Desai; Jens Drillisch (GTZ);Christine Eibs-Singer (E+Co); Chas Feinstein (Weltbank);Manfred Fischedick (Wuppertal Institut); Larry Flowers(NREL); Lisa Frantzis (Navigant Consulting); David Fridley(Lawrence Berkeley National Laboratory); Lew Fulton(Internationale Energieagentur); Chandra Govindarajalu(Weltbank); Chris Greacen (Palang Thai); Gu Shuhua(Tsinghua University); Jan Hamrin (Center for ResourceSolutions); Miao Hong (Weltbank/GEF China RenewableEnergy Project); Thomas Johansson (Universität Lund); DanKammen (Universität von Kalifornien in Berkeley); StephenKarakezi (AFREPREN); Sivan Kartha (Tellus Institute);Marlis Kees (GTZ); Jong-dall Kim (Kyungpook NationalUniversity); June Koch (CMT Consulting); Jean Ku (NREL);Lars Kvale (Center for Resource Solutions); Ole Langniss;Dan Lieberman (Center for Resource Solutions); Li Hua(SenterNovem); Li Junfeng (China Renewable EnergyIndustries Association); John Lund (InternationalGeothermal Association und Oregon Institute ofTechnology); Subodh Mathur (Weltbank); Paul Maycock(PV News); Bob McCormick (NREL); Susan McDade (UN-Entwicklungsprogramm); Tim Merrigan (NREL);Alan Miller (International Finance Corporation); FredMorse (Morse Associates); Hansjörg Müller (GTZ);Wolfgang Mostert; Kevin O’Connor, Kathy O’Dell undRalph Overend (NREL); Rolf Posorski (GTZ); Mark Radka(UN-Umweltprogramm); Venkata Ramana (WinrockInternational); Jeannie Renne (NREL); Jamal Saghir(Weltbank); Oliver Schaefer (European Renewable EnergyCouncil); Michael Schlup (BASE); Martin Schöpe(Bundesministerium für Umwelt, Naturschutz undReaktorsicherheit); Rick Sellers (InternationaleEnergieagentur); Shi Pengfei und Qin Haiyan (China WindEnergy Association); Judy Siegel (Energy and SecurityGroup); Scott Sklar (Stella Group); Brian Smith (NREL);Virginia Sonntag-O’Brien (BASE); Till Stenzel (Internatio-nale Energieagentur); Paul Suding (GTZ); Christof Timpe(Öko-Institut); Blair Swezey (NREL); Valérie Thill(Europäische Investitionsbank); Molly Tirpak (ICF); DieterUh (GTZ); Eric Usher (UN-Umweltprogramm); Claudiavon Fersen (KfW); Bill Wallace (UNDP/GEF ChinaRenewable Energy Project); Njeri Wamukonya (UN-Umweltprogramm); Xiaodong Wang (Weltbank); WangZhongying (China Energy Research Institute); Werner Weiss(AEE INTEC); Ryan Wiser (Lawrence Berkeley NationalLaboratory); Christine Woerlen (GEF); Jeremy Woods(Imperial College of London); Dana Younger (InternationalFinance Corporation); Arthouros Zervos (EuropeanRenewable Energy Council und European Wind EnergyAssociation).
DANKSAGUNG
060131.ps - 2/1/2006 10:38 AM

ERNEUERBARE ENERGIEN 2005 GLOBALER STATUSBERICHT SEITE 3
Zusammenfassung . . . . . . . . . . . . . . . . . . . . . . . 4
1. Globaler Marktüberblick . . . . . . . . . . . . . . . . 6
2. Investitionsflüsse . . . . . . . . . . . . . . . . . . . . . 14
3. Branchenentwicklungen . . . . . . . . . . . . . . . . 17
4. Politische Instrumente . . . . . . . . . . . . . . . . . 19
5. Netzunabhängige ländliche EE-Systeme . . . 29
Glossar . . . . . . . . . . . . . . . . . . . . . . . . . . . . . . . 34
Anmerkungen und Quellenangaben . . . . . . . . (*)
Abbildungen, Tabellen und Seitenleiste
Abbildung 1. Anteil erneuerbarer Energien an derweltweiten Primärenergieversorgung – 2004 . . . 6
Abbildung 2. Durchschnittliche jährliche Zuwachs-raten der installierten EE-Leistung – 2000-2004 . 8
Abbildung 3. Photovoltaik, weltweit installierteLeistung – 1990–2004 . . . . . . . . . . . . . . . . . . . . 8
Abbildung 4. Windkraft, weltweit installierteLeistung – 1990–2004 . . . . . . . . . . . . . . . . . . . . 9
Abbildung 5. Kapazitäten zur Erzeugung vonRegenerativstrom in den fünf führenden Ländern,in der EU und in der Dritten Welt – 2004 . . . . . 9
Abbildung 6. Windkraftkapazität in den zehn führenden Ländern – 2004 . . . . . . . . . . . . . . . 10
Abbildung 7. Installierte Leistung im Bereich solareWarmwasserbereitung/Heizung – 2004 . . . . . 10
Abbildung 8. Vorhandene solareWarmwasseranlagen je tausend Einwohner . . . 11
Abbildung 9. Produktion von Kraftstoffethanol –2000 und 2004 . . . . . . . . . . . . . . . . . . . . . . . . 11
Abbildung 10. Jährliche Investitionen in erneuer-bare Energien – 1995–2004 . . . . . . . . . . . . . . . 14
Abbildung 11. Zielvorgaben der EU für erneuer-bare Energien – Anteil an der Stromerzeugung bis 2010 . . . . . . . . . . . . . . . . . . . . . . . . . . . . . . 19
Tabelle 1. Indikatoren für erneuerbare Energien . 7
Tabelle 2. Stand der Entwicklung im Bereich er-neuerbare Energien – Merkmale und Kosten . . 12
Tabelle 3. Nicht-EU-Länder mit Zielvorgaben für erneuerbare Energien . . . . . . . . . . . . . . . . . 20
Tabelle 4. Instrumente zur Förderung erneuerbarerEnergien . . . . . . . . . . . . . . . . . . . . . . . . . . . . . . 21
Tabelle 5. Kumulative Anzahl derLänder/Bundesstaaten/Provinzen mitEinspeisesystemen . . . . . . . . . . . . . . . . . . . . . . 23
Tabelle 6. Kumulative Anzahl derLänder/Bundesstaaten/Provinzen mit Quoten-systemen (RPS) . . . . . . . . . . . . . . . . . . . . . . . . . 23
Tabelle 7. Ausgewählte Großstädte mitZielvorgaben und/oder Instrumenten zurFörderung erneuerbarer Energien . . . . . . . . . . 27
Tabelle 8. Häufige Anwendungen erneuerbarerEnergien in ländlichen (netzfernen) Gebieten . 30
Übersicht 1. Bonner Aktionsprogramm im internationalen Kontext . . . . . . . . . . . . . . . . . . 15
INHALT
(*) Anmerkungen und Quellenangaben:Vollständige Anmerkungen und Quellenangaben finden sich aufder REN21-Website unter www.ren21.net.
.
.
060131.ps - 2/1/2006 10:38 AM

SEITE 4 ERNEUERBARE ENERGIEN 2005 GLOBALER STATUSBERICHT
Der vorliegende Bericht gibt einen umfassenden Überblicküber den weltweiten Stand der Entwicklung im Bereich erneu-erbare Energien (abgekürzt: EE) im Jahr 2005. Er befasst sichmit Märkten, Investitionen, Industriebranchen, politischenInstrumenten und Programmen und erneuerbarer (netzfer-ner) Energie in Entwicklungsländern. Außerdem enthüllt ereinige überraschende Fakten über erneuerbare Energien, indenen sich vielfach die ausgeprägten Wachstumstrends unddie wachsende Bedeutung dieser Energien im Vergleich zukonventioneller Energie widerspiegeln.
x Rund 30 Mrd. $ wurden 2004 weltweit in erneuerbare
Energien investiert (ohne große Wasserkraft). Dieser Zahl
stehen rund 150 Mrd. $ gegenüber, die im Bereich der kon-
ventionellen Energie investiert wurden. Auf Investitionen
im Großwasserkraftbereich entfielen weitere 20–25 Mrd. $.
Sie wurden überwiegend in Entwicklungsländern getätigt.
x Die weltweite Kapazität zur Erzeugung von Strom aus
erneuerbaren Energien beträgt insgesamt 160 Gigawatt
(GW) (ohne große Wasserkraft) und macht somit ca. 4
Prozent der globalen Gesamtleistung des Stromsektors aus.
44 Prozent bzw. 70 GW davon entfallen auf die Entwick-
lungsländer.
x 2004 wurde mit erneuerbaren Energien weltweit genau
soviel Strom erzeugt wie mit einem Fünftel des gesamten
Kernkraftwerksbestands (unter Ausschluss von großer
Wasserkraft, die für sich allein 16 Prozent der globalen
Elektrizitätserzeugung ausmacht).
x Die wachstumsstärkste Energietechnologie der Welt ist die
netzgekoppelte Photovoltaik, die zwischen 2000 und 2004
in punkto installierte Leistung eine Zuwachsrate von 60
Prozent pro Jahr verzeichnete, und inzwischen auf über
400.000 Dächern in Japan, in Deutschland und in den
Vereinigten Staaten zu finden ist. An zweiter Stelle folgt die
Windkraft, die Kapazitätszuwächse von 28 Prozent pro Jahr
verzeichnete; in dieser Sparte steht Deutschland mit einer
installierten Leistung von fast 17 GW in 2004 an erster
Stelle.
x Dachintegrierte Sonnenkollektoren versorgen weltweit fast
40 Millionen Haushalte – die meisten davon in China – mit
warmem Wasser, und über 2 Millionen erdgekoppelte
Wärmepumpen werden in 30 Ländern zum Beheizen und
Klimatisieren von Gebäuden eingesetzt. Trotzdem wird mit
Biomasse als Brennstoff weltweit fünf Mal so viel Wärme
produziert wie mit Sonnenenergie und geothermischer
Energie zusammen.
x Die Erzeugung von Biokraftstoffen – Ethanol und Biodiesel
– lag 2004 bei über 33 Mrd. Litern; dies entspricht einem
Anteil von rund 3 Prozent des globalen Benzinverbrauchs
von insgesamt 1,2 Bill. Litern. Ethanol deckte im Jahr 2004
insgesamt 44 Prozent des Kraftstoffverbrauchs (Ottokraft-
stoff) in Brasilien und wurde 30 Prozent des verkauften
Benzins in den Vereinigten Staaten zugemischt.
x In Europa, in den Vereinigten Staaten, in Kanada, Australien
und Japan bezogen 2004 über 4,5 Mio. Verbraucher auf
freiwilliger Basis über den Endlieferanten oder mittels
Zertifikaten grünen Strom.
x 2004 lag die Zahl der mit erneuerbaren Energien zusam-
menhängenden direkten Arbeitsplätze im Fertigungs-,
Betriebs- und Wartungsbereich bei über 1,7 Millionen,
wovon rund 0,9 Millionen auf die Produktion biogener
Kraftstoffe entfielen.
x Für Millionen Menschen in den ländlichen Regionen der
Entwicklungsländer liefern erneuerbare Energien – insbe-
sondere kleine Wasserkraft, Biomasse und Photovoltaik –
Strom, Wärme, Antriebsenergie und Energie für Wasser-
pumpen und decken den Bedarf von landwirtschaftlichen
und kleingewerblichen Betrieben, Privathaushalten und
Schulen sowie sonstigen Bedarfträgern der Gemeinschaft.
Sechzehn Millionen Haushalte kochen und beleuchten ihre
Häuser mit Biogas, und zwei Millionen Haushalte nutzen
solare Beleuchtungssysteme.
Programme zur Förderung erneuerbarer Energien sind in
den letzten Jahren wie Pilze aus dem Boden geschossen.
Mindestens 48 Länder überall auf der Welt, darunter auch 14
Entwicklungsländer, verfügen inzwischen über ein wie auch
immer geartetes System zur Förderung erneuerbarer Energien.
Bis 2005 hatten mindestens 32 Länder und fünf Bundes-
staaten/Provinzen Einspeiseregelungen eingeführt, die zu über
50 Prozent bereits seit 2002 in Kraft sind. Mindestens 32
Bundesstaaten/Provinzen haben Quotenregelungen in Form
von so genannten Renewable Portfolio Standards eingeführt
(die Hälfte davon seit 2003), und in sechs Ländern sind natio-
nale Quotenregelungen bereits seit 2001 in Kraft. In mindes-
tens 30 Ländern werden direkte Kapitalsubventionen, Zu-
schüsse oder Vergünstigungen gewährt. Und in den meisten
amerikanischen Bundesstaaten und in mindestens 32 Ländern
werden die verschiedensten steuerlichen Anreize und Steuer-
ZUSAMMENFASSUNG
060131.ps - 2/1/2006 10:38 AM

ZUSAMMENFASSUNG ERNEUERBARE ENERGIEN 2005 GLOBALER STATUSBERICHT SEITE 5
gutschriften für erneuerbare Energien gewährt. Das in den
amerikanischen Bundesstaaten verwendete System der
Production Tax Credits (PTC) als Steuergutschriften für rege-
nerativ erzeugten Strom ist seit 1995 bei über 5,4 GW instal-
lierter Windkraft zum Tragen gekommen.
Über politische Ziele für erneuerbare Energien verfügenweltweit mindestens 45 Länder, darunter auch zehn Ent-wicklungsländer, alle 25 EU-Mitgliedstaaten und vieleBundesstaaten/Provinzen in den USA und in Kanada. Diemeisten Ziele sind zeitlich befristete Quoten für die Erzeu-gung von Strom, in der Regel 5–30 Prozent, die bis 2010–2012 zu erreichen sind. Für die EU gilt ein gemeinschafts-weites Ziel von 21 Prozent für die Elektrizitätserzeugung bis2010. Das von China gesetzte Ziel von 10 Prozent derGesamtleistung im Stromsektor bis 2010 (ohne großeWasserkraft) bedeutet eine Steigerung der installierten EE-Leistung von derzeit 37 GW auf 60 GW bis zum Jahr 2010.
Auch eine große Zahl von Städten rund um den Globusist dabei, Ziele für künftige Anteile erneuerbarer Energienam Energieverbrauch der kommunal en Behörden oder amGesamtverbrauch der Stadt festzulegen; diese liegen in derRegel bei 10 bis 20 Prozent. Einige Städte haben CO2-Min-derungsziele festgelegt. Und viele Städte haben einen gan-zen Katalog von Maßnahmen zur Förderung der solarenWarmwasserbereitung und der Photovoltaik auf den Weggebracht und erneuerbare Energien in die kommunaleStadtplanung eingebunden.
Brasilien ist seit 25 Jahren internationaler Spitzenreiter,was die Förderung biogener Kraftstoffe betrifft. Dem ge-samten in Brasilien verkauften Benzin muss Ethanol zuge-mischt werden, und alle Tankstellen bieten sowohl Rein-ethanol als auch Ethanolgemische an. Neben Brasilienhaben weltweit mindestens 20 Bundesstaaten/Provinzenund zwei Länder (China und Indien) verbindliche Normenfür die Zumischung von Biokraftstoffen zu normalemKraftstoff erlassen.
Erneuerbare Energien sind zum „Big Business“ gewor-den. Große Geschäftsbanken beginnen, Notiz von ihnen zunehmen, und eine Reihe Kreditinstitute haben den Investi-tionen in erneuerbare Energien einen festen Platz in ihremKreditportfolio eingeräumt. Auch andere Großinvestorenbetätigen sich zunehmend auf den Markt für erneuerbareEnergien, darunter auch Risikokapitalinvestoren und füh-rende Investmentbanken wie Morgan Stanley und GoldmanSachs. In den letzten Jahren haben führende Weltkonzernewie GE, Siemens, Shell, British Petroleum, Sanyo und Sharpbereits erhebliche Investitionen und Akquisitionen in die-sem Bereich realisiert. Fünf der größten Elektro- und Luft-und Raumfahrtkonzerne Chinas haben beschlossen, sich in
der Windkraftbranche zu engagieren. Der Börsenwert der60 führenden börsennotierten Unternehmen der EE-Bran-che oder EE-Geschäftsbereiche von Großunternehmen liegtinzwischen bei mindestens 25 Mrd. $.
Eine halbe Milliarde Dollar fließt pro Jahr als Entwick-lungshilfe für Erneuerbare-Energien-Projekte oder alsAusbildungs- und Marktunterstützungshilfe in die Entwick-lungsländer. Der überwiegende Teil wird von der deutschenKfW-Bankengruppe, der Weltbankgruppe und der GlobalenUmweltfazilität (Global Environment Facility, GEF) bereit-gestellt, der Rest von zahlreichen anderen Gebern undProgrammen.
Die vom Staat gewährte Unterstützung für erneuerbareEnergien belief sich im Jahr 2004 in den Vereinigten Staatenund Europa zusammen auf 10 Mrd. $, einschließlich direk-ter Unterstützung über den regulären Haushalt (budgetär)und Unterstützung durch marktpolitische Mechanismen(extrabudgetär). Darin eingeschlossen sind über 700 Mio. $pro Jahr, die in die Forschung und Entwicklung (F&E)fließen.
Im Zuge des technischen Fortschritts und der Erzielungvon Größenvorteilen sinken die Kosten vieler Regenerativ-technologien. Die Solar- und die Windenergie kosten inzwi-schen nur noch die Hälfte dessen, was sie vor 10–15 Jahrengekostet haben. Viele Regenerativtechnologien könnenunter günstigen Umständen durchaus mit den Endverbrau-cher- und sogar den Großabnehmerpreisen für konventio-nelle Energie konkurrieren, obwohl die Kosten konventio-neller Technologien ebenfalls zurückgehen (was durch diegestiegenen Brennstoffpreise wettgemacht wird).
Als Marktbereiter dienende Market Facilitation Orga-nizations (MFO) unterstützen die Entwicklung von Märk-ten, Investitionen, Industriebranchen und politischenInstrumenten/Programmen für erneuerbare Energien miteinem Mix aus Netzwerkbildung, Informationsaustausch,Marktforschung, Ausbildung, Partnering, Projektunterstüt-zung, Consulting, Finanzierung, Politikberatung und sons-tiger fachlicher Hilfe. Auf einer vorläufigen Liste stehenmindestens 150 Organisationen dieser Art in allen Teilender Welt einschließlich Branchenverbänden, Nichtregie-rungsorganisationen, multilateraler und bilateraler Ent-wicklungsorganisationen, internationaler Partnerschaftenund Netzwerken sowie staatlicher Stellen.
060131.ps - 2/1/2006 10:38 AM

SEITE 6 ERNEUERBARE ENERGIEN 2005 GLOBALER STATUSBERICHT
rneuerbare Energien liefern 17 Prozentder weltweiten Primärenergiemenge,rechnet man darin traditionelle Biomasse,große Wasserkraft und „neue“ erneuerba-re Energien* (Kleinwasserkraft, moderne
Biomasse, Wind, Sonnenenergie, Geothermie und Bio-kraftstoffe)*† ein. (Siehe Abb.1). Der Anteil der tradi-tionellen Biomasse, die in erster Linie zum Kochen undHeizen verwendet wird, liegt bei rund 9 Prozent undnimmt in manchen Regionen aufgrund der effiziente-ren Nutzung oder der Substitution durch modernereEnergieträger langsamer zu oder sogar ab. Der Anteilgroßer Wasserkraft liegt bei knapp 6 Prozent undwächst langsam, in erster Linie in den Entwicklungslän-dern [‡]. Der Anteil der neuen erneuerbaren Energienliegt bei 2 Prozent und nimmt in den Industrieländernund in einigen Entwicklungsländern sehr rasch zu.Natürlich zeichnet sich jede dieser drei erneuerbarenEnergieformen durch ihre eigenen Merkmale und Ent-wicklungstendenzen aus. Der vorliegende Bericht befasst sich inerster Linie mit den neuen erneuerbaren Energien, da diese einenormes Zukunftspotenzial bieten und einer vordringlichenMarkt- und Politikunterstützung zur Beschleunigung ihrerkommerziellen Nutzung bedürfen. §[Anm. 1, 2]**
Erneuerbare Energien stehen in vier verschiedenen Markt-segmenten im Wettbewerb mit konventionellen Energieträgern:Stromerzeugung, Warmwasserbereitung/Raumbeheizung, Ver-kehrskraftstoffe und (netzferne) Energieversorgung in länd-lichen Regionen. (Siehe Tabelle 1.) Im Bereich der Stromerzeu-gung verzeichnen erneuerbare Energien einen Anteil von rund 4Prozent der Stromerzeugungskapazität und liefern rund 3 Pro-zent der weltweit erzeugten Elektrizität (ohne große Wasser-kraft). Durch Nutzung von Solar-, Biomasse- und Geothermie-energie werden Millionen von Gebäuden mit warmem Wasserund Heizungswärme versorgt. Solarthermische Kollektoren
allein sind inzwischen in schätzungsweise 40 Millionen Haus-halten überall auf der Welt zu finden. Und Biomasse und Geo-thermie liefern Wärme für die Industrie, für Privathaushalte und für die Landwirtschaft. Kraftstoffe aus Biomasse leisteneinen kleinen, aber wachsenden Beitrag zur Kraftstoffversorgungverschiedener Länder und einen sehr großen in Brasilien, woEthanol aus Zuckerrohr inzwischen 44 Prozent des Kraftstoff-verbrauchs (Ottokraftstoff) des gesamten Landes deckt. In denEntwicklungsländern verwenden 16 Millionen Haushalte Biogaszum Kochen und Beleuchten als Ersatz für Kerosin und andereKochbrennstoffe. Über zwei Millionen Haushalte beleuchten ihreHäuser und Wohnungen mit Photovoltaikstrom, und eine wach-sende Zahl von Kleinbetrieben, darunter auch Verarbeitungs-betriebe für Agrarprodukte, beziehen Prozesswärme und An-triebskraft aus kleinen Biogasanlagen.††[Anm. 3]
Die wachstumsstärkste Regenerativenergietechnologie der
1. GLOBALER MARKTÜBERBLICK
Abbildung1. Anteil erneuerbarer Energien an der weltweiten Primärenergieerzeugung - 2004
TraditionelleBiomasse
9,0%
Groß- wasserkraft
5,7%
Neue erneuerbareEnergieträger
2,0%Biokraftstoffe
0,2%
Warmwasser-Bereitung/
Heizung0,7%
Stromerzeugung1,2%
* Sofern nichts anderes angegeben ist, bezieht sich der Begriff „erneuerbare Energien“ im Sinne dieses Berichts auf „neue erneuerbare Energien“. Es gibt keine allgemein anerkannteDefinition des Begriffs, doch die Bezeichnung „neuer“ erneuerbarer Energien als „erneuerbare Energien“ in schriftlichen Arbeiten ist eine allgemein anerkannte semantische Praxis.British Petroleum zum Beispiel klammert in seinem Statistical Review of World Energy aus dem Begriff „erneuerbare Energien“ große Wasserkraft aus. Und in dem wegweisendenBericht „Renewables for Power Generation“ (2003) der Internationalen Energieagentur wird große Wasserkraft ebenfalls ausgenommen. Üblicherweise wird unter große Wasserkraft >10 MW verstanden, doch die statistischen Angaben zu kleiner Wasserkraft in diesem Bericht enthalten z. B. im Fall Chinas Anlagen bis 50 MW und bei Brasilien Anlagen bis 30 MW, dadiese Länder Kleinwasserkraft anhand dieser Grenzwerte bestimmen und erfassen.
† Je nachdem, wie große Wasserkraft und andere Technologien zur Erzeugung von Regenerativstrom in der globalen Energiebilanz erfasst sind, kann der Gesamtbeitrag der Erneuer-baren zur weltweiten Primärenergieerzeugung auch mit 13-14 Prozent anstatt mit 17 Prozent angesetzt werden. Die grundsätzliche Frage ist, ob der Energiewert der entsprechendenPrimärenergie oder der Energiewert der Elektrizität berücksichtigt werden soll. Näheres siehe Anmerkung 2.
‡ “Entwicklungsland” ist kein genau definierter Begriff, bezeichnet jedoch im Allgemeinen ein Land mit niedrigem Pro-Kopf-Einkommen. Ein mögliches Kriterium ist, ob das Landfür eine Unterstützung durch die Weltbank in Frage kommt. Entwicklungsländer laut diesem Bericht sind die Nichtmitgliedstaaten der OECD plus die OECD-Mitglieder Mexiko undTürkei, allerdings ohne Russland und andere im Übergang befindliche ehemalige Planwirtschaften.
§ Dieser Bericht befasst sich nur mit Regenerativtechnologien, die gegenwärtig weltweit in erheblichem Umfang kommerziell genutzt werden. Viele andere Technologien bieten kom-merziell vielversprechende Zukunftsaussichten oder werden bereits in begrenztem Umfang auf kommerzieller Basis eingesetzt; dazu gehören die aktive solare Kühlung (auch als „solar-gestützte Klimatisierung von Gebäuden“ bezeichnet), die Konzentrierung von Solarstrahlung (mittels Fresnel-Linsen), die Umwandlung von thermischer Meeresenergie, Gezeitenener-gie, Wellenenergie, Hot-Dry-/Wet-Rock-Geothermie und Ethanol aus Zellulose. Wie verlautet, sind in einer knappen Million Haushalte Solarkocher in Gebrauch, doch es standen keineDaten über die derzeitigen Entwicklungen zur Verfügung. Auch die passive Solarnutzung für Heizzwecke ist ein kommerziell erfolgreiches und weitverbreitetes bautechnisches Ver-fahren, wird jedoch in diesem Bericht nicht berücksichtigt. In künftigen Ausgaben könnte auf weitere Technologien und Verfahren dieser Art eingegangen werden.
**Auf Anmerkungen und Hinweise zu diesem Bericht wird in eckigen Klammern nach dem jeweiligen Absatz verwiesen, z. B. [Anm.1]. Ausführliche Anmerkungen und Hinweise zudiesem Bericht sind unter http://ren21.net/globalstatusreport/RE2005_Notes_References.pdf zu finden.
†† Zur netzunabhängigen Photovoltaik gehören Systeme für die private und die gewerbliche Nutzung, die Signal- und Kommunikationstechnik und den Verbrauchsgüterbereich. 2004wurden weltweit 70 MW im Verbrauchsgüterbereich, 80 MW in der Signal- und Kommunikationstechnik und 180 MW für netzunabhängige private und kommerzielle Zweckeverbraucht.
E
060131.ps - 2/1/2006 10:38 AM

GLOBALER MARKTÜBERBLICK ERNEUERBARE ENERGIEN 2005 GLOBALER STATUSBERICHT SEITE 7
Welt ist die netzgekoppelte Photovoltaik, derenGesamtleistung zwischen Anfang 2000 und Ende2004 von 0,16 GW auf 1,8 GW stieg. Damiterreichte sie eine durchschnittliche Zuwachsratevon 60 Prozent pro Jahr in diesem Fünfjahres-zeitraum. (Siehe Abb. 2 und 3.) Auch andereRegenerativtechnologien wuchsen in diesemZeitraum deutlich (im Jahresdurchschnitt):Windkraft um 28 Prozent (siehe Abb. 4), Bio-diesel um 25 Prozent, solare Warmwasserbe-reitung/ Heizung um 17 Prozent, netzunabhän-gige Photovoltaik um 17 Prozent, Erdwärme um13 Prozent und Ethanol um 11 Prozent. Dieübrigen Technologien zur Erzeugung von Stromaus erneuerbaren Energien einschließlich Bio-masse, Geothermie und kleiner Wasserkrafterreichen aufgrund ihrer größeren Marktreifekonservativere Zuwachsraten von 2–3 Prozentpro Jahr. Die Wärmeerzeugung aus Biomassedürfte gegenwärtig in ähnlichem Umfang stei-gen; genaue Zahlen stehen nicht zur Verfügung.Diesen Zuwachsraten stehen jährliche Zuwachs-raten von typischerweise 3–4 Prozent (in einigenEntwicklungsländern liegen sie höher) bei derStromerzeugungskapazität auf Basis fossilerEnergieträger, 2 Prozent bei großer Wasserkraftund 1,6 Prozent bei den Nuklearkapazitäten imDreijahreszeitraum 2000–2002 gegenüber.[Anm.3]
Die weltweit installierte Leistung zur Er-zeugung von Strom aus erneuerbaren Energienbelief sich 2004 auf 160 GW ohne große Wasser-kraft. (Siehe Abbildung 5.) Zwei Drittel dieserKapazität entfallen auf kleine Wasserkraft undWindkraft. Diesen 160 GW stehen 3.800 GW anweltweit installierter Leistung für die gesamteStromerzeugung gegenüber. Die Entwicklungs-länder als eine Gruppe einschließlich China tra-gen 70 GW (44 Prozent) der Gesamtleistung von160 GW bei, in erster Linie in Form von Stromaus Biomasse und kleiner Wasserkraft. Der An-teil der Europäischen Union beträgt 57 GW (36Prozent) und stammt überwiegend aus Wind-kraft. Die führenden fünf Länder (Top-5) sindChina (37 GW), Deutschland (20 GW), die Ver-einigten Staaten (20 GW), Spanien (10 GW)und Japan (6 GW).[Anm. 4, Anm. 5]
Große Wasserkraft gehört immer noch zuden kostengünstigsten Energietechnologien, obwohl ökologi-sche Restriktionen, Umsiedlungsfolgen und die mangelndeVerfügbarkeit von Standorten den Ausbau in vielen Länderneinschränken. Der Anteil großer Wasserkraft an der globalenElektrizitätsproduktion, der vor zehn Jahren noch bei 19 Pro-zent lag, belief sich 2004 auf 16 Prozent. Die Stromerzeugungs-leistung aus großer Wasserkraft betrug 2004 insgesamt rund720 GW weltweit und ist in der Vergangenheit um etwas mehrals 2 Prozent pro Jahr (in den Entwicklungsländern um dieHälfte) gestiegen. Norwegen gehört zu den Ländern, die prak-tisch ihre gesamte Elektrizität aus Wasserkraft erzeugen. Die
fünf führenden Wasserkraftproduzenten in 2004 waren Kanada(12 Prozent der Weltproduktion), China (11,7 Prozent),Brasilien (11,4 Prozent), die USA (9,4 Prozent) und Russland(6,3 Prozent). In China hat die Zunahme im Bereich Wasser-kraft mit dem rasch wachsenden chinesischen StrommarktSchritt gehalten. 2004 installierte das Land fast 8 GW an großerWasserkraft und ist somit, was die installierte Leistung (74 GW)betrifft, auf Platz eins vorgerückt. Auch andere Entwicklungs-länder investieren erhebliche Summen in die große Wasserkraft;zur Zeit befinden sich mehrere Anlagen im Bau.
Tabelle 1. Indikatoren für erneuerbare Energien
InstallierteLeistung
Indikator Ende 2004 Vergleichsindikatoren
Stromerzeugung (GW)
Großwasserkraft 720 Weltweit installierte Kleinwasserkraft 61 elektrische LeistungWindkraftanlagen 48 3.800 GWBiomassestrom 39Geothermischer Strom 8.9Photovoltaik (PV), netzunabhängig 2.2Photovoltaik (PV), netzgekoppelt 1.8Solarthermischer Strom 0.4Meeres(wellen)energie 0.3EE-Stromerzeugungskapazität insgesamt(ohne große Wasserkraft) 160
Warmwasserbereitung/Raumheizung (GWth)
Biomasseheizung 220Sonnenkollektoren fürWarmwasser/Heizung (verglast) 77Direktbeheizung mit Erdwärme 13Erdgekoppelte Wärmepumpen 15
Haushalte mit solarer Haushalte weltweitWarmwasserbereitung 40 Mio. 1,6 Mrd.Gebäude mit erdgekoppeltenWärmepumpen 2 Mio.
Verkehrskraftstoffe (Liter/Jahr)
Ethanolproduktion 31 Mrd. BenzinproduktionBiodieselproduktion 2.2 Mrd. insgesamt
1,2 Bill. Liter/Jahr
Ländliche (netzferne) Energieversorgung
Biogasanlagen für den häuslichen Bedarf 16 Mio. Haushalte ohne Kleine Biomasse-Vergasungsanlagen k.A. NetzversorgungPhotovoltaikanlagen für häuslichen Bedarf 2 Mio. 360 Mio.Solarkocher 1 Mio.
060131.ps - 2/1/2006 10:38 AM
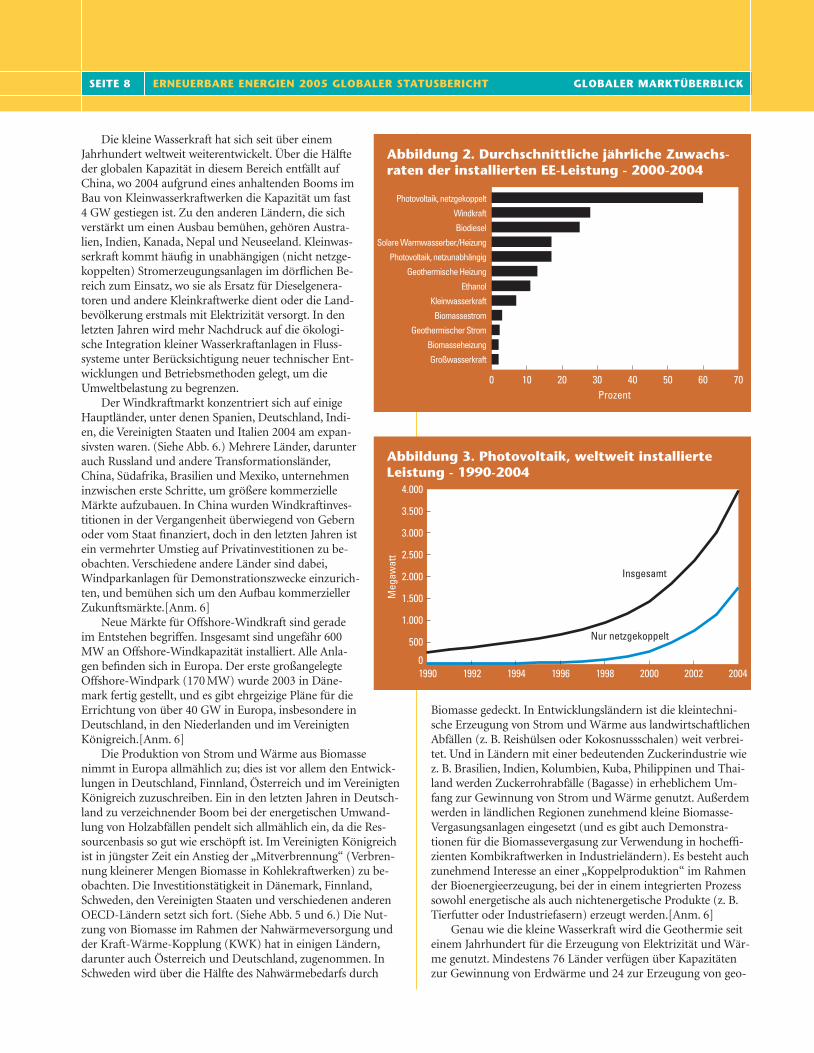
SEITE 8 ERNEUERBARE ENERGIEN 2005 GLOBALER STATUSBERICHT GLOBALER MARKTÜBERBLICK
Die kleine Wasserkraft hat sich seit über einemJahrhundert weltweit weiterentwickelt. Über die Hälfteder globalen Kapazität in diesem Bereich entfällt aufChina, wo 2004 aufgrund eines anhaltenden Booms imBau von Kleinwasserkraftwerken die Kapazität um fast4 GW gestiegen ist. Zu den anderen Ländern, die sichverstärkt um einen Ausbau bemühen, gehören Austra-lien, Indien, Kanada, Nepal und Neuseeland. Kleinwas-serkraft kommt häufig in unabhängigen (nicht netzge-koppelten) Stromerzeugungsanlagen im dörflichen Be-reich zum Einsatz, wo sie als Ersatz für Dieselgenera-toren und andere Kleinkraftwerke dient oder die Land-bevölkerung erstmals mit Elektrizität versorgt. In denletzten Jahren wird mehr Nachdruck auf die ökologi-sche Integration kleiner Wasserkraftanlagen in Fluss-systeme unter Berücksichtigung neuer technischer Ent-wicklungen und Betriebsmethoden gelegt, um dieUmweltbelastung zu begrenzen.
Der Windkraftmarkt konzentriert sich auf einigeHauptländer, unter denen Spanien, Deutschland, Indi-en, die Vereinigten Staaten und Italien 2004 am expan-sivsten waren. (Siehe Abb. 6.) Mehrere Länder, darunterauch Russland und andere Transformationsländer,China, Südafrika, Brasilien und Mexiko, unternehmeninzwischen erste Schritte, um größere kommerzielleMärkte aufzubauen. In China wurden Windkraftinves-titionen in der Vergangenheit überwiegend von Gebernoder vom Staat finanziert, doch in den letzten Jahren istein vermehrter Umstieg auf Privatinvestitionen zu be-obachten. Verschiedene andere Länder sind dabei,Windparkanlagen für Demonstrationszwecke einzurich-ten, und bemühen sich um den Aufbau kommerziellerZukunftsmärkte.[Anm. 6]
Neue Märkte für Offshore-Windkraft sind geradeim Entstehen begriffen. Insgesamt sind ungefähr 600MW an Offshore-Windkapazität installiert. Alle Anla-gen befinden sich in Europa. Der erste großangelegteOffshore-Windpark (170 MW) wurde 2003 in Däne-mark fertig gestellt, und es gibt ehrgeizige Pläne für dieErrichtung von über 40 GW in Europa, insbesondere inDeutschland, in den Niederlanden und im VereinigtenKönigreich.[Anm. 6]
Die Produktion von Strom und Wärme aus Biomassenimmt in Europa allmählich zu; dies ist vor allem den Entwick-lungen in Deutschland, Finnland, Österreich und im VereinigtenKönigreich zuzuschreiben. Ein in den letzten Jahren in Deutsch-land zu verzeichnender Boom bei der energetischen Umwand-lung von Holzabfällen pendelt sich allmählich ein, da die Res-sourcenbasis so gut wie erschöpft ist. Im Vereinigten Königreichist in jüngster Zeit ein Anstieg der „Mitverbrennung“ (Verbren-nung kleinerer Mengen Biomasse in Kohlekraftwerken) zu be-obachten. Die Investitionstätigkeit in Dänemark, Finnland,Schweden, den Vereinigten Staaten und verschiedenen anderenOECD-Ländern setzt sich fort. (Siehe Abb. 5 und 6.) Die Nut-zung von Biomasse im Rahmen der Nahwärmeversorgung undder Kraft-Wärme-Kopplung (KWK) hat in einigen Ländern,darunter auch Österreich und Deutschland, zugenommen. InSchweden wird über die Hälfte des Nahwärmebedarfs durch
Biomasse gedeckt. In Entwicklungsländern ist die kleintechni-sche Erzeugung von Strom und Wärme aus landwirtschaftlichenAbfällen (z. B. Reishülsen oder Kokosnussschalen) weit verbrei-tet. Und in Ländern mit einer bedeutenden Zuckerindustrie wiez. B. Brasilien, Indien, Kolumbien, Kuba, Philippinen und Thai-land werden Zuckerrohrabfälle (Bagasse) in erheblichem Um-fang zur Gewinnung von Strom und Wärme genutzt. Außerdemwerden in ländlichen Regionen zunehmend kleine Biomasse-Vergasungsanlagen eingesetzt (und es gibt auch Demonstra-tionen für die Biomassevergasung zur Verwendung in hocheffi-zienten Kombikraftwerken in Industrieländern). Es besteht auchzunehmend Interesse an einer „Koppelproduktion“ im Rahmender Bioenergieerzeugung, bei der in einem integrierten Prozesssowohl energetische als auch nichtenergetische Produkte (z. B.Tierfutter oder Industriefasern) erzeugt werden.[Anm. 6]
Genau wie die kleine Wasserkraft wird die Geothermie seiteinem Jahrhundert für die Erzeugung von Elektrizität und Wär-me genutzt. Mindestens 76 Länder verfügen über Kapazitätenzur Gewinnung von Erdwärme und 24 zur Erzeugung von geo-
Abbildung 2. Durchschnittliche jährliche Zuwachs- raten der installierten EE-Leistung - 2000-2004
Photovoltaik, netzgekoppelt
Windkraft
Biodiesel
Solare Warmwasserber./Heizung
Photovoltaik, netzunabhängig
Geothermische Heizung
Ethanol
Kleinwasserkraft
Biomassestrom
Geothermischer Strom
Biomasseheizung
Großwasserkraft
0 10 20 30 40 50 60 70Prozent
Abbildung 3. Photovoltaik, weltweit installierte Leistung - 1990-2004
1990 1992 1994 1996 1998 2000 2002 2004
2.000
4.000
3.500
3.000
2.500
1.500
1.000
500
0
Meg
awat
t
Insgesamt
Nur netzgekoppelt
060131.ps - 2/1/2006 10:38 AM

GLOBALER MARKTÜBERBLICK ERNEUERBARE ENERGIEN 2005 GLOBALER STATUSBERICHT SEITE 9
thermischem Strom. Zwischen 2000 und 2004 kamen über 1GW an geothermischer Stromkapazität hinzu, einschließlicherheblicher Zuwächse in Frankreich, Indonesien, Island, Kenia,Mexiko, Philippinen und Russland. Die vorhandene Kapazitätzur Erzeugung von geothermischem Strom in den Industrie-ländern ist überwiegend in Italien, in Japan, in Neuseeland undin den USA zu finden.[Anm. 6]
Die Kapazitäten zur direkten Nutzung von Wärme aus geothermischen Quellen erhöhten sich zwischen 2000 und 2005um 13 GWth auf fast das Doppelte, wobei mindestens 13 neueLänder erstmals Erdwärme nutzten. Island ist bei der direktenErdwärmenutzung für Heizzwecke weltweit führend und decktrund 85 Prozent seines Raumwärmebedarfs durch Erdwärme.Die Türkei hat ihre geothermische Fernwärmekapazität seit2000 um 50 Prozent erhöht; die derzeit bereitgestellte Wärme-menge entspricht dem Bedarf von siebzigtausend Haushalten.Etwa die Hälfte der vorhandenen Erdwärmekapazität entfälltauf geothermische Wärmepumpen, die auch als erdgekoppelteWärmepumpen bezeichnet werden. Diese werden zunehmendfür die Gebäudebeheizung und -klimatisierung genutzt. Derzeit
sind in über 30 Ländern, vor allem in Europa und inden Vereinigten Staaten, fast 2 Millionen Wärme-pumpen in Betrieb.
Die Verwendung netzgekoppelter Photovoltaik-anlagen (PV) konzentriert sich auf die drei LänderJapan, Deutschland und die USA, wo sie gezielt gefördert werden. 2004 speisten in diesen Ländernüber 400.000 Haushalte Strom aus dachgestützten PV-Anlagen ins Netz ein. Dieser Markt wuchs 2004 um0,7 GW, d. h. die kumulierte installierte Leistung stieg von 1,1 GW auf 1,8 GW. Weltweit gibt es einewachsende Zahl kommerzieller und öffentlicherPilotanlagen für gebäudeintegrierte Photovoltaik.Zu den typischen Beispielen gehören eine U-Bahn-Station (100 kW), eine Tankstelle (30 kW), eine PV-Fertigungsanlage (200 kW), eine Feuerwehrwache(100 kW), eine Messehalle (1.000 kW), ein Univer-sitätsgebäude (10 kW) und eine Haftanstalt (70 kW).[Anm. 7]
Der Markt für konzentrierende solarthermischeAnlagen stagniert seit Beginn der 1990er Jahre; damalswurden in Kalifornien aufgrund günstiger steuerlicherAbschreibungsmöglichkeiten 350 MW Leistung neuinstalliert. In jüngerer Zeit haben kommerzielle Anla-gen in Israel, in Spanien und in den Vereinigten Staa-ten zu einer Neubelebung des Interesses, der Techno-logieentwicklung und des Investitionspotenzials ge-führt. 2004 wurde in Arizona mit dem Bau eines 1-MW-Parabolrinnenkraftwerks begonnen, der erstenneuen Anlage weltweit seit Beginn der 1990er Jahre.Auf dem sich entwickelnden spanischen Markt erwä-gen Investoren die Realisierung von zwei 50-MW-Pro-jekten im Jahr 2005. In mehreren Entwicklungslän-dern einschließlich Indien, Ägypten, Mexiko und Ma-rokko sind Projekte mit multilateraler Hilfe geplant,deren Status allerdings teilweise noch ungewiss ist.
Solare Warmwasser-/Heizungstechnologien findenzunehmend Verbreitung und haben einen beträchtli-
chen Anteil an den Warmwasser-/Heizungsmärkten in China,Europa, Israel, der Türkei und Japan. Dutzende anderer Länderverfügen über kleinere Märkte. Der Anteil Chinas an der welt-weit installierten Gesamtkapazität beläuft sich auf 60 Prozent.(Siehe Abb. 7 und 8.) Die Europäische Union erreicht 11Prozent, gefolgt von der Türkei mit 9 Prozent und Japan mit 7Prozent (alle Werte gelten nur für verglaste Kollektoren). ImJahr 2004 belief sich das Umsatzvolumen in China auf insge-samt 13,5 Mio. Quadratmeter; dies entspricht einer Erhöhungder vorhandenen Kapazität um 26 Prozent. Vakuumröhren-Warmwasserkollektoren beherrschen inzwischen den chinesi-schen Markt und verzeichneten 2003 einen Marktanteil von 88Prozent. In Japan nimmt die installierte Leistung bei derSolarthermie weiter ab, da mehr Anlagen außer Betrieb als inBetrieb genommen werden. In Europa wurde 2004 rund 1,6Mio. Quadratmeter Kollektorfläche installiert; dieser Zugangwurde jedoch teilweise durch Abgänge älterer Bestandsanlagenausgeglichen. Rechnet man die 110 Mio. Quadratmeter weltweitinstallierte Kollektorfläche (Wärmeerzeugungsleistung 77GWth) auf Haushalte um, ergeben sich fast 40 Millionen Haus-
Abbildung 4. Windkraft, weltweit installierte Leistung - 1990-2004
1990 1992 1994 1996 1998 2000 2002 20040
Giga
wat
t
0
10
20
30
40
50
Abbildung 5. Kapazitäten zur Erzeugung von Regenerativstrom
in den fünf führenden Ländern, der EU und der Dritten Welt - 2004
JapanSpanienUSADeutsch-land
ChinaEU-25Entwick- lungsländer
Weltgesamt
Giga
wat
t
0
50
25
100
75
175
150
125
Photovoltaik, netzgekoppeltGeothermieBiomasseWindenergieKleinwasserkraft
060131.ps - 2/1/2006 10:38 AM

SEITE 10 ERNEUERBARE ENERGIEN 2005 GLOBALER STATUSBERICHT GLOBALER MARKTÜBERBLICK
halte, die mit solar erzeugtem Warmwasser versorgtwerden. Dies entspricht 2,5 Prozent der rund 1,6 Mrd.Haushalte weltweit.* [Anm. 8]
Die Raumbeheizung mittels Sonnenergie fasst zwarin immer mehr Ländern Fuß, doch die wichtigste Solar-anwendung bleibt die Warmwasserbereitung. In Schwe-den und in Österreich entfallen über 50 Prozent derjährlich installierten Kollektorfläche auf Kombisystemefür Warmwasser und Heizungsunterstützung. InDeutschland beträgt der Anteil der Kombisysteme 25–30 Prozent der jährlich installierten Kapazität. In Chinaerzeugen weniger als 5 Prozent der Anlagen nebenWarmwasser auch Raumwärme.
Der weltweiten Biokraftstoffproduktion von 33Mrd. Litern im Jahr 2004 steht eine jährliche weltweiteBenzinproduktion von insgesamt rund 1,2 Bill. Literngegenüber. (Siehe Abb. 9.) Brasilien ist seit über 25 Jah-ren internationaler Spitzenreiter bei der Erzeugung(und Nutzung) von Kraftstoffethanol. Die brasilianischeEthanolproduktion betrug 2004 rund 15 Mrd. Liter undmacht etwas weniger als die Hälfte der Gesamtproduk-tion von Kraftstoffethanol weltweit aus. Alle Tankstellenin Brasilien vertreiben sowohl Reinethanol (E95) alsauch Gasohol, ein Gemisch aus 25 Prozent Ethanol und75 Prozent Benzin (E25). 2004 wurde in Brasilien fastgenauso viel Ethanol wie Benzin als Kraftstoff (Otto-kraftstoff) eingesetzt. Das bedeutet, dass Ethanol alsBeimischung zu Gasohol oder als Reinethanol vertrie-ben 44 Prozent des insgesamt in Brasilien verkauftenKraftstoffs ausmacht. Im Vergleich zu Benzin war dieNachfrage nach Ethanol 2005 sehr hoch. In den letztenJahren hat sich ein lebhafter internationaler Handel mitKraftstoffethanol mit Brasilien als führendem Expor-teur entwickelt. Die brasilianischen Ethanolexporte inHöhe von 2,5 Mrd. Litern machten über 50 Prozent desWelthandels im Jahr 2004 aus. [Anm. 9]
Der Kraftstoff- und der Fahrzeugmarkt in Brasilienhaben sich gemeinsam entwickelt. Nach einem massi-ven Umsatzeinbruch bei den mit Reinethanol betriebe-nen Fahrzeugen in den 1990er Jahren begannen die UmsätzeAnfang 2000 aufgrund einer deutlichen Senkung der Ethanol-preise, steigender Benzinpreise und der Markteinführung der sogenannten „Flexible Fuel“– oder kurz Flexfuel-Fahrzeuge durchbrasilianische Autohersteller wieder nach oben zu gehen. DieFlexfuel-Fahrzeuge können sowohl mit Reinethanol als auchmit einem Ethanol-/Benzingemisch betrieben werden. Ab 2003wurden diese Fahrzeuge von den meisten Autoherstellern zuPreisen angeboten, die mit den Preisen der mit Reinethanoloder mit Gasohol betriebenen Fahrzeuge vergleichbar waren.Die Flexfuel-Fahrzeuge haben bei den Autofahrern enormenAnklang gefunden, zum Teil aus Sorge über mögliche Versor-gungsengpässe (wie z. B. die Ethanolknappheit 1989 oder künf-tige Ölkrisen). Die Umsätze stiegen rasch, und 2005 waren über50 Prozent der in Brasilien verkauften Neuwagen Flexfuel-Fahr-
zeuge. [Anm. 10]Die Vereinigten Staaten sind der zweitgrößte Konsument
und Produzent von Kraftstoffethanol. Die Expansion des US-amerikanischen Ethanolmarktes ist eine relativ neue Entwick-lung. Die Produktionsleistung stieg zwischen 1996 und 2004 von4 Mrd. Litern pro Jahr auf 14 Mrd. Liter pro Jahr. Die jährlicheZuwachsrate liegt derzeit bei 15–20 Prozent. 2005 verkauftenrund 400 Tankstellen (die meisten davon im nördlichen Mitt-leren Westen) E85 – ein Kraftstoffgemisch aus 85 Prozent Etha-nol und 15 Prozent Benzin – und eine noch größere Menge Gas-ohol (E10). 2005 belief sich der Ethanolanteil am Jahreskraft-stoffverbrauch (Ottokraftstoff) von insgesamt 140 Mrd. Gal-lonen auf rund 3 Prozent. Außerdem wurde Ethanol (E10) 30Prozent des insgesamt in den USA verkauften Benzins zuge-mischt und ersetzte den Oxygenator MTBE (Methyl-Tertiär-
Abbildung 7. Installierte Leistung im Bereich solare Warmwasserbereitung/Heizung - 2004
EU 12,7%
Türkei 9,0%
Japan 7,0%
Israel 4,4%Brasilien 2,1%USA 1,8%Australien 1,4%Indien 0,9%Süd Afrika 0,5%Andere 1,7%
China58,4%
Abbildung 6. Installierte Windkraftleistung in den zehn führenden Ländern - 2004
Meg
awat
t
Zunahme 2004
Deutschland
SpanienUSA
VK
DänemarkIndien
Italien
Niederlande
JapanChina
0
5.000
10.000
15.000
20.000
2.050
2.070
8.100
390
10880
360 200 230 250 200
* Solare Warmwasserbereitung/Heizungsunterstützung wird im Allgemeinen als “solare Heizung und Kühlung” bezeichnet, um zu unterstreichen, dass die solare Kühlung (solar ge-stützte Klimatisierung) ebenfalls eine kommerziell nutzbare Technologie ist. In diesem Bericht wird solare Warmwasserbereitung/Heizung verwendet, weil der überwiegende Teil derinstallierten Kapazität auf Warmwasser allein entfällt. Ein kleiner Teil der weltweit vorhandenen Kapazität, insbesondere in Europa, dient zur Raumbeheizung, jedoch macht die Raum-heizung auch in Kombianlagen nur einen kleinen Teil der Gesamtwärme aus. Die solare Kühlung wird noch nicht in großem Stil kommerziell genutzt, doch viele sind der Ansicht, dassdie Zukunft dieser Technologie vielversprechend ist.
060131.ps - 2/1/2006 10:38 AM

GLOBALER MARKTÜBERBLICK ERNEUERBARE ENERGIEN 2005 GLOBALER STATUSBERICHT SEITE 11
Butylether), dessen Abschaffung von immer mehr Bundesstaa-ten verlangt wurde. Zu den anderen Ländern, die ebenfallsKraftstoffethanol herstellen, gehören Australien, China, Deutsch-land, Indien, die Dominikanische Republik, Frankreich, Kanada,Kolumbien, Jamaika, Malawi, Polen, Sambia, Schweden, Spa-nien, Südafrika und Thailand. [Anm. 9]
Die Biodieselproduktion in Deutschland stieg 2004 um 50Prozent, womit die Gesamtproduktion weltweit über 2 Mrd.Liter erreichte. Reiner Biodiesel (B100) ist in Deutschland zu100 Prozent von der Steuer befreit und wird inzwischen an über1.500 deutschen Tankstellen verkauft. Zu den weiteren wichtigenBiodieselproduzenten gehören Frankreich und Italien, und inverschiedenen anderen Ländern wie Belgien, Dänemark, Indo-nesien, Malaysia, Österreich, der Tschechischen Republik undden Vereinigten Staaten wird Biodiesel in kleineren Mengen
produziert. Einige Länder wollen in den nächstenJahren in die Biodieselproduktion einsteigen oder dievorhandene Produktionskapazität ausbauen.[Anm. 9]
Die Kosten der geläufigsten Anwendungen erneu-erbarer Energien sind in Tabelle 2 aufgeführt. Sie liegenvielfach weiterhin über denjenigen konventionellerEnergietechnologien. (Die Erzeugungskosten für kon-ventionellen Strom liegen typischerweise bei 2 bis 5US-Cent/kWh für Grundlaststrom, können jedoch beiSpitzenlaststrom erheblich höher sein und bei netzu-nabhängigen Dieselgeneratoren sogar noch darüberliegen.*) Die höheren Kosten und zahlreiche andereMarkthindernisse bedeuten, dass die meisten erneuer-baren Energien auch in Zukunft der Unterstützung derPolitik bedürfen werden. Wirtschaftliche Wettbewerbs-fähigkeit ist jedoch nichts Statisches: Genau wie dieKosten erneuerbarer Energien gehen auch die Kostenkonventioneller Technologien zurück (beispielsweiseaufgrund von Verbesserungen im Bereich der Gas-turbinentechnologie). Die grundsätzliche Unsicherheithinsichtlich der Wettbewerbsfähigkeit hängt mit denzukünftigen Preisen für fossile Energieträger zusam-men. Diese wirken sich auf die Kosten konventionellerEnergie aus, auf die Kosten erneuerbarer Energienjedoch nicht.
Die Internationale Energieagentur hat die Wett-bewerbsfähigkeit erneuerbarer Energien nach dem der-zeitigen Stand wie folgt dargestellt: „Mit Ausnahmevon Großwasserkraft und Verbrennungsanlagen zurVerstromung von Biomasse und Müll können dieDurchschnittskosten der Stromerzeugung aus erneuer-baren Energien im Allgemeinen nicht mit den Elek-trizitätspreisen für Großabnehmer mithalten. Aller-dings können die Kosten je nach Technologie, Anwen-dung und Standort mit Netzstrom (Endabnehmer)oder kommerzieller Wärmeerzeugung mithalten.Unter optimalen Bedingungen – optimierte System-auslegung, Standortwahl und Ressourcenverfügbarkeit– kann mit Biomasse, Kleinwasserkraft, Windkraft und
geothermischen Anlagen Elektrizität mit einem Kostenaufwandvon 2–5 Cent/kWh produziert werden. Einige Biomasseanwen-dungen sowie die Gewinnung geothermischer Wärme an be-stimmten Standorten sind wettbewerbsfähig.“ In Regionen, indenen sich die Technologie bereits gut etabliert hat, können essolare Wassererwärmungsanlagen ohne weiteres mit konventio-nellen Anlagen aufnehmen; dies gilt jedoch nicht für kühlereKlimazonen, in denen die Ressource Sonnenlicht knapper undder Heizbedarf größer ist. Die netzgekoppelte Photovoltaik istmit Ausnahme von Standorten mit extrem hohen Endabneh-merpreisen (d. h. über 20–25 Cent/kWh) noch nicht wettbe-werbsfähig. In Brasilien ist Ethanol inzwischen gegenüberBenzin absolut konkurrenzfähig. † [Anm. 11]
Abbildung 9. Produktion von Kraftstoffethanol - 2000 und 2004
Brasilien USA China sonstige weltweit0
Mill
arde
n Li
ter/J
ahr
0
5
10
15
20
25
30
35
2000 2004
Abbildung 8. Installierte Anlagen zur solaren Warm- wasserbereitung je tausend Einwohner
Israel
Zypern
Griechen-
landÖste
rreich
Türkei
Japan
Australie
nChina
Dänemark
Deutsch-
land
m2 /1
.000
Ein
woh
ner
0
100
200
300
400
500
600
700
800
* Sämtliche Cent- und Dollarangaben beziehen sich, soweit nichts anderes vermerkt ist, auf US-Cent und US-Dollar.
† Kostenvergleiche basieren auf wirtschaftlichen Kosten ohne externe Kosten. Finanzkostenvergleiche können relativ komplex sein, da hierbei Aspekte wie staatliche Förderungen,Subventionen, steuerliche Behandlung und andere Marktbedingungen zu berücksichtigen sind. Senkungen der historischen Kosten sind auf eine ganze Reihe von nicht in den Rahmendieses Berichts fallenden Faktoren zurückzuführen. Die brasilianischen Ethanolkosten als ein Beispiel sind im Verlauf von über zwanzig Jahren mit steigender Produktionseffizienz undMarktexpansion gesunken.
060131.ps - 2/1/2006 10:38 AM

SEITE 12 ERNEUERBARE ENERGIEN 2005 GLOBALER STATUSBERICHT GLOBALER MARKTÜBERBLICK
Tabelle 2. Stand der Entwicklung im Bereich erneuerbare Energien – Merkmale und Kosten
TypischeTypische Energiekosten
Technologie Kennwerte (Cent/kWh) Kostentrends und Kostensenkungspotenzial
Stromerzeugung
Große Wasser-kraft
Kleine Wasser-kraft
Wind, Onshore
Wind, Offshore
Strom ausBiomasse
Geothermischer Strom
Photovoltaik (PV) (Modul)
Aufdachanlagen PV
Solathermische Stromerz. (CSP)
Warmwasser/Heizung
Biomassewärme
Solare Warm-wasserbereitung/Heizungsunter-stützung
Geothermische Wärme
Biokraftstoffe
Ethanol
Biodiesel
Anlagengröße:10 MW–18.000 MW
Anlagengröße: 1–10 MW
Turbinenleistung: 1–3 MWRotordurchmesser:60–100 Meter
Turbinenleistung: 1,5–5 MWRotordurchmesser:70–125 Meter
Anlagengröße: 1–20 MW
Anlagengröße: 1–100 MWTyp: binär, Single-Flash,Double-Flash oder Dampf
Zellentyp und Leistung:Monokristallin: 17%Polykristallin: 15%Dünnschicht: 10–12%
Spitzenleistung: 2–5 kW
Anlagengröße: 1–100 MWTyp: Turm, Paraboloid- oderRinnenkraftwerk
Anlagengröße: 1–20 MW
Größe: 2–5 m2
Typ: Vakuumröhren-/ Flach-kollektorenProduktion: WarmwasserRaumwärme
Anlagengröße: 1–100 MWTyp: Binär, Single- undDouble-Flash, Dampf,Wärmepumpen
Ausgangsstoffe: Zuckerrohr,Zuckerrüben, Mais oderWeizen (und in ZukunftZellulose)
Ausgangsstoffe: Soja, Raps,Senf oder Pflanzenaltöle
3–4
4–7
4–6
6–10
5–12
4–7
—
20–40
12–18
1–6
2–25
0.5–5
25–30Cent/Liter
Benzin-äquivalent
40–80Cent/Liter
Diesel-äquivalent
Stabil.
Stabil.
Kosten sinkend um 12–18 % mit jeder Verdoppelung der globalen Kapazität. Kos-ten sind inzwischen bei 50 % des Niveaus von 1990 angelangt. Turbinenleistunglag vor 10 Jahren noch bei 600-800 kW. Künftige Senkungen durch Stand-ortoptimierung, optimierte Rotor-/Generatorkonstruktion und Elektronik.
Markt weiterhin klein. Künftige Kostensenkungen aufgrund von Marktreife undTechnologieverbesserung.
Stabil.
Kosten sind seit den siebziger Jahren gesunken. Kosten für Nutzung von derzeitwirtschaftlichen Ressourcen könnten mit zunehmender Verbesserung der Explora-tionsverfahren, Verbilligung der Bohrtechniken und Optimierung der Wärmeextrak-tion sinken.
Kosten sind mit jeder Verdoppelung der installierten Leistung um 20 % bzw. ca.5%/Jahr gesunken. Kosten stiegen 2004 aufgrund von Marktfaktoren. KünftigeKostensenkungen material-, konstruktions-, verfahrens-, effizienz- und größenbe-dingt.
Kontinuierliche Senkungen aufgrund von geringeren PV-Modulkosten undVerbesserungen bei Wechselrichtern und BOS-Bauteilen.
Kosten sind von ursprünglich rund 44 Cent/kWh für die ersten Anlagen in den1980er Jahren kontinuierlich gefallen. Künftige Senkungen größen- und technolo-giebedingt.
Stabil.
Kosten stabil oder geringfügig niedriger, bedingt durch Größenvorteile, neueMaterialien, größere Kollektoren und qualitative Verbesserungen.
Siehe oben, geothermischer Strom.
Sinkende Kosten in Brasilien aufgrund der Produktionseffizienz, derzeit 25–30Cent/Literäquivalent (Zucker), jedoch stabil in den USA mit 40–50 Cent (Mais). Beianderen Ausgangsstoffen höher, bis zu 90 Cent. Erwartete Senkung der Kosten fürEthanol aus Zellulose auf 27 Cent nach 2010 (derzeit 53 Cent), moderate Senkungbei anderen Ausgangsstoffen.
Kosten könnten bei Raps und Soja nach 2010 auf 35–70 Cent/Liter Dieseläqui-valent sinken und bei Biodiesel aus Altöl unverändert bei rund 25 Cent (derzeit)liegen.
12 neu.ps - 2/2/2006 8:28 AM

GLOBALER MARKTÜBERBLICK ERNEUERBARE ENERGIEN 2005 GLOBALER STATUSBERICHT SEITE 13
s-g
a-ak-
-
o-
Beiürng
Tabelle 2.Fortsetzung
TypischeTypische Energiekosten
Technologie Kennwerte (Cent/kWh) Kostentrends und Kostensenkungspotenzial
Ländliche (netzferne) Energieversorgung
Miniwasserkraft
Kleinstwasserkraft(Mikro)
Kleinstwasserkraft(Pico)
Biomasse Vergärung
Biomasse Ver- gasung
Windkraft Kleinanlage
Windkraft Hausanlage
Kleinnetz im dörfl. Bereich
Solar Home System (SHS)
Anmerkungen zu Tabelle 2: Sämtliche Kosten sind wirtschaftliche Kosten ohne Subventionen und sonstige politische Anreize. Die typischenEnergiekosten gelten für optimale Bedingungen, auch hinsichtlich Systemauslegung, Standortwahl und Ressourcenverfügbarkeit. Unter gewissenBedingungen können sich noch niedrigere Kosten ergeben wie z. B. 2 Cent/kWh für Geothermie und große Wasserkraft und 3 Cent/kWh fürBiomassestrom. Bei suboptimalen Bedingungen können sich erheblich höhere Kosten als die genannten typischen Kosten ergeben. Die durchschnitt-lichen Kosten für netzgekoppelte Photovoltaik gelten für 2.500 kWh/m2 pro Jahr und sind für die meisten Entwicklungsländer typisch. Die Kostensteigen auf 30–50 Cent/kWh an 1.500 kWh/m2-Standorten (d. h. Südeuropa) und auf 50–80 Cent an 1.000 kWh/m2-Standorten (d. h. VereinigtesKönigreich).
Anlagenkapazität:100–1,000 kW
Anlagenkapazität: 1–100 kW
Anlagenkapazität: 0,1–1 kW
Anlagengröße: 6–8 m3
Größe: 20–5.000 kW
Turbinenleistung: 3–100 kW
Turbinenleistung: 0,1–1 kW
Systemgröße: 10–1.000 kWOptionen: batterie- oderdieselbetriebenes Reserve-system
Systemgröße: 20–100 W
5–10
7–20
20–40
k. A.
8–12
15–30
20–40
25–100
40–60
Stabil.
Stabil bis mäßig sinkend mit zunehmender Verbesserung der Effizienz.
Stabil bis mäßig sinkend mit zunehmender Verbesserung der Effizienz.
Stabil bis mäßig sinkend mit zunehmenden Einsparungen durch rationelleBauweise und Serviceinfrastruktur.
Ausgezeichnetes Kostensenkungspotenzial mit zunehmender Weiterentwicklungder Technik.
Mäßig sinkend mit fortschreitender technischer Entwicklung.
Mäßig sinkend mit fortschreitender technischer Entwicklung.
Sinkend mit zunehmender Verbilligung von Solar- und Windkomponenten.
Sinkend mit zunehmender Verbilligung von Solarkomponenten.
060131.ps - 2/1/2006 10:38 AM

SEITE 14 ERNEUERBARE ENERGIEN 2005 GLOBALER STATUSBERICHT
m Jahr 2004 wurden rund 30 Mrd. $ inEE-Kapazität und Anlagen investiert.(Siehe Abb. 10.) Im gleichen Jahr wurdenvon den Photovoltaikherstellern weitere4–5 Mrd. $ in neue Anlagen und Geräte
und von der Ethanolindustrie mindestens mehrerehundert Millionen Dollar in neue Produktionsanlageninvestiert. Diesen Investitionen steht ein Gesamtbetragvon rund 110–150 Mrd. $ gegenüber, der pro Jahrweltweit in den Stromsektor insgesamt investiert wird.Somit liegt der Anteil der Investitionen in erneuerbareEnergien inzwischen bei 20–25 Prozent der Gesamt-investitionen im weltweiten Stromsektor. In der Tatsoll nach Schätzung der Internationalen Energieagen-tur in ihrem neuesten World Energy Investment Out-look ein volles Drittel der im Bereich der Stromerzeu-gung getätigten Neuinvestitionen in den OECD-Län-dern innerhalb der nächsten dreißig Jahre auf erneu-erbare Energien entfallen. Die jährlichen Investitionenin erneuerbare Energien haben seit 1995 (rund 7 Mrd. $) konti-nuierlich zugenommen. Die Investitionen für das Jahr 2004beliefen sich auf rund 9,5 Mrd. $ für Windkraft, 7 Mrd. $ fürPhotovoltaik, 4,5 Mrd. $ für kleine Wasserkraft, 4 Mrd. $ fürsolare Warmwasserbereitung/Heizung und 5 Mrd. $ für Geo-thermie- und Biomassestrom und -wärme. Zusätzlich werdenschätzungsweise 20–25 Mrd. $ pro Jahr in die großeWasserkraft investiert.[Anm. 12]
Die Investitionen in erneuerbare Energien kommen inzwi-schen aus den verschiedensten öffentlichen und privatenQuellen. Unterstützt werden die Investitionsflüsse durch dietechnologische Standardisierung und die wachsende Akzeptanzund Bekanntheit bei Finanzierern unterschiedlichster Projekt-dimensionen von der gewerblichen Finanzierung millionen-schwerer Windparks bis zu Kleinkrediten für private Haushalte.Und eine neue Entwicklung, die in jüngster Zeit zu beobachtenist: Große Geschäftsbanken beginnen allmählich, von der Mög-lichkeit lohnender Investitionen in erneuerbare Energien Notizzu nehmen. Als Beispiel für solche Großbanken, die Investitio-nen in erneuerbare Energien inzwischen zum Mainstream-Ge-schäft zählen, gehören die HypoVereinsbank, Fortis, Dexia,Citygroup, die ANZ Bank, die Royal Bank of Canada und dieTriodos Bank, die sich alle sehr aktiv im Bereich der EE-Finan-zierung betätigen. Auch Investitionen traditioneller Energie-versorgungsunternehmen (EVU), die sich bisher als Gruppemit Investitionen in erneuerbare Energien Zeit ließen, werdenzusehends zum Mainstream. Zu den EVU, die sich im Rege-nerativbereich engagieren, gehören Electricité de France,Florida Power and Light (USA), Scottish Power und Endesa(Spanien).*
Auch andere Großinvestoren erschließen sich den Markt fürerneuerbare Energien, darunter auch führende Investmentban-ken. In der Welt des Mainstream-Investment macht sich zuneh-
mend die Überzeugung breit, dass erneuerbare Energien eineernst zu nehmende Gelegenheit für lohnende Geschäfte bieten.Morgan Stanley zum Beispiel investiert in Windkraftprojekte inSpanien. Goldman Sachs, eine der weltweit führenden Invest-mentfirmen, hat das Windenergie-Unternehmen Zilkha Renew-able Energy gekauft, das zur Zeit in den Vereinigten Staaten 4GW Windleistung erschließt. Auch GE hat innerhalb seinerGeschäftsbereiche Gewerbe- und Verbraucherfinanzierungbegonnen, in erneuerbaren Energien zu investieren. Und Rück-versicherungsgesellschaften entwickeln neue, gezielt auf erneu-erbare Energien ausgerichtete Versicherungsprodukte.
Auch Wagnisfinanzierer beginnen sich für erneuerbareEnergien zu interessieren. Die Wagniskapitalinvestitionen inUS-amerikanische Unternehmen, die im Bereich saubere Ener-gietechnologien tätig sind, beliefen sich 2004 auf fast 1 Mrd. $.Insbesondere die Photovoltaik verzeichnete zwischen 2001 und2004 einen jährlichen Anstieg der Wagnis- und Eigenkapitalin-vestitionen um insgesamt 100 Prozent. Motiviert werden dieWagniskapitalgeber zum Teil durch Prognosen zur Marktent-wicklung, die für die Photovoltaik- und die Windkraftbrancheteilweise ein Wachstum von jeweils 40–50 Mrd. $ zwischen2010 und 2014 in Aussicht stellen.[Anm. 13]
Die Finanzierungstätigkeit öffentlicher Bankinstitute spielteine wichtige Rolle bei der Ankurbelung von Privatinvestitionenund industrieller Tätigkeit. Die Europäische Investitionsbank(EIB) ist das führende öffentliche Bankinstitut, das finanzielleMittel für erneuerbare Energien zur Verfügung stellt. Im Drei-jahreszeitraum 2002–2004 betrugen die von ihr bereitgestelltenMittel zur Finanzierung erneuerbarer Energien im Durchschnitt630 Mio. $ pro Jahr (überwiegend für Projekte in der EU). DieEIB hat vor, im Zeitraum 2002–2007 den auf erneuerbare Ener-gien entfallenden Anteil ihrer Kredite im Energiesektor zu ver-doppeln, d. h. von 7 Prozent auf 15 Prozent bis 2007. Außerdem
2. INVESTITIONSFLÜSSE
Abbildung 10. Jährliche Investitionen in erneuerbareEnergien 1995 – 2004
1995 1996 1997 19991998 2000 2001 2002 2003 20040
Mrd
. Dol
lar
5
10
15
20
25
30
35
* Dieser Bericht befasst sich nicht mit CO2-Finanzierungsprojekten oder CDM-Projekten. Es ist zu hoffen, dass in nachfolgenden Ausgaben auf diese neu entstandenenFinanzierungsmechanismen eingegangen werden kann. In verschiedenen Ländern gab es Pläne, diese Finanzierungsmechanismen in Projekte zur Förderung erneuerbarer Energieneinzubinden, und manche Länder führten entsprechende Verwaltungsvorschriften und Verfahren ein..
I
060131.ps - 2/1/2006 10:38 AM

INVESTITIONSFLÜSSE ERNEUERBARE ENERGIEN 2005 GLOBALER STATUSBERICHT SEITE 15
will die Bank die Kreditgewährung für Regenerativstrom bis2008–2010 von derzeit 15 Prozent auf 50 Prozent der insgesamtin neue Elektrizitätserzeugungskapazität investierten Mittel inder EU erhöhen.[Anm. 14]
Die in die Entwicklungsländer fließenden multilateralen,bilateralen und sonstigen öffentlichen Finanzierungsströme fürneue erneuerbare Energien haben in den letzten Jahren fast 500Mio. $ pro Jahr erreicht. Ein Großteil dieser Mittel wird für Aus-und Fortbildung, Politikentwicklung, Marktbereitung, techni-sche Hilfe und sonstige nicht-investive Zwecke verwendet. Diedrei wichtigsten Kapitalgeber sind die deutsche KfW-Entwick-lungsbank, die Weltbankgruppe und die Globale Umweltfazilität(GEF). Die KfW stellte 2004 rund 180 Mio. $ für erneuerbareEnergien bereit, darunter 100 Mio. $ aus öffentlichen Haushalts-mitteln und 80 Mio. $ aus Marktmitteln. Die Weltbankgruppesagte durchschnittlich 110 Mio. $ pro Jahr für neue erneuerbareEnergieträger im Dreijahreszeitraum 2002–2004 zu.* Und dieGEF stellte zwischen 2002 und 2004 durchschnittlich 100 Mio. $pro Jahr für die Kofinanzierung von Regenerativenergieprojek-ten zur Verfügung, die von der Weltbank, dem UN-Entwick-lungsprogramm (UNDP), dem UN-Umweltprogramm (UNEP)und verschiedenen anderen Organisationen durchgeführt wur-den. Die indirekte oder begleitende Finanzierung des privatenSektors erreicht oft dieselbe Höhe oder ein Mehrfaches der vondiesen Organisationen effektiv bereitgestellten öffentlichenMittel, da viele Projekte gezielt auf die Ankurbelung von Privat-investionen ausgerichtet sind. Außerdem leisten auch die Regie-rungen der Empfängerländer einen Beitrag zur Finanzierungsolcher Entwicklungsprojekte.[Anm. 15]
Zu den anderen Quellen öffentlicher Finanzmittel gehörenbilaterale Hilfsorganisationen, Organisationen der Vereinten
Nationen und die Leistungen der Regierungen der Empfänger-länder im Rahmen von Entwicklungshilfevorhaben. Verschie-dene Organisationen und Regierungen stellen Fördermittel fürneue erneuerbare Energieträger in einer Größenordnung von(typischerweise) 5–25 Mio. $ pro Jahr bereit. Zu ihnen gehörendie Asian Development Bank (ADB), die Europäische Bank fürWiederaufbau und Entwicklung (EBWE), die Interamerikani-sche Entwicklungsbank (IDB), das UN-Entwicklungsprogramm(UNDP), das UN-Umweltprogramm (UNEP), die Organisationder Vereinten Nationen für industrielle Entwicklung (UNIDO),Dänemark (Danida), Frankreich (Ademe und FFEM), Deutsch-land (GTZ), Italien, Japan (JBIC) und Schweden (SIDA). Weite-re Geber, die technische Hilfe und Finanzmittel auf jährlicherBasis zur Verfügung stellen, sind die Ernährungs- und Land-wirtschaftsorganisation der Vereinten Nationen (FAO), Austra-lien (AusAid), Kanada (CIDA), die Niederlande (Novem), dieSchweiz (SDC) und das Vereinigte Königreich (DFID). Einigedieser Geber errichten zweckgebundene Investmentfonds undKreditprogramme, die private Zusatzfinanzierungen mit einbe-ziehen.[Anm. 15]
Diese öffentlichen Investitionsflüsse sind in den letzten Jah-ren relativ konstant geblieben. Jüngste Zusagen verschiedenerOrganisationen lassen jedoch darauf schließen, dass sich ihrVolumen in den nächsten Jahren voraussichtlich erhöhen wird.Im Juni 2004 verabschiedeten 170 Länder auf der Konferenz„Renewables 2004“ in Bonn das Bonner Aktionsprogramm, daszahlreiche Verpflichtungen von Regierungen, internationalenOrganisationen und Nichtregierungsorganisationen für die Zu-kunft enthält. (Siehe Seitenleiste 1). Gleichzeitig sagte die deut-sche Regierung der KfW für einen Zeitraum von fünf Jahren500 Mio. Euro für Investitionen in erneuerbare Energien und
ÜBERSICHT 1. Bonner Aktionsprogramm im internationalen Kontext
Eine Analyse des 2004 verabschiedeten Bonner Aktionsprogramms ergibt fünf wesentliche Kriterien für den Inhalt des Programms. DieseKriterien werden nachstehend mit dem aktuellen globalen Kontext verglichen.[Anm. 15b]
Kriterien Inhalt des Bonner Aktionsprogramms Globaler Kontext (2004)
1. Installstallierte Erbringt bei vollständiger Umsetzung Weltweit vorhandene Regenerativenergiekapazität betrug Kapazität weitere 163 GW Regenerativstromkapazität. 160 GW (plus 720 GW Großwasserkraft).
2. Investitionen Bedeutet Investitionen von insgesamt Die weltweiten jährl. Investitionen in erneuerbare Energien beliefen326 Mrd. $ sich auf 30 Mrd. $ (plus 20–25 Mrd. $ in große Wasserkraft)
3. CO2-Emissionen Bedeutet CO2-Minderungen von insgesamt Die CO2-Minderung durch erneuerbare Energien belief sich auf1,2 Mrd. Tonnen/Jahr bis 2015. 0,9 Mrd. Tonnen/Jahr (plus 3,7 Mrd. Tonnen/Jahr durch
große Wasserkraft).
4. Geberfinanzierung Zugesagte und benötigte Gebermittel Fast 500 Mio. $/Jahr aus Geberfinanzierungen flossen in machen 16 % der Finanzierung bzw. Entwicklungsländer.rund 52 Mrd. $ aus.
5. Zugang zu Unterstützt die Schätzungen ausgehend von Viele Millionen ländliche Haushalte werden durch KleinwasserkraftElektrizität in ländlichen den Millenniumsentwicklungszielen (MDG), versorgt, 16 Millionen nutzen Biogas und 2 Millionen solare Gegenden dass bis 2015 bis zu 1 Mrd. Menschen Zugang Beleuchtung, und viele Haushalte werden durch Biomasse-
zu Energiedienstleistungen aus erneuerbaren Vergasungsanlagen versorgtEnergien haben könnten.
* Mit den von der Weltbankgruppe bereitgestellten Mitteln für neue erneuerbare Energieträger plus der durchschnittlichen GEF-Kofinanzierung von 45 Mio. $ pro Jahr für Pro-jekte der Weltbankgruppe (2002-2004) erhöhte sich das Gesamtvolumen der Weltbankgruppe/GEF-Finanzierung auf über 155 Mio. $ pro Jahr. Außerdem sagte die Weltbank-gruppe durchschnittlich 170 Mio. $ pro Jahr im Dreijahreszeitraum 2002-2004 für große Wasserkraft zu (ohne GEF-Kofinanzierung), womit sich die durchschnittliche jährlicheMittelbereitstellung der Weltbankgruppe/GEF für alle erneuerbaren Energien auf über 325 Mio. $ erhöhte.
060131.ps - 2/1/2006 10:38 AM

SEITE 16 ERNEUERBARE ENERGIEN 2005 GLOBALER STATUSBERICHT INVESTITIONSFLÜSSE
Energieeffizienz in Entwicklungsländern zu. Ebenso verpflichte-te sich die Weltbankgruppe im Jahr 2004, die Finanzmittel fürneue erneuerbare Energieträger und Energieeffizienz innerhalbvon fünf Jahren zu verdoppeln, womit weitere 150 Mio. $ proJahr zur Förderung erneuerbarer Energien hinzukommen wür-den. Und die EU will zusammen mit der JohannesburgRenewable Energy Coalition (JREC) den Dachfonds „GlobalRenewable Energy Fund of Funds“ zur Bereitstellung vonPatient Equity Capital („geduldigem Eigenkapital“) einrichten;er soll zu Beginn mit rund 75 Mio. Euro ausgestattet werden.
Auch die Anzahl an örtlichen Finanzierungsquellen fürerneuerbare Energien in den Entwicklungsländern – frühereinmal Domäne internationaler Entwicklungsorganisationen –hat zugenommen. Geber und Marktbereiter (Market Facili-tators) bemühen sich immer nachdrücklicher, die Zunahmedieser örtlichen Finanzierungsquellen zu unterstützen undMöglichkeiten zur Verringerung der finanziellen Risiken fürprivate Anleger zu finden. Eines der besten Beispiele ist dieIndia Renewable Energy Development Agency (IREDA), die seit ihrer Gründung im Jahr 1987 fast 1,5 Mrd. $ in die Finan-zierung von 2,5 GW EE-Leistung investiert hat. Im ländlichenBereich ist Grameen Shakti in Bangladesch, örtlicher Vermittlervon Finanzierungen und Verkäufen von Solar Home Systems,eines der bekanntesten Beispiele. Es gibt viele weitere. Die De-velopment Bank of Uganda bietet mit Unterstützung der ShellFoundation ländliche Kleinkredite an. UNEP, die UN Foun-dation und E+Co experimentieren mit Konzepten zur Finan-zierung von im Regenerativbereich tätigen kleinen und mittle-ren Unternehmen im Rahmen des „Rural Energy EnterpriseDevelopment“(REED)-Programms in Afrika, Brasilien undChina. Der Renewable Energy for Development Fund der Trio-dos Bank bietet im EE-Bereich tätigen Unternehmern in Asienund Afrika Startkapital, Kredite und Unterstützung beim Ge-schäftsaufbau an. In Indien haben zwei der größten Geschäfts-banken – Canara und die Syndicate Bank – 2003 gemeinsammit ihren regionalen Partnerbanken begonnen, ländlichenHaushalten über insgesamt 2.000 beteiligte Niederlassungen inzwei Bundesstaaten Tausende von Krediten zur Nutzung erneu-erbarer Energien zur Verfügung zu stellen. Bei vielen Organisa-tionen wird dem Capacity Building im Bereich der Finanz-dienstleistungen für Haushalte und Unternehmen im Allge-meinen höhere Priorität eingeräumt.
Diese Mittelzuflüsse werden durch die Bemühungen zahl-reicher anderer Branchenverbände, Nichtregierungsorganisatio-nen, internationaler Partnerschaften und Netzwerke sowie pri-vater Stiftungen verstärkt und erleichtert. Diese so genanntenMarket Facilitation Organizations sind zu Hunderten auf inter-nationaler und nationaler Ebene tätig. (Unter Anmerkung 45 ist eine nach Gruppen geordnete Liste von Websites zu finden).Fünf Beispiele für internationale Partnerschaften sind die Glo-bal Village Energy Partnership (GVEP), die Renewable Energyand Energy Efficiency Partnership (REEEP), das Global Net-work on Energy for Sustainable Development (GNESD), die
Sustainable Energy Finance Initiative des UNEP und dasREN21 Renewable Energy Policy Network.
Die staatliche Unterstützung für erneuerbare Energienbelief sich 2004 in den Vereinigten Staaten und Europa zusam-men auf 10 Mrd. $. Die Unterstützung kann in unterschiedli-cher Form erfolgen. Zur „budgetären“ Unterstützung gehörenMechanismen wie F&E-Finanzierungen, Direktinvestitionen,Zuschüsse zu den Kapitalkosten, Steuergutschriften und Ex-portkredite.* Forschung und Entwicklung sind ein wesentlicherTeil der budgetären Unterstützung und erreichten im Zeitraum1999–2001 für alle Mitgliedstaaten der Internationalen Energie-agentur zusammen ein Gesamtvolumen von durchschnittlich730 Mio. $ pro Jahr. Zur „extrabudgetären“ Unterstützunggehören die Kosten marktwirtschaftlicher Anreize und ord-nungspolitischer Mechanismen, die nicht haushaltswirksamsind (z. B. Einspeisevorschriften und Quotensysteme wie Re-newable Portfolio Standards (RPS)). Die Europäische Umwelt-agentur schätzt die 2001 in Europa gewährte budgetäre Unter-stützung für erneuerbare Energien auf mindestens 0,8 Mrd. $und die extrabudgetäre auf 6 Mrd. $. Ein Großteil der extra-budgetären Unterstützung entfällt auf Einspeisevergütungen.Andere Formen der extrabudgetären Unterstützung sind z. B.Abnahmeverpflichtungen und Ausschreibungsverfahren. In denVereinigten Staaten belief sich die budgetäre Unterstützung desBundes für erneuerbare Energien, einschließlich der bundes-weiten Steuerermäßigungen für Ethanol auf 720 Mio. $ und330 Mio. $ für Forschung und Entwicklung (F&E), im Jahr1999 auf 1,1 Mrd. $. 2004 waren die F&E-Aufwendungen gerin-ger, während die Steuerermäßigungen für Ethanol auf 1,7 Mrd.$ stiegen. Zusammen mit den Production Tax Credits (PTC)(schätzungsweise weitere 200 Mio. $) stieg die budgetäre Unter-stützung auf über 2 Mrd. $ pro Jahr. Mit einzelstaatlichen Maß-nahmen und Programmen einschließlich gemeinnützigerFonds, die schätzungsweise 300 Mio. $ pro Jahr (extrabudgetär)beisteuern, dürfte eine weitere Milliarde Dollar oder mehr hin-zukommen. Im Vergleich dazu belaufen sich die gesamtenEnergiesubventionen/Unterstützungszahlungen für fossileEnergieträger auf globaler Basis nach Schätzung der VereintenNationen und der Internationalen Energieagentur auf etwa150–250 Mrd. $ pro Jahr und für Kernbrennstoff auf ca. 16Mrd. pro Jahr.[Anm. 16]
* Exportkredite sind in der Vergangenheit in Zusammenhang mit erneuerbaren Energien nur selten zum Einsatz gekommen, doch das scheint sich zu ändern. Die OECD hatunlängst beschlossen, erneuerbaren Energien im Rahmen der OECD-Vereinbarung über offiziell unterstützte Ausfuhrkredite eine Sonderbehandlung zukommen zu lassen, wozuauch eine Verlängerung der Tilgungsfristen von 12 auf 15 Jahre gehörte. Dieser Sonderstatus kann dazu beitragen, die Modalitäten von Exportkreditagenturen mit denen andererFinanzierungen zugunsten von Projekten zur Förderung erneuerbarer Energien in Entwicklungsländern in Einklang zu bringen, was zu einer Erhöhung der Investitionen vonExportkreditagenturen in erneuerbare Energien führen könnte.
060131.ps - 2/1/2006 10:38 AM

ERNEUERBARE ENERGIEN 2005 GLOBALER STATUSBERICHT SEITE 17
iese Investitionsflüsse bedeuten: Erneuerbare Ener-gien sind zum „Big Business“ geworden. Weltweitbesaßen 2005 mindestens 60 börsennotierte Unter-nehmen im Bereich erneuerbare Energien bzw. dieentsprechenden Geschäftsbereiche großer Unter-
nehmen einen Börsenwert von über 40 Mio. $. Der Börsenwertdieser Unternehmen und Unternehmensbereiche wird insge-samt auf über 25 Mrd. $ geschätzt. Die 100 nächstgrößeren Un-ternehmen bzw. Unternehmensbereiche würden den Börsenwertnoch um mehrere Milliarden Dollar zusätzlich erhöhen. DiePhotovoltaik ist im Begriff, eine der wachstumsstärksten undeinträglichsten Branchen der Welt zu werden. Pläne für Kapazi-tätsausweitungen im Zeitraum 2005–2008 gehen von mehrerenhundert Megawatt aus; 2005 sollen Kapitalinvestitionen in Höhevon schätzungsweise 5–7 Mrd. $ getätigt werden. [Anm. 17]
Wie sehr erneuerbare Energien zum „Big Business“ gewor-den sind, veranschaulicht vielleicht am besten der Eintritt dergrößten Branchenakteure in den Windenergiemarkt, der in derVergangenheit von den Windkraftanlagenherstellern dominiertwurde. GE und Siemens sind herausragende Beispiele großerElektrokonzerne, die in den letzten Jahren in den Windkraft-markt eingetreten sind – beide durch Übernahmen (GE über-nahm 2003 Enron Wind, Siemens erwarb 2004 Bonus). In Chi-na nahmen fünf der größten Hersteller aus den Sparten Elektro-technik, Luft- und Raumfahrt sowie Stromerzeugungsanlagen2004 die Entwicklung von Windkraftanlagen auf. Vier vonihnen unterzeichneten Verträge mit ausländischen Firmen übereinen Technologietransfer und planten den Bau ihrer erstenTurbinenprototypen für das Jahr 2005. „Big Players“ wie dieseerschließen dem Markt neue Kompetenzen – auch im Finanz-und Marketingbereich – sowie eine neue Produktionsdimen-sion, und sie stärken das Vertrauen in die Technologie.
Im Jahr 2004 wurden in der Windkraftbranche über 6.000Windkraftanlagen mit einer Durchschnittsleistung von 1,25MW produziert. Die sechs größten Hersteller sind Vestas (Däne-mark, 2004 mit NEG Micon fusioniert), Gamesa (Spanien),Enercon (Deutschland), GE Energy (USA), Siemens (Däne-mark, 2004 mit Bonus fusioniert) und Suzlon (Indien). Diebeiden führenden Hersteller in China sind Goldwind und Xi’anNordex mit Marktanteilen von 20 Prozent bzw. 5 Prozent (75Prozent des Marktes entfallen auf Importe). Weltweit drücktsich der Fortschritt der Branche vorwiegend in der Turbinen-größe aus – sie erhöhte sich zwischen 1995 und 2004 von 500kW auf 1.300 kW. Die US-amerikanische und die europäischeWindkraftindustrie stellen inzwischen Anlagen mit einer Leis-tung von 1.000 bis 3.000 kW her, während in China und inIndien noch Größen von 600–1.000 kW üblich sind. Europä-ische Hersteller haben Prototypen von Windkraftanlagen im 5-MW-Bereich vorgestellt. Größere Turbinen zu konstruieren istnach wie vor ein technologisches Hauptanliegen der Industrie.Die Branche setzt weiterhin auf Neuentwicklungen bei Material,Elektronik, der Auslegung von Rotorblättern und Generatorensowie der Standortoptimierung; diese Innovationen bergenweiteres Potenzial für Kostensenkungen.[Anm. 18]
Die Photovoltaik-Branche feierte 1999 ihr erstes Gigawattan globaler kumulierter Stromerzeugung. Fünf Jahre später –
Ende 2004 – hatte sich die kumulierte Produktion auf über 4Gigawatt vervierfacht. Die Produktionsausweitung setzte sich2004 weltweit rasant fort, sodass die Jahresproduktion über1.100 MW hinausging. Die verlautbarten Planungen führenderHersteller sehen für 2005 eine Ausweitung der installiertenLeistung um mindestens 400 MW sowie weitere Kapazitätenvon mehreren hundert Megawatt für den Zeitraum 2006–2008vor. Die drei weltweit größten Hersteller waren 2004 Sharp,Kyocera und BP Solar (jedoch führen rasche Kapazitätsaus-weitungen bei vielen Marktteilnehmern dazu, dass sich dieSpitzenpositionen jedes Jahr ändern).[Anm. 19]
Auch China und andere Entwicklungsländer sind als Her-steller von Photovoltaikanlagen in den Markt eingetreten. Diechinesischen Fertigungskapazitäten für Module verdoppeltensich 2004 von 50 MW auf 100 MW, die Produktionskapazitätfür Solarzellen stieg auf 70 MW. Den vorgestellten Branchen-plänen zufolge könnten sich die Produktionskapazitäten 2005erneut verdoppeln. In Indien mit insgesamt 8 Solarzellen- und14 Modulherstellern hat der bedeutendste Hersteller von Photo-voltaikanlagen – Tata BP Solar – seine Produktionskapazität von8 MW im Jahr 2001 auf 38 MW in 2004 erhöht. Das philippini-sche Unternehmen Sun Power plante 2004, seine Produktions-kapazität im Solarzellenbereich auf 50 MW zu verdoppeln.Solartron in Thailand gab Pläne bekannt, bis 2007 eine Produk-tionskapazität von 20 MW für die Fertigung von Solarzellenanzustreben. In der gesamten Branche verheißen Größenvor-teile sowie konstruktions- und prozesstechnische Verbesserun-gen weitere Kostensenkungen.
Biomassestrom und -wärme sowie Kleinwasserkraft sindBranchen, die viel ausgereifter, stärker den jeweiligen Beding-ungen angepasst und vielgestaltiger sind als die Windkraft- unddie Photovoltaikbranche. In Biomassestrom und -wärme inves-tieren in der Regel jene Unternehmen, bei denen Biomasseres-sourcen in Form von Abfällen entstehen, etwa Holzfirmen,Papierhersteller und Zuckerfabriken. Im Kleinwasserkraft-Ferti-gungsbereich hält die europäische Industrie nach wie vor eineführende Position, wobei sie sich in den letzten Jahren beson-ders auf die Umrüstung und Modernisierung bestehender An-lagen konzentriert hat. Technische Verbesserungen im Klein-wasserkraftbereich zielen auf die Nutzung geringer Fallhöhen(unter 15 Meter) und eine kleinere Leistung (unter 250 kW). ImKleinwasserkraftsektor Chinas betätigen sich mindestens 500Unternehmen, die Generatoren für Wasserkraftwerke fertigen.Dagegen wird der internationale Geothermiemarkt von fünfgroßen Firmen dominiert (Ansaldo, Fuji, Mitsubishi, Ormatund Toshiba).[Anm. 20, Anm. 21]
Die weltweite Ethanolindustrie konzentriert sich auf Brasi-lien und die Vereinigten Staaten. In Brasilien gab es 2004 über300 Zuckerfabriken bzw. Ethanol-Destillieranlagen; Anfang2005 wurden 39 neue Destillieranlagen zugelassen. In den Ver-einigten Staaten wurden 2004 12 neue Ethanolanlagen fertiggestellt, sodass nunmehr insgesamt über 80 Anlagen in Betriebsind. Ebenfalls 2004 wurde mit dem Bau von 16 neuen Anlagenbegonnen. Mehrere große Ethanolanlagen sollen 2005 inDeutschland und in den Vereinigten Staaten die Produktionaufnehmen. Die brasilianische Ethanolindustrie ist inzwischen
3. BRANCHENENTWICKLUNGEN
D
060131.ps - 2/1/2006 10:38 AM

SEITE 18 ERNEUERBARE ENERGIEN 2005 GLOBALER STATUSBERICHT BRANCHENENTWICKLUNGEN
auch ein bedeutender Ethanolexporteur und steuerte 2004 runddie Hälfte des internationalen Ethanolhandels bei. Auch in derEU hat die Biokraftstoffbranche (Ethanol und Biodiesel) einenbeträchtlichen Umfang erreicht, und mehrere andere Länderplanen die Ausweitung ihrer Ethanolindustrie.[Anm. 22]
Die technische Ausgereiftheit vieler Segmente der Regene-rativindustrie nimmt von Jahr zu Jahr zu. So bieten kleinereWindkraftanlagenhersteller einen leichteren Aufbau und dieHybridisierung mit Photovoltaik und anderen Technologien.Die Hersteller netzunabhängiger Photovoltaikanlagen sinddabei, standardisierte Plug-and-Play-Pakete für Laternen undkomplette Haushaltssysteme zu entwickeln. Einige Unterneh-men treiben Innovationen durch Hybridisierung voran; sokombiniert eine US-Firma Photovoltaik- und kleine Windkraft-anlagen in Frachtcontainern mit verbesserten Batterien undReglern, sodass komplette vorinstallierte Systeme angebotenwerden können. In die Anlagen werden technisch noch ausge-reiftere Steuerungen und Elemente für die Leistungsüberwach-ung und die Kommunikation integriert, wodurch bessere Mög-lichkeiten für die Energiebilanzierung und ausgereiftere Abrech-nungs- und Zahlungssysteme geschaffen werden.
Die Regenerativbranche wächst weiterhin rasch. Die welt-weit unmittelbar durch Herstellung, Betrieb und Wartung ge-schaffenen oder erhaltenen Arbeitsplätze beliefen sich 2004 aufmehr als 1,7 Millionen, die rund 0,9 Mio. Beschäftigten in derBiokraftstoffproduktion eingerechnet. Die mittelbare Beschäfti-gungswirkung ist um ein Mehrfaches größer. Es handelt sichum vorläufige Schätzungen, da veröffentlichte Beschäftigten-zahlen nur für wenige ausgewählte Branchen und Länder vorlie-gen. Beispiele für länderspezifische Zahlen sind: 400.000 Ar-beitsplätze in der brasilianischen Ethanolindustrie, 250.000 inder chinesischen Fertigung von Anlagen für die solare Warm-wasserbereitung, 130.000 in Deutschland im gesamten Bereichder erneuerbaren Energien, 75.000 in der europäischen Wind-kraftindustrie, 15.000 in der europäischen Photovoltaikindus-trie, 12.000 in der US-amerikanischen Photovoltaikbranche,11.000 in der nepalesischen Biogasindustrie, 3.400 im gesamtenBereich der erneuerbaren Energien in Japan und 2.200 in derEU im Bereich der Kleinwasserkraft.* [Anm. 24]
* In der Literatur liegen keine weltweiten Zahlen für die Beschäftigungswirkung der erneuerbaren Energien insgesamt vor. Anmerkung 24 enthält Angaben zu dem für diesenBericht verwendeten Untersuchungsansatz, der Kleinwasserkraft, Biomassestrom, Windkraft, Geothermie, Photovoltaik, solarthermische Anlagen zur Warmwasserbereitung undHeizung, Ethanol und Biodiesel berücksichtigt, nicht aber geothermische Heizsysteme und Biomassewärme.
060131.ps - 2/1/2006 10:38 AM
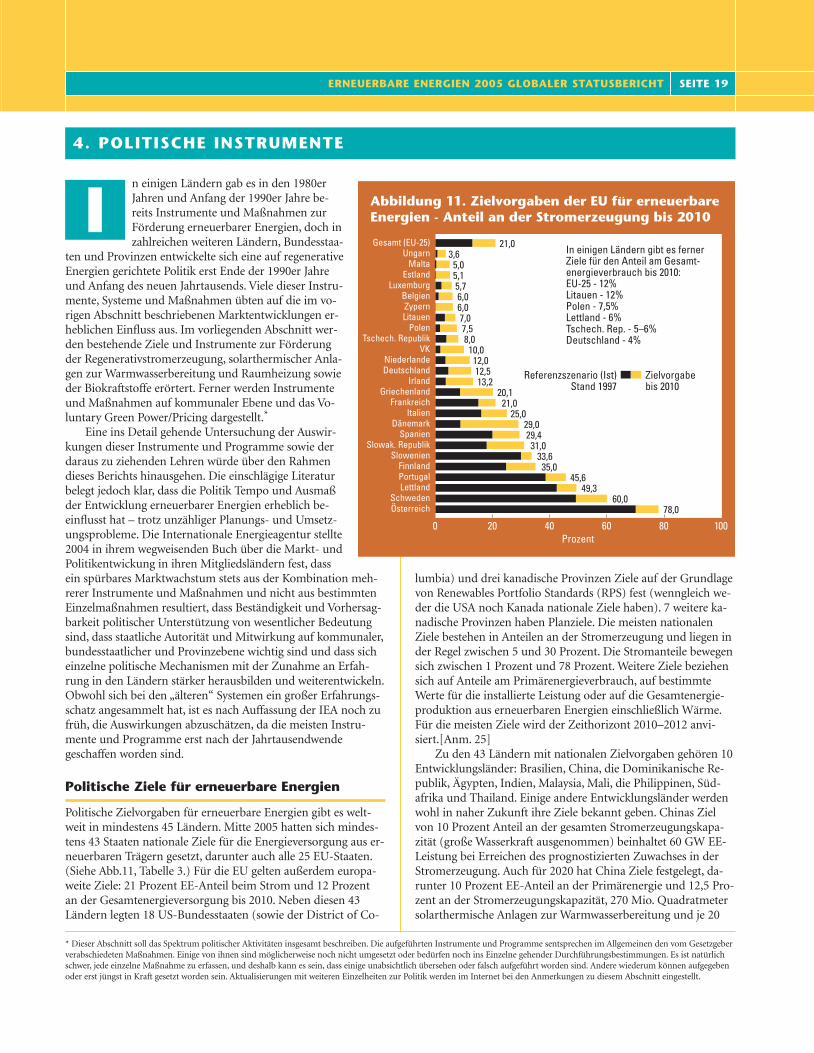
ERNEUERBARE ENERGIEN 2005 GLOBALER STATUSBERICHT SEITE 19
n einigen Ländern gab es in den 1980erJahren und Anfang der 1990er Jahre be-reits Instrumente und Maßnahmen zurFörderung erneuerbarer Energien, doch inzahlreichen weiteren Ländern, Bundesstaa-
ten und Provinzen entwickelte sich eine auf regenerativeEnergien gerichtete Politik erst Ende der 1990er Jahreund Anfang des neuen Jahrtausends. Viele dieser Instru-mente, Systeme und Maßnahmen übten auf die im vo-rigen Abschnitt beschriebenen Marktentwicklungen er-heblichen Einfluss aus. Im vorliegenden Abschnitt wer-den bestehende Ziele und Instrumente zur Förderungder Regenerativstromerzeugung, solarthermischer Anla-gen zur Warmwasserbereitung und Raumheizung sowieder Biokraftstoffe erörtert. Ferner werden Instrumenteund Maßnahmen auf kommunaler Ebene und das Vo-luntary Green Power/Pricing dargestellt.*
Eine ins Detail gehende Untersuchung der Auswir-kungen dieser Instrumente und Programme sowie derdaraus zu ziehenden Lehren würde über den Rahmendieses Berichts hinausgehen. Die einschlägige Literaturbelegt jedoch klar, dass die Politik Tempo und Ausmaßder Entwicklung erneuerbarer Energien erheblich be-einflusst hat – trotz unzähliger Planungs- und Umsetz-ungsprobleme. Die Internationale Energieagentur stellte2004 in ihrem wegweisenden Buch über die Markt- undPolitikentwickung in ihren Mitgliedsländern fest, dassein spürbares Marktwachstum stets aus der Kombination meh-rerer Instrumente und Maßnahmen und nicht aus bestimmtenEinzelmaßnahmen resultiert, dass Beständigkeit und Vorhersag-barkeit politischer Unterstützung von wesentlicher Bedeutungsind, dass staatliche Autorität und Mitwirkung auf kommunaler,bundesstaatlicher und Provinzebene wichtig sind und dass sicheinzelne politische Mechanismen mit der Zunahme an Erfah-rung in den Ländern stärker herausbilden und weiterentwickeln.Obwohl sich bei den „älteren“ Systemen ein großer Erfahrungs-schatz angesammelt hat, ist es nach Auffassung der IEA noch zufrüh, die Auswirkungen abzuschätzen, da die meisten Instru-mente und Programme erst nach der Jahrtausendwendegeschaffen worden sind.
Politische Ziele für erneuerbare Energien
Politische Zielvorgaben für erneuerbare Energien gibt es welt-weit in mindestens 45 Ländern. Mitte 2005 hatten sich mindes-tens 43 Staaten nationale Ziele für die Energieversorgung aus er-neuerbaren Trägern gesetzt, darunter auch alle 25 EU-Staaten.(Siehe Abb.11, Tabelle 3.) Für die EU gelten außerdem europa-weite Ziele: 21 Prozent EE-Anteil beim Strom und 12 Prozent an der Gesamtenergieversorgung bis 2010. Neben diesen 43Ländern legten 18 US-Bundesstaaten (sowie der District of Co-
lumbia) und drei kanadische Provinzen Ziele auf der Grundlagevon Renewables Portfolio Standards (RPS) fest (wenngleich we-der die USA noch Kanada nationale Ziele haben). 7 weitere ka-nadische Provinzen haben Planziele. Die meisten nationalenZiele bestehen in Anteilen an der Stromerzeugung und liegen inder Regel zwischen 5 und 30 Prozent. Die Stromanteile bewegensich zwischen 1 Prozent und 78 Prozent. Weitere Ziele beziehensich auf Anteile am Primärenergieverbrauch, auf bestimmteWerte für die installierte Leistung oder auf die Gesamtenergie-produktion aus erneuerbaren Energien einschließlich Wärme.Für die meisten Ziele wird der Zeithorizont 2010–2012 anvi-siert.[Anm. 25]
Zu den 43 Ländern mit nationalen Zielvorgaben gehören 10Entwicklungsländer: Brasilien, China, die Dominikanische Re-publik, Ägypten, Indien, Malaysia, Mali, die Philippinen, Süd-afrika und Thailand. Einige andere Entwicklungsländer werdenwohl in naher Zukunft ihre Ziele bekannt geben. Chinas Zielvon 10 Prozent Anteil an der gesamten Stromerzeugungskapa-zität (große Wasserkraft ausgenommen) beinhaltet 60 GW EE-Leistung bei Erreichen des prognostizierten Zuwachses in derStromerzeugung. Auch für 2020 hat China Ziele festgelegt, da-runter 10 Prozent EE-Anteil an der Primärenergie und 12,5 Pro-zent an der Stromerzeugungskapazität, 270 Mio. Quadratmetersolarthermische Anlagen zur Warmwasserbereitung und je 20
* Dieser Abschnitt soll das Spektrum politischer Aktivitäten insgesamt beschreiben. Die aufgeführten Instrumente und Programme sentsprechen im Allgemeinen den vom Gesetzgeberverabschiedeten Maßnahmen. Einige von ihnen sind möglicherweise noch nicht umgesetzt oder bedürfen noch ins Einzelne gehender Durchführungsbestimmungen. Es ist natürlichschwer, jede einzelne Maßnahme zu erfassen, und deshalb kann es sein, dass einige unabsichtlich übersehen oder falsch aufgeführt worden sind. Andere wiederum können aufgegebenoder erst jüngst in Kraft gesetzt worden sein. Aktualisierungen mit weiteren Einzelheiten zur Politik werden im Internet bei den Anmerkungen zu diesem Abschnitt eingestellt.
4. POLITISCHE INSTRUMENTE
I Abbildung 11. Zielvorgaben der EU für erneuerbare Energien - Anteil an der Stromerzeugung bis 2010
0 20 40 60 80 100Prozent
In einigen Ländern gibt es ferner Ziele für den Anteil am Gesamt- energieverbrauch bis 2010: EU-25 - 12%Litauen - 12%Polen - 7,5%Lettland - 6%Tschech. Rep. - 5–6%Deutschland - 4%
Gesamt (EU-25)Ungarn
MaltaEstland
LuxemburgBelgienZypernLitauen
PolenTschech. Republik
VKNiederlandeDeutschland
IrlandGriechenland
FrankreichItalien
DänemarkSpanien
Slowak. RepublikSlowenien
FinnlandPortugalLettland
SchwedenÖsterreich
21,03,6 5,0 5,1 5,7 6,0 6,0 7,0 7,5 8,0 10,0 12,0 12,5 13,2 20,1 21,0 25,0 29,0 29,4 31,0 33,6 35,0 45,6 49,3 60,0 78,0
Referenzszenario (Ist)Stand 1997
Zielvorgabe bis 2010
060131.ps - 2/1/2006 10:38 AM

SEITE 20 ERNEUERBARE ENERGIEN 2005 GLOBALER STATUSBERICHT POLITISCHE INSTRUMENTE
GW Elektrizität aus Wind und Biomasse.† Thailand gibt 8 Pro-zent der Primärenergie bis 2011 vor (traditionelle Biomasse aus-genommen). Indien erwartet 10 Prozent zusätzliche Stromkapa-zität bzw. mindestens 10 GW Erzeugung aus erneuerbarenEnergien bis 2012.* Die Philippinen streben knapp 5 GW insge-samt bis 2013 bzw. eine Verdopplung der bestehenden Kapazitätan. Südafrika hat sich 2003 das Ziel von 10 TWh zusätzlicherEndenergie aus erneuerbaren Trägern bis 2013 gesetzt, was 4Prozent der Stromkapazitäten entsprechen würde. Die mexika-nische Legislative beriet 2005 über ein neues Erneuerbare-Energien-Gesetz, das auch nationale Zielvorgaben enthaltensoll.
Förderung der Stromerzeugung aus erneuerba-ren Energien
In mindestens 48 Ländern – 34 Industriestaaten und Transfor-mationsländern sowie 14 Entwicklungsländern – werden erneu-erbare Energien in der einen oder anderen Art gefördert. (SieheTabelle 4.) Die häufigste Form sind Einspeisegesetze, wie sie inden letzten Jahren in zahlreichen Ländern und Regionen neu inKraft getreten sind. Die Vereinigten Staaten waren das ersteLand, in dem – 1978 – ein Einspeisegesetz (PURPA, Public Uti-lities Regulatory Policy Act) erlassen wurde (mehrere Bundes-staaten haben das Gesetz zwar umgesetzt, doch in den meisten
Fällen wurde der Vollzug in den 1990er Jahren ausgesetzt). Alsnächste Länder haben Dänemark, Deutschland, Griechenland,Indien, Italien, Spanien und die Schweiz Anfang der 1990er Jah-re Einspeisesysteme eingeführt. Bis 2005 hatten mindestens 32Länder und fünf Bundesstaaten/Provinzen die Einführung sol-cher Regelungen beschlossen; über die Hälfte von ihnen habenseit 2002 Gesetzeskraft erlangt. (Siehe Tabelle 5.)
Als erstes Entwicklungsland führte Indien Einspeisetarifeein, gefolgt von Sri Lanka und Thailand (nur für kleinereStromerzeuger), Brasilien, Indonesien und Nicaragua. Drei in-dische Bundesstaaten beschlossen 2004 im Anschluss an einnationales Gesetz von 2003, das die Einführung solcher Rege-lungen auf Bundesstaatenebene vorsieht, eine neue Einspeise-regelung (die früheren Einspeisegesetze aus den 1990er Jahrenwurden nach und nach außer Kraft gesetzt). In der ersten Hälfte2005 wurden in China, in Irland, in der Türkei und im US-Bun-desstaat Washington Einspeisesysteme geschaffen. Das chinesi-sche Einspeisesystem war Bestandteil eines umfassenden Gesetz-es zur Förderung erneuerbarer Energien, das im Februar 2005in Kraft trat.[Anm. 26, Anm. 27]
Zweifellos haben die Einspeisevergütungen insbesondere inDeutschland, Spanien und Dänemark in den letzten paar JahrenInnovationen vorangetrieben und sowohl das Interesse als auchdie Investitionstätigkeit belebt. In Deutschland beispielsweisehat sich die Stromerzeugung aus den nach dem EEG geförder-ten erneuerbaren Energien zwischen 2000 und 2004 mehr als
Tabelle 3. Nicht-EU-Länder mit Zielvorgaben für erneuerbare Energien
Land Ziele für den Anteil erneuerbarer Energien
Ägypten 3 % der Elektrizität bis 2010 und 14 % bis 2020
Australien 9,5 TWh Strom jährlich bis 2010
Brasilien 3,3 GW zusätzlich bis 2006 aus Wind, Biomasse und Kleinwasserkraft
China 10 % der Stromkapazität bis 2010 (erwartete 60 GW); 5 % der Primärenergie bis 2010 und 10 % derPrimärenergie bis 2020
Dominikanische Republik 500 MW Stromerzeugung aus Windenergie bis 2015
Indien 10 % zusätzliche Stromerzeugung im Zeitraum 2003–2012 (10 GW erwartet)
Israel 2 % der Elektrizität bis 2007; 5 % der Elektrizität bis 2016
Japan 1,35 % der Elektrizität bis 2010, Geothermie und große Wasserkraft (RPS) ausgenommen
Kanada 3,5 % bis 15 % Strom in 4 Provinzen; zusätzlich andere Ziele in weiteren sechs Provinzen
Korea 7 % der Elektrizität bis 2010, einschließlich große Wasserkraft, und 1,3 GW netzgekoppelte Photovoltaikbis 2011, darunter 100.000 Wohnhäuser (0,3 GW)
Malaysia 5 % der Elektrizität bis 2005
Mali 15 % der Gesamtenergieerzeugung bis 2020
Neuseeland 30 PJ zusätzliche Kapazität (einschließlich Wärme und Kraftstoffe) bis 2012
Norwegen 7 TWh Wärme und Wind bis 2010
Philippinen 4,7 GW installierte Gesamtleistung bis 2013
Schweiz 3,5 TWh Strom und Wärme bis 2010
Singapur 50.000 m2 (~35 MWth) solarthermische Anlagen bis 2012
Südafrika 10 TWh zusätzliche Endenergie bis 2013
Thailand 8 % der Gesamtprimärenergie bis 2011 (traditionelle Biomasse ausgenommen)
Vereinigte Staaten 5 % bis 30 % der Elektrizität in 20 Bundesstaaten (einschließlich DC)
* Indiens nationales Ziel ist ein Plan- oder Richtziel, das allerdings nicht durch spezifische Rechtsvorschriften untermauert wird.
† Chinas Zielvorgaben sind im Entwurf eines Entwicklungsplans für erneuerbare Energien enthalten, der noch von der Regierung zu verabschieden ist; sie wurden auf der Internatio-nalen Konferenz für Erneuerbare Energien (renewables 2004) im Juni 2004 in Bonn bekannt gegeben. Das chinesische Erneuerbare-Energien-Gesetz von Februar 2005 sieht vor, dassdie Regierung den Entwicklungsplan für erneuerbare Energien mit entsprechenden Zielvorgaben bis Januar 2006 vorlegt.
060131.ps - 2/1/2006 10:38 AM

POLITISCHE INSTRUMENTE ERNEUERBARE ENERGIEN 2005 GLOBALER STATUSBERICHT SEITE 21
Tabelle 4. Instrumente zur Förderung erneuerbarer Energien
Land
Industrie- und Transformationsländer
Australien u u u uBelgien u u u u uDänemark u u u uDeutschland u u u u uEstland u uFinnland u u u uFrankreich u u u u u u uGriechenland u u uIrland u u u u uIsrael uItalien u u u u uJapan (*) u u u u uKanada (*) (*) u u u (*) u (*)Korea u u uLettland u uLitauen u u u uLuxemburg u u uMalta uNeuseeland u uNiederlande u u u u uNorwegen u u u uÖsterreich u u u uPolen u u u u uPortugal u u u uSchweden u u u u u u uSchweiz uSlowakische Republik u u uSlowenien uSpanien u u u uTschech. Republik u u u u u uUngarn u u u uVereinigte Staaten (*) (*) u u (*) (*) u (*) (*) (*)Verein. Königreich u u u uZypern u u
Entwicklungsländer
Argentinien u uBrasilien u uChina u u u u u uCosta Rica uGuatemala u uIndien (*) (*) u u u u u
Eins
peise
verg
ütun
g
Net
met
erin
g
Rene
wab
le P
ortf
olio
Stan
dard
s
Kapi
talsu
bven
tione
n, Z
u-
schü
sse,
Ver
güns
tigun
gen
Inve
stiti
onsb
eihi
lfen,
Zu-
schü
sse,
Ste
uerg
utsc
hrift
en
Umsa
tz-,
Ener
gie-
ode
r
Meh
rwer
tste
uers
enku
ng
Han
delb
are
Zert
ifika
te f.
Stro
m a
us e
rn. E
nerg
ien
Ener
giep
rod.
-Ver
gütu
n-
gen
od. S
teue
rgut
schr
iften
Öff.
Inve
stiti
onen
, Kre
dite
oder
Fin
anzm
ittel
Öff.
Aus
schr
eibu
ngs-
verf
ahre
n
060131.ps - 2/1/2006 10:38 AM

SEITE 22 ERNEUERBARE ENERGIEN 2005 GLOBALER STATUSBERICHT POLITISCHE INSTRUMENTE
verdoppelt – von 14 TWh auf 37 TWh. In mehreren Ländernhaben sich die Einspeisesysteme am nachhaltigsten auf dieWindkraft ausgewirkt, doch haben sie auch die Entwicklung derStromerzeugung aus Biomasse und Kleinwasserkraft beeinflusst.(Die meisten Gesetze legen eine Höchstgrenze für die Förder-fähigkeit von Wasserkraft fest, in Deutschland beispielsweise 5MW). Erst kürzlich hat der Einspeisetarif in Spanien zu neuenInvestitionsvorhaben im Bereich der solarthermischen Strom-erzeugung geführt (für 2005 wurden Entscheidungen über zwei50-MW-Anlagen erwartet).
Die Ausgestaltung der Einspeisetarife ist von Land zu Landunterschiedlich. Einige Systeme beziehen sich nur auf bestim-mte Technologien oder Höchstkapazitäten. Die meisten sehenunterschiedliche Tarife für die verschiedenen Technologien vor,meist bezogen auf die Erzeugungskosten (beispielsweise durchUnterscheidung zwischen Offshore- und Onshore-Windkraft).Andere Systeme differenzieren die Tarife wiederum nach Stand-ort/Region, nach dem Jahr der Inbetriebnahme und nach demBetriebszeitraum im Jahr. Die Tarife für eine bestimmte Anlagekönnen mit der Zeit sinken, laufen jedoch in der Regel übereinen Zeitraum von 15–20 Jahren. Einige Systeme sehen einenfesten Tarif vor, andere einen Aufschlag auf die markt- oderkostenbezogenen Tarife (oder beides wie im Falle Spaniens).
RPS-Systeme finden in den Vereinigten Staaten, Kanada undIndien auf bundesstaatlicher bzw. Provinzebene zunehmendVerbreitung. (Siehe Tabelle 6.) In mindestens 32 Bundesstaatenoder Provinzen sind RPS-Systeme in Kraft, die Hälfte davon seit2003. In den USA kamen im Zeitraum 2004–2005 acht weitereBundesstaaten (sowie der District of Columbia) hinzu, womitsich die Gesamtzahl der US-Bundesstaaten mit RPS-Systemenauf 20 erhöhte. Ähnliches gilt für Indien: 2004–2005 führtenfünf weitere Bundesstaaten RPS-Systeme ein, womit die Ge-samtzahl auf sechs stieg (nach dem indischen Elektrizitätsgesetzvon 2003 dürfen Bundesstaaten Quoten für Strom aus erneuer-baren Energien festlegen). In Kanada gibt es drei Provinzen mitRPS-Systemen (und verschiedene andere mit Planzielen). Diemeisten der oben genannten RPS-Systeme sehenRegenerativstromquoten von 5–20 Prozent vor, in der Regel bis2010 oder 2012. Die meisten RPS-Zielvorgaben bedeuten, dassfür die Zukunft umfangreiche Investitionen zu erwarten sind.Einer Studie zufolge würden die derzeit in den USA auf einzel-staatlicher Ebene bestehenden RPS-Gesetze weitere 52 GW anerneuerbarer Energie bis 2020 erfordern, wodurch sich dieinstallierte EE-Leistung mehr als verdoppeln würde.* [Anm. 28]
Ferner gibt es sechs Länder mit nationalen RPS-Systemen,die alle seit 2001 in Kraft sind. Australiens RPS-System (2001)
Tabelle 4. Fortsetzung
Land
Indonesien uKambodscha uMexiko u uNicaragua u uPhilippinen u u uSri Lanka uThailand u u u uTürkei u u
Anmerkungen: (a) Es sind nur Maßnahmen und Instrumente mit Gesetzeskraft aufgeführt. Für manche aufgeführten Maßnahmen undProgramme sind jedoch möglicherweise noch keine Durchführungsregelungen entwickelt oder in Kraft, sodass die Umsetzung noch nichterfolgt ist und Resultate noch nicht zu verzeichnen sind. (b) Ein Sternchen (*) bedeutet, dass einige Bundesstaaten/Provinzen in diesenLändern über eigene Systeme verfügen, auf nationaler Ebene jedoch keine Regelung existiert. (c) Einige der hier aufgeführten Instrumentekönnen sich neben der Stromerzeugung auch auf andere Märkte beziehen. (d) In der Tabelle sind keine auslaufenden Instrumente aufge-führt, wie etwa Norwegens Einspeisesystem für Windkraft, das 2003 endete, die Kapitalzuschüsse in Dänemark, die 2002 ausliefen, oderBelgiens Einspeisetarife („Grüner Franc“), deren Gültigkeit 2003 endete. (e) Verschiedene afrikanische Länder haben eigene Förderprogram-me, mit denen sie in kleinerem Umfang die Photovoltaik in ländlichen Gebieten unterstützen, darunter Mali, Senegal, Tansania und Uganda(auch Kleinstwasserkraft). Südafrika unterhielt eine Zeit lang ein Programm zur Subventionierung von Konzessionen für ländliche Energie-dienstleistungen im Photovoltaikbereich, das inzwischen zu ruhen scheint. (f) Mehrere Entwicklungsländer planen Strategien zum Einsatzerneuerbarer Energien und/oder wollen in nächster Zukunft neue oder weitere Maßnahmen und Programme in Kraft setzen, darunter Alge-rien, Armenien, Kolumbien, Ägypten, Guatemala, Jordanien, Mazedonien, Mexiko, Peru, Südafrika, Vietnam und Jemen.
* Die RPS-Anteile entsprechen nicht unbedingt der Ambitioniertheit oder dem erforderlichen Maß an Bemühen, da einige Bundesstaaten/Provinzen bereits über ihren Zielennahekommende Kapazitäten verfügen, andere dagegen noch weit von ihren Zielen entfernt sind. Des Weiteren sehen einige RPS-Systeme Obergrenzen für die Förderfähigkeit vonWasserkraft vor. In Anmerkung 25 sind die verbindlich vorgeschriebenen Regenerativstromanteile oder angestrebten Kapazitätsziele der einzelnen Länder aufgeführt.
Eins
peise
verg
ütun
g
Net
met
erin
g
Rene
wab
le P
ortf
olio
Stan
dard
s
Kapi
talsu
bven
tione
n, Z
u-
schü
sse,
Ver
güns
tigun
gen
Inve
stiti
onsb
eihi
lfen,
Zu-
schü
sse,
Ste
uerg
utsc
hrift
en
Umsa
tz-,
Ener
gie-
ode
r
Meh
rwer
tste
uers
enku
ng
Han
delb
are
Zert
ifika
te f.
Stro
m a
us e
rn. E
nerg
ien
Ener
giep
rod.
-Ver
gütu
n-
gen
od. S
teue
rgut
schr
iften
Öff.
Inve
stiti
onen
, Kre
dite
oder
Fin
anzm
ittel
Öff.
Aus
schr
eibu
ngs-
verf
ahre
n
060131.ps - 2/1/2006 10:38 AM

POLITISCHE INSTRUMENTE ERNEUERBARE ENERGIEN 2005 GLOBALER STATUSBERICHT SEITE 23
sieht vor, dass Energieversorger jedes Jahr eine bestimmte An-zahl von Zertifikaten für Strom aus erneuerbaren Energiequel-len vorweisen (für 2004 waren 1,25 Prozent der Stromerzeu-gung oder insgesamt rund 2.600 GWh gefordert); diese Mengewird jährlich angepasst, bis 2010 Australiens nationales Ziel von
9.500 GWh erreicht ist. Das britischeRPS-System (2002) strebt 10 Prozentbis 2010 und danach 15 Prozent bis2015 an und läuft bis 2027. AuchJapans RPS-System (2003) sieht fürdie Energieversorger einen bestimm-ten EE-Anteil vor, der mit der Zeitzunimmt und 2010 1,35 Prozenterreichen soll. Nach dem schwedi-schen System (2003) müssen Ver-braucher – oder in ihrem Namen dieVersorger – einen vorgegebenen jähr-lich wachsenden EE-Anteil beziehen,entweder durch Stromzukäufe oderdurch Erwerb von EE-Zertifikaten.(Bei Nichteinhaltung sind inSchweden Geldstrafen in Höhe von150 Prozent des durchschnittlichenZertifikatpreises der Vorperiode vor-gesehen.) Im polnischen RPS-System(2004) werden 7,5 Prozent bis 2010angestrebt. Nach dem thailändischenRPS-System (2004) müssen 5 Prozentaller künftigen Stromerzeugungs-kapazitäten durch erneuerbare Ener-gien gedeckt werden.** Es gibt zahl-reiche andere Formen der Förderungder Stromerzeugung aus erneuer-baren Energiequellen durch die Poli-tik, darunter direkte Kapitalhilfen fürInvestitionen oder sonstige Vergüns-tigungen, steuerliche Anreize undGutschriften, Umsatz- und Mehr-wertsteuerbefreiungen, direkte erzeu-gungsabhängige Vergütungen oderSteuergutschriften (d. h. pro kWh),handelbare grüne Zertifikate, NetMetering, direkte öffentliche Inves-titionen oder Finanzmittel sowieöffentliche Ausschreibungen fürbestimmte Mengen an erzeugtemStrom. (Siehe Tabelle 2, Seite 12.) Inmindestens 30 Ländern werden direk-te Kapitalbeihilfen für Investitionen,Zuschüsse oder Nachlässe in der ei-nen oder anderen Form angeboten.Steuerliche Anreize und Gutschriftensind ebenfalls häufig verwendete For-men der finanziellen Förderung: Diemeisten US-Bundesstaaten und min-
destens 32 andere Länder bieten eine Vielzahl steuerlicher An-reize und Gutschriften für erneuerbare Energien.
Erzeugungsbezogene Vergütungen oder Steuergutschriftengibt es in mehreren Ländern, wobei der US-amerikanische Pro-duction Tax Credit (PTC) als Steuergutschrift für regenerativ
Tabelle 5. Kumulative Anzahl der Länder/Bundesstaaten/Provinzen mit Einspeisesystemen
Jahr Kumulative Anzahl Im jeweiligen Jahr neu hinzugekommen
1978 1 Vereinigte Staaten1990 2 Deutschland1991 3 Schweiz1992 4 Italien1993 6 Dänemark, Indien1994 8 Spanien, Griechenland1995 81996 81997 9 Sri Lanka1998 10 Schweden1999 13 Portugal, Norwegen, Slowenien2000 14 Thailand2001 16 Frankreich, Lettland2002 20 Österreich, Brasilien, Tschech. Republik., Indonesien, Litauen2003 27 Zypern, Estland, Ungarn, Korea, Slowak. Republik,
Maharashtra (Indien)2004 33 Italien, Israel, Nicaragua, Prince Edward Island (Kanada),
Andhra Pradesh und Madhya Pradesh (Indien)2005 37 Türkei, Washington (USA), Irland, China
Anmerkung: Die angaben für 2005 beziehen sich auf die erste Jahreshälfte.
Tabelle 6. Kumulative Anzahl der Länder/Bundesstaaten/Provinzen mit RPS-Systemen
Jahr Kumulative Anzahl Im jeweiligen Jahr neu hinzugekommene
1997 1 Massachusetts (USA)1998 3 Connecticut, Wisconsin (alle USA)1999 7 Maine, New Jersey, Texas (alle USA); Italien2001 12 Arizona, Hawaii, Nevada (alle USA); Flandern (Belgien);
Australien2002 16 Kalifornien, New Mexico (alle USA); Wallonien (Belgien);
Vereinigtes Königreich2003 20 Minnesota (USA); Japan; Schweden; Maharashtra (Indien)2004 34 Colorado, Maryland, New York, Pennsylvania, Rhode Island
(alle USA); Neu Schottland, Ontario, Prince Edward Island(alle Kanada); Madhya Pradesh, Karnataka, AndhraPradesh, Orissa (alle Indien); Polen; Thailand
2005 38 District of Columbia, Montana, Delaware (alle USA); Gujarat (Indien)
** Die nationalen Zielvorgaben in Tabelle 2 und 3 können als „verbindliche“, „Plan-“ oder „Richt-“Ziele betrachtet werden, beinhalten jedoch keine nationalen RPS-Systeme, diefür bestimmte Arten von Versorgungsunternehmen oder Verbrauchern eine rechtliche bindende Verpflichtung darstellen.
schr
eibu
ngs-
ahre
n
060131.ps - 2/1/2006 10:38 AM

SEITE 24 ERNEUERBARE ENERGIEN 2005 GLOBALER STATUSBERICHT POLITISCHE INSTRUMENTE
erzeugten Strom in dieser Kategorie am bedeutendsten ist. Sieist auf über 5.400 MW der zwischen 1995 und 2004 installiertenWindkraft angewendet worden. Inflationsindexiert betrug sie1994 zunächst 1,5 Cent/kWh und stieg mit der Zeit – überverschiedene Auslauf- und Erneuerungsphasen – bis 2005 auf1,9 Cent/kWh; ihre Laufzeit wurde inzwischen bis 2007 verlän-gert. Der Production Tax Credit hat mit dazu beigetragen, dasssich die Windkraft in den letzten Jahren in den USA zu einerMainstream-Investition entwickelt hat, die das Interesse derFinanziers an dieser Branche weckte. Andere Länder mit pro-duktionsbezogenen Anreizen sind beispielsweise Finnland, dieNiederlande und Schweden.*
In einigen Ländern gibt es Förderprogramme für netzge-koppelte PV-Aufdachanlagen, für die entweder Kapitalsubven-tionen oder Einspeisevergütungen oder beides verwendet wer-den (zusammen mit dem Net Metering). Das rasante Wachstumdes Marktes für netzgekoppelte Anlagen in den letzten Jahren isteindeutig diesen Systemen zuzuschreiben. Die japanische Photo-voltaikförderung, deren Auslaufen für 2005 vorgesehen war, sahKapitalsubventionen in Höhe von ursprünglich 50 Prozent imJahr 1994 vor, die bis 2003 auf 10 Prozent und bis 2005 auf 4Prozent zurückgingen. Diese Fördermaßnahmen brachten über800 MW installierte Leistung und betrafen über 200.000 Häuser.In Deutschland mit seinen über 160.000 Auf- und Indachanla-gen (Solar Home Systems) und seinen knapp 700 MW instal-lierter Kapazität wird eine Einspeisevergütung garantiert; außer-dem wurden bis 2003 zinsgünstige Verbraucherkredite bereitge-stellt. Nach den noch gültigen Regelungen in Kalifornien und inanderen US-Bundesstaaten sowie in verschiedenen anderenLändern (darunter Frankreich, Griechenland, Italien, Korea,Luxemburg, Niederlande, Portugal und Spanien) werden Kapi-talzuschüsse (in der Regel 30–50 Prozent) und/oder günstigeStromabnahmetarife gewährt. Korea erwartet im Rahmen seines„100.000-Dächer-Programms“, das zunächst Kapitalzuschüssevon 70 Prozent vorsieht (die mit der Zeit abnehmen), 300 MWinstallierte Kapazität bis 2011. Neue Programme für solare Ein-zelversorger mit Photovoltaikanlagen sind in mehreren Ländernangekündigt, darunter auch in Ungarn und Thailand.[Anm. 29]
Einige Länder bzw. Bundesstaaten/Provinzen haben Fondszur Förderung erneuerbarer Energien aufgelegt, die zur Direkt-finanzierung von Investitionen, für zinsgünstige Kredite oderfür andere Arten der Marktförderung dienen, beispielsweisedurch Forschung, Bildung, Normen und Investitionen in öffent-liche Einrichtungen. Die größten Fonds dieser Art sind die sogenannten Public Benefit Funds in 14 US-Bundesstaaten. DieseFonds, die in vielen Fällen sowohl für Energieeffizienzzwecke alsauch für erneuerbare Energien verwendet werden, speisen sichaus einer Vielzahl von Quellen; am weitesten verbreitet sindAufschläge auf die Stromtarife. Über diese 14 Fonds – die allezwischen 1997 und 2001 aufgelegt wurden – werden pro Jahrüber 300 Mio. $ für erneuerbare Energien angesammelt undausgegeben. Man erwartet, dass bis 2012 über 4 Mrd. $ für er-neuerbare Energien hereinkommen. Ähnlich stellt die IndiaRenewable Energy Development Agency (IREDA) Kredite und
andere Projektmittel zur Verfügung. Chinas Erneuerbare-Ener-gien-Gesetz aus dem Jahr 2005 sieht ebenfalls die Einrichtungeines Fonds vor, und auch Mexiko erwog 2005 die Einrichtungeines „grünen Fonds“ zur Finanzierung von Projekten im Be-reich erneuerbare Energien.[Anm. 30]
Gesetze zum Net Netering bestehen in mindestens 7 Län-dern, 35 US-Bundesstaaten und mehreren kanadischen Pro-vinzen. In vier weiteren US-Bundesstaaten gibt es einen odermehrere Energieversorger, die bereits ein Net Metering anbie-ten. Auch in Japan gibt es ein Net Metering – auf freiwilligerBasis. Immer wieder werden entsprechende Gesetze erlassen,wie z. B. 2004 in sechs weiteren US-Bundesstaaten. Neuerdingsmüssen nach einem 2005 erlassenen US-amerikanischen Bun-desgesetz alle US-amerikanischen Elektrizitätsversorgungsunter-nehmen innerhalb von drei Jahren die Möglichkeit zum NetMetering bieten. Sowohl in den Vereinigten Staaten als auch inJapan trug das Net Metering in besonderem Maß zur Förderungder netzgekoppelten Photovoltaikmärkte bei.[Anm. 30]
Programme für die Ausschreibung bestimmter Regenerativ-strommengen, wie sie ursprünglich von den Briten in den1990er Jahren verwendet wurden, gibt es inzwischen in mindes-tens sieben weiteren Ländern, und zwar in Kanada, China,Frankreich, Indien, Irland, Polen und den Vereinigten Staaten.In China wurden im Zeitraum 2003–2004 im Windkraftbereich850 MW ausgeschrieben und zugeschlagen, und für 2005 sindAusschreibungen für weitere 450 MW vorgesehen. Die kanadi-sche Provinz Ontario schrieb 2004 1.000 MW installierte Wind-kraftleistung aus, andere kanadische Provinzen folgten demBeispiel. In vielen Ländern werden Ausschreibungen von denEnergieversorgern genutzt, um ihre RPS-Verpflichtungen zuerfüllen.[Anm. 31]
Zu den anderen Instrumenten gehören beispielsweise han-delbare EE-Zertifikate, die in der Regel in Verbindung mit demfreiwilligen Bezug von Ökostrom oder Verpflichtungen im Rah-men von Renewable Portfolio Standards eingesetzt werden. Inmindestens 18 Ländern gab es Programme und/oder Märkte fürhandelbare Zertifikate. Zahlreiche andere verordnungsrechtlicheMaßnahmen wie Bauvorschriften, Verwaltungsvorschriften und-verfahren sowie Übertragungsnetzzugang und -entgelte spielenebenfalls eine wichtige Rolle bei der Förderung der Stromerzeu-gung aus erneuerbaren Energien. Solche verordnungsrechtli-chen Maßnahmen können Schritte in Richtung künftiger Märk-te für erneuerbare Energien sein, insbesondere in Entwicklungs-ländern (Mexiko und die Türkei sind Beispiele für Länder, diesolche Maßnahmen ergreifen). Auch die Neuordnung des Ener-giesektors, CO2-Abgaben, Steuern auf fossile Energieträger undzahlreiche andere Maßnahmen können sich auf die Wettbe-werbsfähigkeit erneuerbarer Energien auswirken.
* Auf die Stromerzeugung bezogene Anreize, die den Erzeugern eine Vergütung pro Einheit erzeugter Energie (also kWh) bieten, scheinen Einspeisevergütungen ähnlich zu seinoder sogar so genannt zu werden. Die Unterscheidung ist nicht leicht, da die Mittel für produktionsbezogene Zuschüsse aus expliziten Energieversorgerzuschlägen oder aus entgan-genen Steuereinnahmen stammen können. Die US-amerikanischen Production Tax Credits könnten nach manchen Definitionen als Einspeisegesetz betrachtet werden. Nach derhier verwendeten Definition sollten Einspeisevergütungen für den Staat einnahmeneutral sein, wobei die Differenz implizit von den Energieversorgerkunden abgegolten wird (wieim Fall Deutschlands und Spaniens) anstatt explizit über eine Sonderabgabe (wie im Fall der Niederlande) oder entgangene Steuereinnahmen (wie im Fall Finnlands).
060131.ps - 2/1/2006 10:38 AM

POLITISCHE INSTRUMENTE ERNEUERBARE ENERGIEN 2005 GLOBALER STATUSBERICHT SEITE 25
Förderinstrumente für solarthermischeAnlagen zur Warmwasserbereitung undHeizung
Der weltweit größte Markt für Sonnenkollektoren zurWarmwasserbereitung ist China, auf das 2004 80 Prozent derweltweiten Zuwächse entfielen. Chinas nationales Ziel (das be-reits 2004 nahezu erreicht wurde) sind 65 Mio. Quadratmeterinstallierte Kollektorfläche bis 2005 und 230 Mio. Quadratmeterbis 2015. Zu den treibenden Kräften des ursprünglich in den1980er Jahren in den Kleinstädten und Dörfern entstandenenMarktes gehören in erster Linie der Nachfrageüberhang beiWarmwasser, Wirtschaftlichkeitserwägungen und die zu einemBruchteil der Preise der Industrieländer angebotenen Anlagen.Obwohl es in China keine speziellen Förderinstrumente fürsolarthermische Anlagen in städtischen mehrstöckigen Wohn-häusern gibt, haben die Bauträger begonnen, vor dem Hinter-grund steigender Energiekosten und der verstärkten öffentli-chen Nachfrage die solare Warmwasserbereitung bei der Pla-nung und Ausführung von Bauvorhaben zu berücksichtigen,insbesondere während des derzeitigen Baubooms. Außerdemgibt es staatliche Programme für die Erstellung technischerNormen, Bauvorschriften sowie Prüf- und Zertifizierungsstel-len, die die Branche in ihrem Reifeprozess unterstützen.[Anm.32]
Neben China bieten mindestens 18 Länder – und wahr-scheinlich noch einige mehr – Kapitalzuschüsse, Vergünstigun-gen oder Steuergutschriften auf Investitionen in solarthermischeAnlagen für Wasser und Heizung an, darunter Australien, Öster-reich, Belgien, einige kanadische Provinzen, Zypern, Finnland,Frankreich, Deutschland, Griechenland, Ungarn, Japan, die Nie-derlande, Neuseeland, Portugal, Spanien, Schweden, das Verei-nigte Königreich, zahlreiche US-Bundesstaaten und die ameri-kanische Bundesregierung. Die Kapitalbeihilfen decken in derRegel 20–40 Prozent der Anlagenkosten ab. Steuergutschriftenauf Investitionen ermöglichen die steuerliche Anrechnung derGesamtheit oder eines Teils der Investitionskosten. (Die italieni-schen Zertifikate für erneuerbare Energien gelten auch für diesolare Warmwasserbereitung als so genannte „weiße Zertifika-te“). Israel scheint das einzige Land mit einem landeseigenenProgramm zu sein, das die solare Warmwasserbereitung in Neu-bauten verbindlich vorschreibt. Seit 1980 müssen die meistenGebäude in Israel mit Sonnenkollektoren für die Warmwasser-bereitung ausgestattet sein. Die technischen Anforderungenhängen von der Art und Größe des Gebäudes ab. Ausgenom-men sind bestimmte für gewerbliche und medizinische Zweckegenutzte Gebäude sowie Hochhäuser. Bei der EuropäischenKommission war die Prüfung von Fördermaßnahmen für dieWärmeerzeugung mit erneuerbaren Energien einschließlichSonnenenergie mit einer sich möglicherweise daraus ergeben-den neuen Richtlinie geplant.
Auf kommunaler Ebene haben mehrere große Städte über-all auf der Welt Verordnungen erlassen, die eine solare Warm-wasserversorgung für Neubauten vorschreiben oder finanzielleAnreize bzw. Beihilfen für Investitionen in solarthermischeWarmwassersysteme vorsehen. Als Beispiele sind Barcelona,
Oxford (VK) und Portland in Oregon (USA) zu nennen. Insbe-sondere Barcelona hat eines der umfangreichsten Programmedieser Art in Kraft gesetzt. Die im Jahr 2000 erlassene „Solaran-lagen-Verordnung“ gilt als Meilenstein städtischer Energiepoli-tik. Sie sieht vor, dass alle neuen Gebäude ab einer bestimmtenGrößenordnung (Energieverbrauch für Warmwasser: 292 MJ/Tag) mindestens 60 Prozent ihres hauseigenen Energiebedarfsfür die Warmwasserbereitung über solarthermische Kollektorendecken müssen. Die Beheizung von Schwimmbädern muss zu100 Prozent mit Sonnenenergie erfolgen. Auch Gebäude, dievon Grund auf saniert werden, unterliegen der Verordnung.Die genannte Größenkategorie bedeutet in der Regel, dass allegewerblichen Bauten und alle Wohngebäude mit 16 oder mehrHaushalten unter die Verordnung fallen. Ihr ist es zu verdanken,dass inzwischen 40 Prozent aller Neubauten mit solarthermi-schen Warmwasserbereitungsanlagen ausgestattet sind und dassdie installierte Pro-Kopf-Kapazität (Quadratmeter/1.000 Ein-wohner) um das Fünfzehnfache gestiegen ist, d. h. von 1,1 imJahr 2000 auf 16,5 in 2004. Als Endziel hat sich Barcelona eineinstallierte Kapazität von rund 100.000 Quadratmetern bis 2010gesetzt.
Dem Beispiel Barcelonas folgend haben auch andere spani-sche Städte und Gemeinden wie Madrid, Valencia, Sevilla, Bur-gos und Pamplona Solarthermieverordnungen erlassen. Dasstarke Interesse der Kommunen hat IDAE 2003 bewogen, eineam Vorbild Barcelonas orientierte Solarenergie-Musterverord-nung auszuarbeiten, die anderen Städten und Gemeinden alsGrundlage für eigene Verordnungen dienen könnte. Bis Novem-ber 2004 hatten 34 Kommunen und eine Region eigene Solar-verordnungen erlassen, und in zehn weiteren Regionen (voninsgesamt 17) waren derartige Verordnungen in Vorbereitung.Die Erfolge sind beachtlich. So führte die neue Solarverordnungin Pamplona, die seit Mitte 2004 in Kraft ist, binnen eines Jahreszu einem 50-prozentigen Anstieg des Bestands an solarthermi-schen Kollektoren. Auch die Frage einer landesweiten Solar-verordnung wurde geprüft, deren Erlass für 2005 erwartet wird.
Förderinstrumente für Biokraftstoffe
Brasilien ist mit seinem Programm „ProAlcool“ seit 25 Jahrenbei der Förderung von Biokraftstoffen weltweit führend. Zu denverwendeten Instrumenten und Maßnahmen gehören verbind-liche Beimischungsregelungen, Vorschriften für den Einzelhan-delsvertrieb, Produktionsbeihilfen und andere Maßnahmen. Seit1975 verlangt Brasilien die Zumischung von Ethanol zum ge-samten verkauften Benzin. Das vorgeschriebene Mischungsver-hältnis, das häufig angepasst wird, liegt im Bereich von 20–25Prozent. Alle Tankstellen müssen Gasohol (E25) und Reinetha-nol (E100) anbieten. Fahrzeuge, die mit reinem Ethanol betrie-ben werden, sind steuerlich begünstigt. Die kürzliche Einfüh-rung und der reißende Absatz so genannter Flexfuel-Fahrzeugeeiniger Autobauer waren nicht in erster Linie durch politischeVorgaben bedingt, sondern durch die Tatsache, dass die Regie-rung die Kraftfahrzeugsteuerermäßigung, die ursprünglich nurfür Reinethanolautos galt, auf Flexfuel-Fahrzeuge ausgedehnthat.* In jüngerer Zeit hat Brasilien die vermehrte Nutzung von
* Dieser Wendepunkt – der dadurch gekennzeichnet ist, dass die Hälfte aller 2005 verkauften Neuwagen „Flexfuel“-Fahrzeuge waren – ist der Initiative der Automobilbauer desLandes unter Führung von Volkswagen zu verdanken. Durch die Fertigung von Flexfuel-Fahrzeugen anstelle separater Reinethanol- und Gasohol-Modelle konnten die AutobauerLiefer- und Montageketten vereinfachen.
060131.ps - 2/1/2006 10:38 AM

SEITE 26 ERNEUERBARE ENERGIEN 2005 GLOBALER STATUSBERICHT POLITISCHE INSTRUMENTE
Biodiesel ins Auge gefasst, der hauptsächlich aus im eigenenLand produziertem Sojaöl erzeugt wird. Nach einem vor kur-zem erlassenen Gesetz darf seit Januar 2005 in Brasilien Diesel-kraftstoffen 2 Prozent Biodiesel beigemischt werden. DieserAnteil kann bis 2013 auf 5 Prozent und mehr erhöht werden.[Anm. 33]
Neben Brasilien haben in den letzten Jahren auch mehrereandere Länder verbindliche Regelungen für die Beimischungvon Biokraftstoff zu Fahrzeugtreibstoffen getroffen. Im Einzel-nen gibt es inzwischen in mindestens 20 Bundesstaaten/Provin-zen und zwei Ländern solche verbindlichen Vorschriften zurBeimischung von Ethanol und/oder Biodiesel zu allen verkauf-ten Fahrzeugtreibstoffen. In Indien schrieb die Regierung in 9von 28 Bundesstaaten und in vier von sieben Bundesterritorien(alles Zuckerrohranbaugebiete) die Beimischung von 10 ProzentEthanol zu Kraftstoffen (E10) ab 2003 vor. In China schreibenvier Provinzen E10 vor, in weiteren fünf Provinzen waren für2005 ähnliche Regelungen vorgesehen.† In den Vereinigten Staa-ten schreiben drei Bundesstaaten E10 vor: Hawaii (ein Großteildes Benzins bis 2006), Minnesota (Steigerung auf 20 Prozent bis2013) und Montana. Minnesota schreibt auch die Beimischungvon 2 Prozent Biodiesel (B2) vor, eine Maßnahme, die auch vonanderen Bundesstaaten und Ländern in Betracht gezogen wird.In Kanada verlangt die Provinz Ontario die Einführung von E5(im Durchschnitt) bis 2007. Auf nationaler Ebene sind in Ko-lumbien (E10) und in der Dominikanischen Republik (E15 undB2 bis 2015) verbindliche Mischungsregelungen getroffen wor-den. Thailand hat eine Zielvorgabe für den Biokraftstoffanteilan der Gesamtenergieproduktion bis 2011, wofür es verbindli-che E10- und B2-Mischungsregelungen in Betracht zieht. Japanerwägt eine verbindliche E5-Mischungsregelung, die mit Impor-ten aus Brasilien umgesetzt werden soll.[Anm. 33]
Steuerliche Anreize für Biokraftstoffe haben in den USA, woin den letzten 25 Jahren auf bundes- und einzelstaatlicher Ebeneeine ganze Reihe von Instrumenten geschaffen worden sind,besondere Bedeutung. Im Rahmen des Energy Security Act von1979 wurde auf Bundesebene eine Steuergutschrift auf Ethanolvon bis zu 60 Cent pro Gallone entsprechend dem Mischungs-verhältnis im Kraftstoff (z. B. 6 Cent/Gallone für E10) geschaf-fen. 2004 wurde die Gültigkeit dieser Steuergutschrift bis 2010verlängert. Hinzu kam auch eine Steuergutschrift für Biodieselin Höhe von rund 1 Cent je Prozentanteil des beigemischtenBiodiesels (d. h. 2 Cent pro Gallone für B2). Außerdem werdenin mehreren US-Bundesstaaten steuerliche und andere Anreizefür die Erzeugung und den Verkauf von Ethanol gewährt. Kana-da bietet auf nationaler Ebene eine Ermäßigung der Kraftstoff-steuer in Höhe von 10 Cent pro Liter an, und in vielen Pro-vinzen gibt es einen ähnlichen oder höheren Steuerbonus (biszu 25 Cent/Liter). Verschiedene europäische Länder gewährenKraftstoff- oder Mehrwertsteuerbefreiungen für Biokraftstoffe,darunter Österreich (95 Prozent Steuerbefreiung für Biodiesel),Frankreich, Deutschland (100 Prozent Steuerbefreiung für Bio-diesel), Ungarn, Italien (100 Prozent Steuerbefreiung für Bio-diesel), Spanien, Schweden und das Vereinigte Königreich.
Mehrere andere europäische Länder ziehen auf Biokraft-stoffe bezogene Instrumente als eine Möglichkeit im Rahmenihrer Bemühungen in Betracht, das EU-Ziel für Biokraftstoffe inHöhe von 5,75 Prozent Anteil an den Verkehrskraftstoffen bis2010 zu erreichen. Eine EU-Richtlinie von 2003 sieht für jedesLand Ziele vor, die bis 2005 (2 Prozent) und 2010 (5,75 Pro-zent) zu erreichen sind. Es handelt sich dabei um freiwilligeZielvorgaben, doch die Länder müssen Pläne für die Zielerrei-chung vorlegen bzw. eine Begründung liefern, weshalb die Zielenicht erreicht werden. Einige EU-Länder haben vor kurzemGesetze zur Förderung von Biokraftstoffen oder verbindlicheZiele erlassen, darunter Ungarn, das 2 Prozent der Gesamtener-gie aus Biokraftstoffen bis 2010 vorschreibt, und die Nieder-lande mit einem Ziel von 2 Prozent für die Verkehrskraftstoffe.
Green Power Purchasing und Utility Green Pricing
In Europa, in den Vereinigten Staaten, in Kanada, Australienund Japan gab es 2004 über 4,5 Millionen Ökostromkunden. Esmehren sich die Programme, die den freiwilligen Bezug vonÖkostrom (Green Power Purchasing, GPP) und Energiemix-angebote der Energieversorgungsunternehmen mit unter-schiedlichen EE-Anteilen zu unterschiedlichen Preisen (UtilityGreen Pricing, UGP) fördern; unterstützt werden sie in derRegel durch eine Kombination flankierender politischer Maß-nahmen, privater Initiativen, EVU-Programme und staatlicherAnkäufe. Die drei wichtigsten GPP-Vehikel sind UGP-Program-me, Endkundenverkauf zu Wettbewerbspreisen durch Dritter-zeuger – ermöglicht durch die Deregulierung des Strommarkts(auch Green Marketing genannt) – und handelbare EE-Zerti-fikate. Ökostromprogramme auf kommunaler Ebene gibt esauch in Japan. In dem Maße, wie die Märkte wachsen, gehen diePreisaufschläge für „grünen Strom“ gegenüber konventionellerEnergie zurück. In den Vereinigten Staaten liegen die Endkun-denaufschläge für Ökostrom inzwischen in der Regel bei 1–3Cent/kWh.[Anm. 34]
In einigen europäischen Ländern gibt es Green Power Pur-chasing und Utility Green Pricing seit Ende der 1990er Jahre.So verzeichneten die Niederlande 2004 im Zuge der Steuerbe-freiungen für den Bezug von Ökostrom fast drei MillionenÖkostromkunden. Andere Länder in Europa mit Einspeiserege-lungen für Regenerativstrom und Wiederverkauf von Ökostromvon Dritterzeugern sind z. B. Finnland, Deutschland, dieSchweiz und das Vereinigte Königreich. Der Ökostrommarkt inDeutschland ist seit 1998 stetig gewachsen; 2004 bezogen über600.000 Endkunden insgesamt 2.000 GWh. Achtzehn europäi-sche Länder sind Mitglieder von RECS, dem Zertifikatesystemfür erneuerbare Energien, das Ende der 1990er Jahre eingerich-tet wurde, um die Ausgabe von Zertifikaten für erneuerbareEnergien und den Zertifikatehandel zu standardisieren und zuzertifizieren. Bis 2005 wurden Zertifikate für 33.000 GWhkumulierte Gesamtleistung ausgegeben, wovon fast 13.000 GWh
† Aufgrund der schlechten Zuckerrohrernte 2003–2004 musste Indien Ethanol einführen, um die Beimischungsziele auf bundesstaatlicher Ebene erfüllen zu können; weiter gesteckteZiele mussten zunächst aufgeschoben werden, bis der heimische Markt wieder ausreichende Ethanolmengen liefert. Auch einige chinesische Provinzen mussten die verbindlichvorgeschriebene Beimischung wegen Ethanolknappheit aussetzen.
060131.ps - 2/1/2006 10:38 AM

POLITISCHE INSTRUMENTE ERNEUERBARE ENERGIEN 2005 GLOBALER STATUSBERICHT SEITE 27
auf Zertifikate für den Bezug von Ökostrom durch die Verbrau-cher entfallen.*
In den Vereinigten Staaten gibt es schätzungsweise einehalbe Million Ökostromkunden, die jährlich 4.500 GWh Strombeziehen. Etwa ab 1999 begann das GPP Wirkung zu zeigen.2004 wurden mindestens 2 GW zusätzliche EE-Kapazitätengeschaffen, um diesen Markt zu bedienen.† Die amerikanischeBundesregierung ist der größte Einzelabnehmer von Ökostrom;allein die U.S. Air Force bezieht jährlich 320 GWh. Bis 2004 hat-ten über 600 Energieversorger in 34 Bundesstaaten ein GreenPricing-Programm anzubieten. Die meisten setzten auf Frei-willigkeit, doch in fünf Bundesstaaten wurden zwischen 2001und 2003 Verordnungen erlassen, die den Versorgern die Bereit-stellung von Ökostromprodukten für ihre Kunden auferlegen.Fast die Hälfte aller Ökostromlieferungen 2004 entfiel auf dasUtility Green Pricing.
Zahlreiche amerikanische Großkonzerne von Unternehmender Luft- und Raumfahrtindustrie bis zu Naturkostfirmen bezie-hen freiwillig Ökostromprodukte. Zu ihnen gehören Firmen wieIBM, Dow, Dupont, Alcoa, Intel, HP, Interface, Johnson & John-son, Pitney Bowes, Staples, Baxter, FedEx Kinkos, General Mo-tors und Toyota. Mit zu dieser Entwicklung beigetragen habenInitiativen aus dem öffentlichen und dem nichtstaatlichenSektor. Der „Green Power Partnership“ der US-Umweltbehörde
EPA schlossen sich bis 2005 rund 600 Partner an, die jährlich2.800 GWh Ökostrom beziehen. Zur Glaubwürdigkeit desMarktes hat auch ein Programm der freiwilligen Zertifizierungvon grünem Strom – Green-e – beigetragen.
In Japan gab es Anfang 2005 schätzungsweise 60.000 Bezie-her von Ökostrom. Es handelt sich dabei um Kunden von Ver-sorgungsunternehmen, die über Genossenschaften, lokale undkommunale Organisationen und EVU-Programme einen frei-willigen Beitrag zur Förderung von Ökostrom leisten. Die Öko-stromentwicklung in Japan ging ursprünglich von freiwilligenlokalen oder kommunalen Organisationen aus. Das erste Öko-stromprogramm wurde von einer Konsumgenossenschaft –Seikatsu Club Hokkaido – initiiert. In Zusammenarbeit mit demjeweiligen regionalen Energieversorger zieht der Verband mitden Stromrechnungen freiwillige Beiträge seiner Mitglieder undder allgemeinen Öffentlichkeit ein und investiert in EE-Projekte.Mitglieder können Anteile an Windkraftprojekten erwerben undauf diese Weise die ersten Windkraftanlagen „in Bürgerhand“schaffen. Ähnliche grüne Fonds wurden auch andernorts inJapan eingerichtet, und zehn japanische Energieversorger bietenihren Kunden inzwischen die Möglichkeit, in einen Ökostrom-fonds einzuzahlen, um Windkraft- und Solaranlagen zu fördern.Zu Beginn des Jahres 2005 leisteten 57.000 Kunden freiwilligemonatliche Zuzahlungen zu ihren Stromrechnungen.
Tabelle 7. Ausgewählte Großstädte mit Zielvorgaben und/oder Instrumenten zur Förderungerneuerbarer Energien
Zielvorgaben CO2- Vorgaben/ Vorgaben/ Vorgaben/erneuerbare Minderungs- Instrumente Warm- Instrumente Instrumente Stadt-
Stadt Energien ziele wasserbereitung Photovoltaik planung, Pilotproj. u.a.
Adelaide, Australien u u uBarcelona, Spanien u u u u uChicago, USA uDaegu, Korea u u uDen Haag, Niederlande uFreiburg, Deutschland u u u uGöteborg, Schweden uGwangju, Korea u u uHonolulu, USA uKapstadt, Südafrika u u uLinz, Österreich uMinneapolis, USA u uOxford, VK u u u u uPortland, USA u u u u uQingdao, China uSan Francisco, USA uSanta Monica, USA uSapporo, Japan u uToronto, Kanada uVancouver, Kanada u
* Im Vereinigten Königreich wird die Unterscheidung zwischen freiwilligem Ökostrombezug und EE-Verpflichtungen der Versorgungsunternehmen in Frage gestellt. Es wird dieAuffassung vertreten, der freiwillige Bezug von grünem Strom könne nicht immer als „zusätzlich“ zu bestehenden Verpflichtungen der Versorger gelten. In Deutschland wird derGrünstrommarkt zu über fünfzig Prozent von Wasserkraftwerken bedient, und zwar überwiegend solchen, die lange vor der Liberalisierung des deutschen Elektrizitätsmarkts inBetrieb genommen wurden.
† Der Bezug von Ökostrom in den Vereinigten Staaten erfolgt gesondert und zusätzlich zu etwaigen verbindlichen EE-Regelungen wie z. B. Renewable Portfolio Standards.
060131.ps - 2/1/2006 10:38 AM

SEITE 28 ERNEUERBARE ENERGIEN 2005 GLOBALER STATUSBERICHT POLITISCHE INSTRUMENTE
Auch in Japan haben sich EE-Zertifikatemärkte entwickelt.Die Japan Natural Energy Company (JNEC) verkauft inzwi-schen Ökostromzertifikate an Geschäfts- und Industriekunden,zu ihnen zählen über 50 japanische Großunternehmen wieSony, Asahi, Toyota und Hitachi. JNEC will diesen Firmen übereinen Zeitraum von 15 Jahren Zertifikate im Gesamtwert von60 GWh mit Aufschlägen von 2,4–3,4 Cent/kWh (3–4 Yen/kWh) verkaufen.
In Australien gibt es über 100.000 Ökostromkunden, dieihren Strom von diversen Endlieferanten beziehen. Auch in an-deren Ländern wird zunehmend grüner Strom eingekauft. EinBeispiel ist China, wo zwölf Unternehmen in Shanghai 2005damit begonnen haben, von drei örtlichen Windkraftanlagenauf freiwilliger Basis Ökostrom zu beziehen – in dieser Form einNovum in China. Der Mehrpreis war hoch – er lag 6 Cents/kWh (0,53 Yuan) über dem Preis für konventionellen Strom.
Instrumente auf kommunaler Ebene
Zahlreiche Kommunen in der ganzen Welt haben eigene Instru-mente und Programme zur Förderung erneuerbarer Energiengeschaffen. Städte setzen sich Ziele für den EE-Anteil und dieMinderung von CO2-Emissionen, indem sie Programme undMaßnahmen zur Förderung solarer Warmwasserbereitungs-anlagen und/oder Aufdach-Photovoltaikanlagen beschließen,ihre kommunalen Stadtplanungsmethoden oder -verfahrenunter Berücksichtigung des künftigen Energieverbrauchs än-dern, Demonstrations- oder Pilotanlagen errichten und eineVielzahl anderer Instrumente und Programme auf den Wegbringen. (Siehe Tabelle 7.)[Anm. 35]
Eine ganze Reihe von Städten hat beschlossen, für die Ver-sorgung und den Betrieb der kommunalen VerwaltungsgebäudeÖkostrom zu beziehen. Beispiele sind Portland (Oregon) undSanta Monica (Kalifornien) in den Vereinigten Staaten, die ihrenEnergiebedarf zu 100 Prozent aus Ökostrom decken. Zu denanderen amerikanischen Städten, die 10–20 Prozent des kom-munalen Strombedarfs durch Ökostrom decken, gehören Chi-cago, Los Angeles, Minneapolis und San Diego.
Viele Städte sind dabei, für die Zukunft Ziele von 10–20Prozent EE-Strom für alle städtischen Verbraucher, nicht nurdie Kommunalverwaltung festzulegen. Beispiele sind Adelaide inAustralien, Kapstadt in Südafrika, Freiburg in Deutschland undSacramento in Kalifornien in den USA. Die Ziele sind in derRegel auf den Zeitraum 2010–2020 ausgerichtet. Manche Zielebeziehen sich auf den Gesamtenergieverbrauch, wie z. B. Daeguin Korea mit seiner Zielvorgabe von 5 Prozent bis 2012, andereauf die installierte Leistung. Sowohl Oxford als auch Kapstadtvisieren für 10 Prozent der Wohnungen eine solare Warmwas-serversorgung (Oxford auch Photovoltaik) bis 2010 an. Diespanische Stadt Barcelona strebt für 2010 eine Kollektorflächevon 100.000 Quadratmetern für die Warmwasserbereitung an.Manche Kommunen im Vereinigten Königreich schreiben füralle Neubauten ab einer bestimmten Größe eine hausinterneVersorgung mit regenerativ erzeugtem Strom vor.
Einige Städte haben außerdem CO2-Minderungszielegeplant oder bereits eingeführt,, die in der Regel eine 10- bis 20-prozentige Senkung gegenüber einem Referenzwert (meist derWert von 1990) des Kyoto-Protokolls vorsehen. (Auf kommuna-
ler Ebene wird die Festlegung solcher Ziele allerdings durch dieIndustrieproduktion erschwert, da die Emissionen der Industrienicht unbedingt den Stadtbewohnern zuzuschreiben sind.) Bei-spiele für Städte mit CO2-Minderungszielen sind Freiburg inDeutschland (25 Prozent), Gwangju in Korea (20 Prozent), Sap-poro in Japan (10 Prozent), Toronto in Kanada (20 Prozent desEnergieverbrauchs der Kommunalverwaltung) und VancouverBC in Kanada (6 Prozent). Im niederländischen Den Haag gibtes Pläne, den Energieverbrauch der Kommunalverwaltung bis2006 auf ein „CO2-neutrales“ Niveau zu bringen und die ge-samte Stadt langfristig „CO2-neutral“ zu machen. Die australi-sche Stadt Adelaide hat vor, die Nettoemissionen im Gebäude-bereich bis 2012 und im Verkehrsbereich bis 2020 „auf Null“ zubringen.
Eine Stadtplanung, die künftige Clean Energy-Szenarienberücksichtigt, setzt sich in vielen Städten zunehmend durch,häufig unter Mitwirkung einer Vielzahl von Akteuren. Dasschwedische Göteborg mit seinem Projekt „Göteborg 2050“ istein Beispiel für eine Stadt mit langfristigen Leitzielen. DiesesProjekt ist eine Gemeinschaftsinitiative der Universitäten, derStadtverwaltung und des städtischen Energieversorgers. Es um-fasst Forschung, die Entwicklung von Szenarien, strategischePlanung, den Dialog mit der Öffentlichkeit und Demonstra-tionsvorhaben. In Japan, wo es auf kommunaler Ebene zahlrei-che Aktivitäten zur Förderung erneuerbarer Energien gibt,haben in den letzten zehn Jahren 800 Kommunalverwaltungenunterstützt durch ein Programm der japanischen Regierungkommunale Zukunftsvisionen entworfen. Die von diesen japa-nischen Städten geschaffenen Visionen zeichnen sich durchFortschrittlichkeit und Einzigartigkeit aus, berücksichtigen diejeweiligen lokalen Gegebenheiten und beziehen erneuerbareEnergien mit ein.
Überall auf der Welt werden auf gemeinsame Veranlassungoder mit Beteiligung von Städten eine Vielzahl globaler Initi-ativen zur Förderung der Entwicklung erneuerbarer Energienauf kommunaler Ebene veranstaltet wie etwa die „Cities forClimate“-Kampagne von ICLEI (Local Governments for Sus-tainability), die „International Solar Cities Initiative“, die„European Solar Cities Initiative“, das „European Green CitiesNetwork“ und die „European Climate Alliance“.
060131.ps - 2/1/2006 10:38 AM

ERNEUERBARE ENERGIEN 2005 GLOBALER STATUSBERICHT SEITE 29
n Tabelle 8 sind die häufigsten Anwendungsbe-reiche erneuerbarer Energien in der netzfernenländlichen Energieversorgung aufgeführt. Dazugehören Kochen, Beleuchtung und andere kleinereBedarfszwecke, Antriebsenergie, Wasserpumpen
sowie Heizung und Kühlung. In der Tabelle sind sowohl „tradi-tionelle“ (Erstgenerations-) Anwendungen und Technologien(z. B. unbehandelte Biokraftstoffe und Kleinwasserkraft) alsauch „neue“ (Zweitgenerations-) Anwendungen und Techno-logien (d. h. Windkraft, Photovoltaik, Biomassevergasung undKleinstwasserkraft) aufgeführt. Die Entwicklung konzentriertsich zwar größtenteils auf neue Technologien der zweitenGeneration, doch Experten für ländliche Entwicklung weisendie Fachgemeinde im Entwicklungs- und Regenerativbereichimmer wieder darauf hin, dass traditionelle Verfahren auchheute noch wichtig sind, insbesondere in den am wenigstenentwickelten Ländern. In diesem Abschnitt wird zunächst aufeinige der in Tabelle 8 aufgeführten Energieanwendungen inländlichen Gebieten eingegangen und anschließend die ländli-che Elektrifizierungspolitik erörtert.[Anm. 36]
Zu den „traditionellen“ Nutzungsbereichen gehören inerster Linie die Verbrennung von Holz, Abfällen (Reststoffen)aus Land- und Forstwirtschaft, Dung und anderen unverarbei-teten Biomassebrennstoffen für häusliche Koch- und Heiz-zwecke und sonstigen Prozesswärmebedarf. Ein Teil der Bio-masse wird zu Holzkohle verarbeitet und auf Märkten verkauft.In vielen Entwicklungsländern wird ein Großteil des Gesamt-primärenergieverbrauchs durch Biomasse gedeckt. So betrug2001 dieser Anteil in Afrika 49 Prozent, in Asien 25 Prozent undin Lateinamerika 18 Prozent. Im Jahr 2000 verbrauchten dieHaushalte in Afrika südlich der Sahara fast 470 Mio. TonnenBrennholz (0,72 Tonnen pro Kopf) in Form von Holz undHolzkohle. Zum Vergleich: Indien und China verbrauchtenzusammen 340 Mio. Tonnen. In Afrika südlich der Sahara sindHolz oder Ernteabfälle für 94 Prozent der ländlichen Haushalteund für 41 Prozent der städtischen Haushalte die wichtigsteHaushaltsenergiequelle. Für 4 Prozent der ländlichen und 34Prozent der städtischen Haushalte ist es Holzkohle und für 2Prozent der ländlichen und 13 Prozent der städtischen Haus-halte Kerosin.[Anm. 37]
Die Darstellung der Kosten und der gesundheitlichenFolgen der traditionellen Nutzung von Biomasse (und die ent-sprechenden Vorteile verbesserter Biomassekocher und andererTechnologien) ginge über den Rahmen des vorliegendenBerichts hinaus; diese sind jedoch ganz erheblich. Ein großerTeil der Biomassebrennstoffe wird außerhalb der gewerblichenWirtschaft gesammelt, wobei der Zeitaufwand für das Sammelnein beträchtlicher nichtmonetärer Aufwand ist – vor allem fürFrauen. Die Wissenschaftler Ezzati und Kammen stellen in einerumfassenden Literaturstudie fest, dass „konservative Schätzun-
gen der weltweiten Mortalität infolge der Raumluftbelastungdurch feste Brennstoffe zeigen, dass im Jahr 2000 zwischen 1,5und 2 Millionen Todesfälle diesem Risikofaktor zuzuschreibenwaren; dies entspricht 3–4 Prozent der globalen Gesamtsterb-lichkeit“.[Anm. 37]
Kochen: Verbesserte Biomasse-Kochgeräte
Verbesserte Biomassekocher reduzieren den Biomasseverbrauchfür ein- und denselben Kochvorgang um 10–50 Prozent undkönnen die Innenraumluftqualität enorm verbessern. Die meis-ten verbesserten Kocher wurden in China und in Indien herge-stellt und verkauft, wo ihre Nutzung staatlich gefördert wird,sowie in Kenia, wo sich ein umfangreicher gewerblicher Marktentwickelt hat. Dank der Vielzahl staatlicher Programme underfolgreicher privater Märkte in den letzten zwanzig Jahren sindweltweit inzwischen 220 Mio. verbesserte Kochgeräte in Ge-brauch. Dieser Zahl stehen rund 570 Mio. Haushalte weltweitgegenüber, die von traditioneller Biomasse als ihrer wichtigstenKochenergie abhängen. Chinas 180 Mio. verbesserte Kocherentsprechen derzeit rund 95 Prozent der traditionelle Biomassenutzenden Haushalte des Landes und Indiens 34 Mio. rund 25Prozent.*[Anm. 38]
In Afrika haben die in den letzten Jahrzehnten unternom-menen Bemühungen im Bereich der Forschung, der Verbreitungund der Kommerzialisierung dazu geführt, dass inzwischen einebreite Palette verbesserter, mit Holzkohle – und inzwischen auchmit Holz – befeuerter Herde in Gebrauch ist. Viele dieser Herd-konstruktionen wie auch die Programme und Instrumente, dieihre Kommerzialisierung unterstützten, haben sich bestens be-währt. Inzwischen sind auf dem afrikanischen Kontinent 5 Mio.verbesserte Kochgeräte in Gebrauch. In Kenia ist der „CeramicJikko Stove“ (KCJ) in über 50 Prozent aller städtischen und inrund 16–20 Prozent aller ländlichen Haushalte anzutreffen. Et-wa ein Drittel der afrikanischen Länder verfügt über Program-me für verbesserte Biomassekocher, jedoch sind kaum gezielteingesetzte Instrumente vorhanden. Auch Nichtregierungsorga-nisationen und Kleinunternehmen setzen ihre Bemühungen umdie Förderung und Vermarktung von Kochgeräten fort.
Kochen und Beleuchtung: Biogasanlagen
Weltweit decken schätzungsweise 16 Mio. Haushalte ihren Ener-giebedarf für Beleuchtungs- und Kochzwecke durch Biogas aushäuslichen Biogasanlagen (Anaerobfermenter genannt). Dazugehören 12 Mio. Haushalte in China, 3,7 Mio. Haushalte inIndien und 140.000 Haushalte in Nepal. Biogas liefert nicht nurEnergie zum Kochen und Beleuchten, sondern es hat auf indi-rekte Weise auch die Lebensbedingungen ländlicher Haushalteverbessert. So hat eine Untersuchung der Nutzeffekte von Biogas
5. NETZUNABHÄNGIGE LÄNDLICHE EE-SYSTEME
I
* Verbesserte Biomassekocher sind eigentlich eher als Energiespartechnologie und nicht als regenerative Energieerzeugungstechnologie anzusehen. Dennoch sind sie eindeutig eineForm der ländlichen Regenerativenergienutzung, deren Umfang und Folgewirkung enorm ist. Instrumente und Programme zur Förderung Energie sparender Herde sind daherkeine Instrumente zur „Förderung“ erneuerbarer Energien, wie sie für andere Regenerativenergien in diesem Bericht typisch sind, sondern sie sind eher auf die Verbesserung dergesundheitlichen, ökonomischen und ressourcenbezogenen Auswirkungen einer bestehenden Regenerativenergienutzung gerichtet (und stehen daher in engem Zusammenhang miteiner nachhaltigen Wald- und Bodenbewirtschaftung). Es kann sein, dass die Zahl der vorhandenen und in Gebrauch befindlichen verbesserten Kochgeräte erheblich niedriger ist alsin diesem Bericht angegeben; in Indien z. B. haben manchen Schätzungen zufolge die Mehrzahl der Herde das Ende ihrer Nutzungsdauer erreicht und sind nicht mehr in Gebrauch.
060131.ps - 2/1/2006 10:38 AM

SEITE 30 ERNEUERBARE ENERGIEN 2005 GLOBALER STATUSBERICHT NETZUNABHÄNGIGE LÄNDL. EE-SYSTEME
in Nepal ergeben, dass sich die tägliche Arbeitsbelastung derFrauen und Mädchen um drei Stunden pro Haushalt reduziert,dass der jährliche Kerosinverbrauch um 25 Liter/Haushalt sinktund dass jährlich 3 Tonnen Brennholz, landwirtschaftliche Ab-fälle und Dung pro Haushalt eingespart werden.[Anm. 39]
In China ist die Verwendung von Biogas in ländlichen Haus-halten zur Deckung des häuslichen Energiebedarfs zu Beleuch-tungs- und Kochzwecken weit verbreitet. Eine typische 6–8Kubikmeter große Biogasanlage erzeugt 300 Kubikmeter Biogasjährlich und kostet je nach Provinz 1.500–2.000 Yuan (200–250$). Dank ihrer einfachen Technik erfordern diese Anlagen keinefortgeschrittenen Fachkenntnisse und können von örtlichenKleinunternehmen geliefert werden. Die Bauern können dieAnlagen nach entsprechender Einweisung selbst errichten undbedienen. Ein 2002 aufgelegtes neues Regierungsprogrammstellt 1 Mrd. Yuan pro Jahr als Beihilfen für Bauern zur Verfü-gung, die ihre eigene Biogasanlage bauen. Die Beihilfe liegt bei800 Yuan pro Anlage. Manchen Schätzungen zufolge werden proJahr über 1 Mio. Biogasanlagen hergestellt. Außerhalb des häus-lichen Bereichs waren in China mehrere tausend mittlere undgroße gewerbliche/industrielle Biogasanlagen in Betrieb, derenZahl sich im Zuge eines unlängst verabschiedeten nationalenBiogas-Aktionsplans noch vergrößern dürfte.
In Indien fördert das Ministerium für nichtkonventionelleEnergiequellen seit Beginn der 1980er Jahre Biogasanlagen fürden häuslichen Bedarf. Das Ministerium stellt Beihilfen und Fi-nanzmittel für die Errichtung und Wartung von Biogasanlagen,für Schulungsmaßnahmen, Aufklärungsarbeit, Technikzentrenund die Unterstützung der örtlichen Durchführungsorganisati-onen zur Verfügung. Auch die bekannte „Khadi and VillageIndustries“-Kommission fördert Biogasanlagen.
In Nepal wird im Rahmen des „SNV/Biogas Support Pro-gramme“ Unterstützung im Bereich technologische Innovation,Finanzierung, technisches Know-how und Marktentwicklungfür Biogasanlagen für den häuslichen Gebrauch bereitgestellt(Größe 4 bis 20 Kubikmeter, am gängigsten sind 6 Kubikmeter).Im Rahmen des Programms steigerten 60 private Biogasfirmenihre Technik- und Marktkompetenz, und 100 Mikrokreditorga-nisationen stellten Kredite zur Verfügung; außerdem wurdenQualitätsnormen beschlossen und eine Market Facilitation Or-ganization (MFO) – die „Biogas Sector Partnership/Nepal“ –geschaffen.
Elektrizität, Wärme und Antriebskraft:Biomassevergasung
In einigen Entwicklungsländern, insbesondere in China undIndien, findet die kleintechnische thermische Biomasseverga-sung zunehmend Verbreitung. Das Gas aus einer solchen Anlagekann entweder direkt zur Wärmeerzeugung verbrannt oder inGasturbinen oder Gasmotoren zur Erzeugung von Elektrizitätund/oder Antriebsenergie verwendet werden. In einigen chinesi-schen Provinzen wird Biogas aus thermischen Vergasungsanla-gen auch über Leitungsnetze verteilt und als Kochenergie einge-setzt. Die installierte Gesamtleistung indischer Vergasungsan-lagen wurde 2002 auf 35 MW geschätzt; zehn Hersteller vertrei-ben kleine Vergasungsanlagen zusammen mit Motoren von biszu 300 kW Leistung. Auf den Philippinen werden diese Anlagenseit den 1980er Jahren mit Dual-Fuel-Dieselmotoren (kombi-nierter Erdgas-/Dieselbetrieb) gekoppelt und in Reismühlenund für die Bewässerung eingesetzt. Vergasungsanlagen zu
Tabelle 8. Häufige Anwendungen erneuerbarer Energien in ländlichen (netzfernen) Gebieten
Energiedienstleistungen EE-Anwendungen Konventionelle Alternativen
Kochen
(Haushalte, gewerbliche Koch- und Backherde)
Beleuchtung und andere kleinere Bedarfszwecke (Haushalte, Schulen, Straßenbeleuchtung, Telekommunikation, Handwerk-zeuge, Impfstofflagerung)
Prozessenergie für Antriebe (Kleinindustrie)
Wasserpumpen (Landwirtschaft, Trinkwasserversorgung)
Heizung und Kühlung(Ernteguttrocknung und andere landwirtschaftliche Verarbei-tungsprozesse, Warmwasser)
• direkte Verbrennung von Biomasse (Brennholz, Ernteabfälle,forstwirtschaftliche Abfälle, Dung, Holzkohle u. a.)
• Biogas aus Biokonvertern für den Haushalt• Solarkocher
• Wasserkraft (Klein- und Kleinstwasserkraft) • Biogas aus Biokonvertern für den Haushalt• kleinere Biomassevergaser mit Gasmotor• Hybridanlagen (Sonne/Wind) für Kleinnetze im dörfl. Bereich • Inselanlagen (Solar Home Systems)
• Kleinwasserkraftanlagen mit Elektromotor• Biomasseverstromung und Elektromotor• Biomassevergasung mit Gasmotor
• mechanische Windkraftpumpen • Photovoltaikpumpen
• Direktverbrennung von Biomasse • Biogas aus kleinen und mittleren Anlagen • solare Ernteguttrockner • solare Warmwasserbereiter• Eiserzeugung zur Lebensmittelkonservierung
Flüssiggas, Kerosin
Kerzen, Kerosin, Batterien, zentrale Batterieaufladung,Dieselgeneratoren
Dieselgeneratoren
Dieselpumpen
Flüssiggas, Kerosin,Dieselgeneratoren
060131.ps - 2/1/2006 10:38 AM

NETZUNABHÄNGIGE LÄNDL. EE-SYSTEME ERNEUERBARE ENERGIEN 2005 GLOBALER STATUSBERICHT SEITE 31
Demonstrationszwecken gibt es auch in Indonesien, in Thailandund in Sri Lanka.[Anm. 40]
In Indien laufen Demonstrationsprojekte für den kommer-ziellen Einsatz der Biomassevergasung bei der Herstellung undVerarbeitung von Seide und anderen Textilien; daran beteiligtsind örtliche Unternehmen, die Amortisationszeit ist kurz. Beider Trocknung von Gewürzen (Kardamom) – ebenfalls mit Ver-gasungsanlagen und stromunabhängig – wird bei kürzerenTrocknungszeiten eine höhere Produktqualität erzielt. Bei dieserForm der Anwendung amortisieren sich die Investitionen inner-halb einer Saison. Über 85 Prozent der Projektmittelempfängersind Kleinerzeuger mit weniger als zwei Hektar Land. Die Trock-nung von Kautschuk, ebenfalls mit Vergasungsanlagen, zeigtauch, dass konventionelle Energie ersetzbar und eine Amor-tisation in weniger als einem Jahr erreichbar ist. Vergasungsanla-gen werden auch zur Trocknung von Ziegeln vor dem Brennenim Brennofen verwendet. Der Einsatz einer solchen Anlage ver-ringert den Brennstoffverbrauch und die damit verbundeneRauchbelastung und verkürzt die Trocknungszeit (steigert alsodie Produktivität), bei gleichzeitiger Verbesserung der Arbeits-bedingungen.
Elektrizität: Kleinnetze/Hybridsysteme im dörflichen Bereich
Kleinnetze im dörflichen Bereich können bis zu hundert Haus-halte oder mehr versorgen. Herkömmlicherweise werden Klein-netze in entlegenen Gebieten und auf Inseln durch Dieselgene-ratoren oder Kleinwasserkraft mit Energie gespeist. Die Erzeu-gung von Photovoltaik-, Wind- oder Biomassestrom – oft durchHybridsysteme mit Batterien und/oder zusätzlichem Diesel-generator – bietet hauptsächlich in Asien allmählich eine Alter-native zum traditionellen Modell. In China gibt es Zehntausen-de von Kleinnetzen, in erster Linie versorgt durch Kleinwasser-kraft, in Indien, Nepal, Vietnam und Sri Lanka sind es Hunderteoder Tausende. Die Nutzung von Windkraft- und Photovoltaik-technologien in Kleinnetzen und Hybridsystemen bewegt sichimmer noch in einer Größenordnung von eintausend Systemenweltweit, von denen die meisten seit 2000 in China eingerichtetworden sind. Im Rahmen des chinesischen „Township Electri-fication Program“ wurden zwischen 2002 und 2004 eine MillionMenschen in eintausend ländlichen Gemeinden – etwa 250.000Haushalte – mit Elektrizität aus Photovoltaikanlagen, Wind/PV-Hybridanlagen und Kleinwasserkraftanlagen versorgt. Im Zeit-raum 2002–2004 erhielten fast 700 ländliche Gemeinden dorfei-gene Photovoltaikanlagen mit einer Leistung von etwa 30–150kW (insgesamt rund 20 MW). Einige dieser Anlagen warenHybridsysteme mit Windkraft (insgesamt rund 800 kW Wind-kraft). In Indien, dem anderen wichtigen Standort für Dorf-stromanlagen, sind 550 kW aus Wind/PV-Hybridanlagen instal-liert worden, die in Dutzenden von Dörfern einige tausendHaushalte versorgen.[Anm. 41]
Wasserpumpen: Windkraft und Photovoltaik
Photovoltaik und Windkraft für Wasserpumpen – zur Bewäs-serung wie für die Trinkwasserversorgung – finden immer mehrAkzeptanz, und die Zahl der Projekte und Investitionen steigt.Rund eine Million mit Windkraft betriebene mechanische Pumpen werden nach jahrzehntelanger Entwicklung in ersterLinie in Argentinien zum Wasserpumpen eingesetzt. Auch inAfrika sind immer mehr Windkraftpumpen im Einsatz: inSüdafrika 300.000, in Namibia 30.000, in Kap Verde 800, inSimbabwe 650 und in einigen anderen Ländern weitere 2.000.Inzwischen gibt es weltweit über 50.000 Photovoltaik-Wasser-pumpen, viele davon in Indien. Im Rahmen des indischen„Solar PV Water Pumping Programme“ wurden kürzlich inländlichen Regionen über 4.000 Solarpumpen (von 200 W bis2.000 W) installiert. In Westafrika sind schätzungsweise 1.000solar betriebene Wasserpumpen im Einsatz. Geberprogrammefür die photovoltaisch betriebene Trinkwassergewinnung gibt esunter anderem in Argentinien, Brasilien, Indonesien, Jordanien,Namibia und Niger, auf den Philippinen, in Tunesien und inSimbabwe. [Anm. 42]
In den letzten Jahren ist eine wachsende Zahl kommerziellerProjekte für die photovoltaisch betriebene Trinkwassergewin-nung (Pumpen und Reinigen) gestartet worden, insbesondere inIndien, auf den Malediven und auf den Philippinen. Bei einemkommerziellen Pilotprojekt auf den Malediven wird eine Ab-nahme von 1.000 Litern pro Tag erwartet, wobei langfristig voneinem Wasserpreis für die Haushalte von 0,2 bis 0,5 Cent proLiter ausgegangen wird. Ein weiteres Beispiel aus jüngerer Zeitist die philippinische Insel Cebu. Eine photovoltaisch betriebene3-kW-Wasserpumpe versorgt zehn Dörfer mit gefiltertem undchloriertem Oberflächenwasser. Für den Kauf von Trinkwasserzum Preis von rund 3 philippinischen Pesos (5,5 Cent) für 20Liter (also 0,3 Cent/Liter) – einem Zehntel des Preises für inFlaschen abgefülltes Wasser – verwenden die 1.200 Bewohnervorausbezahlte Guthabenkarten. Die Einnahmen aus demTrinkwasserverkauf werden für die Rückzahlung eines nichtsubventionierten Bankdarlehens mit zehnjähriger Laufzeit ver-wendet. Das Programm könnte auf zehn weiteren philippini-schen Inseln wiederholt werden und 200.000 Menschen in 40Gemeinden mit Trinkwasser versorgen.
Elektrizität: Inselanlagen (Solar Home Systems)
Über 2 Millionen Haushalte in Entwicklungsländern erhieltenim Jahr 2005 Strom aus Inselanlagen (so genannten Solar HomeSystems). Zahlenmäßig konzentrieren sich diese Anlagen – undder überwiegende Teil der weltweiten Zunahme in den letztenJahren – auf bestimmte asiatische Länder (Indien, Sri Lanka,Nepal, Bangladesch, Thailand und China), in denen das Pro-blem der Erschwinglichkeit entweder durch Mikrokredite oderdurch das Angebot kleiner Anlagen gegen Barzahlung gelöstworden ist und in denen der Staat und internationale Geber-programme die Märkte unterstützen.* In all diesen Ländern
* Durch Projekte der Globalen Umweltfazilität, der Weltbank und des UNDP wurden bis 2004 weltweit rund 410.000 Inselanlagen gefördert, davon 230.000 in China, 75.000 in SriLanka, 45.000 in Indien, 40.000 in Bangladesch, 10.000 in Simbabwe und etwa 10.000 weitere im Rahmen anderer Projekte im Verbund. Es handelt sich um das größte einzelneGeberförderprogramm für Solar Home Systems. Für Projekte dieser Organisationen und andere staatliche Programme ist beispielsweise in Südafrika, Kap Verde, Argentinien,Senegal und Botswana auch ein auf die Erteilung von Konzessionen für ländliche Energiedienstleistungen abzielendes Konzept oder „Fee-for-service“-Geschäftsmodell verwendetworden; die Prüfung der wirtschaftlichen Tragfähigkeit solcher Geschäftsmodelle steckt allerdings noch in den Anfängen.
060131.ps - 2/1/2006 10:38 AM

SEITE 32 ERNEUERBARE ENERGIEN 2005 GLOBALER STATUSBERICHT NETZUNABHÄNGIGE LÄNDL. EE-SYSTEME
kommen inzwischen jeden Monat Hunderte oder Tausende vonNeuanlagen für den häuslichen Bedarf hinzu (Berichten zufolge10.000 pro Monat in China in 2005). Der Anlagenbestand ins-gesamt belief sich allein 2004 auf über 200.000. In Indonesiengibt es rund 40.000 im Rahmen verschiedener Geberprogram-me installierte Solar Home Systems, jedoch haben die gesamt-wirtschaftlichen Probleme der letzten Jahre das Wachstum ge-bremst. Zu den anderen großen Märkten außerhalb Asiensgehören Kenia, Marokko und Mexiko. Nach den Plänen einigerlateinamerikanischer Länder könnte sich das Wachstum im Bereich der solaren Inselanlagen in diese Region verlagern,wenn Erfolg versprechende Ansätze zur Lösung des Erschwing-lichkeitsproblems einschließlich staatlicher Subventionen und/oder Fee-for-service-Modelle weiterverfolgt werden.*[Anm. 43]
In Afrika mit seinem sehr geringen Elektrifizierungsgrad imländlichen Raum und dem niedrigen Pro-Kopf-Einkommen istvon einigen wenigen Ländern abgesehen keine nennenswerteZunahme der Solar Home Systems zu verzeichnen. In Kenia gibt es 150.000 Solar Home Systems, fast die Hälfte des in Afrika installierten Bestands, und ein anhaltendes Marktwachstum.Gefördert wird dieses Wachstum durch Barverkäufe kleinerModule an Haushalte in ländlichen Gebieten und im städti-schen Umland. Marokko strebt 150.000 Inselanlagen bis 2010an.Uganda verfolgt ein groß angelegtes Zehnjahresprogramm,das auf Inselanlagen und andere produktive Verwendungsmög-lichkeiten im Bildungs- und Gesundheitswesen ausgerichtet ist.In Südafrika gibt es seit mehreren Jahren Pläne, 200.000 ländli-chen Haushalten über von Privatfirmen betriebene Fee-for-ser-vice-Konzessionen solare Inselanlagen zur Verfügung zu stellen.Andere Länder wie Mali, Senegal und Tansania gewähren be-grenzte Subventionen für ländliche RE-Systeme wie Solar HomeSystems. Im Allgemeinen aber haben sich frühere Erwartungen,Millionen afrikanischer Haushalte mit solchen Insellösungen zuversorgen, nicht erfüllt. Ein großes Problem ist nach wie vor dieErschwinglichkeit, da die Kosten einer typischen Inselanlage derunteren Preisklasse im Vergleich zu den Durchschnittseinkom-men in den meisten afrikanischen Ländern relativ hoch sind.
In fünf Ländern – China, Sri Lanka, Indien, Bangladeschund Kenia – ist der Verkauf von Solar Home Systems durch pri-vate Händler der Eckpfeiler des Marktes. In China und Keniawerden die Anlagen fast ausschließlich gegen Barzahlung ver-kauft. In Indien, Sri Lanka und Bangladesch haben Kreditkäufedie Erschwinglichkeit verbessert und die Märkte gefördert.Wichtige Neuerungen sind NRO-gestützte Mikrofinanzierun-gen, Händlerkredite und Verbraucherkredite von Geschäftsban-ken. In Indien werden neben den zahlreichen Barverkäufen in-zwischen von über 2.000 Bankfilialen in ländlichen Gebieten imRahmen eines kommerziellen Solarkreditprogramms Kredite fürden Kauf von Solar Home Systems angeboten. Die schätzungs-weise 120.000 Solar Home Systems, die in den letzten fünf Jah-ren in Indien, Sri Lanka und Bangladesch auf Kreditbasis ver-kauft wurden, stellen praktisch den gesamten weltweiten Be-stand an kreditfinanzierten Anlagen dar. Auch Kenia verfügtüber einen sehr dynamischen privaten Markt mit mehr als 20großen PV-Import- und Fertigungsbetrieben und Hunderten
ländlicher Anbieter und städtischer Händler, von denen vieleeine breite Palette verschiedener Marken führen.
Andere produktive Verwendungsmöglichkeitenvon Wärme und Elektrizität
Produktive Nutzungen von Wärme und Elektrizität im Klein-gewerbe, in der Landwirtschaft, der Telekommunikation sowieim Gesundheits- und Bildungswesen in ländlichen Gebietenstoßen auf wachsendes Interesse als mögliche Einsatzbereichemoderner Regenerativtechnologien. Beispiele für gewerblicheAnwendungen sind die Seidenproduktion, die Ziegelbrennerei,die Trocknung von Kautschuk, die handwerkliche Produktion,Nähen, Schweißen und Holzbearbeitung. Beispiele für Anwen-dungen in der Landwirtschaft und der Lebensmittelverarbeitungsind die Bewässerung, die Trocknung von Lebensmitteln, Getrei-demühlen, Herde und Öfen, die Eisherstellung, Weidezäune undMilchkühlung. Zu den Anwendungen im Gesundheitsbereichgehören Impfstoffkühlung und Beleuchtung, zu den Kommuni-kationsanwendungen Dorfkinos, Telefone, Computer undRundfunk. Andere Einsatzbereiche auf Gemeindeebene sind dieBeleuchtung von Schulen und Straßen sowie die Trinkwasser-aufbereitung. Trotz dieser Vielfalt potenzieller Anwendungensind die bestehenden Projekte immer noch kleinere Demonstra-tionsvorhaben. In den meisten Fällen steht die großtechnischeEntwicklung dieser Anwendungen zu nachhaltigen oder kom-merziell replizierbaren Bedingungen immer noch aus.
Während die Verwendung von Regenerativstrom für Be-leuchtungszwecke, für Wasserpumpen, für die medizinischeKühlung und als Antriebsenergie mehr Beachtung zu findenbeginnt, wird die Anwendung moderner erneuerbarer Energienzur Deckung des Heizbedarfs immer noch viel weniger disku-tiert oder realisiert. Traditionelle Biomassebrennstoffe werdenzur Wärmeproduktion und für wärmeabhängige Leistungen wieKochen, Raumheizung, Ernteguttrocknung, Rösten, Verarbeitenlandwirtschaftlicher Erzeugnisse, Darren und Trocknen sowiefür die industriell-gewerbliche Lebensmittelverarbeitung ver-wendet. Solare Raumheizung und fortschrittliche Biomassetech-nologien beginnen gerade erst die Aufmerksamkeit der Entwick-lungshilfeorganisationen zu erregen. Auch die Regierungen derEntwicklungsländer richten ihren Blick vermehrt auf dieseBereiche. So hat die indische Regierung umfassende Förderpro-gramme für den Einsatz von Biomasse zur Erzeugung vonStrom, Wärme und Antriebskraft in ländlichen Gebieten ein-schließlich Verbrennung, Kraft-Wärme-Kopplung und Verga-sung auf den Weg gebracht. Zielobjekte dieser Förderprogram-me für ländliche Energie sind alle Bedarfsarten im Haushalt, inder Gemeinde und in der Produktion in Hunderten von ländli-chen Bezirken.
Ein anschauliches Beispiel für Anwendungen im Gesund-heits- und Bildungsbereich ist das Weltbank/GEF-Projekt„Uganda Energy for Rural Transformation“. Das Projekt stelltEnergie für medizinische Geräte, Personalunterkünfte, Be-leuchtung, Kühlketten, Sterilisieranlagen und Telekommuni-kationseinrichtungen bereit und erbringt für das Gesundheits-
* In den Gesamtzahlen für Solar Home Systems sind über eine halbe Million Haushalte in Indien und in anderen Ländern mit „Solarleuchten“ zusätzlich zu fest installiertenhäuslichen Anlagen enthalten. Für Solar Home Systems werden im Allgemeinen Kompaktleuchtstofflampen verwendet, doch es wächst das Interesse an LEDs mit niedrigerWattzahl und an Kaltkathoden-Leuchtstofflampen für preisgünstige Solarleuchten sowie an Inselanlagen mit geringerer PV-Leistung.
060131.ps - 2/1/2006 10:38 AM

NETZUNABHÄNGIGE LÄNDL. EE-SYSTEME ERNEUERBARE ENERGIEN 2005 GLOBALER STATUSBERICHT SEITE 33
ministerium den Nachweis für die wirtschaftliche Tragfähigkeitsolcher Anwendungen. Im Bildungsbereich liefert die Photo-voltaik Strom für die in der beruflichen Bildung eingesetztenGeräte, für den Beleuchtungsbedarf in Abendschulen und fürPersonalwohnungen. Zu den übrigen Anwendungsbereichengehören Wasserpumpen und Kleinunternehmen. Ein weiteresgutes Beispiel ist das „Telesecundaria“-Programm in Mexiko.Es soll Dorfschulen durch Fernunterrichtsprogramme unter-stützen; viele Schulen im ländlichen Raum sind auf die Photo-voltaik angewiesen, um Kommunikations- und sonstige Ein-richtungen für den Fernunterricht mit Strom zu versorgen. InGuatemala, Honduras und Bolivien ist ein neues „Telecenter“-Modell im Entstehen, das öffentliche Einrichtungen mit kom-merziellen Telefondiensten kombiniert.
Ansätze zur finanziellen Unterstützung kleiner und mittle-rer Unternehmen, die produktive Tätigkeiten im Bereich erneu-erbare Energien ausüben, haben in den letzten Jahren durchProgramme wie das von UNEP/UNF initiierte „Rural EnergyEnterprise Development“-Programm (REED) in Afrika, Brasili-en und China große Beachtung gefunden. Diese Unternehmenbieten eine Vielzahl von Dienstleistungen und Produkten an,darunter Solar Home Systems, Wasserpumpen, solare Erntegut-trocknung, mit Biokraftstoff betriebene Motoren für Mahl- undSchleifwerke, Solarbäckereien, Briketts und Pellets aus Biomasseund andere einkommenschaffende Anwendungen. Durch Ge-berprogramme und besseren Zugang zu Geschäftsbankkreditenwächst die Zahl dieser Unternehmen in ländlichen Gebieten.
Elektrifizierung des ländlichen Raums:Instrumente und Programme
Ländliche Elektrifizierungsinstrumente und -programme aufnationaler Ebene im Verbund mit internationalen Geberpro-grammen nutzen erneuerbare Energien als Komplementärins-trument zu „Zugangsstrategien“, um wachsende Anteile ländli-cher Bevölkerungsgruppen zu versorgen, die keinen Zugang zuzentralen Stromnetzen haben. Schätzungsweise 360 Mio. Haus-halte weltweit verfügen noch immer nicht über einen solchenZugang. Zu den wichtigsten Elektrifizierungsoptionen gehörender Ausbau des Stromnetzes, Dieselgeneratoren in Kleinnetzen,regenerative Energieerzeugung in Kleinnetzen (Sonne, Windund/oder Biomassevergasung, manchmal in Verbindung mitDieselkraft) sowie die regenerative Stromerzeugung für denhäuslichen Bedarf (Solar Home Systems und Windkraft-Klein-anlagen). Oft sind die Kosten eines herkömmlichen Netzaus-baus untragbar; in Kenia beispielsweise liegen die Durch-schnittskosten eines Neuanschlusses für einen ländlichen Haus-halt sieben Mal so hoch wie das nationale Pro-Kopf-Einkom-men. [Anm. 44]
In vielen Entwicklungsländern nimmt das Interesse an derNutzung von Regenerativtechnologien zur Versorgung ländli-cher und entlegener Regionen als kostengünstige Alternative zurNetzerweiterung sprunghaft zu. Gleichzeitig wird zunehmendanerkannt, dass private Investitionen allein nicht ausreichenund dass staatliche Subventionen und Programme eine zentraleRolle spielen, was durch Entwicklungsziele und verbindlichestaatliche Regelungen für einen umfassenden Zugang zu Elek-
trizität belegt ist. Ein Projektmanager der Weltbank erklärtedazu: „Alle unsere Empfängerländer in Lateinamerika sagtenuns, ihnen sei klar geworden, dass sie Beihilfen und ordnungs-politische Maßnahmen brauchen, um die ‚letzten 20 Prozent’ihrer noch nicht mit Strom versorgten ländlichen Bevölkerungzu erreichen, u. a. auch mit erneuerbaren Energien.“
In mehreren Ländern, insbesondere in Lateinamerika, sehenländliche Elektrifizierungsprogramme für einen Teil der zu elektrifizierenden Haushalte ausdrücklich umfangreiche Inves-titionen in Inselanlagen vor. Die Regierungen ermitteln die geo-graphischen Gebiete in ländlichen Regionen, in denen ein Netz-ausbau unrentabel ist, und verabschieden gezielte RE-Program-me und RE-Subventionen in diesen Gebieten als Ergänzung zuElektrifizierungsprogrammen durch Leitungsausbau. Brasilienbeispielsweise plant, im Rahmen seines „Luz para Todos“-Pro-gramms bis 2008 rund 2,5 Mio. Haushalte zu elektrifizieren(etwa 700.000 sind bereits versorgt), und hat für 200.000 bzw.rund 10 Prozent dieser Haushalte erneuerbare Energien vorgese-hen. Wie schon erwähnt, versorgt China mit seinem „TownshipElectrification Program“, das im Wesentlichen 2004 abgeschlos-sen wurde, etwa eine Million Menschen in ländlichen Gebietenmit Strom aus erneuerbarer Energie. Das indische „RemoteVillage Electrification Programme“ sieht die Elektrifizierung von18.000 Dörfern vor, zum Teil mit Regenerativtechnologien wieBiomassevergasungsanlagen.
Mehrere lateinamerikanische Länder, darunter Bolivien,Chile, Guatemala, Mexiko, Nicaragua und Peru, haben unlängstneue Elektrifizierungsprogramme für den ländlichen Raum auf den Weg gebracht bzw. neu aufgelegt. Die meisten dieserLänder sind bemüht, erneuerbare Energien als Standardoptionneuer ländlicher Elektrifizierungsmaßnahmen zu etablieren.Chile zum Beispiel, das vor dem Beginn der zweiten Etappeeines landesweiten ländlichen Elektrifizierungsprogramms steht,hat vor kurzem erneuerbare Energien als Schlüsseltechnologieanerkannt. Den Behörden und Versorgungsunternehmen istbewusst geworden, dass angesichts der vorgesehenen verstärktenEinbeziehung erneuerbarer Energien in die ländliche Elektri-fizierung rasch ein rechtlicher und ordnungspolitischer Rahmengeschaffen werden muss. In der Tat wurden in Argentinien,Bolivien, Brasilien, Chile, Guatemala und Nicaragua 2004 und2005 neue Gesetze und Verordnungen verabschiedet.
Zu den asiatischen Ländern mit expliziten Regelungen fürden Einsatz erneuerbarer Energien im Rahmen der ländlichenElektrifizierung gehören beispielsweise Bangladesch, China, In-dien, Nepal, die Philippinen, Sri Lanka, Thailand und Vietnam.Einige dieser Länder finanzieren Programme mit multilateralerHilfe und führen technische Hilfsmaßnahmen und Förderpro-gramme durch. Die Philippinen verfolgen seit 1999 eine Strate-gie, die auf die vollständige Elektrifizierung der Dörfer bis 2007abzielt, und haben erneuerbare Energien ausdrücklich in dieseStrategie einbezogen. Sri Lanka hat es sich zum Ziel gesetzt, 85Prozent der Bevölkerung Zugang zu Elektrizität zu verschaffen,und bereits begonnen, ländliche Solar Home Systems direkt zusubventionieren. Die thailändische Regierung beschloss 2003,die verbleibenden 300.000 netzfernen Haushalte im Land bisEnde 2005 mit Inselanlagen zu elektrifizieren, und hat diesesZiel 2004 fast zur Hälfte erreicht.
060131.ps - 2/1/2006 10:38 AM

SEITE 34 ERNEUERBARE ENERGIEN 2005 GLOBALER STATUSBERICHT GLOSSAR
Biodiesel. Biodiesel wird als Kraftstoff für dieselbetriebenePKW, LKW, Busse und sonstige Motorfahrzeuge verwendetund aus Ölsaaten wie Soja, Raps (Canola), Senf oder anderenPflanzenölprodukten wie z. B. gebrauchtem Speiseöl herge-stellt. In einigen Ländern besteht auch die Möglichkeit, Kokos-öl als Dieselzusatz zu verwenden.
Biogasanlage. Wandelt tierische und pflanzliche Abfälle in Gasum, das für Beleuchtungszwecke, zum Kochen, zum Heizenund für die Erzeugung von Strom genutzt wird.
Biomassestrom und -wärme. Erzeugung von Strom und/oderWärme aus fester Biomasse wie etwa Abfällen aus der Land-und Forstwirtschaft, Energiepflanzen und den organischenBestandteilen von Industrie- und Siedlungsabfällen. AußerdemStromerzeugung aus Biogas (Biogas kann auch direkt Prozess-wärme liefern, doch in den Vereinigten Staaten und in Europawird es überwiegend zur Stromerzeugung verwendet). „Mit-verbrennung“ bedeutet Verbrennung fester Biomasse in dersel-ben Anlage wie fossile Brennstoffe.
Einspeisevergütung. System der Festlegung eines Fixpreises,zu dem Stromerzeuger Regenerativstrom (EE-Strom) ins Ver-sorgungsnetz einspeisen können. In manchen Fällen sind festeTarife vorgesehen, in anderen feste Zuschläge zu den Markt-tarifen oder den kostenbasierten Tarifen. Manche Systemesehen beides vor.
Ethanol. Ein aus Biomasse (in der Regel Mais, Zuckerrohroder Weizen) hergestellter Kraftstoff, der in begrenztem Um-fang Normalbenzin ersetzen (siehe Gasohol) oder in Reinformin entsprechend umgerüsteten Fahrzeugen eingesetzt werdenkann.
Gasohol. Eine Mischung aus Benzin und Ethanol, in der Regelmit 10–25 Prozent Ethanol (wird als E10, E25 usw. bezeich-net).
Geothermiestrom und -wärme. Aus dem Erdinneren nachoben dringende Wärmeenergie – in der Regel in Form vonheißem Wasser oder Dampf –, die zur Erzeugung von Stromoder als Direktwärme für Gebäude, für die Industrie und fürdie Landwirtschaft genutzt werden kann.
Gigawatt (GW), Gigawattstunde (GWh), Gigawatt thermisch(GWth). Siehe Megawatt, Kilowattstunde, Megawattthermisch.
Green Power Purchasing. Freiwilliger Bezug von Ökostromdurch private, gewerbliche, staatliche oder industrielle Kunden,entweder beim Versorgungsunternehmen (siehe Utility GreenPricing), bei Dritterzeugern erneuerbarer Energie (auch GreenMarketing genannt) oder mittels „grüner“ Zertifikate (Renew-able Energy Certificates). Beim Utility Green Pricing oder beimVerkauf zu Wettbewerbspreisen wird der Strombedarf des
Kunden durch Einspeisung einer entsprechenden Erzeugungs-menge erneuerbarer Energie ins Stromnetz gedeckt. Bei grü-nen Zertifikaten kann die Erzeugung erneuerbarer Energieüberall stattfinden, d. h., es muss nicht unbedingt dasselbeStromnetz sein.
Große Wasserkraft. Elektrizität aus abwärts fließendem, in derRegel hinter einem Sperrwerk aufgestautem Wasser. Über dieGrenze zwischen großer Wasserkraft und kleiner Wasserkraftbesteht international keine Einigkeit, jedoch bewegen sich dieoberen Grenzwerte zwischen 2,5 und 50 MW, wobei 10 MWimmer mehr zur Norm wird.
Handelbare Zertifikate für Strom aus erneuerbaren Energien(EE-Zertifikate, grüne Zertifikate). Ein Zertifikat entsprichtder zertifizierten Erzeugung einer Einheit erneuerbarer Energie– in der Regel eine MWh. Die Zertifikate ermöglichen denHandel mit Erneuerbaren-Verpflichtungen zwischen Verbrau-chern und/oder Erzeugern, und auf einigen Märkten wie z. B.dem US-amerikanischen kann jeder die Green Power Attri-butes, d. h. die „grünen Eigenschaften“ des Stroms aus erneu-erbaren Energien, unabhängig vom tatsächlich geliefertenStrom kaufen.
Kapitalsubventionen oder Zuschüsse für Verbraucher.Einmalzahlungen des Staates oder des Versorgungsunter-nehmens decken einen Teil der Kapitalkosten einer Investitionz. B. in eine solarthermische Anlage oder eine Aufdach-Photo-voltaikanlage.
Kilowattstunde (kWh). Maßeinheit für erzeugte oder ver-brauchte Energie. Außerdem die gebräuchlichste Einheit fürden Endverbraucher-Strompreis (Cents/kWh).
Klein-/Kleinst-/Micro-/Picowasserkraft. Siehe große Wasser-kraft. Kleine Wasserkraft bedeutet normalerweise < 10 MW,Kleinstwasserkraft < 1 MW, Microwasserkraft < 100 kW undPicowasserkraft < 1 kW. Picowasserkraft erfordert in der Regelkeine Stauanlage; sie wird mit der Energie des fließendenWassers erzeugt.
Megawatt (MW). Einheit der Stromerzeugungsleistung. Stellteinen momentanen Leistungsfluss dar und darf nicht mit denEinheiten für erzeugte Energie (d. h. MWh oder Megawatt-stunden) verwechselt werden.
Megawatt thermisch (MWth). Einheit der Wärmeabgabeleis-tung zur Messung der potenziellen Leistung einer Heizungs-anlage, die z. B. ein Gebäude oder ein Viertel mit Wärme ver-sorgt. Seit neuerem zur Messung der Leistung von solarenWarmwasserbereitungs-/Heizungsanlagen verwendet. Stellteinen momentanen Wärmefluss dar und darf nicht mit denEinheiten für die erzeugte Wärme (d. h. MWth oder Mega-wattstunden thermisch) verwechselt werden.
GLOSSAR
060131.ps - 2/1/2006 10:38 AM

GLOSSAR ERNEUERBARE ENERGIEN 2005 GLOBALER STATUSBERICHT SEITE 35
Moderne Biomasse. Technologien zur Nutzung von Biomasse,die nicht zu den Technologien für die traditionelle Biomasse-nutzung zählen; dazu gehören die Biomasse-Kraft-Wärme-Kopplung zur Erzeugung von Strom und Wärme, die Verga-sung von Biomasse, Anaerobfermenter zur Biogaserzeugungund die Erzeugung flüssiger Biotreibstoffe für Kraftfahrzeuge.
Multilaterale Organisation. Bezieht sich im Allgemeinen aufinternational tätige Organisationen, die sich mit der Bereit-stellung von Entwicklungs-, Umwelt- oder Finanzhilfe befassen(z. B. die Weltbank) oder internationale Übereinkünfte odervölkerrechtlicher Verträge aushandeln (z. B. die VereintenNationen und ihre Sonderorganisationen).
Net Metering. Dieses Verfahren ermöglicht einen bidirektiona-len Stromfluss zwischen Stromverteilungsnetz und eigenerzeu-gendem Kunden. Übersteigt der momentane Verbrauch dieEigenerzeugung, läuft der Stromzähler vorwärts. Ist hingegendie Eigenerzeugung größer als der Eigenbedarf, läuft derStromzähler rückwärts und der überschüssige Strom wird insNetz eingespeist. Der Verbraucher zahlt nur für seinenNettoverbrauch im jeweiligen Abrechnungszeitraum und darfin manchen Fällen die Nettoerzeugung auf den Folgemonatübertragen.
Production Tax Credit (PTC) - Steuergutschrift für regene-rativ erzeugten Strom. Hierbei erhält der Investor oder derEigentümer einer förderungswürdigen Anlage einen jährlichenSteuerbonus, der sich nach der von der Anlage erzeugtenStrommenge richtet.
Renewables Portfolio Standard (RPS). Diese Quotenregelungsieht vor, dass ein Mindestanteil der verkauften Stromerzeu-gung oder der installierten Leistung aus erneuerbarer Energiebestehen muss. Die verpflichteten Energieversorgungsunter-nehmen (EVU) müssen die Erfüllung des Ziels entweder durchEigenerzeugung, durch Stromzukäufe bei anderen Erzeugernoder durch Direktverkäufe Dritter an die EVU-Kunden ge-währleisten. In der Regel obliegen die RPS-Verpflichtungenden letztbeliefernden Stromhändlern.
Solar Home System (SHS). Eine Inselanlage mit einemDachkollektor, einer Batterie und einem Laderegler, die kleine-re Strommengen für netzferne Haushalte in ländlichen Regi-onen erzeugt. Die Batterieladung eines Tages deckt typischer-weise den abendlichen Strombedarf für Beleuchtung (beiVerwendung stromsparender kompakter Leuchtstofflampen),Fernsehen usw.
Solar-/Photovoltaik(PV)-Kollektoren/-Module/-Zellen.Wandeln Sonnenlicht in Elektrizität um. Der kleinste Bausteinsind die Zellen, die zu Modulen und Kollektorfeldernverknüpft werden.
Solare Warmwasserbereitung/Heizung. Auf dem Dachbefindliche Sonnenkollektoren erzeugen warmes Wasser, das inTanks gespeichert und sowohl für die häusliche Warmwasser-versorgung als auch für die Beheizung genutzt wird.
Steuergutschrift auf Investitionen. Ermöglicht den vollständi-gen oder teilweisen Abzug von Investitionen in erneuerbareEnergien von der Steuerschuld oder vom Einkommen.
Traditionelle Biomasse. Unbehandelte Biomasse wie Abfälleaus der Land- und Forstwirtschaft, gesammeltes Brennholzund Tierdung, die vor allem in ländlichen Gebieten in Kochernoder Öfen verbrannt wird, um Wärmeenergie zum Kochenund Heizen und für die landwirtschaftliche und die industriel-le Verarbeitung zu erzeugen.
Utility Green Pricing. Ein Energieversorgungsunternehmen(EVU) bietet seinen Kunden eine Auswahl von Strompro-dukten mit unterschiedlichen EE-Anteilen zu unterschiedli-chen Preisen an (d. h., das Unternehmen gewährleistet, dass esgenügend erneuerbare Energie erzeugt oder kauft, um denBedarf aller Ökostromkunden decken zu können).
Ziel für erneuerbare Energien. Verpflichtung, Plan oder Zieleines Landes, bis zu einem in der Zukunft liegenden Termineinen bestimmten Anteil erneuerbarer Energien an der Ener-gieversorgung zu erreichen. Einige Ziele sind gesetzlich veran-kert, andere von Genehmigungs-/Aufsichtsbehörden oderMinisterien festgelegt. Können in unterschiedlicher Form mitunterschiedlich ausgeprägter Vollzugskraft vorliegen. Werdenauch „Planziele“, „Entwicklungsziele“ oder „Verpflichtungen“genannt.
060131.ps - 2/1/2006 10:38 AM

GLOBALER STATUSBERICHT 2005
ERNEUERBARE ENERGIEN
Dieser Bericht sowie seine Übersetzung ins Deutsche wurden gefördert durch:
GLOBALER STATUSBERICHT 2005
ERNEUERBARE ENERGIEN
Bericht des Worldwatch Institute für das REN21-Netzwerk
Hauptautor: Eric Martinotwww.ren21.net


21世紀のための自然エネルギー政策ネットワーク(REN21)
―――――――――――――――――――――――――――――――――――――――――
21世紀のための自然エネルギー政策ネットワーク(REN21)は、自然エネルギーに関する国
際的なリーダーシップを取るための話し合いの場を提供することを目的とする、世界的な政策ネ
ットワークである。当ネットワークは、準国内、国内、国際的なレベルでの政策策定及び意思決
定を強化することで、発展途上国及び先進工業国における自然エネルギーの急速な拡大を推し進
めることを目指している。
REN21は、全ての関係者及び自然エネルギーに尽力する利害関係者に開かれており、意見や
情報が共有され、自然エネルギーの世界的な促進のための協力と行動が強化される環境づくりを
可能にし、熱心に取り組む人々のネットワークである。REN21は各国政府、国際制度及び機関、
パートナーシップとイニシアチブ、その他の政治レベルに関わる利害関係者とを結び付けている。
REN21は、活動体そのものではないが、自然エネルギーの普及活動に関わる各種関係を進展さ
せる組織である。
世界的政策ネットワークの設立は、2004年にボンで開かれた自然エネルギー国際会議政治宣
言の中に採り入れられており、2005年 6月にコペンハーゲンにおいて正式に発足した。
REN21運営委員会
―――――――――――――――――――――――――――――――――――――――――
Thomas Becker
デンマーク環境省
Jackie Jones
イギリス環境・食糧・地方事
業省
Peter Rae
世界風力エネルギー協会
(WWEA)
Mohammed Berdai
モロッコ再生可能エネルギー
開発センター
Stephen Karekezi
アフリカエネルギー政策研究
ネットワーク(AFREPREN)
Artur Runge-Metzger
欧州委員会(EC)環境総局
気候・オゾン・エネルギー部
門
James Cameron
気候変動資本
Li Junfeng
中国国家発展・改革委員会
(NDRC)・エネルギー研究所、
中国自然エネルギー産業協会
Jamal Saghir
世界銀行「エネルギーと水」
部門

Paulo Cypriano
在独ブラジル大使館
Susan McDade
国連開発計画(UNDP)
Steve Sawyer
グリーンピース 「気候とエ
ネルギー」部門
Michael Eckhart
アメリカ再生可能エネルギー
委員会
Jennifer Morgan
世界自然保護基金(WWF)
気候変動プログラム
Ernst-Christoph Stolper
持続的発展のための地方政
府ネットワーク
David Hales
ワールドウォッチ研究所
(WWI)
Paul Mubiru
ウガンダ・エネルギー鉱物開
発省
Griffin Thompson
アメリカ国務省
Rainer Hinrichs-Rahlwes
ドイツ連邦環境・自然保護・
原子炉安全省
Rajendra Pachauri
インド・エネルギー資源研究
所
Arthouros Zervos
欧州再生可能エネルギー評
議会(EREC)、世界風力会議
(GWEC)
Neil Hirst
国際エネルギー機関(IEA)
エネルギー技術協力部門
Wolfgang Palz
自然エネルギー世界会議
(WCRE)
Ton van der Zon
オランダ外務省 開発協力
機構(DGIS)
Michael Hofmann
ドイツ連邦経済協力開発省
Mark Radka
国連環境計画(UNEP) 技
術・産業・経済部
Richard Hosier
地球環境ファシリティ
(GEF)
本書を引用する場合の明記方法
―――――――――――――――――――――――――――――――――――――――――
REN21 Renewable Energy Policy Network. 2005. “Renewables 2005 Global Status Report.”
Washington, DC: Worldwatch Institute.
英語名称について
―――――――――――――――――――――――――――――――――――――――――
報告書中の組織名および略称などの正式名称(英語名称)は、表 9及び表 10の対訳表を参照
| RENEWABLE 2005 GLOBAL STATUS REPORT |
PAGE 4
| RENEWABLE 2005 GLOBAL STATUS REPORT |
PAGE 5
謝辞
主筆・研究ディレクター
―――――――――――――――――――――――――――――――――――――――――
Eric Martinot、ワールドウォッチ研究所(WWI)、清華大学
後援
―――――――――――――――――――――――――――――――――――――――――
REN21、ドイツ連邦環境・自然保護・原子炉安全省、ドイツ連邦経済協力開発省
製造・出版
―――――――――――――――――――――――――――――――――――――――――
ワールドウォッチ研究所
特別謝辞
―――――――――――――――――――――――――――――――――――――――――
清華大学、清華-BPクリーンエネルギー研究教育センター
研究者・各地域対応者一覧
―――――――――――――――――――――――――――――――――――――――――
Kyung-Jin Boo(韓国エネルギー経済研究所)、John Michael Buethe(ジョージタウン大学)、
Odon de Buen(メキシコ国立自治大学)、Akanksha Chaurey(エネルギー資源研究所(TERI))、
Red Constantino(グリーンピース・フィリピン)、Jose Etcheverry(デービッドスズキ財団)、
Uwe Fritche(エコ研究所)、Daniele Guidi(エコソルツィオーニ)、Katja Hünecke(エコ研究所)、
Tetsunari Iida(環境エネルギー政策研究所(ISEP))、Waeni Kithyoma(AFREPREN)、Liu Pei
(清華大学)、Samuel Martin(アジア技術研究所)、Jose Roberto Moreira(ブラジル・バイオ
マスユーザーネットワーク(BUN))、Miquel Muňoz(バルセロナ自治大学)、Mika Ohbayashi
(ISEP)、Derrick Okello(AFREPREN)、Killan Reiche(世界銀行)、Michael Rogol(マサチュ
ーセッツ工科大学、CLSAアジア太平洋マーケット)、Ikuko Sasaki(ISEP)、Janet Sawin(WWI)、
Klaus Schmidt(エコ研究所)、Fabby Tumiwa(インドネシア NGO電力部門再構築作業部会)、
Wang Yunbo(清華大学)
その他の寄稿者一覧
―――――――――――――――――――――――――――――――――――――――――
本報告書の作成に当たり、貴重なお時間を割いて、資料提供、また、本書への助言をいただいた

| RENEWABLE 2005 GLOBAL STATUS REPORT |
PAGE 6
次の方々に感謝します。
Molly Aeck(WWI)、Lily Alisse(IEA)、Dennis Anderson(インペリアル・カレッジ・ロンドン)、
Sven Anemüller(ジャーマンウォッチ)、Frederic Asseline(EU・中国エネルギー環境プログラ
ム)、Robert Bailis(カリフォルニア大学バークレー校)、Doug Barnes(世界銀行)、Morgan
Bazilian(アイルランド持続可能エネルギー)、Jeff Bell(分散型エネルギー世界連盟(WADE))、
Eldon Boes(アメリカ国立再生可能エネルギー研究所(NREL))、John Byrne(デラウェア大学)、
Anil Cabraal(世界銀行)、John Christensen(UNEP)、Wendy Clark(NREL)、Christian de Gromard
(フランス地球環境ファシリティ(FFEM))、Nikhil Desai, Jens Drillisch(ドイツ技術協力公社
GTZ)、Christine Eibs-Singer(E+Co)、Chas Feinstein(世界銀行)、Manfred Fischedick(ヴッ
パタール研究所)、Larry Flowers(NREL)、Lisa Frantzis(ナビガント・コンサルティング)、
David Fridley(ローレンス・バークレー国立研究所)、Lew Fulton(IEA)、Chandra Govindarajalu
(世界銀行)、Chris Greacen(パラン・タイ)、Gu Shuhua(清華大学)、Jan Hamrin(センタ
ー・フォー・リソース・ソリューションズ)、Miao Hong(世界銀行/GEF中国自然エネルギー
プロジェクト)、Thomas Johansson(ルンド大学)、Dan Kammen(カリフォルニア大学バーク
レー校)、Stephen Karakezi(AFREPREN)、Sivan Kartha(テラス研究所)、Marlis Kees(GTZ)、
Jong-dall Kim(キョンプック大学校)、June Koch(CMTコンサルティング)、Jean Ku(NREL)、
Lars Kvale(センター・フォー・リソース・ソリューションズ)、Ole Langniss, Dan Lieberman
(センター・フォー・リソース・ソリューションズ)、Li Hua(オランダ・エネルギー環境庁
(SenterNovem))、Li Junfeng(中国自然エネルギー産業協会)、John Lund(国際地熱協会(IGA)、
オレゴン技術研究所)、Subodh Mathur(世界銀行)、Paul Maycock(PVニュース)、Bob McCormick
(NREL)、Susan McDade(UNDP)、Tim Merrigan(NREL)、Alan Miller(国際金融公社)、Fred
Morse(モース・アソシエイツ)、Wolfgang Mostert, Hansjög Müller(GTZ)、Kevin O’Connor, Kathy
O’Dell, Ralph Overend(NREL)、Rolf Posorski(GTZ)、Mark Radka(UNEP)、Venkata Ramana
(ウィンロック・インターナショナル)、Jeannie Renne(NREL)、Jamal Saghir(世界銀行)、
Oliver Schaefer(EREC)、Michael Schlup(バーゼル持続可能エネルギー局(BASE))、Martin
Schöpe(ドイツ連邦環境・自然保護・原子炉安全省)、Rick Sellers(IEA)、Shi Pengfei, Qin Haiyan
(中国風力エネルギー協会)、Judy Siegel(エネルギー・セキュリティグループ)、Scott Sklar
(ステラ・グループ)、Brian Smith(NREL)、Virginia Sonntag-O’Brien(BASE)、Till Stenzel
(IEA)、Paul Suding(GTZ)、Blair Swezey(NREL)、Christof Tempe(エコ研究所)、Valérie Thill
(欧州投資銀行(EIB))、Molly Tirpak(ICFコンサルティング)、Dieter Uh(GTZ)、Eric Usher
(UNEP)、Claudia von Fersen (ドイツ復興金融公庫(KfW))、Bill Wallace(UNEP/GEF中
国自然エネルギープロジェクト)、Njeri Wamukonya(UNEP)、Xiaodong Wang(世界銀行)、
Wang Zhongying(中国エネルギー研究所)、Werner Weiss(AEE インテック)、Ryan Wiser(ロ
ーレンス・バークレー国立研究所)、Christine Woerlen (GEF)、Jeremy Woods(インペリア
ルカレッジ・ロンドン)、Dana Younger(国際金融公社)、Arthouros Zervos(EREC、欧州風力
エネルギー協会)

| RENEWABLE 2005 GLOBAL STATUS REPORT |
PAGE 7
目次
報告書要旨····································································································································· 9 1. 世界市場概観 ··························································································································· 12 2. 投資フロー ······························································································································· 28 3. 産業の潮流 ······························································································································· 34 4. 政策の展望 ······························································································································· 37 自然エネルギーの政策目標······································································································ 37 発電促進政策 ··························································································································· 40 太陽熱温水/暖房促進政策······································································································ 46 バイオ燃料促進政策 ················································································································ 48 グリーン電力購入とグリーン電力料金 ··················································································· 49 地方自治体による政策············································································································· 51
5. 農村地域(独立型)自然エネルギー ······················································································· 54 調理:改良型バイオマス調理ストーブ ··················································································· 55 調理と照明:バイオガス発酵槽 ······························································································ 56 電気、熱、動力:バイオマスガス化 ······················································································· 57 電気:村落規模の小規模系統システム/ハイブリッドシステム············································ 57 揚水、風力および太陽光発電 ·································································································· 58 電気:独立型の住宅用太陽光発電システム ············································································ 58 熱と電気のその他の生産への利用··························································································· 60 地域の電力供給政策とプログラム··························································································· 61 用語解説 ······································································································································ 63 対訳表·········································································································································· 66
図・表・補足
―――――――――――――――――――――――――――――――――――――――――
図 1 世界の一次エネルギーにおける自然エネルギーの割合 2004年 .................................. 12 図 2 自然エネルギー容量年間平均増加率 2000-2004年 ...................................................... 15 図 3 世界の太陽光発電容量 1994-2004年 ............................................................................ 15 図 4 世界の風力発電容量 1990-2004年................................................................................ 16 図 5 EU、上位 5カ国、発展途上国の自然エネルギー容量 2004年 .................................... 17 図 6 上位 10カ国の風力発電容量 2004年............................................................................ 18 図 7 各国の太陽熱温水/暖房容量シェア 2004年 ............................................................... 20

| RENEWABLE 2005 GLOBAL STATUS REPORT |
PAGE 8
図 8 1000人あたりの太陽熱温水システム容量....................................................................... 21 図 9 各国のエタノール生産量 2000年および 2004年 ......................................................... 22 図 10 自然エネルギーへの年間投資額 1995-2004年 ........................................................... 28 図 11 EU自然エネルギー目標値 2010年までの電力シェア ................................................ 38 ―――――――――――――――――――――――――――――――――――――――――
表 1 自然エネルギー指標 ......................................................................................................... 14 表 2 自然エネルギー技術の現状(特徴とコスト) ................................................................. 24 表 3 非 EU国の自然エネルギー目標値.................................................................................... 39 表 4 自然エネルギー促進政策.................................................................................................. 40 表 5 固定価格制を導入した国、州、地域の総数..................................................................... 42 表 6 RPSを導入した国、州、地域の総数............................................................................... 44 表 7 自然エネルギー目標や政策を行っている主要都市の例................................................... 52 表 8 農村地域(独立型)における一般的な自然エネルギー利用 ........................................... 54 表 9 正式名称対訳表 ................................................................................................................ 66 表 10 英語略称対訳表 .............................................................................................................. 79 ―――――――――――――――――――――――――――――――――――――――――
補足 1 世界情勢におけるボン行動プログラム ........................................................................ 32

| RENEWABLE 2005 GLOBAL STATUS REPORT |
PAGE 9
報告書要旨
本報告書は、2005年の世界における自然エネルギーの現状をまとめたものである。本書は、
投資、産業、政策、発展途上国の無電化の農村部(以下農村部(独立型))における自然エネル
ギーの現状を網羅している。本報告書はその目的から、分析や勧告、もしくは結論を導くもの
ではない。100 名以上の研究者と寄稿者が、数ヶ月にわたって調査と論評を行い、不確実性は
最小限にとどめている。REN21は、本書を活発な意見及び情報交換の手始めとして利用したい。
本書は、自然エネルギーについてのいくつかの驚くべき事実を明らかにし、また、近年の活
発な成長状況や従来のエネルギーに関連して増し続ける重要性が反映されている。
2004年には、世界中で約 300億ドルが自然エネルギー(大型水力を除く)に投資され、従来の電力部門への投資がおおよそ 1500億ドルである。加えて大型水力への投資は 200-250
億ドルにのぼり、そのほとんどは発展途上国である。
自然エネルギー電力の容量は、世界中で計 1億 6000万 kW(大型水力を除く)であり、全世界の電力部門の容量の 4%に当たる。発展途上国はこの容量の 44%の 7000万 kWを占め
る。
2004年には、大型水力を除く世界の自然エネルギーからの電力生産量は、世界の原子力発電所の生産量の 5分の 1に相当する(全世界の電力生産量の 16%を占める)。
世界で最も速く成長しているエネルギー技術は、系統連系型太陽光発電(PV)であり、2000年から 2004年には、既存容量が毎年 60%ずつ伸びており、日本、ドイツ、アメリカの 40
万世帯以上の屋根に設置されている。その次には風力発電が続き、毎年 28%ずつ発電容量
が増えており、特にドイツがこれを牽引しており、2004年現在 1700万 kWが設置されて
いる。
屋根に取り付けられている太陽熱パネルは、世界中で 4000万件近くの世帯に温水を提供しており、このほとんどが中国である。また、200万以上の地中熱ヒートポンプが 30カ国で
建物の冷暖房の目的で設置されている。それでも、バイオマス燃料を利用した暖房は、太
陽熱と地中熱を合わせた暖房の 5倍の量を世界で提供している。
バイオ燃料(エタノールとバイオディーゼル)の生産量は、2004年で 330億リットルを超え、世界のガソリン消費量の 1兆 2000億リットルの約 3%を占める。エタノールは、2004
年のブラジルにおける輸送車両の全燃料(ディーゼルを除く)の 44%を提供し、アメリカ
で販売された全ガソリンの 30%に混合されていた。
2004 年には、ヨーロッパ、アメリカ、カナダ、オーストラリア、及び日本において、450万人以上がグリーン電力を購入し、小売レベルもしくは認証制度によって自発的な電力購
入が行われた。
2004年における自然エネルギーの製造、稼動、維持から創出された世界中の直接の雇用機会は、バイオ燃料生産での 90万件を含む、170万件を超えた。
自然エネルギー、特に小水力、バイオマス、太陽光発電は、発展途上国の農村部に住む何千万人もの人々に電力、熱、動力源、揚水を提供し、また、農業や小規模産業、家庭や学

| RENEWABLE 2005 GLOBAL STATUS REPORT |
PAGE 10
校、及びコミュニティーのニーズに役立っている。1600万世帯がバイオガスを使って料理
し、明かりをともし、200万世帯が太陽光発電システムを利用している。
自然エネルギーを促進する政策は、この数年で急増している。14の発展途上国を含む少なく
とも世界の 48カ国が、何らかのタイプの自然エネルギーを促進する政策を採用している。2005
年までに、少なくとも 32カ国と 5つの州が、固定価格制を採用しており、その半分以上が 2002
年から実施されているものである。また、少なくとも 32 の州や県が、自然エネルギー割当基
準制度(RPS)を実施しており、その半数は 2003年から実施し、さらに、6カ国が 2001年か
ら国家レベルの RPS を実施している。直接資本投資への補助金、助成金、もしくは割戻しな
どの施策が、少なくとも 30 カ国で実施されている。アメリカのほとんどの州及び、少なくと
も 32 カ国が、自然エネルギーのための様々な種類の税制優遇策やクレジット制度を採用して
いる。アメリカでは、1995年以来、540万 kW以上の風力発電に税制優遇措置が適用されてい
る。
発展途上国の 10 カ国と、欧州連合(EU)の全 25 カ国、さらにアメリカとカナダの多くの
州を含む、世界で少なくとも 45 カ国が、自然エネルギーの政策目標を設定している。ほとん
どの目標値は電力生産量のシェアであり、2010年から 2012年までの期間で 5-30%を目指すも
のが典型的である。2010年までに EU全域で 21%の導入目標を掲げている。また、中国は 2010
年までに(大型水力を除く)全電力容量の 10%の導入を目標としており、現在の 3700 万 kW
から 2010年までに自然エネルギー容量が 6000万 kWとなることを意味する。
世界中の地方自治体もまた、公共部門の使用量または都市の全消費量に対する、自然エネル
ギーの将来的なシェアの目標値を導入しており、典型的には 10-20%の幅で目標値を設定して
いる。二酸化炭素削減目標値を設定した自治体もある。多くの自治体は、太陽熱温水や太陽光
を促進するための様々な政策を実施したり、自然エネルギーを都市計画に組み込むなどしてい
る。
ブラジルは、過去 25 年間バイオ燃料促進の世界的な牽引役となってきた。販売されるガソ
リンは全て、エタノールと混合しなければならないし、全てのガソリンスタンドは純粋なエタ
ノールとエタノールブレンドの両方を販売している。ブラジルの他にも、少なくとも世界で 20
の州と 2つの国(中国及びインド)が、車両燃料へのバイオ燃料の混合を義務付ける取り組み
を行っている。
自然エネルギーは大きなビジネスと化している。大型の商業銀行はこの動きに注目し始め、
ポートフォリオの貸付における自然エネルギーへの投資を「本流化」させようとしている銀行
もいくつか登場している。その他の大手投資機関は、自然エネルギー市場に参入し、ベンチャ
ーキャピタルの投資家や、モルガン・スタンレーやゴールドマン・サックスなどの主要な投資
銀行もこの動きに含まれている。近年の大型の投資や買収は、ゼネラル・エレクトリック(GE)
やシーメンス、シェル、BP、サンヨー、シャープなどの主要な世界的企業によって行われてい
る。中国の電気会社と航空会社の大手 5 社は、風力ビジネスに参入することを決定した。60

| RENEWABLE 2005 GLOBAL STATUS REPORT |
PAGE 11
社の公的に取引している自然エネルギー会社、もしくは大手企業の自然エネルギー部門を合わ
せると、少なくとも 250億ドルの市場資本を有している。
毎年 5 億ドルが、自然エネルギープロジェクト、訓練、市場支援のための開発援助として、
発展途上国に提供されている。これら資金の大部分が、ドイツ復興金融公庫(KfW)や世界銀
行グループ、地球環境ファシリティ(GEF)を通して提供されており、その他の出資者やプロ
グラムも数多く存在する。
自然エネルギーの政府からの支援は、2004 年にはアメリカとヨーロッパを合わせて 100 億
ドルの注文があり、(「予算内の」)直接の支援と、(「予算外の」)市場に基づいた政策メカニズ
ムからの支援が含まれる。さらにこれには、毎年 7億ドル以上の研究開発費も含まれている。
多くの自然エネルギー技術のコストは、技術の向上と規模の経済により低下してきている。
太陽光と風力発電のコストは、今では 10年から 15年前の価格の約半分になっている。多くの
自然エネルギー技術は、良好な条件のもとでの従来型エネルギーの小売価格や卸売価格とも競
合できるものであり、従来型技術のコストも同様に下落している状況(燃料価格の上昇に起因
して)であるにもかかわらずそうなのである。
市場促進機関“Market Facilitation Organizations (MFOs)”はネットワーク化、情報交換、
市場研究、訓練、パートナー化、プロジェクトの促進、相談、資金調達、政策助言、その他の
技術支援を組み合わせ、自然エネルギー市場、投資、産業、政策の発展を支援する団体である。
[N45]のリストが示すように、少なくとも 150団体が世界中に MFOとして機能しており、この
中には、産業協会、非政府機関、多国間及び二国間開発機関、国際パートナーシップ及びネッ
トワーク、そして政府機関などが含まれている。

| RENEWABLE 2005 GLOBAL STATUS REPORT |
PAGE 12
1. 世界市場概観
自然エネルギーは、伝統的バイオマス、大型水力発電、そして「新」自然エネルギー(小水
力、現代的バイオマス、風力、太陽光、地熱、バイオ燃料)を合計すると世界の一次エネルギ
ーの 17%を供給している1,2(図 1参照)。
図 1 世界の一次エネルギーにおける自然エネルギーの割合 2004年
主に調理や暖房に用いられる伝統的バイオマスは、そのうちの約 9%を占めるが、バイオマ
スがより効率良く使用され、現代的なエネルギー形態に取って代わられつつあるので、地域に
よっては緩やかな増加、もしくは減少傾向にある。大型水力発電は 6%を少し下回り、増加は
緩やかで、主に途上国においてである3。「新」自然エネルギーは 2%であり、先進国や一部の 1 指示がない限り、本報告書において”自然エネルギー”とは“新”自然エネルギーを意味する。全世界的に承認された自然エネルギーの定義はないが、一般的に文書中では“新”自然エネル
ギーを自然エネルギーと語義的に用いる。例えば、BP社の世界エネルギー統計年鑑では自然エネルギーは大型水力を除いて定義されている。画期的な著作である国際エネルギー機関
(IEA)の『Renewables for power generation』(2003)でも大型水力は除かれている。一般的には 1万 kW以上を大型水力と定義するが、中国、ブラジルの小水力基準値に関する定義と報告に従い、本報告書の小水力統計は、中国では 5万 kW、ブラジルでは 3万 kWまでの発電所を含む。 2世界エネルギーバランスにおいて大型水力やその他の自然エネルギー発電技術を考慮する方
法論によって、自然エネルギーの世界一次エネルギーに占める合計割合は 17%ではなく13-14%になり得る。根本的な問題は、一次エネルギー相当、もしくは電力相当のエネルギー価値を考慮するかどうかにある。 3 「途上国」は正確な用語ではないが、一般的に低所得国家のことをいう。一つの指標として

| RENEWABLE 2005 GLOBAL STATUS REPORT |
PAGE 13
途上国において急速に増加している。明らかに、これら 3つの自然エネルギーの形態はそれぞ
れ独自の特徴と傾向がある。本報告書では、「新」自然エネルギーを中心に、その大きな将来的
な潜在性と商業的利用促進に関する市場支援や政策支援の決定的な必要性を鑑み、焦点を当て
ていく4,5。[N1、N2]
自然エネルギーは 4つの異なる市場において従来型燃料と競合する。すなわち、発電、温水
や暖房、輸送燃料、そして農村地域(系統独立型)エネルギーである(表 1参照)。
発電に関し、自然エネルギーは発電容量の約 4%を占め、世界発電総量の約 3%を供給してい
る(大型水力発電は除く)。数千万の建築において温水や暖房は太陽、バイオマス、地熱によっ
て供給されている。太陽熱集熱器それ自体は、世界の約 4000 万世帯において現在使用されて
いる。バイオマスや地熱も産業や家庭、農業に熱を供給している。バイオマス輸送燃料の占め
る割合は少ないが、いくつかの国々では大きく貢献しており、特にブラジルでは、国内全土の
自動車(非ディーゼル車)の燃料消費量の 44%をサトウキビからのエタノールで供給している。
途上国では、1600 万世帯が灯油やその他の調理燃料の代わりにバイオガスを調理や照明に、
200 万世帯以上が太陽電池を照明に利用し、農産物加工を含むますます多くの小規模産業が小
規模バイオガス発酵槽からプロセス加熱や動力を得ている6。[N3]
世界銀行の援助に対して申請資格を有するかどうかである。本報告書では、途上国は非 OECD諸国と OECD加盟国のメキシコ、トルコであり、ロシアとその他の旧移行経済国は除く。 4 本報告書では、今日著しく世界規模で商業的に利用されている自然エネルギー技術を取り上げる。アクティブ太陽熱冷房(太陽熱室内空調とも呼ばれる)、集光型太陽熱発電(フレネルレ
ンズ付)、海洋温度差発電、潮力発電、波力発電、次世代型地熱発電、セルロース系エタノール、
などのその他多くの自然エネルギー技術も将来の商業的展望を示しており、限られた数量では
あるがすでに商業的利用されているのもある。太陽熱調理器(ソーラークッカー)は約 100万世帯で利用されているとされたが、最新のデータは入手が困難であった。加えて、パッシブソ
ーラー冷暖房は商業的に証明され、広く建築設計に実用されているが、本報告書では扱わない。
本報告書の次回編集があれば、これらの技術や実用に関しても多く取り上げるだろう。 5 本報告書の注釈や参照は、[N1]などのように文末に続く括弧内に指定される。完全な注釈や参照は 21世紀のための自然エネルギー政策ネットワーク(REN21)ウェブサイト上で見ることができる。www.ren21.net/globalstatusreport 6 独立型太陽電池は住宅用、産業用、信号や電信、そして消費者製品を含む。2004年には世界で、消費者製品に 7万 kW、信号や電信に 8万 kW、そして住宅用、産業用独立型利用に 18万kWが用いられた。

| RENEWABLE 2005 GLOBAL STATUS REPORT |
PAGE 14
表 1 自然エネルギー指標 指標
2004年末 累積容量 比較指標
発電 (百万 kW)
大型水力 720 世界発電容量=3800
小水力 61
風力 48
バイオマス 39
地熱 8.9
独立型太陽光 2.2
系統連系型太陽光 1.8
太陽熱 0.4
海洋(潮力) 0.3
160自然エネルギー発電容量総計(大型水
力除く)
温水/暖房 (百万 kWth)
バイオマス 220
太陽熱集熱器 77
地熱直接利用 13
地中熱ヒートポンプ 15
太陽熱温水器付住宅 4000万件 世界住宅総数=16億件
地中熱ヒートポンプ付建築 200万件
輸送燃料 (リットル/年)
エタノール生産量 310億
バイオディーゼル生産量 22億
ガソリン生産量総計
=1兆 2000億
農村地域(独立型)エネルギー
家庭用バイオガス消化槽 1600万
小規模バイオマスガス化装置 n/a
系統独立型世帯総数
=3億 6000万
住宅用太陽光発電システム 200万
太陽熱調理器(ソーラークッカー) 100万

| RENEWABLE 2005 GLOBAL STATUS REPORT |
PAGE 15
世界で最も急速に成長しているエネルギー技術は系統連系型太陽電池で、累積容量は 2000年
初めの 16万 kWから 2004年末の 180万 kWへ増加し、この 5年間の年間平均増加率は 60%
であった(図 2、図 3参照)。
図 2 自然エネルギー容量年間平均増加率 2000-2004年
図 3 世界の太陽光発電容量 1994-2004年

| RENEWABLE 2005 GLOBAL STATUS REPORT |
PAGE 16
同期間におけるその他の自然エネルギー技術も急速に成長した(年間平均)。風力は 28%(図
4参照)、バイオディーゼルは 25%、太陽熱温水/暖房は 17%、独立型太陽電池は 17%、地中
熱利用は 13%、エタノールは 11%である。バイオマスや地熱、小水力を含むその他の自然エネ
ルギー発電技術はより成熟しており、これまで通り年間 2-4%で増加している。バイオマス熱
供給もほぼ同様の増加率であるが、正確なデータは入手困難である。これらの自然エネルギー
の増加率と比較すると、化石燃料発電容量の年間増加率は典型的に 3-4%であり、大型水力発
電は 2%、2000年から 2003年における原子力発電容量の年間増加率は 1.6%となっている。[N3]
図 4 世界の風力発電容量 1990-2004年
大型水力を除いて、2004年の世界の自然エネルギー発電容量は合計 1億 6000万 kWであっ
た(図 5参照)。小水力と風力はそのうちの 3分の 2を占める。この 1億 6000万 kWは世界
の発電設備容量総計である 38億 kWと比較される値である。中国を含め途上国全体で 1億6000
万 kWのうち 7000万 kW(44%)を主にバイオマスや小水力が占めている。EUは 5700万 kW
(36%)で、多くは風力からである。上位 5カ国は中国(3700万 kW)、ドイツ(2000万 kW)、
アメリカ(2000 万 kW)、スペイン(1000 万 kW)、日本(600 万 kW)となっている。[N4、
N5]

| RENEWABLE 2005 GLOBAL STATUS REPORT |
PAGE 17
図 5 EU、上位 5カ国、発展途上国の自然エネルギー容量 2004年
大型水力発電は低コストエネルギー技術の 1 つであるが、環境上の制約や再定住への影響、
土地の利用可能性のため、多くの国で更なる増加が抑制されてきた。大型水力は、10 年前の
19%から減少してはいるが、2004 年においては、世界の電力発電量の 16%を供給した。大型
水力は 2004年世界で合計 7億 2000万 kWあり、歴史的に年間 2%をやや上回って増加してき
た(その増加率の半分は先進国)。ノルウェーは実質的に水力からすべての国内電力を得る国の
1つである。2004年水力発電上位 5カ国はカナダ(世界の水力発電量の 12%)、中国(11.7%)、
ブラジル(11.4%)、アメリカ(9.4%)、ロシア(6.3%)である。中国の水力発電の増加は電力
部門の急速な成長に対応してきた。中国は 2004年に約 800万 kWの大型水力を設置し、設備
容量(7400 万 kW)では最上位国となった。その他の途上国もまた大いに大型水力に投資し、
数多くの計画が建設中である。
小水力発電は 1世紀以上にわたって世界で発展してきた。世界の小水力発電容量の半分以上
は中国が占め、2004 年合計約 400 万 kW の小水力発電の建設ブームが進行中である。その他
の活発な国々は、オーストラリア、カナダ、インド、ネパール、ニュージーランドである。小
水力はよく無電化の農村部の電力利用に使われ、ディーゼル発電やその他の小規模発電設備に
取って代わったり、農村地域住民に初めて電気を供給したりする。ここ 2、3 年、環境影響を
最小化するために、小水力発電設備の水系への環境統合に更なる力が入れられ、新しい技術や
操業方法が組み入れられている。
風力市場は主に数カ国に集中し、2004年スペイン、ドイツ、インド、アメリカ、イタリアが
拡大を牽引している(図 6 参照)。ロシアやその他の経済移行国、中国、南アフリカ、ブラジ
ル、メキシコなどの国では、大規模な商業的市場の発展へ向けた第一歩が踏み出されようとし
ている。中国の場合、風力発電への投資のほとんどは、歴史的に寄付や政府援助によるものだ

| RENEWABLE 2005 GLOBAL STATUS REPORT |
PAGE 18
ったが、近年は民間投資への移行が進んでいる。その他の国々は風力発電ファーム設置の実験
段階で、将来の商業的市場の発展を目指している。[N6]
図 6 上位 10カ国の風力発電容量 2004年
洋上風力発電市場は近年出現したところである。約 60 万 kW の洋上風力発電が存在し、す
べてヨーロッパにある。最初の大規模な洋上風力発電ファーム(17 万 kW)は 2003 年にデン
マークで完成し、さらにドイツ、オランダ、イギリスなどのヨーロッパ諸国で 4000 万 kW 以
上の野心的な開発計画がある。[N6]
バイオマスによる発電や熱利用はヨーロッパでゆっくりと拡大しており、主にオーストリア、
フィンランド、ドイツ、イギリスが発展を促している。ドイツでの近年の廃材利用ブームは、
その資源基盤がほぼ利用されたので現在は頭打ちになっている。イギリスでは近年、混焼(石
炭火力発電設備で少量のバイオマスを燃焼すること)が増加してきた。継続した投資がデンマ
ーク、フィンランド、スウェーデン、アメリカ、さらにその他の OECD 諸国で行われている。
地域熱やコジェネレーションへのバイオマスの利用は、オーストリアやドイツなどの国々で拡
大してきた。スウェーデンでは、バイオマスにより 50%以上の地域熱需要を供給している。途
上国では、もみ殻やヤシ殻など農業廃棄物からの小規模発電や熱利用は一般的である。電気や
熱の生産にサトウキビのかすを利用することは、ブラジル、コロンビア、キューバ、インド、
フィリピン、タイなどの大規模砂糖産業国では重要である。ますます多くの小規模バイオマス
ガス化装置が農村地域で利用され始めている(先進国では高効率コンバインドサイクル火力発
電へのバイオマスガス化利用の実証もある)。バイオエネルギーの「コプロダクション」、すな
わち統合過程でのエネルギーと非エネルギー(飼料や産業用繊維)の生産への関心は大きくな

| RENEWABLE 2005 GLOBAL STATUS REPORT |
PAGE 19
っている。[N6]
小水力と同様に、地熱エネルギーは 1世紀もの間、発電と暖房に利用されてきた。少なくと
も 76カ国で地中熱利用、24カ国で地熱発電が利用可能である。100万 kW以上の地熱発電が
2000年から 2004年の間に追加され、フランス、アイスランド、インドネシア、ケニア、メキ
シコ、フィリピン、ロシアなどで顕著な増加が見られる。先進国における地熱発電容量の大部
分はイタリア、日本、ニュージーランド、アメリカに存在する。[N6]
地中熱直接利用設備の容量は 2000年から 2005年にかけてほぼ倍増し(1300万 kWthの増
加)、少なくとも新たに 13カ国で初めて地中熱利用が行われた。アイスランドは地中熱利用に
おいて世界を牽引し、地中熱から国内の全暖房需要の約 85%を供給している。トルコは 2000
年から国内の地中熱直接利用設備の容量を 50%増加し、現在では 7万世帯の需要に相当する熱
を供給している。既存の設備容量の約半分は地中熱ヒートポンプとして利用されている。建築
物の暖房や冷却へのこれらの利用は増加しており、ほぼ 200万台のヒートポンプが、主にヨー
ロッパやアメリカなど 30カ国以上で利用されている。
系統連系型太陽光発電は、支援的な政策に後押しされ、日本、ドイツ、アメリカの 3カ国に
集中している。2004年までに、これらの国の 40万の住宅が屋上用太陽光発電により系統へ送
電した。この市場は 2004年に約 70万 kW増加し、累積設備容量は 110万 kWから 180万 kW
になった。世界中でも商業用や公共用の建材一体型太陽光発電の実証はますます増加している。
典型的な例は、地下鉄の駅(100kW)、ガソリンスタンド(30kW)、太陽電池製造工場(200kW)、
消防署(100kW)、市庁舎(50kW)、展示場(1000kW)、美術館(10kW)、大学施設(10kW)、
刑務所(70kW)などである。[N7]
1990年代初頭から、集光型太陽熱発電市場が停滞しているが、カリフォルニア州では税制優
遇措置によって 35 万 kW の建設が行われた。最近では、イスラエル、スペイン、米国の商業
計画が収益の回復、技術の発展、そして潜在的投資を牽引している。2004年には、アリゾナ州
で 1000kW 規模のパラボラ型太陽熱発電装置の建設が始まり、1990 年代初期以来の新設の発
電所となった。スペインの市場が活気を見せており、2005 年には 2 つの 5 万 kW 規模のプロ
ジェクトに投資家たちが関心を寄せている。インド、エジプト、メキシコ、モロッコを含むい
くつかの発展途上国は、多国間援助によるプロジェクトを計画しているが、現状が不明確なま
まのプロジェクトもいくつかある。
太陽熱温水/暖房技術はますます広まってきており、特に中国、ヨーロッパ、イスラエル、
トルコ、日本の温水/暖房市場で大きく貢献している。その他の多くの国々でも小規模の市場
が存在する。世界の設置容量の計 60%を中国が占めている(図 7、図 8参照)。次いで EUが
11%、トルコが 9%、日本が 7%と続いている(全ての数字は集熱ガラス型のみにあてはまる)。
中国における 2004 年の販売総量は 1350 万㎡で、既存容量の 26%増である。中国市場では、
真空管型の太陽熱利用温水器が主流を占めており、2003 年には 88%のシェアを誇っている。
日本においては、既存の太陽熱容量は減少を続けており、新しく設置する面積は寿命を迎える

| RENEWABLE 2005 GLOBAL STATUS REPORT |
PAGE 20
面積を下回っている。ヨーロッパでは、160 万㎡が 2004 年に設置され、これは一部には、古
い既存のシステムが寿命を迎えたことに伴うものである。設置された集熱面積の 1 億 1000 万
㎡(熱生産量の 7700万 kWth)が世界中で約 4000万世帯に太陽熱利用温水として配給されて
いる。これはおよそ世界に存在する 16億世帯の 2.5%に相当する7。
太陽熱を利用した暖房がいくつかの国で広まってきているが、温水目的の利用が未だ主流で
ある。スウェーデンやオーストリアでは、年間設置集熱面積の 50%以上が、温水システムと暖
房システムを組み合わせたものである。ドイツでは、このような混合システムが年間設置容量
の 25-30%を占めている。中国の 5%以下のシステムが温水機能に加えて、暖房の機能も備えて
いる。
図 7 各国の太陽熱温水/暖房容量シェア 2004年
7 [N8]太陽熱利用温水/暖房は一般に、「太陽熱冷暖房」と呼ばれており、太陽熱利用冷房(太陽熱を利用した空調)もまた商用技術であることを強調するものである。本報告書は、太陽熱
利用温水が設置容量の大多数を占めるため、太陽熱利用温水/暖房という言葉を使用している。
世界の容量のうち、特にヨーロッパでは、暖房の機能を果たしているものもあるが、暖房は両
システムを組み合わせても総計の熱量は小規模に過ぎない。太陽熱を利用した冷房は、まだ商
用として広まっていないが、将来の利用を期待する声は高い。

| RENEWABLE 2005 GLOBAL STATUS REPORT |
PAGE 21
図 8 1000人あたりの太陽熱温水システム容量
2004年には、年間 1兆 2000億リットルのガソリンが世界中で生産されているのに対し、330
億リットルのバイオ燃料が生産された(図 9を参照)。ブラジルは 25年以上にわたってエタノ
ール燃料の世界的リーダー(及び主要なユーザー)である。2004 年には 150 億リットルのエ
タノールがブラジルで生産され、世界の生産総量の半分にわずかに満たない量を占める。ブラ
ジルの全ての燃料スタンドでは、純粋なエタノール(E95)と 25%のエタノールと 75%のガソ
リンを混合したガソホール(E25)の両方が販売されている。2004年には、ガソリンとほぼ同
量のエタノールが(非ディーゼルの)自動車用燃料として使用された。すなわち、エタノール
混のガソホール、または純粋なエタノールの販売がブラジルにおける全自動車用燃料販売数の
44%を占めたのである。2005年には、ガソリンの需要に比べ、エタノール燃料の需要は非常に
大きくなった。近年、ブラジルを筆頭輸出国として、エタノール燃料の世界的な取引の増加が
顕著になっている。ブラジルによって輸出されている 25億リットルのエタノールは、2004年
には世界貿易の半分以上を占めている。[N9]

| RENEWABLE 2005 GLOBAL STATUS REPORT |
PAGE 22
図 9 各国のエタノール生産量 2000年および 2004年
ブラジルの輸送燃料と自動車市場はともに進化している。純エタノール車の売り上げは 1990
年代に激しく落ち込んだ後、エタノール価格の著しい低下とガソリン価格の上昇、そして、ブ
ラジル自動車メーカーのいわゆる「フレックス燃料車」の発売によって、2000年代初期には再
び売り上げを伸ばし始めた。これらの車は、純エタノールでもエタノール/ガソリン混の燃料
のどちらでも使用することができる。2003年までに、これらの車は、ほとんどの自動車メーカ
ーから、純エタノール車またはガソホール車に競合する価格で売り出されている。「フレックス
燃料車」はドライバーからの広い支持を受けており、燃料供給の不確実性を気にしないドライ
バーもいる(1989年のエタノール不足や将来のオイルショックなど)。この車の売り上げは急
激に伸びており、2005年までにブラジルで販売された全ての新車の約半分が「フレックス燃料
車」であった。
アメリカは、世界第二のエタノール燃料の消費国であり生産国である。アメリカ市場の成長
は比較的最近の潮流であり、エタノールの生産容量は 1996年の年間 40億リットルから 2004
年には年間 140億リットルにまで増え続けている。最近の年間成長率は 15-20%にのぼる。2005
年までに 400近くの燃料スタンド(ほとんどは上部中西部に位置する)が、エタノール 85%と
ガソリン 15%混合の E85 やより多くのガソホール(E10)を販売した。2005 年までには、米
国で消費されている 1400億ガロンの(非ディーゼルの)自動車燃料のうち約 3%がエタノール
であった。さらに、アメリカで販売された全ガソリンの 30%が、より多くの州で使用中止を義
務付けられている MTBE(t-ブチルメチルエーテル)の代替酸素剤としてエタノール(E10)と
混合したものであった。オーストラリア、カナダ、中国、コロンビア、ドミニカ共和国、フラ
ンス、ドイツ、インド、ジャマイカ、マラウイ、ポーランド、南アフリカ、スペイン、スウェ
ーデン、タイ、ザンビアなどの国々でエタノール燃料が生産されている。[N9]

| RENEWABLE 2005 GLOBAL STATUS REPORT |
PAGE 23
2004年におけるドイツのバイオ燃料生産量は 50%増加し、世界の生産量を 20億リットル以
上引き上げた。ドイツの純バイオディーゼル(B100)は、燃料税が 100%免除され、現在ドイ
ツ国内では、1500以上の燃料スタンドで B100が販売されている。その他の主要なバイオ燃料
生産国は、オーストリア、ベルギー、チェコ共和国、デンマーク、インドネシア、マレーシア、
アメリカである。また、今後数年間に、バイオディーゼルの生産を始める国、または、既存の
容量の拡大を計画している国もある。[N9]
最も一般的な自然エネルギーの利用コストは、表 2に示されている通りである。これらのコ
ストの多くは、ベースロード発電のための 2-5セント/kWh幅であるが、ピーク時にはかなり
高額になり、系統独立型のディーゼル発電者にとってはなおさら高額になる8。割高なコストと
その他の市場への障害の存在は、自然エネルギーが引き続き政策支援を要していることを意味
する。しかしながら、経済的競争性は一定していない。自然エネルギーのコストが減少してい
るのと同じように、従来型エネルギー技術も同様に安くなってきているのである(例えば、ガ
スタービン技術の向上など)。将来の競争性についての根本的な不確実性は、従来型の発電コス
トに影響するが自然エネルギーのコストには影響しない、将来の石油価格に連動するものであ
る。
現在のところ、IEA は、自然エネルギーのコストの競争性について次のように述べている。
「大型水力や可燃性の再生可能物やごみ発電を除いて、自然エネルギーを利用した発電コスト
は卸売り電力価格と一般に競合しない。しかしながら、技術、利用、場所によっては、コスト
は系統電力価格や商用の熱生産と競合するものになる。最良の条件の下で、すなわち最適化さ
れたシステムデザイン、敷地、資源の有用性が整えば、バイオマス、小水力、風力、地熱発電
所は、2-5 セント/kWhの範囲で電気を生産できる。バイオマスの利用は、特定の敷地におい
ては、地熱発電と同様に競合できる。」技術がしっかりと確立された地域では、太陽熱温水器は
十分従来の温水器と競合できるが、太陽資源が乏しく暖房の需要が高い寒冷地では難しい。極
端に高い小売電力価格である場所を除いては(例:20-25 セント/kWh)、系統連系型の太陽
光発電はまだそれほど競合できるものではない。ブラジルのエタノールは現在十分にガソリン
と競合している9。 [N11]
8 特筆しない限り、ドル表示は全てアメリカドルでの表示である。 9 コストの比較は、外部コストを除いた経済コストに基づいている。財政コストの比較はかなり複雑であり、これは、政策支援、補助金、税制処遇、その他の市場条件を考慮しなければな
らないためである。歴史的なコストの減少は、本報告書の範囲を超える一連の原因によるもの
である。例えば、ブラジルのエタノール価格は、過去 20年間に渡って、生産性の向上と市場の成長のため減少した。

| RENEWABLE 2005 GLOBAL STATUS REPORT |
PAGE 24
表 2 自然エネルギー技術の現状(特徴とコスト)
技術 典型的な特徴
典型的な エネルギー コスト
(セント/kWh) コスト傾向とコスト削減の潜在性
発電
大型水力 設備規模:
1万 kW-1800万 kW
3-4 安定。
小水力 設備規模:
1000kW-1万 kW 4-7 安定。
風力(陸上) タービン規模:
1000-3000kW
ブレード直径:
60-100m
4-6 コストは世界容量が倍増する毎に
12-18%削減。現在、コストは 1990
年の半額である。タービン規模は
10年前の 600-800kWから増加し
た。更なる削減は立地最適化、ブレ
ード/発電機設計の改良、電子通信
による。
洋上風力 タービン規模:
1500-5000kW
ブレード直径:
70-125m
6-10 市場はまだ小さい。更なる削減は市
場の成熟と技術改善による。
バイオマス発
電 設備規模:1000-2万 kW 5-12 安定。
地熱発電 設備規模:1000-10万
kW
種類:バイナリー、
シングルフラッシュ、
ダブルフラッシュ、
自然対流
4-7 コストは1970年代から減少。現在、
経済的資源の利用コスト削減は探
査技術改良、掘削技術コストの減
少、熱抽出の向上による。
太陽光発電
(モジュール)
セルの種類と効率性:
単結晶:17%
多結晶:15%
薄膜:10-12%
― コストは設備容量が倍増する毎に
20%減少、または年に約 5%の減
少。2004年のコスト上昇は市場要
因による。更なるコスト削減は原
料、設計、過程、効率性、規模によ
る。
住宅用
太陽光発電
ピーク容量:2-5kW 20-40 継続したコスト減少は太陽電池モ
ジュールの価格低下やインバータ
ーシステム構成部品の改良による。

| RENEWABLE 2005 GLOBAL STATUS REPORT |
PAGE 25
技術 典型的な特徴
典型的な エネルギー コスト
(セント/kWh) コスト傾向とコスト削減の潜在性
太陽熱発電
(CSP)
設備規模:1000-10万
kW
種類:タワー、ディッ
シュ、トラフ
12-18
(トラフ)
コストは1980年代に導入された初
期設備の 44セント/kWhから減
少。更なる削減は規模と技術によ
る。
温水/暖房
バイオマス
熱利用
設備規模:1000-2万 kW 1-6 安定。
太陽熱
温水/暖房
規模:2-5㎡
種類:真空ガラスまた
は平板
サービス:温水、暖房
2-25 コストは、経済規模、新材料、大型
集熱器、品質改善により安定、また
は中程度に低い。
地熱熱利用 設備容量:1000-10万
kW
種類:バイナリー、
シングルフラッシュ、
ダブルフラッシュ、
自然対流、ヒートポン
プ
0.5-5 上記の地熱発電参照。
バイオ燃料
エタノール 原料:サトウキビ、
サトウ大根、
トウモロコシ、
小麦(将来はセルロー
ス)
20-30セント
/リットル
ガソリン相
当
ブラジルでは生産効率性によりコ
ストは減少、現在は 25-30セント
/相当リットル(砂糖)。しかしア
メリカでは 40-50セント(トウモ
ロコシ)で安定。その他の原料はよ
り高く、90セントまで上がる。セ
ルロースからのエタノール生産コ
スト削減が計画され、今日の 53セ
ントから 2010年以降は 27セント
となる。その他の原料は緩やかな減
少である。

| RENEWABLE 2005 GLOBAL STATUS REPORT |
PAGE 26
技術 典型的な特徴
典型的な エネルギー コスト
(セント/kWh) コスト傾向とコスト削減の潜在性
バイオ
ディーゼル
原料:大豆、菜種、
カラシ、廃植物油
40-80セント
/リットル
ディーゼル
相当
コストは 2010年以降、原料が菜種
や大豆の場合、35-70セント/リッ
トルディーゼル相当に減少し、廃油
の場合は約 25セント(現在)のま
まであろう。
農村地域(独立型)エネルギー
ミニ水力 設備容量:100-1000kW 5-10 安定。
マイクロ水力 設備容量:1-100kW 7-20 安定し、効率性向上により緩やかに
減少。
ピコ水力 設備容量:0.1-1kW 20-40 安定し、効率性向上により緩やかに
減少。
バイオガス
発酵槽
発酵槽規模:6-8㎥ n/a 安定し、建設の経済性やサービスイ
ンフラにより緩やかに減少。
バイオマス
ガス化装置
規模:20-5000kW 8-12 更なる技術発展により大幅なコス
ト削減の潜在性がある。
小規模風力発
電機
タービン規模:
3-100kW
15-30 技術進歩により緩やかに減少。
家庭用風力発
電機
タービン規模:0.1-1kW 20-40 技術進歩により緩やかに減少。
農村用小規模
系統システム
タービン規模:
10-1000kW
オプション:バッテリ
ーバックアップかディ
ーゼル
25-100 太陽光や風力の関連部品コスト削
減により減少。
独立型の住宅
用太陽光発電
システム規模:
20-100W
40-60 太陽光の関連部品コスト削減によ
り減少。

| RENEWABLE 2005 GLOBAL STATUS REPORT |
PAGE 27
注釈:すべてのコストは経済コストで、補助金やその他の政策奨励は除く。典型的なエネル
ギーコストはシステム設計、立地、資源利用可能性など最も良い状況におけるものである。
よりコストが減少する場合もあり、例えば、地熱や大型水力は 2 セント/kWh、バイオマス
発電は 3セント/kWhまで下がる。最適状況下でない場合、表中のコストよりも実質的に上
回る。典型的な系統連系型太陽光発電コストは年間 2500kWh/㎡に対するもので、多くの発
展途上国に当てはまる。コストは 1500kWh/㎡の立地(例えば南欧)で 30-50セント/kWh、
1000kWh/㎡の立地(例えば、イギリス)で 50-80セント/kWhとなる。

| RENEWABLE 2005 GLOBAL STATUS REPORT |
PAGE 28
2. 投資フロー
2004 年、自然エネルギー設備および設置に対し、約 300 億ドルが投資された(図 10 を参照)。太陽光発電パネル製造産業は 2004 年、更に 40 億-50 億ドルを新規発電プラントや設備
に投資し、エタノール産業では、新規製造プラントに対して、少なくとも数億ドルが投資され
た。これらの額を合わせると、毎年世界で発電へ投資されているおよそ 1100億-1500億ドルに
匹敵する額となる。従って、自然エネルギーは今日、世界の電力部門における投資の内 20-25%
を占めているのである。実際、国際エネルギー機関(IEA)が発行している「World Energy
Investment Outlook」の最新刊において、今後 30年間の OECD諸国における新規の発電投資
の内、自然エネルギーが実に 3分の 1を占めることになると予想している。自然エネルギーへ
の年間投資は 1995年度の 70億ドルから着実に増加し続けている。2004年の投資内訳は、風
力に対するものが約 95億ドル、太陽光は 70億ドル、小水力は 45億ドル、太陽熱温水/暖房
は 40 億ドル、そして地熱とバイオマス発電および熱利用については 50 億ドルとなっている。
こうした投資に加え、年間推定で 200-250億ドルが大規模水力へ投資されている。[N12]
図 10 自然エネルギーへの年間投資額 1995-2004年
自然エネルギー投資は今日、公的資金や民間資金といった極めて幅広い分野から行われてい
る。投資フローは技術標準化や、投資家の受容度や認知度の向上により支えられるようになっ
ており、それは数億ドル規模の風力発電ファームへの商業投資から、一般家屋向けのマイクロ
投資に至るあらゆる範囲に渡っている。最近の傾向のひとつとして、大規模な商業銀行が自然
エネルギー投資の機会を認識し始めているということが挙げられる。自然エネルギー投資の主
流となっている大規模銀行の例としては、ヒポ・フェラインス銀行、フォルティス、デクシア、
シティグループ、オーストラリア・ニュージーランド銀行、カナダ・ロイヤル銀行、またトリ

| RENEWABLE 2005 GLOBAL STATUS REPORT |
PAGE 29
オドス銀行などが存在し、これらの銀行は自然エネルギーに対する投融資に極めて積極的であ
る。伝統的な公益企業による投資については、これらは歴史的に自然エネルギーへの投資が遅
れたグループであったが、商業銀行同様ますます主流化している。自然エネルギーにおける公
的活動の例には、フランス電力公社やフロリダ電力、スコットランド電力、そしてスペインの
エンデサが挙げられる10。
主要な投資銀行を含む他の大規模投資家が自然エネルギー市場に参入し始めている。主流な
投資コミュニティの間では、自然エネルギーは重要なビジネスチャンスであるという確信が高
まってきている。例を挙げると、モルガン・スタンレーは現在スペインにおける風力発電事業
に対する投資を行っている。世界最大の投資会社のひとつであるゴールドマン・サックスは、
現在アメリカ合衆国で 400万 kWの風力容量を開発している風力開発会社のジルカ・リニュー
アブル・エナジーを買収した。GE コマーシャル・アンド・コンシューマー・ファイナンス・
アームスは自然エネルギーへの融資を開始している。また商業再保険会社は自然エネルギーを
対象とする新たな保険商品を開発している。
ベンチャーキャピタルの投資家たちもまた、自然エネルギーの存在を認識し始めている。ア
メリカ合衆国をベースとするクリーンエネルギー技術会社に対するベンチャーキャピタルから
の投資は、2004 年度はほぼ 10 億ドルに達した。特に太陽光パネルは 2001 年から 2004 年の
間のベンチャーキャピタルおよび設備投資において、併せて 100%の年間成長率を見せた。ベ
ンチャーキャピタルは部分的には将来の市場予測に従って行動しており、予測の中には 2010
年から 2014年の間に太陽光パネルおよび風力産業のいずれもが、400億-500億ドルに成長す
ることを示すものもある。[N13]
公的銀行組織による融資は民間投資と産業活動を刺激する重要な役割を担って来た。欧州投
資銀行(EIB)は、2002年から 2004年の 3年間に年間平均 6億 3000万ドルの融資(EU内の
プロジェクトに対する投資のほぼ全てに相当する)を行った主導的な公的銀行組織である。EIB
は 2002年から 2007年の間に、エネルギー部門の自然エネルギーに対する貸付の割合を、7%
から二倍の 15%へ引き上げることを計画している。また EUにおける新規の発電容量に対する
全融資のうち、自然エネルギー発電への貸付が占める割合を 2008年から 2010年までの間に、
現在の 15%から 50%にまで増加させることを計画している。[N14]
開発途上国における自然エネルギーに対する多国間や二国間、もしくは他の公的融資のフロ
ーは、近年およそ年間 5億ドルに達している。これらの資金の大半は、訓練や政策拡充、市場
発展、技術協力、そして他の非投資分野におけるニーズへの支援に用いられている。最も大き
な資金源となっているのが、ドイツ復興金融公庫(KfW)、世界銀行グループ、また地球環境フ
ァシリティ(GEF)の三つである。KfWは 2004年に、自然エネルギーに対する 1億 8000万 10 本報告はカーボンファイナンスもしくはクリーン開発メカニズム(CDM)事業をカバーしたものではない。続版において、こうした新たに台頭して来た投資手段を扱うことが可能となる
だろう。こうした投資手段を組み入れた自然エネルギー事業計画は幾つかの国々に存在してい
たし、行政規則や手続きの策定も行われている。

| RENEWABLE 2005 GLOBAL STATUS REPORT |
PAGE 30
ドルの資金を承認しており、それらの資金は公的予算基金からの 1億ドルおよび市場基金から
の 8000万ドルを含んでいる。
世界銀行グループは、2002年から 2004年の 3年間に、新規の自然エネルギーに対し年平均
1億 1000万ドルを融資した11。GEFは 2002年から 2004年にかけて、世界銀行と国連開発計
画(UNEP)、および他の機関から提案された自然エネルギープロジェクトへの共同融資に毎年
平均 1億ドルを充当した。間接的もしくは関連する民間部門の融資はしばしばこれらの機関か
らの実質的な公的融資額と等しいか、数倍上回ることがあるが、これは多くの事業が民間投資
を呼び込むことを明確な目的として設計されていることによる。それに加えて、被援助国政府
もこうした開発事業に対する共同融資に貢献している。[N15]
公的融資の他の資金源には二国間援助機関や国連機関、また被援助国政府の開発援助事業へ
の出資も含まれている。幾つかの機関や政府も(一般的に)年間 500万-2500万ドルの幅で新
規の自然エネルギーに対する援助を行っており、そこにはアジア開発銀行(ADB)、欧州復興
開発銀行(EBRD)、米州開発銀行(IDB)、国連開発計画(UNDP)、UNEP、国連工業開発機
関(UNIDO)、デンマーク国際開発援助機関(Danida)、フランスエネルギー・環境管理庁
(Ademe) フランス地球環境ファシリティ(FFEM)、ドイツ技術協力公社(GTZ)、イタリ
ア、日本国際協力銀行(JBIC)、スウェーデン国際開発協力庁(SIDA)なども含まれる。他の
ドナーで年間ベースの技術援助や投資を行っているものとしては、国連食糧農業機関(FAO)、
オーストラリア国際開発庁(AusAid)、カナダ国際開発庁(CIDA)、オランダ・エネルギー環
境庁(SenterNovem)、スイス開発協力庁(SDC)、そしてイギリス国際開発省(DFID)など
がある。これらのドナーの内には、特定目的投資信託や追加的な民間投資を組み合わせた信用
与信枠を創設しているものもある。[N15]
多くの組織が融資を行ってきたことで、融資合計額は今後増加することを示唆しているもの
の、こうした公的投資のフローは、過去数年に渡って比較的一定のままであった。2004年には、
ドイツのボンにおける自然エネルギー2004国際会議において、170カ国がボン行動プログラム
と、政府や国際機関、非政府組織による数多くの将来的なコミットメントを受諾した(補足 1
を参照)。同時に、ドイツ政府は開発途上国における自然エネルギーとエネルギー効率化に向け
た投資のために、KfWに対し 5年に渡り 5億ユーロを拠出することを約束した。同じく 2004
年に、世界銀行グループは今後 5年以内に新規の自然エネルギーおよびエネルギー効率化に対
する投資フローを倍増させることを約束しており、これにより自然エネルギー向けの年間投資
に更に 1億 5000万ドルが追加されることとなる。EUは、ヨハネスブルグ自然エネルギー連合
(JREC)と共に、7500万ユーロの初期融資と長期的な資本投下を提供することを目的とする
11 世界銀行グループの自然エネルギーへの融資に、GEFによる世界銀行グループ事業(2002年から 2004年)に対する共同出資年平均 4500万ドルを加えると、世界銀行グループと GEFによる融資総計は年平均 1億 5500万ドル以上となる。世界銀行グループはまた、2002年から2004年の 3年間に、大規模水力に対し(GEF共同融資を除き)年平均 1億 7000万ドルの出資を承認しており、これにより世界銀行と GEFによる全自然エネルギーに対する年間平均融資額は 3億 2500万ドル以上となる。

| RENEWABLE 2005 GLOBAL STATUS REPORT |
PAGE 31
「グローバル再生可能エネルギー・ファンドオブファンズ」の創設を予定している。
開発途上国の自然エネルギー対するローカル・ファイナンス資金源は、かつては国際開発機
関が管轄していたが、こちらも成長を見せている。ドナーや市場推進者らは、自然エネルギー
に対するローカル・ファイナンス資金源拡大のための支援と、民間投資家の融資リスク軽減策
の模索を、さらに重視するようになってきている。最も良い例としては、1987 年の開始以降
250万 kWの自然エネルギーに対しておよそ15億ドルを支給してきたインド再生可能エネルギ
ー開発省(IREDA)が挙げられる。地方においては独立型の住宅用太陽光発電システム向けに、
ローカルなクレジット調達と販売を行っているバングラデュのグラミン銀行は最も良く知られ
ている例である。他にも多くの例がある。ウガンダ開発銀行は、シェル財団からの支援を受け
ながら、地方へのマイクロ・ローンを供給している。UNEPと国連財団、そして E+Coは、ア
フリカやブラジル、中国における農村エネルギー事業開発プログラム(REED)プログラムを
通じて、小規模もしくは中規模の自然エネルギー事業への融資への取り組みを試みている。ト
リオドス銀行による再生可能エネルギー開発のための基金は、アジアやアフリカの自然エネル
ギー起業家に対し、当初投入資本や借款、事業開発支援を提供している。2003年には、インド
最大の商業銀行であるカナラ銀行とシンジケート銀行の 2社が、地域の提携銀行と共に、家庭
での自然エネルギー利用のため、2 つの州において 2000 の銀行支店を通じ数千に上るローン
の提供を開始した。全体的に見て、一般家庭やビジネス向けの融資業務は多くの組織にとって
高い優先順位を獲得しつつある。
こうした融資フローは他の多くの産業団体や非政府組織、国際的なパートナーシップ、また
ネットワークや民間基金の努力によって議論され、推進されている。こうしたいわゆる MFO
は数百を数え、世界中でローカルなレベルで活発に活動している ([N45]のウェブサイトリス
トを参照) 。国際的なパートナーシップの例としては、グローバル・ヴィレッジ・エネルギー・
パートナーシップ(GVEP)、持続可能なエネルギー・エネルギー効率化パートナーシップ
(REEEP)や持続可能な開発のためのエネルギーに関する世界ネットワーク(GNESD)、UNEP
持続可能なエネルギーのための金融イニシアチブ(SEFI)、21世紀のための自然エネルギー政
策ネットワーク(REN21) の 5つが挙げられる。
自然エネルギーへの政府支援はアメリカ合衆国およびヨーロッパをあわせると、2004年にお
よそ 100億ドルに上った。こうした支援は幾つかの形態を取る事がある。政府予算による支援
には、調査開発資金や直接投資、資本コスト補助、税額控除、輸出信用などのメカニズムが含
まれる12。
12 過去には自然エネルギーに対する輸出信用は殆ど行われたことがないが、状況は変化しつつある。OECDは近頃自然エネルギーに対し、「公的支持を受ける輸出信用ガイドラインに関するアレンジメント」において、12年から 15年間に渡る返済猶予期間の延長を含む特別措置を取ることを決定した。この特別な措置は、潜在的には自然エネルギーへの輸出信用機関投資を
増やし、輸出信用機関の条項を開発途上国の自然エネルギー事業への他の融資と協調させるこ
とにも貢献するかもしれない。
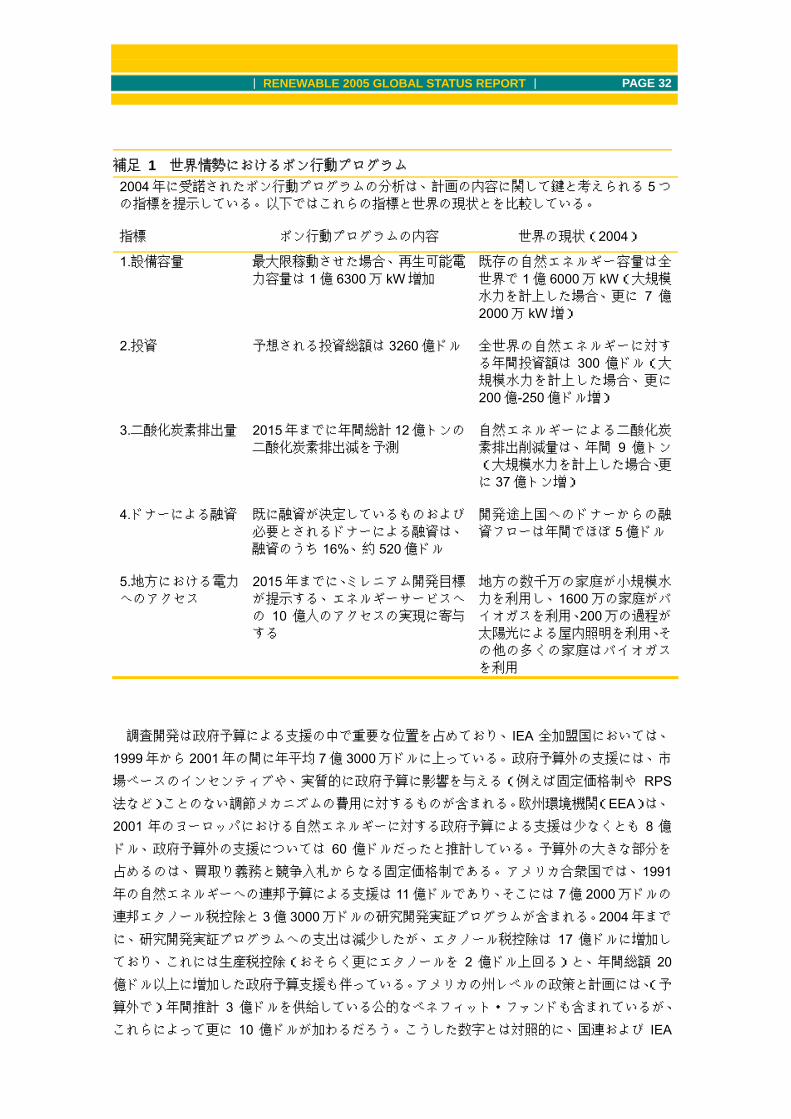
| RENEWABLE 2005 GLOBAL STATUS REPORT |
PAGE 32
補足 1 世界情勢におけるボン行動プログラム 2004年に受諾されたボン行動プログラムの分析は、計画の内容に関して鍵と考えられる 5つの指標を提示している。以下ではこれらの指標と世界の現状とを比較している。 指標 ボン行動プログラムの内容 世界の現状(2004)
1.設備容量 最大限稼動させた場合、再生可能電
力容量は 1億 6300万 kW増加 既存の自然エネルギー容量は全
世界で 1億 6000万 kW(大規模水力を計上した場合、更に 7 億2000万 kW増)
2.投資 予想される投資総額は 3260億ドル 全世界の自然エネルギーに対す
る年間投資額は 300 億ドル(大規模水力を計上した場合、更に
200億-250億ドル増)
3.二酸化炭素排出量 2015年までに年間総計 12億トンの二酸化炭素排出減を予測
自然エネルギーによる二酸化炭
素排出削減量は、年間 9 億トン(大規模水力を計上した場合、更
に 37億トン増)
4.ドナーによる融資 既に融資が決定しているものおよび
必要とされるドナーによる融資は、
融資のうち 16%、約 520億ドル
開発途上国へのドナーからの融
資フローは年間でほぼ 5億ドル
5.地方における電力へのアクセス
2015年までに、ミレニアム開発目標が提示する、エネルギーサービスへ
の 10 億人のアクセスの実現に寄与する
地方の数千万の家庭が小規模水
力を利用し、1600万の家庭がバイオガスを利用、200万の過程が太陽光による屋内照明を利用、そ
の他の多くの家庭はバイオガス
を利用
調査開発は政府予算による支援の中で重要な位置を占めており、IEA 全加盟国においては、
1999年から 2001年の間に年平均 7億 3000万ドルに上っている。政府予算外の支援には、市
場ベースのインセンティブや、実質的に政府予算に影響を与える(例えば固定価格制や RPS
法など)ことのない調節メカニズムの費用に対するものが含まれる。欧州環境機関(EEA)は、
2001 年のヨーロッパにおける自然エネルギーに対する政府予算による支援は少なくとも 8 億
ドル、政府予算外の支援については 60 億ドルだったと推計している。予算外の大きな部分を
占めるのは、買取り義務と競争入札からなる固定価格制である。アメリカ合衆国では、1991
年の自然エネルギーへの連邦予算による支援は 11億ドルであり、そこには 7億 2000万ドルの
連邦エタノール税控除と 3億 3000万ドルの研究開発実証プログラムが含まれる。2004年まで
に、研究開発実証プログラムへの支出は減少したが、エタノール税控除は 17 億ドルに増加し
ており、これには生産税控除(おそらく更にエタノールを 2 億ドル上回る)と、年間総額 20
億ドル以上に増加した政府予算支援も伴っている。アメリカの州レベルの政策と計画には、(予
算外で)年間推計 3 億ドルを供給している公的なベネフィット・ファンドも含まれているが、
これらによって更に 10 億ドルが加わるだろう。こうした数字とは対照的に、国連および IEA

| RENEWABLE 2005 GLOBAL STATUS REPORT |
PAGE 33
が示す全世界の化石燃料に対するエネルギー補助金および支援の総額は、年間 1500 億-2500
億ドルであり、原子力については年間 160億ドルとなっている。[N16]

| RENEWABLE 2005 GLOBAL STATUS REPORT |
PAGE 34
3. 産業の潮流
このような投資の流れは、自然エネルギーが一大ビジネスに成長したことを物語っている。
世界的には 2005年、60以上の自然エネルギー事業者、あるいは主要な電力会社の自然エネル
ギー部門の時価総額は 4000 万ドル以上であった。またこれらの法人および部門の時価総額総
計は、250億ドル以上に上ると推定されている。次に規模の大きい 100法人および部門を加え
ると、時価総額はさらに数十億ドルのプラスとなる。太陽光発電は、世界で最も利益の高い急
成長産業の一つになっている。2005年から 2008年の間に、合計数十万 kWの設備容量拡大が
計画されており、2005年には 50億-70億ドルの設備投資が見込まれている。[N17]
これまで風力タービン製造業者に限定されていた風力発電市場に、主要な大企業が参入を始
めたことは、自然エネルギーが一大産業に成長したことを最も良く示している例だといえるだ
ろう。ゼネラル・エレクトリック(GE)やシーメンスは、近年の電気機器メーカーによる風力
市場参入の顕著な例であり、いずれも企業買収によって参入している(GEは 2003年にエンロ
ン・ウィンドを、シーメンスは 2004 年にボーナスを買収している)。2004 年に中国では、大
手電気機器、航空、発電機器メーカー5 社が、風力タービン技術開発に乗り出した。海外企業
と4本の技術移転契約を交わしており、2005年にはプロトタイプのタービンを製造する予定で
ある。このような大手の市場参入は、ファイナンスやマーケティング、生産規模といった新た
な競争力を市場に生み出しており、技術の信頼性をさらに高める結果となっている。
風力発電産業では、2004年に平均 1250kWの風力タービン 6000機以上を製造している。そ
のうちのトップ 6社は、ヴェスタス(デンマーク、2004年 NEGミーコンを合併)、ガメサ(ス
ペイン)、エネルコン(ドイツ)、GE エナジー(米国)、シーメンス(デンマーク、2004 年に
ボーナスを合併)、そしてスズロン(インド)である。中国の主要な風力タービン製造メーカー
は、20%シェアを持つゴールドウィンドと、5%シェアを持つシーアン・ノーデックスの 2社で
ある(残り 75%のシェアは輸入が占める)。世界の風力産業の発展とタービンのサイズは深く
関係しており、設置されたタービン容量の平均は 1995年の 500kWから 2004年には 1300kW
へと拡大している。米国やヨーロッパの風力産業では、現在 1000-3000kW 級のタービンを製
造しているが、インドや中国では 600-1000kW級タービンの製造がまだ一般的である。ヨーロ
ッパの製造メーカーでは、5000kW 級の風力タービンプロトタイプの製造を始めた。より大き
な容量のタービンを製造することが、依然としてこの業界における最大の技術的課題となって
おり、より優れた素材や電気部品、羽根や発電機のデザインの開発、そして立地最適化などの
努力によって、更なるコスト低下の可能性を高めてきている。[N18]
太陽光発電産業は 1999年、世界の累積生産量で初の 100万 kWを達成した。5年後の 2004
年には、累積生産量は 4倍の 400万 kWとなった。2004年の世界的な生産高は、力強い拡大
を続けており、年間の生産は 110 万 kW を超えている。2005 年に主要な製造メーカーの生産
計画発表には、少なくとも 40 万 kW 以上の生産能力拡大が含まれており、2006 年から 2008
年の間には、更に数十万 kWの拡大が見込まれている。2004年の製造メーカートップ 3社は、

| RENEWABLE 2005 GLOBAL STATUS REPORT |
PAGE 35
シャープ、京セラと BP ソーラーである(実際は多くの参入企業による急激な生産能力の拡大
によって、毎年トップ企業が入れ替わっている)。[N19]
中国やその他の開発途上国は、太陽光発電機器の製造分野で台頭してきている。2004年、中
国におけるモジュール生産能力は 5万 kW から 10 万 kW へ 2倍に、またセルの生産能力は 7
万 kWに拡大した。太陽光業界が発表した計画によると、2005年の生産能力はさらに倍増する
可能性がある。インドには、セル製造業者は 8 社、モジュール製造業者は 14 社ある。インド
の主要太陽光発電メーカーのタタBPソーラー社は、2001年に 8000kWだった生産能力を 2004
年には 3 万 8000kW に拡大している。フィリピンのサン・パワーは、2004 年に生産能力を 2
倍の 5万 kWに拡大することを計画した。タイのソーラートロンは、2007年のセル生産能力を
2 万 kW とする計画を発表した。風力産業全体に渡って、生産規模拡大による経済性と、設計
や製造工程の改善が、更なるコスト削減を可能にしている。
バイオマス発電・熱や小水力産業は、風力や太陽光産業に比べてより成熟しており、ローカ
ル化と多様化が進行している。木材や製紙会社、砂糖工場のようにバイオマス廃棄物を出す企
業が、バイオマス発電と熱供給の両方へ投資する傾向がある。ヨーロッパの小水力産業は小水
力発電製造において主導的な地位を占めており、近年は既存発電設備の改良・改修が課題とな
っている。小水力技術の改善努力は、低落差(15メートル以下)と小規模容量(250kW以下)
の開拓に注がれている。中国の小水力産業は、500 を超える水力発電メーカーを抱えている。
対照的に、国際的な地熱発電産業は大手 5社が占めている(アンサルド、富士電機、三菱、オ
ーマット、東芝)。[N20、N21]
全世界のエタノール産業はブラジルと米国に集中している。ブラジルでは 2004 年、300 以
上のサトウキビ精製・蒸留工場でエタノールが製造され、2005年には 39の蒸留業者が認定を
受けた。米国では 2004 年、12 ヶ所のエタノール工場が完成し、合計で 80 ヶ所となった。同
じく 2004年に 16ヶ所の新規工場建設が始まった。ドイツと米国では、数件の大規模エタノー
ル工場が 2005 年より製造を開始する。また、ブラジルのエタノール産業は主要なエタノール
輸出産業に成長しており、2004年の世界エタノール輸出量の半分を占めている。さらに EUで
は、かなりの量のバイオ燃料が取引されており(エタノールとバイオディーゼルを含む)、他の
国々でもエタノール産業を拡大する計画が見られる。[N22]
自然エネルギー産業の多くの部分が、年々高度に複雑化してきている。例えば、小型風力機
メーカーでは、簡易に設置でき、太陽光など他の機器とのハイブリッドという選択肢も提供し
ている。系統独立型の住宅用太陽光発電機器の産業は、照明用や本格的な住宅用システム向け
に、標準化された“プラグ&プレイ”パッケージを開発し始めている。またいくつかの企業で
はハイブリッド・システムのパッケージング方法の革新に着手している。例えば米国のある会
社では、太陽光発電と小型風力発電を、最新のバッテリーと一緒に輸送コンテナーに積み込む
ことで、完全にパッケージ化されたシステムの販売を管理している。より高度な管理、性能の
モニタリングや通信がシステムに融合されることで、より明確なエネルギー集計や高度な請求、
支払い方法が可能になってきている。

| RENEWABLE 2005 GLOBAL STATUS REPORT |
PAGE 36
自然エネルギー産業は、今後も急激に成長を続けるだろう。自然エネルギーの産業では、製
造や運転、維持管理といった直接的雇用は、2004年に 170万人を超え、そのうちの 90万人は
バイオ燃料製造者であった。間接的雇用者数は数倍にも上る。公表されている雇用統計は非常
に限られた産業や国のものしか存在しないため、これらは仮の推計である。国別の雇用推計の
例としては、ブラジルのエタノール産業 40万人、中国の太陽熱温水産業 25万人、ドイツの自
然エネルギー全産業 13 万人、ヨーロッパの風力産業 7.5 万人、ヨーロッパの太陽光発電産業
1.5万人、米国の太陽光発電産業 1.2万人、ネパールのバイオガス産業 1.1万人、日本の自然エ
ネルギー全産業 3400人、EUの小水力産業 2200人、などがある13。[N24]
13 自然エネルギー関連の全世界での雇用に関する推計が含まれる文献は存在しない。本報告書の分析の詳細については[N24]を参照。小水力、バイオマス発電、地熱発電、太陽光発電、太陽熱温水、エタノール、バイオディーゼルが含まれているが、地熱熱利用とバイオマス熱利用は
含まれていない。

| RENEWABLE 2005 GLOBAL STATUS REPORT |
PAGE 37
4. 政策の展望
自然エネルギーの利用促進に関する政策は、1980年代や 1990年代初めには数カ国でしか見
られなかった。しかし、1990年代後半から 2000年代前半にかけて多くの国や州、地方、都市
において作成されるようになった。これらの政策の多くは前章で見たような市場発展に大きな
影響を及ぼすようなものである。この章では、太陽熱温水や暖房、バイオ燃料といった自然エ
ネルギーによる発電を促進する目標や政策について述べる。また、地方自治体で行われている
政策や、自主的な取組みのグリーン電力・グリーン電力料金についても述べる14。
政策の影響や経験についての詳細な分析はこのレポートでは割愛する。しかしながら、政策
の設計や実施に無数の問題があるにもかかわらず、政策は自然エネルギーの発展のスピードや
程度に大きな影響を与えていることが、調査により明らかにされている。国際エネルギー機関
(IEA)は 2004年、IEA加盟国の市場や政策の動向に関する報告書の中で、以下のことを述べ
ている。市場の大幅な成長は、単一の政策によるものよりもむしろ、いくつかの政策の組み合
わせによってなされていること、長期的で予見可能性のある政策支援が重要であること、地域
的な州または地方政府を巻き込むことが重要であること、そして、個々の政策のメカニズムは
各国がより多くの経験を積むことで発展していくということである。古い政策には多くの経験
が蓄積されているが、多くの政策が 2000 年以降実施されたものなので、それらの影響を評価
するにはまだ早すぎると IEAでは考えられている。
自然エネルギーの政策目標
世界では 45カ国で自然エネルギーに関する政策目標が立てられている。2005年半ばまでに、
EU25カ国すべてを含む 43カ国で自然エネルギー供給に対する国内目標があった(図 11、表 3
参照)。EU ではヨーロッパ全体での目標も同様に設定しており、それは、2010 年までに電力
の 21%、全エネルギーの 12%を自然エネルギーとするという内容である。これら 43カ国に加
え、アメリカ合衆国の 18州(とコロンビア特別区)、カナダの 3地方では RPSに基づく目標
を定めている(ただし、アメリカ合衆国とカナダには国としての目標はない。)。 また、それ
以外のカナダの 7 地方では計画目標が作られている。国内目標は発電におけるシェアを概ね
5-30%に設定しているものがほとんどである。電力自体のシェアは 1%から 78%と幅がある。
その他の目標には、全一次エネルギー供給量のシェアに対するものであったり、特定の発電設
備の導入数や、熱を含めた自然エネルギーの総量であったりする。またほとんどの目標設定は
2010年から 2012年における期間となっている。[N25]
14 この章では政策の展望の全般的なものを示す予定である。紹介する政策は概ね立法機関によりすでに制定されたものであるが、中にはまだ導入されていないものや詳細な規定が定められ
ていないものがある可能性がある。またすべての政策を網羅することは困難なので、意図せず
して省略されていたり間違いがあったりするものがあるかもしれない。いくつかの政策には打
ち切られていたりごく最近制定されていたりするものもあると思われる。より詳細な情報を掲
載したものをオンライン上で更新していく予定である。

| RENEWABLE 2005 GLOBAL STATUS REPORT |
PAGE 38
図 11 EU自然エネルギー目標値 2010年までの電力シェア
国内目標のある 43カ国には発展途上国が 10カ国含まれており、ブラジル、中国、ドミニカ
共和国、エジプト、インド、マレーシア、マリ、フィリピン、南アフリカ共和国、タイである。
その他の発展途上国でも近い将来、目標を設定する予定の国がある。中国は 2010 年までに全
発電容量の 10%を自然エネルギーとする目標を立てており(ただし大規模水力発電は除く)、
これは計画されている電力の伸びのうち、6000万 kWの自然エネルギー発電設備に相当する。
中国ではまた 2020年に向けた目標を設定しており、これには一次エネルギーの 10%、発電容
量の 12.5%、太陽熱温水を 2億 7000万㎡、風力とバイオマスをそれぞれ 2000 万 kW導入す
るという内容である15。タイでは 2011年までに一次エネルギーの 8%を目標としている(伝統
的に行われているバイオマスは除く)。インドでは 2012年までに追加的に導入する発電容量の
10%すなわち自然エネルギー1000 万 kW を導入することを見込んでいる16。フィリピンでは
15 中国の目標は政府が未承認の自然エネルギー開発計画の草案の中で示されている。しかし、2004年 6月にドイツのボンにおける自然エネルギー2004国際会議において公式に発表されたものである。2005年 2月の中国自然エネルギー法では 2006年 1月までに目標設定を含む自然エネルギー開発計画を政府が正式に公表することを取り決めている。 16 インドの国内目標は計画中または示唆されたものであるが、特定の法律によって裏づけされ

| RENEWABLE 2005 GLOBAL STATUS REPORT |
PAGE 39
2013年までに現在の容量の 2倍にあたるおよそ 500万 kW を目標としている。南アフリカ共
和国では 2013年までに最終エネルギー増加分のうち 100億 kWh、すなわち発電容量の約 4%
にあたるが、これを自然エネルギーとするという目標を 2003 年に設定した。メキシコでは議
会において、国内目標を定めることを盛り込んだ自然エネルギーに関する新しい法律を 2005
年検討中である。
表 3 非 EU国の自然エネルギー目標値 国 目標
オーストラリア 2010年までに年間 95億 kWhの発電
ブラジル 2006年までに風力、バイオマス、小水力による発電を 330万 kW増
カナダ 4地方では全電力量の 3.5%から 15%にする。6地方では他の目標有。
中華人民共和国 2010年までに発電容量の 10%(6000万 kW相当)
2010年までに一次エネルギーの 5%、2020年までに 10%
ドミニカ共和国 2015年までに風力発電容量を 50万 kW
エジプト 2010年までに電力の 3%、2020年までに 14%
インド 2003年から 2012年の間に発電容量を 10%増(1000万 kW相当)
イスラエル 2007年までに電力の 2%、2016年までに 5%
日本 2010年までに電力の 1.35%(地熱と大規模水力は除く)(RPSによ
る)
韓国
2010年までに大規模水力を含み 7%、
2011年までに 10万世帯(30万 kW分)を含む系統連系型の太陽光
発電を 130万 kW
マレーシア 2005年までに電力の 5%
マリ 2020年までにエネルギー源の 15%
ニュージーランド 2012年までに容量を 300億 MJ増(熱と輸入燃料を含む)
ノルウェー 2010年までに熱と風力で 70億 kWh
フィリピン 2013年までに 470万 kW
シンガポール 2012年までに太陽熱設備を 5万㎡
南アフリカ共和国 2013年までに最終エネルギーで 100億 kWh増
スイス 2010年までに電力と熱を合わせて 35億 kWh
タイ 2011年までに一次エネルギーの 8%
(地方で行われている伝統的なバイオマスは除く)
アメリカ合衆国 20州(コロンビア特別区含む)で電力の 5%から 30%
たものではない。
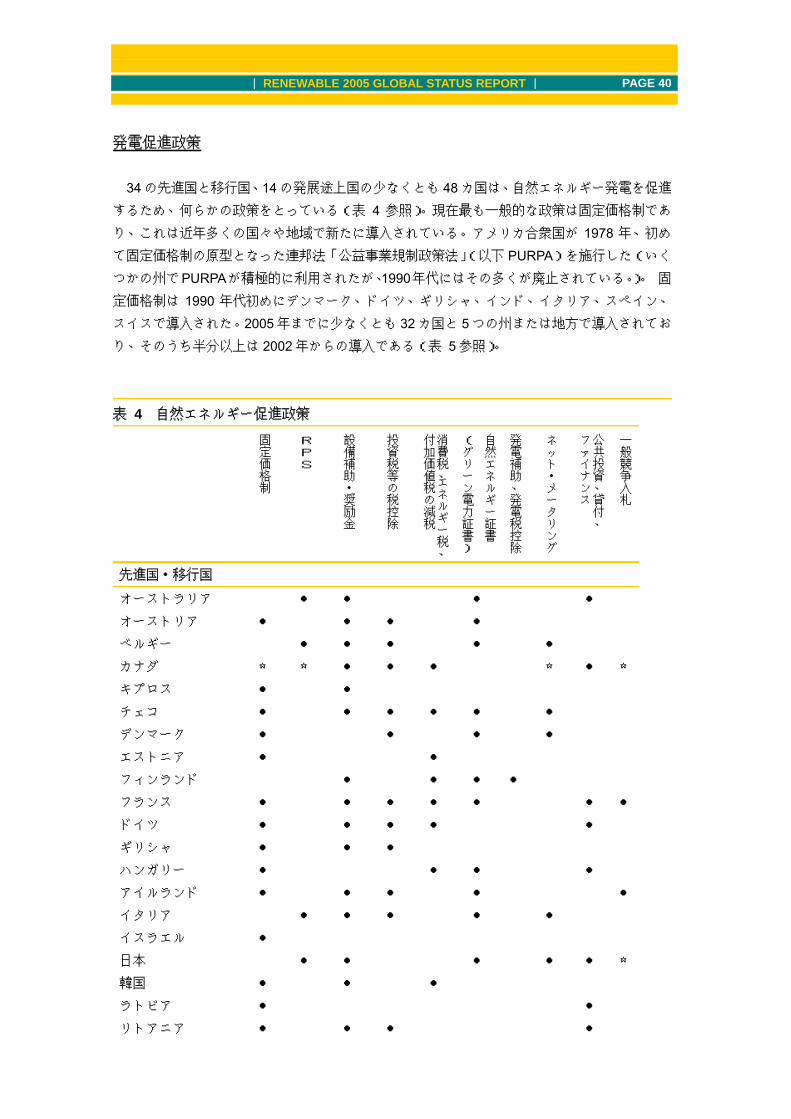
| RENEWABLE 2005 GLOBAL STATUS REPORT |
PAGE 40
発電促進政策
34の先進国と移行国、14の発展途上国の少なくとも 48カ国は、自然エネルギー発電を促進
するため、何らかの政策をとっている(表 4 参照)。現在最も一般的な政策は固定価格制であ
り、これは近年多くの国々や地域で新たに導入されている。アメリカ合衆国が 1978 年、初め
て固定価格制の原型となった連邦法「公益事業規制政策法」(以下 PURPA)を施行した(いく
つかの州でPURPAが積極的に利用されたが、1990年代にはその多くが廃止されている。)。 固
定価格制は 1990 年代初めにデンマーク、ドイツ、ギリシャ、インド、イタリア、スペイン、
スイスで導入された。2005年までに少なくとも 32カ国と 5つの州または地方で導入されてお
り、そのうち半分以上は 2002年からの導入である(表 5参照)。
表 4 自然エネルギー促進政策
固定価格制
RPS
設備補助・奨励金
投資税等の税控除
消費税、エネルギー税、
付加価値税の減税
自然エネルギー証書
(グリーン電力証書)
発電補助、発電税控除
ネット・メータリング
公共投資、貸付、
ファイナンス
一般競争入札
先進国・移行国
オーストラリア ● ● ● ●
オーストリア ● ● ● ●
ベルギー ● ● ● ● ●
カナダ ☆ ☆ ● ● ● ☆ ● ☆
キプロス ● ●
チェコ ● ● ● ● ● ●
デンマーク ● ● ● ●
エストニア ● ●
フィンランド ● ● ● ●
フランス ● ● ● ● ● ● ●
ドイツ ● ● ● ● ●
ギリシャ ● ● ●
ハンガリー ● ● ● ●
アイルランド ● ● ● ● ●
イタリア ● ● ● ● ●
イスラエル ●
日本 ● ● ● ● ● ☆
韓国 ● ● ●
ラトビア ● ●
リトアニア ● ● ● ●

| RENEWABLE 2005 GLOBAL STATUS REPORT |
PAGE 41
固定価格制
RPS
設備補助・奨励金
投資税等の税控除
消費税、エネルギー税、
付加価値税の減税
自然エネルギー証書
(グリーン電力証書)
発電補助、発電税控除
ネット・メータリング
公共投資、貸付、
ファイナンス
一般競争入札
ルクセンブルク ● ● ●
マルタ ●
オランダ ● ● ● ● ●
ニュージーランド ● ●
ノルウェー ● ● ● ●
ポーランド ● ● ● ● ●
ポルトガル ● ● ● ●
スロバキア ● ● ●
スロベニア ●
スペイン ● ● ● ●
スウェーデン ● ● ● ● ● ● ●
スイス ●
イギリス ● ● ● ●
アメリカ合衆国 ☆ ☆ ● ● ☆ ☆ ● ☆ ☆ ☆
発展途上国
アルゼンチン ● ●
ブラジル ● ●
カンボジア ●
中国 ● ● ● ● ● ●
コスタリカ ●
グアテマラ ● ●
インド ☆ ☆ ● ● ● ● ●
インドネシア ●
メキシコ ● ●
ニカラグア ● ●
フィリピン ● ● ●
スリランカ ●
タイ ● ● ● ●
トルコ ● ●

| RENEWABLE 2005 GLOBAL STATUS REPORT |
PAGE 42
(a) 制定された政策だけを表示している。しかし、導入されているが推進力やイン
パクトに欠けていたり、効果がない発展途上の規制がある。
(b) ☆印をつけているものは、その国内の州または地方が州または地方レベルで導
入している政策で、国全体の政策とはなっていないものである。
(c) 発電市場以外の市場に適用されている政策もある。
(d) 表には廃止された政策は表示していない。例えば、2003 年に廃止されたノル
ウェーの風力に対する固定価格制や、2002 年に廃止されたデンマークの設備
補助や、2003 年に廃止されたベルギーの固定価格制(グリーンフランクシス
テム)である。
(e) マリやセネガル、タンザニア、ウガンダといったアフリカ諸国では、農村地域
の太陽光発電への小規模な補助制度がある(ウガンダでは小水力にもある。)。
南アフリカ共和国では現在休止しているが、農村部の太陽光発電によるエネル
ギーサービス権への補助を行っていた。
(f) 発展途上国の中には自然エネルギーの戦略を検討していたり、新たに追加的な
政策を将来とることが考えられている国もある。アルジェリア、アルメニア、
コロンビア、エジプト、グアテマラ、ヨルダン、マケドニア、メキシコ、ペル
ー、南アフリカ共和国、ベトナム、イエメンなどがそうである。
表 5 固定価格制を導入した国、州、地域の総数 年 総数 新たに導入した国、州、地域
1978 1 アメリカ合衆国
1990 2 ドイツ
1991 3 スイス
1992 4 イタリア
1993 6 デンマーク、インド
1994 8 スペイン、ギリシャ
1995 8
1996 8
1997 9 スリランカ
1998 10 スウェーデン
1999 13 ポルトガル、ノルウェー、スロベニア
2000 14 タイ
2001 16 フランス、ラトビア
2002 20 オーストリア、ブラジル、チェコ、インドネシア、リトアニア
2003 27 キプロス、エストニア、ハンガリー、韓国、スロバキア、マハラシュトラ
(インド)
2004 33 イタリア、イスラエル、ニカラグア、プリンスエドワード島(カナダ)、

| RENEWABLE 2005 GLOBAL STATUS REPORT |
PAGE 43
アーンドラプラデシュ(インド)、マディヤプラデシュ(インド)
2005 37 トルコ、ワシントン(アメリカ合衆国)、アイルランド、中国
2005年の数字は上半期のみのものである。
発展途上国のうち、インドで初めて固定価格制が導入され、スリランカ、タイ(小規模発電
事業者のみ)、ブラジル、インドネシア、ニカラグアと続いている。インドの 3 州では、2003
年までに施行された州レベルの政策導入を要する国内法に基づき、2004年に新たに固定価格制
が導入された(ここで 1990年代に行われていた固定価格制は段階的に廃止された。)。2005年
の上半期には、中国、アイルランド、トルコ、ワシントン(アメリカ合衆国)でも固定価格制
が導入されている。中国の固定価格制は 2005 年 2 月に制定された包括的自然エネルギー促進
法の一部として導入されている。[N26,N27]
固定価格制は明らかに革新を促しており、過去数年間ドイツ、スペイン、デンマークで見ら
れるように、利益や投資が増加した。例を挙げると、ドイツの固定価格制により認定されてい
る自然エネルギーからの発電は、2000年から 2004年の間に 140億 kWhから 2倍以上の 370
億 kWhへ増加した。またいくつかの国では、固定価格制は風力発電で最も大きな効果を上げて
いるが、バイオマスや小水力の開発についても効果が見られる(多くの法律では、小水力とし
て認められる水力発電の規模に制限を定めている。例えばドイツでは 5000kWである。)。最近
では、スペインの固定価格制が、太陽熱発電への新しい投資計画へ支援を行った(2005年には
2つの 5万 kWの発電所に適用される見込みである。)。
固定価格制は国によって制度の様子が異なっている。いくつかの制度では、一定の技術や最
大容量にしか適用されない。ほとんどの制度では異なった技術には異なった金額を設定し、通
常これは発電コストに関連している。例えば、洋上風力と陸上風力の区別をするということで
ある。また、場所や地域、発電年数、年間の稼動時期によって異なった金額を設定しているも
のもある。発電所に設定された金額は時がたつにつれて減少するが、通常 15年から 20年継続
するものになっている。固定価格を設定するものもあれば、市場価格または発電コストに固定
のプレミアムを追加した価格(またはスペインで見られるように市場価格と発電コストを併用)
を設定するところもある。
RPS 制度はアメリカ合衆国やカナダ、インドの州や地方レベルで導入されている(表 6 参
照)。少なくとも 32の州や地方で RPSが導入され、その半分は 2003年から導入されている。
2004年から 2005年にかけて、アメリカ合衆国では新たに 8州(とコロンビア特別区)で RPS
が導入され、国内で合計して 20州が導入したこととなる。同様にインドでは 2004年から 2005
年にかけて新たに 5 つの州で RPS が導入され、合計して 6 州で導入されていることになる
(2003年インド電力法では、各州で導入する自然エネルギーの最低限の量を定めている。)。カ
ナダでは 3 地方が RPS を導入している(また、さらにいくつかの地方で目標の設定を計画中
である。)。以上に挙げた RPSの多くは、自然エネルギーの割合を、2010年または 2012年ま
でに 5-20%とすることになっている。ほとんどのRPS目標では将来大きな投資が見込まれる。

| RENEWABLE 2005 GLOBAL STATUS REPORT |
PAGE 44
ある研究において、現在アメリカ合衆国で導入されている州レベルの RPS法では、2020年ま
でに新たに 5200万 kW、すなわち現在アメリカで導入されている自然エネルギー容量の 2倍以
上の自然エネルギーの導入が必要であるとされている17。[N28]
表 6 RPSを導入した国、州、地域の総数 年 総数 新たに導入した国、州、地域
1997 1 マサチューセッツ(アメリカ合衆国)
1998 3 コネチカット、ウィスコンシン(アメリカ合衆国)
1999 7 メーン、ニュージャージー、テキサス(アメリカ合衆国)、イタリア
2001 12 アリゾナ、ハワイ、ネバダ(アメリカ合衆国)、フランドル(ベルギー)、
オーストラリア
2002 16 カリフォルニア、ニューメキシコ(アメリカ合衆国)、ワロン(ベルギー)、
イギリス
2003 20 ミネソタ(アメリカ合衆国)、日本、スウェーデン、マハラシュトラ(イ
ンド)
2004 34
コロラド、メリーランド、ニューヨーク、ペンシルバニア、ロードアイラ
ンド(アメリカ合衆国)、ノバスコシア、オンタリオ、プリンスエドワー
ド島(カナダ)、マディヤプラデシュ、カルナタカ、アーンドラプラデシ
ュ、オリッサ(インド)、ポーランド、タイ
2005 38 ワシントン DC、モンタナ、デラウェア(アメリカ合衆国)、グジャラート
(インド)
国として RPSを定めている国が 6カ国あり、すべて 2001年以降に制定されている。オース
トラリアの RPS(2001 年施行)では、毎年電力会社が一定の自然エネルギー証書(グリーン
電力証書)を提供することが定められている(2004年には発電の 1.25%、合計すると 26億 kWh)。
これより、2010 年までにオーストラリアの国内目標である 95 億 kWh は徐々に達成されると
思われる。イギリスの RPS(2003年施行)では 2010年までに 10%、2015年までに 15%とす
ることを定めており、2027年まで継続される。日本の RPS(2003年施行)もまた、電力会社
が一定の割合で自然エネルギーを提供することを定めており、2010 年までに 1.35%となるよ
うに増加させることになっている。スウェーデンの RPS(2003年施行)では、消費者または、
消費者の代わりに電力供給者が、一定の年間割合を購入することを定めており、その割合は、
自然エネルギーによる電力購入と証書購入により年々増加させる(スウェーデンでは達成でき
ない者に対しては、前期の平均証書価格の 150%を罰金として課している。)。ポーランドのRPS
(2004年施行)では、2010年までに 7.5%とすること定めている。タイの RPS(2004年施行)
17 州や地方によってはすでに目標に近い容量を有するところもあり、RPSの割合が必ずしも野心的なものや努力を必要とする水準のものではないこともある。しかし、目標をはるかに下
回る容量しかないところもある。さらに、条件を満たすために認定した水力発電に上限を設け
ている RPSもある。[N25]では各国の割合や容量の目標をリストアップしている。

| RENEWABLE 2005 GLOBAL STATUS REPORT |
PAGE 45
ではこれから新たに設置される全発電設備の 5%を自然エネルギーとすることを定めている18。
自然エネルギー発電の支援政策はほかにも多くの形でとられており、設備投資への直接補助
や割戻し、税制上の優遇措置や税額控除、消費税や付加価値税の免除、kWhあたりの直接発電
支払いや税額控除、グリーン電力証書取引、ネット・メータリング、直接公共投資や公的融資、
特定の発電量に対する一般競争入札などがある(表 4 参照)。設備投資への直接補助や割戻し
のタイプは少なくとも 30 カ国で行われている。税制上の優遇措置や税額控除も財政上の支援
として一般的なものである。アメリカ合衆国のほとんどの州と 32 カ国では自然エネルギーに
対するさまざまな税制上の優遇措置や税額控除を導入している。
発電への支払いや税額控除はいくつかの国で行われており、最も重要なものとしてアメリカ
合衆国の連邦発電税額控除が挙げられる。この控除は 1995 年から 2004 年までに導入された
540 万 kW 以上の風力発電に適用されている。インフレを指数化するため、1994 年に控除は
1.5セント/ kWhから始められ、年々満期や更新をしながら増加し、2005年までに 1.9セン
ト/ kWhとなって、2007年まで満期は延長される。発電税控除によって近年アメリカでは風
力発電は投資先の主流となり、投資家の気を引いている。発電の優遇措置を与えている国は他
に、フィンランド、オランダ、スウェーデンがある19。
系統連系型の屋上太陽光発電を促進する政策を行っている国がいくつかあり、設備補助や固
定価格制、もしくはその両方(系統測定を伴い)を導入している。これらの政策は近年の系統
連系市場の急速な成長の助けになっていることは明確である。日本の屋上太陽光発電への補助
は、2005年に終了したが 1994年に 50%の補助金を出すことで始まり、2003年までに約 10%、
2005年までに 4%と減少した。この政策によって、20万世帯以上、80万 kWを超える導入量
となった。ドイツでは 16万世帯以上、およそ 70万 kWの太陽光発電があるが、固定価格制が
導入されており、2003年まで低金利の消費者ローンも提供されていた。カリフォルニアやアメ
リカ合衆国の他の州、いくつかの国(フランス、ギリシャ、イタリア、韓国、ルクセンブルク、
オランダ、ポルトガル、スペイン)で行われている政策では、設備補助(通常 30-50%)や有
利な購入価格を設定している。韓国では 70%の設備補助を導入し年々下げていくが、2011 年
までに 10万世帯の太陽光屋上設置プログラムにより、30万 kWの導入を見込んでいる。新し
い屋上太陽光発電のプログラムもハンガリーやタイなどで行われることになっている。[N29]
18 表 3と図 11の国内目標は法的拘束力のある計画中もしくは示唆された目標であるものもある。しかし、特定の発電事業者や消費者に法的な義務付けのある国内の RPS制度を示しているものではない。 19 発電のインセンティブは、発電事業者に発電単位あたり(すなわち kWh)に支払われるものだが、固定価格制と似ており、固定価格制と呼ばれることもある。発電インセンティブへの出
資金は発電料金に上乗せされたり規定の税収により得られるものなので、その区別は単純では
ない。アメリカの発電税還付はある定義では固定価格制と考えてよい。ここで用いられた定義
とは、固定価格制が、特別課税(オランダの場合)や規定の税収(フィンランドの場合)があ
る場合よりも、需要家が暗黙のうちにさまざまな金額を支払う中(ドイツやスペインの場合)、
政府にとって税制中立でなければならないということである。

| RENEWABLE 2005 GLOBAL STATUS REPORT |
PAGE 46
直接投資に出資されたり、低金利ローンに提供されたり、研究、教育、規格、公共設備への
投資といったものを通した方法で市場を助けるような、自然エネルギー基金を導入している国
や地域もある。最も大きな基金では、アメリカ合衆国の 14 州におけるいわゆる「公益基金」
と呼ばれるものがある。こういった基金では、自然エネルギーと同様に効率的なエネルギー利
用にも適用されており、さまざまなところから集められている。もっとも一般的なものとして
は電力料金に上乗せする形がある。これら 14の州の基金はすべて 1997年から 2001年の間に
開始され、自然エネルギーに毎年 3 億ドル以上が集められ、使用されている。2012 年までに
自然エネルギーに 40 億ドルに達する金額を集められるのではないかと考えられている。イン
ド再生可能エネルギー開発機関(IREDA)では同様のローンやプロジェクト出資を行っている。
中国でも、2005年自然エネルギー法で基金をつくることを定めており、メキシコでは 2005年、
自然エネルギーのプロジェクトに出資する「グリーンファンド」を計画していた。[N30]
ネット・メータリング法は 7 カ国、アメリカ合衆国の 35 の州、カナダのいくつかの地方で
行われている。さらにアメリカの 4 州がネット・メータリングを行う発電設備を有している。
日本でも自主的なレベルでネット・メータリングと同様のものが存在する。新たにアメリカ合
衆国の 6州では、2004年にネット・メータリング法が制定された。最近では 2005年アメリカ
連邦法ですべてのアメリカの電力設備に 3年以内にネット・メータリングを適用することも定
められた。ネット・メータリングはアメリカ合衆国や日本で系統連系型の太陽光発電市場を進
めるにおいて特に有益な手法となっている。[N30]
特定の自然エネルギー発電量に対する競争入札の政策は、もともとイギリスで 1990 年代に
始まり、今ではカナダ、中国、フランス、インド、アイルランド、ポーランド、アメリカ合衆
国の 7カ国で行われている。中国では 2003年から 2004年に 85万 kWの風力発電を入札、発
注し、2005年にはさらに 45万 kWの入札を計画している。カナダのオンタリオ地方では、2004
年に風力発電 100万 kWを入札、カナダの他の地方でも同様のことが行われている。多くの国
では発電設備は RPSの条件をみたすために競争入札を利用している。[N31]
取引可能な自然エネルギー証書(グリーン電力証書)に関する政策は、RPS下での自主的な
グリーン電力購入やグリーン電力購入義務と併用して用いられている。18カ国で証書取引の仕
組みや市場ができている。構築基準、管理規定や手順、取引手続きや価格といった多くの規制
措置もまた、自然エネルギー発電を促進する重要な役割を果たしている。このような規制措置
は特に発展途上国において将来自然エネルギー市場を形成するひとつのステップになりうる
(メキシコとトルコがこのような規制措置を行っている国の例として挙げられる。)。電力部門
の改革や炭素税、化石燃料税なども自然エネルギーの経済的な競争力に影響を与える。
太陽熱温水/暖房促進政策
太陽熱温水の世界でもっとも大きな市場は中国で、2004年の世界の増加分の80%を占める。
中国の国内目標は 2005年までに 6500万㎡とすることであり(2004年にほぼ達成されている)、
2015年までに 2億 3000万㎡とすることである。1980年代には小都市や村を起源とするシス

| RENEWABLE 2005 GLOBAL STATUS REPORT |
PAGE 47
テムのため、先進国では極めて低価格で販売され、需要に見合わない温水や経済、システムに
市場が動かされていた。市街地の高層ビルに太陽熱温水導入を促進するしっかりとした政策は
とられてこなかったが、エネルギー価格が上昇し、世間の需要が高まるにつれ、特に現在の建
築ブームの中、開発業者による建物のデザインや造りに太陽熱温水を取り入れるようになって
きている。また、技術基準や建築基準、試験認証センターなど、産業界の成長を促すような政
府のプログラムもでてきている。[N32]
中国のほかに、18カ国、おそらくはそれ以上の国で太陽熱温水や太陽熱暖房の投資のための
設備補助や税割戻し、投資税控除がとられている。このようなことが行われているのは、オー
ストラリア、ベルギー、カナダの数地方、キプロス、フィンランド、フランス、ドイツ、ギリ
シャ、ハンガリー、日本、オランダ、ニュージーランド、ポルトガル、スペイン、スウェーデ
ン、イギリス、アメリカ合衆国の多くの州と、アメリカ合衆国連邦政府である。設備補助は設
備費用の通常 20-40%となっている。投資税控除は納税義務による投資コストのすべてまたは
一部控除を許容している(イタリアの自然エネルギー証書制度では太陽熱温水にいわゆるホワ
イト証書を適用している。)。イスラエルは新たに建設する建物に太陽熱温水を設置することを
義務化することを国内政策としている唯一の国である。1980年からイスラエルで建設される建
物のほとんどが太陽熱温水貯湯槽を備え付けなければならなかった。技術的な条件も建物の大
きさや種類によって変わる。ただし特定の産業や医療関係や高層の建物は除外されている。欧
州委員会では太陽光を含む再生可能な熱の促進政策を計画し、新しい方向へ導くものと考えて
いた。
地方のレベルでは、世界中の多くの主要都市で新しい建物に太陽熱温水を導入したり、太陽
熱温水への投資のインセンティブや補助を提供するための条例が制定されている。例を挙げる
と、バルセロナ(スペイン)、オックスフォード(イギリス)、ポートランド、オレゴン(アメ
リカ合衆国)である。特にバルセロナではこのような政策の中でも最も進んでいる。2000年に
施行したバルセロナ太陽熱条例は、都市部のエネルギー政策の画期的な出来事となっている。
この条例では、特定の大きさに分類されるすべての新築の建物(一日あたり 292MJの温水にか
かるエネルギー消費があるもの)において、温水にかかるエネルギー需要の少なくとも 60%を
太陽熱から供給することとしている。温水プールでは 100%を太陽熱にしなければならない。
大規模な改修中の建物にもこの条例は適用される。適用される大きさに分類されるものは、全
商業ビル、16世帯以上ある全居住ビルであり、この条例の対象となっている。この条例により、
現在、すべての新築の建物の 40%は太陽熱温水を導入しており、一人あたりの導入容量(㎡/
千人)は 2000年の 1.1から 2004年には 15倍の 16.5へと飛躍的に伸びた。市の目標は 2010
年までに 10万㎡導入することである。
バルセロナに続き、スペインの他の市や町でも同様に太陽熱条例が制定された。例えば、マ
ドリッド、バレンシア、セビリア、ブルゴス、パンプロナである。地方自治体が強い関心を持
っているため、スペインのエネルギー多様化と省エネ研究所(IDAE)が 2003年に太陽熱条例
の雛形を作成した。これはバルセロナの太陽熱条例を非常に参考にしており、市町村で同様の
規制を作る際に利用されている。2004年 11月までに、新たに 10以上の地域(合計 17地域あ

| RENEWABLE 2005 GLOBAL STATUS REPORT |
PAGE 48
る)でパイプラインに関する条例が制定され、34自治体と 1地域が太陽熱条例を制定している。
結果はめざましく、2004年半ばに施行されたパンプロナの太陽熱条例では、1年で太陽熱温水
器が 50%増加した。国としての太陽熱法はまだ検討中であるが、2005 年には制定されると思
われる。
バイオ燃料促進政策
ブラジルは「プロアルコール」政策により、25年間バイオ燃料促進に関して世界のリーダー
的役割を果たしている。この政策では、エタノール混合の義務付け、小売流通の必要性、生産
補助金などその他にも措置がとられている。1975年からブラジルはエタノールと全ての販売さ
れているガソリンを混合することを義務付けてきた。必要な混合水準は頻繁に設定されていた
が、20-25%の幅で混合することになっている。すべてのガソリンスタンドではガソホール
(E25)と純エタノール(E100)を販売しなければならない。純エタノールで走る車には税の
優遇がなされている。最近数社から販売され、販売量が急増しているいわゆるフレックス燃料
車は、単に政策によってもたらされたのではなく、政府が純エタノール自動車からフレックス
燃料車へ自動車免許税の優遇対象を広げたことによる20。ブラジルは最近、一次エネルギーか
ら家庭用まで大豆油を原料としたバイオディーゼル燃料の使用を増加させる目標を設定した。
ブラジルの近年の法律では、2005年 1月からディーゼル燃料に 2%のバイオディーゼルを混合
することを認めている。この割合は 2013年までに 5%以上に増加する予定である。[N33]
ブラジルに加え、自動車燃料にバイオ燃料を混合することを定めた法律は近年いくつかの国
でみられる。特に、20の州または地域と 2カ国で現在、全小売自動車燃料にエタノールまたは
バイオディーゼルを混合することを定めている。インドでは、政府が 10%のエタノールを混合
(E10)することを定めており、2003年から 28州のうち 9州、7連邦地域のうち 4地域で行
われている(すべてサトウキビを生産する地域である。)。中国では 4地方で E10混合を義務付
け、さらに 5地方で 2005年に同様の法律が制定される予定である21。アメリカ合衆国では、3
州が E10混合を義務付けており、ハワイ(2006年までにほとんどのガソリンを対象)、ミネソ
タ(2013年までに 20%に増加)、モンタナで行われている。ミネソタではまた 2%の混合バイ
オディーゼル(B2)を義務化し、これは他の州や国でも考慮されている。カナダではオンタリ
オ地方で 2007年までに E5(平均)混合が定められている。コロンビア(E10)とドミニカ共
和国(2015年までに E15と B2)では国全体で混合が義務付けられている。タイでは 2011年
までに全エネルギーのシェアの中でバイオ燃料の目標を定め、E10とB2混合を検討中である。
20 この転換点は、2005年までに全ての新車の半数がフレックス燃料車となる状況で、フォルクスワーゲンをリーダーとする国内の自動車産業の自主的な誘導によるものである。純エタノ
ールとガソホールが別になっている型よりも、フレックス燃料車の方が、自動車メーカーは供
給や組立てを単純化しやすくなっている。 21 2003年から 2004年サトウキビの生産高が少なかったため、インドでは州の混合目標を達成するためにエタノールを輸入しなければならず、市場で国内のエタノール供給が十分に行われ
るようになるまで目標を拡大するのは延期しなければならなかった。中国の地方でもまたエタ
ノールが不足し、混合義務付けを一時中断しなければならなかった。

| RENEWABLE 2005 GLOBAL STATUS REPORT |
PAGE 49
日本ではブラジルから輸入したものを基本とした E3 混合を導入することを検討している。
[N33]
バイオ燃料の税制上の優遇措置はアメリカ合衆国で最も突出しており、州と連邦レベルで過
去 25年、多くの法律が制定されている。1979年のエネルギー保安法では、連邦のエタノール
税控除を 1ガロン当たり最高 60セントとし、これは燃料の混合割合に比例している(例えば、
E10では 1ガロン当たり 6セントである。)。2004年にこの税控除は 2010年まで延長された。
バイオディーゼルの税控除も追加され、混合率 1%あたり約 1 セントとしている(すなわち、
B2では 1ガロン当たり 2セント)。アメリカのいくつかの州ではエタノール生産と販売に税と
他のインセンティブを与えている。カナダでは国内燃料税をリッターあたり 10セント減税し、
多くの地方では同様またはさらに多くの減税をおこなっている(最大リッターあたり 25 セン
ト)。またヨーロッパの多くの国でもバイオ燃料について燃料税や付加価値税の減税を行ってお
り、オーストリア(バイオディーゼルで 95%減税)、フランス、ドイツ(バイオディーゼルで
100%減税)、ハンガリー、イタリア(バイオディーゼルで 100%減税)、スペイン、スウェーデ
ン、イギリスで行われている。
また他のヨーロッパ諸国のなかでは、2010 年までに輸出燃料の 5.75%をバイオ燃料とする
EUの目標を達成するために、バイオ燃料政策に取り組んでいる国もある。2003年の EC指令
では、2005 年までに 2%、2010 年までに 5.75%の目標を達成するために各国に目標を設定し
た。この目標は自主的なものだが、各国はこの目標を達成するための計画を提出、またはそう
しないことの理由を述べなければならなかった。EU 加盟国の中では近年バイオ燃料促進法を
制定したり法的拘束力のある目標値を設定したりする国がある。その中でハンガリーでは 2010
年までに全エネルギーの 2%をバイオ燃料とすることを定めており、オランダでは輸出燃料の
2%を目標としている。
グリーン電力購入とグリーン電力料金
2004 年、ヨーロッパ、アメリカ合衆国、カナダ、オーストラリア、日本で 450 万人以上の
グリーン電力消費者がいる。支援政策と民間のイニシアチブ、電気事業者によるプログラム、
政府による購入により、グリーン電力購入とグリーン電力料金は伸びている。グリーン電力購
入の 3つの主な動力は、電気事業者によるグリーン電力料金と、電力自由化の中での第 3の発
電事業者による競争力のある小売価格(グリーンマーケティングと呼ばれる)、取引可能な自然
エネルギー証書(グリーン電力証書)である。日本では地域で形成されたグリーン電力プログ
ラムもある。市場が拡大するに従い、グリーン電力の価格プレミアムは一般の電力を超えてい
たが低価格になりつつある。アメリカ合衆国ではグリーン電力の小売プレミアムは現在 kWh
当たり 1-3セントとなっている。[N34]
ヨーロッパではグリーン電力購入やグリーン電力料金が 1990 年代後半からいくつかの国で
行われている。2004 年までにオランダではグリーン電力購入に減税が行われたことで約 300
万人のグリーン電力消費者がいた。グリーン電力の小売市場のあるヨーロッパの他の国として

| RENEWABLE 2005 GLOBAL STATUS REPORT |
PAGE 50
は、フィンランド、ドイツ、スイス、イギリスがある。ドイツのグリーン電力市場は 1998 年
から着実に成長しており、2004 年には 60 万以上の消費者が 20 億 kWh を購入していた。18
のヨーロッパ諸国が RECSに加盟している。RECSは 1990年代後半に自然エネルギー証書(グ
リーン電力証書)とその取引を確立するために設立されたシステムである。2005年までに自然
エネルギー証書の累積合計は 330億 kWhが発行され、約 130億 kWh分の証書がグリーン電力
購入のために使用された22。
アメリカ合衆国では年間 50万のグリーン電力消費者が 45億 kWhの電力を購入している。
グリーン電力購入は 1999年あたりから真剣に取り組み始められた23。2004年までにアメリカ
では市場を整えるために 200万 kWの自然エネルギー発電設備が作られた。連邦政府はグリー
ン電力の最大の単独購入者で、空軍が年間 3億 2000万 kWhを購入している。2004年までに
34 州で 600 以上の電力設備がグリーン電力料金プログラムを導入している。これらの取り組
みは自主的なものであったが、2001年から 2003年の間に 5州でグリーン電力を発電する発電
所を設立するという規制が作成された。グリーン電力料金は 2004 年、グリーン電力売り上げ
のほぼ半分を占めている。
アメリカ合衆国の、航空宇宙産業の請負業者から自然食品会社まで多くの大企業は自主的に
グリーン電力を購入している。このような協力的な企業の中には IBM、ダウ、デュポン、アル
コア、インテル、ヒューレット・パッカード、インターフェース、ジョンソン&ジョンソン、
ピツニーボウズ、ステイプルズ、バクスター、フェデックスキンコーズ、ゼネラルモーターズ、
トヨタがある。公共または非政府の主導によりこのような購入者が増えている。アメリカ環境
保護庁の「グリーン電力パートナーシップ」は 2005年までに 600のパートナーをもち、年間
28 億 kWh のグリーン電力を購入している。また、自主的な「グリーン e」という認証プログ
ラムにより市場の信頼性が築かれている。
日本では 2005 年始めまでに 6 万のグリーン電力消費者がいる。これらは協同組合や地域組
織、電気事業者のプログラムを通じて自主的にグリーン電力に貢献しようという電力消費者た
ちである。日本のグリーン電力は自主的な地域組織を通じて単独に発展してきた。最初のグリ
ーン電力プログラムは消費者共同組合である北海道生活クラブ(SCH)が主導したものであっ
た。地域の電力事業者と協力し、加入者や一般市民が自主的に上乗せした電力料金を集め、自
然エネルギープロジェクトへの投資を行った。加入者は風力発電プロジェクトへの出資が可能
となり、これにより、初の「市民風車」が誕生した。同様のグリーン電力基金は日本の他の場
所でも設立され、日本の 10 電力会社でも現在顧客に風力と太陽光のためのグリーン電力基金
22 イギリスでは発電事業者による自主的なグリーン電力購入と自然エネルギー購入義務が区別されていて、このことが疑問視されている。イギリスでは自主的なグリーン電力購入は必ず
しも発電事業者への義務付けの追加的なものではないということに批判がある。ドイツではグ
リーン電力市場の 50%以上が水力発電で賄われており、大部分はドイツ電力市場が自由化される以前にうまく運営されていた。 23 アメリカ合衆国のグリーン電力購入は、例えば RPSといった自然エネルギー義務付けとは区別されていて、追加的なものとされている。

| RENEWABLE 2005 GLOBAL STATUS REPORT |
PAGE 51
に貢献するメニューを提供している。2005 年始めの時点で、57000 人の消費者が月々自主的
に電力料金に加えて出資している。
グリーン電力証書の市場も日本では存在する。日本自然エネルギー(JNEC)が現在グリー
ン電力証書を商業界や産業界の消費者に販売している24。これには 50以上の日本の大企業が参
加しており、ソニー、アサヒ、トヨタ、日立などがある。JNEC はこれらの企業に証書を長期
契約の場合 kWhあたり 2.4-4.4セント(3-5円)のプレミアムで 15年間合計 6000万 kWhを
販売する予定である。
オーストラリアではさまざまな小売業者を通して 10 万以上のグリーン電力購入者がいる。
グリーン電力購入は他の国々にも広がっている。一例として、中国では上海にある 12 の企業
が 2005 年に 3 つのローカルウィンドファームからグリーン電力を自主的に購入し始め、これ
が中国における初の購入となった。価格プレミアムは高く、一般電力よりも高い、kWhあたり
6セント(0.53元)となっている。
地方自治体による政策
世界中で多くの地方自治体が独自の自然エネルギー政策を行っている。各市では将来の自然
エネルギー目標や二酸化炭素排出削減目標を設定し、太陽熱温水や屋上太陽光発電を支援する
政策を行い、都市計画の手法や過程を将来のエネルギー消費に見合うよう修正し、実証実験や
パイロット施設を建設したり、他にもさまざまな政策やプログラムを行ったりしている(表 7
参照)。[N35]
多くの都市では市庁舎や業務に導入するためにグリーン電力購入を行っている。例としては、
アメリカ合衆国のポートランド、オレゴン、サンタモニカ、カリフォルニアが挙げられ、必要
な電力の 100%をグリーン電力で購入している。自治体の電力の 10-20%をグリーン電力にして
いるほかのアメリカの都市には、シカゴ、ロサンゼルス、ミネアポリス、サンディエゴがある。
多くの都市では、市政だけでなく市内のすべての消費者が使う電力の 10-20%を自然エネル
ギーとする将来目標を設定している。その例としてはオーストラリアのアデレード、南アフリ
カのケープタウン、ドイツのフライブルク、アメリカ合衆国のサクラメント(カリフォルニア
州)がある。これらの目標は通常 2010年から 2020年の期間のうちの数年間を設定している。
韓国のテグのように、2012年までに 5%の目標を設定するような、全エネルギー消費のうちの
シェアで目標を設定しているところがある。また、ほかの都市では導入発電設備に関連した目
標を設定しているところもあり、イギリスのオックスフォードや南アフリカのケープタウンで
は、2010 年までに全家庭の 10%に太陽熱温水を導入することを目標としている(オックスフ
ォードでは太陽光発電も同様である。)。スペインのバルセロナでは 2010 年までに太陽熱温水
を 10 万㎡とする目標を立てている。またイギリスの地方都市のなかには特定の大きさ以上の
24 2005年には他社も参入

| RENEWABLE 2005 GLOBAL STATUS REPORT |
PAGE 52
すべての新築の建物にオンサイト型の自然エネルギー設備を設置することを決めているところ
もある。
表 7 自然エネルギー目標や政策を行っている主要都市の例
自然エネルギ
ー目標
二酸化炭素削
減目標
太陽熱温水
太陽光発電
都市計画、
その他
アデレード(オーストラリア) ● ● ●
バルセロナ(スペイン) ● ● ● ● ●
ケープタウン(南アフリカ共和国) ● ● ●
シカゴ(アメリカ合衆国) ●
テグ(韓国) ● ● ●
フライブルク(ドイツ) ● ● ● ●
ヨッテボリ(スウェーデン) ●
光州(韓国) ● ● ●
ハーグ(オランダ) ●
ホノルル(アメリカ合衆国) ●
リンツ(オーストリア) ●
ミネアポリス(アメリカ合衆国) ● ●
オックスフォード(イギリス) ● ● ● ● ●
ポートランド(アメリカ合衆国) ● ● ● ● ●
青島(中国) ●
サンフランシスコ(アメリカ合衆国) ●
サンタモニカ(アメリカ合衆国) ●
札幌(日本) ● ●
トロント(カナダ) ●
バンクーバー(カナダ) ●
いくつかの都市では二酸化炭素排出削減目標を提案したり設定したりしており、京都議定書
の目標を満足するように、通常、基準年(1990年レベルが通常)に対して 10-20%の削減とし
ている(ただし、市のレベルでは、産業に関連する排出は必ずしもその市民に適用できるとは
言えないため、このような目標設定は困難である。)。例としては、ドイツのフライブルク(25%)、
韓国の光州(20%)、日本の札幌(10%)、カナダのトロント(市政が消費するエネルギーに関
する 20%)、カナダのバンクーバー(6%)がある。オランダのハーグでは、2006 年までに市
政のエネルギー消費を CO2ニュートラルとする計画をしており、長期的には市全体を CO2ニ
ュートラルとすることを考えている。オーストラリアのアデレードでは、2012年までに建物内、

| RENEWABLE 2005 GLOBAL STATUS REPORT |
PAGE 53
2020年までに輸送内でゼロエミッションとすることを計画している。
将来のクリーンエネルギービジョンにつながる都市計画は多くの都市で行われており、さま
ざまなステークホルダーが参加して作成されている。スウェーデンのヨッテボリでは、ヨッテ
ボリ 2050 というプロジェクトで長期的なビジョンを作成している都市の一例である。このプ
ロジェクトは、大学や市政、市のエネルギー関連施設と協力して行われるものである。研究、
計画作成、戦略プランニング、市民との対話、実証実験プロジェクトが行われることが盛り込
まれている。日本では地方レベルでは国のプログラムの支援を受けて、過去 10 年で 800 の地
方自治体が将来の都市ビジョンを設定している。これらの日本の都市は、地方の特性を考慮し
た進んだ独自のビジョンを作成しており、そのビジョンの中に自然エネルギーの利用も組み込
んでいる。
世界中の都市は、地方レベルでの自然エネルギー開発を支援するさまざまな世界的なイニシ
アチブを形成したりそれに参加したりしている。そういった組織としては、イクレイ-持続可能
性をめざす自治体協議会(ICLEI)の都市気候保全キャンペーンや、国際ソーラーシティ都市イ
ニシアチブ(ISCI)、ヨーロッパ太陽光都市イニシアチブ、ヨーロッパグリーン都市ネットワー
ク、ヨーロッパ気候連合といったものがある。

| RENEWABLE 2005 GLOBAL STATUS REPORT |
PAGE 54
5. 農村地域(独立型)自然エネルギー
農村地域(独立型)で最も一般的な自然エネルギー利用は、調理、照明、そしてその他の電
力、動力、揚水、そして暖房、冷房である。これらの利用方法は表 8にあらわされる。この表
では、「第一世代」もしくは「伝統的な」利用方法や技術(すなわち、未処理バイオ燃料、小水
力)と、「第二世代」の利用方法(すなわち、風力、太陽光、ガス化バイオマス、そして 1kW
未満の小水力)の両方をあらわしている。開発の関心の多くは第二世代の技術に向けられてい
るが、農村開発の専門家は、特に後発の途上国における継続的な第一世代技術の重要性という
点で、開発と自然エネルギーコミュニティーへの注目を喚起し続けている。このセクションで
は、表 8にもとづいて農村のエネルギー利用のいくつかについて議論し、それから農村地域の
電力供給政策についての議論をおこなう。[N36]
表 8 農村地域(独立型)における一般的な自然エネルギー利用 エネルギーサービス 自然エネルギー利用 伝統的代替品
調理(家庭用、業務用
ストーブやオーブン)
・バイオマスの直接燃焼(薪、農業廃棄物、
林業廃棄物、肥料、炭、その他)
・世帯規模発酵槽からのバイオガス
・ソーラー調理器
LGガス、灯油
照明とその他の小電力
需要(家庭、学校、街
灯、電気通信、工具、
ワクチン保存)
・水力(1kW以下、数 kW規模、小規模)
・世帯規模発酵槽からのバイオガス
・ガスエンジン付き小規模バイオマスガス
化装置
・村落規模の小規模系統システムと太陽光
/風力のハイブリッドシステム
・電気:独立型の住宅用太陽光発電システ
ム
ロウソク、灯油、バッテ
リー、セントラルバッテ
リー充電、ディーゼル発
電
動力(小規模産業) ・電気モーター付小水力
・バイオマス発電と電気モーター
・ガスエンジン付きバイオマスガス化装置
ディーゼルエンジンと
発電機
揚水(農業と飲料水) ・機械式風力ポンプ
・太陽光発電装置ポンプ
ディーゼルポンプ
暖房と冷房(作物乾燥
とその他の農業プロセ
ス、給湯)
・バイオマスの直接燃焼
・中小規模発酵槽からのバイオガス
・太陽熱作物乾燥機
・太陽熱温水器
・食糧保存用の製氷機
LP ガス、灯油、ディー
ゼル発電機

| RENEWABLE 2005 GLOBAL STATUS REPORT |
PAGE 55
「伝統的」利用法は、主に木質燃料、農業・林業廃棄物(残渣)、肥料、そして未処理バイオ
マス燃料を家庭での調理・暖房・その他の温熱需要のために燃焼することを意味する。いくつ
かのバイオマスは木炭に転換され、市場で売られている。多くの発展途上国では、全ての一次
エネルギー供給の多くの割合をバイオマスが占めている。2001年におけるその割合は、アフリ
カで 49%、アジアで 25%、そしてラテンアメリカで 18%という数字であった。2000 年には、
サハラ砂漠以南のアフリカの家庭が薪や木炭というかたちでおよそ 4 億 7000 万トンの木質燃
料(一人当たり 0.72トン)を消費している。比較として、インドと中国を合わせた消費量は 3
億 4000万トンである。サハラ砂漠以南のアフリカの農村世帯の 94%、都市世帯の 41%にとっ
て、薪もしくは農業残渣は主なエネルギー源である。農村世帯の 4%、都市世帯の 34%にとっ
て、木炭は主なエネルギー源である。そして、農村世帯の 2%、都市世帯の 13%にとって、灯
油は主なエネルギー源である。[N37]
伝統的バイオマス利用のコストと健康への影響(また、改良型バイオマスストーブとその他
の技術による便益)は、このレポートの射程を超えるものであるが非常に重要である。バイオ
マス燃料の多くは、特に女性に対して収集時間に対価が支払われることなく、市場経済の外で
収集されている。Ezzatiや Kammenなどの研究者は、総合的な文献レビューの中で次のように
述べている。「固形燃料による室内の空気汚染への暴露に起因する死亡の 2000年における世界
的な合計は、控えめに見積もっても 150万-200万人であり、これは世界の合計死亡者数の 3~
4%にあたる。」[N37]
調理:改良型バイオマス調理ストーブ
改良型バイオマスストーブは、同じ調理方法に対して 10-50%のバイオマス消費を節約し、
室内の空気の質を劇的に改善する。改良型ストーブは、その大部分が政府の利用促進のもと、
中国やインドで事業化されてきており、ケニヤでは大規模な市場が発展している。現在、世界
中で 2億 2000万台の改良型ストーブが利用されており、それは過去 20年にわたる多様な公共
プログラムと民間市場の成功によるものである。この数字は、伝統的なバイオマスを主な調理
燃料として利用する約 5億 7000 万世帯に相当する。現在中国にある 1 億 8000 万台の改良型
ストーブは、そのような世帯の約 95%に相当する。インドの 3400万台の改良型ストーブは、
そのような世帯の約 25%に相当する25。[N38]
アフリカでは、過去数十年にわたる研究、普及、そして事業化の努力によって、一連の改良
25 改良型バイオマスストーブは、自然エネルギーの生産技術というよりはむしろ適切な燃料効率技術として考えられている。それでもしかし、改良型バイオマスストーブは、多大な適用可
能性を備えた農村の自然エネルギー利用であるということは明らかである。そのため、高効率
ストーブを促進する政策やプログラムは、このレポートでカバーされている他の自然エネルギ
ーに象徴されるような自然エネルギー「促進」政策ではなく、むしろ健康、経済、そして現行
の自然エネルギー利用の資源影響の改善のために策定されている(そのため、これは森林や土
地の持続可能な管理と密接にリンクしている)。現在使用されている改良型ストーブの数はここ
で示されている値より大幅に小さいかもしれない:例えば、インドではストーブの大半が使用
期間を過ぎており、もはや使われていないという推測が行われている。

| RENEWABLE 2005 GLOBAL STATUS REPORT |
PAGE 56
型木炭ストーブ(そして現在では薪燃焼型ストーブ)が利用されている。事業化をサポートし
てきたプログラムや政策と同様、これらのストーブのデザインの多くはかなりの成功をおさめ
ている。今では 500万台の改良型ストーブが利用されている。ケニヤでは、セラミックジッコ
ーストーブ(KCJ)が都市世帯の半分以上、農村世帯のおよそ 16-20%以上で見られる。アフ
リカの約 3分の 1の国には改良型バイオマスス調理ストーブのためのプログラムがあるのだが、
具体的な政策が実行されることはほとんどない。むしろ NGO や小企業が促進し続け、ストー
ブを市場に出すほうが良いだろう。
調理と照明:バイオガス発酵槽
世界中のおよそ 1600万の世帯は、照明や調理のためのエネルギーを世帯規模のプラント(嫌
気性発酵槽と呼ばれている)から得ている。これは中国の 1200万世帯、インドの 370万世帯、
そしてネパールの 14万世帯を含んでいる。調理や照明用のエネルギーを供給することに加え、
バイオガスは間接的に農村世帯の生計を改善している。例えば、ネパールでのバイオガスの便
益分析は、世帯 1日当り 3時間の女性・少女の労働負荷削減、世帯当り年間 25リットルの灯
油の節約、世帯当り年間 3トンの薪燃料、農業廃棄物、肥料の節約を示している。[N39]
中国では、農村家庭の照明や調理用の世帯規模バイオガスは、広く普及した自然エネルギー
利用である。典型的な発酵槽は、地域にもよるが、6-8立方メートルのサイズで年間 300㎥の
バイオガスを生産し、1500-2000元(200-250ドル)のコストがかかる。発酵槽はシンプルな
技術なので、高度な専門的知識を必要とせず、そのため地域の小さな企業が供給することが可
能である。適切な研修を受けた後、農家は自ら発酵槽をつくり、操作することができる。2002
年にはじまった新しい政府プログラムは、自ら発酵槽をつくる農家に対して年間合計 10 億元
を補助金として支出している。発酵槽 1台当りの補助金は 800元である。ある推計では、毎年
100 万台のバイオガス発酵槽が生産されているという。中国では世帯規模を超えて、数千の中
規模・大規模の工業バイオガスプラントが操業しているが、これは近年の国家的なバイオガス
行動計画がそういったプラントの拡大を期待していることによるものである。
インドでは、1980年代はじめから非従来型エネルギー資源省(MNES)が世帯規模のバイオ
ガスプラントを推進してきた。この省では、補助金、バイオガスプラントの建設・維持への融
資、研修、普及啓発、技術センター設置などをおこない、地域での実行機関をサポートしてい
る。有名なカディ農村産業委員会もバイオガスプラントをサポートしている。
ネパールでは、SNV/バイオガスサポートプログラムが、世帯規模のバイオガスプラント(4-20
立方メートルサイズ、もっとも人気があるのは 6立方メートルのもの)の技術革新、ファイナ
ンス、エンジニアリング、市場展開を提供している。プログラムの期間中に 60 のバイオガス
の民間企業が技術・市場能力を高め、100 の小口融資組織が融資をおこない、品質基準が取り
入れられ、恒久的な MFO:ネパール・バイオガスセクター・パートナーシップがつくられた。

| RENEWABLE 2005 GLOBAL STATUS REPORT |
PAGE 57
電気、熱、動力:バイオマスガス化
小規模バイオマス熱分解ガス化は、いくつかの発展途上国、とくに中国とインドにおいて、
事業的に成長しつつある技術である。ガス化装置から発生するガスは、熱需要のために直接燃
焼させることができ、電力や動力のためにガスタービンやガスエンジンで使用することもでき
る。中国のいくつかの地域では、配管による供給ネットワークを通じて、熱分解ガス化装置か
ら発生するバイオガスを調理用燃料として提供している。インドにおけるガス化装置の全設備
容量は、2002年時点で 3万 5000kWであり、10企業が 300kWまでのエンジンがついた小規
模ガス化装置を販売している。フィリピンでは、1980年代からガス化装置はガスと液体燃料を
燃料として駆動できるディーゼルエンジンと組み合わされ、精米や灌漑に使われている。ガス
化装置は、インドネシア、タイ、スリランカでも実践されている。[N40]
インドでは、絹やその他の織物生産地におけるバイオマスガス化プロジェクトは事業ベース
で実践され、そこでは地域の起業家が短期間での投資回収をおこなっている。スパイス(カル
ダモン)乾燥にもガス化装置が使われ、電力には依存していない上に、短時間の乾燥で高品質
の製品をつくることができている。この利用法では、投資は単季で回収される。受益者の 85%
以上は 2ヘクタール未満の小規模生産者である。ゴム乾燥にもガス化装置が使われ、そこでも
伝統的なエネルギー利用からの転換を実践すると同時に、1 年以内の投資回収がおこなわれて
いる。窯での焼成前のレンガの乾燥にもガス化装置は使われている。ガス化装置の利用は、一
方では労働条件を改善しつつ、燃料消費とそれにともなう煙を削減し、乾燥時間を短縮してい
る(生産性の向上)。
電気:村落規模の小規模系統システム/ハイブリッドシステム
村落規模の小規模系統システムは、数十もしくは数百の世帯をまかなうことができる。もと
もと遠隔地や離島の小規模系統システムはディーゼル発電機や小水力でおこなわれていた。主
にアジアにおいて、しばしばバッテリーや補助ディーゼル発電とハイブリッドされた太陽光発
電、風力、バイオマスは、伝統的なモデルに対する代替モデルを提供しつつある。小水力を主
とした数万の小規模系統システムが中国にあり、一方でインド、ネパール、ベトナム、スリラ
ンカには数十万の小規模系統システムが存在する。小規模系統システムやハイブリッドシステ
ムにおける風力や太陽光発電技術利用は、世界でも、特に 2000年以降中国で導入された 1000
システム程度である。中国の「村落電力供給プログラム」は、2002年から 2004年の間に、太
陽光発電、風力―太陽光ハイブリッドシステム、小水力システムによって、1000の農村地帯の
100万人、25 万世帯に電力供給をおこなった。2002 年から 2004 年の間に 700の村落が、お
よそ 30-150kW(トータルで約 2 万 kW)の村規模の太陽光発電ステーションを手に入れた。
これらのいくつかは、風力発電とのハイブリッドシステムであった(風力はトータルで約
800kW)。もう一方の主な村落規模発電システムの導入地であるインドでは、550kWの太陽光
/風力ハイブリッドシステムが導入され、数千世帯相当の数十の村落に電力を供給している。
[N41]

| RENEWABLE 2005 GLOBAL STATUS REPORT |
PAGE 58
揚水、風力および太陽光発電
灌漑用、飲料用の揚水のための太陽光発電と風力発電は、広く受け入れられていて、さらに
多くのプロジェクトと投資がなされている。主にアルゼンチンで、およそ 100万台の風力ポン
プが揚水のために利用されており、数十年の発展につながっている。多数の風力ポンプがアフ
リカでも利用されており、具体的には、南アフリカ(30万)、ナミビア(3万)、カーボベルデ
(800)、ジンバブエ(650)、その他(2000)である。現在世界では、5万台以上の太陽電池駆
動ポンプがあり、それらの多くはインドにある。太陽電池駆動ポンプ(200-2000Wのもの)の
4000台以上は、インドの太陽電池駆動揚水プログラムの一部として、最近農村地域に導入され
たものである。西アフリカでは、1000台ほどのソーラー揚水が利用されていると推計されてい
る。飲料水のための太陽電池駆動揚水機の寄贈プログラムが、アルゼンチン、ブラジル、イン
ドネシア、ヨルダン、ナミビア、ニジェール、フィリピン、チュニジア、ジンバブエ、その他
の国々で現れている。[N42]
太陽光発電によって揚水、浄化をおこなう飲料水事業プロジェクトの仲間は、最近特にイン
ド、モルジブ、フィリピンで現れている。モルジブでのパイロット事業プロジェクトは 1日当
り 1000リットルの販売を見込み、世帯への供給価格は長期的に 1リットル当り 0.2-0.5セント
になると期待されている。もう一つの最近の例はフィリピンのセブ島でおこなわれている。1
台の 3kWの太陽電池駆動揚水装置が、ろ過・塩素処理した水を 10の村落に供給している。飲
料水を買うために、1200人の住民はプリペイドのデビットカードを使い、その価格は 20リッ
トルで 3フィリピン・ペソ(5.5セント)、もしくは 1リットル当り 0.3セントであり、これは
瓶詰めされた水の 10分の 1の価格である。水売上からの手数料は補助金ではない 10年ローン
の返済に充てられている。このスキームはフィリピンの他の 10の島で再現され、40の市町村
に住む 20万人の人々に飲料水を提供している。
電気:独立型の住宅用太陽光発電システム
2005 年までに、発展途上国の 200 万世帯以上が独立型の住宅用太陽光発電システムから電
力供給を受けている。これらのシステムの大半は、また、近年の地球規模での成長の大半はア
ジアのいくつかの特殊な国(インド、スリランカ、ネパール、バングラディシュ、タイ、中国)
でのものである。これらの国々では、小口融資や小規模システムの直取引によって経済性の問
題を克服し、政府や国際的な支援プログラムが市場をサポートしている26。これらのそれぞれ
26 地球環境ファシリティ(GEF)、世界銀行、国連環境計画(UNEP)によって支援されているプロジェクトは、2004年までに世界中で 41万台の小規模な住宅太陽光発電システムを導入し、その内訳は、中国の 23万台、スリランカの 7万 5000台、インドの 4万 5000台、バングラディシュの 4万台、ジンバブエの 1万台、その他の合同プロジェクトを通じた 1万台である。これは小規模な住宅用太陽光発電システムの単一の支援プログラムとしては最大のものである。
これらの機関によるプロジェクトや、他の政府プログラムは、農村エネルギーサービス免許制
度、もしくは「サービス料金」ビジネスモデルを採用している。例えば、南アフリカ、カーボ

| RENEWABLE 2005 GLOBAL STATUS REPORT |
PAGE 59
の国では、今や毎月数百から数千の世帯に新たな設備が導入されている(中国では 2005年に 1
ヶ月 1 万台の導入を報告している)。2004 年の年間総導入は 20 万台以上であった。インドネ
シアでは、いくつかの支援プログラムにより 4万台の独立型の住宅用太陽光発電システムを導
入したのだが、過去数年来のマクロ経済の悪化が持続的な成長を鈍らせている。アジア以外で
は、ケニヤ、モロッコ、メキシコを含む巨大なマーケットがある。もし政府の補助金やサービ
ス料金モデルなどの持続的な経済性が約束されるのならば、数多くのラテンアメリカ諸国の計
画は独立型の住宅用太陽光発電システムの成長に向けてシフトするだろう27。[N43]
農村の電力供給率が非常に低く、1 人当たりの国民所得も低いアフリカでは、いくつかの例
外を除いて、独立型の住宅用太陽光発電システムの顕著な成長は見られない。ケニヤでは、ア
フリカにおける導入量のほぼ半分に当たる 15 万台の独立型の住宅用太陽光発電システムがあ
り、市場成長は続いている。農村や郊外周辺地域の世帯への小モジュール導入を現金取引でお
こなうことで、成長が支えられている。モロッコは、2010年までに 15万台の独立型の住宅用
太陽光発電システム導入を目標としている。ウガンダには、独立型の住宅用太陽光発電システ
ムの導入とその他の教育・医療における生産性向上についての目標を掲げる主要な 10 年プロ
グラムがある。南アフリカでは、民間企業による「サービス料金」免許を通じて、農村の 20
万世帯に独立型の住宅用太陽光発電システムを数年で提供するプログラムを計画している。マ
リ、タンザニア、セネガルといったその他の国々は、限られた補助金を住宅用太陽光発電シス
テムのような農村の自然エネルギーに費やしている。しかしながら、一般的にいえば、アフリ
カの数百万世帯が独立型の住宅用太陽光発電システムを手に入れるだろうという性急な見込み
の実現は失敗している。経済性は依然として重要な問題であり、それは標準的な低価格の独立
型の住宅用太陽光発電システムの価格が、多くのアフリカの国々の平均収入よりも比較的高い
ということである。
民間のディーラーによる独立型の住宅用太陽光発電システムの売上は 5カ国における市場の
要であった:中国、スリランカ、インド、バングラディシュ、ケニヤの 5カ国である。中国と
ケニヤでは、システムは独占的に現金で売られている。インド、スリランカ、バングラディシ
ュでは、クレジット販売が経済性を改善し、市場を育成した。重要なイノベーションは、NGO
ベースの小口融資、ディーラーによるクレジット、事業銀行による消費者クレジットによって
起こされている。インドでは、現在多くの現金購入に混じって、2000を超える農村の銀行支店
が、ソーラー事業ローンプログラムの一部として、独立型の住宅用太陽光発電システム購入の
ためのクレジットを提供している。実際に、過去 5年の間にインド、スリランカ、バングラデ
ィシュでクレジット販売が見積もられた 1万 2000台の独立型の住宅用太陽光発電システムは、
ベルデ、アルゼンチン、セネガル、ボツワナでおこなわれているのだが、そういったビジネス
モデルは、実行可能性を実証する上でいまだ初期段階にある。 27 世帯規模の固定型システムに加え、小規模な住宅用太陽光発電システムは、インドの 50万世帯以上とその他の国々の「ソーラーランタン」も含んでいる。コンパクトな蛍光灯は一般的
に小規模な住宅用太陽光発電システムによって利用されているが、低電圧 LEDや低コストのソーラーランタン用の冷陰極蛍光灯への関心も高まっており、小規模な住宅用太陽光発電システ
ムはより小さな太陽光発電セル容量を必要としている。

| RENEWABLE 2005 GLOBAL STATUS REPORT |
PAGE 60
実質的に世界のクレジットベースの導入の総ストックに相当する。ケニヤにも積極的な民間の
市場があり、20以上の主要な輸入・製造業者、数百の農村ベンダーや郊外の供給業者など、こ
れらの多くがブランドの販売をしている。
熱と電気のその他の生産への利用
小規模産業、農業、電気通信、衛生、教育分野における農村での熱と電力の産業利用は、現
代的な自然エネルギー技術利用の分野として関心を集めている。工業分野における利用の例と
しては、絹生産、レンガ生産、ゴム乾燥、手工業生産、裁縫、溶接、木材加工がある。農業と
食品加工分野における利用の例としては、灌漑、食品乾燥、穀物の製粉、ストーブとオーブン、
製氷、家畜用フェンス、牛乳の冷蔵などがある。衛生分野における利用には、ワクチン冷蔵と
照明がある。電気通信分野における利用には、映画、電話、コンピューター、ラジオ放送があ
る。その他に、コミュニティーのための利用として、学校や街頭の照明、飲料水の浄化がある。
このように多様で潜在的な利用可能性があるにもかかわらず、現在行われているプロジェクト
はいまだに小規模なデモンストレーションでしかない。通例、持続可能で事業的にも複製可能
となる、これらの利用方法の大規模な発展はいまだに起こっていない。
照明、揚水、医療冷蔵、動力のための再生可能な電力の利用でさえ、強い関心を集めはじめ
たばかりであり、現代的な自然エネルギーの熱需要に対する利用に関しては、ほとんど議論さ
れてもいないし、実践もされていない。伝統的なバイオマス燃料は、熱生産とそれに関連する
サービスに用いられてきた。例えば、調理、暖房、穀物乾燥、焙焼、農業プロセス、窯、オー
ブン、食品加工プロセスである。太陽熱利用や高度なバイオマス利用技術は、発展コミュニテ
ィーの関心を集めはじめたばかりである。発展途上国の政府も同様にこれらの分野により注目
している。例えば、インド政府は、農村におけるバイオマスの電力利用、熱利用、動力利用の
ための包括的なプログラムを推進している。これには、燃焼、コジェネレーション、ガス化が
含まれている。これらの農村のエネルギープログラムは、数百の農村地域のすべての形態の家
庭、コミュニティー、生産の需要をターゲットにしている。
衛生と教育における自然エネルギー利用の良い例は、世界銀行/GEFウガンダ農村エネルギ
ー転換プロジェクトである。プロジェクトは、医療機器、スタッフ宿舎、照明、低温流通シス
テム、殺菌消毒、電気通信にエネルギーを供給し、衛生省にこのような利用の実行方法を具体
的に説明している。教育において、太陽電池は職業教育用の機器を駆動し、夜間授業とスタッ
フ宿舎の照明をおこなう。その他の利用としては揚水や事業がある。メキシコの「テレビ中等
教育システム」プログラムはもう一つの良い例である。このプログラムは、遠隔教育プログラ
ムを通じて農村学校の質を高めるためにデザインされており、多くの遠隔地の教育は、コミュ
ニケーションや遠隔教育のための機器の駆動を太陽電池に頼っている。グアテマラ、ホンジュ
ラス、ボリビアでは、「テレセンター」のための新しいモデルがあらわれており、これは公共サ
ービスセンターと営利電話サービスを結びつけるものである。
自然エネルギー関連ビジネスに取り組む中小企業への金融アプローチは、アフリカ、ブラジ

| RENEWABLE 2005 GLOBAL STATUS REPORT |
PAGE 61
ル、中国における国連環境計画(UNEP) /国連財団 「農村エネルギー事業開発プログラム
(REED)」やその他の金融イニシアチブを通じて、近年かなり高まっている。これらの企業は、
住宅用太陽光発電システム、揚水、ソーラー穀物乾燥、研削・製粉用のバイオ燃料エンジン、
ソーラー製パン、バイオマスブリケットとペレット、その他の収入を生み出す自然エネルギー
利用を含むさまざまなサービスと製品を提供している。支援プログラムや銀行クレジットへの
アクセスによって、農村地域ではそういった企業の数は増えている。
地域の電力供給政策とプログラム
国際支援プログラムと同様、国家の農村電力供給政策やプログラムは、自然エネルギーを「ア
クセス」戦略を補完するものとして採用している。つまり、中央の電力ネットワークへのアク
セス手段を持たない農村の人々にサービスを行き届かせるということである。世界の約 3 億
6000万世帯はいまだにそういったアクセスができずにいる。主な電力供給オプションは、次の
ようなものを含んでいる:電力網の拡張、小規模系統システム接続のディーゼル発電機、小規
模系統システム接続の自然エネルギー(太陽光、風力、ガス化バイオマス、場合によってはデ
ィーゼルにも接続)、世帯規模の自然エネルギー(住宅用太陽光発電システム、小風力タービン)。
しばしば伝統的なグリッドの拡張のコストは妨げられる;例えばケニヤでは、農村家庭への新
規接続コストの平均は国民所得の 7倍である。[N44]
農村や遠隔地へ電力を提供する際に、系統を拡張するより費用対効果の優れた代替手段とし
て、多くの途上国で、自然エネルギー技術へ大きな関心が集まっている。同時に、貧困撲滅と
いう発展のゴールや、すべての人が電力にアクセスできる(ユニバーサルアクセス)ためには、
私的な投資だけでは不十分であり、公的な補助金や政策が重要な役割を担うという認識が広ま
っている。世界銀行のプロジェクトマネジャーは、「わたしたちの顧客であるラテンアメリカ諸
国のすべてが、自然エネルギーを含めた手段が、無電化地域の“最後の 20%の人々”へと届く
ためには、補助金と規制的手法が必要だと言っている」と述べている。
いくつかの国、特にラテンアメリカにおける農村電力供給プログラムは、電力を供給すべき
家屋への住宅用太陽光発電システム導入のための大規模な投資を明確に組み入れている。政府
はグリッド拡張が不可能な農村地域を地理的に認識しており、ライン拡張電力供給プログラム
を補完するため、これらの地域への自然エネルギー導入のための明確な政策と補助金を機能さ
せている。例えば、ブラジルは「すべての国民に灯りを」プログラムのもと 2008年までに 250
万世帯に電力を供給することを計画しており(すでに 70万世帯に供給されている)、その内 20
万人もしくは 10%の世帯には自然エネルギーを供給することを目標としている。すでに述べて
いるように、中国は「村落電力供給プログラム」を 2004年に成功させており、農村地域の 100
万人に自然エネルギーの電力を提供している。インド政府の「遠隔地電力供給プログラム」は、
部分的にはガス化バイオマスのような自然エネルギー技術を使い、1 万 8000 の村落に電力供
給をおこなったことを確認している。最近、その他のラテンアメリカの国のいくつかは、ボリ
ビア、チリ、グアテマラ、メキシコ、ニカラグア、ペルーを含む、農村への新しい電力供給プ
ログラムを推進している。これらの国の多くは、農村への新たな電力供給におけるスタンダー

| RENEWABLE 2005 GLOBAL STATUS REPORT |
PAGE 62
ドオプションとして、「メインストリームの」自然エネルギーを推進している。例えば、最近チ
リは国家の農村電力供給プログラムが第 2段階に入り、自然エネルギーがカギとなる技術であ
ることを認識した。こうした農村電力供給における自然エネルギーのスケールアップにともな
って、監督機関と電力会社は、法的枠組みや規制枠組みが早急に採択されることを必要として
いる。実際、アルゼンチン、ボリビア、ブラジル、チリ、グアテマラ、ニカラグアでは、2005
年から 2004年の間に新しい法律と規制があらわれている。
バングラディシュ、中国、インド、ネパール、フィリピン、スリランカ、タイ、ベトナムを
含むアジアの国々の例は、農村の電力供給に自然エネルギーを利用することを明確に規定して
いる。これらの国のいくつかは、多国間の支援のもとに融資プログラムをおこなっており、同
様に多国間で技術支援や支援策もおこなっている。フィリピンは、2007年までに農村への完全
な電力供給を目指し、1999年から戦略を推進しており、その戦略には明確に自然エネルギーが
含まれている。スリランカは、人口の 85%に電力へのアクセスを可能にすることを目標とし、
直接農村の住宅用太陽光発電システムへの補助をはじめた。タイは、2005年までに国内の独立
型の 30万世帯に住宅用太陽光発電システムによって電力を供給することを 2003年に決定し、
2004年には目標のほぼ半分が達成されている。

| RENEWABLE 2005 GLOBAL STATUS REPORT | PAGE 63
用語解説
バイオディーゼル ディーゼルエンジン車、トラック、バス等に用いられる輸送燃料。バイオディーゼルは大豆、
菜種、カラシナといった油料種子、廃食油のような他の植物油から生産される。
バイオガス発酵槽(消化槽) 畜産残さや植物残さを照明や調理、暖房や発電に使えるガスへと転換する装置。
バイオマス発電および熱 林業残さや穀物残さ、エネルギー作物、都市固形廃棄物や産業廃棄物に含まれる有機物から発
電や熱利用を行うこと。バイオガスからの発電とその過程での発熱も含む。
設置補助金または奨励金 太陽熱温水システムや住宅用太陽光発電システムの初期投資の一部を賄うために政府や電力会
社から支払われる補助。
エタノール バイオマス(通常トウモロコシ、サトウキビ、小麦など)から生産される輸送燃料であり、通
常のガソリンと任意の割合で混合でき、特別仕様の車では純粋なエタノールを使用できる。
固定価格制(Feed-in tariff) 発電者が自然エネルギーを電力会社に固定価格で販売できるよう定めた政策。いくつかの政策
では固定料金であり、他には市場価格に固定の上乗せ料金を定める方法もある。さらにいくつ
かは両方を定めている。
ガソホール ガソリンとエタノールの混合物であり、通常 10-20%がエタノールである。(E10 や E25 と呼
ばれる。)
地熱発電および熱利用 地下から排出される熱エネルギーであり、通常温水や蒸気の形で見られる。発電や建築物、産
業、農業用への直接熱利用が行われている。
グリーン電力の購入 市民や商業、政府産業による自発的な自然エネルギー電力の購入であり、電力会社(グリーン
電力料金制度参照)からの購入、既存の電力会社以外の電力供給者・特定規模電気事業者(PPS)
からの購入(グリーン電力マーケティング、とも呼ばれる)、証書発行事業者などからのグリー
ン電力証書の購入がある。グリーン電力料金制度やそれに相当する販売では、消費者の電力需

| RENEWABLE 2005 GLOBAL STATUS REPORT |
PAGE 64
要は、自分がつながっている電力系統に流される自然エネルギーの発電量と同量となる。グリ
ーン電力証書では、自然エネルギーの発電はどこででも良い。
投資税控除 自然エネルギーへの投資が全てまたは一部が税や収入から控除される。
キロワットアワー(kWh) 電気の生産や消費の単位。同様に電気の小売価格の最もよく使われる単位は円/kWhである。
大規模水力発電 通常ダムにより水の落差を用いる発電方法。大規模水力と中小水力を仕切る値についての国際
的な基準は定められていないが、2500-5万 kWが上限であり、最もよく使われるのは世界ダム
会議で議論された 1万 kWである。
モダンバイオマス 伝統的バイオマスとして定められているもの以外のバイオマス利用技術であり、バイオマスコ
ジェネレーションやバイオマスガス化、バイオマス発酵槽、輸送用バイオマス燃料の生産など
が挙げられる。
国際機関 国際的に活動する公共機関であり、世界銀行のように発展途上国に開発、環境、財政支援など
を行うものと国際連合のように国際的な取り決めや取引を仲介するものがある。
ネットメータリング 配電網と自ら発電を行う消費者の間で逆潮流を認めること。同時消費が発電量を超えた場合に
はメーターが加算される。発電量が消費量を超えている場合にはメーターは逆回転を行い、電
気は系統に流れていく。消費者はそれぞれの支配時期に使われた正味の電気代を支払い、月ご
との正味発電量を持ち越すことも認められることもある。
税制優遇措置 所定の設備の投資者や所有者に発電設備により生産された電気量に応じて税の還付が行われる
制度。
自然エネルギー目標値 将来のある時期までに一定量の自然エネルギーを導入する国ごとの約束、計画、目標。目標値
の中には法制化されるものもあり、特定の期間や省庁により定められるものもある。さまざま
な度合いの影響が考えられる。計画目標や開発計画、社会的な約束とも呼ばれることもある。
自然エネルギー割当基準制度(RPS) 販売電力量や導入容量の一定割合を自然エネルギーとすることが要求される基準。義務を持つ
| RENEWABLE 2005 GLOBAL STATUS REPORT | PAGE 65
電力会社は自身が自然エネルギーの発電を行う、他社の電気を購入する、PPSから顧客に直接
供給することにより目標を達成することが要求される。
小水力、ミニ水力、マイクロ水力、ピコ水力(大規模水力を参照)
小水力は 1万 kW以下、ミニ水力は 1000kW以下、マイクロ水力は 100kW以下、ピコ水力は
1kW以下と一般に定義されている。ピコ水力は通常ダムを必要とせず、小さな落差で発電を行
う。
住宅用太陽光発電システム 電力網に連系していない地域で相当量の電気を供給することができる屋根置きの太陽光パネル、
バッテリー、充電装置。通常一日の充電により夜間の照明(高効率照明を使用)やテレビの視
聴が可能である。
太陽熱温水/給湯 給湯や暖房用の温水を作り、タンクに貯蔵する屋根置の集熱装置。
太陽光パネル/モジュール/セル 太陽光を電気に変換する。セルはモジュールやパネルを製造する際の基本構成要素。
取引可能な自然エネルギー証書(グリーン電力証書) それぞれの証書が1単位の自然エネルギーの発電量を証明する。これらの証書は消費者や発電
事業者の間での自然エネルギーの義務の達成の取引などに使われ、アメリカ合衆国のようにい
くつかの市場では自然エネルギーのグリーン電力価値分としてだれでも購入することができる。
伝統的バイオマス利用 農業残さや林業残さ、薪、家畜排泄物を含む処理されていないバイオマスであり、特に農村地
域で調理や暖房、農業用や産業用としてストーブや炉で燃やされる。
グリーン電力料金制度 電力会社が消費者に通常価格の異なる様々な自然エネルギーの割合の電気を選択させる。電力
会社は全てのグリーン電力購入の需要を満たす量の自然エネルギーの発電を行うか、購入して
くることを保証する。

| RENEWABLE 2005 GLOBAL STATUS REPORT |
PAGE 66
対訳表
表 9 正式名称対訳表 (Notes & Referenceの語も含む)
日本語訳 英語名 略称
10万戸屋上計画 100000 roofs program
10万戸屋上太陽光発電プログラム 100000-rooftop program
21世紀のための自然エネルギー政策ネッ
トワーク
Renewable Energy Policy Network for
the 21st Century
REN21
AEE インテック AEE INTEC
BP BP BP
BPソーラー BP Solar
BTMコンサルト BTM Counsult
CLSAアジア太平洋マーケット CLSA Asia-Pacific Markets
CMTコンサルティング CMT Consulting
E+Co E+Co
ECN自然エネルギー政策情報サイト ECN Renewable Energy Policy Info
Website
EC-アセアン・エネルギー機関 EC-ASEAN Energy Facility EAEF
EPAグリーン電力パートナーシップ EPA Green Power Partnership
EU・中国エネルギー環境プログラム EU-China Energy and Environment
Programme
EUエネルギーイニシアチブ EU Energy Initiative
GE コマーシャル・アンド・コンシューマ
ー・ファイナンス・アームス
GE Commercial and consumer finance
arms
GEエナジー GE Energy
IBM IBM
ICF コンサルティング ICF Consulting Group ICF
LMグラスファイバー LM Glasfibre
OECD 開発援助委員会 Development Co-operation Directorate
(Development Assistance Committee)
DAC
PVニュース PV News
RWEショット・ソーラー RWE Schott Solar
SAGソーラーシュトロム SAG Solarstrom
SNV/バイオガスサポートプログラム SNV/Biogas Support Programme
TXU(テキサス州のエネルギー会社) TXU Energy TXU
アーストラック Earthtrack
アイルランド持続可能エネルギー Sustainable Energy Ireland

| RENEWABLE 2005 GLOBAL STATUS REPORT | PAGE 67
日本語訳 英語名 略称
アクシオナ Acciona
アサヒ Asahi
アジア開発銀行 Asian Development Bank ADB
アジア技術研究所 Asian Institute of Technology
アジア代替エネルギープログラム Asia Alternative Energy Program ASTAE
アフリカエネルギー政策研究ネットワーク African Energy Policy Research
Network
AFREPREN
アフリカ・カリブ・太平洋の国々 African, Carribbean, and Pacific
Countries
ACP
アフリカ開発銀行 African Development Bank
アフリカ開発のための新パートナーシップ
行動計画
NEPAD Action Plan
(The New Partnership for Africa's
Development)
アフリカエネルギー国際首脳会議 African Ministerial Meeting on Energy
Proceedings
アメリカ・エタノール連合 American Coalition for Ethanol
アメリカ・エネルギー省 US Department of Energy US DOE
アメリカ・エネルギー情報局 Energy Information Administration EIA
アメリカ環境保護庁 U.S. Environmental Protection Agency EPA
アメリカ国務省 Department of State United States
アメリカ国立再生可能エネルギー研究所 National Renewable Energy Laboratory NREL
アメリカ再生可能エネルギー委員会 American Council on Renewable
Energy
アメリカ風力発電協会 American Wind Energy Association AWEA
アライアント・エナジー Alliant Energy
アルコア Alcoa
アンサルド Ansaldo
イー・オン・エナジー E.On Energie
イギリス環境・食料・地方事業省 Department for Environment, Food and
Rural Affairs United Kingdom
イギリス国際開発省 Department for International
Development
DFID
イクレイ 持続可能性をめざす自治体協議
会
International Council for Local
Environmental Initiatives
ICLEI
石川島播磨重工 Ishikawajima-Harima
イソフォトン Isofoton
イタリア電力公社エネル Ente Nazionale per l'Energia eLettrica
ENEL
イバーソル Ibersol

| RENEWABLE 2005 GLOBAL STATUS REPORT |
PAGE 68
日本語訳 英語名 略称
イベルドロラ Iberdrola
インターフェース Interface
インテル Intel
インド・エネルギー資源研究所 Energy and Resource Institute India
インド再生可能エネルギー開発局 India Renewable Energy Development
Agency
IREDA
インド自動車製造協会 Society for Indian Automobile
Manufacturers
SIAM
インドネシアNGO電力部門再構築作業部
会
Indonesia NGOs Working Group on
Power Sector Restructuring
インド非従来型エネルギー資源省 Ministry of Non-conventional Energy
Sources India
MNES
インベステクスト Investext
インベスト・グリーン・ドットコム InvestGreen.com
インペリアル・カレッジ・ロンドン Imperial College of London
ウィンロック・インターナショナル Winrock International
ウェーベル・ソーラー] WEBEL Solar
ヴェスタス Vestas
ウガンダ・エネルギー鉱物開発省 Ministry of Energy and Mineral
Development Uganda
ウガンダ開発銀行 Development Bank of Uganda
ヴッパタール研究所 Wuppertal Institute
エヴァーグリーン・ソーラー Evergreen Solar
エクセル・エナジー XCEL Energy
エコ研究所 Öko-Institute
エコソルツィオーニ Ecosoluzioni
エコテック ECOTECH
エタノール拡大プログラム Ethanol Expansion Program EEP
エナジー・ディベロップメント Energy Developments
エニ Eni
エネルギー・セキュリティーグループ Energy and Security Group
エネルギー・環境管理庁 French Agency for Environment and
Energy Management
Ademe
エネルギー技術協力部門 Energy Technology Collaboration
Division
エネルギー資源研究所 The Energy Resource Institute TERI
エネルギー多様化と省エネ研究所 Institute for Energy Diversification and
Saving
IDAE

| RENEWABLE 2005 GLOBAL STATUS REPORT | PAGE 69
日本語訳 英語名 略称
エネルギーと水部門 Energy and Water
エネルギー環境グループ Energy Environment Group
エネルコン Enercon
エネルシス Enersis
エレクトリカル・イクイップメント・グル
ープ
Electrical Equipment Group Ltd.
エレクトリシテ Electricité
遠隔地電力供給プログラム Remote Village Electrification
Programme
エンデサ Endesa
エンロン・ウィンド Enron Wind
欧州委員会 European Commission EC
欧州環境機関 European Environment Agency EEA
欧州再生可能エネルギー評議会 European Renewable Energy Council EREC
欧州小水力連盟 European Small Hydropower
Association
ESHA
欧州太陽光発電工業会 European Photovoltaic Industry
Association
EPIA
欧州太陽熱産業連合 European Solar Thermal Industry
Federation
ESTIF
欧州投資銀行 European Investment Bank EIB
欧州風力エネルギー協会 European Wind Energy Association
欧州復興開発銀行 European Bank for Reconstruction and
Development
EBRD
オーストラリア・エタノール Australia Ethanol Limited
オーストラリア・ニュージーランド銀行 ANZ Bank
オーストラリア国際開発庁 Australian Agency for International
Development
AusAid
オーストリア・エネルギー庁 Austrian Energy Agency
オートメーション・ツーリング・システム Automation Tooling Systems
オーマット Ormat
オムロン Omron
オランダ・エネルギー環境庁 SenterNovem SenterNovem
オランダ外務省 Ministry of Foreign Affairs Netherlands
オレゴン技術研究所 Oregon Institute of Technology
開発協力機構 Agency for Development Co-operation DGIS
改良型調理用コンロプログラム National Improved Stove Program
輝き計画 Brightness
| RENEWABLE 2005 GLOBAL STATUS REPORT |
PAGE 70
日本語訳 英語名 略称
各州の自然エネルギーに対するインセンテ
ィブデータベース
Database of State Incentives for
Renewable Energy
DSIRE
カディ農村産業委員会 Khadi and Village Industries
commission
カナダ天然資源省 Natural Resources Canada
カナダ・ロイヤル銀行 Royal Bank of Canada
カナダ国際開発庁 Canadian international Development
Agency
CIDA
カナラ銀行 Canara Bank
カネカソーラーテック Kaneka Solar Tech
ガメサ Gamesa
ガメサ・エネルギア Gamesa Energia
カリフォルニア・エネルギー委員会 California Energy Commission
カリフォルニア大学バークレー校 University of California at Berkeley
カルパイン Calpine
カルマナ・テクノロジーズ Carmanah Technologies
環境エネルギー政策研究所 Institute for Sustainable Energy Policies ISEP
環境総局 DG Environment
環境ワーキング・グループ Environmental Working Group
韓国エネルギー経済研究所 Korean Energy Economics Institute
気候・オゾン・エネルギー部門 Climate, Ozone and Energy
気候とエネルギー部門 Climate and Energy
気候変動資本 Climate Change Capital
気候変動プログラム Climate Change Programme
技術・産業・経済部 Division of Technology, Industry and
Economics
京セラ Kyocera
キョンプック大学校 Kyungpook National University
クー・ツェル Q Cell
グラミン銀行 Grameen Shakti
グリーンe Green e
グリーンテック・エナジー・システムズ Greentech Energy Systems
グリーン電力パートナーシップ Green Power Partnership
グリーン電力料金プログラム green-pricing programs
グリーンピース Greenpeace
グリーンファンド green fund
グリーン都市宣言 Green Cities Declaration
クリッパー・ウィンドパワー・アンドAES Clipper Windpower and AES

| RENEWABLE 2005 GLOBAL STATUS REPORT | PAGE 71
日本語訳 英語名 略称
グローバル・ヴィレッジ・エネルギー・パ
ートナーシップ
Global Village Energy Partnership GVEP
グローバル・エナジー・ディシジョンズ Global Energy Decisions
グローバル・再生可能エネルギー・ファン
ドオブファンズ
Global Renewable Energy Fund of
Funds
公益基金 Public Benefit Fund
公的支持を受ける輸出信用ガイドラインに
関するアレンジメント
Arrangement on Officially Supported
Export Credits
コーニング Corning
ゴールドウィンド Goldwind
ゴールドマン・サックス Goldman Sachs
国際エネルギー機関 International Energy Agency IEA
国際エネルギー機関太陽熱利用冷暖房プロ
グラム
International Agency's Solar Heating
and Cooling Program
IEA-SHC
国際開発協会 International Development Association IDA
国際金融公社 International Finance Corporation IFC
国際原子力機関 International Atomic Energy Agency IAEA
国際水力協会 International Hydro Association IHA
国際ソーラーシティ都市イニシアチブ International Solar Cities Initiative ISCI
国際地熱協会 International Geothermal Association IGA
国際復興開発銀行 International Bank for Reconstruction
and Development
IBRD
国連開発計画 United Nations Development
Programme
UNDP
国連環境計画 United Nations Environment
Programme
UNEP
国連工業開発機関 U.N. Industrial Development
Organization
UNIDO
国連財団 U.N. Foundation
国連食糧農業機関 U.N. Food and Agriculture Organization FAO
国連世界環境デー会議 United Nations World Environment Day
コネルギー Conergy
再生可能エネルギー開発のための基金 Renewable Energy for Development
Fund
再生可能燃料協会 Renewables Fuels Association
在独ブラジル大使館 Embassy of Brazil in Germany
サイプレス・セミコンダクター Cypress Semiconductor
ザウター Sauter
サクラメント電力公社 Sacramento Municipal Utility District SMUD

| RENEWABLE 2005 GLOBAL STATUS REPORT |
PAGE 72
日本語訳 英語名 略称
サンパウロ州サトウキビ生産者協会 São Paulo's representative in the sugar
and alcohol industry
UNICA
サン・パワー Sun Power
サンウェイAGフォトボルタイック・テクノ
ロジー
Sunways AG Photovoltaic Technology
サンシャイン計画 Sunshine Program
サンテック Suntech
サンプ Sunpu
サンヨー Sanyo
シー・ウェスト Seawest
シーアン・ノーデックス Xi'an Nordex
シーメンス Siemens
シェル Shell
シェル財団 Shell Foundation
ジオダイナミックス Geodynamics
自然エネルギー2004国際会議 Renewables 2004 Conference
自然エネルギー・エネルギー効率化及び気
候変動プロジェクト
Renewable Energy, Energy Efficiency
and Climate Change Project
REACH Project
自然エネルギー行動計画 Renewable Energy Action Plan
自然エネルギー市民ファンド Japan Green Fund Co.
自然エネルギー世界会議 World Council for Renewable Energy WCRE
自然エネルギー政策プロジェクト Renewable Energy Policy Project REPP
自然エネルギー政策枠組み Renewable Energy Policy Framework REPF
持続可能なエネルギー・エネルギー効率化
パートナーシップ
Renewable Energy and Energy
Efficiency Partnership
REEEP
持続可能なエネルギーのための金融イニシ
アチブ
Sustainable Energy Finance Initiative SEFI
持続可能な開発のためのエネルギーに関す
る世界ネットワーク
Global Network on Energy for
Sustainable Development
GNESD
持続的発展のための地方政府ネットワーク Network of Regional Governments for
Sustainable Development
シティグループ Citigroup
シャープ Sharp
ジャーマンウォッチ Germanwatch
上海・省エネルギー管理センター Shanghai Energy Conservation
Supervision Center
ジョージタウン大学 Georgetown University
小規模住宅用太陽光発電計画 Small rooftop solar PV program
ジョンソン&ジョンソン Johnson&Johnson

| RENEWABLE 2005 GLOBAL STATUS REPORT | PAGE 73
日本語訳 英語名 略称
ジルカ・リニューアブル・エナジー Zilkha Renewable Energy
シンジケート銀行 Syndicate Bank
水質保全情報ネットワーク Water Conservation Information
Network
スイス開発協力庁 Swiss Agency for Development and
Cooperation
SDC
スウェーデン国際開発協力庁 Swedish International Development
Cooperation Agency
SIDA
スコットランド電力 Scottish Power
スズロン Suzlon
ステイプルズ Staples
ステラ・グループ Stella Group
スパイア Spire
スペイン国家エネルギー委員会 National Energy Commission Spain
すべての国民に灯りをプログラム Luz para todos
清華ーBPクリーンエネルギー研究教育セ
ンター
Tsinghua-BP Clean Energy Research
and Education Center
清華大学 Tinghua University
世界エネルギー会議 World Energy Council WEC
世界銀行 World Bank
世界銀行/GEF 中国自然エネルギープロ
ジェクト
World Bank/GEF China Renewable
Energy Project
世界銀行/地球環境ファシリティ・ウガン
ダ農村エネルギー転換プロジェクト
World Bank/GEF Uganda Energy for
Rural Transformation project
世界銀行/地球環境ファシリティ自然エネ
ルギー開発プロジェクト
World Bank/GEF Renewable Energy
Development Project
世界資源研究所 World Resources Institute WRI
世界自然保護基金 World Wide Fund for Nature WWF
世界風力エネルギー協会 World Wind Energy Association WWEA
世界風力会議 Global Wind Energy Council GWEC
世界地熱評議会 World Geothermal Council
積水化学 Sekisui Chemical
ゼネラル・エレクトリック General Electric GE
ゼネラル・エレクトリック/GEウインド General Electric/GE Wind
ゼネラルモーターズ General Motors
センター・フォー・リソース・ソリューシ
ョンズ
Center for Resource Solutions CRS
セントラロ・エレクトロニクス Centralo Electronics
ソーラー・インテグレイテッド・テクノロ Solar Integrated Technologies

| RENEWABLE 2005 GLOBAL STATUS REPORT |
PAGE 74
日本語訳 英語名 略称
ジーズ
ソーラー・ファブリック Solar-Fabrik
ソーラーシステム振興協会 Solar System Development Association
ソーラートロン Solartron
ソーラーパーク Solarparc
ソーラーワールド SolarWorld
ソーラトロンPLC Solartron PLC
ソニー Sony
ソルコ SOLCO SOLCO
ソロン Solon
村落電力供給プログラム Township Electrification Program
タイ・エネルギー省エネルギー政策計画事
務局
Energy Planning and Policy Office EPPO
太陽光発電システム貸付プログラム Solar Loan Program
タイ代替エネルギー開発効率化省 Department of Alternative Energy
Development and Efficiency Thailand
DEDE
ダウ Dow
多国間投資保証機関 Multilateral Investment Guarantee
Agency
MIGA
タタBPソーラー Tata BP Solar
タミル・ナードゥ電力委員会 Tamil Nadu Electricity Board
タリスマン・エナジー Talisman Energy
地球環境ファシリティ Global Environmental Facility GEF
地球の友 Friends of the Earth FOE
中国エネルギー研究所 Energy Research Institute China
中国国家バイオガス行動計画 China national biogas action plan
中国国家発展・改革委員会 National Development and Reform
Commission China
NDRC
中国自然エネルギー産業協会 Chinese Renewable Energy Industries
Association
中国農村エネルギー開発プログラム China Rural Energy Development
Programme
CREDP
中国風力エネルギー協会 China Wind Energy Association
中東欧におけるエネルギーに関するオース
トリア・エネルギー庁のサイト
enerCEE.net(Energy in Central and
Eastern Europe)
enerCEE
ツィンファオ・ヤン・アグアン Tsinghua Yang Aguang
ティアンプ Tianpu
デイスター Daystar
デービッドスズキ財団 David Suzuki Foundation

| RENEWABLE 2005 GLOBAL STATUS REPORT | PAGE 75
日本語訳 英語名 略称
デクシア Dexia
デュポン Dupont
デラウェア大学 University of Delaware
テラス研究所 Tellus Institute
テレビ中等教育システム Telescundaria
デンマーク環境省 Ministry of the Environment Denmark
デンマーク国際開発援助機関 Danish International Development
Assistance
Danida
電力供給計画 Power feed scheme
ドイチェ・シェル Deutsche Shell
ドイツ風力エネルギー協会 German Wind Energy Association BWE
ドイツ連邦環境・自然保護・原子炉安全省 Federal Ministry for the Environment,
Nature Conservation and Nuclear
Safety Germany
ドイツ連邦経済協力開発省 German Federal Ministry for Economic
Cooperation and Development
ドイツ技術協力公社 German Agency for Technical
Cooperation
GTZ
ドイツ航空宇宙センター German Aerospace Center GAC
ドイツ復興金融公庫 German Development Finance Group KfW
東芝 Toshiba
トクヤマ Tokuyama
都市環境協定 Urban Environmental Accord
都市気候保全キャンペーン Cities for Climate Protection campaign
トヨタ Toyota
トランス・カナダ TransCanada
トリオドス銀行 Triodos Bank
ナビガント・コンサルティング Navigant Consulting
南京PV-Tech Nanjing PV-Tech
日本国際協力銀行 Japan Bank for International
Cooperation
JBIC
日本自然エネルギー Japan Natural Energy Company JNEC
日本風力開発 Japan Wind Development
ニューエネルギー・ファイナンス New Energy Finance
ヌータス Nutas
ヌオン・アンド・エッセント Nuon and Essent
ネパール・バイオガス支援プログラム Nepal Biogas Support Programme
ネパール・バイオガスセクター・パートナ
ーシップ
Biogas Sector Partnership/Nepal

| RENEWABLE 2005 GLOBAL STATUS REPORT |
PAGE 76
日本語訳 英語名 略称
ネパール・バイオガス支援計画 Biogas Support Programme Nepal 2005
ノースク・ハイドロ・アンド・SNパワー Norsk Hydro and SN Power
農村エネルギー開発プログラム Rural Energy Development Programme REDP
農村地域エネルギー事業開発プログラム Rural Energy Enterprise Development REED
農村地域経済発展のための自然エネルギー
プログラム
Renewable Energy for Rural Economic
Development
RERED
ノベラ・エナジー Novera Energy
ノルデックス・エナジー Nordex Energy
バーゼル持続可能エネルギー局 Basel Agency for Sustainable Energy BASE
ハイドロ・ケベック Hydro Quebeck
ハイドロ・タスマニア Hydro Tasmania
バクスター Baxter
パシフィック・ハイドロ Pacific Hydro
バラット・ヘビー・エレクトリカル Bharat Heavy Electricals
パラン・タイ Palang Thai
バルセロナ・エネルギー改善計画 Barcelona energy improvement plan
バルセロナエネルギー局 Barcelona Energy Agency
バルセロナ自治大学 Autonomous University of Barcelona
日立 Hitachi
ピツニーボウズ Pitney Bowes
ヒポ・フェラインス銀行 Hypo Vereins Bank
ヒミン Himin
ヒューレット・パッカード Hewlett Packard HP
評価事務所 Office of Monitoring and Evaluation
ファ・ヤン Hua Yang
ファースト・ソーラーAZ First Solar -AZ
ファイブ・スター Five Star
フェデックスキンコーズ FedEX Kinko's
フォトボルテック Photovoltech
フォルティス Fortis
富士電機 Fuji
フライデラー Pfleiderer
ブラジル・バイオマスユーザーネットワー
ク
Biomass Users Network Brazil BUN
ブラスカン Brascan
フランス電力公社 Electricite de France EDF
フランス地球環境ファシリティ French FFEM FFEM
ブリティッシュ・エナジー British Energy
ブルームバーグ Bloomberg

| RENEWABLE 2005 GLOBAL STATUS REPORT | PAGE 77
日本語訳 英語名 略称
プロアルコール政策 ProAlocool
フロリダ電力 Florida Power and Light
分散型エネルギー世界連盟 World Alliance for Decentralized Energy WADE
米国電力研究所 Electric Power Research Institute EPRI
米州開発銀行 Inter American Development Bank IDB
ペンビナインスティテュート Pembina Institute
ボーナス Bonus
北海道グリーンファンド Hokkaido Green Fund HGF
北海道生活クラブ Seikatsu Club Hokkaido SCH
ボラレックス Boralex
ポリューションプルーブ Pollution Probe
ボン行動プログラム Bonn Action Programme
マーケット・ウォッチ・ドットコム MarketWatch.com
マサチューセッツ工科大学 Massachusetts Institute of Technology MIT
マハーラーシュトラ州立電力委員会 Maharashtra State Electricity Board MRSEB
丸紅 Marubeni
ミーコン Micon
ミッド・アメリカ・バイオフュールズ Mid-America Biofuels
三菱 Mitsubishi
三菱重工 Mitsubishi Heavy Industries
三菱電機 Mitsubishi Electric
南アフリカ開発共同体 Southern African Development
Community
SADC
南アフリカ資源エネルギー省 South Africa Department of Minerals
and Energy
メイ・ダ Mei Da
メキシコ国立自治大学 National Autonomous University of
Mexico
モース・アソシエーツ Morse Associates
モテック Motech
モルガン・スタンレー Morgan Stanley
モロッコ再生可能エネルギー開発センター Centre de Développement des Energies
Renouvelables Morocco
ユーラスエナジー Eurus
ユーロブザーバー(欧州再生可能エネルギ
ー観測所)
EuroObserv'ER
ヨーロッパ開発基金 European Development Fund
ヨーロッパ気候連合 European Climate Alliance
ヨーロッパグリーン都市ネットワーク European Green Citiies Network

| RENEWABLE 2005 GLOBAL STATUS REPORT |
PAGE 78
日本語訳 英語名 略称
ヨーロッパ太陽光都市イニシアチブ European Solar Cities Initiative
ヨーロッパ風力発電協会 European Wind Energy Association EWEA
ヨッテボリ2050 Göteborg 2050
ヨハネスブルク自然エネルギー連合 Johannesburg Renewable Energy
Coalition
JREC
ライン・ヴェストファーレン電力公社 Rheinisch-Westfälisches
Elektrizitätswerk AG
RWE
センター・フォー・リソース・ソリューシ
ョン
Center for Resource Solutions CRS
リニューアブル・エネルギー・アクセス・
コム
Renewable Energy Access.com
リヌオ・パラディマ Linuo Paradigma
リパワー・システム Repower Systems
リフォーカス ReFocus
ルンド大学 Lund University
ロイター Reuters
ローレンス・バークレー国立研究所 Lawrence Barkeley National Laboratory
ロサンゼルス水資源・電力委員会 Los Angels Department of Water and
Power
LADWP
ロンドン大学インペリアルカレッジエネル
ギー政策・技術センター
Imperial College Center for Energy
Policy and Technology
ICCEPT
ワールドウォーター・コーポレーション Worldwater Corporation
ワールドウォッチ研究所 Worldwatch Institute WWI

| RENEWABLE 2005 GLOBAL STATUS REPORT | PAGE 79
表 10 英語略称対訳表 (Notes & Referenceの語も含む)
略称 英語名 日本語名
ACP African, Carribbean, and Pacific Countries アフリカ・カリブ・太平洋の
国々
ADB Asian Development Bank アジア開発銀行
Ademe French Agency for Environment and Energy
Management
エネルギー・環境管理庁
AFREPREN African Energy Policy Research Network アフリカエネルギー政策研究
ネットワーク
ASTAE Asia Alternative Energy Program アジア代替エネルギープログ
ラム
AusAid Australian Agency for International
Development
オーストラリア国際開発庁
AWEA American Wind Energy Association アメリカ風力発電協会
BASE Basel Agency for Sustainable Energy バーゼル持続可能エネルギー
局
BP BP BP
BUN Biomass Users Network Brazil ブラジル・バイオマスユーザー
ネットワーク
BWE German Wind Energy Association ドイツ風力エネルギー協会
CIDA Canadian international Development Agency カナダ国際開発庁
CREDP
China Rural Energy Development
Programme
中国農村エネルギー開発プロ
グラム
CRS Center for Resource Solutions センター・フォー・リソース・
ソリューションズ
DAC Development Co-operation Directorate
(Development Assistance Committee)
OECD 開発援助委員会
Danida Danish International Development
Assistance
デンマーク国際開発援助機関
DEDE Department of Alternative Energy
Development and Efficiency Thailand
タイ代替エネルギー開発効率
化省
DFID Department for International Development イギリス国際開発省
DGIS Agency for Development Co-operation 開発協力機構
DSIRE Database of State Incentives for Renewable
Energy
各州の自然エネルギーに対す
るインセンティブデータベー
ス
EAEF EC-ASEAN Energy Facility EC-アセアン・エネルギー機関
EBRD European Bank for Reconstruction and 欧州復興開発銀行

| RENEWABLE 2005 GLOBAL STATUS REPORT |
PAGE 80
略称 英語名 日本語名
Development
EC European Commission 欧州委員会
EDF Electricite de France フランス電力公社
EEA European Environment Agency 欧州環境機関
EEP Ethanol Expansion Program エタノール拡大プログラム
EIA Energy Information Administration アメリカ・エネルギー情報局
EIB European Investment Bank 欧州投資銀行
ENEL Ente Nazionale per l'Energia eLettrica イタリア電力公社エネル
enerCEE enerCEE.net(Energy in Central and Eastern
Europe)
中東欧におけるエネルギーに
関するオーストリア・エネルギ
ー庁のサイト
EPA U.S. Environmental Protection Agency アメリカ環境保護庁
EPIA European Photovoltaic Industry Association 欧州太陽光発電工業会
EPPO Energy Planning and Policy Office タイ・エネルギー省エネルギー
政策計画事務局
EPRI Electric Power Research Institute 米国電力研究所
EREC European Renewable Energy Council 欧州再生可能エネルギー評議
会
ESHA European Small Hydropower Association 欧州小水力連盟
ESTIF European Solar Thermal Industry Federation 欧州太陽熱産業連合
EWEA European Wind Energy Association ヨーロッパ風力発電協会
FAO U.N. Food and Agriculture Organization 国連食糧農業機関
FFEM French FFEM フランス地球環境ファシリテ
ィ
FOE Friends of the Earth 地球の友
GAC German Aerospace Center ドイツ航空宇宙センター
GE General Electric ゼネラル・エレクトリック
GEF Global Environmental Facility 地球環境ファシリティ
GNESD Global Network on Energy for Sustainable
Development
持続可能な開発のためのエネ
ルギーに関する世界ネットワ
ーク
GTZ German Agency for Technical Cooperation ドイツ技術協力公社
GVEP Global Village Energy Partnership グローバル・ヴィレッジ・エネ
ルギー・パートナーシップ
GWEC Global Wind Energy Council 世界風力会議
HGF Hokkaido Green Fund 北海道グリーンファンド
HP Hewlett Packard ヒューレット・パッカード
IAEA International Atomic Energy Agency 国際原子力機関
IBRD International Bank for Reconstruction and 国際復興開発銀行

| RENEWABLE 2005 GLOBAL STATUS REPORT | PAGE 81
略称 英語名 日本語名
Development
ICCEPT Imperial College Center for Energy Policy
and Technology
ロンドン大学インペリアルカ
レッジエネルギー政策・技術セ
ンター
ICF ICF Consulting Group ICF コンサルティング
ICLEI Local Governments for Sustainability イクレイー持続可能性をめざ
す自治体協議会
IDA International Development Association 国際開発協会
IDAE Institute for Energy Diversification and Saving エネルギー多様化と省エネ研
究所
IDB Inter American Development Bank 米州開発銀行
IEA International Energy Agency 国際エネルギー機関
IEA-SHC International Agency's Solar Heating and
Cooling Program
国際エネルギー機関太陽熱利
用冷暖房プログラム
IFC International Finance Corporation 国際金融公社
IGA International Geothermal Association 国際地熱協会
IHA International Hydro Association 国際水力協会
iii energy
para 110
NEPAD Action Plan アフリカ開発のための新パー
トナーシップ行動計画
IREDA India Renewable Energy Development
Agency
インド再生可能エネルギー開
発局
ISCI International Solar Cities Initiative 国際ソーラーシティ都市イニ
シアチブ
ISEP Institute for Sustainable Energy Policies 環境エネルギー政策研究所
JBIC Japan Bank for International Cooperation 日本国際協力銀行
JNEC Japan Natural Energy Company 日本自然エネルギー
JREC Johannesburg Renewable Energy Coalition ヨハネスブルク自然エネルギ
ー連合
KfW German Development Finance Group ドイツ復興金融公庫
LADWP Los Angels Department of Water and Power ロサンゼルス水資源・電力委員
会
MIGA Multilateral Investment Guarantee Agency 多国間投資保証機関
MIT Massachusetts Institute of Technology マサチューセッツ工科大学
MNES Ministry of Non-conventional Energy Sources
India
インド非従来型エネルギー資
源省
MRSEB Maharashtra State Electricity Board マハーラーシュトラ州立電力
委員会
NDRC National Development and Reform
Commission China
中国国家発展・改革委員会

| RENEWABLE 2005 GLOBAL STATUS REPORT |
PAGE 82
略称 英語名 日本語名
NREL National Renewable Energy Laboratory アメリカ国立再生可能エネル
ギー研究所
REACH
Project
Renewable Energy, Energy Efficiency and
Climate Change Project
自然エネルギー・エネルギー効
率化及び気候変動プロジェク
ト
REDP Rural Energy Development Programme 農村エネルギー開発プログラ
ム
REED Rural Energy Enterprise Development 農村地域エネルギー事業開発
プログラム
REEEP Renewable Energy and Energy Efficiency
Partnership
持続可能なエネルギー・エネル
ギー効率化パートナーシップ
REN21 Renewable Energy Policy Network for the
21st Century
21世紀のための自然エネルギ
ー政策ネットワーク
REPF Renewable Energy Policy Framework 自然エネルギー政策枠組み
REPP Renewable Energy Policy Project 自然エネルギー政策プロジェ
クト
RERED Renewable Energy for Rural Economic
Development
農村地域経済発展のための自
然エネルギープログラム
RWE Rheinisch-Westfälisches Elektrizitätswerk
AG
ライン・ヴェストファーレン電
力公社
SADC Southern African Development Community 南アフリカ開発共同体
SCH Seikatsu Club Hokkaido 北海道生活クラブ
SDC Swiss Agency for Development and
Cooperation
スイス開発協力庁
SEFI Sustainable Energy Finance Initiative 持続可能なエネルギーのため
の金融イニシアチブ
SenterNovem SenterNovem オランダ・エネルギー環境庁
SIAM Society for Indian Automobile Manufacturers インド自動車製造協会
SIDA Swedish International Development
Cooperation Agency
スウェーデン国際開発協力庁
SMUD Sacramento Municipal Utility District サクラメント電力公社
SOLCO SOLCO ソルコ
TERI The Energy Resource Institute エネルギー資源研究所
TXU TXU Energy TXU(テキサス州のエネルギー
会社)
UNDP United Nations Development Programme 国連開発計画
UNEP United Nations Environment Programme 国連環境計画
UNICA São Paulo's representative in the sugar and
alcohol industry
サンパウロ州サトウキビ生産
者協会

| RENEWABLE 2005 GLOBAL STATUS REPORT | PAGE 83
略称 英語名 日本語名
UNIDO U.N. Industrial Development Organization 国連工業開発機関
US DOE US Department of Energy アメリカ・エネルギー省
WADE World Alliance for Decentralized Energy 分散型エネルギー世界連盟
WCRE World Council for Renewable Energy 自然エネルギー世界会議
WEC World Energy Council 世界エネルギー会議
WRI World Resources Institute 世界資源研究所
WWEA World Wind Energy Association 世界風力エネルギー協会
WWF World Wide Fund for Nature 世界自然保護基金
WWI Worldwatch Institute ワールドウォッチ研究所

| RENEWABLE 2005 GLOBAL STATUS REPORT |
PAGE 84
日本語版作成にあたって
本報告書は、21 世紀のための自然エネルギー政策ネットワーク(REN21)のために、米国・
ワールドウォッチ研究所がとりまとめた「RENEWABLES 2005: GLOBAL STATUS REPORT:
GSR2005」(主筆:Eric Martinot)を、環境エネルギー政策研究所の責任で日本語へ翻訳したも
のです。
REN21 は 2004 年にボンで開催された自然エネルギー国際会議(RE2004)を契機として発足
したネットワークで GSR2005は、RE2004のフォローアップ会議として 2005年 11月に開催
された、北京自然エネルギー国際会議で発表されました。
報告書は、急成長を続ける 2005 年時点での世界の自然エネルギーの状況を俯瞰する、新しい
未来の道筋を示した内容となっています。
環境エネルギー政策研究所は、自然エネルギーが初めて国際交渉会議のメインテーマとして取
りあげられた RE2004のフォローアップに積極的に取り組んでおり、この報告書へも執筆者と
して貢献しています。
2006年 7月には、アップデート版 GSR2006が出版されています。環境エネルギー政策研究所
では、2006年秋の出版を目指し鋭意翻訳を進めています。
REN21(英語):http://www.ren21.net/
GSR2005, Notes and Reference(英語):http://www.ren21.net/globalstatusreport/g2005.asp
GSR2006(英語):http://www.ren21.net/globalstatusreport/issueGroup.asp
本報告書の日本語版作成にあたって、下記のインターン、ボランティアの皆様にご協力いただ
きました。この場を借りて厚く御礼申し上げます。
阿部耕太郎さん、榎堀都さん、北原千絵さん、木村寿香さん、佐々木育子さん、中野希美さん、
春増知さん、古屋将太さん、細川和朗さん、和田冬彦さん (五十音順)

| RENEWABLE 2005 GLOBAL STATUS REPORT | PAGE 85
発行日:2006年 9月
発行所: 特定非営利活動法人 環境エネルギー政策研究所(ISEP)
所長 飯田哲也
日本語版翻訳・編集:梅原由美子、山下紀明、大林ミカ
―――――――――――――――――――――――――――――――――――――――――
特定非営利活動法人 環境エネルギー政策研究所
自然エネルギーを軸とする持続可能なエネルギー社会をめざし、研究および国際交流を進め
ている非営利の独立シンクタンク
〒164-0001 東京都中野区中野 4-7-3
TEL: +81-3-5318-3331 FAX: +81-3-3319-0330
URL: http://www.isep.or.jp