Renewable Energy Superpower - Beyond Zero …...n The world is shifting from polluting fossil energy...
100
Zero Carbon Australia Renewable Energy Superpower
Transcript of Renewable Energy Superpower - Beyond Zero …...n The world is shifting from polluting fossil energy...

Zero Carbon Australia
Renewable Energy Superpower
Zero Carbon Australia R
enewable Energy Superpow
er
The world is transitioning from the fossil energy era to the renewable energy era
Renewable energy and energy efficiency will attract more investment in the next 2 decades than the development of coal, gas and oil combined
Industry must be prepared to capitalise on the build out of renewable energy, this will be a limited time opportunity
Energy self-sufficiency will increase and the international energy trade will decrease
Nations with abundant high quality renewable resources, available land, skills and industry capacity can be Renewable Energy Superpowers
Australia’s economic renewable energy resource potential is greater than its coal, gas and oil resources combined
Energy intensive industry will migrate to Renewable Energy Superpowers
Australia can recover the competitiveness of its domestic energy by consolidating gas and petroleum use to renewable electricity, future proofing the nation
Renewable energy is Australia’s Superpower

Renewable Energy Superpower Renewable Energy Superpower

Zero Carbon Australia
Renewable Energy Superpower

Renewable Energy Superpower
II
© 2015
This work is licensed under the Creative Commons Attribution-NonCommercial-ShareAlike 3.0 Unported License. To view a copy of this license, visit http://www.creativecommons.org/licenses/by-nc-sa/3.0/ or send a letter to Creative Commons, 171 Second Street, Suite 300, San Francisco, California, 94105, USA.
ISBN 978-0-9923580-1-3
Published by Beyond Zero Emissions Kindness House Suite 12, Level 1 288 Brunswick Street Fitzroy, Victoria 3065 Phone: 03 9415 1301 www.bze.org.au
First edition October 2015
This document and appendices can be downloaded from http://bze.org.au
COVER IMAGE ELECTRIC ARC FURNACE PRODUCING HIGH GRADE SILICON. USED FOR ALUMINIUM ALLOYS, SEMI-CONDUCTORS, SOLAR CELLS AND FIBRE OPTICS. IMAGE COURTESY OF SIMCOA OPERATIONS. SILICON SMELTER, KEMERTON, WEST AUSTRALIA. SIMCOA.COM.AU
Acknowledgements
Author
Gerard Drew
Contributors
Stephen BygraveAilin SunKatie MeeBen GielewskiTim GoodsonMischa VickasJohannes HorlemannLaura PerriSascha SuessspeckPaulina RakowskaWilliam SandoverSpiro KanellakisKatia SidorovaJessica Van SonBozena PieniazekAhri TallonDamien HicksGeorg MolzJavad Jazaeri
Beyond Zero Emissions would like to thank the PMF Foundation for its generous support of this project.
Graphic designMark Carter

Donations over $2.00 are tax-deductible You can
help us produce climate solutions Researching Zero Carbon solutions for Australia is a hard job. The fact is that Beyond Zero Emissions relies on donations from hundreds of donors, both small and large. People like you. We don’t get Government backing. We are very careful to ensure that our research is independent.To do the research that needs to be done, to get the word out there, to empower Australians by providing them with scientifically sound facts, all costs money. Your help will allow us to continue researching our Zero Carbon Australia solutions. And every cent helps.
Who are Beyond Zero Emissions?Beyond Zero Emissions is a not-for-profit research & education organisation. We are working to deliver a zero carbon Australia, relying on the support of people like you.
What is the Zero Carbon Australia project?The Zero Carbon Australia (ZCA) project is an exciting initiative of Beyond Zero Emissions and the University of Melbourne’s Energy Research Institute. The project is a road map for the transition to a decarbonised Australian economy.The latest and most credible science tell us such a transition is necessary in order to reverse climate disruption.The project draws on the enormous wealth of knowledge, experience and expertise within Beyond Zero Emissions and the community to develop a blueprint for a zero carbon future for Australia. There’s more about the ZCA project on the back of this page.
How can you help?Please tear out the donations form to the right, fill it in, seal the edges and send it to Beyond Zero Emissions, Suite 10, 288 Brunswick Street, Fitzroy, Vic 3065
Go to www.bze.org.au/donate
or fill out, detach, seal & send ☞
DE
TA
CH
AL
ON
G H
ER
E
REN
EWAB
LW E
NER
GY
SUP
ERP
OW
ER
I want to donateMy details
Salutation Mr , Mrs , Ms , Miss
First name
Surname
Address
P’code
Surname
Phone
I’d like to give
FREQUENCY Monthly , Once only
AMOUNT $25 , $55 , $105 , $205
Other $
My credit card details
Visa , Mastercard , American Express
Name on card
Card number
Verification no. Expiry /
My signature
I’ll take the Direct Debit option
Beyond Zero Emissions Fund BSB 633-000 Account 139914402
Please include your name with your direct debit details.
SE
AL
AL
ON
G H
ER
E
Beyo
nd Z
ero
Emis
sion
s
Suite
10, 2
88 B
runs
wic
k St
reet
Fitz
roy,
Vic
306
5
ST
AM
P
GO
ES
HE
RE The Zero Carbon Australia project
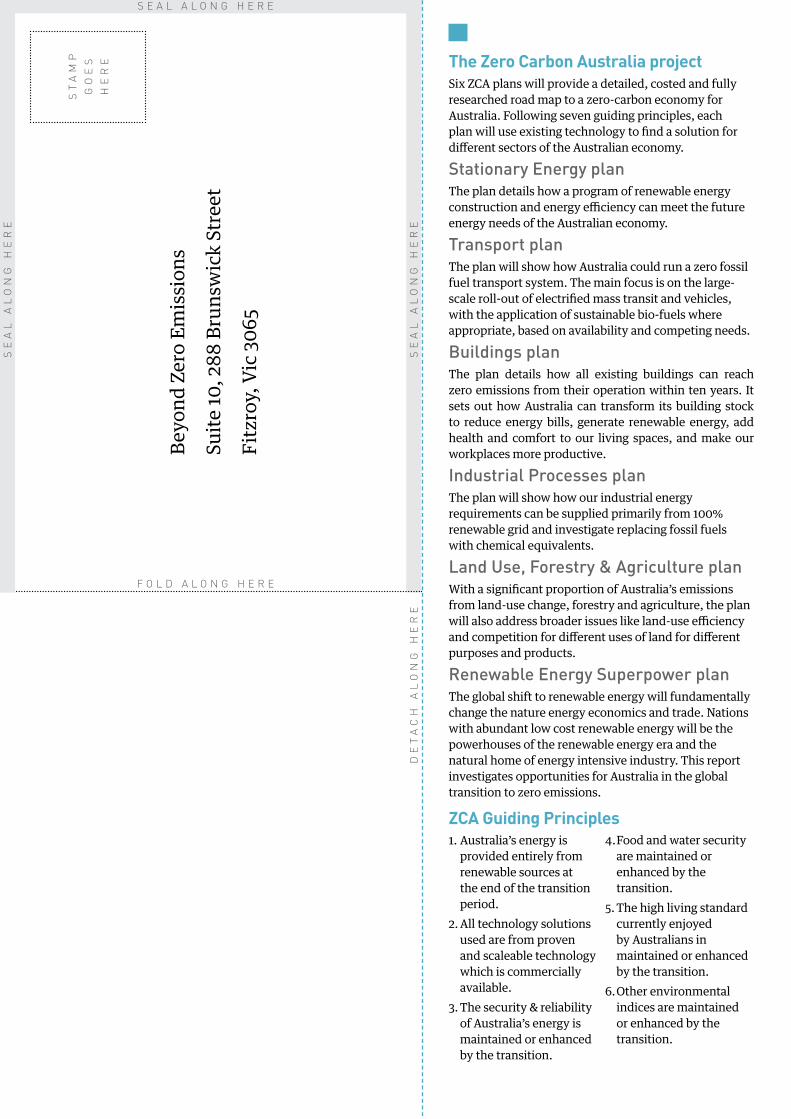
Six ZCA plans will provide a detailed, costed and fully researched road map to a zero-carbon economy for Australia. Following seven guiding principles, each plan will use existing technology to find a solution for different sectors of the Australian economy.
Stationary Energy planThe plan details how a program of renewable energy construction and energy efficiency can meet the future energy needs of the Australian economy.
Transport planThe plan will show how Australia could run a zero fossil fuel transport system. The main focus is on the large-scale roll-out of electrified mass transit and vehicles, with the application of sustainable bio-fuels where appropriate, based on availability and competing needs.
Buildings planThe plan details how all existing buildings can reach zero emissions from their operation within ten years. It sets out how Australia can transform its building stock to reduce energy bills, generate renewable energy, add health and comfort to our living spaces, and make our workplaces more productive.
Industrial Processes planThe plan will show how our industrial energy requirements can be supplied primarily from 100% renewable grid and investigate replacing fossil fuels with chemical equivalents.
Land Use, Forestry & Agriculture planWith a significant proportion of Australia’s emissions from land-use change, forestry and agriculture, the plan will also address broader issues like land-use efficiency and competition for different uses of land for different purposes and products.
Renewable Energy Superpower planThe global shift to renewable energy will fundamentally change the nature energy economics and trade. Nations with abundant low cost renewable energy will be the powerhouses of the renewable energy era and the natural home of energy intensive industry. This report investigates opportunities for Australia in the global transition to zero emissions.
ZCA Guiding Principles
F O L D A L O N G H E R E
S E A L A L O N G H E R ES
EA
L A
LO
NG
HE
RE
1. Australia’s energy is provided entirely from renewable sources at the end of the transition period.
2. All technology solutions used are from proven and scaleable technology which is commercially available.
3. The security & reliability of Australia’s energy is maintained or enhanced by the transition.
4. Food and water security are maintained or enhanced by the transition.
5. The high living standard currently enjoyed by Australians in maintained or enhanced by the transition.
6. Other environmental indices are maintained or enhanced by the transition.
DE
TA
CH
AL
ON
G H
ER
E

Renewable Energy Superpower
V
ContentsKey points vi
Executive summary 1
Energy Superpowers and the energy advantage 4Opportunities for Superpowers in the renewable energy era 5Sustainable foundations for Australia’s energy future 6Australia’s disappearing fossil energy advantage 7Maximising the renewable energy advantage 8Insights 9
Introduction 11
1. Energy Superpowers and the energy advantage 13
What is the energy advantage? 14Superpowers in the fossil energy era 15Superpowers in the renewable energy era 17The future is electric 19
2. Opportunities for Superpowers in the renewable energy era 21
Three areas of opportunity 22New industries in the renewable energy and efficiency market 24Migration of energy intensive industry 30Renewable energy exports 34
3. Sustainable foundations for Australia’s energy future 39
A sustained advantage from renewable energy 40Comparing resources 48
4. Australia’s disappearing fossil energy advantage 51
Australia’s historic fossil energy advantage 52Eroded domestic energy advantage 53Eroded international energy advantage 58
5. Maximising the renewable energy advantage 61
Rethinking energy sectors 62New energy solutions 68A system designed for low cost energy 74
6. Insights and recommendations 77
References 81
Appendices 87
Appendix A 88Energy Superpowers and the energy advantage
Appendix B 88Opportunities for Superpowers in the renewable energy era
Appendix C 88Sustainable foundations for Australia’s energy future
Appendix D 88Australia’s disappearing fossil advantage
Appendix E 88Maximising the renewable energy advantage

Renewable Energy Superpower
VI
n The world is shifting from polluting fossil energy to renewable energy
A global transition to renewable energy is an unavoidable condition for containing global warming below 2°C; the globally agreed limit. This transition is already underway and will accelerate in the years ahead.
n The status of energy Superpowers will fundamentally change as energy self-sufficiency increases and the energy trade decreases
Renewable energy is abundant, distributed throughout all nations and is now becoming cost competitive with fossil energy. As nations increase energy independence, the volume of traded energy will diminish along with related geopolitical tensions.
n Renewable Energy Superpowers will be nations with abundant, high quality renewable energy resources as well as skills and industrial capacity
Renewable energy resources are not equivalent in all nations. The cost of generating power can more than halve across the typical range of wind or solar conditions. This is the new energy advantage. Low cost energy, combined with land availability for harvesting, and the industrial capacity to utilise energy, are the building blocks for Renewable Energy Superpowers. Australia has all of these components.
n Electricity is the primary medium for zero emission energy
All investigations of decarbonisation confirm that extensive electrification is essential. The driving force for this is the relative ease and affordability of replacing polluting power stations with renewable energy generation and the versatility of electricity as an energy medium. ‘Fuel switching’, from fossil fuels to renewable electricity provides zero emission energy for many heating and transportation applications. The increased use of electricity means that international differences in power prices will be amplified.
n Renewable Energy Superpowers have three major opportunities
1. US$28 trillion is expected to be invested globally in renewable energy and efficiency equipment by 2035; more than coal, oil and gas development combined
The renewable energy transition is a once in a lifetime industrial opportunity. The majority of world energy investment over the next two decades is expected to flow to renewable energy and efficiency solutions. Higher upfront equipment costs of renewable energy solutions replace ongoing fuel costs of fossil energy. This means that this opportunity will be time limited; strongest during the energy transition phase and receding as the renewable energy era takes hold.
2. The economics of renewable energy will precipitate a migration of energy intensive trade exposed industries currently generating US$2.3 trillion in annual trade value
Uneven renewable energy resources and energy costs will cause energy intensive industries to relocate in order to minimise operating costs and maximise profits. Renewable Energy Superpowers will be the natural home of energy intensive industry. This opportunity will materialise after the energy transition when the economics of renewable energy prevails: high upfront cost and near zero marginal power costs, higher cost tradeable energy commodities, and restrictions on greenhouse gas emissions.
3. Production and export of renewable energy commodities
Renewable energy commodities such as biofuel, hydrogen and electricity are expected to play a significant role in the future, though less than the current trade of fossil energy commodities. These will effectively be new energy intensive industries which gravitate to Renewable Energy Superpowers.
Key points

Renewable Energy Superpower
VII
n Australia’s economic renewable energy resources are greater than coal, oil, gas and uranium resources combined
Renewable energy is abundant in Australia. The economic resource is estimated at over 5,000 exajoules – enough to power the world for ten years. This economic resource includes only solar and wind resources within close proximity to the transmission grid and able to generate power at a price competitive with other new power stations. This is 75 per cent more than the energy content of all Australia’s fossil energy resources.
n Australia’s fossil energy exports will decline as the world decarbonises, exposing the nation’s growing petroleum imports ($41 billion in 2014)
Australia’s coal and gas export revenue is largely offset by growing petroleum import expenditure. Global emission reduction efforts will destabilise this fossil energy trade balance. Coal use will decline early because it is the most emissions intensive commodity and readily substituted in many applications – this has already begun. Substituting Australia’s use of petroleum is more challenging and will take longer. The time lag exposes Australia to a potential fossil energy trade deficit.
n Australia’s domestic power and gas prices have risen up to 80% since 2005 after national reforms were completed and are now internationally uncompetitive
Australia’s electricity and gas utilities, formerly state owned and operated, were reformed into a national scheme completed in 2005. Since then electricity and gas prices have risen dramatically due to costly expansion at the same time as demand peaked and declined. Approximately $75 billion has been invested in electricity network infrastructure since 2005. Before the reform Australia’s energy prices were the lowest of OECD nations; they are now midfield. The national energy system structure has failed in its objective to promote efficient investment in the interest of consumers. It is unfit for contemporary energy issues of technology integration, energy efficiency and emission reductions.
n Electric-equivalents for gas and petroleum applications offer better value to energy users, making it economical to consolidate energy use to the electricity system
High efficiency electric appliances cost approximately 48% less to operate than gas appliances for households. Electric vehicles cost approximately 32% less per kilometre than petroleum vehicles. Shifting gas and petroleum use to electricity will utilise excess capacity in the electricity system, lowering power prices for all users. The productivity gain from increased electricity utilisation will outweigh gas system losses. Costly expansion of the gas system can be avoided and Australia’s petroleum import liability can be reduced. Consolidation to electricity will prepare Australia for the renewable energy future and recover lost competitiveness of the electricity system.
n Australia’s electricity system must be reconfigured to achieve the maximum value from new energy solutions
The current electricity system structure imposes barriers to new technologies. Rooftop solar, energy storage, smart infrastructure and appliances all blur the distinction between the traditional energy sectors of supply, distribution and retail. To extract the most value from new energy solutions as they evolve the full energy system value chain must be opened up allowing more cost effective integrated energy solutions to emerge.
n To be a Renewable Energy Superpower in the future, the time for electricity reform is now
The costs of renewable energy solutions are up front and are therefore locked-in from the time of investment. Every uncoordinated development adds costs to the electricity system and undermines Australia’s renewable energy advantage.

Renewable Energy Superpower
VIII

Renewable Energy Superpower
1
Executive summary

Renewable Energy Superpower
2
For too long Australia has progressed emission reductions reluctantly, and inadequately, with the false aim of minimising impacts on the local economy. The realisation has not yet dawned
that the economic impacts resulting from global decarbonisation will be positive for this country. Australia should maximise the opportunity, not minimise it.
Executive summary
Renewable Energy Superpower is a vision of Australia in the renewable energy era.
Opportunities for Renewable Energy Superpowers
World-wide, more investment is expected to flow to renewable energy and efficiency equipment over the next two decades than to development of coal, gas and oil combined. We have reached a tipping point; the past was fossil energy and the future is renewable energy.
The transition from the fossil energy era to the renewable energy era will be a once in a lifetime industrial opportunity. Almost thirty trillion US dollars is expected to be invested in renewable energy and efficiency equipment by 2035 as the polluting energy system is replaced. The upfront cost of equipment will replace the ongoing cost of fuel, making equipment supply a limited window of opportunity.
The renewable energy investment drive will animate a broad cross section of the economy, directly engaging industries which employ more than half of Australia’s twelve million workers. This includes the primary industries of resources, agriculture and raw material production; the secondary manufacturing and construction industries; and the tertiary industries of technology development, trade, finance and logistic services. Decarbonisation will be the day job of many.
The renewable energy era will follow the transition period, when the economics of renewable energy dominate: global distribution, near zero marginal cost power, higher cost tradeable energy commodities, and restrictions on greenhouse gas emissions. The trade of energy commodities will decline as nations decrease emissions and seek energy self-
sufficiency. Domestic energy costs will vary according to the resources of each country. In the case of wind and solar, costs can more than halve across the typical range of conditions. Quality renewable energy resources will be the new energy advantage.
Australia possesses one of the best renewable energy resources in the world. This natural advantage can be capitalised on due to a developed industrial capacity, established supply chains, high quality infrastructure, political stability and a well-trained and capable workforce.
The economics of renewable energy will precipitate a migration of energy intensive industries, in search of lower production costs for a competitive edge. Australia can attract these businesses with its abundant, low cost energy as well as complementary industries established during the former glory years of energy intensive production in this country.
Production of tradeable renewable energy commodities — such as biofuel, hydrogen or transmitted electricity — will be additional energy intensive industries of the renewable energy era. Abundant, low cost renewable energy, land availability, and proximity to the emerging Asian region will make Australia a natural home for these industries.
Managed well, the transition to renewable energy will restore and enhance former strengths, this time built on sustainable foundations.

Renewable Energy Superpower
3
Comprehensive decarbonisation entails widespread electrification. This was identified in Beyond Zero Emissions’ Stationary Energy Plan and has since been reinforced by similar studies. Electricity is the most versatile and efficient of all energy mediums. It is also relatively easy and affordable to replace polluting power stations with renewable energy generation. This provides a zero emission energy source for many applications including lighting, heating and motive power.
Differences in electricity prices will have greater impact in the renewable energy era due to electricity playing a more significant role. Australia’s world class renewable energy will be a source of low cost electricity generation. To ensure electricity prices are low for end users, the downstream system costs of networks and market operation must also be minimised. These downstream system costs have almost doubled in Australia over the past ten years. This will have to be reversed to realise Australia’s full potential in the renewable energy era.
The emerging renewable energy technologies offer the chance to reduce downstream energy system costs. Onsite power generation, energy storage, high efficiency appliances and embedded intelligence make it possible to extract
more from established infrastructure. These new energy technologies blur the traditional boundaries of the electricity system. To extract their full value, a rethink is required for how this system is managed.
High efficiency appliances and electric vehicles make it not just possible, but economical, to switch gas and petroleum use to the electricity system — delivering better value for energy consumers. This consolidation will utilise excess capacity in the electricity system, lowering power prices for everyone. At the same time Australia will save money otherwise spent upgrading gas infrastructure, and lower its forty billion dollar petroleum import bill — the nation’s single biggest liability. Consolidating Australia’s energy use will prepare the country for the renewable energy future and recover the lost competitiveness of the electricity system.
Establishing a framework for integrated development of a zero emission electricity system is arguably Australia’s most important strategic energy task today. Every day that passes with uncoordinated development of the energy system adds cost and undermines Australia’s future renewable energy advantage.
Executive summary
The renewable energy future is bright
A global transition to renewable energy is an unavoidable condition to ensure a safe climate in the future. It is in the interest of the planet. It is in the interest of Australians today, and of
generations to come. The dimming fossil energy past can be let go with confidence because the renewable energy future is bright.
The future is electric
Australia can be a Renewable Energy Superpower.

Renewable Energy Superpower
4
Executive summary
Energy Superpowers and the energy advantage
All nations have access to renewable energy resources. This will fundamentally change the international energy trade. Energy from high quality renewable energy resources can be half the cost of energy from poor resources. Nations with abundant, low cost energy will be the energy Superpowers of the renewable energy era. Australia can be a Renewable Energy Superpower.
The energy advantage
Independent access to low cost energy is an economic and strategic advantage. Living standards are increased and businesses derive a commercial advantage from low cost energy. Nations with poor resources must pay higher prices for energy and import energy they cannot provide themselves. As a result of importer dependence, major energy exporting nations are able to use their market power to advance their political goals. These are the energy superpowers.
Superpowers in the fossil energy era
Energy superpowers have emerged from the global imbalance in fossil energy resources. A defining characteristic of the fossil energy era is the ongoing need for, and cost of, fuel. Even after significant investment in energy infrastructure, it provides no benefit without the continuous supply of fuel. It is an ongoing source of revenue for fuel suppliers while an ongoing expense and anxiety for consumers. Nations at the extremes of the import or export balance can be recognised as featuring heavily in the geopolitical events of the twentieth century. This is an indicator of the tension arising from the global fossil energy imbalance.
Superpowers in the renewable energy era
In the renewable energy era, higher quality renewable energy resources will provide lower cost energy. The cost of power can more than halve across the typical range of wind or solar conditions. Wider decarbonisation efforts will involve electrification of many applications currently serviced by fossil energy. The increased role of electricity will amplify the effects of renewable resource variations.
The greater the energy resource surplus, the more options available to those nations or regions to trade off the simplest and lowest cost resources. Ultimately, this will lead to a lower cost energy system compared with those nations needing to pursue poorer performing resources.
Australia has among the best renewable energy resources in the world — a natural advantage. On top of this, Australia is an advanced economy with an established industrial capacity, infrastructure and skills base. This is necessary to capitalise on the renewable energy advantage.
Australia can be a Renewable Energy Superpower in the renewable energy era.
Global distribution of combined wind and solar generation potential Source: IEA, 2014

Renewable Energy Superpower
5
a T
+2oC
+4oC New Policies
450ppm
E[R]
0
10
20
30
40
50
1990 2000 2010 2020 2030 2040 2050 2060 2070
Gt CO2
Fossil energy er ransition Renewable energy era
Energy intensive industries are commercially sensitive to energy prices. Businesses supplying the world market will relocate in order to minimise operating costs and maximise profits. The international market value of emissions intensive trade exposed products is currently over US$2.3 trillion per year. Renewable Energy Superpowers will be the natural home of energy intensive industry.
Renewable energy exports
Some role is expected for the trade of renewable energy commodities, though much less than fossil energy today. Substantial demand is expected for biofuel products, particularly for specialty transportation tasks like aviation and shipping. The future role of hydrogen remains unclear but there is certain to be a market for hydrogen derived chemical products. In addition, the high quality renewable resources of northern Australia could be tapped to assist the rapid electrification of the South East Asian region. Renewable energy commodities such as these require substantial energy inputs. Renewable Energy Superpowers will be the natural home of renewable energy commodity production.
Supplying the renewable energy and efficiency market
A tipping point has been reached. The majority of world energy investment over the next two decades is expected to flow to renewable energy and efficiency solutions – even under ‘business as usual’ conditions. The global market for renewable energy and efficiency solutions was estimated to be US$390 billion in 2013. This is expected to grow to US$2.3 trillion by 2035 in order to limit global warming to 2 degrees Celcius. In all, US$28 trillion is expected to be invested in renewable energy and efficiency throughout the period.
The nature of renewable energy solutions is upfront equipment costs replacing the ongoing high fuel costs of fossil energy. This means that this opportunity will be at its strongest during the energy transition phase and recede into the renewable energy era.
Migration of energy intensive industry
Nations will shift increasingly to domestic, renewable energy resources and the trade of energy will contract. As a result, energy price imbalances will emerge in relation to renewable energy resource quality.
Global emission trajectories and opportunities in the transition to renewable energy
IEA New Polices Scenario, IEA 450ppm scenario, Greenpeace Energy [R]evolution scenario, IPCC representative concentration pathways leading to global warming of two degrees and four degrees.
Executive summary
Opportunities for Superpowers in the renewable energy era
There are three main opportunities for Superpowers in the transition to renewable energy. First, demand for renewable energy and efficiency equipment will surge during the transition and then recede. Second. after the transition, energy intensive industries will relocate in search of low cost energy. Third, renewable energy commodities for export will be produced in countries with low cost renewable energy.
3. Renewable energy exports
1. Renewable energy
& efficiency
2. Energy intensive industry

Renewable Energy Superpower
6
Executive summary
A sustained advantage
Abundant and high quality renewable energy resources are the key to Australia’s renewable energy advantage in the future. Unlike fossil energy — which fluctuates with new discoveries, depleting reserves or geopolitical factors — Australia’s low cost renewable energy advantage will be sustained into the future.
Economic renewable energy resource potential
For a meaningful measure of Australia’s renewable energy potential, the total primary resource can be reduced to the Economically Demonstrated Resource (EDR). The vast renewable energy weathering the Australian continent daily has been dissected; wind and solar within 10km of the transmission grid has been considered ‘marketable’; resources able to generate power below the price of new power stations are considered ‘competitive’. Only those resources that are both ‘marketable’ and ‘competitive’ are considered EDR.
Australia’s potential wind and solar EDR is estimated to be 5,054 exajoules (wind: 803 EJ, solar: 4,215 EJ)i. This is only 4 per cent of Australia’s total renewable energy resource yet is enough to power the world for 10 years.
Comparing resources
Australia’s economically demonstrated wind and solar energy resource potential is 75 per cent greater than all of Australia’s combined coal, gas, oil and uranium resources (2,876 EJ).
Fossil resources classified as economic assume extraction at current rates will be able to continue in the case of black coal for over 100 years, and brown coal for over 500 years. This assumption is known to be incompatible with limiting global warming to internationally agreed targets.
Adjusting Australia’s resource to be compatible with the International Energy Agency’s 450ppm climate change mitigation scenario reduces the economic resource to 1,315 EJ (a reduction of 55%).
Sustainable foundations for Australia’s energy future
Australia’s high quality renewable resources are the foundation for a sustained energy advantage. The economic renewable energy resource potential of Australia is greater than its coal, gas, petroleum and uranium resources combined.
i. Finite resource assessment based on lifetime production of generator assets (wind: 40 years, solar: 20 years).
Comparison of fossil and renewable energy Economically Demonstrated Resources
Also includes fossil energy production corresponding to the International Energy Agency’s 450ppm scenario.
0
1,000
2,000
3,000
4,000
5,000
6,000
Fossil Fossil(450ppm)
Renewable
EJ
Solar
Wind
Uranium
Natural Gas
LPG
Condensate
Crude oil
Brown coal
Black Coal

Renewable Energy Superpower
7
Executive summary
Eroded international energy advantage
Australia’s export of fossil energy experienced unprecedented revenues during the recent commodity boom. At the same time, Australia’s fossil energy imports also surged due to the depletion of domestic oil reserves. Petroleum imports are Australia’s single biggest import liability, totalling $40.8 billion in 2014. Gross energy export revenues of around $70 billion shrink to $30 billion after accounting for oil imports. This diminishes further, to around $10 billion, after accounting for profits expatriated to the foreign owners of Australia’s fossil energy exporters.
Global emission reduction efforts will negatively impact on Australia’s fossil energy trade balance. Global demand for Australian coal is likely to decline faster than Australia will reduce its oil consumption. Unmitigated oil consumption will result in a growing fossil energy trade deficit in the future.
Australia’s fossil energy trade balance
Export projection indicates the range between the IEA’s New Policy Scenario and 450ppm scenario estimates. Projected imports based on an oil price of US$70 and US$100 per barrel. Dashed lines adjusted for estimated foreign equity holder profits.
Australia’s disappearing fossil energy advantage
Recently, Australia’s fossil energy advantage has been disappearing. Domestic energy prices have risen from lowest in the world to higher than the OECD average. Growing imports of petroleum are offsetting the earnings from exports.
Eroded domestic energy advantage
Domestic energy prices, once among the lowest of developed countries, are now around the average. This loss of competitiveness has taken only ten years and has roots in the energy system reforms initiated by the Howard Government in 1998 and completed in 2005.
Uneconomic investment in network infrastructure is the main source of cost increases. System capacity has been increased, at a cost of approximately $75 billion, while demand peaked and then declined. This, however, is symptomatic of the reformed energy system design and regulation, to facilitate privatisation, and geared for managing growth in a rigid system structure. Electricity demand has declined since 2010 and gas demand peaked in 2012.
The national energy market structure is not suitable for the contemporary energy needs of technology integration, distributed ownership, increased efficiency and decarbonisation. An increased role for electricity in the future amplifies the negative impact of high priced power.
International household electricity prices
Purchasing Power Parity (PPP) prices..
Aus
US/Can
OECD
Japan
0
40
80
120
160
200
1980 1985 1990 1995 2000 2005 2010 2015
$US/MWh (PPP)
Export
Balance
Import $70/bbl
$100/bbl
450
NPS
-100
-75
-50
-25
0
25
50
75
100
125
1990 2000 2010 2020 2030
$Bn

Renewable Energy Superpower
8
Comparison of basic energy prices and efficiency adjusted prices for mass market electricity, gas and petroleum
Adjusted prices (shown in orange) based on electric-equivalent appliance or vehicle energy efficiency. Mass market covers residential and commercial users. Petroleum price shown excludes taxes.
Executive summary
Maximising the renewable energy advantage
Energy system reform is arguably Australia’s most important strategic energy task today. For Australia to maximise its renewable energy resource the cost of the downstream energy system must also be minimised. New energy solutions make it possible to economically consolidate Australia’s three energy systems — electricity, gas and petroleum — into a single electricity system for the renewable energy era.
Rethinking energy sectors
Petroleum, gas and electricity have developed separate markets for their particular energy products. The petroleum energy system almost exclusively supports transportation, gas is primarily provided for heating purposes while electricity has the most varied range of end use applications. Each of these energy systems has distinct sectors reflecting the roles of supply, distribution and retail.
Newly available technologies and management solutions make it economical to consolidate Australia’s three energy systems. At the same time, these new energy solutions bridge the traditional sectors of supply, distribution and retail.
High efficiency electric appliances and vehicles overcome the higher energy price of electricity to deliver better value to end users. Ultimately, it is the cost of useful output that is important to energy users. Adjusting prices based on electric-equivalent appliance efficiency demonstrates electricity is the best value option compared with both gas and petroleum.
When viewed through the value lens, the switch is an economic choice as well as a step in the right direction for decarbonisation. Consolidated use of the electricity system will prepare Australia for the renewable energy era.
The future is electric
Comprehensive decarbonisation requires widespread electrification. This was identified in Beyond Zero Emissions’ Stationary Energy Plan, the first instalment of the Zero Carbon Australia Project, and reinforced by similar studies since. Electricity is the most versatile and efficient of all energy mediums. It is also relatively easy and affordable to replace polluting power stations with renewable energy generation. This provides a zero emission energy source for many applications including lighting, heating and motive power. Differences in renewable energy resources, and therefore electricity prices, will have greater impact due to electricity playing a more significant role in the future energy system. To take full advantage of Australia’s low cost renewable power potential, the downstream system costs must also be kept low.
Time for reform is now
To extract the most value from new energy solutions as they evolve a new system structure is required. By opening up the full energy system value chain, more cost-effective integrated energy solutions can emerge. It is important that reform happens now. The costs of renewable energy solutions are locked-in from the time of investment so every uncoordinated development adds costs to the system and undermines Australia’s renewable energy advantage.
0
30
60
90
120
150
Electricity Gas Petroleum
$/GJ

Renewable Energy Superpower
9
Executive summary
Insights and recommendations
Rapid decarbonisation of Australia’s domestic energy system
Rapid decarbonisation is necessary for Australia to contribute its share of global emission reductions and avoid dangerous climate change. An advantage of early action is establishing industry expertise in renewable energy solutions prepared to capitalise on the global energy transition. Global investment in renewable energy is an opportunity of limited time. The renewable energy market value will surge during the transition due to the capital intensive nature of renewable energy; then it will recede because there is little need for fuels and operating costs are very low.
Recommendations1 Government Target 100% renewable
electricity in Australia. More modest targets will not stimulate Australian industry to discover and develop innovative solutions to full decarbonisation.
2 Government Planning and policy should be consistent with the international agreement to keep global average temperature rise below 2°C (450ppm of CO2) — preferably lower.
3 Business Business planning and strategy should factor in the long term implications of emission reductions to avoid investment lock-in and potential stranded assets. Claiming in future that these impacts were unforeseeable is not acceptable.
4 Government Continue and expand & Business renewable energy innovation and commercialisation initiatives — such as the Australian Renewable Energy Agency (ARENA), Clean Energy Finance Corporation (CEFC) and Cooperative Research Centres (CRC).
5 Government Engage with emerging Asian & Business nations on joint decarbonisation programs.
Support energy intensive trade exposed industries through the transition
Australia’s potential for low cost renewable energy will be an advantage for energy intensive industries in the low carbon global economy. Until greenhouse gas emissions are universally constrained, global competitiveness is expected to be unbalanced. Energy intensive industries in nations with tight emissions policies may experience a loss of competitiveness and possibly closure. Carefully managed support for energy intensive industries through the energy transition will maintain continuity of skills and supply chains in Australia.
Recommendations6 Government Promote and facilitate energy & Business efficiency programs for energy intensive industries.
7 Business Identify and invest in energy efficiency and emission reduction opportunities.
8 Government Maintain and expand targeted schemes to balance the competitiveness of energy intensive industries through the period of transition.
9 Government Negotiate for a global emission reduction agreement consistent with global average temperature rise below 2°C (450ppm of CO2) — preferably lower — in multilateral forums, such as the UN Climate Change Conference in Paris; as well as regional forums such as the Asia-Pacific Economic Cooperation (APEC).
10 Government Negotiate for effective & Business emission reductions in multilateral and bilateral trade agreements.
Renewable Energy Superpower
10
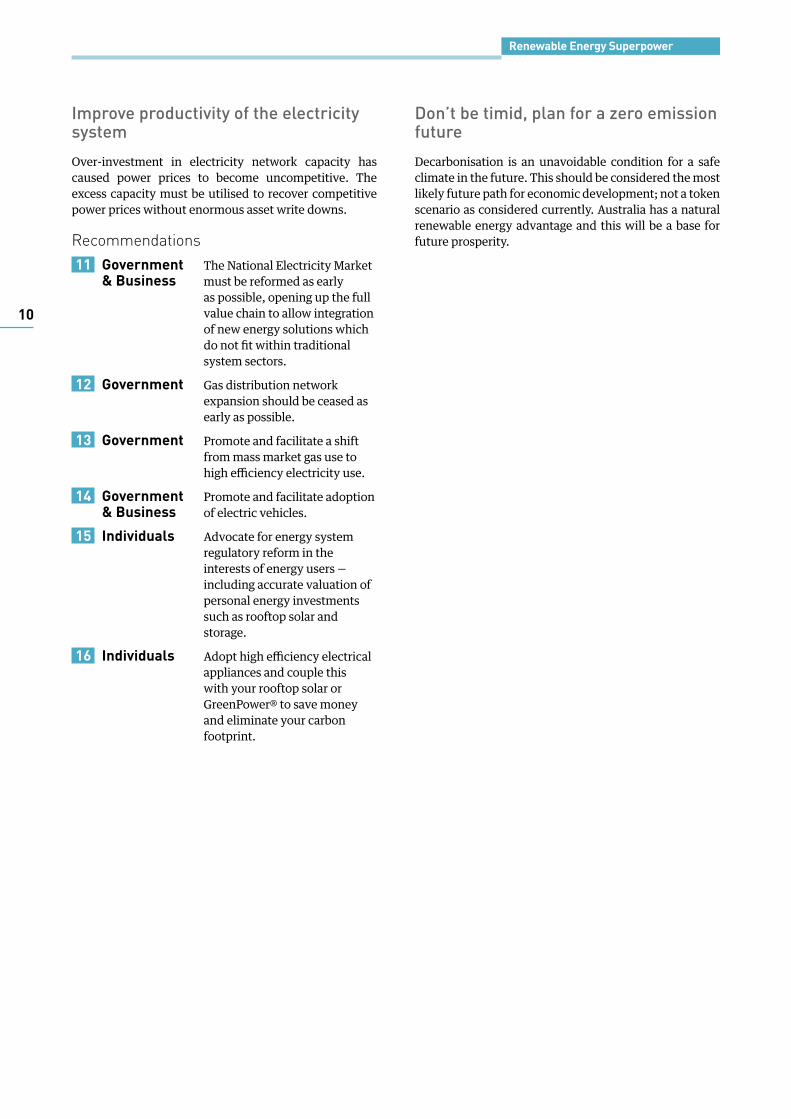
Improve productivity of the electricity system
Over-investment in electricity network capacity has caused power prices to become uncompetitive. The excess capacity must be utilised to recover competitive power prices without enormous asset write downs.
Recommendations11 Government The National Electricity Market & Business must be reformed as early as possible, opening up the full value chain to allow integration of new energy solutions which do not fit within traditional system sectors.
12 Government Gas distribution network expansion should be ceased as early as possible.
13 Government Promote and facilitate a shift from mass market gas use to high efficiency electricity use.
14 Government Promote and facilitate adoption & Business of electric vehicles.
15 Individuals Advocate for energy system regulatory reform in the interests of energy users — including accurate valuation of personal energy investments such as rooftop solar and storage.
16 Individuals Adopt high efficiency electrical appliances and couple this with your rooftop solar or GreenPower® to save money and eliminate your carbon footprint.
Don’t be timid, plan for a zero emission future
Decarbonisation is an unavoidable condition for a safe climate in the future. This should be considered the most likely future path for economic development; not a token scenario as considered currently. Australia has a natural renewable energy advantage and this will be a base for future prosperity.

Renewable Energy Superpower
11
Introduction

Renewable Energy SuperpowerIntroduction
12
The global transition to renewable energy is well underway. This report, Renewable Energy Superpower, explores how Australia is positioned for the renewable energy era as well as the opportunities from the transition. The report is produced by Beyond Zero Emissions (BZE), a non-profit climate solutions research organisation.
The Renewable Energy Superpower report is part of the Zero Carbon Australia project. This is a comprehensive investigation of decarbonising the major sectors of Australia’s economy including energy, buildings, land use and agriculture, transport, industrial processes and exports. The Superpower report relates to Australia’s export sector and can be considered alongside previous reports: Fossil economy, Carbon crisis and Carbon Capture and Storage.
Objective
The objective of this study is to give Australians confidence in embracing the challenge of limiting global warming below 2 degrees Celsius. The apparent costs of change tend to steal the show in public debate, while the opportunities and benefits are disregarded or ignored. This report will shine a light on these opportunities to help form a vision around Australia’s prosperity in the coming renewable energy era.
It is not the objective of this study to demonstrate a renewable energy export industry to directly substitute Australia’s fossil fuel exports. The nature of energy and trade itself is expected to undergo substantial change. This report identifies some of the changes which can be expected in the trade of energy, energy equipment and energy intensive production.
Scope
The study is tethered to two issues: the international competitiveness of Australia’s energy, and prospects for Australian trade in the shift to renewable energy. The scope of this study is necessarily broad and covers a range of subjects from the international energy trade, the commercial influence of international energy price imbalances, an assessment of renewable energy resources, to Australia’s domestic energy prices and the structure and reform of Australia’s domestic energy system.
This study does not attempt to explicitly define Australia’s role in future energy and energy intensive industries. This study identifies some of the factors influencing the economics of the shift to renewable energy and the market opportunity this presents for Australia. Where possible, the scale of the market opportunity in which Australia can participate is identified.
Unless otherwise stated, monetary figures are 2014 Australian dollars.
Overview
The report divides the broad subject matter into six sections:
1. Energy Superpowers and the energy advantage
2. Opportunities for Superpowers in the renewable energy era
3. Sustainable foundations for Australia’s energy future
4. Australia’s disappearing fossil energy advantage
5. Maximising the renewable energy advantage
6. Insights and recommendations
Section 1 briefly discusses the nature of international energy advantages in the fossil energy era and how this is likely to change in the renewable energy era.
Section 2 discusses the opportunities for Australian business from the shift to renewable energy. This includes the market for new renewable energy and efficiency solutions but also prospects for energy intensive industry in Australia and the potential for exports of renewable energy products.
Section 3 presents an assessment of Australia’s economic renewable energy resources and compares this with the nation’s fossil energy reserves.
Section 4 demonstrates the change in Australia’s energy advantage over time. Domestic energy prices are being affected by domestic policy and regulation as well as international energy commodity prices. Australia’s exports are also being impacted by market volatility and energy policies of key trade partners.
Section 5 investigates opportunities to maximise Australia’s renewable energy advantage by minimise the downstream costs of domestic energy systems.
Section 6 provides insights from this investigation and recommended paths for action in Australia.

Renewable Energy Superpower
13
1. Energy Superpowers and the energy advantage

Renewable Energy Superpower1. Energy Superpowers and the energy advantage
14
Overview
Having independent access to low cost energy is an economic and strategic advantage. Nations with inadequate resources must pay the going price for energy and are dependent on others. Oil is the most traded energy commodity today and has been throughout the 20th century.
Energy superpowers have emerged from the global imbalance in fossil energy resources, giving some nations a political and economic advantage over others.
The global shift to renewable energy will cause major changes to the international energy trade because most nations have independent access to substantial energy resources. As a result, the tensions associated with energy supply security will ease.
In the renewable energy era higher quality renewable energy resources will provide lower cost energy. The cost of power can more than halve across the typical range of wind or solar conditions. Australia has among the best renewable energy resources in the world. This will be the new natural advantage, delivering lower living costs for residents and a commercial advantage for business.
Decarbonisation will involve electrification of many applications currently serviced by fossil energy. The increased role of electricity will amplify the effects of renewable resource variations.
Further detail and data can be found in Appendix A.
What is the energy advantage?
Energy is essential to the way we live our lives. It eases our daily chores, powers the industries catering to our desires and moves us from where we are to where we want to be. Over the past century, world energy consumption increased tenfold as the population and productivity grew (Figure 1).
FIGURE 1
Historic annual world energy consumption1.
The energy advantage is having access to sufficient energy to meet or exceed your needs at low cost. Nations with access to energy can independently conduct their activities and industrial pursuits. Access to low cost energy leaves more capacity for other activities once energy needs have been met.
In the home, living standards are increased by allowing a higher proportion of household earnings to be saved or spent on life’s pleasures. For businesses, low cost energy provides a source of competitive advantage, particularly for energy intensive industries.
Nations without access to sufficient and affordable energy must import it from nations with surplus energy resources. Energy importers must accept higher international market prices. This is the first source of advantage where living costs and business operating costs are higher for residents of energy importing nations relative to exporters. The energy import expenditure transfers wealth from the importer to the exporter, a second source of advantage. The expenditure on imported energy must then be offset with some alternative export to balance international payments. This diverts industrial effort from fulfilling domestic aspirations, a third source of advantage for energy exporters.
Energy is a strategic resource and a stable supply is required to maintain economic activity, essential services and social cohesion. As a result of importer dependence, major energy exporting nations are able to use their market power to advance their political goals. These are the energy superpowers.
0
100
200
300
400
500
1900 1920 1940 1960 1980 2000 2020
EJ

Renewable Energy Superpower1. Energy Superpowers and the energy advantage
15
FIGURE 2
Global distribution of fossil energy reserves 2, 3, 4.
Superpowers in the fossil energy era
The concept of an energy superpower has historically entailed political and economic advantages accruing to the nations which supply large amounts of the international energy trade. This situation of superiority is possible because the fossil energy sources integral to the current energy system are unevenly distributed across the globe. Millions of years of sunlight, stored by lifeforms from the past, have been buried and deposited arbitrarily by the geological forces over time (Figure 2). This geological disregard for modern political borders has made some nations dependent on others for their energy supply.
Because energy is a critical element to productive economies and high modern living standards, it is highly valued. Security of energy supply is a source of ongoing anxiety for importing countries. A disruption to supply can cause systemic failure at the national scale. Where power and transport systems are affected, production breaks down and essential activities such as medical
services and food distribution are challenged, with the inevitable disruption to social cohesion and heightened risk of civil unrest. These systems can be finely balanced and highly sensitive to disruption. For this reason importing countries accept sacrifices to ensure stable and secure energy supply. This allows well-endowed energy suppliers to bargain for favourable politico-economic relationships while also enjoying a cost advantage on energy.
A defining characteristic of the fossil energy era is the ongoing need for, and cost of, fuel. Even after significant investment in energy infrastructure, it provides no benefit without the continuous supply of fuel. This arrangement cements a long commitment. It is the source of ongoing revenue for fuel suppliers as well as ongoing expense and anxiety for consumers.

Renewable Energy Superpower1. Energy Superpowers and the energy advantage
16
The International Energy Agency (IEA) was formed after the oil crisis of the early 1970s which led to major economic and social disruptions. The aim of the IEA is to provide stability in the energy trade. They provide one of the earliest comprehensive records of energy production, use and trade.
Many nations at the extremes of the import or export balance can be recognised as featuring heavily in the geopolitical events of the twentieth century (Figure 4). There are undoubtedly many other contributing factors but this is an indicator of the tension arising from the global fossil energy imbalance.
In 2014 the value of the international energy trade was reported at just over US$2.1 trillion and is dominated by oil (Figure 3). As an indicator of the volatility of the fossil fuel trade, the 50 per cent drop in the oil price at the end of 2014 will reduce the value of traded energy in 2015 by around US$700 billion.
FIGURE 3
International energy trade, 20145.
FIGURE 4
Top ten fossil energy exporters and importers from 1973-20122.
-1,000 -750 -500 -250 0 250 500 750 1,000
Saudi Arabia
Russia
Iran
Canada
Venezuela
Norway
Indonesia
Australia
United States
Netherlands
Spain
United Kingdom
China
Netherlands
Korea
Italy
France
Germany
Japan
United States
EJ
Oil
Gas
Coal
Import Export
Coal 5%
Gas 18%
Oil 75%
Energy trade US$2,142 Bn
Electricity 2%

Renewable Energy Superpower1. Energy Superpowers and the energy advantage
17
Superpowers in the renewable energy eraIn a shift away from fossil to renewable energy, the international imbalance will be reduced and redefined, along with the associated geopolitical tensions. The reason for this is that renewable sources of energy are both more abundant and more evenly distributed across the world than concentrated deposits of minerals. Solar irradiation, wind, hydro flows, tidal and wave movements and biomass provide an enormous energy resource to be harnessed. Energy harvesting technologies and distribution solutions, which can be manufactured and deployed widely, are the key to renewable energy supply. These solutions are already available and continuing to be improved in efficiency and cost effectiveness. In many cases they are already competitive with existing energy supply systems.
While highly distributed renewable energy will reduce international energy imbalances, it will not yield a perfect geographical distribution. A shift to renewable energy will still bring advantages to some nations.
The value associated with renewable energy is largely accounted for by the harvesting equipment, with very little ongoing costs and zero fuel costs. This is completely different to fossil energy where the majority of the value is in the ongoing consumption of fuel. As a result, the opportunity to capitalise on supplying renewable energy and efficiency equipment will be confined to the period of the transition; then it will recede. This opportunity will be based on innovation rather than natural resources.
Considering that energy harvesting equipment is commonly available to all nations, advantages will accrue to nations or regions with higher quality renewable energy resources and a greater harvesting territory in relation to their domestic energy needs (Figure 6). In essence, these nations will require less investment for equivalent energy output, lowering their energy costs. As shown in Figure 5, the cost of power per unit of installed capacity can more than halve across the typical range of wind or solar conditions.
This is the new energy advantage.
FIGURE 5
Cost of power from solar and wind generators relative to resource quality (average annual solar irradiation and average annual wind speed).
The greater the energy resource surplus, the more options available to those nations or regions to trade off the simplest and lowest cost resources. Ultimately this will lead to a lower cost energy system compared with those nations needing to pursue poorer performing resources. To capitalise on the natural energy advantage, nations will require an established industrial capacity, infrastructure and skills base as well as stable governance. These will be the renewable energy superpowers of the future and, as shown in Table 1, Australia is among its top ranks.
Those nations needing to pursue higher cost options will end up with higher cost energy systems, not unlike today. In most cases a balance will be struck between strategic and economic considerations for nations with poorer and therefore more costly renewable energy resources. Despite this, energy self-sufficiency and therefore security will be increased by ensuring a domestic energy supply to support the needs of daily life and shock proofing vital systems. This will diminish a major contributor to global conflict.
Solar
Wind
3 4 5 6 7
0
50
100
150
200
250
50 100 150 200 250 300 350
$/MWh
W/m2 m/s

Renewable Energy Superpower1. Energy Superpowers and the energy advantage
18
TABLE 1
Top ten ranked nations for wind and solar energy resources.
Rank Energy production potential per square km
Energy production potential from total land area
Energy production potential from unutilised land area
Energy production potential from rural land area
1 Egypt Russia Russia Australia
2 Saudi Arabia. Australia Canada China
3 Australia China Australia United States
4 Kenya Brazil China Russia
5 Zimbabwe United States United States Canada
6 South Africa Canada Iran Brazil
7 Malta India Egypt Saudi Arabia
8 Cuba Argentina Argentina Argentina
9 Israel Saudi Arabia Saudi Arabia India
10 Mexico Mexico Brazil Iran
FIGURE 6
Global distribution of combined wind and solar generation potential. Derived from NASA global wind and solar data6,7.

Renewable Energy Superpower1. Energy Superpowers and the energy advantage
19
Unlike the temporary advantage taken by fossil energy superpowers, the renewable energy advantage will be sustained. Over the longer term, this will drive a rebalancing of global energy economics whereby trade-able energy intensive industries and activities will gravitate towards the renewable energy superpowers. This ‘industrial migration’ will be a feature of the global shift to renewable energy.
A restructure of the Australian economy to become a renewable energy superpower requires a clear vision and confidence in the real opportunities on offer. Policies will need to be implemented which invest in long term outcomes and must remain flexible to take advantage of the dynamic nature of new energy solutions.
The future is electric
All investigations of comprehensive decarbonisation identify widespread electrification as essential. This was identified in Beyond Zero Emissions’ Stationary Energy Plan, the first instalment of the Zero Carbon Australia Project. Other decarbonisation studies support this trend including the International Energy Agency 450ppm scenario, the Greenpeace Energy [R]evolution scenario and the Deep Decarbonisation Pathway Project (Figure 7).
FIGURE 7
Historic and projected world final energy demand sourced from electricity according to the International Energy Agency 450ppm scenario and Greenpeace Energy [R]evolution scenario8, 9. Projection of Australian electrification according to the Deep Decarbonisation Pathway Project10.
The driving force for this increase in electrification is the relative ease and affordability of replacing polluting power stations with renewable energy generation. Electricity is the most versatile and efficient of all energy mediums. This provides a zero emission energy source for many applications including lighting, heating and motive power. The value of electricity infrastructure is then maintained through the renewable energy transition or even increased as a result of higher utilisation.
The differences in renewable energy resources, and therefore electricity prices, will have greater impact due to electricity playing a more significant role in the future energy system.
DDPP Australia
E[R]
450ppm
Historic
0%
10%
20%
30%
40%
50%
2000 2010 2020 2030 2040 2050 2060

Renewable Energy Superpower1. Energy Superpowers and the energy advantage
20

Renewable Energy Superpower
21
2. Opportunities for Superpowers in the renewable energy era

Renewable Energy Superpower2. Opportunities for Superpowers in the renewable energy era
22
Overview
There are three main opportunities for renewable energy superpowers: supplying renewable energy and efficiency equipment, attracting energy intensive industries and exporting renewable energy commodities.
The global market for renewable energy and efficiency solutions was estimated to be US$390 billion in 2013. This is expected to grow rapidly over the next two decades as the world replaces the polluting energy system. The nature of renewable energy solutions is upfront equipment costs replacing the ongoing high fuel costs of fossil energy. This means that this opportunity will be at its strongest during the energy transition phase and recede into the renewable energy era.
Energy Intensive Trade Exposed (EITE) industries and renewable energy product exports are opportunities centred on access to abundant and low cost renewable energy. Hence the opportunity for these industries will be ongoing in the renewable energy era after the transition phase.
The international market value of EITE industry products is currently over US$2.3 trillion per year. As the trade in energy contracts, the trade in energy intensive products is likely to increase as production gravitates to locations offering abundant and low cost energy.
A market for tradeable renewable energy products is undefined at this time. Substantial demand is expected for biofuels, particularly for specialty transportation tasks like aviation and shipping. The future role of hydrogen remains unclear but there is certain to be a market for hydrogen derived chemical products. In addition, the high quality renewable resources of northern Australia could be tapped to assist the rapid electrification of the South East Asian region.
Further detail and data can be found in Appendix B.
Three areas of opportunity
The sources of value in the energy system will change in the transition from fossil energy to renewable energy. The new sources of value will develop in different phases of the renewable energy transition (Figure 8). They can be separated into three separate groups of opportunity:
1. Supply of renewable energy and efficiency equipment
Equipment and efficiency products are the source of value in the renewable energy system. This involves significant upfront investment and very low ongoing costs unlike fossil energy which entails the ongoing cost of fuel. The effect of this will be a substantial but temporary surge of investment in renewable energy equipment over the transition period. After the peak in renewable energy deployment, this opportunity will recede. Businesses must be prepared to capitalise on this opportunity.
2. Migration of energy intensive trade exposed industry
Industries which supply international markets are free to choose the location of their operations. The location which offers the lowest cost of operation is preferred in order to maximise the profitability of their business. In the renewable energy era following the transition, energy intensive industries will migrate to locations with low energy prices. This will be a sustained advantage throughout the renewable energy era for nations with high quality renewable energy resources.
3. Exports of renewable energy
Some renewable energy commodities will continue to be traded internationally into the future. These products are converted from renewable resources into useable energy products and require substantial energy inputs. Nations with high quality renewable energy resources will be the natural home for these industries because they will be produce renewable energy commodities at the lowest cost. Effectively another energy intensive trade exposed industry this advantage will also be sustained throughout the renewable energy era.

Renewable Energy Superpower2. Opportunities for Superpowers in the renewable energy era
23
FIGURE 8
Timing of opportunities in the transition to the renewable energy era relative to emission scenario trajectories. IEA New Polices Scenario, IEA 450ppm8 scenario and Greenpeace Energy [R]evolution scenario9. Also shown are IPCC representative concentration pathways leading to global warming of two degrees (RCP 2.6)11 and four degrees (RCP 4.5)12.
+2oC
+4oC New Policies
450ppm
E[R]
0
10
20
30
40
50
1990 2000 2010 2020 2030 2040 2050 2060 2070
Gt CO2
Fossil energy era Transition Renewable energy era
2. Energyintensiveindustry
3. Renewableenergyexports
1. Renewableenergy &efficiency

Renewable Energy Superpower2. Opportunities for Superpowers in the renewable energy era
24
New industries in the renewable energy and efficiency market
The transition to renewable energy opens up new opportunities for businesses providing renewable energy solutions. This is a broad market incorporating energy supply and management as well as a variety of efficiency measures. The diversity of this market means it intersects all traditional industry segments: resources and materials, manufacturing, transportation, information technology, construction, engineering, finance, trade and other services. There is opportunity for all sectors to participate in the transition and find their niche in this market.
As shown in Figure 9, US$390 billion is estimated to have been invested in this broad market in 2013 according to the International Energy Agency (IEA)13. In order to contain global warming below two degrees Celsius the IEA estimates the annual investment in this market will increase to US$2,300 billion by 2035.
FIGURE 9
Estimated annual renewable energy and energy efficiency investment for IEA 450ppm scenario13.
0
500
1,000
1,500
2,000
2,500
2013 2020 2035
US$ Bn
EfficiencyElectric vehiclesBiofuelOtherRenewables
Investment intentions can be considered a crystal ball of sorts, revealing the direction of the future. This being the case, it is clear that we have now reached a tipping
point. According to the International Energy Agency’s projections, the power sector (dominated by renewables and network infrastructure) and energy efficiency is expected to account for the majority of energy investment over the next twenty years (Figure 10 and Figure 11). This accounts for 51 per cent of total investment under ‘business as usual’ conditions (New Policies Scenario) and 64 per cent under a scenario keeping global warming below the internationally agreed limit of 2°Celsius (450ppm scenario).
Fossil energy has dominated the past and renewable energy will dominate the future.
There is an additional benefit for Australia. In either scenario, power sector and energy efficiency investment is skewed towards Australia’s neighbours in the Asian region (40%), compared to global fossil energy investment (25%).
The outlook for coal, the most polluting of fossil fuels, is telling. Coal accounts for just 2 per cent of future energy investment under IEA ‘business as usual conditions’ and 1 per cent in the 450 scenario. The renewables dominated power sector and energy efficiency market will be 20-40 times the value of future coal sector development.

Renewable Energy Superpower2. Opportunities for Superpowers in the renewable energy era
25
FIGURE 10
Cumulative global energy investment from 2013-2035 according to the IEA 450ppm scenario13.
FIGURE 11
Cumulative global energy investment from 2013-2035 according to the IEA New Policies Scenario13.
Oil 21%
Gas 14%
Coal 1% Power
36%
Biofuels 2%
Efficiency 26%
9,014
902 1,146
5,135
2,322
508 181 2,877
1,722 8,809
1,586
4,265
920
1,371
8,120
4,040
450ppm scenario
US$52,918 Bn
Oil 28%
Gas 18%
Coal 2%
Power 34%
Biofuels 1%
Efficiency 17%
11,284
986
1,401
6,138
2,633
736 298
2,635 1,061
5,857
1,787
5,030
320 739
4,928
2,334
New Policy Scenario
US$48,167 Bn
Transport
Industry
Biofuels
Transmission
Renewables
Fossil fuels
Mining Upstream
BuildingsDistribution
Nuclear
Transport Transport Refining
EfficiencyPower Coal Gas Oil
Transport
Upstream
Renewable Energy Superpower2. Opportunities for Superpowers in the renewable energy era
26
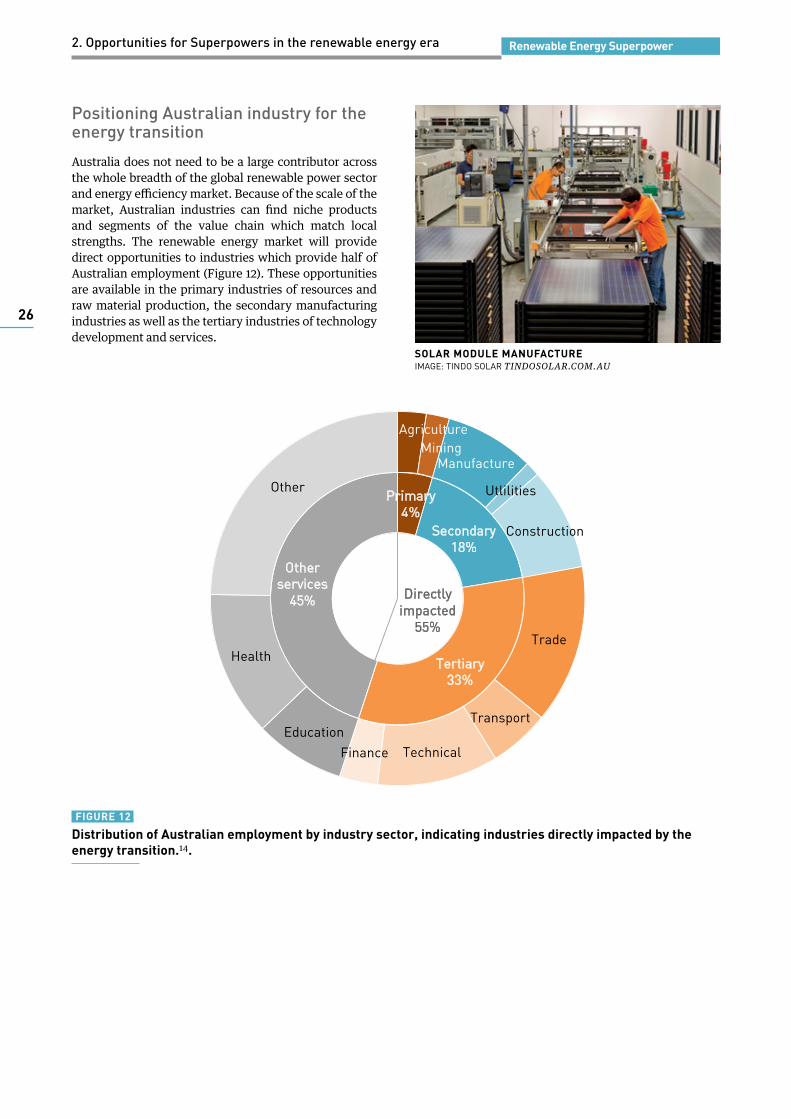
Positioning Australian industry for the energy transition
Australia does not need to be a large contributor across the whole breadth of the global renewable power sector and energy efficiency market. Because of the scale of the market, Australian industries can find niche products and segments of the value chain which match local strengths. The renewable energy market will provide direct opportunities to industries which provide half of Australian employment (Figure 12). These opportunities are available in the primary industries of resources and raw material production, the secondary manufacturing industries as well as the tertiary industries of technology development and services.
FIGURE 12
Distribution of Australian employment by industry sector, indicating industries directly impacted by the energy transition.14.
Primary 4%
Secondary 18%
Tertiary 33%
Other services
45%
Agriculture Mining
Manufacture
Utlilities
Construction
Trade
Transport
Technical Finance Education
Health
Other
Directly impacted
55%
SOLAR MODULE MANUFACTUREIMAGE: TINDO SOLAR TINDOSOLAR.COM.AU

Renewable Energy Superpower2. Opportunities for Superpowers in the renewable energy era
27
Resources and materialsRenewable energy and energy efficiency reduces the demand for energy resources such as coal, gas and oil. Instead of fossil fuels being continually drawn upon over time, renewable energy requires materials upfront for the manufacture of equipment and construction of infrastructure. Steel, aluminium, copper, and concrete are in high demand during periods of substantial infrastructure investment of any kind. While there is always extensive recycling of materials (decommissioned fossil fuel plants will be a useful source), additional raw material is likely to be needed and Australia is a major supplier of these key construction materials. The transition to renewable energy in particular will feature demand for more specific and higher value material inputs. This includes semiconductor materials for solar panels, high performance battery materials and magnetic materials for electric motors. Australia is already a major source of key renewable energy materials.
Australia currently produces large quantities of polysilicon, essential to most of the solar PV panels produced today. Local production is mostly metallurgical grade (98.5% purity) for use in aluminium smelting. This is a lower grade than required for solar PV semiconductors (99.999% purity). The global sales value of polysilicon was approximately US$6 billion in 2013 and is likely to double by 2020 based on projected sales of solar PV. The industry is currently dominated by three companies. The manufacturing process is energy intensive and economies are found with both scale and value chain proximity. While Australia does not have a significant solar PV manufacturing industry, the nation has been a leader in developing solar cell technology. Material recycling is another opportunity at the other end of the solar PV life-cycle (Box 1).
The growing advanced battery storage industry is less developed than that of solar PV. Advanced battery production is currently dominated by lithium ion batteries for consumer electronic applications and increasingly electric vehicles. In the future electric vehicles are expected to dominate the lithium ion battery market, due to the greater energy requirements of vehicles compared to personal devices. The advanced battery market is becoming highly competitive and has been projected to double in value from US$27 billion in 2014 to US$55 billion by 202015. While Australia has a very limited battery industry today, the economies found from integrating material production and downstream manufacturing could attract major manufacturers to Australia in search of a competitive advantage.
BOX 1Solar PV recycling
While solar PV modules can perform well beyond their guaranteed life — up to 25 years16 — eventually they will be decommissioned. Solar panel recycling will be a growing industry over the next 20 years.
With the rapid growth of installed solar PV capacity, the waste of end-of-life modules will grow rapidly in the coming decades. The waste in 2025 is estimated to be 24,855 tons from installations between the years 2000 and 2010 (278 MW). This is expected to grow to 1.16 million tonnes by 2035 (17,000 MW). The recycled product value is estimated to reach 1.21 US$/W with a total product value of US$12.9 billion in 2035 due to the increased recycled mass of solar panel glass and aluminium17.
In 2010, 85% of the installed modules were silicon-based modules, leaving about 15% on thin-film technologies. The majority of solar PV waste will therefore be from silicon modules that consist of about 75% glass, 10% aluminium, 3% silicon and 12% other materials.
Recycling-processes for silicon-based modules as well as thin-film modules include dismantling, shredding and hammermilling of the modules followed by different separation processes. Recycling of glass and aluminium is already well established in Australia so this would be a manageable extension of the existing industry. Existing recycling processes are able to recover between 80% and 97% of the materials, which can be used in new solar modules18. Recovered silicon can be reprocessed for new semiconductors or other applications such as aluminium smelting.
As new technologies, such as thin-film, organic, hybrid or dye-sensitised cells reach maturity, a market for recycling processes for those solar modules will be necessary.

Renewable Energy Superpower2. Opportunities for Superpowers in the renewable energy era
28
ManufacturingThere are many opportunities for Australian manufacturers to deliver innovative solutions for the global transition to efficient use of renewable energy. Many of the skills and knowhow already exist within the sector which employs almost one million people throughout Australia.
The manufacturing sector is often derided as outdated and subject to inevitable decline in this country. This is an unfortunate attitude which overlooks the reality that manufacturing is the main source of real economic productivity, converting fewer resources (materials, energy labour and capital) into more output (useful things). Gains made in other sectors are most often enabled by manufactured goods (consider computers as an example). A healthy manufacturing sector is essential to a healthy developed economy.
A wide variety of manufactured goods and equipment will be in demand for both renewable energy supply as well as energy efficiency measures. Australia will not necessarily be competitive in all areas of manufacture for this market but it is large and diverse enough for Australia to find high value contributions.
High volume commodity products like solar panels operate on slim margins and will be directed to the most competitive producers. Factors such as input costs, scale and supply logistics will exclude some regions from taking a share in this part of the market. Yet higher value niche contributions can be established within the commodity product value chain (Box 2). The step up in complexity of a more widely distributed energy system will require innovative solutions on all scales from large scale generation, storage and transmission, right through to optimising the functions of household appliances.
The market for energy efficiency is likely to be more diverse than that of energy supply. Solutions for households, transport and industry will be many and varied. With the diversity of industrial applications, solutions may be one-off or very low in number. This is where advanced manufacturing, flexibility and prototyping is of more value than economies of scale. The transport sector will require solutions for the mass market of private transport as well as improvements in coordinated transit systems. The market for household energy efficiency includes building upgrades, appliances, lighting and energy management systems. This segment of the market has already expanded rapidly due to rising energy costs as well as more conscientious home owners.
BOX 2 Wind turbine component manufacturing
Within the current wind industry, Original Equipment Manufacturers (OEMs) comprise a significant part of the value chain. These are typically large, multi-national companies that conduct the majority of research and development, and often manufacture and assemble the major components of wind turbines (blades, towers and generators). Nonetheless, there are about 8,000 parts in a wind turbine and OEMs often rely on smaller manufacturing firms to produce specialised inputs such as epoxy resins and gears. It is this small-scale, advanced manufacturing that offers the greatest opportunities for Australia to increase its share in the global wind energy market.
The U.S. represents a good example of how a wind manufacturing industry can grow rapidly in a developed country. By the end of 2013, there were over 550 wind turbine component manufacturing facilities, located mostly around traditional manufacturing regions in the Midwest, Southwest and Northeast19. Overall, the share of components manufactured domestically in the U.S. nearly tripled from 25 per cent in 2007 to 72 per cent in 201220.
Importantly, there is a demonstrated ability for different manufacturing industries to diversify into wind energy manufacturing. This is especially the case for the automotive industry, where experience with steel and precision manufacturing are essential to the production of wind turbine components21. Some of the components contained in wind turbines, such as bearings, gears and braking systems, are also produced by the automotive industry. The U.S. contains several examples of different manufacturing companies that have converted or diversified their facilities for the manufacture of wind turbine components. For example:• Allegheny Technologies, a Pittsburgh-based metals
manufacturer, upgraded its foundry in order to be able to cast and machine iron hubs and baseplates for wind turbines.
• PPG Industries, a Pittsburgh-based fibreglass manufacturer, reconfigured its facility to produce fibreglass for wind turbine blades
• Three M Tool & Machine Inc., a Michigan-based automotive supplier, opened a new facility to produce gearbox housings
• Knight & Carver, a California-based boat-building company, opened a facility for the building and repair of wind turbine blades using its experience with fibreglass
The imminent closure of the Australian auto industry is an acute concern for the 38,000 skilled manufacturing workers facing unemployment22. Diversifying into the wind energy value chain is one of many opportunities that will arise for Australian manufacturing in the shift to renewable energy.

Renewable Energy Superpower2. Opportunities for Superpowers in the renewable energy era
29
Technology and servicesAustralia’s economy has a developed and substantial services sector. This services sector employs almost 80 per cent of the Australian workforce and generates 68 per cent of added value (GDP).
The skills and knowledge within this sector will drive the innovation required by the shift to clean and efficient use of energy. Some service industries will be peripheral to the energy transition but others will be directly involved:
• Finance to establish new businesses and infrastructure
• Marketing and communication of new solutions for users
• Trade and transport logistics for delivering solutions to users
• Technical and scientific services for research and innovation
Financial services are always necessary for facilitating investment and improving its effectiveness. The financial services industry is heavily influenced by prevailing regulations and policies which guide the expectations for future investments. While the capability exists within the Australian industry, government policy equivocation has relegated renewable energy from the industry’s priorities. A clear and credible energy policy would mobilise the industry.
Australia’s Asian neighbourhood is expected to account for around 40 per cent of global power sector and efficiency investment. By engaging with the region, Australia’s trade services sector can establish the large market scale required for world leading industries. The Australian domestic market lacks this scale, and smaller local businesses can struggle to compete with large international competitors. This engagement will increase opportunities for trade businesses as well as expand the reach of other Australian industries.
Scientific and technical services are an engine of innovation. The Australian industry is highly skilled and plays a key role in developing the actual solutions for renewable energy and efficiency. Australia has a successful history in the research and development of solar photovoltaics and is actively investigating new energy technologies such as biofuels, solar thermal and energy storage. Australian engineering services were key to the successful Energy Efficiency Opportunities (EEO) program, developing efficiency solutions for Australian industries. Applications are many and diverse, often necessitating tailored solutions (Box 3).
Directing Australia’s service industries to the task of reducing emissions will provide direct opportunities for service businesses, but also the productive businesses they interact with. The fundamental skills, intellect and creativity are already established. The guidance provided by regulation and policy will animate the services sector and drive innovation across all Australian industry.
BOX 3Industrial process optimisation
Australian industry has been accustomed to low cost energy in the past. One drawback of this has been complacency in the efficient use of energy. Rising energy prices combined with emission reduction efforts has drawn attention to the efficiency gains on offer in Australian industry. One of the most cost effective solutions identified in the Australian Government’s Energy Efficiency Opportunities (EEO) program was Advanced Process Control (APC).
APC involves monitoring process equipment in real time to ensure the best performance while requiring minimum energy input. APC can adapt to variable conditions in a dynamic way which is not possible from static control equipment. APC requires detailed knowledge of each application it is applied to. Some examples from the EEO program are listed23.
• Incitec Pivot, ammonia plant in Brisbane (QLD). Potential to reduce process heat energy by 13% and increase output.
• Simplot Australia, frozen vegetable plant in Davenport (TAS). Optimised control of refrigeration compressors and condenser fans reducing energy consumption by 10%.
• Worsley Alumina, alumina plant in Worsley (WA). Increased system stability, increased output, reduced maintenance downtime and cost recovery in 7 months.
Technology solutions of this variety are skills intensive as opposed to equipment intensive. This is valuable for making improvements with minimal disruption. These examples combined the knowledge of plant operators with technology specialists to implement tailored process control systems.
Identifying efficiency opportunities, developing technical solutions and business cases requires skilled service providers even before measures are implemented. The variety of applications will benefit from this tailored assessment approach. In many cases it requires active marketing and communication to engage with businesses, to raise awareness of the energy-saving and productivity raising opportunities available.
More involved process and equipment upgrades may be identified which require new products to be developed, generating further opportunities for the manufacturing and materials sectors.

Renewable Energy Superpower2. Opportunities for Superpowers in the renewable energy era
30
Migration of energy intensive industry
Energy intensive industries have attracted significant attention due to the sensitivity of emission reduction policies on international competitiveness. Because energy is currently the primary source of greenhouse gas emissions, the industries are most often energy intensive. When emission reduction policies are unequal in different countries, energy intensive industries will be affected to different degrees depending on where they are located. Exemptions from emission reduction polices have often been granted to energy intensive industries when they are exposed to international trade. The reason for this is the concern that these businesses may relocate to nations with weaker emission policies, maintaining competitive international prices while having minimal impact on their market access. This relocation of business to avoid costs of emission reduction policies has been termed ‘carbon leakage’.
The major Emission Intensive Trade Exposed (EITE) industries subject to ‘carbon leakage’ are the manufacture of commodity materials:
• Ferrous metals: iron and steel
• Non-ferrous metals: aluminium, copper, nickel, zinc, tin and lead
• Non-metallic minerals: glass, ceramics, construction materials (lime, cement, clay)
• Pulp and paper: paper and paperboard
• Chemicals: organic and inorganic base chemicals, fertilisers and plastics
These commodities are vital to the production chain of many and diverse industries. As shown in Table 2, the combined gross added value (wages and profits) of these industries is estimated to be around US$2.5 trillion in 2013 (3.4% of total world production). The traded value from the same year is reported to be US$2.3 trillion (13% of total world trade). While the finished goods in demand are in constant flux, these materials remain essential inputs albeit with a tendency for declining material intensity and increased recycling.
Emission reduction policies may materially affect the production costs of some businesses, but there are many factors which will ultimately influence a decision to relocate including infrastructure, tax, market proximity, supply chains and human resources. In some circumstances the competitive pressure of energy price imbalances will be compelling.
So long as weak emission reduction policies are tolerated internationally, nations with low-cost energy not subject to emission standards may attract some businesses sensitive to energy costs. Relocating production facilities for these industries typically involves substantial investments with long pay back times. Over the course of the repayment period the energy cost basis for relocation may be challenged. Even if host nations have little intention of introducing emission policies, external pressure can come to bear via sanctions or restricted access to trade for nations with unacceptable emissions profiles. Relocating for a competitive advantage on the basis of emission policy avoidance is a short term strategy.
Thinking more long term, it will be jurisdictions with low cost renewable energy that deliver a sustained competitive energy advantage. Australia can be a low cost renewable energy destination attracting industries seeking a competitive energy advantage. In addition to this Australia also offers other complementary factors: high quality infrastructure, political stability, proximity to the growing Asian region, established supply chains (both upstream raw inputs as well as downstream industries) as well as a well-trained and capable human resource. While many of these features can be continually refined and improved, low cost renewable energy is a natural advantage for Australia (as is the availability of raw material inputs).
TABLE 2
Characteristics of world-wide Energy Intensive Trade Exposed industries2, 5, 24, 25, 26.
Unit Base metalsFerrous Non- ferrous
Non-metallic minerals
Pulp and paper
Chemicals (Excl.
pharma)
EITE total Other Total EITE % of total
Value added US$Bn 925 502 317 808 2,552 73,572 76,124 3%
Trade value US$Bn 395 288 300 218 1,110 2,310 15,655 17,965 13%
Energy input EJ 19.5 4.7 13.9 6.0 14.9 59.1 47.2 106.3 56%
Energy intensity MJ/$ 26 28 19 18 23 0.6 1.4 —

Renewable Energy Superpower2. Opportunities for Superpowers in the renewable energy era
31
Australian energy intensive industries
Because Australia has had an energy advantage in the past, energy intensive industries have operated here for some time. More recently the performance of Australia’s Energy Intensive Trade Exposed industries has been declining, as indicated by their balance of trade shown in Figure 13. The decline is not exclusively the result of Australia’s declining energy competitiveness but it is a contributing factor. The disruption caused by a rapid surge of production capacity in China is causing difficulties across these industry sectors internationally due to oversupply. This situation will take time to normalise as redundant facilities are decommissioned.
In the years ahead emission reduction policies will bear on the relative competitiveness of businesses within these industries. Those with lower emission profiles will be insulated from the costs and restrictions imposed. Low cost renewable energy will be a significant commercial advantage for businesses within these industries.
FIGURE 13
Balance of Australian trade in emissions intensive goods27. Chemicals manufacture excludes pharmaceuticals, toiletries and petroleum.
-10
-5
0
5
10
15
1990 1995 2000 2005 2010 2015
$Bn
Ferrous metalsNon-ferrous metalsNon-metallic mineralsPulp & paperChemicalsEITE total
STEEL MILL
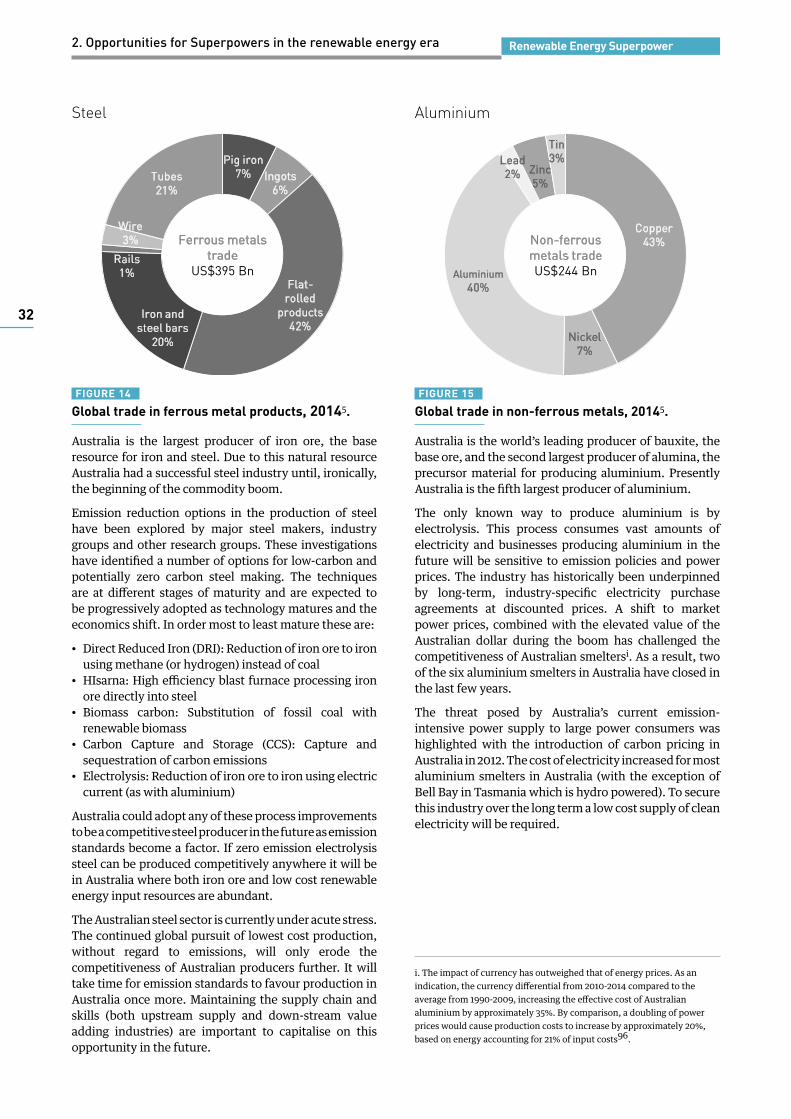
Renewable Energy Superpower2. Opportunities for Superpowers in the renewable energy era
32
Steel
FIGURE 14
Global trade in ferrous metal products, 20145.
Australia is the largest producer of iron ore, the base resource for iron and steel. Due to this natural resource Australia had a successful steel industry until, ironically, the beginning of the commodity boom.
Emission reduction options in the production of steel have been explored by major steel makers, industry groups and other research groups. These investigations have identified a number of options for low-carbon and potentially zero carbon steel making. The techniques are at different stages of maturity and are expected to be progressively adopted as technology matures and the economics shift. In order most to least mature these are:
• Direct Reduced Iron (DRI): Reduction of iron ore to iron using methane (or hydrogen) instead of coal
• HIsarna: High efficiency blast furnace processing iron ore directly into steel
• Biomass carbon: Substitution of fossil coal with renewable biomass
• Carbon Capture and Storage (CCS): Capture and sequestration of carbon emissions
• Electrolysis: Reduction of iron ore to iron using electric current (as with aluminium)
Australia could adopt any of these process improvements to be a competitive steel producer in the future as emission standards become a factor. If zero emission electrolysis steel can be produced competitively anywhere it will be in Australia where both iron ore and low cost renewable energy input resources are abundant.
The Australian steel sector is currently under acute stress. The continued global pursuit of lowest cost production, without regard to emissions, will only erode the competitiveness of Australian producers further. It will take time for emission standards to favour production in Australia once more. Maintaining the supply chain and skills (both upstream supply and down-stream value adding industries) are important to capitalise on this opportunity in the future.
Aluminium
FIGURE 15
Global trade in non-ferrous metals, 20145.
Australia is the world’s leading producer of bauxite, the base ore, and the second largest producer of alumina, the precursor material for producing aluminium. Presently Australia is the fifth largest producer of aluminium.
The only known way to produce aluminium is by electrolysis. This process consumes vast amounts of electricity and businesses producing aluminium in the future will be sensitive to emission policies and power prices. The industry has historically been underpinned by long-term, industry-specific electricity purchase agreements at discounted prices. A shift to market power prices, combined with the elevated value of the Australian dollar during the boom has challenged the competitiveness of Australian smeltersi. As a result, two of the six aluminium smelters in Australia have closed in the last few years.
The threat posed by Australia’s current emission-intensive power supply to large power consumers was highlighted with the introduction of carbon pricing in Australia in 2012. The cost of electricity increased for most aluminium smelters in Australia (with the exception of Bell Bay in Tasmania which is hydro powered). To secure this industry over the long term a low cost supply of clean electricity will be required.
i. The impact of currency has outweighed that of energy prices. As an indication, the currency differential from 2010-2014 compared to the average from 1990-2009, increasing the effective cost of Australian aluminium by approximately 35%. By comparison, a doubling of power prices would cause production costs to increase by approximately 20%, based on energy accounting for 21% of input costs96.
Pig iron 7% Ingots
6%
Flat-rolled
products 42%
Iron and steel bars
20%
Rails 1%
Wire 3%
Tubes 21%
Ferrous metals trade
US$395 Bn
Copper 43%
Nickel 7%
Aluminium 40%
Lead 2% Zinc
5%
Tin 3%
Non-ferrous metals trade US$244 Bn

Renewable Energy Superpower2. Opportunities for Superpowers in the renewable energy era
33
Non-metallic minerals
FIGURE 16
Global trade in non-metallic mineral products, 20145.
Non-metallic mineral manufacture covers a broad range of products from bricks and tiles, windows and bottles to abrasives and high strength fibres. Many of these products are unsuited to international trade due to the general availability of minerals and the low value density of bulky products. These products require high temperature processing and are sensitive to energy prices. Some high value products, such as carbon fibre, are extremely energy intensive. The US$2 billion market for carbon fibre is anticipated to grow substantially as it expands from the aerospace sector to the auto sector. Australia can benefit from low cost renewable energy and turn its current research and development into a future industry28.
Pulp and paper
FIGURE 17
Global trade in pulp and paper products, 20145.
In Australia and elsewhere, a successful pulp and paper industry must be built on the foundations of sustainable use of forest fibre. Plantation timber can be managed to provide value to foresters from both industry feedstocks as well as the sequestration of atmospheric carbon dioxide. With a sustainable supply of fibre, the energy intensive pulp and paper industry can benefit from a supply of low cost renewable energy in Australia.
Chemicals
FIGURE 18
Global trade in chemical products, 2014 (excludes pharmaceuticals and toiletry chemicals)5.
The manufacture and refining of chemical products in an energy intensive industry which provides high ‘value add’ to the economy (wages and profits). It is also a large contributor to international trade (Table 2). Australia has an established chemicals manufacturing industry which has been based on low cost supplies of fossil energy. Oil and gas are used as feedstock materials which form the final products. For energy purposes, electricity and direct use of gas are heavily utilised in the manufacturing process, mostly to provide heat. The current consumption of energy products is approximately split 60 per cent as feed stock and 40 per cent as process energy.
While the majority of developed nations have a trade surplus in chemicals, Australia’s trade in chemicals has experienced increasing deficits (Figure 13). The CSIRO have recently reviewed the strengths and weaknesses of the Australian chemicals industry29. The identified strengths were the proximity of feed stocks to manufacturing facilities and access to the growing Asian economies in the region. Weaknesses included the intensive use of water and energy, with access to competitively priced energy noted as a significant threat.
Having a supply of low-cost renewable energy will ensure the competitiveness of Australia’s chemicals industry over the long term. This is particularly important for this industry which requires substantial upfront investment in facilities and infrastructure and therefore wants stable business conditions thereafter. The sustained advantage of low cost renewable energy will be key to building up this industry in Australia.
While fossil energy feed stocks can be converted to end products with low emissions intensity (much of this is embodied in end products), renewable feed stocks from biomass may become increasingly used in the future.
Cement products
17%
Glass 21%
Pottery 7%
Non-metallic minerals trade
US$162 Bn
Clay construction materials
18%
Mineral manufactures
22%
Glassware 15%
Pulp & waste paper 21%
Paper products
29%
Pulp and paper trade
US$218 Bn
Paper & paperboard
50%
Organic 30%
Inorganic 7%
Plastics 33%
Colouring materials
7%
Other 19%
Chemicals trade US$1,110 Bn
Fertilisers 4%

Renewable Energy Superpower2. Opportunities for Superpowers in the renewable energy era
34
Other factors for industrial migration
Migration of industries will not be a foregone conclusion on the basis of low cost renewable energy alone. Australia has enjoyed an energy price advantage in the past only to be undermined by other factors making production in Australia uncompetitive.
The prolonged elevation of Australia’s currency in combination with high living costs (and therefore appropriate wages) has conspired to push many industries into uncompetitive positions. Volatility of government policy has resulted in an unstable decision making outlook, arresting new business and infrastructure investment. Australia has had limited success in expanding its market reach from the small domestic economy. With the exception of resource enterprises, Australian business has been slow to engage with the major emerging markets in our Asian neighbourhood.
Meaningful and forward looking policy reform will benefit all sectors of the economy and allow Australia to make full use of its renewable energy advantage. If Australia does not catch up to the progressive reforms taking place elsewhere, any renewable energy advantage may be overwhelmed by other domestic constraints.
Renewable energy exports
Fossil energy (coal, oil and methane) is readily transportable in its mineral forms (solids, liquids and gas). This has enabled wide scale trade in energy across the globe. On the basis of tonne kilometres carried, fossil energy accounts for 43 per cent of all shipping today (Figure 19). The shift to renewable energy will entail a dramatic reduction in the trade of energy products. This is a result of the natural distribution of renewable energy resources, reducing the need for trade, as well as less favourable economics for manufactured renewable energy products. This will be a contributing factor to the migration of energy intensive industry as previously discussed.
FIGURE 19
Global shipping task 2014 (Tonne kilometres)30.
While the trade of energy products will experience a major contraction, there will still remain some key energy applications where trade arrangements are more economic. For example the transport tasks of shipping and aviation are unlikely to find substitutes to hydrocarbon fuels for some time. Biofuels have been suggested as a low emission substitute. Hydrogen has also been considered a renewable energy medium for the future. This has attracted significant attention in Japan in particular, with a “hydrogen society” being articulated in the nation’s most recent Strategic Energy Plan31. In addition, the trade of electricity, which is common place across Europe and some parts of Asia, may be expanded by transnational infrastructure connectivity.
With an understanding of the future uncertainty surrounding the energy trade, it is worth considering the potential markets for tradeable renewable energy products, and Australia’s prospects.
Fossil energy
43% Other 57%
Coal
Crude
Gas Iron ore
Grain
Container
Other
Petroleum

Renewable Energy Superpower2. Opportunities for Superpowers in the renewable energy era
35
BiofuelsBiofuels are a substitute for hydrocarbon fuels such as petrol, diesel or jet fuel. In general biofuels are derived from organic matter formed by photosynthesis. The recent diversion of food crops to biofuel production highlighted the conflict of using cropping resources, pushing up food prices for some of the world’s most vulnerable. Recent effort has focused on algae as a source of organic matter; so called ‘third generation biofuels’. Using algae as a feedstock has a number of advantages over plant based biofuels. It does not displace food production from arable land, does not consume food products, grows much faster than plant biomass and is less water intensive. Algal biofuel can even be produced using brackish water. Challenges remain with algal biofuel production. The reticulation of water and nutrients is energy intensive making low cost energy a commercial advantage in the production of algal biofuel. In addition it remains susceptible to contamination, it requires nutrients for the growth of algal cells and the harvesting and conversion to liquid fuel is costly. A considerable global research effort is underway, including in Australia, to address these remaining issues.
Australia will be an attractive location for algae biofuel production due to the combination of abundant space for large scale harvesting and exceptional solar resources (for photosynthesis and processing energy). Close proximity to consumers in the Asian region is also advantageous.
Shipping and aviation transport are expected to continue using hydrocarbon fuel for some time due to their unique requirements. In 2012, shipping and aviation consumed approximately 21,000 petajoules (PJ) of hydrocarbon fuel (or 566 gigalitres)2. This is about 13 per cent of total global oil consumption today and valued at approximately US$180 billion per yeari. These services operate world-wide and the supply of affordable hydrocarbon fuel will continue to be concentrated, whether it is extracted fossil fuels or renewable biofuels.
Certainly the profile of consumption today will be subject to feedbacks in the future. First of all, reduced trade of energy commodities will in turn reduce demand for shipping itself. The overall demand will also be influenced by the prevailing price to consumers. Price relativities, between manufactured renewable energy products or pollution penalties for continued use of fossil fuels, will affect the competitiveness of different suppliers.
HydrogenHydrogen is often misunderstood to be an energy source but is in fact an energy carrier, much like a battery. Hydrogen requires the input of energy to remove it from stable natural molecules. Due to this energy input requirement, the economics of a hydrogen energy system have been challenged. Hydrogen can be separated from methane by steam reformation or extracted from water with the application of electric current. The separation of hydrogen also produces a by-product from the original molecule. In the case of methane, the by product is carbon dioxide which makes this pathway for producing hydrogen emission intensive. The by-product of water electrolysis is oxygen. Alternatively, seawater can be used in which case the by-product is predominantly chlorine. This can be produced with no greenhouse emissions but is more costly because it requires more energy input than steam reformation.
The attractions for producing clean hydrogen (by electrolysis) in Australia are much the same as for production of algal biofuels: abundant space for large scale harvesting and exceptional solar resources for low cost clean electricity. Australia also has pre-existing port infrastructure, currently used for the export of Liquefied Natural Gas (LNG), which can be repurposed for the shipment of hydrogen products. The upper Spencer Gulf region of South Australia has been identified as a potential site for industrial scale hydrogen production32. The Pilbara region in northern Western Australia has also be suggested as a potential production site due to its land and solar resources as well as the existing port infrastructure.
The potential for hydrogen as a renewable energy medium is difficult to specify at this time. While the potential technical applications are many and diverse, the economics of hydrogen energy appears to be a barrier. Other applications for hydrogen may prove to be more successful. Hydrogen is a versatile industrial feedstock. It has applications in the production of chemicals, electronics, glass and metals. Hydrogen can even replace coal in the reduction of iron for steel making with very low greenhouse gas emissions33.
Hydrogen produced by electrolysis can be used as a clean feedstock for industrial chemical production. Hydrogen is the main input for the production of ammonia, an important fertiliser product, and is currently sourced from methane (producing large quantities of carbon dioxide as a by-product). The global production of ammonia is approximately 180 million tonnes. Just over 10 per cent of this (18.5 million tonnes) is traded internationally with a market value of around US$10 billion in 201334. Whether or not hydrogen fulfils expectations of the ‘hydrogen economy’, a number of valuable applications will remain.
i. Assuming marine bunker fuel (IFO 380) price of US$250 per tonne and jet fuel price of US$430 per tonne.

Renewable Energy Superpower2. Opportunities for Superpowers in the renewable energy era
36
ElectricityThe international trade of electricity was reported to be worth US$32.7 billion in 20145. This is most developed in Europe where there are many nations clustered within the continent and extensive interconnection. There is no technical constraint to linking power infrastructure between bordering nations. In Europe there are also a number of high capacity, undersea cables linking areas which do not share a land border as shown in Figure 20. The main challenges experienced are political and strategic barriers as well as the establishment of an effective market exchange. South East Asian nations have been exploring an interconnected power system, the ASEAN ‘super-grid’, as a means of improving the energy supply and security of the rapidly developing region35. This has been seen as an opportunity to connect the untapped renewable resource of north-west Australia to the neighbouring region which is struggling to keep up with its own power system growth targets (Box 4).
FIGURE 20
Existing and proposed interconnections of High Voltage Direct Current (HVDC) power cables across the European continent 36. Red: existing, green: approved, blue: under consideration.
BOX 4
Electricity exports and the ASEAN ‘super-grid’
The future energy task in the South-East Asian region has been seen as an opportunity for exports of zero emission electricity from northern Australia37. Electricity demand in the region is expected to increase by more than five times by 2050. Meeting this growth in demand is already proving to be a challenge due to inadequate infrastructure and the domestic energy resources of different members of the region. An ASEAN ‘super-grid’ has been slowly developing to interconnect the isolated electricity networks and energy sources in the region38.
By connecting northern Australia to the regional ‘super-grid’, this world class solar resource could provide substantial clean electricity to the growing ASEAN region (Figure 21). There are obstacles to achieving such a solution including both physical infrastructure challenges as well as the strategic and political issues of energy interdependence. Nevertheless, there is an economic opportunity if a solution can be established in the future.
It is worth looking at Indonesia in isolation when considering the potential. Indonesia is expected to increase its annual electricity consumption by around 1,000 TWh by 2050 (Table 3). This is almost four times Australia’s total annual electricity consumption. In 2014, the weighted average cost of generation in Indonesia was US$110 per megawatt hour (AU$127/MWh). This is currently provided at a subsidy to consumers who pay about half price39. Supplying 10 per cent of Indonesia’s 2050 electricity demand at the benchmark price used in this report (AU$92/MWh), would generate $11.8 billion inflation adjusted annual revenue. It would also reduce the average cost of power in Indonesia.
Considering the broader ASEAN region, supplying 10 per cent of power via an interconnected ‘super-grid’ would generate $35 billion by 2050. For some sense of scale, providing this amount of power with solar PV would require a land area measuring approximately 45 by 45 kilometres.
Despite the obstacles of achieving this concept it is important to consider new ways of realising the potential value of Australia’s renewable energy resources.

Renewable Energy Superpower2. Opportunities for Superpowers in the renewable energy era
37
TABLE 3
Current and future energy needs of South-East Asian nations40, 41, 42.
2010 2050Population(million)
Access(%)
Per capita(MWh/yr)
Total(TWh/yr)
Population(million)
Per capita*(MWh/yr)
Total(TWh/yr)
ASEANIndonesia 251 76% 0.6 156 322 4.0 1,289
Singapore 5.4 100% 7.8 43 6.7 8.0 53
Malaysia 29 100% 3.7 112 41 7.0 285
Laos 6.6 78% 0.4 2.4 10 4.0 41
Brunei 0.4 100% 7.6 3.2 0.5 8.0 4
Philippines 98 70% 0.5 58 148 4.0 593
Cambodia 15 34% 0.2 2.3 23 3.0 68
Myanmar 53 32% 0.1 5.6 64 3.0 191
Thailand 67 99% 2.5 169 62 6.0 375
Vietnam 91 96% 1.1 104 113 5.0 564
OtherTimor-Leste 1.1 22% 0.1 0.07 2.2 4.0 9
PNG 7.3 10% 0.5 3.1 13 3.0 40
Total/Average 626 76% 25 660 805 4.7 3,825
Australia 23 100% 10 227
FIGURE 21
Illustration of the planned ASEAN grid interconnections and conceptual extension to north-west Australia43,
44. White: existing, red: planned, black: proposed Indonesia interconnection, green: proposed extended interconnection.US Dept of State Geographer. © 2015 Google. Image Landsat. Data SIO, NOAA, U.S. Navy, NGA, GEBCO

Renewable Energy Superpower2. Opportunities for Superpowers in the renewable energy era
38

Renewable Energy Superpower
39
3. Sustainable foundations for Australia’s energy future

Renewable Energy Superpower3. Sustainable foundations for Australia’s energy future
40
Overview
Abundant and high quality renewable energy resources are the key to Australia’s renewable energy advantage in the future. Unlike fossil energy which fluctuates with new discoveries, depleting reserves or geo-political factors, Australia’s low cost renewable energy advantage will be sustained into the future.
Australia’s economically demonstrated renewable energy resource potential is estimated to be 5,054 EJ, or almost ten times the annual energy consumption of the world. This resource is 75 per cent greater than all of Australia’s mineral energy resources combined (coal, gas, oil and uranium).
The renewable energy resources classified as economic are those which lie within ten kilometres of the national transmission network and can be converted to electricity at a price lower than conventional power stations. This excludes the vast majority of Australia’s renewable energy potential which could still be utilised for large scale, stand-alone production facilities as discussed in Section 2.
Further detail and data can be found in Appendix C.
A sustained advantage from renewable energy
The new balance of energy strengths and weaknesses will be long lasting and driven by the access to, and quality of, renewable resources. In Section 1 Australia was identified as one of the top ranking nations of renewable energy potential. A number of studies have been conducted assessing Australia’s renewable potential. Perhaps the most notable result came from the Australian Energy Market Operator (AEMO) 100 per cent Renewables Study which identified the renewable potential of the eastern states to be in excess of 500 times the demand from that region45. It is not necessary or practical to harness all of this energy but the huge surplus allows Australia to select the most efficient and cost effective options from a wide range of quality resources.
Australian renewable energy resource assessment
A combined investigation from Geoscience Australia (GA) and the Bureau of Resources and Energy Economics (BREE — now the Office of the Chief Economist) has reviewed the variety of energy resources available in Australia, both fossil and renewable. This assessment includes the magnitude of the raw resources and their current utilisation. An important factor that is missing from this study is a comparison of the useful potential of the various energy resources, in particular renewable forms of energy. This has been estimated using the United Nations Framework Classification (UNFC) as a guide for classifying renewable resources. Some additional definitions are required for this national resource assessment and are briefly discussed in Box 5, and in more detail in Appendix C.

Renewable Energy Superpower3. Sustainable foundations for Australia’s energy future
41
BOX 5Energy resource classification
The United Nations Framework Classification (UNFC) of mineral resources has been developed as a common framework able to relate the various national and industry systems currently in use46. The UNFC is also adapting this system for the integration of renewable energy resources. This is to allow a meaningful comparison of what are quite different resources. The UNFC framework has been utilised in this analysis.
The classification system separates and ranks total resource types in three dimensions: economic viability, technical feasibility and the level of certainty of the resource (subsurface mineral resources are difficult to specify with accuracy). The issues associated with incorporating the fundamental differences of renewable resource with finite mineral resources are explored in the UNFC documentation as well as a preliminary study by Bloomberg New Energy Finance commissioned by BP47. The UNFC classification system is designed primarily for company reporting of individual projects rather than national resource assessments, so some additional definitions have been necessary for this purpose.
A comparison of Australian resources requires not only the integration of renewables to the UNFC classification system, but also the correspondence of the UNFC system to the Australian conventions. The conventions used in Australia contain less detail, defining only Economically Demonstrated Resources (EDR), and Sub-economic Demonstrated Resources (SDR). The correspondence is mapped out in Table 4, including the additional definitions adopted by this study for assessing renewable resources.
Here we have introduced definitions which are important to identify a practical renewable resource potential.
The definitions of ‘Marketable’ and ‘Competitive’ represent economic parameters which separate the vast resource into segments that can be delivered to a customer market at a price that market will accept. Four combinations are possible providing a scale of declining potential.
• Marketable and competitive ➥Not marketable but competitive
➥Marketable but not competitive ➥Not marketable and not competitive
Marketable resources have been defined as those able to be harvested within a practical distance of the transmission network or existing generators (some of which are isolated from the transmission network). A distance of ten kilometres has been applied in this analysis.
Competitive resources have been defined as those able to deliver a useable energy product (i.e. electricity) at a price competitive to alternative sources of electricity.
A current interpretation of Economically Demonstrated Resources only includes actual projects delivered or those which are shovel ready. This substantially understates the potential economic renewable resource. This analysis also considers those resources which are both marketable and competitive as EDR.
It should be intuitive to recognise that the potential resource is greater than that which exists today. The most appropriate classification of these resources will no doubt be disputed until their potential is better understood. The full breakdown of resource classification is provided in Appendix C to inform other interpretations. This also includes the effect of alternative market conditions.
TABLE 4
Correspondence of fossil and renewable energy classifications.
Com
mod
ity in
pla
ce
ClassSub-class
Fossil Renewable
Kno
wn
depo
sit
Commercial Projects Reserves (proven)
On Production (completed)
Committed
Potentially Commercial Projects
Resources (probable)
Feasibility Stage
Publicly Announced
Para- and sub-marginal
Development not viable
Marketable and Competitive
Unmarketable but Competitive
Marketable but Non-competitive
Non-commercial Projects
Additional Quantities in PlaceUnmarketable and Non-competitive

Renewable Energy Superpower3. Sustainable foundations for Australia’s energy future
42
FIGURE 22
Distribution of Australian average solar irradiance from 3TIER’s Global Solar Dataset49.
Primary resource
Only wind and solar resources have been considered in this study. For an indication of other Australian renewable energy resources refer to the Australian Energy Resource Assessment produced by Geoscience Australia48.
The primary wind and solar resource information has been sourced from 3TIER via the International Renewable Energy Agency’s (IRENA) Global Atlas for Renewable Energy shown in Figure 22 and Figure 2349. This resource map indicates annual average solar irradiance and wind speed. The total primary energy resource in Australia is approximately 58,300 EJ each year (1,900 EJ for wind plus 56,400 EJ for solar), a truly enormous amount. For some perspective on this figure, it is equivalent to 100 years of global energy consumption2.
One advantage of renewable energy over most mineral resources is that the resource potential is not hidden beneath the earth’s surface. This provides a high level of confidence in the resources available. For advancing energy projects to feasibility assessments it is necessary to also have a thorough understanding of the resource activity over time with some statistical history.
At a glance it can be seen that the solar and wind resources are not uniform, and have an approximately inverse distribution. Solar energy is intense over the majority
of the Australian mainland, with a noticeable decline in the vicinity of the southern and eastern coasts and all of Tasmania. Wind on the other hand is most intense in Tasmania and the coastal areas. The inverse distribution of these two resources means that essentially all areas of Australia are likely to possess a quality renewable energy resource of one or the other — some will have both.
Determining how much useable energy product can be delivered depends on the performance of available harvesting technology.
Modern wind turbines and solar PV are the harvesting technologies considered in this study. This is because these resources are well defined and the technology is mature. It is understood that it is not satisfactory to consider only these two forms of generation for the purposes of managing a balanced power system. That is not the objective of this analysis.
Other resources available include ocean energy (wave and tidal), hydro (including pumped hydro) as well as geothermal energy.
The performance characteristics of both wind and solar technologies were sourced from the National Renewable Energy Laboratory System Advisor Model (SAM) database. This provides energy conversion efficiency from the primary resource to useable electricity50.
FIGURE 23
Distribution of Australian average wind speed from 3TIER’s Global Wind Dataset (wind speed at 80m height)49.

Renewable Energy Superpower3. Sustainable foundations for Australia’s energy future
43
Marketable Resources
From the primary resource, the next step was to exclude areas which were unavailable for resource harvesting. This analysis excluded land areas of restricted status such as national parks, reserves, catchment areas, built-up urban areas (including a buffer of 2km) and others provided by Geoscience Australia. This land area exclusion could be altered depending on each investigator’s aims. Agricultural lands have not been excluded. In many cases agricultural land is compatible with renewable energy harvesting. It is also worth considering other purposes for what might be marginal agricultural land.
Having developed a basis for the primary resource available, the infrastructure of the existing energy system was considered. The architecture of the current infrastructure reflects both the pattern of urban development but also large power generators which are typically co-located with energy deposits (Figure 24). This system will evolve in the future and will not remain locked in its current form. As discussed in AEMO’s 100 per cent Renewable Study45, it can be reasonably expected that that there will be new extensions to the transmission system to access the best energy resources. This will ultimately be a trade-off between grid extension costs and generator performance.
For the purpose of this study it was not necessary to trade off all options for a lowest cost system solution,
only to identify the resource available. For this reason the transmission infrastructure has been left unchanged to show the potential resources within reach of the established system. A buffer of 10km has been defined in relation to the transmission grid as well as generators which may not be connected to the transmission system. This includes the string of gas generators along the pipeline traversing central WA. This is a purely geographical constraint and makes no consideration of the network capacity and performance.
Essentially, all of the area within the infrastructure buffer and not conflicting with any restricted land is designated as the marketable zone. The marketable zone covers half a million square kilometres, 6.5% of Australia’s total land area.
The renewable energy resource contained within the marketable zone is 3,400 EJ per year.
It is reasonable to extend the marketable zone to include the area surrounding townships where local power projects and potentially micro-grids could be established. This has not been included in this study as the assessment of competiveness is more complex.
The resource defined as marketable does not mean that it is practical, or even possible to deliver all of the energy potential of that zone to users via the existing infrastructure.
FIGURE 24
Marketable zone for Australian renewable energy resources.
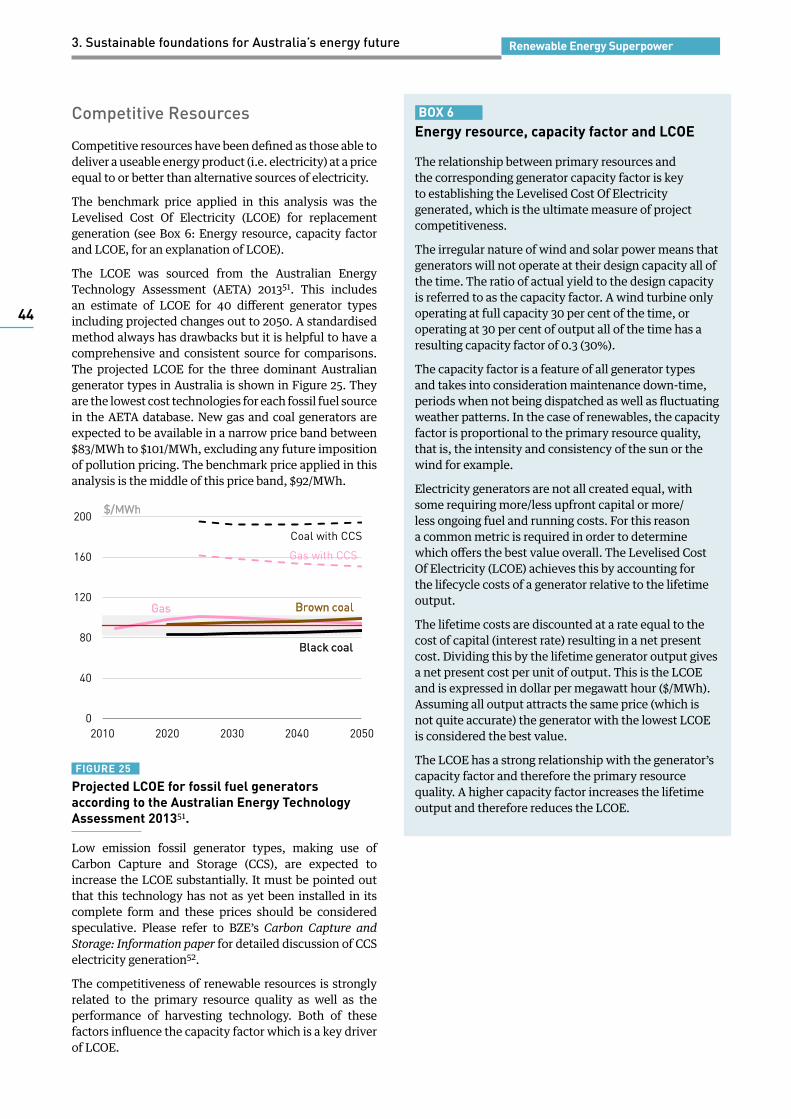
Renewable Energy Superpower3. Sustainable foundations for Australia’s energy future
44
Competitive Resources
Competitive resources have been defined as those able to deliver a useable energy product (i.e. electricity) at a price equal to or better than alternative sources of electricity.
The benchmark price applied in this analysis was the Levelised Cost Of Electricity (LCOE) for replacement generation (see Box 6: Energy resource, capacity factor and LCOE, for an explanation of LCOE).
The LCOE was sourced from the Australian Energy Technology Assessment (AETA) 201351. This includes an estimate of LCOE for 40 different generator types including projected changes out to 2050. A standardised method always has drawbacks but it is helpful to have a comprehensive and consistent source for comparisons. The projected LCOE for the three dominant Australian generator types in Australia is shown in Figure 25. They are the lowest cost technologies for each fossil fuel source in the AETA database. New gas and coal generators are expected to be available in a narrow price band between $83/MWh to $101/MWh, excluding any future imposition of pollution pricing. The benchmark price applied in this analysis is the middle of this price band, $92/MWh.
FIGURE 25
Projected LCOE for fossil fuel generators according to the Australian Energy Technology Assessment 201351.
Low emission fossil generator types, making use of Carbon Capture and Storage (CCS), are expected to increase the LCOE substantially. It must be pointed out that this technology has not as yet been installed in its complete form and these prices should be considered speculative. Please refer to BZE’s Carbon Capture and Storage: Information paper for detailed discussion of CCS electricity generation52.
The competitiveness of renewable resources is strongly related to the primary resource quality as well as the performance of harvesting technology. Both of these factors influence the capacity factor which is a key driver of LCOE.
BOX 6Energy resource, capacity factor and LCOE
The relationship between primary resources and the corresponding generator capacity factor is key to establishing the Levelised Cost Of Electricity generated, which is the ultimate measure of project competitiveness.
The irregular nature of wind and solar power means that generators will not operate at their design capacity all of the time. The ratio of actual yield to the design capacity is referred to as the capacity factor. A wind turbine only operating at full capacity 30 per cent of the time, or operating at 30 per cent of output all of the time has a resulting capacity factor of 0.3 (30%).
The capacity factor is a feature of all generator types and takes into consideration maintenance down-time, periods when not being dispatched as well as fluctuating weather patterns. In the case of renewables, the capacity factor is proportional to the primary resource quality, that is, the intensity and consistency of the sun or the wind for example.
Electricity generators are not all created equal, with some requiring more/less upfront capital or more/less ongoing fuel and running costs. For this reason a common metric is required in order to determine which offers the best value overall. The Levelised Cost Of Electricity (LCOE) achieves this by accounting for the lifecycle costs of a generator relative to the lifetime output.
The lifetime costs are discounted at a rate equal to the cost of capital (interest rate) resulting in a net present cost. Dividing this by the lifetime generator output gives a net present cost per unit of output. This is the LCOE and is expressed in dollar per megawatt hour ($/MWh). Assuming all output attracts the same price (which is not quite accurate) the generator with the lowest LCOE is considered the best value.
The LCOE has a strong relationship with the generator’s capacity factor and therefore the primary resource quality. A higher capacity factor increases the lifetime output and therefore reduces the LCOE.
Gas
0
40
80
120
160
200
2010 2020 2030 2040 2050
$/MWh
Gas with CCS
Coal with CCS
Black coal
Brown coal

Renewable Energy Superpower3. Sustainable foundations for Australia’s energy future
45
FIGURE 26
Distribution of wind turbine capacity factor within marketable zone (RHS) and corresponding LCOE according to the Australian Energy Technology Assessment 201351. Indicated in red is the price of power from the Coonooer Bridge wind farm in Victoria53.
The relationship between capacity factor and Levelised Cost of Electricity is shown in Figure 26 and Figure 27 for wind and solar generators according to AETA. These figures also indicate the resource distribution and the cost improvements expected over the projection period.
The distribution of wind resource (Figure 26) in the marketable zone is shown to have capacity factors distributed between 20 and 50 per centi. The average capacity factor for this resource is 33 per cent. According to the AETA information, the LCOE for wind power is shown to reduce moderately over the projection period, stabilising from 2020 onwards. The LCOE approximately halves across the resource distribution; from $153/MWh at 20 per cent capacity factor to $70/MWh at 50 per centii.
The most competitive Australian wind farm power prices have been delivered through the Australian Capital Territory Governments reverse auction program. In 2015 the 19MW Coonooer Bridge Wind Farm near Bendigo in Victoria agreed to a purchase price of $81.50/MWh, the lowest in Australia to date53. Two other wind farms successful in the same auction will provide power for $87/MWh (Ararat Wind Farm, 80MW) and $92/MWh (Hornsdale Wind Farm, 100MW).
FIGURE 27
Distribution of solar PV capacity factor within marketable zone (RHS) and corresponding LCOE according to the Australian Energy Technology Assessment 201351. Indicated in red is the price of power from US solar farms in 201454.
The distribution of solar resource (Figure 27) in the marketable zone is much narrower than for wind, lying between 13 and 21 per cent capacity factor. The LCOE cost estimates provided by AETA decline substantially over the projection period as indicated by the large spread in LCOE curves for different years. Considering recent international evidence of utility solar PV price declines, the progressive decline indicated by AETA appears to be highly underestimated. In the United States, after the installation of 2.9 GW of capacity, LCOEs have already declined to US$50/MWh (AU$67/MWh)54.
Due to this we reference the 2040 base curve as an indicator of what is achievable for utility scale solar PV with a substantial deployment in Australia. Such cost reductions were achieved for rooftop solar in Australia which is delivered for lower cost than the United States.
Despite the narrow distribution of solar PV capacity within the marketable zone, it can be seen in Figure 27 that this is nevertheless located in a steep range of the LCOE cost curve. The LCOE declines from $125/MWh at 13 per cent capacity factor to $79/MWh for 21 per centiii.
i Capacity factor estimated using Weibull distribution methodology. See Appendix C for details. ii. Based on 2030 cost curve.
iii. Based on 2040 cost curve. This is also supported by Canadian Solar, expecting utility scale solar to decline to $75/MWh by 202097.
0%
5%
10%
15%
20%
25%
30%
0
50
100
150
200
250
300
0% 20% 40% 60% 80%
$/MWh
Capacity factor
2012 2020 2030 2040
$81.5/MWh $67/MWh
0%
5%
10%
15%
20%
25%
30%
0
50
100
150
200
250
300
0% 10% 20% 30% 40%
$/MWh
Capacity factor
2012 2020 2030 2040

Renewable Energy Superpower3. Sustainable foundations for Australia’s energy future
46
What is evident from this is that wind and solar resources at the higher end of the capacity factor distribution are competitive with the replacement electricity generation benchmark of $92/MWh. This analysis approximates the quantity of energy able to be delivered above and below the competitive benchmark price. The cumulative annual generating potential from the marketable zone is shown in Figure 28 in relation to LCOE.
FIGURE 28
Cumulative annual electricity generation potential relative to LCOE.
The resources with an LCOE below (to the left of) the benchmark price are classified as competitive. Those resources with an LCOE exceeding the benchmark price are classified as uncompetitive. Using this approach we determine that 5,762 TWh of annual wind generation and 58,500 TWh of annual solar generation potential within the marketable zone are also competitive. The combined solar and wind competitive resource of 64,262 TWh is 73 per cent of the total marketable resource defined by this analysis.
Rooftop solar PVThe rapid uptake of solar PV has changed the economics of the power generation sector. The ability to avoid using the most expensive component of final delivered power (transmission and distribution) provides on-site generation with a price advantage. The dramatic cost reductions of solar PV hardware and installation over the past five years have resulted in a price advantage for almost all residents compared with the alternative retail electricity tariff (Table 5).
TABLE 5
Comparison of retail electricity prices in Australian capital cities with the LCOE for rooftop solar PV (excluding subsidies and including a 5% discount rate).
Capacity factor
LCOE ($/MWh)
Retail tariff
($/MWh)
Relative energy
costAdelaide 18.0% 129 327 40%
Brisbane 18.6% 130 287 45%
Canberra 17.9% 144 217 66%
Hobart 14.3% 162 247 66%
Melbourne 15.0% 159 288 55%
Sydney 16.6% 134 288 47%
Perth 19.4% 111 338 33%
Australia 17.1% 137 291 47%
To recognise the price advantage of on-site solar PV, this energy resource assessment also includes the generation potential of these systems. The potential rooftop solar PV generation capacity has been estimated previously in the BZE Buildings Plan report55. Nation-wide, the Buildings plan estimates a capacity of 31.5 GW on residential building stock and 2.5GW on non-residential building stock. Only residential building stock is considered for this part of the assessment due to the variation in power prices paid by non-residential consumers. The annual power generation potential from solar PV on residential buildings is estimated to be approximately 46 TWh per year. The production potential of rooftop solar is approximately one fifth of total Australian electricity generation today.
Solar
Wind
5,762
58,500
Ben
chm
ark
0
20,000
40,000
60,000
80,000
0 25 50 75 100 125 150 175 200
TWh/y
$/MWh

Renewable Energy Superpower3. Sustainable foundations for Australia’s energy future
47
Potential renewable energy resource
The marketable and competitive resources determined earlier in this section are classified as the Economical Demonstrated Resource of Australia’s wind and solar energy. By taking into account the asset life of wind and solar generators we can determine a base of comparison with fossil energy resources (see Appendix C for detailed explanation). Table 6 contains the conversion from annual energy production to asset lifetime energy production totalling 5,045 EJi.
TABLE 6
Lifetime energy production of Australian economically demonstrated renewable energy resources
TWh/y EJ/y Asset life Lifetime production
(EJ)
Wind 5,762 20.7 40 830
Solar (utility) 58,500 210.6 20 4,212
Solar (rooftop) 46 0.2 20 3.3
Total 64,308 231.5 — 5,045
i. It must be pointed out that the asset life is the expected life of the investment to harvest the renewable energy resource. The resource itself, unlike fossil energy, has an infinite life. Hence the asset life can be extended, or the asset replaced, and the resource harvested again, most likely at lower cost due to technological advances. In contrast, as fossil fuels are depleted, the cost of extracting the marginal resource usually increases.
TARALGA WIND FARMIMAGE: GETTY IMAGES AND TARALGA WIND FARM TARALGA-WINDFARM.COM.AU

Renewable Energy Superpower3. Sustainable foundations for Australia’s energy future
48
FIGURE 29
Comparison of fossil and renewable energy Economically Demonstrated Resources. Also includes fossil energy production potential corresponding to the International Energy Agency’s climate change mitigation scenario (450ppm)56.
0
1,000
2,000
3,000
4,000
5,000
6,000
Fossil Fossil(450ppm)
Renewable
EJ
Solar
Wind
Uranium
Natural Gas
LPG
Condensate
Crude oil
Brown coal
Black Coal
Comparing resources
Having assessed Australia’s renewable energy resource potential we can now compare this to the more familiar accounts of Australia’s fossil energy resource. Australia’s Economically Demonstrated Resources (EDR) of fossil energy is shown in Figure 29, along with the asset life production of wind and solar resources assessed to be both marketable and competitive.
The contributions of the various fossil energy reserves are estimated at a total of 2,876 EJ and are dominated by black coal (58%), followed by uranium (23%), brown coal (15%), natural gas (4%). All remaining oil based reserves (crude, condensate and LPG) account for only 1% of Australian fossil energy reserves. The wind and solar resource total of 5,054 EJ is 75 per cent greater than Australia’s fossil energy EDR.
A full resource breakdown according to the UN Framework Classification is shown in Table 7.Another item included in Figure 29 is an indication of the impact on Australia’s fossil energy resource as a result of
global emission reduction policies. Currently the fossil reserve classified as EDR includes an assumption of current extraction rates continuing in the case of black coal for over 100 years, and brown coal for over 500 years. This assumption is known to be incompatible with keeping global below the internationally agreed 2°Celsius limit.The estimate shown in Figure 29 is based on the International Energy Agency’s (IEA) 450 parts per million energy scenario. The 450 scenario corresponds to development of global energy use expected to limit the atmospheric carbon dioxide concentration to 450 parts per million and warming of two degrees.
The impacts on Australia’s fossil energy prospects of this global energy scenario are detailed in the report Fossil economy56. That study identified that the global reduction of coal consumption anticipated by the IEA scenario will heavily impact on Australia’s fossil energy production. Disappearing demand for coal accounts for the drop in reserves, reducing the total by more than half to 1,315 EJ.

Renewable Energy Superpower3. Sustainable foundations for Australia’s energy future
49
TAB
LE
7
Foss
il en
ergy
and
ren
ewab
le e
nerg
y re
sour
ce c
lass
ifica
tion
57, 5
8 .
Commodity in placeCl
ass
Sub-
clas
s
Foss
ilB
lack
Coa
lB
row
n co
alC
rude
oil
Con
d.LP
GN
atur
al
Gas
Ura
nium
Ren
ewab
leW
ind
Sola
r (U
tility
)So
lar
(Hom
e)Known deposit
Com
mer
cial
P
roje
cts
Res
erve
s (p
rove
n)55
40
5.0
3.5
2.7
3120
9
On
Pro
duct
ion
(Com
plet
ed)
1.4
0.01
0.3
Com
mitt
ed0.
60.
04—
Pote
ntia
lly
Com
mer
cial
P
roje
cts
Res
ourc
es
(pro
babl
e)1,
084
435
0.7
8.9
1.3
8344
8
Feas
ibili
ty
Stag
e6.
30.
1—
Pub
licly
A
nnou
nced
1.2
0.03
—
Mar
keta
ble
an
d Co
mpe
titiv
e83
04,
212
3
Non
-co
mm
erci
al
Pro
ject
s
Para
- an
d
sub-
mar
gina
l13
747
81.
73.
71.
660
19U
nmar
keta
ble
but C
ompe
titiv
e9,
517
85,3
510
Dev
elop
men
t no
t via
ble
1,72
21,
009
0.6
00
1.1
330
Mar
keta
ble
but N
on-
com
petit
ive
834
1,29
90
Add
ition
al Q
uant
ities
in P
lace
——
——
——
—U
nmar
keta
ble
and
Non
-co
mpe
titiv
e9,
243
5,30
30

Renewable Energy Superpower3. Sustainable foundations for Australia’s energy future
50

Renewable Energy Superpower
51
4. Australia’s disappearing fossil energy advantage

Renewable Energy Superpower4. Australia’s disappearing fossil energy advantage
52
Overview
Australia has been a beneficiary of the fossil energy era. Coal, gas and oil resources have provided low cost domestic power and export revenue. Recently, Australia’s fossil energy advantage has been disappearing.
Domestic energy prices which were once the lowest of developed countries are now middle of the pack. This has taken only ten years and has roots in the energy system reforms initiated by the Howard Government in 1998. System capacity has been increased, at great cost, while demand is declining. The national energy market is not suitable for the contemporary energy needs of technology integration, increased efficiency and decarbonisation.
Australia’s export of fossil energy experienced unprecedented revenues during the recent commodity boom. At the same time, Australia’s fossil energy imports also surged due to the depletion of domestic oil reserves. Gross fossil energy export revenues of around $70 billion shrink to $30 billion after accounting for oil imports. This diminishes further, to around $10 billion, after accounting for the foreign ownership of Australia’s fossil energy exporters.
Global emission reduction efforts will negatively impact on Australia’s fossil energy trade balance. Global demand for coal will decline before Australia reduces its oil imports.
Further detail and data can be found in Appendix D.
Australia’s historic fossil energy advantage
While not recognised as an energy superpower, Australia has enjoyed an energy advantage for a long time. Abundant supplies of coal and gas were the main contributors, while Australia was a net exporter of oil for some time. Access to low cost raw energy resources such as coal and gas, as well as secondary energy resources such as electricity and refined oil products, supported energy consuming industries (metal and chemical production, manufacturing, widely spread road transport), and household uses.
Historically, Australia has enjoyed the economic advantages from its endowment of fossil energy resources. These advantages can be grouped into two distinct domains; domestic and international. Each domain features unique characteristics of advantage over our international peers.
The domestic advantages stem from low-cost domestic energy, lowering household living costs, as well as input costs for businesses operating in Australia. Reducing living costs allows a higher proportion of household earnings to be saved or spent on life’s pleasures — hence lifting living standards and returning cash to the economy. Low cost energy also provides a source of competitive advantage for Australian businesses where energy consumption is a significant factor. This attracts more businesses to Australia (along with the associated investment and employment opportunities), increasing industrial capacity and potentially adding to Australia’s tradeable production.
The directly international advantage associated with Australia’s fossil energy is derived from export revenue earnings. Income from exporting coal, gas and oil, among other exports (resources or otherwise), has helped balance Australia’s imports as well as a high degree of foreign capital liabilities. The use of foreign capital has allowed investments to be made with a reduced need for domestic savings from Australian households, governments and businesses. For good or bad, the high level of consumption spending in Australia has been assisted, to some degree, by Australia’s surging exports.
Both Australia’s domestic and international energy advantages have been substantially eroded in a short period of time. Domestic energy costs have been inflated as a result of uneconomic investment, and the linking of raw energy products to international pricing. Over-capitalisation of the export boom cycle has resulted in devalued commodities, as well as elevated production costs in many facilities, reducing the collective profitability in now saturated markets.
In addition to the uneconomic actions noted above, global climate change mitigation is further diminishing the value of Australia’s historical domestic and international energy advantages, due to their inherent emissions intensity.

Renewable Energy Superpower4. Australia’s disappearing fossil energy advantage
53
Eroded domestic energy advantage
In just 10 years, Australia has lost its long lived domestic energy price advantage. The domestic energy system (electricity and gas) has experienced a near doubling in price, with no material change in end user performance.
The lost advantage is clearly shown in Figures 30—33. Until approximately the year 2000, Australia enjoyed some of the lowest priced energy in the world; roughly on par with Canada and the United States. Since then, the price of energy in Australia has rapidly increased. Australia has not only moved from having one of the lowest prices for energy, it has become higher than the OECD average for electricity and approaching that for gas. This price inflation has completely eroded Australia’s former advantage.
When comparing international energy prices it is important to consider the influence of both upstream primary energy costs and downstream system costs.
The upstream energy cost is typically the source of international price differences as the cost of energy raw materials is lower in countries with abundant domestic energy resources. These countries tend to be net exporters of energy while importing countries must accept prevailing market prices.
Downstream system costs are dependent on built infrastructure and regulations. While the downstream inputs are internationally equivalent, the final performance is affected by physical and regulatory designs. This distinction is useful for examining the cause of Australia’s recent energy price inflation.
Energy costs for industry are lower than household prices. This is because much higher volumes of energy are consumed by industrial customers. As a result the wholesale energy cost, which is low, makes up a larger portion of the bill than downstream costs, which are high (see Figure 40 for a detailed breakdown of bill components).
FIGURE 30
International comparison of household electricity prices59. Purchasing Power Parity (PPP) prices.
FIGURE 31
International comparison of household gas prices59. Purchasing Power Parity (PPP) prices.
FIGURE 32
International comparison of industry electricity prices59. Purchasing Power Parity (PPP) prices.
FIGURE 33
International comparison of industry gas prices59. Purchasing Power Parity (PPP) prices.
Aus
US/Can
OECD
Japan
0
40
80
120
160
200
1980 1985 1990 1995 2000 2005 2010 2015
$US/MWh (PPP)
Aus
US/Can
OECD
Japan
0
5
10
15
20
25
30
1980 1985 1990 1995 2000 2005 2010 2015
$US/GJ (PPP)
Aus
US/Can
OECD
Japan
0
40
80
120
160
200
1980 1985 1990 1995 2000 2005 2010 2015
$US/MWh (PPP)
Aus
US/Can
OECD
Japan
0
5
10
15
20
1980 1985 1990 1995 2000 2005 2010 2015
$US/GJ (PPP)

Renewable Energy Superpower4. Australia’s disappearing fossil energy advantage
54
The true cause for the price schism is being more accurately attributed now after a series of misleading accusations during the implementation of Australia’s Emissions Trading Scheme (ETS).
The heart of the issue can be traced back to 1998 when the Howard Government introduced a new regulatory regime for Australia’s energy systems. The new regime came into full effect in 2006 with the establishment of a national rule maker, the Australian Energy Market Commission (AEMC), a regulator, the Australian Energy Regulator (AER), and operator, the Australian Energy Market Operator (AEMO, formerly NEMMCO). The objective was to reduce costs through competition and streamlined administration. Multiple regulatory systems, administered by State governments, were to amalgamated into the national bodies. Separate state energy systems across eastern Australia were physically interconnected. The vertically integrated utilities, once fully state owned and operated, were split into numerous generation, distribution and retail entities. These entities were then corporatised, to facilitate privatisation. The incorporated utilities were then ‘ring-fenced’ into the three sectors to facilitate price reducing competition. The over-arching objective of the new energy market structure is:
“to promote efficient investment in, and efficient operation and use of energy services for the long term interests of consumers of electricity with respect to — price, quality, safety, reliability, and security of supply of energy.”60
The resulting market based system was proclaimed “a major success”61. Based on the most fundamental evidence, this energy system reform failed.
Household gas and electricity prices have increased by 75 per cent, industrial gas and electricity prices have increased by 20 and 40 per cent respectively (Figure 34 and Figure 35). This follows a period of stable prices in real terms. At the same time, electricity system performance and energy product quality has seen no improvement for end users, essentially paying much more for the same product (Figure 36). Administration has become more elaborate and the activity of market entities more opaque and convoluted.
Cross referencing a timeline of reform events with the price history provides a clear indication of the influences of the national energy system reform.
Industry
-50%
-25%
0%
25%
50%
75%
100%
1985 1990 1995 2000 2005 2010 2015
NEM reform initiated
Household
NEM reform completed
Carbon price period
Industry
-50%
-25%
0%
25%
50%
75%
100%
1985 1990 1995 2000 2005 2010 2015
NEM reform initiated
Household
NEM reform completed
Carbon price period
Price Outage
time Outage
frequency
-100%
-50%
0%
50%
100%
150%
200%
250%
300%
2000 2005 2010 2015
NEM reform period Complaints
Emissions intensity
FIGURE 34
Inflation adjusted Australian electricity indices for households and industry, base year 199864, 66.
FIGURE 35
Inflation adjusted Australian gas price indices for households and industry, base year 199864, 66.
FIGURE 36
NEM performance quality metrics: price, outage time, emissions intensity and complaints (RHS)62
63, 64, 65. 2011 outage spike due to natural disasters in Queensland.

Renewable Energy Superpower4. Australia’s disappearing fossil energy advantage
55
The National Electricity Market has ruined the national electricity market
The combination of two overriding factors is responsible for the price outcomes in Australia. The new regulatory regime encouraged utilities to expand the system and consumers chose to reduce their use of the system. The cost went up and the energy output went down; leading to the simple outcome of higher cost per unit of energy.
The divergence in expectation and reality is starkly illustrated by the National Electricity Market (NEM), which encompasses 88% of Australian grid supplied electricity (Figure 37). The projection made in 2010 for the current year is 25 per cent higher than the actual demand.
Successive projections show it is taking a long time for utilities to recognise the new trend.
FIGURE 37
Electricity demand and successive projections by the Australian Energy Market Operator67.
The turnaround in actual demand shown in Figure 37 is in fact unprecedented in this country. Utilities and regulating institutions alike didn’t anticipate a change of this nature because there was no experience to suggest it was possible. This seeming ‘black swan’ event might be considered excusable on these grounds, but warnings were sounded at the time which were disregarded by officials68.
The structure of the NEM actually contradicts the needs of a modern energy system. Energy efficiency, emission reductions and new technologies are the new drivers and all result in lower consumption from the centralised energy system. But the system is designed to manage and reward growth. The following is a description of how each ring-fenced sector has responded to the NEM system design.
NetworksNetworks have led the charge in price inflation by overinvesting in grid infrastructure. The NEM has encouraged this by incentivising over-investment, first by corporatising utilities and then by distorting their business conditions.
Essentially, network business revenue is guaranteed by the regulator and is determined by two components:
1. The Regulated Asset Base (RAB) — the value of grid infrastructure.
2. The Weighted Average Cost of Capital (WACC) — the interest yield on the RAB.
The WACC approved by the regulator have rewarded network businesses with an investment yield which is above the market rate for this low risk asset class69. By providing this incentive the NEM has contributed to a distortion of capital allocation over this period. In order to fully exploit the inflated yields, and hence maximise profits, network businesses have sought to expand their ‘poles and wires’ asset base. To do this, network businesses over-hyped future demand from the grid, in order to be granted expansion approval by the Australian Energy Regulator (AER).
FIGURE 38
Annual investment in electricity infrastructure 1990-2014 (70). Network proportion discounts estimated electricity generator investment (3yr moving average)65.
From 2005-2013, an estimated $75 billion has been invested in transmission and distribution network upgrades. As a result, the RAB has doubled from $38.7 billion in 2006 to $77.1 billion in 201471. Because network revenue is guaranteed by the regulator, consumers must pay for this new capacity whether they use it or not. Clearly the demand did not rise in line with projections, but declined. This is the major contributor of the rapid rise in power prices in Australia since 2005.
Historic
2010 2011
2012
2013
2014
2015
150
170
190
210
230
250
2000 2005 2010 2015 2020 2025
TWh
Total electricity
infra.
Network infra.
0
2
4
6
8
10
12
14
1990 1995 2000 2005 2010 2015
$Bn
NEM refroms initiated
NEM refroms completed

Renewable Energy Superpower4. Australia’s disappearing fossil energy advantage
56
This situation is possible due to the monopoly nature of the electricity grid. Subsequent review of this behaviour has caused the AER to tighten their approvals process. Under the so called ‘Better Regulation’ program, network operators are required to explore alternative mitigation measures for capacity constraints identified in future, such as demand reductions.
Wholesale generationThe pricing of the wholesale supply sector has remained the most stable component during the period. The reform of this sector can be considered somewhat successful for this result though it has other issues including a considerable capacity overhang.
The overzealous projections, as used by network operators to expand their asset base, were also used as guidance for new supply capacity. As a result of the reversing demand trend the new supply has been excessive. At the same time, old generators are operating beyond their original asset life and beyond the standards of the community. Renewable energy has attracted the most blame for this, mostly due to the Renewable Energy Target (RET) scheme which mandates additional generation capacity. A point that is largely overlooked however is that three quarters of the generation capacity added since the national reforms in 1998 has been in coal and gas generators65.
FIGURE 39
NEM generator capacity additions by fuel source since the year 200065.
Again, optimistic projections have resulted in considerable over-investment. New gas generation is uneconomic as a result of the compounding effects of depressed prices from oversupply, lost competitiveness from the repeal of carbon pricing, and gas price volatility caused by LNG export parity pricing. New gas plants are already being withdrawn72. In this case it is the utilities which directly bear the costs, though these are likely to be passed onto consumers to some degree by generators with retail arms, namely, Origin, AGL and Energy Australia in the East, and Synergy in the west.
The rules of the wholesale power market do not favour any generation type and so separate interventions, such as the RET, are required to lower the emission intensity of electricity supply.
The emission reducing RET policy has been downgraded to limit the market oversupply. While a logic can be found for this, the intention of the RET is to increase the proportion of renewable energy in the national mix, not to accommodate demand growth.
A natural outcome of adding renewable energy capacity in an environment of declining demand is that renewable generators will replace emission intensive generators. As it stands, price is the only determinant for generators to leave the market. On this basis, older and dirtier generators have an advantage compared with newer and cleaner generators which must cover the cost of capital on top of operating expenses. This is leading to the more likely withdrawal of less emission intensive generation and therefore counteracting the intent of the RET scheme.
RetailThe retail sector is another source for substantial price increases. This is particularly the case in Victoria which is often showcased as the gold star wearer for the performance of its fully de-regulated retail sector. Proxy competition metrics such as the number of retailers and the proportion of customers switching (the so called churn) seemingly indicate a successful market.
The ultimate judgement of market success lies in the value to consumers. The retail component of Victorian power bills is the most costly in the country and therefore the least successful, no matter what proxy metrics are used to say otherwise (Figure 40).
FIGURE 40
Household electricity price breakdown in each state, 201373.
0
2
4
6
8
10
12
14
16
2000 2002 2004 2006 2008 2010 2012
GW
Coal
Gas
Other
Wind
-100
0
100
200
300
400
QLD NSW VIC SA TAS ACT WA NT
$/MWh
Subsidy Green NetworkWholesale Retail Price

Renewable Energy Superpower4. Australia’s disappearing fossil energy advantage
57
Consumers have clearly indicated a capacity and a will to reduce energy consumption from the grid (Figure 37). Energy conscious behaviour, efficient appliances and solar power have enabled the turnaround in power consumption. However growing revenue and profits for retailers is dependent on growing consumption. Retailers have been changing customer tariff structures, increasing fixed charges and reducing the variable component; thus reducing the reward for customers who decrease their consumption. An effect of this is isolation of consumer behaviour from the actual causes of system cost increases. Ultimately an ineffective price signal will lead to higher costs for consumers.
Unfit for purpose
All three sectors of the electricity system, as structured by the National Electricity Rules, are designed to manage growth in energy consumption. This has put the utilities’ interests in opposition to customers who are striving to lower their power bills and carbon footprints. The result has been growing animosity between customers and power providers as each dig in to protect their interests, working against one another and driving up the unit price of power in Australia.
History is being repeated with Australia’s gas system, also governed by the AEMC according to the National Gas Rules. The supply network is being expanded and new unconventional gas supplies are being developed, at great cost, to satisfy projected demand. Warnings are being sounded that consumers will withdraw from the gas system even more dramatically than the electricity system as a result of rising gas prices and substitution of efficient electric appliances (Figure 41)74.
FIGURE 41
Gas demand and successive projections by the Australian Energy Market Operator as well as a recent analysis by the Melbourne Energy Institute (MEI). Dashed black line is eastern state demand based on Australian energy statistics74, 75.
Essentially the national energy market structure is not fit for its stated purpose of delivering energy services in the interests of consumers. The sector ring fencing and growth focus does not match contemporary technical solutions or customer desires. Unless it is reformed Australia’s domestic energy supply will grow increasingly uncompetitive.
NEM historic
2009
2010
2012
2013
2014
MEI
300
500
700
900
1,100
2005 2010 2015 2020 2025
PJ
50% reduction
SUBSTATION

Renewable Energy Superpower4. Australia’s disappearing fossil energy advantage
58
Eroded international energy advantage
Australia earns an income from exports of energy commodities as well as a wide range of natural resources, manufactured goods and services. During the ten year period of high commodity prices (2004-2014), energy exports were a significant proportion of all exports (22%), earning $70 billion in 201427.
When the balance of Australia’s energy trade is considered, exports and imports, the strength of Australia’s energy trade is less impressive. Because Australia’s domestic oil reserves are dwindling Australia has been a growing net importer of oil and its derivatives since the early 2000’s. These imports have surged alongside exports to reach $40.8 billion in 201476. This is Australia’s single biggest liability.
Allowing for the foreign equity holdings of Australian energy exporters (approximately 80%56), which divert export earnings back offshore, the net result is a more modest income averaging $10 billion over the past decade (Figure 42).
FIGURE 42
Balance of Australian trade in fossil energy commodities. Dashed lines adjusted for foreign equity holder profits27, 56.
During the boom period from around the year 2000, Australian supply capacity was significantly expanded, bringing higher cost resources into the market where prices were rising. This was the case for a number of resources, but the Australian energy resources subject to this were predominantly coal and gas.
In the urgency to develop new mines and capitalise on inflated prices, a high degree of pressure was applied to the industry’s supply chain resources. Engineering services, labour, transportation, real estate and so on were also subject to the effects of demand outstripping supply. Prices rose steeply making already lower quality, and therefore more expensive resources, even more costly to develop — largely as a result of the race to production. The inflationary effects of this pushed Australian producers higher up the supply cost curve, becoming less competitive. This was even the case for existing operations facing new competition for resources such as labour, transport and engineering services. Those companies which directed capital to new capacity instead of efficiency gains have been afflicted by production cost increases. This was tolerable while commodity prices remained high but many are struggling to reduce costs to profitable levels.
The contagion of increasing supply capacity was not quarantined only to within Australian borders but spread across the globe. The result of this is all too apparent now. Supplies of many commodities are far in excess of demand and prices have tumbled back to pre-boom levels (Figure 43). Those production facilities that have shuffled toward the high end of the supply cost curve are experiencing vanishing profit margins, sustained losses and ultimately closure. The full effects are yet to be realised in Australia. This is a wealth destroying reality that is consuming investment capital, and devaluing the natural capital of Australia — both the targeted resources and the environment sacrificed in order to access them.
FIGURE 43
Inflation adjusted energy commodity price index77, 78.
Export
Balance
Import
-60
-40
-20
0
20
40
60
80
1990 1995 2000 2005 2010 2015
$Bn
Coal
Oil
Gas
-1.0
-0.5
0.0
0.5
1.0
1.5
2.0
1990 1995 2000 2005 2010 2015

Renewable Energy Superpower4. Australia’s disappearing fossil energy advantage
59
Export
Balance
Import
US$70/bbl
US$100/bbl
NPS ( $70/bbl )
450 ( $70/bbl )
NPS ( $70/bbl )
NPS ( $100/bbl )
450 ( $70/bbl )
NPS ( $100/bbl )
-100
-75
-50
-25
0
25
50
75
100
125
1990 1995 2000 2005 2010 2015 2020 2025 2030 2035
$Bn
Declining value of exports from global emission reduction efforts
The period spanning this hyperactive investment drive was also notable for the step up of international concern regarding climate change mitigation. The surge in emissions from China overwhelmed the gradual emissions intensity improvements being made by other predominant emitters. This brought a new urgency to greenhouse gas reductions. The development in global climate politics over the period has been convulsive. The IPCC assessment reports have become more dire, global treaty negotiations continue to ebb and flow and unilateral pronouncements are made both for and against action. Despite mixed and tepid actions, concern and awareness of greenhouse emissions is increasing. This is now materialising as an added deflator of demand for emissions intensive energy.
Australia finds itself in the unenviable position of suffering financially if emission reduction efforts are successful or suffering the physical effects of climate change if efforts are unsuccessful.
More losses are to be expected if the world is to keep global warming below two degrees. Using the International Energy Agency projection as a guide, Australian coal and gas export revenue is estimated to fall $100 billion per year short of projections by 203056. The combination of falling export earnings and unmitigated oil imports will convert Australia’s modest net energy exports into a net import liability Figure 44.
FIGURE 44
Impact on Australia’s fossil energy trade balance of the range between the IEA’s New Policy Scenario and 450ppm scenario projections. Projected imports based on an oil price of US$70 per barrel and US$100 per barrel. Dashed lines adjusted for foreign equity holder profits27, 56.

Renewable Energy Superpower4. Australia’s disappearing fossil energy advantage
60

Renewable Energy Superpower
61
5. Maximising the renewable energy advantage

Renewable Energy Superpower5. Maximising the renewable energy advantage
62
Overview
Energy system reform is arguably Australia’s most important strategic energy task today. For Australia to maximise its renewable energy resource the cost of the downstream energy system must also be minimised.
Newly available technologies and management solutions make it possible to economically consolidate Australia’s three energy systems: electricity, gas and petroleum. Consolidated use of the electricity system will prepare Australia for the renewable energy era.
It is important for Australia to reform the structure of the electricity system. New energy solutions are evolving fast and they do not fit neatly into the confines of current generation, distribution and retail sectors. To extract the most value from new energy solutions as they evolve the new system structure must open up the full value chain. By doing this, more cost effective integrated energy solutions can emerge.
It is important that energy system reform happens now. The costs of renewable energy solutions are locked-in from the time of investment. Every uncoordinated development of the energy system adds costs and undermines Australia’s renewable energy advantage.
Further detail and data can be found in Appendix E.
Rethinking energy sectors
The legacy energy system in Australia has been defined by the energy resources and technologies of the twentieth century. The result is a limited number of large scale energy suppliers, conveying energy to end users by way of vast distribution networks to meet and balance the final demands of energy consumers, brokered by retail energy providers.
Three domestic energy systems have developed in Australia (and elsewhere) for essentially the same service: the provision of energy. Petroleum, gas and electricity have developed separate markets for their particular energy products. The petroleum energy system almost exclusively supports transportation, gas is primarily provided for heating purposes while electricity has the most varied range of end use applications. Each of these energy systems has distinct sectors reflecting the roles of supply, distribution and retail.
Within each energy system these sectors have been operated and refined in isolated domains. They are now facing new solutions which bridge not only the traditional sectors but bridge all three energy systems. This will result in both complementary and competitive outcomes.
As shown in Figure 45, distributed power generation, advanced energy storage and smart infrastructure blur the distinction between all electricity system sectors. Smart and efficient appliances and electric vehicles blur the distinction between electricity, gas and petroleum energy systems.

Renewable Energy Superpower5. Maximising the renewable energy advantage
63
FIGURE 45
Structure of electricity, gas and petroleum energy systems and interaction of new energy technologies.
Heat pumps
Electric vehicles
Supply
Distribution
Retail
Sola
r P
V
Ener
gy s
tora
ge
Smar
t inf
rast
ruct
ure
Petroleum
OIL WELLS & REFINERIES
ROAD TANKERS
PETROL STATIONS
Gas
GAS WELLS & REFINERIES
PIPELINES
GAS RETAILERS
Electricity
ELECTRICITY GENERATORS
POWERLINES
ELECTRICITY RETAILERS
Energy for transport Energy for heating Energy for all other purposes

Renewable Energy Superpower5. Maximising the renewable energy advantage
64
FIGURE 46
Comparison of basic energy prices and efficiency adjusted prices for mass market electricity, gas and petroleum. Adjusted prices (shown in orange) based on electric-equivalent appliance or vehicle energy efficiency. Mass market covers residential and commercial users. Petroleum price shown excludes taxes.
Recognising the interactions of technologies, applications and energy requires a rethink of energy sectors and system definitions. Such a fundamental restructure can seem like a daunting prospect given the degree and complexity of current activity and regulation, but macro scale efficiencies are on offer. This opportunity has been completely overlooked by the most recent Australian energy policy paper, the 2015 Energy White Paper79. Instead, the traditional sectors continue to be regarded independently and incrementally refined. Such an approach will be of very limited and short lived value.
A more general and integrated approach to energy system design and administration is needed. By focussing on the value of energy to the end user, as opposed to the price of energy, it is possible to introduce meaningful competition between energy systems. As a result of effective competitive discipline, the duplicate regulation and administration burden can be reduced. Promoting end user value will lead to more informed consumer choices, lowering energy system costs and delivering better value for energy users.
In such a competitive market, electricity has some fundamental advantages that are likely to see it prevail as the dominant energy system of the future, though with some substantial changes to its current structure.
The flexibility and efficiency of electricity as a physical energy medium is unmatched by the gas and oil energy systems. Almost all (99.7%) Australian premises are already connected to the electricity system compared with only half connected with the gas system80. No premises are connected to the petroleum energy system. Renewable energy can be substituted into the existing electricity system while gas and petroleum are inherent
sources of greenhouse gas. Renewable powered electricity is Australia’s greatest energy resource as demonstrated in Section 3. Electricity is able to be produced cost effectively on-site allowing further streamlining of the existing infrastructure.
In addition to all of these advantages, electrical energy is also better value to users once the end use energy efficiency is taken into consideration. Shown in Figure 46 is the comparative unit cost of energy delivered to residential and commercial (mass market) users for each energy system. This includes the component cost of the supply, distribution and retail sectors for each energy system.
Considered purely on a joule-for-joule energy basis electricity is shown to be the highest cost system at $70 per gigajoule followed by petroleum ($30/GJ) and gas ($29/GJ). This joule-for-joule comparison overlooks the end use efficiency of equipment consuming this energy. Considering electricity based alternatives available for gas and petroleum applications, a comparison of electric-equivalent value can be made by factoring the respective energy efficiencies (Box 7: Electric equivalent value).
The effect of end use efficiency requires cost multipliers of 4.6 for gas and 3.5 for petroleum to establish a consistent measure of value. Such is the poor energy efficiency of gas and petroleum applications. Ultimately it is the end use value of energy which is most relevant to energy users. Clearly the consideration of efficiency redefines the competitiveness of the three energy systems. On an electric-equivalent value basis, electricity is unchanged ($70/GJ) while petroleum increases to $103 per gigajoule and gas is elevated to the most costly at $133 per gigajoule.
0
30
60
90
120
150
Electricity Gas Petroleum
$/GJ
RetailDistributionSupply

Renewable Energy Superpower5. Maximising the renewable energy advantage
65
BOX 7Electric equivalent value
The useful energy that appliances provide users is a result of the energy supplied and the efficiency of the appliance. If a lamp is supplied with 10 joules of energy and is 50 per cent efficient, only 5 joules of light are provided for the user. Importantly, the user pays for the energy supplied to the lamp. In this case the user is paying double for each joule of useful light than they would pay if the lamp was 100 per cent efficient. For this reason the value of energy to users must factor not only the base energy price, but also the efficiency of their appliances.
Gas vs electricity
Considering gas use in the home, space heating, water heating and cooking are the main applications (Table 8). The comparative efficiency of electrical appliances far exceeds the efficiency of gas appliances. This is mainly due to the performance of heat pumps which make use of unmetered (free) energy sourced from surrounding air. For an electric-equivalent value of heat energy output, a gas cost multiplier of 4.6 is requiredi.
TABLE 8
Energy efficiency comparison for electric and gas heating applications81.
Gas Electric
Effective appliance efficiency Gas useSpace heating 61% 53% 330%
Water heating 32% 85% 247%
Cooking 7% 35% 55%
Weighted average — 62% 285%
Electric-equivalent multiplier 4.6 1
Petroleum vs electricity
Transportation by combustion engine vehicle is the main application for petroleum energy. Combustion engine vehicles feature high losses, primarily from waste heat. Electric vehicles make much better use of energy due to the high efficiency of electric motors. The process of charging can be responsible for greater losses than the operation of the electric powertrain. A comparison of otherwise equivalent vehicles under equivalent drive duty tests directly illustrates the relative energy efficiency performance (Table 9). For an electric-equivalent value of motive power output, a petroleum cost multiplier of 3.5 is required.
TABLE 9
Energy efficiency comparison for electric and petroleum vehicles82.
2015 Volkswagen Golf
Petrol Electric
Energy performanceL/100km 7.81 —
MJ/km 2.50 0.65
Charge efficiency — 90%
MJ/km (charge loss adjusted) 2.50 0.73
Electric-equivalent multiplier 3.5 1
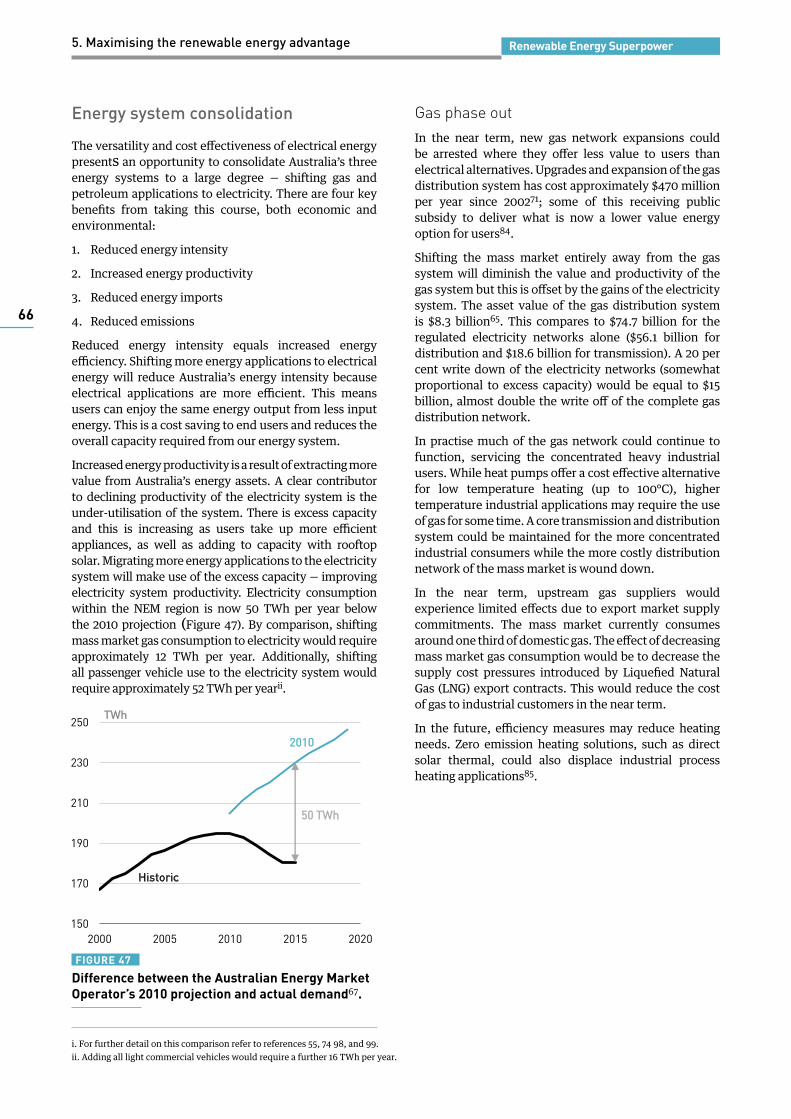
Renewable Energy Superpower5. Maximising the renewable energy advantage
66
Energy system consolidation
The versatility and cost effectiveness of electrical energy presents an opportunity to consolidate Australia’s three energy systems to a large degree — shifting gas and petroleum applications to electricity. There are four key benefits from taking this course, both economic and environmental:
1. Reduced energy intensity
2. Increased energy productivity
3. Reduced energy imports
4. Reduced emissions
Reduced energy intensity equals increased energy efficiency. Shifting more energy applications to electrical energy will reduce Australia’s energy intensity because electrical applications are more efficient. This means users can enjoy the same energy output from less input energy. This is a cost saving to end users and reduces the overall capacity required from our energy system.
Increased energy productivity is a result of extracting more value from Australia’s energy assets. A clear contributor to declining productivity of the electricity system is the under-utilisation of the system. There is excess capacity and this is increasing as users take up more efficient appliances, as well as adding to capacity with rooftop solar. Migrating more energy applications to the electricity system will make use of the excess capacity — improving electricity system productivity. Electricity consumption within the NEM region is now 50 TWh per year below the 2010 projection (Figure 47). By comparison, shifting mass market gas consumption to electricity would require approximately 12 TWh per year. Additionally, shifting all passenger vehicle use to the electricity system would require approximately 52 TWh per yearii.
FIGURE 47
Difference between the Australian Energy Market Operator’s 2010 projection and actual demand67.
Gas phase outIn the near term, new gas network expansions could be arrested where they offer less value to users than electrical alternatives. Upgrades and expansion of the gas distribution system has cost approximately $470 million per year since 200271; some of this receiving public subsidy to deliver what is now a lower value energy option for users84.
Shifting the mass market entirely away from the gas system will diminish the value and productivity of the gas system but this is offset by the gains of the electricity system. The asset value of the gas distribution system is $8.3 billion65. This compares to $74.7 billion for the regulated electricity networks alone ($56.1 billion for distribution and $18.6 billion for transmission). A 20 per cent write down of the electricity networks (somewhat proportional to excess capacity) would be equal to $15 billion, almost double the write off of the complete gas distribution network.
In practise much of the gas network could continue to function, servicing the concentrated heavy industrial users. While heat pumps offer a cost effective alternative for low temperature heating (up to 100°C), higher temperature industrial applications may require the use of gas for some time. A core transmission and distribution system could be maintained for the more concentrated industrial consumers while the more costly distribution network of the mass market is wound down.
In the near term, upstream gas suppliers would experience limited effects due to export market supply commitments. The mass market currently consumes around one third of domestic gas. The effect of decreasing mass market gas consumption would be to decrease the supply cost pressures introduced by Liquefied Natural Gas (LNG) export contracts. This would reduce the cost of gas to industrial customers in the near term.
In the future, efficiency measures may reduce heating needs. Zero emission heating solutions, such as direct solar thermal, could also displace industrial process heating applications85.
Historic
2010
50 TWh
150
170
190
210
230
250
2000 2005 2010 2015 2020
TWh
i. For further detail on this comparison refer to references 55, 74 98, and 99. ii. Adding all light commercial vehicles would require a further 16 TWh per year.

Renewable Energy Superpower5. Maximising the renewable energy advantage
67
Petroleum phase outAs Figure 46 shows, the retail network and the distribution system of road tankers to support them are a relatively small component (18%) of the cost of petroleum energy. There are two important conclusions to draw from this. The first is that there is little room for savings on top of the energy cost, which is essentially equal across the world. The second is that petroleum features a very high marginal cost where a reduction in petroleum consumption will correspond to a similar reduction in petroleum expenditure — there is relatively little value locked in downstream infrastructure.
The composition of the petroleum energy system makes for an easier transition process, where progressive withdrawal does not result in adverse price feedbacks. In fact the opposite is more likely as demand subsides and lowers the market price of primary petroleum.
Petroleum energy use is currently a strategic, economic, security and environmental risk to Australia. Approximately 97 per cent of Australian road transport fuel is currently imported making transport vulnerable to supply interruptions outside the control of Australia.
Petroleum is Australia’s single biggest import expense, totalling $40.8 billion in 2013-14 (12% of total imports)76. This expenditure on petroleum imports is wealth removed from the Australian economy whereas spending on gas and electrical energy is largely retained within the domestic economyi. Converting the energy source of Australia’s vehicle fleet to electricity would have the effect of replacing imported energy for domestic energy. This means the wealth spent on transport energy would be recirculated in the domestic economy. For every 10 per cent of passenger car use converted to electric power, imports of petroleum would be reduced by around $2 billion per yearii.
Almost all vehicles purchased in Australia are imported and this will increase to 100 per cent with the closure of the three remaining auto plants by the end of 2017. The economic gain from shifting to electric vehicles will need to weigh the savings on petroleum to the capital cost differences of vehicles. Import substitution (whole cars or even components), or price equivalency would nullify this effect.
The high proportion of petroleum based transport is also a greenhouse gas liability. Passenger cars currently account for 44 million tonnes of carbon dioxide per year, 47 per cent of transport emissions (57.4 Mt and 62% including light commercial vehicles). For every 10 per cent of passenger car use converted to clean electric power, greenhouse emission would be reduced by 4.4 million tonnes (5.7Mt including light commercial vehicles).
Preparing Australia for an electric futureAs noted in Section 1, electricity will be much more significant in the renewable energy era (Figure 48). To take full advantage of Australia’s low cost renewable power potential, the downstream system costs must also be kept low.
The costly expansion of Australia’s electricity system has caused end user prices to rise, making power uncompetitive by world standards despite low wholesale power prices. Increasing the utilisation of Australia’s electricity system will decrease the downstream infrastructure and management costs and ultimately prices for end users. Consolidating Australia’s three energy systems into one is an opportunity to recover value in the electricity system and prepare for the future.
FIGURE 48
Historic and projected world final energy demand sourced from electricity according to the International Energy Agency 450ppm scenario and Greenpeace Energy [R]evolution scenario8, 9. Projection of Australian electrification according to the Deep Decarbonisation Pathway Project10.
i. Australian gas and electricity infrastructure features substantial foreign ownership which results in a portion of the profits being removed from the Australian economy. ii. Passenger car use accounts for 50% of all petroleum consumption.
DDPP Australia
E[R]
450ppm
Historic
0%
10%
20%
30%
40%
50%
2000 2010 2020 2030 2040 2050 2060

Renewable Energy Superpower5. Maximising the renewable energy advantage
68
New energy solutions
Reformation and consolidation of the energy system is made possible by new energy technologies as well as new control and management solutions. Five key new energy solutions are presented here identifying their characteristics and the functions they bring to the energy system. New energy generation technologies as well as appliances are changing the game for stationary energy solutions. Advanced battery technology is emerging as a competitor to petroleum, the long-time master of mobile energy, as well as augmenting stationary systems. Central to both stationary and mobile applications is the communication and information processing technologies that allow more complex energy concepts to be managed.
Energy solutions for stationary applications
The conventional power system servicing stationary applications has been rocked by the rapid development of new energy technologies and solutions. The most recognisable is solar PV which can be seen on around a quarter of Australian rooftops today. But others such as heat pumps, smart appliances and infrastructure as well as storage are also having substantial impacts despite being less celebrated.
These technologies are advancing faster than anticipated and proving competitive with established utility offerings based on out dated energy system structures.
SMART HOME IN YOUR POCKETIMAGE: REPOSIT POWER REPOSITPOWER.COM
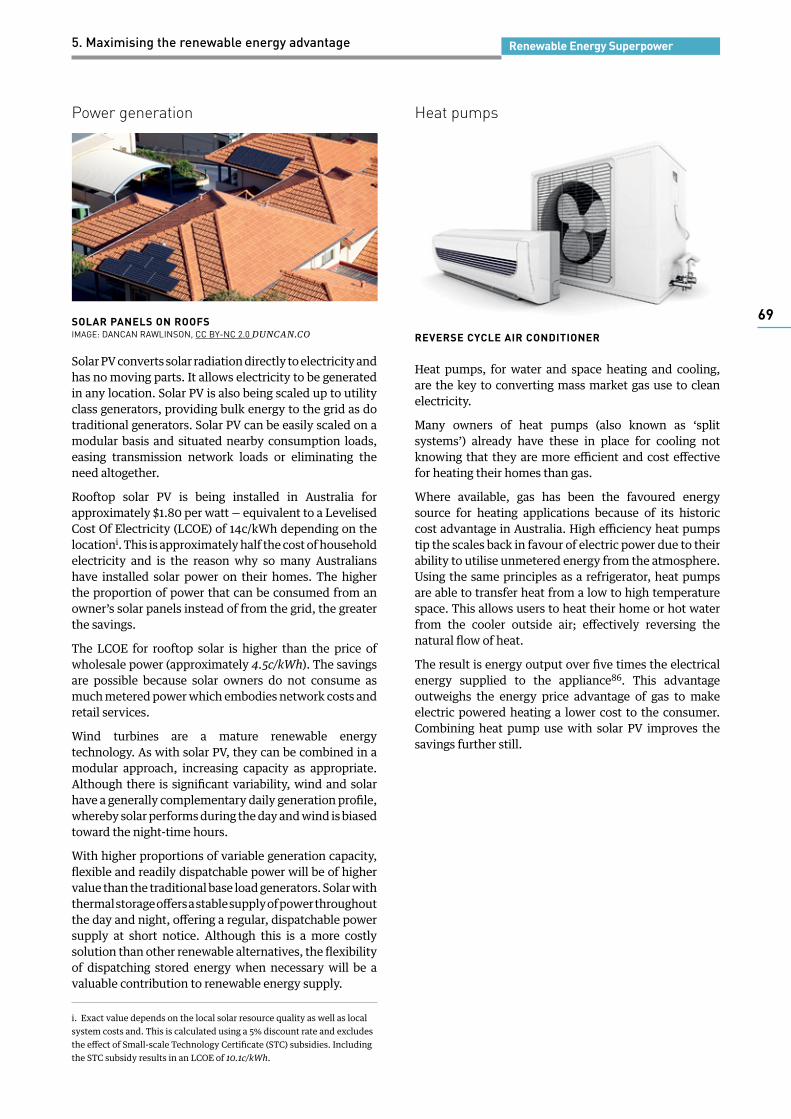
Renewable Energy Superpower5. Maximising the renewable energy advantage
69
Power generation
Solar PV converts solar radiation directly to electricity and has no moving parts. It allows electricity to be generated in any location. Solar PV is also being scaled up to utility class generators, providing bulk energy to the grid as do traditional generators. Solar PV can be easily scaled on a modular basis and situated nearby consumption loads, easing transmission network loads or eliminating the need altogether.
Rooftop solar PV is being installed in Australia for approximately $1.80 per watt — equivalent to a Levelised Cost Of Electricity (LCOE) of 14c/kWh depending on the locationi. This is approximately half the cost of household electricity and is the reason why so many Australians have installed solar power on their homes. The higher the proportion of power that can be consumed from an owner’s solar panels instead of from the grid, the greater the savings.
The LCOE for rooftop solar is higher than the price of wholesale power (approximately 4.5c/kWh). The savings are possible because solar owners do not consume as much metered power which embodies network costs and retail services.
Wind turbines are a mature renewable energy technology. As with solar PV, they can be combined in a modular approach, increasing capacity as appropriate. Although there is significant variability, wind and solar have a generally complementary daily generation profile, whereby solar performs during the day and wind is biased toward the night-time hours.
With higher proportions of variable generation capacity, flexible and readily dispatchable power will be of higher value than the traditional base load generators. Solar with thermal storage offers a stable supply of power throughout the day and night, offering a regular, dispatchable power supply at short notice. Although this is a more costly solution than other renewable alternatives, the flexibility of dispatching stored energy when necessary will be a valuable contribution to renewable energy supply.
Heat pumps
Heat pumps, for water and space heating and cooling, are the key to converting mass market gas use to clean electricity.
Many owners of heat pumps (also known as ‘split systems’) already have these in place for cooling not knowing that they are more efficient and cost effective for heating their homes than gas.
Where available, gas has been the favoured energy source for heating applications because of its historic cost advantage in Australia. High efficiency heat pumps tip the scales back in favour of electric power due to their ability to utilise unmetered energy from the atmosphere. Using the same principles as a refrigerator, heat pumps are able to transfer heat from a low to high temperature space. This allows users to heat their home or hot water from the cooler outside air; effectively reversing the natural flow of heat.
The result is energy output over five times the electrical energy supplied to the appliance86. This advantage outweighs the energy price advantage of gas to make electric powered heating a lower cost to the consumer. Combining heat pump use with solar PV improves the savings further still.
i. Exact value depends on the local solar resource quality as well as local system costs and. This is calculated using a 5% discount rate and excludes the effect of Small-scale Technology Certificate (STC) subsidies. Including the STC subsidy results in an LCOE of 10.1c/kWh.
SOLAR PANELS ON ROOFSIMAGE: DANCAN RAWLINSON, CC BY-NC 2.0 DUNCAN.CO REVERSE CYCLE AIR CONDITIONER

Renewable Energy Superpower5. Maximising the renewable energy advantage
70
Energy storage
Many different scales and types of energy storage are in development. Small batteries, thermal storage and pumped hydro can all serve to moderate energy supply and demand imbalances of various sizes and time scales. This can increase the stability of the power system and deliver lower and more stable prices. Storage is not only valuable to an energy supply featuring a high penetration of variable renewable generation, but also to the current energy system.
It is important to maintain a balance of supply and demand in the network to avoid damage from overload. Costly strategies are currently required to balance critical supply and demand events. Peak demand events currently require either the intermittent dispatch of high cost generation at short notice or the shut-down of registered power users. On occasions where supply exceeds demand, loads can be dispatched at a cost to the generators exceeding demand. New storage solutions can manage this load balancing much more accurately than generation and load dispatching.
Embedded storage capacity within the network infrastructure can also avoid grid overload in vulnerable locations. This can mitigate costly network capacity upgrades as well as enable more independent micro-grid cells within the main grid; or indeed separate from it.
The more attention grabbing development is that of household storage in combination with rooftop solar, raising the prospect of ‘off-grid’ homes. This has become an attractive idea to many in Australia as utility customers have been particularly offended by recent price increases, and many already have the solar component. In this environment, the prospect of energy independence has captured imaginations despite this not necessarily being the most cost effective solution on offer.
Off-grid solar and storage solutions will benefit some energy users now, such as those in remote locations relying on generators, those looking to make a new connection to the grid, or those who reside in costly, fringe of grid locations.
While storage may not take the bulk of customers ‘off-grid’ the potential for solar arbitrage will have a major impact on utility businesses. Solar arbitrage will allow customers to store the energy from their rooftop solar systems for use at other times of the day. This allows greater self-consumption of solar power and greater savings on utility bills. Beyond this, solar arbitrage can be used in concert with the main grid system. Smart control systems can seamlessly regulate self-consumption and energy import and export with the grid, maximising the value for the system owner. At the same time this can reduce the load, and improve the consistency of power flow, within the main grid.
This raises the question of what type of relationship will develop between households (or businesses) and utilities? The service provided by network operators will not be the one-way flow of the past. Rather, energy users will be empowered to responsibly support the operation of the electricity system. The emergence of storage technologies also raises questions about what role will remain for retailers when smart gadgets are managing all of the power flows between households and the main grid; as well as what volume of utility scale bulk generation will be required and how much variability can be managed?
Energy storage of all scales and types is going to enable a redefinition of the electricity system.
ZINC BROMIDE FLOW BATTERYIMAGE: REDFLOW REDFLOW.COM

Renewable Energy Superpower5. Maximising the renewable energy advantage
71
Micro grids and smart infrastructure
Micro grids are essentially small scale versions of the wider power grid that currently connects consumers to suppliers. The development of micro grids can change the functional behaviour of the electricity network to improve capacity utilisation, increase the stability of the power system, and add significantly to the resilience of the network as a whole. Micro grids can be embedded within the existing grid or be separate from it entirely.
The combination of distributed power generation, energy storage and intelligent communication control systems has enabled the development of interactive micro grids. These work by managing clusters of energy users, and balancing local energy production and consumption to reduce the demands on the main grid system or to maximise the efficiency of isolated energy users.
In the past, energy activity has been aggregated together in order to filter out the localised fluctuations which occur in certain regions of the system. This has made it simpler to anticipate whole-of-system loads, making the energy market simpler to balance and less costly to operate. While the aggregated signal of demand is made simpler, the by-product is uneven distribution of load throughout the network. This system must be designed to cope with local load peaks to avoid failures. Until recently the exact imbalances within the grid were not known. The introduction of real time metering has changed this situation revealing minute-by-minute, even second-by-second, detail at each property. This information is one critical component of functional micro grids.
Smart meters also have the ability to communicate with interactive electrical devices. This capability allows coordination of loads with other consumers in order to smooth system loads.
Distributed power generation is another component which allows local power demand to be offset by local power generation. This can be combined with storage to conform available local power to local demand.
The combination of adjustable supply and demand at the local scale can substantially reduce the balancing loads required either by the main grid for embedded systems or bulk power supply for stand-alone micro grids.
In the case of embedded micro grids, functional cells within the main grid architecture (such as a substation or transformer groupings) can be managed at the cellular level. By best matching the supply and demand of the embedded micro grid cell the loads on the main grid can be reduced.
The functions of stand-alone micro grids are similar to embedded applications, however the auxiliary service is not provided by the grid but by additional local infrastructure. By maximising the internal balance of the micro grid the additional infrastructure required can be minimised — saving up front and ongoing costs. In some cases it will be more cost effective to service some groupings as stand-alone systems rather than embedded in the grid.
The cellular reconfiguration of the main grid and stand-alone micro grids increases the robustness of the power system. Rather than viewing a single, consolidated energy system as monolithic and vulnerable to disruption, this can be seen as a collection of many electrical energy sub-systems. In the event of disruption, which is inevitable in any system, each cell can be isolated, localising any issues. At the extreme, each property could be isolated and continue to be serviced by onsite generation — albeit with diminished capability. The level of redundancy and failsafe is beyond the capability of the aggregated grid that currently services Australia.
The localised interactivity possible with micro grids cannot be utilised with the current isolation of retail and network interests in particular and, to a lesser degree, generators. A new, flexible regulatory architecture is required to enable a progressive transition from the current structure to more integrated solutions in an efficient way with minimal barriers.
SMART HOME DASHBOARDIMAGE: REPOSIT POWER REPOSITPOWER.COM

Renewable Energy Superpower5. Maximising the renewable energy advantage
72
Energy solutions for mobile applications
The independence offered by energy dense petroleum was the defining factor which elevated it to prime position for transport energy. The freedom and flexibility offered by self-contained automobiles was irresistible and the fixed mass transit modes of travel were progressively relegated. Mass transit continues to effectively service confined transport duties, such as rail access to high density employment zones. In these applications individual automobiles actually become a liability congesting transport networks. Despite this, automobiles have gone on to service the overwhelming majority of travel to this day.
Just as heat pumps make the mass market gas system redundant, advancing energy storage provides the opportunity to move away from the petroleum energy system. Until recently, electrical energy storage has not been able to compete with either the cost or performance of petroleum and combustion engine vehicles. The highly competitive consumer electronics market changed this with the push for ever smaller and more powerful devices. A new range of battery chemistries became commercially competitive and opened the door for automotive applications.
Electric vehiclesElectric Vehicles (EVs) are still considered a fringe technology in the automobile market. The purchase price is above that of combustion engine vehicles and most have a considerably lower range from a full chargei. These attributes have confined sales of EVs to enthusiasts to date. The viability of EVs to become a mainstream choice increases with the rate of battery technology development, in terms of both performance and cost. These are both improving rapidly and are likely to bring EVs to the main-stream market earlier than anticipated.
Dissimilarities between electric and petroleum vehicles are commonly regarded as drawbacks. Shorter range, long recharge times and lack of charge stations are typical concerns. But many EV dissimilarities bring value and new opportunities.
i. Tesla vehicles are a notable exception to this stereotype, with a single charge range of over 400km.
TESLA MODEL S AT SUPERCHARGER STATIONIMAGE: TAINA SOHLMAN / SHUTTERSTOCK.COM
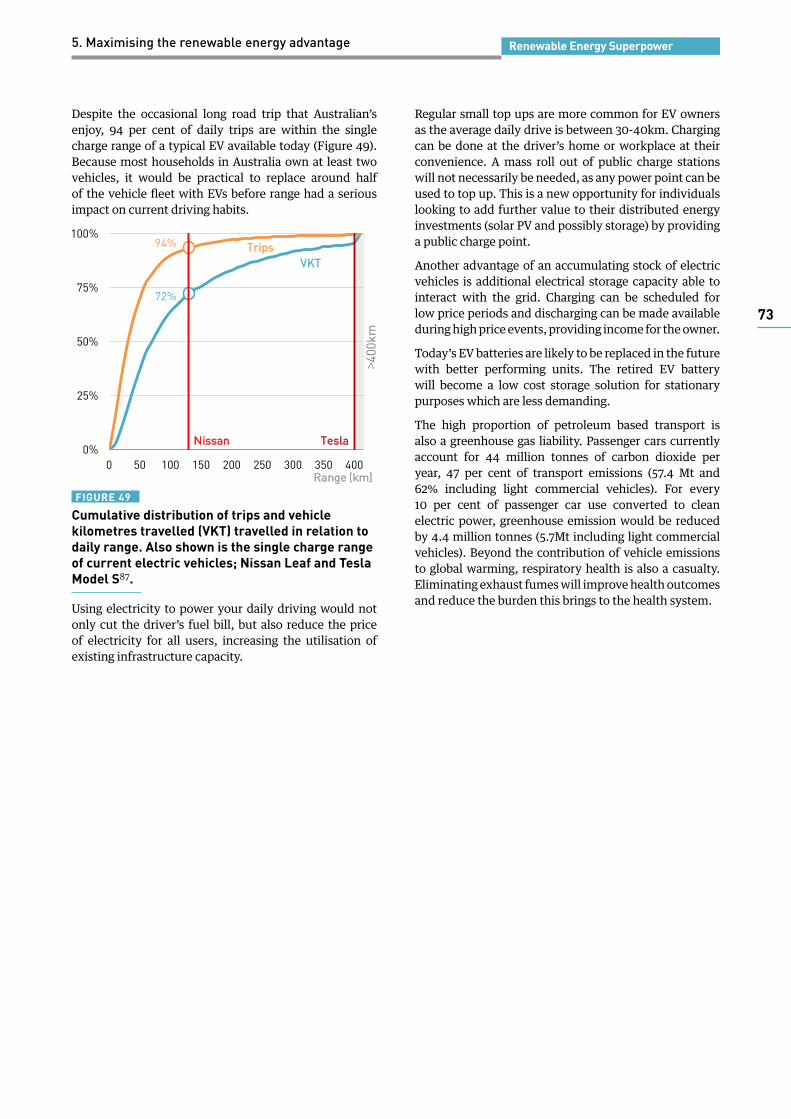
Renewable Energy Superpower5. Maximising the renewable energy advantage
73
Despite the occasional long road trip that Australian’s enjoy, 94 per cent of daily trips are within the single charge range of a typical EV available today (Figure 49). Because most households in Australia own at least two vehicles, it would be practical to replace around half of the vehicle fleet with EVs before range had a serious impact on current driving habits.
FIGURE 49
Cumulative distribution of trips and vehicle kilometres travelled (VKT) travelled in relation to daily range. Also shown is the single charge range of current electric vehicles; Nissan Leaf and Tesla Model S87.
Using electricity to power your daily driving would not only cut the driver’s fuel bill, but also reduce the price of electricity for all users, increasing the utilisation of existing infrastructure capacity.
72%
VKT
94% Trips
Tesla Nissan 0%
25%
50%
75%
100%
0 50 100 150 200 250 300 350 400Range (km)
>400
km
Regular small top ups are more common for EV owners as the average daily drive is between 30-40km. Charging can be done at the driver’s home or workplace at their convenience. A mass roll out of public charge stations will not necessarily be needed, as any power point can be used to top up. This is a new opportunity for individuals looking to add further value to their distributed energy investments (solar PV and possibly storage) by providing a public charge point.
Another advantage of an accumulating stock of electric vehicles is additional electrical storage capacity able to interact with the grid. Charging can be scheduled for low price periods and discharging can be made available during high price events, providing income for the owner.
Today’s EV batteries are likely to be replaced in the future with better performing units. The retired EV battery will become a low cost storage solution for stationary purposes which are less demanding.
The high proportion of petroleum based transport is also a greenhouse gas liability. Passenger cars currently account for 44 million tonnes of carbon dioxide per year, 47 per cent of transport emissions (57.4 Mt and 62% including light commercial vehicles). For every 10 per cent of passenger car use converted to clean electric power, greenhouse emission would be reduced by 4.4 million tonnes (5.7Mt including light commercial vehicles). Beyond the contribution of vehicle emissions to global warming, respiratory health is also a casualty. Eliminating exhaust fumes will improve health outcomes and reduce the burden this brings to the health system.

Renewable Energy Superpower5. Maximising the renewable energy advantage
74
A system designed for low cost energy
Establishing a platform for the future development of the electricity system is arguably Australia’s most important strategic energy task today. New energy solutions are ‘front loaded’ — high upfront costs and low (negligible) ongoing costs. It is important to invest efficiently because the costs are locked in from the start. Every day that passes without clear direction allows further uncoordinated development of the energy system, adding cost and undermining Australia’s future renewable energy advantage.
Re-imagining the electricity system
Australia’s electricity could provide for the majority of our energy needs; from industry, to transport as well as in the home. This electricity can be generated from renewable sources — meaning the energy that we use does not contribute to global warming. The system itself could take many shapes. Rather than regarding it at as a single monolithic system, it could be a collection of many subsystems. The responsibility for these subsystems could be any mix of individuals, communities, private companies or public bodies. Millions of electronic brains embedded within the system can manage the increased complexity of the many subsystems working in concert, ensuring each user’s needs are met. At the same time these brains can act to balance the needs of the whole system so costs are reduced.
In other words: a renewable energy system, which meets our needs, and manages itself to minimise its own cost. This is a prize worth striving for and we are capable of delivering it.
Designing a new energy system
The technical possibilities are exciting and will define the new energy system. But this is not the only factor. An open and integrated platform for trading off energy solutions will deliver the best value system to meet Australia’s energy needs. The design and implementation of this platform is more important than the ultimate shape and ownership of the physical infrastructure.
Recent history has taught us that predicting the impact of new technologies on the energy system is fraught. Disruptive technologies impact along the entire value chain, sometimes positively and sometimes negatively. Attempting to prescribe how new energy solutions are integrated into the system may miss opportunities and result in unnecessary costs. The pace of change of new technologies is fast; faster than the regulatory process which currently oversees development of the system. The compartmentalised development of energy sectors also truncates the value of solutions which bridge sectors.
New energy solutions are being regarded more generally as energy resources due to their multi-functional nature; supplying power, easing network stress and balancing loads. At the same time, the existing infrastructure is a valuable resource. Each of these resources can contribute to fulfilling the role of the energy system and have different costs and capabilities. Ultimately, a market place which integrates all system resources is needed to identify and reward the resource combinations which best meet the energy system goals.
The strategy of integrating Distributed Energy Resources (DERs) is being pursued by progressive utility providers internationally. Box 8 outlines the reforms underway in four US jurisdictions.
Renewable Energy Superpower5. Maximising the renewable energy advantage
75
BOX 8US energy system reforms
Texas
The electricity market operator of Texas (ERCOT) is investigating a framework for integrating DERs into the existing wholesale energy and ancillary services markets. ERCOT is currently considering ‘Minimal’, ‘Light’ and ‘Heavy’ integration concepts for DERs to participate across the energy value chain88, 89.
New York
Reforming the Energy Vision (REV) emerged from the aftermath of Hurricane Sandy which crippled the city’s aging and vulnerable power system. Still in development, REV is a comprehensive redesign of utility regulation to modernise the state’s energy infrastructure, lower pollution and increase resilience. Central to REV is a platform for proposing novel energy solutions, unlocking innovation and value. The facilitation of micro grids is attracting particular attention for their resilience to disruptive events which NY anticipates more of in future90, 91.
California
The Distributed Resources Plan is California’s initiative to introduce DERs into the state’s energy system. DRP has so far made more progress than other jurisdictions with its reforms, carefully evolving the existing regulations to take advantage of the value offered by new energy solutions. Location specific pricing is being targeted to ensure DERs are rewarded according to the services they actually provide to the system. California is also further ahead in the use of smart metering which allows these more complex arrangements to function92,93.
Pacific Northwest
The GridWise® project underway in the Pacific Northwest is one of the most advanced concepts for managing the complexities of the future energy system. This project is developing a control and dispatch system architecture, termed ‘transactive energy’, which fully automates the operation of the energy system. Overall supply and demand are predicted based on learned activity. Dispatches are fine-tuned according to external factors, such as changing weather which influences user demand as well as the capacity of renewable generators. Integrating the activity of DERs into a transactive energy system allows the capacity of millions of devices to assist in balancing the demands of the system as a whole. Transactive energy values DERs according to their direct contribution and delivers the lowest cost combination at all times94, 95.
Energy development platform
The essential factor to guide energy system development with an Integrated Energy Resource Market (IERM) is incentivising outcomes which match the overarching goals: safety, reliability, energy user value and minimised greenhouse gas emissions, for example. This is the basis on which energy resources succeed or fail in the Market. The resulting system would be a product of the competitive pressure to deliver on the guiding Market goals, ensuring that the best combination of resources is assembled to achieve the best complete system. In this way the energy system would design itself to a large degree.
Each energy resource influences the others, and each contributes to the system cost. Power generation, energy storage, power quality regulators, demand and demand response capacity, transmission and distribution network capacity as well as sources of emissions. Each interact and balance at any point in time. By attributing costs to the characteristics of each resource, the lowest cost combination can be resolved to meet the energy system goals at all times. The computing capacity is at our disposal to optimise these components.
Importantly, many of the necessary components of an Integrated Energy Resource Market are already operating, albeit separately. The wholesale power market, the renewable energy market, the ancillary services markets and the market for retail providers, for example. Australia also has experience operating an Emissions Trading Scheme, despite this being deactivated in 2014. These markets cover many of the energy resources identified. At the moment they are not integrated. This means the best results from isolated markets may not translate into the best results for the system as a whole.
The most notable absence in today’s energy market-places is the resource provided by transmission and distribution networks. This special status is a result of their historic monopoly nature. This is changing with the introduction of Distributed Energy Resources (DERs). While DERs do not provide the same service as networks, their capabilities influence the value and performance of network resources. It is not unforeseeable that DERs could replace large swathes of network services in future. At the margin, DERs can compete with network capacity expansion.
This change of status is an opportunity to introduce network resources to the competitive discipline of a market.
Introducing network resources into the market in a truly cost reflective way is an important change. Because the needs of the networks vary by location, an aggregated market, like that for wholesale power, is not suitable. An effective Integrated Energy Resource Market will need to relate resources at the local level (solar, demand response, storage, network capacity) to resources at the macro level (wholesale power, auxiliary services, network capacity).

Renewable Energy Superpower5. Maximising the renewable energy advantage
76
Local solutions
Bringing focus to energy activity at the local level will unlock greater value from the power system. This is the largest source of recent cost increases, namely peak capacity in the distribution network which connects millions of homes and businesses. The introduction of new Distributed Energy Resources throughout Australian homes and business can be used to improve the utilisation of the current power infrastructure, avoiding costly expansion. Smart meters, solar panels, smart and efficient appliances as well as storage are all energy resources which can support energy activity at the local level. This translates to savings across the whole system; reduced pressure on the distribution network, reduced pressure on the transmission network, more predictable and flexible demand.
The complexity of coordinating the growing number of DERs is increased by their variety and multifaceted interactions. Resolving all of the combinations available will require some rationalisation. Working with the infrastructure that is already in place, local resource optimisation can be paired with macro resource optimisation, extracting the best of both worlds. The functional layout of network infrastructure can support this where transformer or substation nodes could be gateways between the macro grid and local micro grid.
At the grid gateway, macro energy resources compete with local energy resources to resolve the best combination which meets the Market goals. The complexities of DERs can be resolved at the local level, optimising resources throughout the node. These resources can be bid on one side of the gateway against the macro resources on the other side. This is essentially embedded micro grids operating within the macro energy system.
Resolving the balance of energy resources at the local level has the effect of defining local resource sub-markets and opens many opportunities. It brings five key advantages:
1. Individual energy users will be rewarded according to the value of resources they contribute to the system.
2. The ability to tailor resources and management strategies to unique user compositions at each node.
3. Lower entry hurdle for energy resource market participants, adding competitive pressure.
4. Simplifying the operation of macro energy resources, needing to only respond to the signals of node gateways.
5. The ability for the local node to support itself to some degree in the event of a disruption elsewhere, improving reliability and resilience.
The market approach described interacts across the entire energy value chain. While technologies will influence which resource combinations prove economic, an Integrated Energy Resource Market will guide system development. So long as the goals of the energy system are reflected by the allocation of resources, the system can be allowed to evolve with the confidence it is delivering value.
System transition
In ten years’ time Australia’s energy system may be configured very differently to its current form. Even if this change takes place rapidly, it must progressively morph from its current form without causing critical disruptions.
The electricity system provides an essential service to Australia. Any change in the structure and function of the system must allow its stable operation over the course of any change. This does not mean substantial and rapid changes cannot be achieved. For a time some overlapping roles or subordination of new activities may be required as they are introduced and proven to function.
The Integrated Energy Resource Market described conceptually here can be adapted from existing energy markets and physical infrastructure. Local sub-systems can be piloted and validated before being implemented across the whole system. The greatest challenge lies with introducing network capacity into the IERM as a resource.
While acknowledging the difficulties and discomfort associated with change, it is important that reform is not delayed. Low cost renewable energy is an economic opportunity for Australia. The competitiveness of Australia’s electricity system in the future will be determined by the decisions and investments made today.

Renewable Energy Superpower
77
6. Insights and recommendations
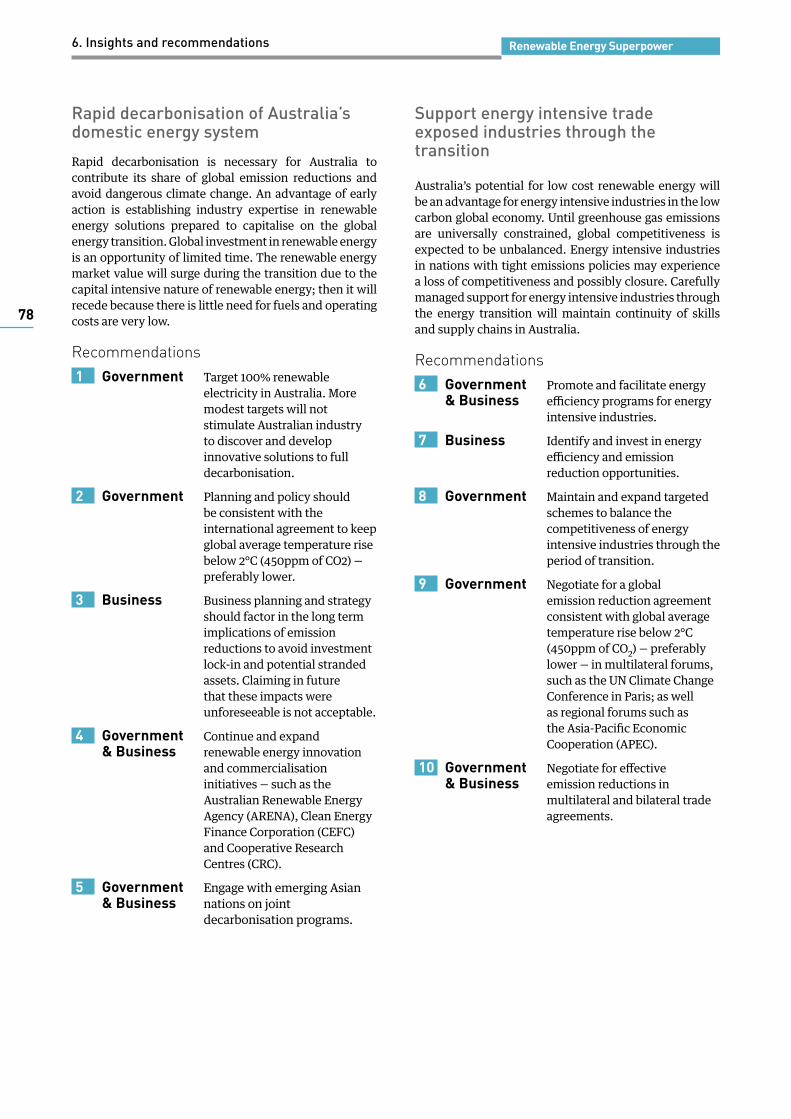
Renewable Energy Superpower6. Insights and recommendations
78
Rapid decarbonisation of Australia’s domestic energy system
Rapid decarbonisation is necessary for Australia to contribute its share of global emission reductions and avoid dangerous climate change. An advantage of early action is establishing industry expertise in renewable energy solutions prepared to capitalise on the global energy transition. Global investment in renewable energy is an opportunity of limited time. The renewable energy market value will surge during the transition due to the capital intensive nature of renewable energy; then it will recede because there is little need for fuels and operating costs are very low.
Recommendations1 Government Target 100% renewable
electricity in Australia. More modest targets will not stimulate Australian industry to discover and develop innovative solutions to full decarbonisation.
2 Government Planning and policy should be consistent with the international agreement to keep global average temperature rise below 2°C (450ppm of CO2) — preferably lower.
3 Business Business planning and strategy should factor in the long term implications of emission reductions to avoid investment lock-in and potential stranded assets. Claiming in future that these impacts were unforeseeable is not acceptable.
4 Government Continue and expand & Business renewable energy innovation and commercialisation initiatives — such as the Australian Renewable Energy Agency (ARENA), Clean Energy Finance Corporation (CEFC) and Cooperative Research Centres (CRC).
5 Government Engage with emerging Asian & Business nations on joint decarbonisation programs.
Support energy intensive trade exposed industries through the transition
Australia’s potential for low cost renewable energy will be an advantage for energy intensive industries in the low carbon global economy. Until greenhouse gas emissions are universally constrained, global competitiveness is expected to be unbalanced. Energy intensive industries in nations with tight emissions policies may experience a loss of competitiveness and possibly closure. Carefully managed support for energy intensive industries through the energy transition will maintain continuity of skills and supply chains in Australia.
Recommendations6 Government Promote and facilitate energy & Business efficiency programs for energy intensive industries.
7 Business Identify and invest in energy efficiency and emission reduction opportunities.
8 Government Maintain and expand targeted schemes to balance the competitiveness of energy intensive industries through the period of transition.
9 Government Negotiate for a global emission reduction agreement consistent with global average temperature rise below 2°C (450ppm of CO2) — preferably lower — in multilateral forums, such as the UN Climate Change Conference in Paris; as well as regional forums such as the Asia-Pacific Economic Cooperation (APEC).
10 Government Negotiate for effective & Business emission reductions in multilateral and bilateral trade agreements.

Renewable Energy Superpower6. Insights and recommendations
79
Improve productivity of the electricity system
Over-investment in electricity network capacity has caused power prices to become uncompetitive. The excess capacity must be utilised to recover competitive power prices without enormous asset write downs.
Recommendations11 Government The National Electricity Market & Business must be reformed as early as possible, opening up the full value chain to allow integration of new energy solutions which do not fit within traditional system sectors.
12 Government Gas distribution network expansion should be ceased as early as possible.
13 Government Promote and facilitate a shift from mass market gas use to high efficiency electricity use.
14 Government Promote and facilitate adoption & Business of electric vehicles.
15 Individuals Advocate for energy system regulatory reform in the interests of energy users — including accurate valuation of personal energy investments such as rooftop solar and storage.
16 Individuals Adopt high efficiency electrical appliances and couple this with your rooftop solar or GreenPower® to save money and eliminate your carbon footprint.
Don’t be timid, plan for a zero emission future
Decarbonisation is an unavoidable condition for a safe climate in the future, this should be considered the most likely future path for economic development; not a token scenario as is currently commonplace. Australia has a natural renewable energy advantage and this will be a base for future prosperity.

80
Renewable Energy Superpower

Renewable Energy Superpower
81
References

Renewable Energy SuperpowerReferences
82
1. Roser, Max. Our world in data. [Online] http://ourworldindata.org/data/resources-energy/energy-production-and-changing-energy-sources/.
2. Organisation for Economic Co-operation and Development (OECD). World energy balances. OECDiLibrary. [Online] International Energy Agency. http://www.oecd-ilibrary.org/energy/data/iea-world-energy-statistics-and-balances_enestats-data-en.
3. Energy Information Agency. International energy statistics. [Online] http://www.eia.gov/beta/international/data/browser/.
4. World Energy Council. World Energy Resources: 2013 Survey. [Online] 2013. https://www.worldenergy.org/publications/2013/world-energy-resources-2013-survey/.
5. United Nations Comtrade. International Trade Statistics Database. [Online] 2014. http://comtrade.un.org/data/.
6. U.S. National Aeronautics and Space Administration (NASA), Surface meteorology and Solar Energy (SSE). Solar: monthly and annual average global horizontal irradiance GIS data at one-degree resolution of the World from NASA/SSE. OpenEI. [Online] 2009. http://en.openei.org/datasets/dataset/solar-monthly-and-annual-average-global-horizontal-irradiance-gis-data-at-one-degree-resolution-of.
7. U.S. National Aeronautics and Space Administration (NASA), Surface meteorology and Solar Energy (SSE). NASA SSE monthly average wind data at one-degree resolution of the world. OpenEI. [Online] 2005. http://en.openei.org/datasets/dataset/nasa-see-monthly-average-wind-data-at-one-degree-resolution-of-the-world.
8. International Energy Agency. World Energy Outlook 2014. 2014.
9. Greenpeace International, Global Wind Energy Council, Solar Power Europe. Energy Revolution. [Online] 2015. http://www.greenpeace.org/international/en/publications/Campaign-reports/Climate-Reports/Energy-Revolution-2015/.
10. ClimateWorks Australia, Australia National University. Pathways to Deep Decarbonization in Australia. [Online] 2014. http://deepdecarbonization.org/countries/.
11. van Vuuren, D., den Elzen, M., Lucas, P., Eickhout, B., Strengers, B., van Ruijven, B., Wonink, S., van Houdt, R. Stabilizing greenhouse gas concentrations at low levels: an assessment of reduction strategies and costs. RCP 2.6. RCP Database (version 2.0). [Online] 2007. http://tntcat.iiasa.ac.at:8787/RcpDb/dsd?Action=htmlpage&page=compare. Climatic Change doi:10.1007/s/10584-006-9172-9.
12. Wise, M., Calvin, K., Thomson, A., Clarke, L., Bond-Lamberty, B., Sands, R., Smith, S., Janetos, A., Edmonds, J. Implications of Limiting CO2 Concentrations for Land Use and Energy. RCP 4.5. RCP Database (version 2.0). [Online] 2009. http://tntcat.iiasa.ac.at:8787/RcpDb/dsd?Action=htmlpage&page=compare. Science. 324:1183-1186.
13. International Energy Agency. World Energy Investment Outlook — Special Report. [Online] 2014. https://www.iea.org/publications/freepublications/publication/world-energy-investment-outlook---special-report---.html.
14. Australian Bureau of Statistics. Labour Force, Australia, Detailed, Quarterly. [Online] August 2015. http://www.abs.gov.au/AUSSTATS/[email protected]/DetailsPage/6202.0Aug%202015?OpenDocument. Cat: 6291.0.55.003, Table 04. Employed persons by Industry division of main job (ANZSIC).
15. PR Newswire. Global Market for Advanced Batteries — Forecast, Trends & Opportunities 2015-2020. [Online] 2015. http://www.prnewswire.com/news-releases/global-market-for-advanced-batteries---forecast-trends--opportunities-2015-2020-300136464.html.
16. SunPower. High Performance, Excellent Durability. [Online] http://global.sunpower.com/high-efficiency-solar-technology/solar-panels/.
17. GlobalData. Solar Module Recycling: A Necessary Step to Maximize Environmental Benefits of Solar PV Industry. [Online] 2012. http://store.globaldata.com/market-reports/power/solar-module-recycling-a-necessary-step-to-maximize-environmental-benefits-of-solar-pv-industry#.VfEXWZeo2iw.
18. PV Cycle. PV Recycling. [Online] http://www.pvcycle.org/pv-recycling/.
19. American Wind Energy Association. U.S. Wind Industry Annual Market Report 2013. [Online] 2013. http://www.awea.org/AMR2013.
20. Office of Energy Efficiency & Renewable Energy. 2012 Wind Technologies Market Report. U.S. Department of Energy. [Online] 2012. http://energy.gov/eere/wind/downloads/2012-wind-technologies-market-report.
21. Center on Globalization, Governance & Competitiveness. Manufacturing Climate Solutions, Wind Power: Chapter 11. [Online] http://www.cggc.duke.edu/environment/climatesolutions/greeneconomy_Ch11_WindPower.pdf.
22. Productivity Commission. Australia’s Automotive Manufacturing Industry. [Online] August 2014. http://www.pc.gov.au/inquiries/completed/automotive/report.
23. Department of Resources Energy and Tourism. Case Studies in Systems Optimisation. [Online] 2013. http://eex.gov.au/files/2014/08/Systems-Optimisation-Case-Study-2013.pdf.

Renewable Energy SuperpowerReferences
83
24. McKinsey & Company. Manufacturing the future: The next era of global growth and innovation. [Online] 2012. http://www.mckinsey.com/insights/manufacturing/the_future_of_manufacturing.
25. The World Bank. Manufacturing, value added (% of GDP). [Online] http://data.worldbank.org/indicator/NV.IND.MANF.ZS.
26. Statistica. Gross value added in the global pharmaceutical industry from 2006 to 2012. [Online] http://www.statista.com/statistics/418674/pharmaceutical-industry-globally-by-gross-value-added/.
27. Australian Bureau of Statistics. International Trade in Goods and Services, Australia. [Online] July 2015. http://www.abs.gov.au/AUSSTATS/[email protected]/DetailsPage/5368.0Jul%202015?OpenDocument. Cat: 5368.0.
28. Carbon Nexus. [Online] http://www.carbonnexus.com.au/.
29. Hajkowicz S., Cook H., King S., Deverell J., Cox F. Strategic Directions: Towards sustained growth of the Australian chemicals and plastics industry. [Online] 2013. http://www.pacia.org.au/docs_mgr/PACIA_strategic_directions_WEB.pdf.
30. United Nations Conference on Trade and Development. Review of Maritime Transport 2014. [Online] 2014. http://unctad.org/en/pages/publications/Review-of-Maritime-Transport-%28Series%29.aspx.
31. Ministry of Economy Trade and Industry. Strategic Energy Plan. [Online] April 2014. http://www.enecho.meti.go.jp/en/category/others/basic_plan/pdf/4th_strategic_energy_plan.pdf.
32. Forcey, T. Proposal for an economic study into: Producing hydrogen and ammonia for domestic use and export, from the Spencer Gulf region of South Australia. Melbourne Energy Insitute, University of Melbourne. [Online] 2015. http://www.enecho.meti.go.jp/en/category/others/basic_plan/pdf/4th_strategic_energy_plan.pdf.
33. COURSE 50. Technologies to reduce CO2 emissions. [Online] 2011. http://www.jisf.or.jp/course50/tecnology01/index_en.html.
34. PotashCorp. World Ammonia Exports. [Online] 2013. http://www.potashcorp.com/overview/nutrients/nitrogen/overview/world-ammonia-exports.
35. Energy, ASEAN Centre for. ASEAN Power Grid. [Online] http://www.aseanenergy.org/programme-area/apg/.
36. J JMesserley, Maix, Tintazul. HVDC connections in Europe excepting low power lines to platforms and out of service lines.
37. Asia Pacific Super Grid: Solar electricity generation, storage and distribution. Blakers, A., Luther, J., Nadolny, A. 4, 2012, Green, Vol. 2.
38. Head ASEAN Power Utilities/Authorities (HAPUA). [Online] http://www.hapuasecretariat.org/#.
39. PT PLN (Persero). Statistics Report. [Online] 2014. http://www.pln.co.id/eng/?p=2773.
40. International Energy Agency. Energy access database. [Online] 2014. http://www.worldenergyoutlook.org/resources/energydevelopment/energyaccessdatabase/.
41. Central Intelligence Agency. The World Factbook. [Online] https://www.cia.gov/library/publications/the-world-factbook/.
42. United Nations Department of Economic and Social Affairs. 2015 Revision of World Population Prospects. [Online] 2015. http://esa.un.org/unpd/wpp/.
43. Electricity Generating Authority of Thailand. ASEAN Power Grid. [Online] 2013. http://www.unescap.org/sites/default/files/EGAT_ASEANPowerGrid.PDF.
44. Blakers, A. North Australia’s electrifying future: powering Asia with renewables. Reneweconomy. [Online] 2013. http://reneweconomy.com.au/2013/north-australias-electrifying-future-powering-asia-with-renewables-80382.
45. Australian Energy Market Operator. 100 per cent Renewables Study — Modelling Outcomes. [Online] July 2013. https://www.environment.gov.au/climate-change/publications/aemo-modelling-outcomes.
46. United Nations Economic Commission for Europe. Application of the United Nations Framework Classification for Fossil Energy and Mineral Reserves and Resources 2009 to renewable energy resources. 2015. ECE/ENERGY/GE.3/2015/3.
47. Bloomberg New Energy Finance. Renewable Reserves: Testing the concept for the US and Brazil. [Online] March 2013. http://www.unece.org/fileadmin/DAM/energy/se/pdfs/UNFC/unfc2009_re_ws.wdc.2014/BNEP_RE_ReservesReport_2013.pdf.
48. Carson, L. Australian Energy Resource Assessment — 2 ed. Report. Geoscience Australia. [Online] 2014. http://www.ga.gov.au/metadata-gateway/metadata/record/gcat_79675.
49. International Renewable Energy Agency. Global Atlas for Renewable Energy. [Online] http://irena.masdar.ac.ae/.
50. National Renewable Energy Laboratory (NREL). System Advisor Model. [Online] https://sam.nrel.gov/. Version: 2015.1.30.
51. Bureau of Resource, Energy and Economics. Australian Energy Technology Assessment 2013. [Online] 2013. http://www.industry.gov.au/Office-of-the-Chief-Economist/Publications/Pages/Australian-energy-technology-assessments.aspx.
52. Beyond Zero Emissions. Carbon Capture and Storage: Information Paper. [Online] 2014. http://media.bze.org.au/fossileconomy/Carbon%20Capture%20and%20Storage%20information%20paper.pdf.

Renewable Energy SuperpowerReferences
84
53. ACT Government. Wind auction result delivers renewable energy and economic benefits to the ACT. [Online] February 2015. http://www.cmd.act.gov.au/open_government/inform/act_government_media_releases/corbell/2015/wind-auction-result-delivers-renewable-energy-and-economic-benefits-to-the-act.
54. Kann, S. GTM Research Presentation: The Evolution of the U.S. Solar Market. [Online] Greentech Media, April 2015. http://www.slideshare.net/greentechmediaevents/gtm-research-presentation-the-evolution-of-the-us-solar-market.
55. Beyond Zero Emissions. Zero Carbon Australia Buildings Plan. [Online] 2013. https://bze.org.au/buildings.
56. Drew, G. Fossil Economy. Beyond Zero Emissions. [Online] November 2014. http://media.bze.org.au/fossileconomy/FossilEconomy.pdf.
57. Britt, A.F., Barber, J., Carson, L., Penney, K., Skirrow, R.G., Shael, T., Dulfer, H., Cowling, S., Senior, A.B., McKay, A.D., Whitaker, A.J., Summerfield, D., Miezitis, Y., Porritt, K.R., Cadman, S. & Barnicoat, A.C. Australia’s Mineral Resource Assessment 2013. 2 ed. Report. [Online] 2013. http://www.ga.gov.au/metadata-gateway/metadata/record/gcat_78803.
58. Geoscience Australia. Oil and Gas Resources of Australia 2010. [Online] 2012. http://www.ga.gov.au/data-pubs/data-and-publications-search/publications/oil-gas-resources-australia/2010. Geocat: 73412.
59. Organisation for Economic Development and Co-operation. IEA Energy Prices and Taxes Statistics. [Online] 1980-2012. http://www.oecd-ilibrary.org/energy/data/iea-energy-prices-and-taxes-statistics_eneprice-data-en.
60. Autralian Energy Market Commission. National Electricity Rules . [Online] http://www.aemc.gov.au/Energy-Rules/National-electricity-rules.
61. Willett, E. Speech to the APP Energy Regulatory and Market Development Forum — Country Information Presentation — The Australian Experience. Australian Energy Regulator. [Online] 2008. https://www.aer.gov.au/news/australian-energy-reform.
62. Szuster, P. Will Australia follow the German experience and buy-back their energy networks? 2015.
63. Autralian Energy Market Operator. Carbon Dioxide Equivalent Intensity Index. [Online] 2001-2015. http://www.aemo.com.au/Electricity/Settlements/Carbon-Dioxide-Equivalent-Intensity-Index.
64. Australian Bureau of Statistics. Consumer Price Index, Australia. [Online] June 2015. http://www.abs.gov.au/AUSSTATS/[email protected]/DetailsPage/6401.0Jun%202015?OpenDocument. Cat: 6401.0, TABLE 7. CPI: Group, Sub-group and Expenditure Class, Weighted Average of Eight Capital Cities .
65. Australian Energy Regulator. State of the Energy
Market. [Online] 2014. http://www.aer.gov.au/publications/state-of-the-energy-market-reports/state-of-the-energy-market-2014.
66. Australian Bureau of Statistics. Producer Price Indexes, Australia. [Online] March 2015. http://www.abs.gov.au/AUSSTATS/[email protected]/DetailsPage/6427.0Mar%202015?OpenDocument. Cat: 6427.0, Table 13. Input to the Manufacturing industries, division and selected industries.
67. Australian Energy Market Operator. Electricity Statement of Opportunities. [Online] 2010-2015. http://www.aemo.com.au/Electricity/Planning/Archive-of-previous-Planning-reports/2014-Electricity-Statement-of-Opportunities.
68. Various. Submissions — on draft decision and revised proposals. Australian Energy Regulator website. [Online] February 2009. http://www.aer.gov.au/networks-pipelines/determinations-access-arrangements/ausgrid-energyaustralia-determination-2009-14/revised-proposal.
69. Wood, T. Putting Customers Back in Front: How to make energy cheaper. Grattan Institute. [Online] 2012. http://grattan.edu.au/report/putting-the-customer-back-in-front-how-to-make-electricity-prices-cheaper/.
70. Bureau of Infrastructure, Transport and Regional Economics. Australian Infrastructure Statistics — Yearbook 2014. Bureau of Infrastructure, Transport and Regional Economics. [Online] 2014. http://bitre.gov.au/publications/2014/yearbook_2014.aspx. Table E 1.1d.
71. Australian Energy Regulator. State of the Energy Market. [Online] 2007-2014. http://www.aer.gov.au/publications/state-of-the-energy-market-reports.
72. Stanwell Corporation Limited. Stanwell to withdraw Swanbank Gas Power Station from service. [Online] February 2014. http://www.stanwell.com/news/stanwell-withdraw-swanbank-gas-power-station-service/.
73. Australian Energy Market Commission. 2014 Residential Electricity Price Trends. [Online] 2014. http://www.aemc.gov.au/Markets-Reviews-Advice/2014-Residential-Electricity-Price-Trends.
74. Forcey, T. Switching Off Gas — An examination of declining gas demand in Eastern Australia. Melbourne Energy Insitute, University of Melbourne. [Online] 2015. http://www.energy.unimelb.edu.au/switching-gas-report-available-here.
75. Australian Energy Market Operator. Gas Statement of Opportunities. [Online] 2009-20014. http://www.aemo.com.au/Gas/Planning/Gas-Statement-of-Opportunities/Previous-GSOO-reports.
76. Department of Foreign Affairs and Trade. Australia’s trade in goods and services 2013-14. [Online] 2014. http://dfat.gov.au/about-us/publications/trade-investment/australias-trade-in-goods-and-services/Pages/australias-trade-in-goods-and-services-2013-14.aspx.

Renewable Energy SuperpowerReferences
85
77. BP. Statistical Review of World Energy 2015. [Online] 2015. http://www.bp.com/en/global/corporate/about-bp/energy-economics/statistical-review-of-world-energy.html. Data workbook — Statistical Review 2015.
78. The World Bank. Global Economic Monitor (GEM) Commodities. [Online] http://databank.worldbank.org/data/reports.aspx?source=global-economic-monitor-%28gem%29-commodities.
79. Department of Industry. Energy White Paper. [Online] 2015. http://ewp.industry.gov.au/.
80. Australian Bureau of Statistics. Environmental Issues: Energy Use and Conservation. [Online] March 2014. http://www.abs.gov.au/AUSSTATS/[email protected]/DetailsPage/4602.0.55.001Mar%202014?OpenDocument. Cat: 4602.0.55.001.
81. Energy Efficiency Strategies. Energy Use in the Australian Residential Sector 1986-2020. [Online] 2008. http://www.energyrating.gov.au/program-publications/?viewPublicationID=2141. ISBN: 978-1-921298-14-1.
82. U.S. Department of Energy. Compare Side-by-Side, 2015 Volkswagen e-Golf and 2015 2015 Golf (1.8L turbo, gasoline). fueleconomy.gov. [Online] 2015. https://www.fueleconomy.gov/feg/Find.do?action=sbs&id=35849&id=35349.
83. Australian Energy Regulator. State of the Energy Market. [Online] 2007-2014. http://www.aer.gov.au/publications/state-of-the-energy-market-reports.
84. Regional Denelopment Victoria. Regional Gas Infrastructure program. [Online] http://www.rdv.vic.gov.au/programs-and-grants/regional-gas-infrastructure.
85. Solar industrial process heating in Australia — Past and current status. Fuller, R. 1, s.l. : Renewable Energy, 2011, Vol. 36. DOI:10.1016/j.renene.2010.06.023.
86. Daikin Australia. Split System Air Conditioners, Tech Specs. [Online] http://www.daikin.com.au/home-solutions/split-air-conditioning.
87. State Government of Victoria. Victorian Integrated Survey of Travel and Activity. [Online] 2007. https://www.data.vic.gov.au/data/dataset/victorian-integrated-survey-of-travel-and-activity.
88. Electric Reliability Council of Texas, Inc. Distributed Resource Energy and Ancillaries Market Task Force. [Online] http://www.ercot.com/committees/board/tac/dreamtf.
89. St. John, J. Texas Mulls New Grid Markets for Aggregated Distributed Energy Resources. [Online] Greentech Media, June 2015. http://www.greentechmedia.com/articles/read/texas-looks-to-distributed-energy-resources-as-market-players.
90. New York State Department of Public Service. Reforming the Energy Vision (REV), About the Initiative. [Online] http://www3.dps.ny.gov/W/PSCWeb.nsf/All/CC4F2EFA3A23551585257DEA007DCFE2?OpenDocument.
91. Tweed, K. New York Launches Major Regulatory Reform for Utilities. [Online] Greentech Media, April 2014. http://www.greentechmedia.com/articles/read/new-york-launches-major-regulatory-reform-for-utilities.
92. California Public Utilities Commission. Distribution Resources Plan (R.14-08-013). [Online] http://www.cpuc.ca.gov/PUC/energy/drp/.
93. St. John, J. California’s Plan to Turn Distributed Energy Resources Into Grid Market Players. [Online] Greentech Media, June 2015. http://www.greentechmedia.com/articles/read/californias-plan-to-turn-distributed-energy-resources-into-grid-market-play.
94. GridWise. Transactive Energy. [Online] 2015. http://www.gridwiseac.org/about/transactive_energy.aspx.
95. St. John, J. Results From the World’s Biggest Transactive Energy Test . [Online] Greentech Media, September 2015. http://www.greentechmedia.com/articles/read/results-from-the-worlds-biggest-transactive-energy-test?utm_source=SmartGrid&utm_medium=Headline&utm_campaign=GTMDaily.
96. H., Turton. The Aluminium Smelting Industry: Structure, market power, subsidies and greenhouse gas emissions. [Online] 2002. http://www.tai.org.au/documents/dp_fulltext/DP44.pdf.
97. Parkinson, G. Large scale solar costs to fall by half in Australia in five years. [Online] Reneweconomy, July 2015. http://reneweconomy.com.au/2015/large-scale-solar-costs-to-fall-by-half-in-australia-in-five-years-30750.
98. Keech, R. The Energy Freedom Home. s.l. : Beyond Zero Emissions, Scribe, 2015.
99. Alternative Technology Association. Are We Still Cooking With Gas. [Online] November 2014. http://www.ata.org.au/ata-research/new-report-on-economics-of-gaselectric-appliances.

Renewable Energy SuperpowerReferences
86

Renewable Energy Superpower
87
Appendices

Renewable Energy Superpower
88
Appendices
Appendix A
Energy Superpowers and the energy advantage
This includes geospatial data files of global renewable energy distribution and the assessment of national renewable resource potential and land constraints. Also included are records of global fossil energy resources and historic trade as well as corresponding geospatial data files.
This appendix can be found online at: http://media.bze.org.au/resp/resp_appendix_a.zip
Appendix B
Opportunities for Superpowers in the renewable energy era
This includes projected global energy investment by region from 2013-35. Also included is a characterisation of energy intensive trade exposed industries including: historic international trade, energy use and estimated added value.
This appendix can be found online at: http://media.bze.org.au/resp/resp_appendix_b.zip
Appendix C
Sustainable foundations for Australia’s energy future
This includes details of the Australian renewable energy resource assessment including: classification guidelines and interpretations, geospatial data files of renewable energy resources, production potential, energy infrastructure and classification results.
This appendix can be found online at: http://media.bze.org.au/resp/resp_appendix_c.zip
Appendix D
Australia’s disappearing fossil advantage
This includes data files of Australia’s domestic electricity and gas system performance preceding and following national reforms including: prices, demand, capacity, investment and performance metrics. Also included is Australia’s fossil energy trade balance data including projections factoring varying oil prices and global emission reduction policies.
This appendix can be found online at: http://media.bze.org.au/resp/resp_appendix_d.zip
Appendix E
Maximising the renewable energy advantage
This includes a comparative analysis of energy value factoring primary energy costs and application efficiency. This also includes data on gas distribution network asset value and historic investment.
This appendix can be found online at: http://media.bze.org.au/resp/resp_appendix_e.zip

Renewable Energy Superpower Renewable Energy Superpower

Zero Carbon Australia
Renewable Energy Superpower
Zero Carbon Australia R
enewable Energy Superpow
er
The world is transitioning from the fossil energy era to the renewable energy era
Renewable energy and energy efficiency will attract more investment in the next 2 decades than the development of coal, gas and oil combined
Industry must be prepared to capitalise on the build out of renewable energy, this will be a limited time opportunity
Energy self-sufficiency will increase and the international energy trade will decrease
Nations with abundant high quality renewable resources, available land, skills and industry capacity can be Renewable Energy Superpowers
Australia’s economic renewable energy resource potential is greater than its coal, gas and oil resources combined
Energy intensive industry will migrate to Renewable Energy Superpowers
Australia can recover the competitiveness of its domestic energy by consolidating gas and petroleum use to renewable electricity, future proofing the nation
Renewable energy is Australia’s Superpower