Renewable Energy Futures in the East - Solar Integration...
22
Renewable Energy Futures in the East Josh Novacheck and Greg Brinkman SIW17-135 January 1, 2017
Transcript of Renewable Energy Futures in the East - Solar Integration...

Renewable Energy Futures in the East
Josh Novacheck and Greg Brinkman
SIW17-135
January 1, 2017
NATIONAL RENEWABLE ENERGY LABORATORY 2
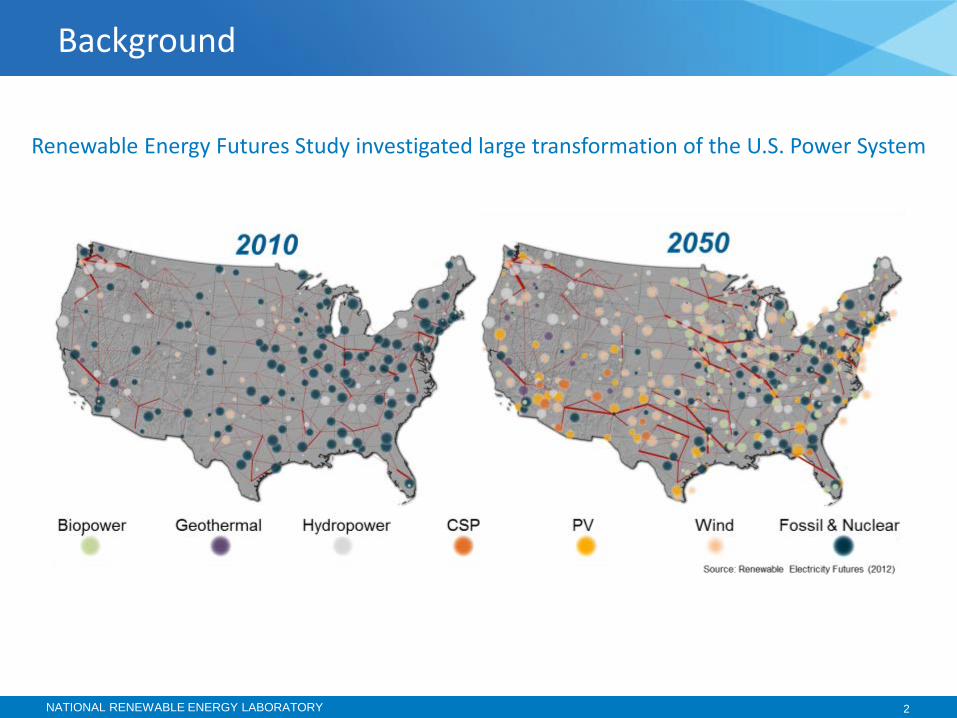
Background
Renewable Energy Futures Study investigated large transformation of the U.S. Power System

NATIONAL RENEWABLE ENERGY LABORATORY 3
Eastern Renewable Generation Integration Study

NATIONAL RENEWABLE ENERGY LABORATORY 4
• Nuclear plants retired • No hurdle rates between
regions in Base scenario • ERGIS Sub-Regions define flow
limits • VG can provide reserves • ERGIS reserve methodology
REFutures in the East: Base Scenario
Onshore Wind (%)
Offshore Wind (%)
Solar PV (%)
Hydro (%)
Total wind + solar + hydro
FRCC 0% 0% 30% 0% 30% ISO-NE 33% 10% 20% 6% 69% MISO 76% 0% 20% 2% 98% NYISO 44% 5% 20% 16% 84% PJM 11% 27% 25% 1% 64% SERC 0% 3% 25% 3% 32% SPP 144% 0% 20% 1% 165%
Total 37% 9% 26% 3% 75%

NATIONAL RENEWABLE ENERGY LABORATORY 5
Scenarios
Base High VG Hurdle Rate Inflexible Baseload
Local Conventional
ERGIS Thermal
and Hydro Assumptions
ERGIS ITx30 Transmission
70% VG Nuclear units
retired Baseload units
(all ERGIS coal units) have coal flexibility
Increase VG by
10% in all regions
Include
$10/MWh charge on imports
~25% of all
Baseload capacity in each region given ERGIS Nuclear flexibility
Always committed at full load when not on an outage
25% of all
regional load must be served by local thermal or hydro resources

NATIONAL RENEWABLE ENERGY LABORATORY 6
REFutures East Implementation – Geographic Decomposition
1. Transmission Flow Forecast
2. Decomposed Unit Commitment
3. Real Time
Model Phase Centralized UC Geographic Decomposition UC
Simplified Day-Ahead
- 10 hours
Day-Ahead 50 hours 1-5 hours/region run in parallel
Real-Time 10 hours 10 hours
Total 60 hours 25 hours
Summary Results

NATIONAL RENEWABLE ENERGY LABORATORY 8
U.S. Eastern Interconnection Generation Annual Results
Scenario VG curtailment
Base 7.3%
High VG 10.2%
Inflexible Baseload
11.4%
Local Conventional
13.7%
Hurdle Rate 8.8%

NATIONAL RENEWABLE ENERGY LABORATORY 9
MISO and SPP large net exporters • Hurdle Rate limits exports to some
degree SERC meets approximately a third of their load through imports
Annual Regional Generation

NATIONAL RENEWABLE ENERGY LABORATORY 10
% Difference from Base Scenario
High VG -7%
Inflexible Baseload 4%
Local Conventional 7%
Hurdle Rate 4%
U.S. Eastern Interconnection Annual Costs
Less flexible scenarios reduce on/off cycling costs, but not enough to reduce benefit from displaced fuel and O&M costs.

System Stress

12
System Stress
• Economic Stress – VG Curtailment
• Operational Stress – Thermal
Headroom – Non-
Synchronous Penetration
– CT Starts and Usage

NATIONAL RENEWABLE ENERGY LABORATORY 13
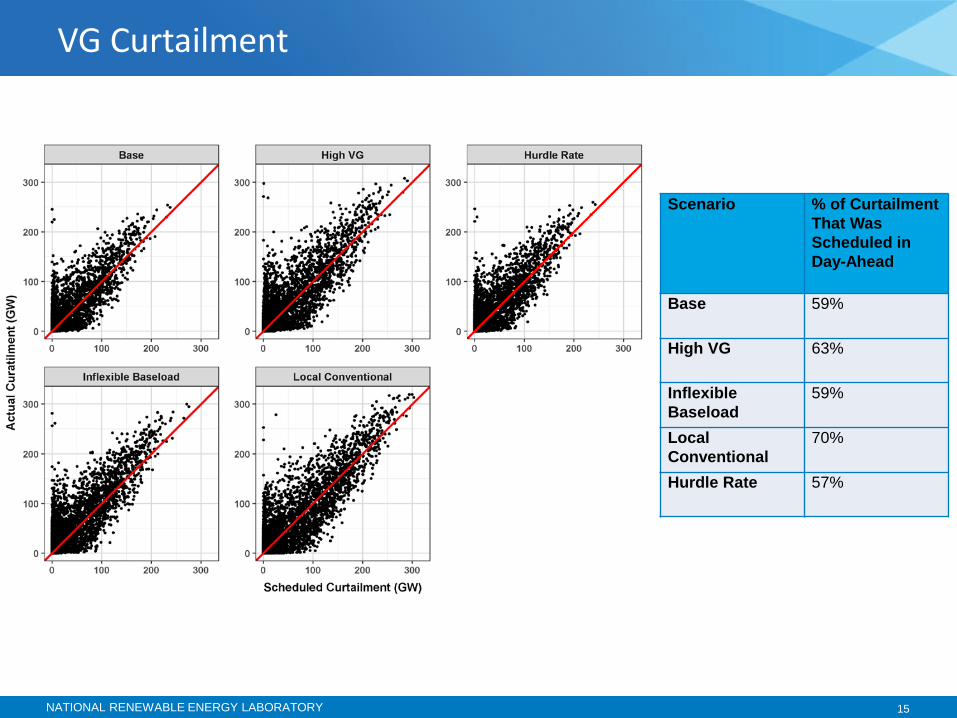
• Curtailment is modest or non-existent for more than half the year
• Hurdle Rate leads to nearly identical “extreme” curtailment as Base
VG Curtailment

NATIONAL RENEWABLE ENERGY LABORATORY 14
• Low curtailment in Summer months suggest value of seasonal energy storage
• High curtailment during peak PV production and low curtailment overnight/evening suggests value daily storage
VG Curtailment
NATIONAL RENEWABLE ENERGY LABORATORY 15
VG Curtailment
Scenario % of Curtailment That Was Scheduled in Day-Ahead
Base 59%
High VG 63%
Inflexible Baseload
59%
Local Conventional
70%
Hurdle Rate 57%

NATIONAL RENEWABLE ENERGY LABORATORY 16
• Headroom considers ability to deal with an increase in net-load
• Undispatched online thermal capacity or curtailed VG can provide headroom
• Scenarios with less flexible operation of thermal fleet do not protect system against low headroom conditions
Headroom

NATIONAL RENEWABLE ENERGY LABORATORY 17
• Total VG generation (post curtailment) relative to the online conventional capacity and VG generation
• Less flexible thermal fleet limits does limit periods of low inertia
• Less coordination between regions leads to higher Non-synchronous penetration in high wind areas
Non-Synchronous Penetration

NATIONAL RENEWABLE ENERGY LABORATORY 18
Quick Start Combustion Turbine Usage

NATIONAL RENEWABLE ENERGY LABORATORY 19
Scheduled Quick Start
Day-Ahead did not well predict the need for quick start generation capacity

Conclusions

NATIONAL RENEWABLE ENERGY LABORATORY 21
• Balancing 70-75% renewables (67% - 72% wind and solar) at 5-min levels in the Eastern Interconnection is possible.
• There was no unserved energy and more than 99.98% of required reserves were procured in the annual grid simulation.
• Curtailment was simulated to range between 7.3% and 10.2% if grid operations are flexible.
• Flexibility challenges led to 9-14% curtailment, making achieving 70% renewables challenging.
• Curtailment and generation from wind and solar resources were somewhat well predicted in the day-ahead simulation
• Peaking generation from natural gas combustion turbines was not well predicted by the day-ahead simulation o 5-minute net-load deviated from average hourly net-load, but much of the deviation is
predictable (i.e. sunrise/sunset)
• More research is needed to understand dynamic stability and voltage issues, and whether additional constraints or technologies may be necessary to operate these scenarios reliably.
Conclusions

www.nrel.gov
NREL is a national laboratory of the U.S. Department of Energy, Office of Energy Efficiency and Renewable Energy, operated by the Alliance for Sustainable Energy, LLC.