Renewable energy, energy efficiency, and eco-friendly ...
16
ORIGINAL ARTICLE Open Access Renewable energy, energy efficiency, and eco-friendly environment (R-E 5 ) in Nigeria Joshua Sunday Riti * and Yang Shu Abstract Background: Renewable energy (RE) has been talked about for more than 30 years while there is an increased use of fossil fuels accompanied by subsequent negative environmental impacts and supply decline. This study explores the linkages between renewable energy and energy efficiency in ensuring an eco-friendly environment in Nigeria. Four independent variables (economic growth, fossil fuel energy consumption, renewable energy consumption, and population) were examined using time series data from 1981 to 2013 with pollution (CO 2 ) emission as an indicator (dependent variable) for environmental degradation. The study also emanates with the view of proffering policies on how the use of renewable energy resulting in energy efficiency instead of the traditional fossil fuel can be used to sustain the environment. Methods: The autoregressive distributed lag (ARDL) bounds testing approach to co-integration and the vector error correction model (VECM)-Granger causality test were applied to estimate both long- and short-run parameters as well as the direction of causation. Results: The results from the analysis confirmed the existence of co-integration among the variables both in long- and short-run paths. The increasing negative impact of renewable energy consumption on environmental degradation validates the renewable energy-environmental quality nexus. The increased pollution emission due to fossil fuel consumption calls for a shift in the energy consumption policy from the traditional fossil fuel to renewable energy. However, an economic growth impact on environmental degradation in the long run invalidates the environmental Kuznets curve (EKC) hypothesis for CO 2 emission in Nigeria. Conclusions: The adoption of renewable and alternate energy resources will support sustainable growth with reduced adverse environmental impacts and ensure an eco-friendly environment in Nigeria. Keywords: Renewable energy, Energy efficiency, Eco-friendly environment, CO 2 emission, EKC Background The demand for energy and its associated services, to meet social and economic development and improve hu- man welfare and health, is on the increase. Every society requires energy services to meet basic human needs (e.g., lighting, cooking, space comfort, mobility, and communication) and to serve productive processes. Since approximately 1850, the global use of fossil fuels (coal, oil, and gas) has increased to dominate the energy supply, leading to a rapid growth in carbon dioxide (CO 2 ) emissions [1]. The world can become increasingly environmentally clean and friendly if countries shift to and promote the use of cleaner energy sources that are renewable. Renewable energy (RE) has been talked about for more than 30 years while fossil fuels have increased in use and declined in supply. While significant gains have been made, we are currently challenged to make the switch to renewable energy in time to avoid sig- nificant environmental and climatic changes. At the recent World Summit on Sustainable Development (WSSD), held in Johannesburg in 2002, energy was one of the most contentious issues. Setting targets for new renewable energy (defined as modern biomass, solar, the wind, and small-scale hydro, geothermal, and marine energy) as well as reducing perverse and * Correspondence: [email protected] School of Economics, Huazhong University of Science and Technology, Wuhan, Hubei 430074, P.R. China © 2016 Riti and Shu. Open Access This article is distributed under the terms of the Creative Commons Attribution 4.0 International License (http://creativecommons.org/licenses/by/4.0/), which permits unrestricted use, distribution, and reproduction in any medium, provided you give appropriate credit to the original author(s) and the source, provide a link to the Creative Commons license, and indicate if changes were made. Riti and Shu Energy, Sustainability and Society (2016) 6:13 DOI 10.1186/s13705-016-0072-1
Transcript of Renewable energy, energy efficiency, and eco-friendly ...
ORIGINAL ARTICLE Open Access
Renewable energy, energy efficiency, andeco-friendly environment (R-E5) in NigeriaJoshua Sunday Riti* and Yang Shu
Abstract
Background: Renewable energy (RE) has been talked about for more than 30 years while there is an increased useof fossil fuels accompanied by subsequent negative environmental impacts and supply decline. This study exploresthe linkages between renewable energy and energy efficiency in ensuring an eco-friendly environment in Nigeria.Four independent variables (economic growth, fossil fuel energy consumption, renewable energy consumption,and population) were examined using time series data from 1981 to 2013 with pollution (CO2) emission as anindicator (dependent variable) for environmental degradation. The study also emanates with the view of profferingpolicies on how the use of renewable energy resulting in energy efficiency instead of the traditional fossil fuel canbe used to sustain the environment.
Methods: The autoregressive distributed lag (ARDL) bounds testing approach to co-integration and the vector errorcorrection model (VECM)-Granger causality test were applied to estimate both long- and short-run parameters aswell as the direction of causation.
Results: The results from the analysis confirmed the existence of co-integration among the variables both inlong- and short-run paths. The increasing negative impact of renewable energy consumption on environmentaldegradation validates the renewable energy-environmental quality nexus. The increased pollution emission due tofossil fuel consumption calls for a shift in the energy consumption policy from the traditional fossil fuel torenewable energy. However, an economic growth impact on environmental degradation in the long run invalidatesthe environmental Kuznets curve (EKC) hypothesis for CO2 emission in Nigeria.
Conclusions: The adoption of renewable and alternate energy resources will support sustainable growth withreduced adverse environmental impacts and ensure an eco-friendly environment in Nigeria.
Keywords: Renewable energy, Energy efficiency, Eco-friendly environment, CO2 emission, EKC
BackgroundThe demand for energy and its associated services, tomeet social and economic development and improve hu-man welfare and health, is on the increase. Every societyrequires energy services to meet basic human needs(e.g., lighting, cooking, space comfort, mobility, andcommunication) and to serve productive processes.Since approximately 1850, the global use of fossil fuels(coal, oil, and gas) has increased to dominate the energysupply, leading to a rapid growth in carbon dioxide(CO2) emissions [1].
The world can become increasingly environmentallyclean and friendly if countries shift to and promotethe use of cleaner energy sources that are renewable.Renewable energy (RE) has been talked about formore than 30 years while fossil fuels have increasedin use and declined in supply. While significant gainshave been made, we are currently challenged to makethe switch to renewable energy in time to avoid sig-nificant environmental and climatic changes. At therecent World Summit on Sustainable Development(WSSD), held in Johannesburg in 2002, energy wasone of the most contentious issues. Setting targets fornew renewable energy (defined as modern biomass,solar, the wind, and small-scale hydro, geothermal,and marine energy) as well as reducing perverse and
* Correspondence: [email protected] of Economics, Huazhong University of Science and Technology,Wuhan, Hubei 430074, P.R. China
© 2016 Riti and Shu. Open Access This article is distributed under the terms of the Creative Commons Attribution 4.0International License (http://creativecommons.org/licenses/by/4.0/), which permits unrestricted use, distribution, andreproduction in any medium, provided you give appropriate credit to the original author(s) and the source, provide a link tothe Creative Commons license, and indicate if changes were made.
Riti and Shu Energy, Sustainability and Society (2016) 6:13 DOI 10.1186/s13705-016-0072-1
harmful energy subsidies were hotly debated. In the end,no target was agreed upon. However, at the final plenarysession more than 30 countries announced their commit-ment to promoting renewable energy sources and settingtheir own goals. As part of this, Germany agreed to hostRenewable—which will focus on a way forward to sub-stantially increase the proportion of new renewable energyin both industrialized and developing countries [2]. At thejust concluded World Climate Summit tagged “COP21,2015” held on 17 December 2015, governments of morethan 190 nations discussed a possible new global agree-ment on climate change towards curbing carbon emis-sions [3]. In the words of Jürgen Trittin, the formerGerman Federal Environment Minister (1998–2005):
I am convinced the development of renewable energiesis a win-win strategy for both industrial and developingcountries. Renewable brings together climate protection,poverty reduction, technology development and thesecuring of jobs- [4].1
Climate change is a phenomenon that has remained athreat to development globally. It has been identified asone of the greatest challenges facing all nations, govern-ments, business, and citizens of the globe and the biggestproblem of the twenty-first century. The threat of climatechange on our green planet “Earth” demands that the re-newable energy share in the total energy generation, andconsumption should be substantially increased as a matterof urgency. Climate change has implications for both hu-man and natural systems and could lead to significantchanges in resource utilization, production, and economicactivities [1]. In response to the impact and possibleeffects of climate change due to the predominance offossil fuel, international, regional, national, and local initia-tives have been developed and implemented to limit andmitigate the future greenhouse gases (GHGs) concentra-tion in the Earth’s atmosphere [5].Numerous examples from history illustrate how the
success of civilization and human welfare is intimatelylinked to climate [6]. Fossil fuel use will affect future cli-mate. Fossil fuels, currently the mainstay of economic-ally developed and developing countries, supply energyeither directly as fuel or indirectly as generated electri-city, for manufacturing, agriculture, transportation, andspace heating. Future GHG emissions and the resultantclimate change will depend largely on the future rates offossil fuel consumption.The Intergovernmental Panel on Climate Change
(IPCC), a body set up in 1988 by the World Meteoro-logical Organization and the United Nations Environ-mental Programme to provide authoritative informationabout the climate change phenomenon, asserts that thewarming of the last 100 years was unusual and unlikely
to be natural in origin [7]. The IPCC has attributed thewarming of at least the second half of the century to anincrease in the emission of greenhouse gases into theatmosphere, largely caused by human activity: CO2 isproduced by the burning of fossil fuels (coals, oil, gas)as well as by land use activities such as deforestation;methane is produced by cattle, rice agriculture, fossilfuel use, and landfills, whereas nitrous oxide is producedby the chemical industry, cattle feedlots and agriculturalsoils. As humans have increased their levels of productionand consumption, greenhouse gas emissions have alsoincreased. Since 1750, at the time of the industrialrevolution, the emission of CO2, methane, and nitrousoxide have increased by 31, 15, and 17 %, respectively.Moreover, the emissions of these gases continue to risesteadily [8].Many complex and interacting factors determine the
consumption rate of fossil fuels. Demand is a result ofpopulation growth rate, availability of fossil fuel, energyefficiency, conservation measures and use of non-fossilenergy sources, general industrial productivity, energypolicy, and future climate [9]. All these factors will affectthe fossil fuel utilization rates and the future climate.Nigeria is one of the highest emitters of greenhouse
gases in Africa [10]. The practice of flaring gas by the oilcompanies operating in Nigeria has been a major meansthrough which greenhouse gases are released into the at-mosphere. Carbon dioxide emissions in this area areamong the highest in the world [11]. Some 45.8 billionjoules of heat are discharged into the atmosphere of theNiger Delta from flaring 1.8 billion ft3 of gas every day[6]. Gas flaring has raised temperatures and renderedlarge areas uninhabitable. Between 1970 and 1986, atotal of about 125.5 million m3 of gas was produced inthe Niger Delta region, about 102.3 million m3 (81.7 %)were flared, while only 2.6 million m3 were used as fuelby oil-producing companies and about 14.6 million m3
were sold to other consumers [12, 13]. The use of renew-able energy sources will reduce the over dependence onthe burning of fossil fuel. Moreover, instead of flaring gasin Nigeria, the gases can be converted to methanol andused as a fuel for both domestic and industrial use. Withgood energy efficiency practices and products, the burningof fossil fuel for energy will be greatly minimized.Though some researches on the use of renewable en-
ergy to mitigate climate change have been carried out,such researches failed to empirically identify the bestcombination of energy needed to mitigate or ensure aneco-friendly environment in Nigeria. Against this back-drop, the study intends to close this gap by identifyingthe combination of energy consumption that reduces theemission of GHGs capable of ensuring an eco-friendlyenvironment for sustainable development in Nigeria.The two questions underpinning this study are as follows:
Riti and Shu Energy, Sustainability and Society (2016) 6:13 Page 2 of 16
1. Does renewable energy consumption mitigateclimate change and promote an eco-friendlyenvironment in Nigeria?
2. Can economic growth improve the environmentalquality in the long run?
The objective of the study, therefore, revolves aroundthe following:
1. To investigate the potentials of renewable energyconsumption to mitigate climate change andpromote an eco-friendly environment in Nigeria and
2. To assess the probability of economic growth inimproving environmental quality in the long run.
An auto-regression distributed lag (ARDL) model ana-lysis is used to estimate the environmental impact of bothfossil fuel and non-fossil fuel consumption with the aim ofexamining the contribution of renewable and green energyin ensuring an eco-friendly environment in Nigeria.
Theoretical issuesClimate change scenario in NigeriaGHGs are gaseous constituents of the atmosphere, bothnatural and anthropogenic, that absorb and emit radia-tions at specific wavelengths within the spectrum ofthermal infrared radiation emitted by the Earth’s surface,the atmosphere itself, and by the clouds. The primarygreenhouse gases are water vapor (H2O), carbon dioxide(CO2), nitrous oxide (N2O), methane (CH4), and ozone(O3) [9]. Although carbon dioxide is the most abundantof the greenhouse gases, methane and nitrous oxide havemore global warming potential than carbon dioxide.Carbon dioxide emission should be strictly under con-trol in Nigeria. Even though the emission level in Nigeriais not so significant, the impact of such GHGs emittedin one location may be felt in a completely different loca-tion. Major areas of greenhouse gas emissions include theburning of fossil fuels in cars as well as in industrial pro-cesses and deforestation leading to a high concentrationof carbon dioxide in the atmosphere. In Nigeria, the mostimportant sources of greenhouse gases include electricitygenerators, motor vehicles, waste dumps, burning of fuelwood and coal, agricultural activities, land use changesand deforestations, gas flaring, and bush burning in gen-eral [10]. In addition to the CO2 emission, these processesemit methane, sulfur dioxide, and nitrous gases.
Nigeria’s energy sceneThe energy consumption mix in Nigeria is dominated byfuelwood (50.45 %), petroleum products (41.28 %), andhydroelectricity (8 %). Coal, nuclear, geothermal, tidal,the wind, and solar energy are currently not part ofNigeria’s energy mix, as they have either been neglected,
not discovered, or are currently at their early stage of de-velopment [14]. The energy utilization sector in Nigeriacan be grouped into industry, transport, commercial,household, and agricultural sectors. Fuelwood is used byover 60 % of people living in the rural areas and 80 % ofNigerians as an energy source. Nigeria consumes over50 million metric tons of fuel wood annually, which is amajor cause of desertification and erosion in the coun-try. The rural areas are generally inaccessible due to theabsence of good road networks, even with the ongoingpower reform and privatization of the electricity indus-try; it is obvious that for logistic and economic reasons,rural areas which are remote from the grid and/or havelow power purchase potential will not be attractive to pri-vate power investors. Meanwhile, electricity is required forbasic developmental services as well as economic growth.The absence of reliable energy supply has left the ruralpopulace socially backward and their economic potentialsuntapped [14].The transport sector is a consumer of oil accounting for
60 % of the total consumption. Despite the vast oil and gasreserves, a small amount is used in Nigeria. The countryimports more than 70 % of domestic fuel requirements be-cause none of the four refineries have functioned effi-ciently. The high oil import bill exposes Nigeria’s energysector to the external energy price shocks. Nigeria has theninth largest natural gas reserve in the world and exportslarge quantities of liquefied natural gas (LNG) to othercountries, but her gas-dominated electricity grid still expe-riences frequent collapses due to inadequate gas supplyand obsolete infrastructures. Nigeria flares 75 % of its nat-ural gas for lack of processing facilities and that amountsto 12.5 % of all globally flared gas [10].For Nigeria to meet up with its energy needs, it must
look for alternative energy sources especially for therural populace. While it is recognized that renewableenergy cannot solve all of Nigeria’s energy problems,renewable energy technology is still seen as having asignificant unexploited potential to enable the countries tomeet their growing energy requirements. If renewableenergy is properly harnessed, it could meet a significantproportion of energy demand with less deterioratingeffects on the environment.
Renewable energy potentials in NigeriaHydro energy The country is reasonably endowed withlarge rivers and some few natural falls. Small rivers andstreams also exist within the present split of the countryinto 11 River Basin Authorities, some of which maintainminimum discharges all year round. Hydropower cur-rently accounts for about 29 % of the total electricalpower supply. In a study carried out in 1990 in 12 statesand 4 river basins, over 278 unexploited small hydro-power (SHP) sites with total potentials of 734.3 MW
Riti and Shu Energy, Sustainability and Society (2016) 6:13 Page 3 of 16
were identified [15]. However, SHP potential sites existin virtually all parts of Nigeria with an estimated totalcapacity of 3500 MW. They indicate that Nigeria pos-sesses the potential renewable source of energy alongher numerous river systems, a total of 70 micro-dams,126 mini dams, and 86 small sites have been identified.A private company, the Nigerian Electricity SupplyCompany (NESCO), and the government have installedeight SHP stations with an aggregate capacity of 37.0 MWin Nigeria. Most of these stations are found around Jos atKwall and Kurra Falls. The total technically exploitablehydropower potential based on the country’s river systemis conservatively estimated to be about 11,000 MW ofwhich only 19 % is currently being tapped or developed[16]. These rivers, waterfalls, and streams with highpotentials for hydropower, if properly harnessed, willlead to decentralized use and provide the most affordableand accessible option to off-grid electricity services,especially to the rural communities.
Solar energy Nigeria lies within a high sunshine beltand thus has enormous solar energy potentials. Solarradiation is fairly well distributed with an averagesolar radiation of about 19.8 MJm−2 day−1 and averagesunshine hours of 6 h per day. If solar collectors or mod-ules were used to cover 1 % of Nigeria’s land area, it ispossible to generate 1850 × 103 GWh of solar electricityper year, which is over 100 times the current grid electri-city consumption level in the country [17].Several pilot projects, surveys, and studies have been
undertaken by the Sokoto Energy Research Center(SERC) and the National Center for Energy Researchand Development (NCERD) under the supervision ofthe Energy Commission of Nigeria (ECN). SeveralPV-water pumping, electrification, and solar-thermalinstallations have been put in place. Such solar thermalapplications include solar cooking, solar crop drying, solarincubators, and solar chick brooding. Other areas of appli-cation of solar electricity include low- and medium-powerapplications such as water pumping, village electrification,rural clinic and power supply for schools, vaccine refriger-ation, traffic lighting, and lighting of road signs.
Wind energy Wind energy is available at annual averagespeeds of about 2.0 m/s at the coastal region and 4.0 m/sat the far northern region of the country. With an air dens-ity of 1.1 kg/m3, the wind energy intensity perpendicular tothe wind direction ranges between 4.4 W/m2 at the coastalareas and 35.2 W/m2 at the far northern region [18].At present, the share of wind energy in the national
energy consumption has remained on the lower endwith no commercial wind power plants connected to thenational grid. Only a few number of stand-alone windpower plants were installed in the early 1960s in five
northern states mainly to power water pumps and a 5-kW wind electricity conversion system for village electri-fication installed at Sayyan Gidan Gada, in Sokoto State[17]. In recent times, numerous studies have been car-ried out to assess the wind speed characteristics and theassociated wind energy potentials in different locationsin Nigeria. Promising attempts are being made in theSokoto Energy Research Centre (SERC) and AbubakarTafawa Balewa University, Bauchi, to provide the cap-ability for the development of wind energy technologies.
Biomass The biomass resources of Nigeria can be iden-tified as crops, forage grasses and shrubs, animal wastes,and wastes arising from forestry, agriculture, municipal,and industrial activities, as well as aquatic biomass.Crops such as sweet sorghum, maize, and sugarcanewere the most promising feedstocks for biofuel produc-tion [19]. Plant biomass can be utilized as a fuel forsmall-scale industries. It could also be fermented by an-aerobic bacteria to produce a cheap fuel gas (biogases).Biogas production from agricultural residues, industrial,and municipal waste does not compete for land, water,and fertilizers with food crops as is the case with bio-ethanol and biodiesel production and will thus reducethe menaces posed by these wastes. In Nigeria, the feed-stock substrates suitable for an economically feasiblebiogas production include water lettuce, water hyacinth,dung, cassava leaves, and processing waste, urban refuse,solid (including industrial) waste, agricultural residues,and sewage [20]. It has been estimated that Nigeria pro-duces about 227,500 tons of fresh animal waste daily.Since 1 kg of fresh animal waste allows to produce about0.03 m3 biogas, Nigeria can potentially produce about6.8 million m3 of biogas every day from animal wasteonly [20]. Although the biogas technology is not commonin Nigeria, various research works on the technology andpolicy aspects of biogas production have been carried outby various scientists in the country. Some significant re-searches have been done on a reactor design that wouldlead to process optimization in the development of anaer-obic digesters [20]. Sawdust and wood wastes are otherimportant biomass resources associated with the lumberindustry. Small particle biomass stoves already exist forburning sawdust and wood shaving. Biomass utilization asan energy resource is currently limited to the thermal ap-plication as fuels for cooking and crop drying.
Role of renewable energy in ensuring eco-friendly environmentRenewable energy is clean, inexhaustible, unlimited, andrapidly replenished naturally. Renewable energy sourceshave brought about the need for technology innovationas a means of addressing climate change challenges, i.e.,by reducing the rate and volume of GHG concentrationsin the atmosphere and saving the ozone layer from
Riti and Shu Energy, Sustainability and Society (2016) 6:13 Page 4 of 16
ongoing depletion. The use of renewable energy sourceswill also significantly reduce the over-dependency on theburning of fossil fuel. Moreover, instead of flaring gas inNigeria, the gases can be converted to methanol andused as a fuel for both domestic and industrial applica-tions. When using the best practices and products withregards to energy efficiency, the burning of fossil fuelsfor energy generation will be greatly minimized. Nigeriahas an abundance of renewable energy resources to beharnessed. Given the abundant availability of sun forsolar energy generation in Nigeria and if the needed pol-itical will to tap these resources into place, the countrywill definitely surmount the challenges of climate changeand global warming. The sun, with an estimated diam-eter of 1.4 million km and at a black body temperatureof 6000 K, produces about 4.506 × 10²⁰ MW of power.About 2.055 × 10¹¹ MW of this power gets to the Earth’ssurface and which translates into a solar intensity ofabout 1.58 kW/m2 on the Earth’s surface. If 1 % of theNigerian landmass of 794,000 is used to collect solarpower at an efficiency of 5 %, the available power will beapproximately 627,260 MW [21].The ECN has significantly done well in this regard. Be-
tween 1999 and 2009, several installations of solar PVsystems have been executed in the country. In 2008 and2009 alone, the Commission installed over 300 kWp and1.01 MW, respectively, of solar PV power systems allover the country. The installations were mainly for waterpumping, streetlight applications, and powering of of-fices. The current estimate of solar PV installations inthe country is put at 6 MW of power [21]. Wind energyis also important in mitigating climate change. About2.5 % of solar energy captured by the atmosphere is beingconverted into wind. The development of wind powerplants is being undertaken by many countries includingNigeria, for the generation of electricity in their quest toexploit renewable energy sources. With wind energy avail-able at an annual average speed of 4.0 m/s at the coastalborders and northern regions, the country possesses enor-mous potential to develop and utilize energy from thewind for electricity generation. The coastal regions of thesouth and the northern part of the country are possiblesuitable sites for wind energy exploitation.
Clean energy technology and sustainabilityEnergy efficiency and renewable energy technologies areprominent in most sustainable development programs,for example, the Agenda 21 [22]. According to theIPCC’s second assessment report, the stabilization of at-mospheric greenhouse gas concentrations at levels thatwill prevent serious interference with the climate systemcan only be achieved by dramatically increasing the im-plementation of renewable energy. In one IPCC sce-nario, in which greenhouse gases are stabilized by the
year 2050, the share of renewable energy in the globalenergy balance must increase tenfold from the currentlevel. In developing countries, the required increase is,even more, dramatic and was estimated to be a 20-foldbetween 1990 and 2050. Further improvements in energyefficiency and energy conservation can reduce emissionsin the shorter term, thus “buying time” for the requiredchanges in energy production [23].
MethodsIn this section, an appropriate econometric model,which theoretically established the relationship be-tween variables of interest, are specified and used topractically demonstrate energy use and environmentalquality in Nigeria. According to the World Bank, fourdrivers that constitute the basis for emission scenariosare as follows:
1. Population growth. More people, more energy use,2. Energy choices. The choice of energy we consume
determines the emission of CO2. Whether we willbe building more coal or more solar, wind, andrenewable energy.
3. The third factor is the economic growth. The fastereconomies grow, the more energy they will need,and the more fossil fuels they are likely to consume.
4. And the fourth factor is technological innovation; somepeople think that technological innovation will save usby, for example, allowing us to pull CO2 from the airor, in a less dramatic way, removing through scrubbers,from power plants and pumping it under the Earth. Inany case, it is these four drivers that together constitutethe basis for emission scenarios [24].
In line with the theoretical considerations, we specifiedthe models as follows:
CO2t ¼ f FUEt ;GDPt ;RENt ; POPtð ÞU ; ð1Þ
where
CO2t = carbon dioxide emissionRENt = renewable energy consumptionFUEt = fossil fuel consumptionGDPt = gross domestic product proxy for economicgrowthPOPt = population.
μ is the error term of Eq. 1.
In a more explicit form, the model can be written in alog-linear form to transform the variables into the sameunit and base. Thus,
Riti and Shu Energy, Sustainability and Society (2016) 6:13 Page 5 of 16
InCO2t ¼ β0 þ β1InFUt þ β2InGDPtþ β3InRENt þ β4InPOPt ; ð2Þ
where β1, β2, and β4 > 0 and β3 < 0.
The bound test approach to co-integration which isbased on the ARDL procedure proposed by Pesaran etal. [25] is used in the study to examine the relationshipbetween fossil fuel consumption, renewable energy con-sumption, carbon emissions, population, and gross do-mestic output in Nigeria. The study covers the periodsfrom 1981 to 2012 by relying on annual time series datafor Nigeria, which are mainly taken from the WorldBank country data base (2014), the Carbon Dioxide In-formation Analysis Center, USA, and the Central Bankof Nigeria Statistical Bulletin 2014. The variables usedare renewable energy consumption (RENt) and fossil fuel
consumption (FUEt) as components of disaggregated en-ergy use. The fossil fuel is made of coal, oil, petroleum,and natural gas. Others are real gross domestic product[(GDPt) proxy for economic growth] and total carbondioxide emissions [(CO2t)] measured in million metrictons. All data are converted into natural logarithm.E-views 8.0 and Stata 12.0 econometrics softwarewere used for the analysis.
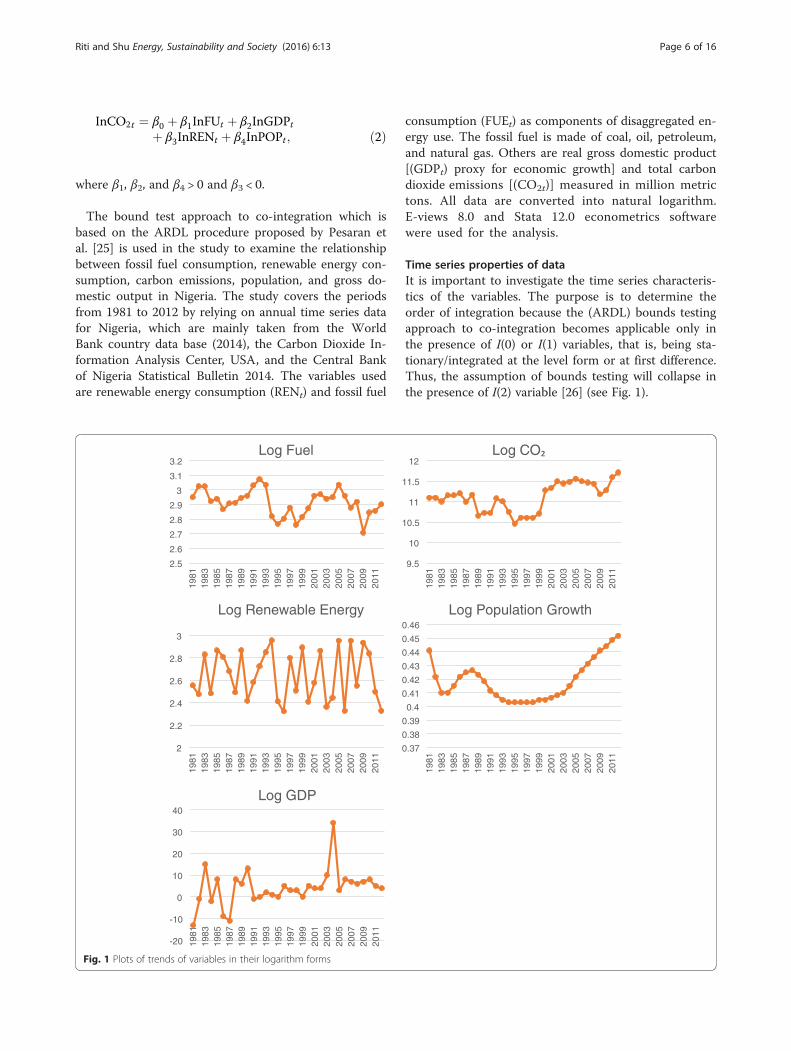
Time series properties of dataIt is important to investigate the time series characteris-tics of the variables. The purpose is to determine theorder of integration because the (ARDL) bounds testingapproach to co-integration becomes applicable only inthe presence of I(0) or I(1) variables, that is, being sta-tionary/integrated at the level form or at first difference.Thus, the assumption of bounds testing will collapse inthe presence of I(2) variable [26] (see Fig. 1).
2.5
2.6
2.7
2.8
2.9
3
3.1
3.2
1981
1983
1985
1987
1989
1991
1993
1995
1997
1999
2001
2003
2005
2007
2009
2011
Log Fuel
9.5
10
10.5
11
11.5
12
1981
1983
1985
1987
1989
1991
1993
1995
1997
1999
2001
2003
2005
2007
2009
2011
2
2.2
2.4
2.6
2.8
3
1981
1983
1985
1987
1989
1991
1993
1995
1997
1999
2001
2003
2005
2007
2009
2011
Log Renewable Energy
0.37
0.38
0.39
0.4
0.41
0.42
0.43
0.44
0.45
0.46
1981
1983
1985
1987
1989
1991
1993
1995
1997
1999
2001
2003
2005
2007
2009
2011
Log Population Growth
-20
-10
0
10
20
30
40
1981
1983
1985
1987
1989
1991
1993
1995
1997
1999
2001
2003
2005
2007
2009
2011
Log GDP
Fig. 1 Plots of trends of variables in their logarithm forms
Riti and Shu Energy, Sustainability and Society (2016) 6:13 Page 6 of 16
Figure 1 shows the trend of variables in their loga-rithm form from 1981 to 2012. The vertical axes indicatethe variables measured in different units but convertedto logarithm forms to bring them to the same base orunit. The trends of the variables include CO2 emission,fossil fuel consumption as a percentage of total energyconsumption, GDP growth, population growth, and re-newable energy consumption as a percentage of total en-ergy consumption. The graphs exhibit trends andstructural breaks. CO2 structural break occurred in 1995and showed an upward trend, while fossil fuel structuralbreaks occurred in 1986, 1991, and 2008. The popula-tion growth, however, displayed a trend while the GDPstructural break occurred in 2004. And last but not least,renewable energy alternated up and down.We conducted unit root tests using the variables in-
cluded in the regression by employing both the Aug-mented Dickey-Fuller (ADF), the Phillips-Peron (PP), andthe Kwiatkowski-Phillips-Schmidt-Shin (KPSS) tests at 1,5, and 10 % levels of significance. The null hypothesis isthat unit root problem exists, that is, β1 = β2 = β3 = β4 = 1against the alternative hypothesis that there exists no unitroot problem, that is, β1 ≠ β2 ≠ β3 ≠ β4 ≠ < 1.
Bounds testing approach to co-integrationAs pointed out by the authors of [27], the bounds testingapproach to co-integration is preferred to other conven-tional co-integration tests because it has several import-ant advantages over other conventional tests. Theapproach effectively corrects for a possible endogeneityof explanatory variables. Another important advantageof the ARDL approach is that one can avoid the uncer-tainties created by unit root pre-testing as the test canbe applied regardless of whether the series is I(0) or I(1).An added bonus of this approach is that unlike otherconventional tests for co-integration, it can be applied tostudies that have a small sample size [27]. In addition,both the short- and the long-run relationship can besimultaneously estimated. In this paper, the ARDL ap-proach to co-integration is estimated using the followingunrestricted error correction (UREC) regressions.
Δ lnFUEt ¼ α2 þXp
i¼0
β2iΔ lnCO2 t− iþXp
i¼1
κ2iΔ lnFUEt−i
þXp
i¼0
ϖ2iΔ lnRENt−i þXp
i¼0
φ2iΔ lnGDPt−i
þXp
i¼0
γ2iΔ lnPOPt−i þ η1CΔ lnCO2 t−1
þ η2CΔ lnFUEt−1 þ η3CΔ lnRENt−1
þ η4CΔ lnGDPt−1 þ η5CΔ lnPOPt−1 þ μ2
ð4Þ
Δ lnRENt ¼ α3 þXp
i¼0
β3iΔ lnCO2 t− i þXp
i¼1
κ3iΔ lnFUEt−i
þXp
i¼0
ϖ3iΔ lnRENt−i þXp
i¼0
φ3iΔ lnGDPt−i
þXp
i¼0
γ3iΔ lnPOPt−i þ η1VΔ lnCO2 t−1
þ η2VΔ lnFUEt−1 þ η3VΔ lnRENt−1
þ η4VΔ lnGDPt−1 þ η5VΔ lnPOPt−1 þ μ3
ð5Þ
Δ lnGDPt ¼ α4 þXp
i¼0
β4iΔ lnCO2 t− iþXp
i¼0
κ4iΔ lnFUEt−i
þXp
i¼0
ϖ4iΔ lnRENt−i þXp
i¼1
φ4iΔ lnGDPt−i
þXp
i¼0
γ4iΔ lnPOPt−i þ η1RΔ lnCO2 t−1
þ η2RΔ lnFUEt−1 þ η3RΔ lnRENt−1
þ η4RΔ lnGDPt−1 þ η5RΔ lnPOPt−1 þ μ4
ð6Þ
Δ lnPOPt ¼ α5 þXp
i¼0
β5iΔ lnCO2 t− i þXp
i¼0
κ5iΔ lnFUEt−i
þXp
i¼0
ϖ5iΔ lnRENt−i þXp
i¼1
φ5iΔ lnGDPt−i
þXp
i¼0
γ5iΔ lnPOPt−i þ η1SΔ lnCO2 t−1
þ η2SΔ lnFUEt−1 þ η3SΔ lnRENt−1
þ η4SΔ lnGDPt−1 þ η5SΔ lnPOPt−1 þ μ5
ð7ÞHere, Δ is the first difference operator, In denotes
the natural logarithm, and p is the lag order selectedby Akaike’s information criterion (AIC). The parame-ters β, κ, ω, φ, and γ are the short-run dynamic coef-ficients while the parameters η1 to η5 function as thelong-run multipliers of the underlying ARDL model.The residuals μi are assumed to be normally distributedand white noise.
Δ lnCO2t ¼ α1 þXp
i¼1
β1iΔ lnCO2 t− i þXp
i¼0
κ1iΔ lnFUEt−i
þXp
i¼0
ϖ1iΔ lnRENt−i þXp
i¼0
φ1iΔ lnGDPt−i
þXp
i¼0
γ1iΔ lnPOPt−i þ η1YΔ lnCO2 t−1
þ η2YΔ lnFUEt−1 þ η3YΔ lnRENt−1
þ η4YΔ lnGDPt−1 þ η5YΔ lnPOPt−1 þ μ1
ð3Þ
Riti and Shu Energy, Sustainability and Society (2016) 6:13 Page 7 of 16
In Eq. 3, the tests for co-integration are carried out byexamining the joint significance of the lagged levels ofthe variables using the F-test where the null of no co-integration is defined by the following:H0: η1Y = η2Y = η3Y = η4Y = η5Y = 0 against the alterna-
tive that H1: η1Y ≠ 0, η2Y ≠ 0, η3Y ≠ 0, η4Y ≠ η5Y = 0.Other tests for co-integration in Eqs. 4–7 can also becarried out using similar procedures. The asymptoticdistribution of the F-statistic is non-standard under thenull, and it was originally derived and tabulated by [25],but later modified by [26]. Two sets of critical values areprovided: one, which is appropriate when all the seriesare I(0) and the other for all the series that are I(1).According to [27], in testing for co-integration, if the
computed F-statistic falls above the upper criticalbounds, a conclusive inference can be made regardingco-integration without the need to know whether theseries were I(0) or I(1). In this case, the null of no co-integration is rejected regardless of whether the series isI(0) or I(1). Alternatively, when the test statistic fallsbelow the lower critical value, the null hypothesis is notrejected regardless of whether the series is I(0) orI(1). In contrast, if the computed test statistic falls in-side the lower and the upper bounds, a conclusive in-ference cannot be made unless we know whether theseries was I(0) or I(1). To ascertain the goodness offit of the ARDL model, the stability test is conductedby employing the cumulative sum of recursive resid-uals (CUSUM) and the cumulative sum of squares ofrecursive residuals (CUSUMsq).
Granger causality testAccording to the concept of Granger causality, “X causesY” if and only if the past values of X help to predict thechanges of Y, while “Y causes X” if and only if the pastvalues of Y help to predict the changes of X. The vectorauto-regression (VAR) model is likely to be used forthis purpose. However, Granger [28] noted that if aset of variables is co-integrated, there must be ashort- and long-run causality which cannot be cap-tured by the standard first difference VAR model. Inthis case, we must implement the Granger causalitytest with the vector error correction model (VECM)framework as follows:
Δ lnCO2t ¼ a1 þXp
i¼1
βiΔ lnCO2 t− i þXp
i¼1
κiΔ lnFUEt−i
þXp
i¼1
ϖ iΔ lnRENt−i þXp
i¼1
φiΔ lnGDPt−i
þXp
i¼1
γ iΔ lnPOPt−i þ δ1ECMt−1 þ v1t
ð8Þ
Δ lnFUEt ¼ a1 þXp
i¼1
κiΔ lnFUEt−i þXp
i¼1
βiΔ lnCO2 t− i
þXp
i¼1
ϖ iΔ lnRENt−i þXp
i¼1
φiΔ lnGDPt−i
þXp
i¼1
γ iΔ lnPOPt−i þ δ2ECMt−1 þ v2t
ð9Þ
Δ lnRENt ¼ a1 þXp
i¼1
ϖ iΔ lnRENt−i þXp
i¼1
βiΔ lnCO2 t− i
þXp
i¼1
κiΔ lnFUEt−i þXp
i¼1
φiΔ lnGDPt−i
þXp
i¼1
γ iΔ lnPOPt−i þ δ3ECMt−1 þ v3t
ð10Þ
Δ lnGDPt ¼ a1 þXp
i¼1
φiΔ lnGDPt−i þXp
i¼1
βiΔ lnCO2 t− i
þXp
i¼1
κiΔ lnFUEt−i þXp
i¼1
ϖ iΔ lnRENt−i
þXp
i¼1
γ iΔ lnPOPt−i þ δ4ECMt−1 þ v4t
ð11Þ
Δ lnPOPt ¼ a1 þXp
i¼1
γ iΔ lnPOPt−i þXp
i¼1
βiΔ lnCO2 t− i
þXp
i¼1
κiΔ lnFUEt−i þXp
i¼1
ϖ iΔ lnRENt−i
þXp
i¼1
φiΔ lnGDPt−i þ δ5ECMt−1 þ v5t;
ð12Þ
where Δ is the first difference operator and ln is the nat-ural logarithm. The residuals υit are assumed to be nor-mally distributed, and white noise is the one-period laggederror correction term derived from the co-integrationequation. The ECMt − 1 variable will be excluded from thatmodel if the variables are not co-integrated. The optimallag length p is determined by the AIC because of its super-ior performance in small sample [29]. Next, we apply thelikelihood ratio (LR) statistics to ascertain the direction ofGranger causality between the variables of interest. In thisstudy, we test the following hypotheses2:
H0 : κ1 = κ2 =… = κp = 0, implying that FUEt does notGranger-cause CO2t,H0 :ϖ1 =ϖ2 =… =ϖp = 0, implying that RENt does notGranger-cause CO2t,
Riti and Shu Energy, Sustainability and Society (2016) 6:13 Page 8 of 16
H0 : ϕ1 = ϕ2 =… = ϕp = 0, implying that GDPt does notGranger-cause CO2t,H0 : γ1 = γ2 =… = γp = 0, implying that POPt does notGranger-cause CO2t
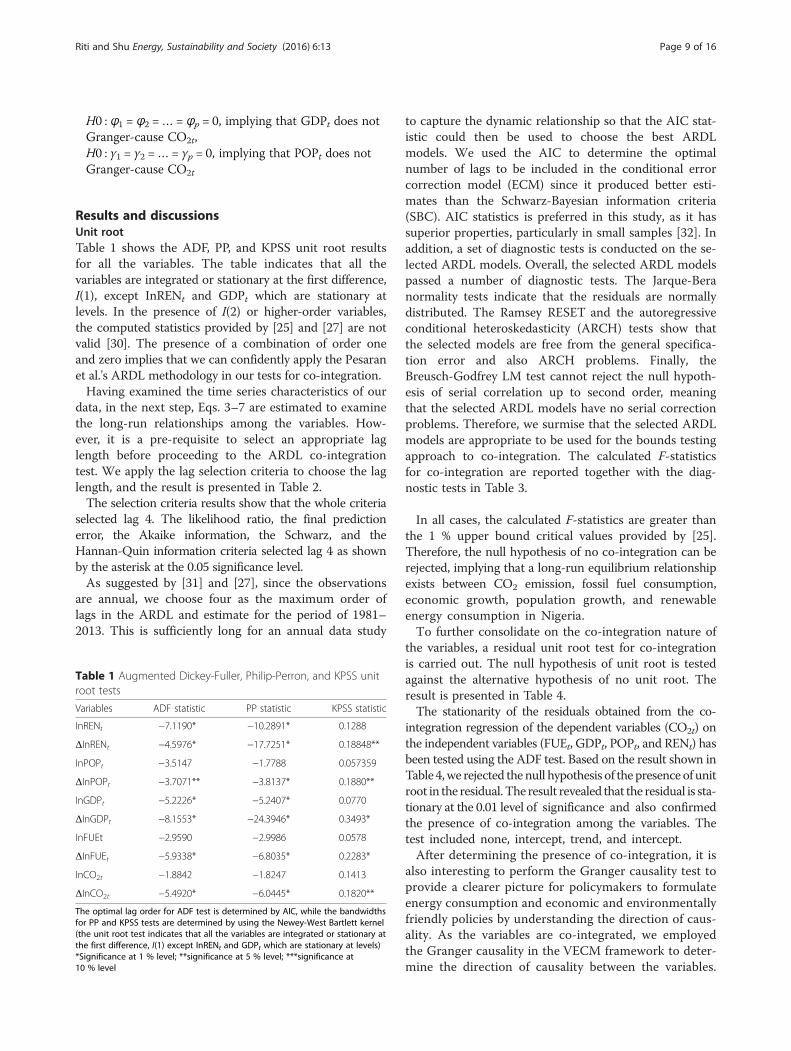
Results and discussionsUnit rootTable 1 shows the ADF, PP, and KPSS unit root resultsfor all the variables. The table indicates that all thevariables are integrated or stationary at the first difference,I(1), except InRENt and GDPt which are stationary atlevels. In the presence of I(2) or higher-order variables,the computed statistics provided by [25] and [27] are notvalid [30]. The presence of a combination of order oneand zero implies that we can confidently apply the Pesaranet al.'s ARDL methodology in our tests for co-integration.Having examined the time series characteristics of our
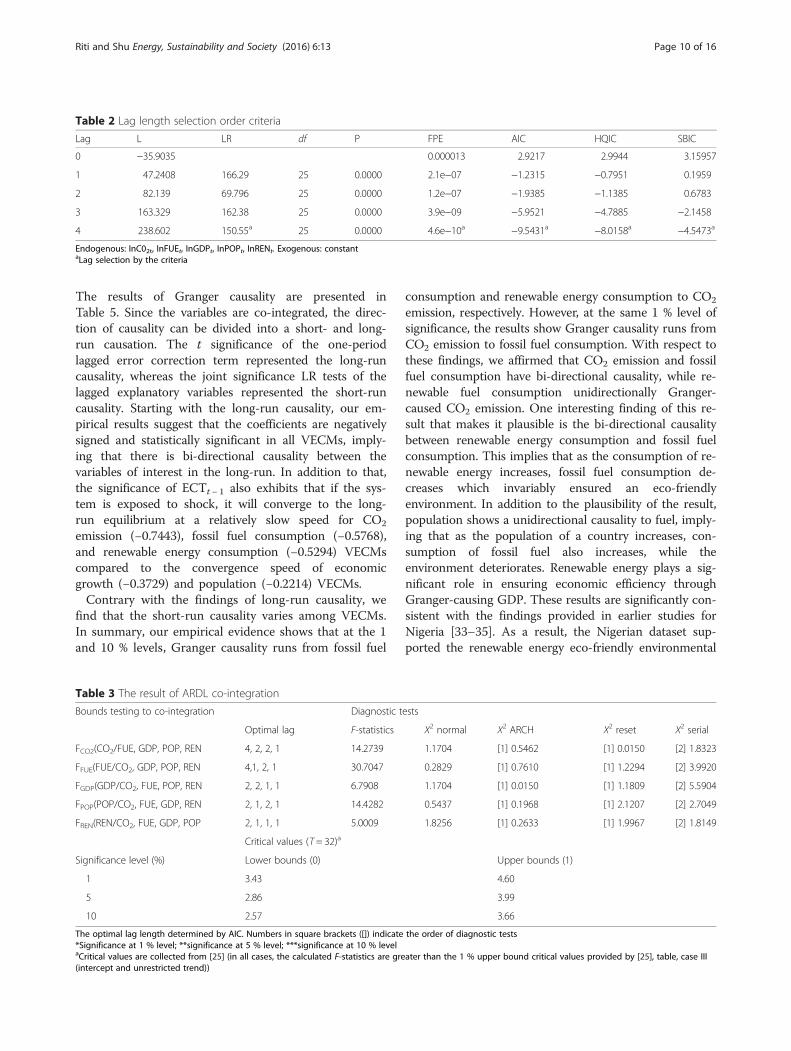
data, in the next step, Eqs. 3–7 are estimated to examinethe long-run relationships among the variables. How-ever, it is a pre-requisite to select an appropriate laglength before proceeding to the ARDL co-integrationtest. We apply the lag selection criteria to choose the laglength, and the result is presented in Table 2.The selection criteria results show that the whole criteria
selected lag 4. The likelihood ratio, the final predictionerror, the Akaike information, the Schwarz, and theHannan-Quin information criteria selected lag 4 as shownby the asterisk at the 0.05 significance level.As suggested by [31] and [27], since the observations
are annual, we choose four as the maximum order oflags in the ARDL and estimate for the period of 1981–2013. This is sufficiently long for an annual data study
to capture the dynamic relationship so that the AIC stat-istic could then be used to choose the best ARDLmodels. We used the AIC to determine the optimalnumber of lags to be included in the conditional errorcorrection model (ECM) since it produced better esti-mates than the Schwarz-Bayesian information criteria(SBC). AIC statistics is preferred in this study, as it hassuperior properties, particularly in small samples [32]. Inaddition, a set of diagnostic tests is conducted on the se-lected ARDL models. Overall, the selected ARDL modelspassed a number of diagnostic tests. The Jarque-Beranormality tests indicate that the residuals are normallydistributed. The Ramsey RESET and the autoregressiveconditional heteroskedasticity (ARCH) tests show thatthe selected models are free from the general specifica-tion error and also ARCH problems. Finally, theBreusch-Godfrey LM test cannot reject the null hypoth-esis of serial correlation up to second order, meaningthat the selected ARDL models have no serial correctionproblems. Therefore, we surmise that the selected ARDLmodels are appropriate to be used for the bounds testingapproach to co-integration. The calculated F-statisticsfor co-integration are reported together with the diag-nostic tests in Table 3.
In all cases, the calculated F-statistics are greater thanthe 1 % upper bound critical values provided by [25].Therefore, the null hypothesis of no co-integration can berejected, implying that a long-run equilibrium relationshipexists between CO2 emission, fossil fuel consumption,economic growth, population growth, and renewableenergy consumption in Nigeria.To further consolidate on the co-integration nature of
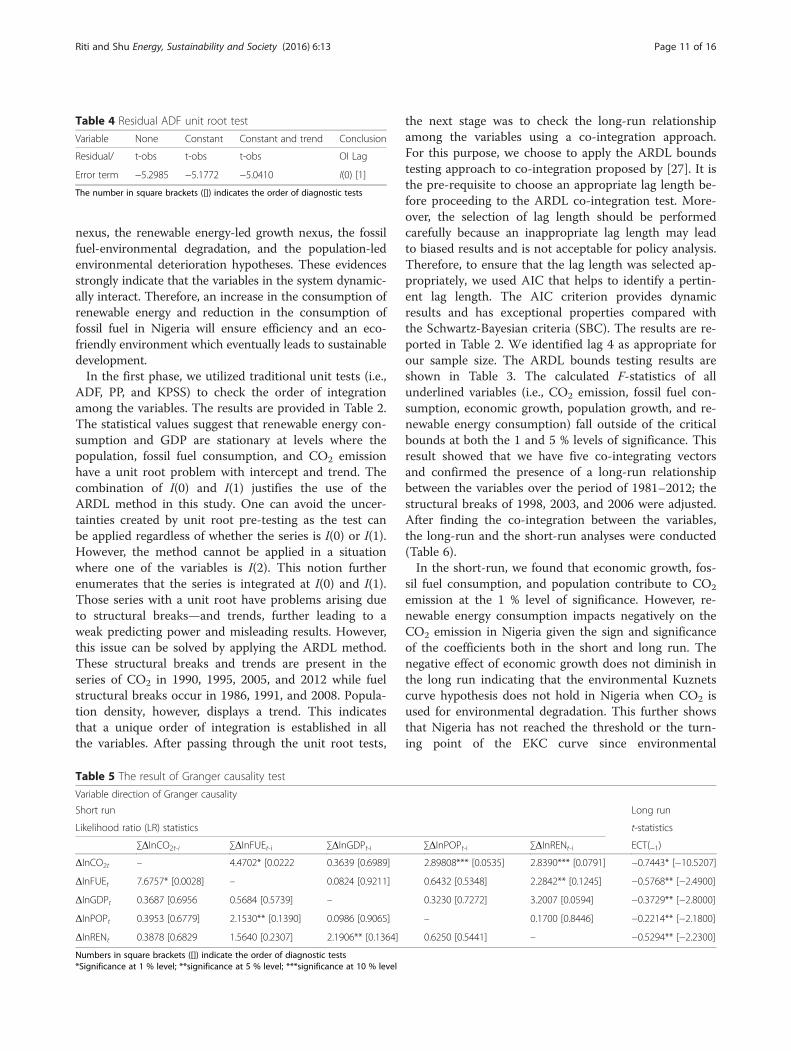
the variables, a residual unit root test for co-integrationis carried out. The null hypothesis of unit root is testedagainst the alternative hypothesis of no unit root. Theresult is presented in Table 4.The stationarity of the residuals obtained from the co-
integration regression of the dependent variables (CO2t) onthe independent variables (FUEt, GDPt, POPt, and RENt) hasbeen tested using the ADF test. Based on the result shown inTable 4,we rejected the null hypothesis of the presence of unitroot in the residual. The result revealed that the residual is sta-tionary at the 0.01 level of significance and also confirmedthe presence of co-integration among the variables. Thetest included none, intercept, trend, and intercept.After determining the presence of co-integration, it is
also interesting to perform the Granger causality test toprovide a clearer picture for policymakers to formulateenergy consumption and economic and environmentallyfriendly policies by understanding the direction of caus-ality. As the variables are co-integrated, we employedthe Granger causality in the VECM framework to deter-mine the direction of causality between the variables.
Table 1 Augmented Dickey-Fuller, Philip-Perron, and KPSS unitroot tests
Variables ADF statistic PP statistic KPSS statistic
InRENt −7.1190* −10.2891* 0.1288
ΔInRENt −4.5976* −17.7251* 0.18848**
InPOPt −3.5147 −1.7788 0.057359
ΔInPOPt −3.7071** −3.8137* 0.1880**
InGDPt −5.2226* −5.2407* 0.0770
ΔInGDPt −8.1553* −24.3946* 0.3493*
InFUEt −2.9590 −2.9986 0.0578
ΔInFUEt −5.9338* −6.8035* 0.2283*
InCO2t −1.8842 −1.8247 0.1413
ΔInCO2t −5.4920* −6.0445* 0.1820**
The optimal lag order for ADF test is determined by AIC, while the bandwidthsfor PP and KPSS tests are determined by using the Newey-West Bartlett kernel(the unit root test indicates that all the variables are integrated or stationary atthe first difference, I(1) except InRENt and GDPt which are stationary at levels)*Significance at 1 % level; **significance at 5 % level; ***significance at10 % level
Riti and Shu Energy, Sustainability and Society (2016) 6:13 Page 9 of 16
The results of Granger causality are presented inTable 5. Since the variables are co-integrated, the direc-tion of causality can be divided into a short- and long-run causation. The t significance of the one-periodlagged error correction term represented the long-runcausality, whereas the joint significance LR tests of thelagged explanatory variables represented the short-runcausality. Starting with the long-run causality, our em-pirical results suggest that the coefficients are negativelysigned and statistically significant in all VECMs, imply-ing that there is bi-directional causality between thevariables of interest in the long-run. In addition to that,the significance of ECTt − 1 also exhibits that if the sys-tem is exposed to shock, it will converge to the long-run equilibrium at a relatively slow speed for CO2
emission (−0.7443), fossil fuel consumption (−0.5768),and renewable energy consumption (−0.5294) VECMscompared to the convergence speed of economicgrowth (−0.3729) and population (−0.2214) VECMs.Contrary with the findings of long-run causality, we
find that the short-run causality varies among VECMs.In summary, our empirical evidence shows that at the 1and 10 % levels, Granger causality runs from fossil fuel
consumption and renewable energy consumption to CO2
emission, respectively. However, at the same 1 % level ofsignificance, the results show Granger causality runs fromCO2 emission to fossil fuel consumption. With respect tothese findings, we affirmed that CO2 emission and fossilfuel consumption have bi-directional causality, while re-newable fuel consumption unidirectionally Granger-caused CO2 emission. One interesting finding of this re-sult that makes it plausible is the bi-directional causalitybetween renewable energy consumption and fossil fuelconsumption. This implies that as the consumption of re-newable energy increases, fossil fuel consumption de-creases which invariably ensured an eco-friendlyenvironment. In addition to the plausibility of the result,population shows a unidirectional causality to fuel, imply-ing that as the population of a country increases, con-sumption of fossil fuel also increases, while theenvironment deteriorates. Renewable energy plays a sig-nificant role in ensuring economic efficiency throughGranger-causing GDP. These results are significantly con-sistent with the findings provided in earlier studies forNigeria [33–35]. As a result, the Nigerian dataset sup-ported the renewable energy eco-friendly environmental
Table 3 The result of ARDL co-integration
Bounds testing to co-integration Diagnostic tests
Optimal lag F-statistics X2 normal X2 ARCH X2 reset X2 serial
FCO2(CO2/FUE, GDP, POP, REN 4, 2, 2, 1 14.2739 1.1704 [1] 0.5462 [1] 0.0150 [2] 1.8323
FFUE(FUE/CO2, GDP, POP, REN 4,1, 2, 1 30.7047 0.2829 [1] 0.7610 [1] 1.2294 [2] 3.9920
FGDP(GDP/CO2, FUE, POP, REN 2, 2, 1, 1 6.7908 1.1704 [1] 0.0150 [1] 1.1809 [2] 5.5904
FPOP(POP/CO2, FUE, GDP, REN 2, 1, 2, 1 14.4282 0.5437 [1] 0.1968 [1] 2.1207 [2] 2.7049
FREN(REN/CO2, FUE, GDP, POP 2, 1, 1, 1 5.0009 1.8256 [1] 0.2633 [1] 1.9967 [2] 1.8149
Critical values (T = 32)a
Significance level (%) Lower bounds (0) Upper bounds (1)
1 3.43 4.60
5 2.86 3.99
10 2.57 3.66
The optimal lag length determined by AIC. Numbers in square brackets ([]) indicate the order of diagnostic tests*Significance at 1 % level; **significance at 5 % level; ***significance at 10 % levelaCritical values are collected from [25] (in all cases, the calculated F-statistics are greater than the 1 % upper bound critical values provided by [25], table, case III(intercept and unrestricted trend))
Table 2 Lag length selection order criteria
Lag L LR df P FPE AIC HQIC SBIC
0 −35.9035 0.000013 2.9217 2.9944 3.15957
1 47.2408 166.29 25 0.0000 2.1e−07 −1.2315 −0.7951 0.1959
2 82.139 69.796 25 0.0000 1.2e−07 −1.9385 −1.1385 0.6783
3 163.329 162.38 25 0.0000 3.9e−09 −5.9521 −4.7885 −2.1458
4 238.602 150.55a 25 0.0000 4.6e−10a −9.5431a −8.0158a −4.5473a
Endogenous: InC02t, InFUEt, InGDPt, InPOPt, InRENt. Exogenous: constantaLag selection by the criteria
Riti and Shu Energy, Sustainability and Society (2016) 6:13 Page 10 of 16
nexus, the renewable energy-led growth nexus, the fossilfuel-environmental degradation, and the population-ledenvironmental deterioration hypotheses. These evidencesstrongly indicate that the variables in the system dynamic-ally interact. Therefore, an increase in the consumption ofrenewable energy and reduction in the consumption offossil fuel in Nigeria will ensure efficiency and an eco-friendly environment which eventually leads to sustainabledevelopment.In the first phase, we utilized traditional unit tests (i.e.,
ADF, PP, and KPSS) to check the order of integrationamong the variables. The results are provided in Table 2.The statistical values suggest that renewable energy con-sumption and GDP are stationary at levels where thepopulation, fossil fuel consumption, and CO2 emissionhave a unit root problem with intercept and trend. Thecombination of I(0) and I(1) justifies the use of theARDL method in this study. One can avoid the uncer-tainties created by unit root pre-testing as the test canbe applied regardless of whether the series is I(0) or I(1).However, the method cannot be applied in a situationwhere one of the variables is I(2). This notion furtherenumerates that the series is integrated at I(0) and I(1).Those series with a unit root have problems arising dueto structural breaks—and trends, further leading to aweak predicting power and misleading results. However,this issue can be solved by applying the ARDL method.These structural breaks and trends are present in theseries of CO2 in 1990, 1995, 2005, and 2012 while fuelstructural breaks occur in 1986, 1991, and 2008. Popula-tion density, however, displays a trend. This indicatesthat a unique order of integration is established in allthe variables. After passing through the unit root tests,
the next stage was to check the long-run relationshipamong the variables using a co-integration approach.For this purpose, we choose to apply the ARDL boundstesting approach to co-integration proposed by [27]. It isthe pre-requisite to choose an appropriate lag length be-fore proceeding to the ARDL co-integration test. More-over, the selection of lag length should be performedcarefully because an inappropriate lag length may leadto biased results and is not acceptable for policy analysis.Therefore, to ensure that the lag length was selected ap-propriately, we used AIC that helps to identify a pertin-ent lag length. The AIC criterion provides dynamicresults and has exceptional properties compared withthe Schwartz-Bayesian criteria (SBC). The results are re-ported in Table 2. We identified lag 4 as appropriate forour sample size. The ARDL bounds testing results areshown in Table 3. The calculated F-statistics of allunderlined variables (i.e., CO2 emission, fossil fuel con-sumption, economic growth, population growth, and re-newable energy consumption) fall outside of the criticalbounds at both the 1 and 5 % levels of significance. Thisresult showed that we have five co-integrating vectorsand confirmed the presence of a long-run relationshipbetween the variables over the period of 1981–2012; thestructural breaks of 1998, 2003, and 2006 were adjusted.After finding the co-integration between the variables,the long-run and the short-run analyses were conducted(Table 6).In the short-run, we found that economic growth, fos-
sil fuel consumption, and population contribute to CO2
emission at the 1 % level of significance. However, re-newable energy consumption impacts negatively on theCO2 emission in Nigeria given the sign and significanceof the coefficients both in the short and long run. Thenegative effect of economic growth does not diminish inthe long run indicating that the environmental Kuznetscurve hypothesis does not hold in Nigeria when CO2 isused for environmental degradation. This further showsthat Nigeria has not reached the threshold or the turn-ing point of the EKC curve since environmental
Table 5 The result of Granger causality test
Variable direction of Granger causality
Short run Long run
Likelihood ratio (LR) statistics t-statistics
∑ΔInCO2t-i ∑ΔInFUEt-i ∑ΔInGDPt-i ∑ΔInPOPt-i ∑ΔInRENt-i ECT(−1)
ΔInCO2t – 4.4702* [0.0222 0.3639 [0.6989] 2.89808*** [0.0535] 2.8390*** [0.0791] −0.7443* [−10.5207]
ΔInFUEt 7.6757* [0.0028] – 0.0824 [0.9211] 0.6432 [0.5348] 2.2842** [0.1245] −0.5768** [−2.4900]
ΔInGDPt 0.3687 [0.6956 0.5684 [0.5739] – 0.3230 [0.7272] 3.2007 [0.0594] −0.3729** [−2.8000]
ΔInPOPt 0.3953 [0.6779] 2.1530** [0.1390] 0.0986 [0.9065] – 0.1700 [0.8446] −0.2214** [−2.1800]
ΔInRENt 0.3878 [0.6829 1.5640 [0.2307] 2.1906** [0.1364] 0.6250 [0.5441] – −0.5294** [−2.2300]
Numbers in square brackets ([]) indicate the order of diagnostic tests*Significance at 1 % level; **significance at 5 % level; ***significance at 10 % level
Table 4 Residual ADF unit root test
Variable None Constant Constant and trend Conclusion
Residual/ t-obs t-obs t-obs OI Lag
Error term −5.2985 −5.1772 −5.0410 I(0) [1]
The number in square brackets ([]) indicates the order of diagnostic tests
Riti and Shu Energy, Sustainability and Society (2016) 6:13 Page 11 of 16
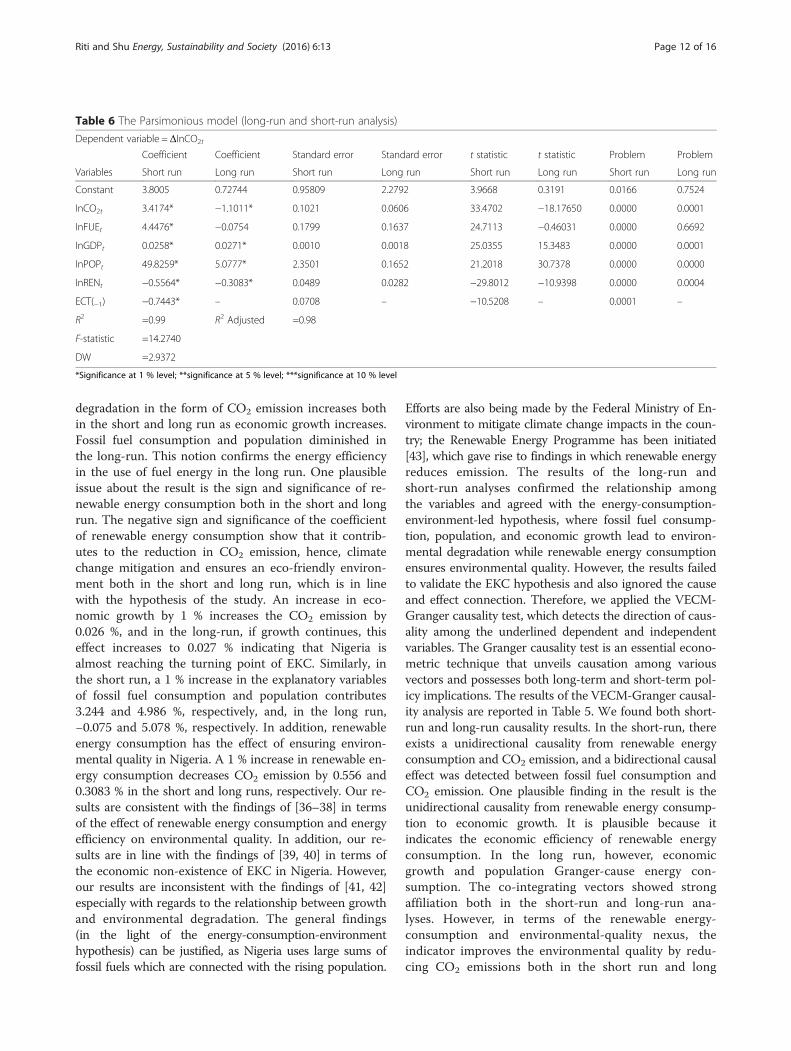
degradation in the form of CO2 emission increases bothin the short and long run as economic growth increases.Fossil fuel consumption and population diminished inthe long-run. This notion confirms the energy efficiencyin the use of fuel energy in the long run. One plausibleissue about the result is the sign and significance of re-newable energy consumption both in the short and longrun. The negative sign and significance of the coefficientof renewable energy consumption show that it contrib-utes to the reduction in CO2 emission, hence, climatechange mitigation and ensures an eco-friendly environ-ment both in the short and long run, which is in linewith the hypothesis of the study. An increase in eco-nomic growth by 1 % increases the CO2 emission by0.026 %, and in the long-run, if growth continues, thiseffect increases to 0.027 % indicating that Nigeria isalmost reaching the turning point of EKC. Similarly, inthe short run, a 1 % increase in the explanatory variablesof fossil fuel consumption and population contributes3.244 and 4.986 %, respectively, and, in the long run,−0.075 and 5.078 %, respectively. In addition, renewableenergy consumption has the effect of ensuring environ-mental quality in Nigeria. A 1 % increase in renewable en-ergy consumption decreases CO2 emission by 0.556 and0.3083 % in the short and long runs, respectively. Our re-sults are consistent with the findings of [36–38] in termsof the effect of renewable energy consumption and energyefficiency on environmental quality. In addition, our re-sults are in line with the findings of [39, 40] in terms ofthe economic non-existence of EKC in Nigeria. However,our results are inconsistent with the findings of [41, 42]especially with regards to the relationship between growthand environmental degradation. The general findings(in the light of the energy-consumption-environmenthypothesis) can be justified, as Nigeria uses large sums offossil fuels which are connected with the rising population.
Efforts are also being made by the Federal Ministry of En-vironment to mitigate climate change impacts in the coun-try; the Renewable Energy Programme has been initiated[43], which gave rise to findings in which renewable energyreduces emission. The results of the long-run andshort-run analyses confirmed the relationship amongthe variables and agreed with the energy-consumption-environment-led hypothesis, where fossil fuel consump-tion, population, and economic growth lead to environ-mental degradation while renewable energy consumptionensures environmental quality. However, the results failedto validate the EKC hypothesis and also ignored the causeand effect connection. Therefore, we applied the VECM-Granger causality test, which detects the direction of caus-ality among the underlined dependent and independentvariables. The Granger causality test is an essential econo-metric technique that unveils causation among variousvectors and possesses both long-term and short-term pol-icy implications. The results of the VECM-Granger causal-ity analysis are reported in Table 5. We found both short-run and long-run causality results. In the short-run, thereexists a unidirectional causality from renewable energyconsumption and CO2 emission, and a bidirectional causaleffect was detected between fossil fuel consumption andCO2 emission. One plausible finding in the result is theunidirectional causality from renewable energy consump-tion to economic growth. It is plausible because itindicates the economic efficiency of renewable energyconsumption. In the long run, however, economicgrowth and population Granger-cause energy con-sumption. The co-integrating vectors showed strongaffiliation both in the short-run and long-run ana-lyses. However, in terms of the renewable energy-consumption and environmental-quality nexus, theindicator improves the environmental quality by redu-cing CO2 emissions both in the short run and long
Table 6 The Parsimonious model (long-run and short-run analysis)
Dependent variable = ΔInCO2t
Coefficient Coefficient Standard error Standard error t statistic t statistic Problem Problem
Variables Short run Long run Short run Long run Short run Long run Short run Long run
Constant 3.8005 0.72744 0.95809 2.2792 3.9668 0.3191 0.0166 0.7524
InCO2t 3.4174* −1.1011* 0.1021 0.0606 33.4702 −18.17650 0.0000 0.0001
InFUEt 4.4476* −0.0754 0.1799 0.1637 24.7113 −0.46031 0.0000 0.6692
InGDPt 0.0258* 0.0271* 0.0010 0.0018 25.0355 15.3483 0.0000 0.0001
InPOPt 49.8259* 5.0777* 2.3501 0.1652 21.2018 30.7378 0.0000 0.0000
InRENt −0.5564* −0.3083* 0.0489 0.0282 −29.8012 −10.9398 0.0000 0.0004
ECT(−1) −0.7443* – 0.0708 – −10.5208 – 0.0001 –
R2 =0.99 R2 Adjusted =0.98
F-statistic =14.2740
DW =2.9372
*Significance at 1 % level; **significance at 5 % level; ***significance at 10 % level
Riti and Shu Energy, Sustainability and Society (2016) 6:13 Page 12 of 16
run. Economic growth, fossil fuel, population, and theenvironmental degradation nexus deteriorate the environ-mental degradation indicator (CO2 emission) both inthe short run and long run and do not support theEKC hypothesis.Conclusively, the model was diagnosed for stability
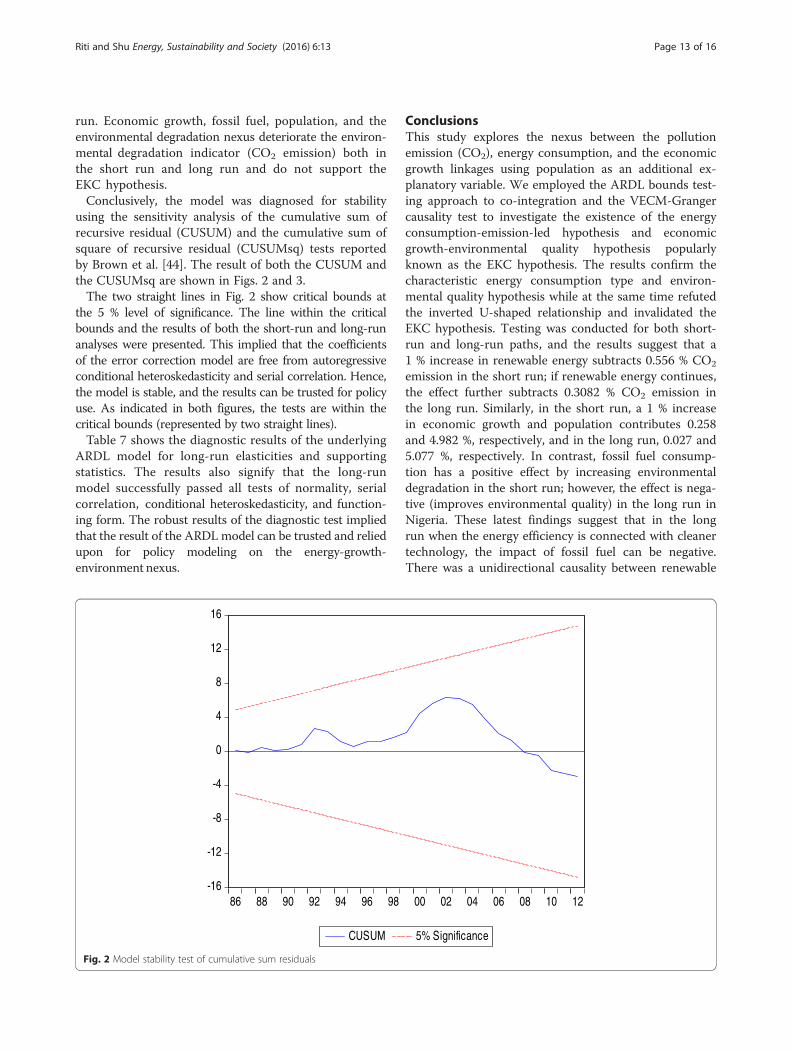
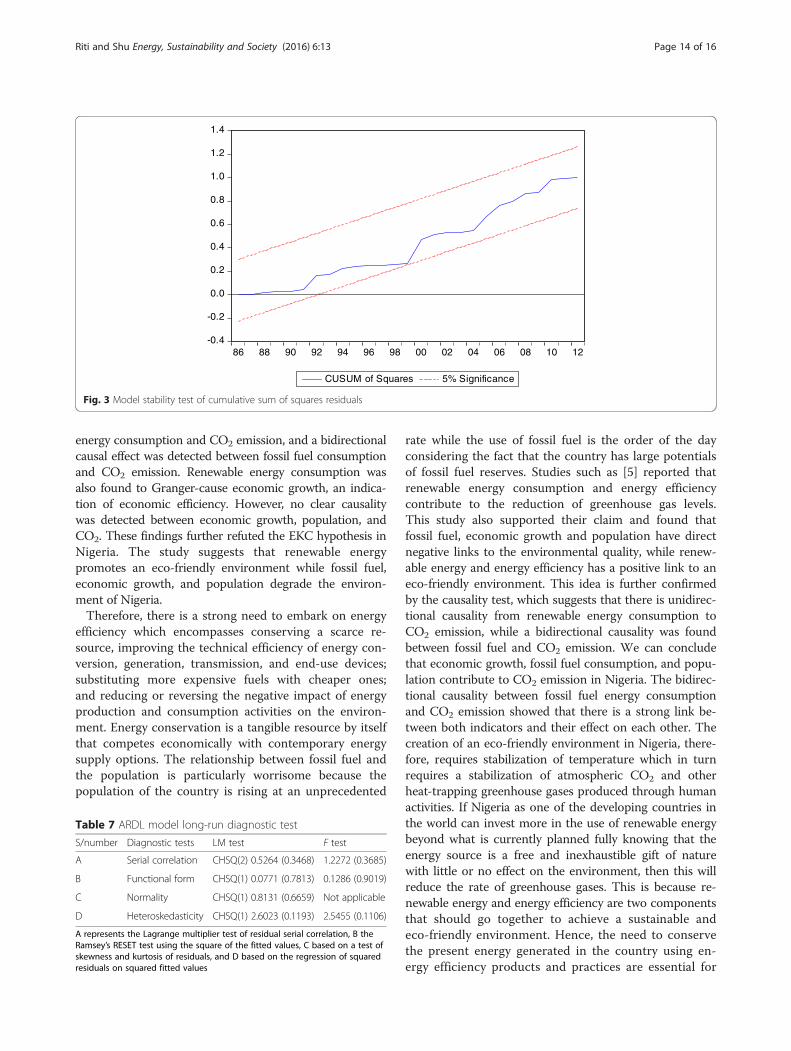
using the sensitivity analysis of the cumulative sum ofrecursive residual (CUSUM) and the cumulative sum ofsquare of recursive residual (CUSUMsq) tests reportedby Brown et al. [44]. The result of both the CUSUM andthe CUSUMsq are shown in Figs. 2 and 3.The two straight lines in Fig. 2 show critical bounds at
the 5 % level of significance. The line within the criticalbounds and the results of both the short-run and long-runanalyses were presented. This implied that the coefficientsof the error correction model are free from autoregressiveconditional heteroskedasticity and serial correlation. Hence,the model is stable, and the results can be trusted for policyuse. As indicated in both figures, the tests are within thecritical bounds (represented by two straight lines).Table 7 shows the diagnostic results of the underlying
ARDL model for long-run elasticities and supportingstatistics. The results also signify that the long-runmodel successfully passed all tests of normality, serialcorrelation, conditional heteroskedasticity, and function-ing form. The robust results of the diagnostic test impliedthat the result of the ARDL model can be trusted and reliedupon for policy modeling on the energy-growth-environment nexus.
ConclusionsThis study explores the nexus between the pollutionemission (CO2), energy consumption, and the economicgrowth linkages using population as an additional ex-planatory variable. We employed the ARDL bounds test-ing approach to co-integration and the VECM-Grangercausality test to investigate the existence of the energyconsumption-emission-led hypothesis and economicgrowth-environmental quality hypothesis popularlyknown as the EKC hypothesis. The results confirm thecharacteristic energy consumption type and environ-mental quality hypothesis while at the same time refutedthe inverted U-shaped relationship and invalidated theEKC hypothesis. Testing was conducted for both short-run and long-run paths, and the results suggest that a1 % increase in renewable energy subtracts 0.556 % CO2
emission in the short run; if renewable energy continues,the effect further subtracts 0.3082 % CO2 emission inthe long run. Similarly, in the short run, a 1 % increasein economic growth and population contributes 0.258and 4.982 %, respectively, and in the long run, 0.027 and5.077 %, respectively. In contrast, fossil fuel consump-tion has a positive effect by increasing environmentaldegradation in the short run; however, the effect is nega-tive (improves environmental quality) in the long run inNigeria. These latest findings suggest that in the longrun when the energy efficiency is connected with cleanertechnology, the impact of fossil fuel can be negative.There was a unidirectional causality between renewable
-16
-12
-8
-4
0
4
8
12
16
86 88 90 92 94 96 98 00 02 04 06 08 10 12
CUSUM 5% Significance
Fig. 2 Model stability test of cumulative sum residuals
Riti and Shu Energy, Sustainability and Society (2016) 6:13 Page 13 of 16
energy consumption and CO2 emission, and a bidirectionalcausal effect was detected between fossil fuel consumptionand CO2 emission. Renewable energy consumption wasalso found to Granger-cause economic growth, an indica-tion of economic efficiency. However, no clear causalitywas detected between economic growth, population, andCO2. These findings further refuted the EKC hypothesis inNigeria. The study suggests that renewable energypromotes an eco-friendly environment while fossil fuel,economic growth, and population degrade the environ-ment of Nigeria.Therefore, there is a strong need to embark on energy
efficiency which encompasses conserving a scarce re-source, improving the technical efficiency of energy con-version, generation, transmission, and end-use devices;substituting more expensive fuels with cheaper ones;and reducing or reversing the negative impact of energyproduction and consumption activities on the environ-ment. Energy conservation is a tangible resource by itselfthat competes economically with contemporary energysupply options. The relationship between fossil fuel andthe population is particularly worrisome because thepopulation of the country is rising at an unprecedented
rate while the use of fossil fuel is the order of the dayconsidering the fact that the country has large potentialsof fossil fuel reserves. Studies such as [5] reported thatrenewable energy consumption and energy efficiencycontribute to the reduction of greenhouse gas levels.This study also supported their claim and found thatfossil fuel, economic growth and population have directnegative links to the environmental quality, while renew-able energy and energy efficiency has a positive link to aneco-friendly environment. This idea is further confirmedby the causality test, which suggests that there is unidirec-tional causality from renewable energy consumption toCO2 emission, while a bidirectional causality was foundbetween fossil fuel and CO2 emission. We can concludethat economic growth, fossil fuel consumption, and popu-lation contribute to CO2 emission in Nigeria. The bidirec-tional causality between fossil fuel energy consumptionand CO2 emission showed that there is a strong link be-tween both indicators and their effect on each other. Thecreation of an eco-friendly environment in Nigeria, there-fore, requires stabilization of temperature which in turnrequires a stabilization of atmospheric CO2 and otherheat-trapping greenhouse gases produced through humanactivities. If Nigeria as one of the developing countries inthe world can invest more in the use of renewable energybeyond what is currently planned fully knowing that theenergy source is a free and inexhaustible gift of naturewith little or no effect on the environment, then this willreduce the rate of greenhouse gases. This is because re-newable energy and energy efficiency are two componentsthat should go together to achieve a sustainable andeco-friendly environment. Hence, the need to conservethe present energy generated in the country using en-ergy efficiency products and practices are essential for
Table 7 ARDL model long-run diagnostic test
S/number Diagnostic tests LM test F test
A Serial correlation CHSQ(2) 0.5264 (0.3468) 1.2272 (0.3685)
B Functional form CHSQ(1) 0.0771 (0.7813) 0.1286 (0.9019)
C Normality CHSQ(1) 0.8131 (0.6659) Not applicable
D Heteroskedasticity CHSQ(1) 2.6023 (0.1193) 2.5455 (0.1106)
A represents the Lagrange multiplier test of residual serial correlation, B theRamsey’s RESET test using the square of the fitted values, C based on a test ofskewness and kurtosis of residuals, and D based on the regression of squaredresiduals on squared fitted values
-0.4
-0.2
0.0
0.2
0.4
0.6
0.8
1.0
1.2
1.4
86 88 90 92 94 96 98 00 02 04 06 08 10 12
CUSUM of Squares 5% Significance
Fig. 3 Model stability test of cumulative sum of squares residuals
Riti and Shu Energy, Sustainability and Society (2016) 6:13 Page 14 of 16
this initiative. In general, Nigeria is in dire need oftechnological change in both the energy and industrialsectors. The adoption of renewable and alternate energyresources will support sustainable growth with reducedadverse environmental impacts. The increasing populationratio is a fueling factor to worsening environmental condi-tions due to economic growth and energy use. Based onthe empirical results of this study, the government ofNigeria needs to take remedial actions towards the sus-tainable development goals. In view of increasing energyconsumption, the energy demand needs to be fulfilled byadopting renewable and alternative energy resources ra-ther than depending on conventional fossil fuel energysources. Moreover, economic growth as a whole causesenvironmental degradation both in the short and long-run;therefore, there is still need to mitigate carbon emission inindustrial sectors and to adopt adaptation strategies in vul-nerable areas to minimize the short-run and long-rundamages. The government should establish performancestandards and greenhouse gas emission baselines formajor activities and major source and create aware-ness of renewable energy and energy efficiency. Thisresearch helps fill the knowledge gap in energy mixconsumption and environmental impacts created withthe convergence of the energy commission and theenvironment ministry, which has limited the scope ofthe environmental protection and management systems.There is an urgent need to carry out spatial planninganalysis to know and project renewable energy com-bination in Nigeria. Also, environmental protectionlaws in terms of both human activities and a managementsystem should be put in place to help mitigate climatechange and ensure an eco-friendly environment andgrowth at the same time.
Endnotes1German Federal Ministry of Environment, Nature
Conservation and Nuclear Safety, 2000. Act on GrantingPriority to Renewable Energy Sources (Renewable EnergySources Act). http://www.bmub.bund.de/fileadmin/bmu-import/files/pdfs/allgemein/application/pdf/res-act.pdf.
2ARDL bound test for co-integration and VECMframework applied.
Competing interestThe authors declare that they have no any competing interests.
Authors’ contributionsJSR personally contributed in terms of analyzing the data and produced theresults of the manuscript. JSR also contributed in revising the manuscript. Allauthors read and approved the final manuscript.
AcknowledgementsWe would like to thank anonymous reviewers for their valuable commentson academic ideas of this manuscript. This work was supported by ChineseScholarship Council of Huazhong University of Science and Technology.
DisclaimerThis article was sponsored by the Chinese Scholarship Council of HuazhongUniversity of Science and Technology, Wuhan, PR China. The viewsexpressed herein can in no way be taken to reflect the official opinion ofChinese Scholarship/Government.
Received: 5 June 2015 Accepted: 22 February 2016
References1. Intergovernmental Panel on Climate Change (IPCC) (2012) Special report of
the intergovernmental panel on climate change, Summary for policymakers(A Report of Working Group III of the IPCC and technical Summary)
2. Energy Solution, 2004. Working together for the environment and theeconomy. Centre for Climate and Energy Solution. http://www.c2es.org/science-impacts/extreme-weather/hurricanes
3. COP-21: UN Climate Change Conference, Paris (2015). Everything you needto know about the Paris Climate Summit and UN Talks.
4. German Federal Ministry of Environment, Nature Conservation and NuclearSafety (2000) Act on granting priority to renewable energy sources(Renewable Energy Sources Act). http://www.bmub.bund.de/fileadmin/bmu-import/files/pdfs/allgemein/application/pdf/res-act.pdf
5. Ugwuoke PE, Agwunobi UC, Aliyu AO (2012). Renewable energy as climatechange mitigation strategy in Nigeria. Int'l J Envi Sci 3(1):11-19.
6. Gore A (1993) E-Pushed for BTU tax on coal & gas, in 1993, environmentalactions by President Clinton and Vice President Gore. http://www.ontheissues.org/celeb/More_Al_Gore_Energy_+_Oil.htm
7. Sims, R.E.H; Schock, R.N.; Adegbululgbe A.; Fenhann J.; Konstantinaviciute, I.;Moomaw, W. & Uyigue, E., 2007. CREDC conference on promotingrenewable energy and energy efficiency in Nigeria. Held at University ofCalabar Hotel and Conference Centre. 21st November
8. Uyigue E (2007) Renewable energy and energy efficiency and sustainabledevelopment in Nigeria’, CREDC Conference on Promoting RenewableEnergy and Energy Efficiency in Nigeria
9. Hardy JT (2003) Climate change: causes, effects and solution. John Wileyand Sons Ltd, England
10. Community Research and Development Centre (CREDC) (2007) Promotingrenewable energy and energy efficiency in Nigeria
11. Martinot E, McDom O (2002) Promoting energy efficiency and renewableenergy GEF climate change projects and impacts. Global EnvironmentalFacility, Washington, DC
12. Iyayi F (2004) An integrated approach to development in the Niger Delta,A paper prepared for the Centre for Democracy and Development (CDD)
13. Awosika LF (1995) Impacts of global climate change and sea level rise on coastalresources and energy development in Nigeria. In: Umolu JC (ed) Global climatechange: impact on energy development. DAMTECH Nigeria Limited, Nigeria
14. Omokaro O (2008) Energy development in a fossil fuel economy: theNigerian experience, Report of a National Dialogue to Promote RenewableEnergy and Energy Efficiency in Nigeria
15. Aliyu UO, Elegba SB (1990) Prospects for small hydropower developmentfor rural applications in Nigeria. Niger J Renewable Energy 1:74–86
16. Okafor ECN, Joe-Uzuegbu CKA (2010) Challenges to development of renewableenergy for electric power sector in Nigeria. Int J Acad Res 2(2):211–216
17. Uzoma CC, Nnaji CE, Ibeto CN, Okpara CG, Nwoke OO, Obi IO, Oparaku OU(2011) Renewable energy penetration in Nigeria: a study of the South-Eastzone. Continental J Environ Sci 5(1):1–5
18. Sambo AS (2009) Strategic developments in renewable energy in Nigeria.Int Assoc Energy Econ 4:15–19
19. Nnaji CE, Uzoma CC, Chukwu JO (2012) Analysis of factors determining fuelwood use for cooking by rural households in Nsukka area of Enugu State,Nigeria. Continental J Environ Sci 6(2):1–6
20. Akinbami JFK (2001) Renewable energy resources and technologies inNigeria: present situation, future prospects and policy framework, vol 6,Mitigation and adaptation strategies for global change. Kluwer AcademicPublishers, Netherlands, pp 155–188
21. Energy Commission of Nigeria (2003) National energy policy. FederalRepublic of Nigeria, Abuja
22. Dayo FB (2008). Clean Energy Investment in Nigeria: The domestic context.Published by International Institute for Sustainable Development (IISD),http://www.iisd.org.
Riti and Shu Energy, Sustainability and Society (2016) 6:13 Page 15 of 16

23. Hyman EL (1994). Fuel Substitution and efficient woodstoves: Are they theanswers to fuelwood supply problem in Northern Nigeria? EnvironmentalManagement (Springer) 18(1):23–32.
24. World Bank (2015) Turn down the heat: why a 4 degree celsius worldwarmer must be avoided. http://www-wds.worldbank.org/external/
25. Pesaran MH, Shin Y, Smith RJ (2001) Bounds testing approaches to theanalysis of level relationships. J Appl Econ 16(3):289–326
26. Frimpong JM, Oteng-Abayie EF (2006) Bivariate causality analysis betweenFDI inflows and economics growth in Ghana. Proceedings, 3rd AfricanFinance Journal Conference, Research in Development Finance for Africa,Ghana, 12th-13th July 2006
27. Narayan PK (2004) Reformulating Critical Values for the Bounds F-statisticsApproach to Cointegration: an Application to the Tourism Demand Modelfor Fiji. Department of Economics Discussion Papers, No. 02/04, MonashUniversity, Victoria 3800, Australia,-References- Scientific Research Publish.
28. Granger CWJ (1988) Some recent development in a concept of causality.J Econom 39:199–211
29. Lutkepohl H (2005) New Introduction to Multiple Time Series Analysis.2008-2 IEE-836 -Macroeconometria Profa. Viviane Luporini.
30. Fosu E, Frimpong JM, Oteng-Abayie (2006) Bounds testing approach: anexamination of foreign direct investment, trade, and growth relationships.Am J Appl Sci 4(1):257–70
31. Ang JB (2007) CO2 emissions, energy consumption, and output in France.Energy Policy, 5, pp 4772–4778
32. Pesaran MH, Shin Y, Smith RP (1997) Estimatinglong run relationships indynamic heterogeneous panels. DAE Working Papers AmalgamatedSeries 9721.
33. Chindo S, Abdulrahim A, Waziri SI, Huong WM Ahmed AA (2014) Energyconsumption, CO2 emissions and GDP in Nigeria. Springer-Neitherlands:Geojournal. doi:10.107/s10708-014-9558-6.
34. Olufemi MS (2013) Energy consumption, carbon emission and economicgrowth in Nigeria. International Conference on Energy policies and Climateprotection (ICEPCP’2013), Johannesburgs, South Africa, 15-16 April 2013
35. Akpan GE and Akpan UF (2012) Electricity Consumption, Carbon Emissionsand Economic Growth in Nigeria. Int'l J Ener Econ Pol 2(4):292–306
36. Oyedepo SO (2012) Energy and sustainable development in Nigeria. Theway forward. Energy Sustainability and Society. http://energsustainsoc.springeropen.com/articles/10.1186/2192-0567-2-15.
37. Efeakpor OM (2015) Environmental Impacts of Renewable Energy andManagement Dilemma in Nigeria. https://www.academia.edu/3341822/Environmental_Impacts_of_Renewable_Energy_and_Management_Dilemma_in_Nigeria.
38. Borut V, Christin H, Stefano B, Chris W, Ales P, Alessa P, Richard H, Ales P(2015) Renewable and sustainable energy reviews. In Progress, Vol. 48(2015). Science Direct.
39. Ojewumi JS (2015) EKC hypothesis n Sub-Saharan Africa (SSA) countries;evidence from panel data analysis. Int'l J Envi Pollut Res 3(1):20–33
40. Alege PO & Ogundipe AA (2013) Environmental quality and economicgrowth in Nigeria: a fractional cointegration analysis. Int'l J Devt Sust2(2):580–596
41. Akpan UF & Chuku CA (2011) Economic Growth and EnvironmentalDegradation in Nigeria: Beyond the Environmental Kuznets Curve. In:Adinikinju A, Iwayemiand A, Iledare W (Eds) Green Energy and EnergySecurity: Options for Africa, 2011 NAEE Proceedings, p 212–234
42. Omisakin AO (2009) Economic growth and environmental quality: does EKChypothesis hold? Ecological Journal. Medwell Journals Scientific Researchpublishing Coy. 3(1):14–18
43. The Federal Ministry of Environment (2014) Renewable Energy programme.http://renewableenergy.gov.ng/adopting-renewable-energy-in-nigeria/.
44. Brown RL, Durbin J & Evans JM (1975) Techniques for testing the constancyof regression relations overtime. Journal of the Royal Statistical Society.Series B, Statistical Methodology, 37:149–192
Submit your manuscript to a journal and benefi t from:
7 Convenient online submission
7 Rigorous peer review
7 Immediate publication on acceptance
7 Open access: articles freely available online
7 High visibility within the fi eld
7 Retaining the copyright to your article
Submit your next manuscript at 7 springeropen.com
Riti and Shu Energy, Sustainability and Society (2016) 6:13 Page 16 of 16