Renewable Energy Challenges and Opportunities in the ......3.1 The Contribution of Saudi Energy...
35
1 WP/19/08 SAMA Working Paper: Renewable Energy Challenges and Opportunities in the Kingdom of Saudi Arabia November 2019 By Mohammed Ahmed Al Yousif Al Yousif Saudi Arabian Monetary Authority The views expressed are those of the author(s) and do not necessarily reflect the position of the Saudi Arabian Monetary Authority (SAMA) and its policies. This Working Paper should not be reported as representing the views of SAMA.
Transcript of Renewable Energy Challenges and Opportunities in the ......3.1 The Contribution of Saudi Energy...

1
WP/19/08
SAMA Working Paper:
Renewable Energy Challenges and Opportunities in the
Kingdom of Saudi Arabia
November 2019
By
Mohammed Ahmed Al Yousif
Al Yousif
Saudi Arabian Monetary Authority
The views expressed are those of the author(s) and do not necessarily reflect the position of the Saudi
Arabian Monetary Authority (SAMA) and its policies. This Working Paper should not be reported as
representing the views of SAMA.

2
Renewable Energy Challenges and Opportunities
in the Kingdom of Saudi Arabia
September 2019
By
Mohammed Al Yousif1Al Yousif2
Economic Research Departmentrch Department
Abstract
This paper seeks to introduce a different method of investing in renewable energy, one that
will be more attractive to local investors. It concludes that investment in renewable energy is
a promising strategy for creating more sustainable jobs for Saudi citizens and promoting the
domestic economic diversification. The Saudi renewable energy sector shall increase the
contribution that the Saudi non-oil sector makes to the total Saudi economic activities. Further
development of the Saudi renewable energy sector should encourage further domestic energy
consumption efficiency and less pollution. However, challenges typically thwart progress in
the renewable energy sector. These challenges include technical problems, cost issues and lack
of financial sources. This paper proposes solutions that should help circumvent these particular
challenges.
Keywords: Renewable energy; Input-output table; Value Added; Saudi Arabia; Energy
efficiency; Diversification; Less pollution; Sustainable jobs.
JEL: C67, Q5, Q20, Q29
1 Contact Detail: Mohammed Al Yousif, email: [email protected] 2 Contact Detail: Mohammed Al Yousif, email: [email protected]
3
1. INTRODUCTION
By the end of 2018, Saudi Arabia was consuming for domestic energy usage more than
three million barrels of oil every day; among these, 0.5 million barrels were solely for
desalination. Moreover, the demand for water and energy is expected to increase significantly
in Saudi Arabia due to high population growth (approximately 3.2% annually in recent years
[2012-2017]) and economic growth (Rambo et al., 2017). The total number of oil barrels used
inside the Kingdom is predicted to be around eight million per day by the end of 2050 (Negewo
et al., 2012). This current level of domestic consumption of energy places a heavy burden on
the government budget and prevents the exploration of opportunities to export more barrels of
oil (Sdralevich et al., 2014). However, renewable energy investments would increase the
demand for domestic economic activities such as construction, manufacturing, services and
utilities, as well as the activities of small and medium enterprises (SMEs), which should help
generate more jobs for Saudi citizens (Al-Gheethi et al., 2015). Therefore, this research’s
objective is to propose a transformation roadmap for the Saudi economy so that it achieves a
higher level of diversification and more sustainability. In conclusion, this paper will discuss,
specifically, the challenges and opportunities of investment in the renewable energy sector,
renewable energy technology and the Saudi renewable energy contribution to the local
production system, the labor market and the value added.
4
2. DISCUSSION
2.1. Challenges and Opportunities for Widespread Renewable Energy Development
Investment in renewable energy has faced many challenges worldwide, such as those
of financial and technical natures, as well as a small market share. Renewable energy
technology, maintenance, and training are still very costly compared to conventional sources
of energy. Thus, the share of renewable energy as compared to total energy was no greater than
12% worldwide and less than 10% in the United States in 2017. In addition, the challenges
related to investment in renewable energy in Saudi Arabia include high temperatures and
significant amounts of dust, which are not appropriate for photovoltaic (PV) and concentrated
solar power (CSP) technologies. The efficiency of PV systems is found to decrease at high
temperatures, while dust reduces the output level of reflectors, especially of the CSP system.
However, the addition of cooling and washing systems could solve these problems (Baras et
al., 2012). In summary, renewable energy development faces various challenges, such as
technological issues, the high initial cost of renewable energy projects, low efficiency, and a
shortage of funding.
On the other hand, investment in renewable energy is an effective policy for generating
more jobs for the local community and promoting domestic economic activities. Additionally,
the use of renewable energy, even if only partially, should help reduce the level of pollution
and increase the level of environmental quality.
5
2.2. Renewable Energy Technology
The types of renewable energy technologies handled by this research are solar energy
(Photovoltaic [PV], Concentrated Solar Power [CSP], and wind energy). This research focuses
on these types of technologies because it seems that they are more suitable for Saudi Arabia’s
weather and geography. As discussed, solar energy has two essential parts: Photovoltaic (PV)
and Concentrated Solar Power (CSP). Solar photovoltaic (PV) technology is the dominant
technology for generating renewable energy because it is very efficient and easy to install. The
other kind of technology, such as CSP is excellent on a large scale for producing electricity in
cities. CSP technology could be used for desalination as well as for generating electricity on a
big scale. Wind technology is also considered as a cheap source of renewable energy
worldwide.
2.3.1. Solar energy
The Middle East region receives around 3,000-3,500 hours of sunshine per year, with
over 2500 kWh/m2 of solar energy per day (El-sebaii et al., 2010). Saudi Arabia has additional
potential for investment in solar energy because it has the Empty Quarter, which can host a
solar array, and clear sand, which can be used to manufacture silicon PV cells and mirrors
(Aksakal & Rehamn, 2009). Solar PV technology uses semiconductor materials to convert
solar energy directly into electricity. Besides, solar PV can be used in small-scale projects ,and
it does not require a large area. Saudi Arabia could use solar PV technology in remote areas
because these small villages need a limited amount of electricity, such as for water pumps and
lighting. In addition, solar PV energy can be used for road lights, road instructor signals, tunnel
lighting, and traffic lights. Concentrating Solar Power systems (CSPs) technology uses mirrors

6
to concentrate solar energy by 50 to 10,000 times. This heat creates steam for moving turbines
and generating electricity. The CSP requires many laborers (especially during construction)
and machinery due to an increased demand for glass, iron and other materials (Asplund, 2008).
2.3.2. Wind energy
Wind energy is expected to be the dominant source of renewable energy because it has
a faster growth rate compared to other types of renewable energy. The main advantages of
wind energy are clean and less polluting. Some negative effects on the environment of using
wind energy are killing some birds and destructing some forest (Iskander, 2015). Saudi Arabia
has many attractive areas for producing wind energy, particularly around the Arabian Gulf and
the Red Sea coastline zones.
3.1 The Contribution of Saudi Energy Efficiency and Renewable Energy to Saudi
Arabia (GDP, Labor Market, and Value Added)
The Saudi economy would gain many benefits from increasing domestic investment in
renewable energy. These new renewable energy investments expected to augment the domestic
economic growth. Investment in renewable energy predict to enhance significantly various
sectors of the economy, such as construction, services, and research and development (R&D).
This paper estimates and calculates the contribution of investment in Saudi renewable energy
to the Saudi economic activities, value-added and the labor market by using Leontief’s input-
output model (Chemingui & Lofgren, 2004; Al-Hawwas, 2010).
As long as the renewable energy sector has higher value-added activities and uses input
materials from most economic sectors, investment in renewable energy should generate more

7
expansion on a big list of domestic economic activities due to new investments in renewable
energy. Any expansion on a domestic production system shall increase the demand for
laborers. In 2019, the International Renewable Energy Agency (IRENA) estimated the number
of (direct and indirect) jobs in renewable energy worldwide during the period between 2017
and 2018. There were approximately more than 10.3 million jobs in renewable energy
worldwide in 2013 and 11.0 million in 2018. According to IRENA, the higher number of
renewable energy jobs can be found in Germany, China, Brazil, India, the United States, and
Japan. There is a wide range of occupation in renewable energy, such as engineering,
technicians, marketing, retail, administration and customer service. Jobs in renewable energy
could be classified into different fields such as research and development, manufacturing and
distribution; project development; construction and installation; and operation and
maintenance (Sastreas et al., 2010).
3.1.1 Methodology
The main purpose of using Leontief input-output model as a methodology for this
research is to study the contribution of investment in renewable energy to the other sectors of
production. A macroeconomic input-output model is a quantitative tool for calculating the rate
of growth resulting from increased investment in renewable energy (Pestel, 2014). The input-
output model has a high capability of capturing the flow of goods and services between
different sectors of production. Furthermore, this model captures the flow stream of goods and
services in the economy as a whole. The purpose of calculating this new expansion in the
production system is to estimate the further additional increase in demand for goods, services,
and labor due to the flow of investment in renewable energy. The input-output model traces
economic activities as a process of interrelations among different sectors of production and the
8
final demand entities. Thus, the input-output model considers the circulation of inputs of raw
materials (or services) and outputs of finished or semi-finished goods (or services) among
different sectors of production and the final demand sector. Overall, the Leontief approach has
the ability to calculate the tradeoff coefficient between different domestic entities of production
and the final demand (government, investors, household consumption and trade) (Miller,
2009).
The sizes of interchangeability between the production sectors depend on the tradeoff
coefficient between domestic entities of production and the final demand (government,
investors, household consumption and trade) (Miller, 1998). The tradeoff coefficient means
the distribution of sector A output to other sectors of production, which could be read as aij/ai.
According to table (3) Saudi Arabia ‘A’ matrix input-output, the tradeoff coefficient of
Agriculture Act (1) to Construction Act (7) is around ab/aa = 0.32, or 32 percent of Agriculture
production consumed directly by Construction sector. Any investment increase in sector Act
(7) would result in a new expansion of the production of Agriculture sector Act (1). This
increase in production of Act (7) would increase the demand on all kinds of inputs. In our
example, the demand increase from Act (7) will be distributed to other sectors of production
in the existing economic system; one of them is increasing the demand on Act (1) outputs.
According to Miller and Blair (2009), Leontief’s input-output model can simulate the
forward and backward connections between the domestic production sectors and the final
demand sectors. It is a backward and forward movement that any expansion in sector B would
push forward the demand on the other sectors of production and import. Some output of sector
B is input to other sectors of production such as A, C, D, which there demand on the other
sector of production would increase as a backward effect. In the end, the whole system of
production shall expand because of expanding investment in B. The Leontief model is eligible

9
for calculating this kind of dynamic movement in the model. These calculations are intended
to help us estimate the amount of expansion in the economic system due to increasing
investment in renewables.
The main purpose of using this particular methodology is to study the contribution of
investment in renewable energy to the other sectors of production. As long as the renewable
energy sector has a high level of diversification, investment in renewable energy should
generate more expansion on a big list of domestic economic activities due to new investments
in renewable energy. Any expansion on a domestic production system shall increase the
demand for laborers.
This calculation helps us to estimate the amount of expansion in the entire economic
system because of increased investment in renewables. The Leontief table divides the national
economy into n+1 sectors, which can be grouped into two major categories; one is the
producing sector, and the other is the final demand sector, which can be further divided into
sub-groups (government spending, household consumption, investment and net exports).
Hence, the total output of any sector of production will either be in the form of an intermediate
input to both itself and the other sectors of production or it will go to the final demand sector,
which consumes the rest of these outputs. Therefore, the total goods and services produced by
a particular production sector should be consumed by the n sectors of production and the n+1
sector (the final demand sector). In short, the input-output model reveals the flow of goods and
services among all economic production sectors and the consuming sector (which is further
sub-divided into the final components of expenditure GDP) over a period of time, usually one
year. The Saudi input-output table is divided into three essential sectors (domestic consumption
sector, value-added sector, final uses) as it appears in figure (1).

10
Figure (1): The Saudi Arabian Input-Output Elements3
Source: General Authority of Statistic (GSTAT, 2015)
Table (1) provides a snapshot of the Saudi input-output table (2015). Table (1) contains
three areas with different colors. Area number (1) (in red) contains information about trade
between the sectors of production (in value “Million of SR”). Area (1)’s columns represent the
supply side, for instance, the total output of the agriculture sector that is consumed by the
agriculture sector, manufacturing and wholesale and retail trade. The other side of the matrix
is the raw side, which includes the total demand of each sector of production. Area (2) (in blue)
3 This figure built on the latest available supply and used tables for Saudi Arabia.
Saudi Input-output model
Domestic consumption
12 Sectors of Production
Value Added
Compensaton of emplolyment
Operating Surplus
Other taxes less subsidies on production
Final uses sector
Government
Investors
Household
Gross Fixed
Capital Formation
Net export

11
contains the final government and household consumption of the three sectors of production.
Area (3) (in brown) includes the value added by each sector of production. The primary data
were collected from different sources, including the Organization for Economic Co-operation
and Development (OECD), the General Authority for Statistics (GSTAT), and the Saudi
Arabian Monetary Authority (SAMA). In addition, some information obtained from the Saudi
National Transportation Plan (NTP 2020), Saudi Vision (Vision 2030), and any announcement
by the Public Investment Fund (PIF). This research used the Leontief's I-O model as a
quantitative method for calculating the expected economic growth from new investments in
renewable energy at Saudi Arabia (Al Yousif & Albaker, 2017).
Table (1): The Saudi Arabian Input-Output Table (2015)
GDP Activities
(Billions of SR)
Agriculture Manufacturing Wholesale &
Retail Trade,
Restaurants &
Hotels
Final
Consumption
Expenditure by
Government
Final
Consumption
Expenditure by
Households
Agriculture 7.928 880 5.548 2.142 39.097
Manufacturing 9.631 19.404 141.391 1.355 377.167
Wholesale &
Retail Trade,
Restaurants &
Hotels
1.122
4.952 14.178 0 71.848
Compensation
of Employment
8.502 45.195 55.423
Operating
Surplus
60.404 202.153 212.346
Source: General Authority of Statistic (GSTAT, 2015)
Table (2) evaluates trade-offs among different entities of production. For instance, the
amount of output from entity ACT1 goes to entity ACT2 and vice versa in billions of SR. Table
(2) rows include the distributions of output between different sectors of production and table
(2) columns include the distributions of output to all sectors of production. Table (2) below

12
explains the total flow of goods and services between different sectors of production and the
summation of the total amount of input and output between all sectors has to be zero.

13
Table (2): Saudi Arabia Input and Output Table for 20154 (Millions of SR)
Init; Sectors Act(1) Act(2) Act(3) Act(4) ACT(5) ACT(6) ACT(7) ACT(8) ACT(9) ACT(10) ACT(11) ACT(12) Inter-industry
Sub-Total
ACT(1) Agriculture, Forests and
Fishing 7,928.44 - 879.76 - 2,945.79 66,593.89 - 5,548.10 - 4,728.94 - 2,679.10 91,304.02
ACT(2) Crude petroleum and Natural
gas extraction - - 1,083.72 320.73 39,103.75 44,389.04 4,102.07 9,906.40 - 3,109.79 - - 102,015.50
ACT(3) Other mining - - - - - 14,104.74 1,214.78 11,383.76 - - - - 26,703.29
ACT(4) Petroleum Refining 4,068.56 1,500.01 812.03 787.38 6,309.68 37,565.30 8,486.82 13,794.84 7,521.18 31,963.72 1,306.22 2,257.73 116,373.46
ACT(5) Other Manufacturing 9,631.16 1,427.76 3,560.46 1,836.97 19,403.80 89,152.27 10,118.58 141,391.47 27,260.98 42,758.07 6,775.50 14,301.90 367,618.92
ACT(6) Electricity, Gas, and Water 902.54 147.45 375.83 174.93 2,399.76 15,026.12 1,009.46 6,086.17 9,129.61 4,934.21 1,304.35 2,705.04 44,195.49
ACT(7) Construction 1,210.68 280.06 846.97 425.92 8,580.69 31,272.74 3,256.62 22,591.14 11,498.54 14,770.98 2,324.58 7,598.37 104,657.29
ACT(8) Wholesale and Retail Trade 1,122.24 103.54 565.66 181.50 4,951.95 17,981.01 2,483.10 14,178.27 7,358.96 7,523.20 1,090.83 2,143.26 59,683.53
ACT(9)
Restaurants and Hotels,
transport, Storage, and
Communication
628.08 461.88 1,087.75 1,152.43 9,013.98 13,172.65 2,401.64 18,652.42 36,272.70 18,191.89 1,587.14 2,693.10 105,315.66
ACT(10)
Financial, Insurance, Real
estate, and Business Services,
Ownership of Dwellings
(Imputed Rent)
1,365.90 364.04 553.56 311.57 6,338.67 22,964.42 2,928.46 18,206.00 26,762.40 10,140.72 6,701.92 6,199.23 102,836.89
ACT(11) community, social, and personal
services 1,189.71 250.06 483.59 234.32 4,589.29 16,065.55 1,545.50 5,406.75 6,246.36 5,136.39 872.83 1,747.41 43,767.77
ACT(12) Producers of government
services 372.47 64.90 264.84 110.20 2,559.34 7,365.29 879.19 4,219.70 2,089.91 2,482.41 409.63 759.15 21,577.02
Total Input 28,419.79 4,599.69 10,514.18 5,535.96 106,196.72 375,653.01 38,426.23 271,365.02 134,140.65 145,740.32 22,373.00 43,084.28 0.00
Source: General Authority of Statistic (GSTAT, 2015) & Author calculation
4 This table built based on the latest update available from the General Authority of Statistics

14
Table (3) calculates the ‘A’ matrix as (aij = Xij / Xj). ‘A’ matrix calculates the input
coefficients between all production sectors. Let us say that X2 consumes 10% of the total
production of X1, and a12 is the share of X1 used as input to X2. In short, table (3) provides the
distribution of output by one sector of production among all other sectors of production. The
next step in the Leontief I-O methodology is the identity matrix (see Table 4). This step is vital
for calculating Leontief’s inverse matrix. This matrix is used to calculate the next table (Table
5), which is the (I-A) matrix. Table (5) has one condition, which is that diagonal values are
positive, and off-diagonal values are negative.

15
Table (3): Saudi Arabia ‘A’ Matrix Input and Output Table for 2015
Percentage Act(1) Act(2) Act(3) Act(4) ACT(5) ACT(6) ACT(7) ACT(8) ACT(9) ACT(10) ACT(11) ACT(12)
Act(1) Agriculture, Forests and
Fishing 5.99% 0.00% 0.67% 0.00% 2.23% 50.35% 0.00% 4.19% 0.00% 3.58% 0.00% 2.03%
Act(2) Crude petroleum and
Natural gas extraction 0.00% 0.00% 0.18% 0.05% 6.52% 7.40% 0.68% 1.65% 0.00% 0.52% 0.00% 0.00%
Act(3) Other mining 0.00% 0.00% 0.09% 0.00% 0.00% 60.08% 5.17% 48.49% 0.00% 0.00% 0.00% 0.00%
Act(4) Petroleum Refining 1.97% 0.72% 0.39% 0.38% 3.05% 18.14% 4.10% 6.66% 3.63% 15.44% 0.63% 1.09%
Act(5) Other Manufacturing 0.65% 0.10% 0.24% 0.12% 1.31% 6.02% 0.68% 9.55% 1.84% 2.89% 0.46% 0.97%
Act(6) Electricity, Gas, and
Water 0.89% 0.15% 0.37% 0.17% 2.37% 14.86% 1.00% 6.02% 9.03% 4.88% 1.29% 2.68%
Act(7) Construction 0.32% 0.07% 0.22% 0.11% 2.26% 8.25% 0.86% 5.96% 3.03% 3.90% 0.61% 2.00%
Act(8) Wholesale and Retail
Trade 1.88% 0.17% 0.95% 0.30% 8.32% 30.20% 4.17% 23.81% 12.36% 12.64% 1.83% 3.60%
Act(9)
Restaurants and Hotels,
transport, Storage, and
Communication
0.34% 0.25% 0.59% 0.63% 4.92% 7.18% 1.31% 10.17% 19.78% 9.92% 0.87% 1.47%
Act(10)
Financial, Insurance,
Real estate, and Business
Services, Ownership of
Dwellings (Imputed
Rent)
0.42% 0.11% 0.17% 0.10% 1.94% 7.02% 0.89% 5.56% 8.18% 3.10% 2.05% 1.89%
Act(11) community, social, and
personal services 0.29% 0.06% 0.12% 0.06% 1.13% 3.94% 0.38% 1.33% 1.53% 1.26% 0.21% 0.43%
Act(12) Producers of government
services 0.11% 0.02% 0.08% 0.03% 0.73% 2.09% 0.25% 1.20% 0.59% 0.71% 0.12% 0.22%
Source: Author calculation

16
Table (4): Saudi Arabia Identical Matrix Table
Act(1) Act(2) Act(3) Act(4) ACT(5) ACT(6) ACT(7) ACT(8) ACT(9) ACT(10) ACT(11) ACT(12)
Act(1) Agriculture, Forests
and Fishing 1.00 0.00 0.00 0.00 0.00 0.00 0.00 0.00 0.00 0.00 0.00 0.00
Act(2)
Crude petroleum
and Natural gas
extraction
0.00 1.00 0.00 0.00 0.00 0.00 0.00 0.00 0.00 0.00 0.00 0.00
Act(3) Other mining 0.00 0.00 1.00 0.00 0.00 0.00 0.00 0.00 0.00 0.00 0.00 0.00
Act(4) Petroleum Refining 0.00 0.00 0.00 1.00 0.00 0.00 0.00 0.00 0.00 0.00 0.00 0.00
Act(5) Other
Manufacturing 0.00 0.00 0.00 0.00 1.00 0.00 0.00 0.00 0.00 0.00 0.00 0.00
Act(6) Electricity, Gas, and
Water 0.00 0.00 0.00 0.00 0.00 1.00 0.00 0.00 0.00 0.00 0.00 0.00
Act(7) Construction 0.00 0.00 0.00 0.00 0.00 0.00 1.00 0.00 0.00 0.00 0.00 0.00
Act(8) Wholesale and
Retail Trade 0.00 0.00 0.00 0.00 0.00 0.00 0.00 1.00 0.00 0.00 0.00 0.00
Act(9)
Restaurants and
Hotels, transport,
Storage, and
Communication
0.00 0.00 0.00 0.00 0.00 0.00 0.00 0.00 1.00 0.00 0.00 0.00
Act(10)
Financial,
Insurance, Real
estate, and Business
Services, Ownership
of Dwellings
(Imputed Rent)
0.00 0.00 0.00 0.00 0.00 0.00 0.00 0.00 0.00 1.00 0.00 0.00
Act(11)
community, social,
and personal
services
0.00 0.00 0.00 0.00 0.00 0.00 0.00 0.00 0.00 0.00 1.00 0.00
Act(12) Producers of
government services 0.00 0.00 0.00 0.00 0.00 0.00 0.00 0.00 0.00 0.00 0.00 1.00
Source: Author calculation

17
Table (5): Saudi Arabia (I-A) Matrix Input and Output Table for 2015
Act(1) Act(2) Act(3) Act(4) ACT(5) ACT(6) ACT(7) ACT(8) ACT(9) ACT(10) ACT(11) ACT(12)
Act(1) Agriculture, Forests and Fishing 0.94 0.00 -0.01 0.00 -0.02 -0.50 0.00 -0.04 0.00 -0.04 0.00 -0.02
Act(2) Crude petroleum and Natural gas
extraction 0.00 1.00 0.00 0.00 -0.07 -0.07 -0.01 -0.02 0.00 -0.01 0.00 0.00
Act(3) Other mining 0.00 0.00 1.00 0.00 0.00 -0.60 -0.05 -0.48 0.00 0.00 0.00 0.00
Act(4) Petroleum Refining -0.02 -0.01 0.00 1.00 -0.03 -0.18 -0.04 -0.07 -0.04 -0.15 -0.01 -0.01
Act(5) Other Manufacturing -0.01 0.00 0.00 0.00 0.99 -0.06 -0.01 -0.10 -0.02 -0.03 0.00 -0.01
Act(6) Electricity, Gas, and Water -0.01 0.00 0.00 0.00 -0.02 0.85 -0.01 -0.06 -0.09 -0.05 -0.01 -0.03
Act(7) Construction 0.00 0.00 0.00 0.00 -0.02 -0.08 0.99 -0.06 -0.03 -0.04 -0.01 -0.02
Act(8) Wholesale and Retail Trade -0.02 0.00 -0.01 0.00 -0.08 -0.30 -0.04 0.76 -0.12 -0.13 -0.02 -0.04
Act(9) Restaurants and Hotels, transport,
Storage, and Communication 0.00 0.00 -0.01 -0.01 -0.05 -0.07 -0.01 -0.10 0.80 -0.10 -0.01 -0.01
Act(10)
Financial, Insurance, Real estate, and
Business Services, Ownership of
Dwellings (Imputed Rent)
0.00 0.00 0.00 0.00 -0.02 -0.07 -0.01 -0.06 -0.08 0.97 -0.02 -0.02
Act(11) community, social, and personal
services 0.00 0.00 0.00 0.00 -0.01 -0.04 0.00 -0.01 -0.02 -0.01 1.00 0.00
Act(12) Producers of government services 0.00 0.00 0.00 0.00 -0.01 -0.02 0.00 -0.01 -0.01 -0.01 0.00 1.00
Source: Author calculation

18
Table (6) shows the inverse matrix (I-A)-1. The inverse matrix calculates coefficient
vectors among different sectors of production. Agriculture and utility made the lowest
contribution to the total Saudi output. Their coefficients with other sectors of production are
very small compared to mining, quarrying, and manufacturing.
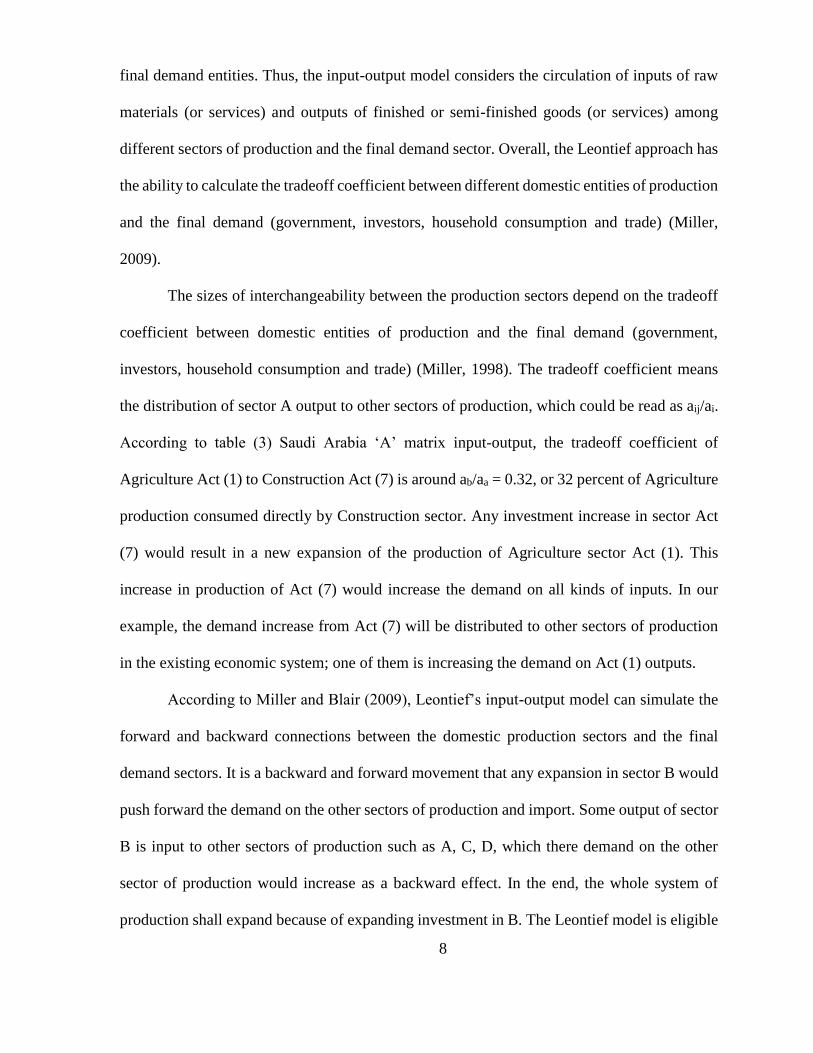
Table (7) is the value added table. This table explains the gross domestic product
(GDP). The value added table presents the total value resulting from the domestic production
sector for a year. Table (7) also includes the compensation of employees, other taxes less
subsidies on production and operating surplus. As is clear from this table, the manufacturing
and construction sectors make a significant contribution to the total value added in the Saudi
economy, as these sectors are highly labor-intensive.

19
Table (6): Leontief Inverse Matrix (I-A)-1 of Saudi Arabia for 2015
Act(1) Act(2) Act(3) Act(4) ACT(5) ACT(6) ACT(7) ACT(8) ACT(9) ACT(10) ACT(11) ACT(12)
Act(1) Agriculture, Forests and
Fishing 1.08 0.00 0.01 0.00 0.06 0.73 0.02 0.16 0.12 0.11 0.02 0.05
Act(2) Crude petroleum and Natural
gas extraction 0.00 1.00 0.00 0.00 0.08 0.12 0.01 0.05 0.03 0.02 0.00 0.01
Act(3) Other mining 0.03 0.00 1.02 0.01 0.12 1.08 0.10 0.81 0.28 0.20 0.04 0.07
Act(4) Petroleum Refining 0.03 0.01 0.01 1.01 0.07 0.34 0.06 0.17 0.14 0.22 0.02 0.03
Act(5) Other Manufacturing 0.01 0.00 0.01 0.00 1.04 0.16 0.02 0.16 0.08 0.07 0.01 0.02
Act(6) Electricity, Gas, and Water 0.02 0.00 0.01 0.00 0.06 1.28 0.02 0.15 0.18 0.11 0.02 0.05
Act(7) Construction 0.01 0.00 0.00 0.00 0.04 0.17 1.02 0.12 0.09 0.08 0.01 0.03
Act(8) Wholesale and Retail Trade 0.04 0.00 0.02 0.01 0.17 0.64 0.08 1.47 0.33 0.27 0.05 0.08
Act(9)
Restaurants and Hotels,
transport, Storage, and
Communication
0.01 0.00 0.01 0.01 0.10 0.24 0.03 0.24 1.33 0.19 0.02 0.04
Act(10)
Financial, Insurance, Real
estate, and Business Services,
Ownership of Dwellings
(Imputed Rent)
0.01 0.00 0.00 0.00 0.04 0.16 0.02 0.12 0.15 1.07 0.03 0.03
Act(11) community, social, and
personal services 0.00 0.00 0.00 0.00 0.02 0.07 0.01 0.03 0.04 0.03 1.00 0.01
Act(12) Producers of government
services 0.00 0.00 0.00 0.00 0.01 0.04 0.00 0.03 0.02 0.02 0.00 1.00
Source: Author calculation
20
Table (7): Saudi Arabia Value Added Table for 2015
Value Added (Million of SR)
Init; Sectors Act(1) Act(2) Act(3) Act(4) ACT(5) ACT(6) ACT(7) ACT(8) ACT(9) ACT(10) ACT(11) ACT(12)
Val(1) Compensation
of Emplolyment
8,502.79
29,857.99
1,298.13
6,313.61
45,195.53
11,251.24
38,608.86
55,423.60
43,157.34
32,656.50
216,863.64
192,337.33
Val(2)
Other Taxes
Less Subsidies
on Production
(3,381.02)
-
110.94
-
(916.22)
158.76
1,803.93
5,348.98
4,744.50
1,430.70
1,527.92
-
Val(3) Operating
Surplus
60,404.62
559,200.87
9,894.90
56,609.73
202,153.09
30,375.60
120,104.72
212,346.87
195,271.11
269,651.39
51,883.96
30,775.66 GDP
Total
Value Added
Value Added
total
65,526.40
589,058.86
11,303.97
62,923.34
246,432.40
41,785.60
160,517.50
273,119.45
243,172.95
303,738.59
270,275.52
223,112.99 2,490,967.56
Source: General Authority of Statistic (GSTAT, 2015) & Author calculation

21
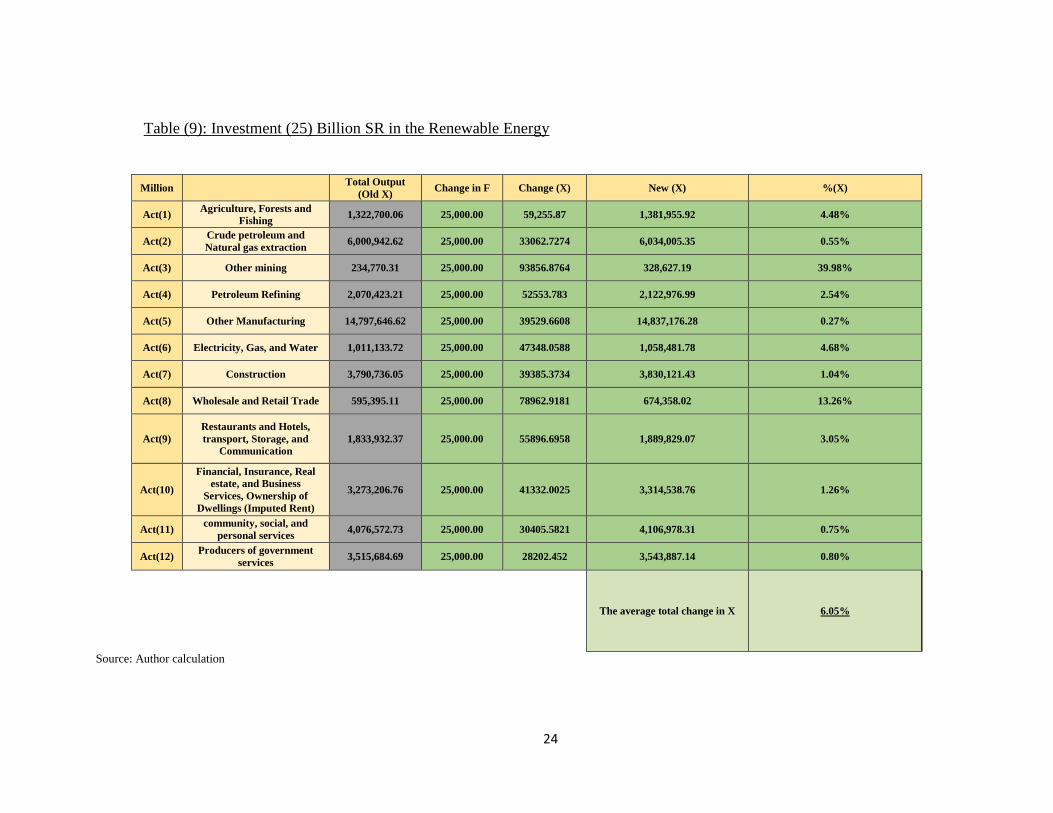
3.2. Empirical Scenarios
This research paper uses Leontief’s method to estimate the impact of investment in
renewable energy through three main scenarios (Investment of 25, 50, and 85 billion Saudi
Riyals). These scenarios have different economic outcomes based on the amount of
investment in renewable energy. The purpose of having these scenarios is to compare the
cost of investment in renewable energy and its outcomes. This evaluation will provide the
reader with three major pieces of information: the expected level of expansion in the
domestic production system, the expected additional growth in the value added and the
estimated number of new jobs (direct and indirect).
The expected expansion of investment of 25 billion Saudi Riyals in the domestic
production system growth is no less than 2.4 percent; see Table (9). The establishment of
a new project in renewable energy will create new demand for different sectors of
production. Some sectors of production are expected to expand in response to this new
demand. Moreover, the impact of new investment in renewable energy was distributed
among the sectors of production based on the level at which these production sectors were
involved in the renewable energy sector. Also, the Saudi government could enhance the
domestic producers to meet the new demand from the domestic renewable energy projects.
Thus, this new investment in renewable energy should be distributed to different sectors of
production based on their levels of involvement in renewable energy economic activities.
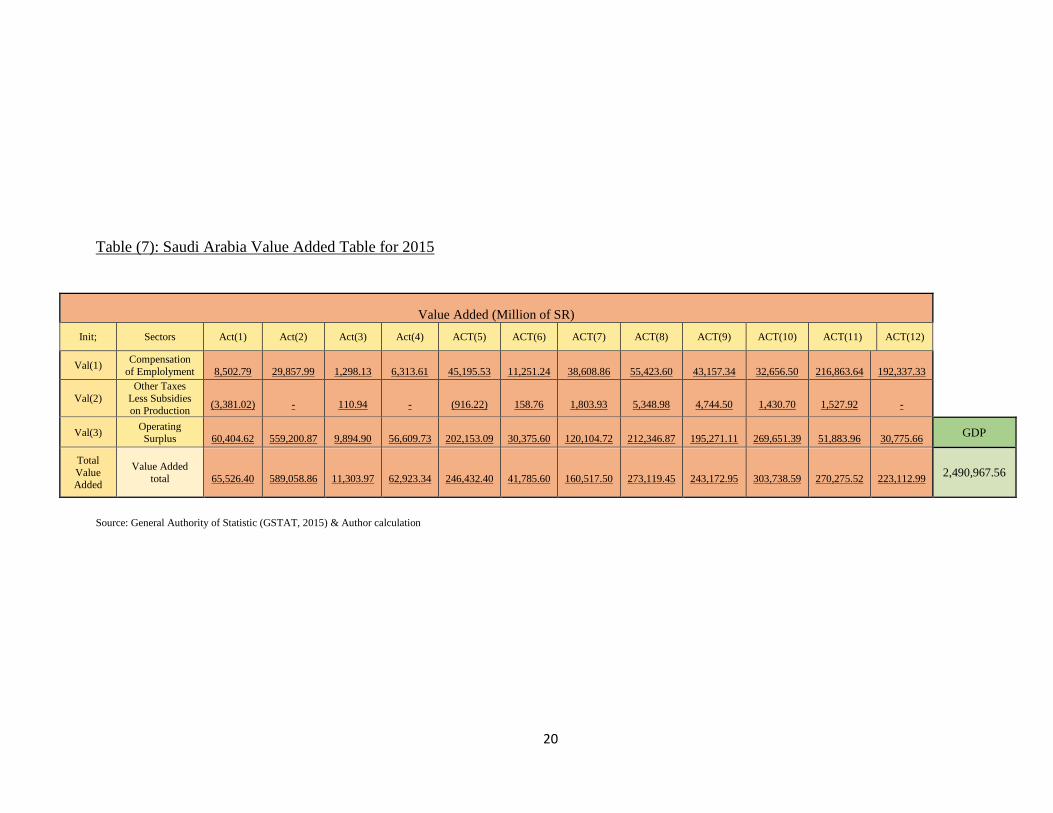
Table (8) contains the distribution of Saudi sectors of production. 5
5 There is not enough actual data for renewable energy in Saudi Arabia. Thus, this
research relies on the literature to visualize the flow of renewable energy investments.
22
Table (8): The level of distribution of the renewable energy sectors
Sector of Production Level of Involvement Sector of Production Level of Involvement
Constriction Level (1) Petroleum Refining Level (2)
Manufacturing6 Level (1) Restaurants and
Hotels, Transport,
Storage and
Communication
Level (2)
Wholes and Retail Trade Level (1) Financial, Insurance,
real estate, and
Business services
Level(2)
Agriculture and fishing Level (3) Crude Petroleum and
Natural Gas
Level (3)
Other Mining Level (3) Utilities (Electricity,
Gas, and water)
Level (3)
Community, Social,
and Personal services
Level (3) Producers of
government services
Level (3)
Source: Author
Based on Table (9), the expected expansion in the whole domestic system of
production is estimated to be around 6.0 percent of an investment of 25 billion Saudi
Riyals. The distribution of the investment of 25 billion Saudi Riyals in renewable energy
6 The high renewable energy technology machines and devices are not expected to
be produced locally. However, the local producers are expected to supply other
requirements such as wires, cement, pipes, Aluminum, services and others.
23
has been resolved using the Leontief’s inverse matrix (X-A)-1. The equation (∆X = (i −
A)(-)* ∆ g7 summarizes the following of changes between different sectors of production
through the Leontief’s inverse matrix (X-A)-1. If the government had invested one billion
dollars in enhancing the renewable energy activities in the Kingdom, this amount of
investment would have flowed directly to the construction and manufacturing sectors. Any
new investment in the domestic renewable energy sector would have a lower impact on the
financial, insurance, real estate, restaurant, hotel, and transportation sectors, as well as on
all other business services.
From Table (10), the total value added is estimated to be around 2.7 percent of the
investment of 25 billion dollars in renewable energy. As is clear from table (10), there are
three main sources of value added: ‘Compensation of Employment,’ ‘Taxes Minus
subsidies,’ and ‘Operation Surplus.’ The same methodology was used to calculate the new
value added and the change in the production system resulting from the investment of 25
billion, 50 billion, and 85 billion Saudi Riyals in renewable energy; see tables (11, 12, 13,
and 14). There is an expectation that value added will increase by around 4.7 percent and
6.0 percent for an investment of 50 billion and 85 billion Saudi Riyals. Figure (2) shows
the expected number of new jobs that would be generated in all three scenarios, i.e., 44,000,
90,000, and 150,000 thousand jobs.
7 ∆ g, government investment in the renewable energy activities
24
Table (9): Investment (25) Billion SR in the Renewable Energy
Million Total Output
(Old X) Change in F Change (X) New (X) %(X)
Act(1) Agriculture, Forests and
Fishing 1,322,700.06 25,000.00 59,255.87 1,381,955.92 4.48%
Act(2) Crude petroleum and
Natural gas extraction 6,000,942.62 25,000.00 33062.7274 6,034,005.35 0.55%
Act(3) Other mining 234,770.31 25,000.00 93856.8764 328,627.19 39.98%
Act(4) Petroleum Refining 2,070,423.21 25,000.00 52553.783 2,122,976.99 2.54%
Act(5) Other Manufacturing 14,797,646.62 25,000.00 39529.6608 14,837,176.28 0.27%
Act(6) Electricity, Gas, and Water 1,011,133.72 25,000.00 47348.0588 1,058,481.78 4.68%
Act(7) Construction 3,790,736.05 25,000.00 39385.3734 3,830,121.43 1.04%
Act(8) Wholesale and Retail Trade 595,395.11 25,000.00 78962.9181 674,358.02 13.26%
Act(9)
Restaurants and Hotels,
transport, Storage, and
Communication
1,833,932.37 25,000.00 55896.6958 1,889,829.07 3.05%
Act(10)
Financial, Insurance, Real
estate, and Business
Services, Ownership of
Dwellings (Imputed Rent)
3,273,206.76 25,000.00 41332.0025 3,314,538.76 1.26%
Act(11) community, social, and
personal services 4,076,572.73 25,000.00 30405.5821 4,106,978.31 0.75%
Act(12) Producers of government
services 3,515,684.69 25,000.00 28202.452 3,543,887.14 0.80%
The average total change in X 6.05%
Source: Author calculation

25
Table (10): Saudi Arabia Value Added Table for 2015
Source: Author calculation
Init; Sectors Act(1) Act(2) Act(3) Act(4) ACT(5) ACT(6) ACT(7) ACT(8) ACT(9) ACT(10) ACT(11) ACT(12)
Val(1) Compensation of
Emplolyment
8,502.79
29,857.99
1,298.13
6,313.61
45,195.53
11,251.24
38,608.86
55,423.60
43,157.34
32,656.50
216,863.64
192,337.33
Val(2)
Other Taxes Less
Subsidies on
Production
(3,381.02)
-
110.94
-
(916.22)
158.76
1,803.93
5,348.98
4,744.50
1,430.70
1,527.92
-
Val(3) Operating Surplus
60,404.62
559,200.87
9,894.90
56,609.73
202,153.09
30,375.60
120,104.72
212,346.87
195,271.11
269,651.39
51,883.96
30,775.66 GDP
Total
Value
Added
Value Added total
65,526.40
589,058.86
11,303.97
62,923.34
246,432.40
41,785.60
160,517.50
273,119.45
243,172.95
303,738.59
270,275.52
223,112.99 2,490,967.56
Init; Sectors Act(1) Act(2) Act(3) Act(4) ACT(5) ACT(6) ACT(7) ACT(8) ACT(9) ACT(10) ACT(11) ACT(12)
Step1 % in all X's 4.48% 0.55% 39.98% 2.54% 0.27% 4.68% 1.04% 13.26% 3.05% 1.26% 0.75% 0.80% NEW GDP
Step 2 Change in the value
added 68461.92 592304.33 15823.09 64520.53 247090.71 43742.28 162185.26 309341.29 250584.65 307574.01 272291.40 224902.78 2,558822.26

26
Table (11): Investment (50) Billion Saudi Riyals in the Renewable Energy
Total Output (Old X) Change in F Change (X) New (X) %(X)
Act(1) Agriculture, Forests and Fishing 3,968,100.17 50000 118,511.73 4,086,611.90 2.99%
Act(2) Crude petroleum and Natural gas
extraction 12,001,885.24 50000 66125.45485 12,068,010.70 0.55%
Act(3) Other mining 234,770.31 50000 187713.7529 422,484.06 79.96%
Act(4) Petroleum Refining 4,140,846.41 50000 105107.566 4,245,953.98 2.54%
Act(5) Other Manufacturing 147,976,466.18 50000 79059.32151 148,055,525.50 0.05%
Act(6) Electricity, Gas, and Water 2,022,267.45 50000 94696.11763 2,116,963.57 4.68%
Act(7) Construction 7,581,472.11 50000 78770.74682 7,660,242.86 1.04%
Act(8) Wholesale and Retail Trade 2,976,975.53 50000 157925.8363 3,134,901.37 5.30%
Act(9) Restaurants and Hotels, transport, Storage, and
Communication 7,335,729.49 50000 111793.3916 7,447,522.88 1.52%
Act(10)
Financial, Insurance, Real estate, and Business Services,
Ownership of Dwellings (Imputed Rent)
9,819,620.27 50000 82664.00502 9,902,284.28 0.84%
Act(11) community, social, and personal
services 12,229,718.19 50000 60811.16423 12,290,529.35 0.50%
Act(12) Producers of government
services 7,031,369.38 50000 56404.90399 7,087,774.29 0.80%
The average total
change in X 8.40%
Source: Author calculation

27
Table (12): Saudi Arabia Value Added Table for 2015
Init; Sectors Act(1) Act(2) Act(3) Act(4) ACT(5) ACT(6) ACT(7) ACT(9) ACT(10) ACT(11) ACT(12)
Val(1)
Compensation of
Emplolyment
8,502.79
29,857.99
1,298.13
6,313.61
45,195.53
11,251.24
38,608.86
43,157.34
32,656.50
216,863.64
192,337.33
Val(2)
Other Taxes
Less
Subsidies on Production
(3,381.02)
-
110.94
-
(916.22)
158.76
1,803.93
4,744.50
1,430.70
1,527.92
-
Val(3) Operating
Surplus
60,404.62
559,200.87
9,894.90
56,609.73
202,153.09
30,375.60
120,104.72
195,271.11
269,651.39
51,883.96
30,775.66 GDP
Total
Value
Added
Value Added
total
65,526.40
589,058.86
11,303.97
62,923.34
246,432.40
41,785.60
160,517.50
243,172.95
303,738.59
270,275.52
223,112.99 2,490,967.56
Init; Sectors Act(1) Act(2) Act(3) Act(4) ACT(5) ACT(6) ACT(7) ACT(9) ACT(10) ACT(11) ACT(12)
Step1 % in all X's 2.99% 0.55% 79.96% 2.54% 3.05% 4.68% 11.04% 7.52% 4.84% 7.50% 2.80% NEW GDP
Step 2 Change in the
value added 67483.42 592304.33 20342.21 64520.53 253957.04 43742.28 178237.01 261469.18 318445.08 290538.73 229365.04 2,608,013.03 4.70%
Source: Author calculation

28
Table 13: Investment (85) Billion Saudi Riyals in the Renewable Energy
Total Output (Old X) Change in F Change (X) New (X) %(X)
Act(1) Agriculture, Forests and
Fishing 6,613,500.28 85000 201,469.94 6,814,970.23 3.05%
Act(2) Crude petroleum and Natural gas extraction
30,004,713.10 85000 112413.2732 30,117,126.38 0.37%
Act(3) Other mining 704,310.93 85000 319113.3799 1,023,424.31 15.31%
Act(4) Petroleum Refining 1,035,211.60 85000 178682.8621 1,213,894.47 17.26%
Act(5) Other Manufacturing 7,398,823.31 85000 134400.8466 7,533,224.16 1.82%
Act(6) Electricity, Gas, and
Water 606,680.23 85000 160983.4 767,663.63 26.54%
Act(7) Construction 2,274,441.63 85000 133910.2696 2,408,351.90 5.89%
Act(8) Wholesale and Retail
Trade 476,316.09 85000 268473.9217 744,790.01 49.36%
Act(9) Restaurants and Hotels, transport, Storage, and
Communication 1,650,539.14 85000 190048.7657 1,840,587.90 7.51%
Act(10)
Financial, Insurance, Real estate, and
Business Services, Ownership of Dwellings
(Imputed Rent)
1,963,924.05 85000 140528.8085 2,104,452.86 7.16%
Act(11) community, social, and
personal services 3,261,258.18 85000 103378.9792 3,364,637.16 3.17%
Act(12) Producers of
government services 3,164,116.22 85000 95888.33678 3,260,004.56 3.03%
The average total change in X 11.71%
Source: Author calculation

29
Table 14: Saudi Arabia Value Added Table for 2015
Init; Sectors Act(1) Act(2) Act(3) Act(4) ACT(5) ACT(6) ACT(7) ACT(8) ACT(9) ACT(10) ACT(11) ACT(12)
Val(1) Compensation of
Employment 8,502.79 29,857.99 1,298.13 6,313.61 45,195.53 11,251.24 38,608.86 55,423.60 43,157.34 32,656.50 216,863.64 192,337.33
Val(2)
Other Taxes Less
Subsidies on
Production
(3,381.02) - 110.94 - (916.22) 158.76 1,803.93 5,348.98 4,744.50 1,430.70 1,527.92 -
Val(3) Operating
Surplus 60,404.62 559,200.87 9,894.90 56,609.73 202,153.09 30,375.60 120,104.72 212,346.87 195,271.11 269,651.39 51,883.96 30,775.66 GDP
Total
Value
Added
Value Added total
65,526.40 589,058.86 11,303.97 62,923.34 246,432.40 41,785.60 160,517.50 273,119.45 243,172.95 303,738.59 270,275.52 223,112.99 2,490,967.56
Init; Sectors Act(1) Act(2) Act(3) Act(4) ACT(5) ACT(6) ACT(7) ACT(8) ACT(9) ACT(10) ACT(11) ACT(12)
Step1 % in all X's 3.05% 2.37% 6.31% 7.26% 6.82% 12.54% 14.89% 10.36% 7.51% 7.16% 3.17% 3.03% NEW GDP
Step 2 Change in the value added
67522.56 603046.96 12017.09 67491.90 263230.51 47023.48 184414.72 301427.34 261445.80 325472.64 278843.01 229874.41 2,641,810.42 6.06%
Source: Author calculation

30
Figure (2) : The Number of Laborers in Renewable Energy
Source: Author
44 Thousand New Jobs
90 Thousand New Jobs
150 Thousand New Jobs
25 billion 50 Billion 85 Billion

31
4. CONCLUSION
Investment in renewable energy inside the Kingdom of Saudi Arabia has many economic
benefits. The primary hypothesis of this research is "investment in renewable energy is an optimal
solution for solving various kinds of problems, such as unemployment and less economic
diversification." Most of renewable energy empirical research papers concluded that investment
in renewable energy is a very promising solution for generating more jobs and driving economic
growth. There are numerous benefits of investment in renewable energy, including creating more
jobs for Saudis, making new sources of income and reducing the domestic consumption of fossil
fuel and saving more oil for export.
This study has calculated three multipliers: labor, value-added, and output. The output
multiplier of investment in the Saudi renewable energy sector is estimated to be around 8 percent.
This means that increasing demand for the renewable energy sector by SAR 1 million is expected
to increase the total economic demand, on average, by SAR 80 thousand. The value-added
multiplier is estimated to be around 4 percent, which means that an investment of SAR 1 million
in Saudi renewable energy will generate SAR 40 thousand value-added. Regarding to labor
multiplier, there are 1,750 new permanent direct jobs expected to be made from each SAR 1
billion spent on renewable energy in Saudi Arabia8.
Overall, this research encourages the Saudi government to actively invest in the
renewable energy sector and localize relevant supply chains. Some can argue that it is
cheaper to import renewable energy equipment and machines from abroad, because
localizing renewable energy industries could increase the cost of renewable energy.
8 According to the kingdom’s ministry of energy (2019), the number of new jobs in the Saudi
renewable energy sector was estimated to be around 4500 jobs as a result of SAR 5.66 billion investment in
this sector.

32
However, localizing renewable energy production could be a promising approach for
creating more work opportunities for Saudi citizens through three channels (direct,
indirect, and induced). Direct jobs would be mostly in project development, construction,
installation and maintenance. Indirect jobs would be available in other manufacturing
sectors supplying the renewable energy sector and financial sector, including the banking
system, with equipment, materials and services. Employees of these new renewable
energy sector projects would ultimately generate induced jobs through the new
expenditures on local goods and services. This new demand will lead to an expansion in
the local businesses and social activities, such as groceries, hospitals, schools and
restaurants. Further research could be explored by investigating the economic benefit of
solar energy or wind energy.

33
REFERENCES
Al-Abbadi, N. M. (2005). Wind energy resource assessment for five locations in Saudi
Arabia. Renewable Energy, 30(10), 1489-1499.
Al Yousif, M., & Al Bakr, A. (2017). Tourism development effect on saudi economic
diversification. SAMA working Paper, WP/17/1.
Al-Gheethi, A. A., Ismail, N., Efaq, A. N., Bala, J. D., & Al-Amery, R. M. (2015). Solar
disinfection and lime stabilization processes for reduction of pathogenic bacteria
in sewage effluents and biosolids for agricultural purposes in Yemen. Journal of
Water Reuse and Desalination, 5(3), 419-429.
Aksakal, A., & Rehman, S. (1999). Global solar radiation in northeastern Saudi Arabia.
Renewable Energy, 17(4), 461-472.
Al-Hawwas, A. (2010). Policy experiments for the saudi’s economy using a computable
general equilibrium model (CGE): Oil demand and tariff liberalization effects on
the Saudi economy. (Unpublished doctoral dissertation). School of Business,
Dundee, Scotland, UK.
Asplund, R. W. (2008). Profiting from clean energy: A Complete Guide to Trading Green
in Solar, Wind, Ethanol, Fuel Cell, Carbon Credit Industries, and More. John
Wiley & Sons, 307.
Baras, A., Bamhair, W., AlKhoshi, Y., Alodan, M., & Engel-Cox, J. (2012).
Opportunities and challenges of solar energy in Saudi Arabia. American Solar
Energy Society Conference, (Vol. 1, p.4721). Denver, CO.
Chemingui, M. A., & Lofgren, H. (2004, September). Tax policy reform in Saudi Arabia:
A general equilibrium analysis. Paper presented at the 11th Annual Conference of
the Economic Research Forum, Kuwait Institute for Scientific Research and
Economic Research Forum.

34
Commander, S. (2012). A guide to the political economy of reforming energy subsidies.
Paper presented at Indian Wind Power Association Conference 2008 at New
Delhi. April 25, 2008.
Diesendorf, M. (2007). Greenhouse solutions with sustainable energy (Vol. 20, No. 1).
Sydney: University of New South Wales Press.
El-Nakla, S., Yahya, C. B., Peterson, H., Ouda, O. K., & Khobar, K. S. A. (2006).
Renewable energy in Saudi Arabia: Current status, initiatives and challenges.
Paper presented at the 9th EEE-GCC Conference and Exhibition, Bahrain
El-Sebaii, A., Al-Hazmi, F., Al-Ghamdi, A., & Yaghmour, S. J. (2010). Global, direct
and diffuse solar radiation on horizontal and tilted surfaces in Jeddah, Saudi
Arabia. Applied Energy, 87(2), 568-576.
Fattouh, B., & El-Katiri, L. (2013). Energy subsidies in the Middle East and North
Africa. Energy Strategy Reviews, 2(1), 108-115.
Ladislaw, S. O., & Cuyler, Z. (2015). Adjusting to low prices: prospects for fossil-fuel
subsidy reform in oil-producing and exporting countries. Washington, DC: Center
for Strategic and International Studies.
Miller, R. E., & Blair, P. D. (2009). Input-output analysis: Foundations and extensions.
Cambridge, UK: Cambridge University Press.
Nachet, S., &Aoun, M. C. (2015). The Saudi electricity sector: pressing issues and
challenges. Paris, France: The Institutfrançais des relations internationals (Ifri).
Retrieved July, 14, 2016.
Negewo, B. D. (Ed.). (2012). Renewable energy desalination: an emerging solution to
close the water gap in the Middle East and North Africa. World Bank
Publications.

35
Pestel, N. (2014). Employment effects of green energy policies: Does a switch in energy
policy toward more renewable sources create or destroy jobs in an industrial
country. IZA World of Labor, 76.
Rambo, K. A., Warsinger, D. M., Shanbhogue, S. J., V, J. H. L., & Ghoniem, A. F.
(2017). Water-Energy Nexus in Saudi Arabia. Energy Procedia, 105, 3837–3843.
doi: 10.1016/j.egypro.2017.03.782
Rehman, S., & Mohandes, M. (2009). Estimation of diffuse fraction of global solar
radiation using artificial neural networks. Energy Sources, Part A, 31(11), 974-
984.
Rentschler, J., &Bazilian, M. (2017). Policy Monitor—principles for designing effective
fossil fuel subsidy reforms. Review of Environmental Economics and Policy,
11(1), 138-155.
Sastresa, E. L., Usón, A. A., Bribián, I. Z., & Scarpellini, S. (2010). Local impact of
renewables on employment: assessment methodology and case study. Renewable
and sustainable energy reviews, 14(2), 679-690.
Sdralevich, M. C. A., Sab, M. R., Zouhar, M. Y., &Albertin, G. (2014). Subsidy reform
in the Middle East and North Africa: Recent progress and challenges ahead.
International Monetary Fund.
Sen, A., Jamasb, T. (2010). The economic effects of electricity deregulation: An
empirical analysis of Indian states. EPRG working paper 1001, Cambridge
working paper in Economics 1005.
Taher, N., &Hajjar, B. (2014). Environmental concerns and policies in Saudi Arabia. In
Energy Environment in Saudi Arabia: Concerns & Opportunities. Springer,
Cham, (pp. 27-51).
Tlili, Iskander. (2015). Renewable energy in Saudi Arabia: current status and future
potentials. Environment, Development and Sustainability, 17, no. 4, 859-886.