renewable energy and energy effi ciency International Renewable Energy Agency m million MMS...
121
AUGUST 2017 WORKING PAPER based on REmap Synergies between renewable energy and energy efficiency
Transcript of renewable energy and energy effi ciency International Renewable Energy Agency m million MMS...

WORKING PAPER 1AUGUST 2017WORKING PAPER based on REmap
Synergies between renewable energy and energy effi ciency

SYNERGIES2
© IRENA 2017
Unless otherwise stated, material in this publication may be freely used, shared, copied, reproduced, printed or stored, provided that appropriate acknowledgement is given of IRENA as the source and copyright holder. Material in this publication that is attributed to third parties may be subject to separate terms of use and restrictions, and appropriate permissions from these third parties may need to be secured before any use of such material.
ISBN 978-92-9260-013-6
Citation
IRENA (2017), “Synergies between renewable energy and energy efficiency, a working paper based on REmap”, International Renewable Energy Agency (IRENA), Abu Dhabi, www.irena.org/remap
About IRENA
The International Renewable Energy Agency (IRENA) is an intergovernmental organisation that supports countries in their transition to a sustainable energy future and serves as the principal platform for international co-operation, a centre of excellence, and a repository of policy, technology, resource and financial knowledge on renewable energy. IRENA promotes the widespread adoption and sustainable use of all forms of renewable energy, including bioenergy, geothermal, hydropower, ocean, solar and wind energy in the pursuit of sustainable development, energy access, energy security and low-carbon economic growth and prosperity.
Acknowledgements
This report has benefited from valuable expert review provided by Zuzana Dobrotková (World Bank), Wolfgang Eichhammer (Fraunhofer Institute for Systems and Innovation Research), Benoît Lebot and Jurei Yada (International Partnership for Energy Efficiency Cooperation) and Jyoti Painuly (Copenhagen Centre on Energy Efficiency). IRENA colleagues Laura Gutierrez, Asami Miketa, Gayathri Prakash, Elizabeth Press and Jasper Rigter also provided valuable comments.
IRENA is grateful to the German government, whose financial support of the REmap programme makes the publication of reports and papers such as this a reality.
Authors: Niels Berghout, Machteld van den Broek and Ernst Worrell (Utrecht University); Dolf Gielen, Deger Saygin and Nicholas Wagner (IRENA)
For further information or to provide feedback, please contact the REmap team: [email protected]
Disclaimer
This publication and the material herein are provided “as is”.
All reasonable precautions have been taken by IRENA to verify the reliability of the material in this publication. However, neither IRENA nor any of its officials, agents, data or other third-party content providers provide a warranty of any kind, either expressed or implied, and they accept no responsibility or liability for any consequence of use of the publication or material herein.
The information contained herein does not necessarily represent the views of the Members of IRENA. The mention of specific companies or certain projects or products does not imply that they are endorsed or recommended by IRENA in preference to others of a similar nature that are not mentioned. The designations employed and the presentation of material herein do not imply the expression of any opinion on the part

WORKING PAPER 3
CONTENTS
ABBREVIATIONS ������������������������������������������������������������������������������������������������������������������������������������������������ 5
UNITS OF MEASURE ���������������������������������������������������������������������������������������������������������������������������������������� 6
FIGURES ������������������������������������������������������������������������������������������������������������������������������������������������������������� 6
TABLES ���������������������������������������������������������������������������������������������������������������������������������������������������������������� 9
EXECUTIVE SUMMARY ������������������������������������������������������������������������������������������������������������������������������������ 11
1� INTRODUCTION ������������������������������������������������������������������������������������������������������������������������������������������ 17
2� METHOD ������������������������������������������������������������������������������������������������������������������������������������������������������� 19
3� SYNERGIES �������������������������������������������������������������������������������������������������������������������������������������������������� 21
Technologies showing synergies between energy efficiency and renewable energy ������������������� 21
Renewable electricity generation and electrification of end-use services go hand in hand ����������� 22
Renewables could feasibly account for two-thirds of the world’s energy supply in 2050 ���������� 22
Long-term perspective and policy required to avoid trade-offs between
renewable energy and energy efficiency ��������������������������������������������������������������������������������������������������� 24
Energy efficiency technologies increase primary energy savings and the renewable
energy share ������������������������������������������������������������������������������������������������������������������������������������������������������ 25
Renewable energy technologies increase the efficiency of the power and end-use sectors ������ 28
Synergies from sector coupling will become increasingly important ������������������������������������������������� 31
Energy efficiency is key to achieving high renewable energy shares in cities ���������������������������������� 31
4� COUNTRY FINDINGS ��������������������������������������������������������������������������������������������������������������������������������� 33
Opportunities and potential for synergies depend on national circumstances ������������������������������ 33
Developed versus developing countries: the example of the United States and China ��������������� 34
Ambition in Reference Case differs considerably by country �������������������������������������������������������������� 35
Role of RE/EE varies by country ������������������������������������������������������������������������������������������������������������������ 35
5� CLIMATE CHANGE – BENEFITS OF AN INTEGRATED RE/EE APPROACH ������������������������������������ 37
A combined portfolio of RE/EE technologies is required to achieve the deep CO₂ emission
reductions necessary to meet the global target of well below 2°C temperature rise ������������������� 38

SYNERGIES4
6� COSTS AND BENEFITS ����������������������������������������������������������������������������������������������������������������������������� 40
The costs of decarbonisation are small compared to the improvement in human welfare
through reduced externalities ���������������������������������������������������������������������������������������������������������������������� 40
Energy efficiency technologies tend to be more cost-competitive than renewable energy
options, but both are required to realise long-term climate change mitigation goals ������������������� 41
Costs for energy efficiency technologies are typically negative and costs for renewables are
partly negative – the combination cuts total energy system costs significantly ���������������������������� 42
7� DEVELOPING AN ACTION AGENDA ����������������������������������������������������������������������������������������������������� 45
Develop smart and well-designed initiatives to realise the synergies of RE/EE
technologies across and within all sectors of the energy system� ����������������������������������������������������� 45
Accelerate the deployment of RE/EE technologies in the industrial and transport
sectors, taking into account their wide diversity of energy use applications,
technology deployment rates and available technologies ������������������������������������������������������������������� 45
Explore more ambitious technology solutions for buildings, including integrated RE/EE
solutions, coupled with energy efficiency policies to avoid lock-in of emissions �������������������������� 46
Plan for the period beyond 2030 to achieve long-term reductions in energy-related
CO₂ emissions, incorporating a strategy to develop emerging technologies ��������������������������������� 46
REFERENCES ��������������������������������������������������������������������������������������������������������������������������������������������������� 47
ANNEX ��������������������������������������������������������������������������������������������������������������������������������������������������������������� 51
Method and data ����������������������������������������������������������������������������������������������������������������������������������������������� 51
Overview��������������������������������������������������������������������������������������������������������������������������������������������������������� 51
Performance indicators ������������������������������������������������������������������������������������������������������������������������������ 51
Selected countries ���������������������������������������������������������������������������������������������������������������������������������������53
EE Options �����������������������������������������������������������������������������������������������������������������������������������������������������53
Data ����������������������������������������������������������������������������������������������������������������������������������������������������������������� 54
REmap method and data ���������������������������������������������������������������������������������������������������������������������������55
COUNTRY RESULTS ���������������������������������������������������������������������������������������������������������������������������������������� 60
Highlights ������������������������������������������������������������������������������������������������������������������������������������������������������������ 60
China ��������������������������������������������������������������������������������������������������������������������������������������������������������������� 63
Germany �������������������������������������������������������������������������������������������������������������������������������������������������������� 70
India �����������������������������������������������������������������������������������������������������������������������������������������������������������������78
Japan �������������������������������������������������������������������������������������������������������������������������������������������������������������� 85
United States ������������������������������������������������������������������������������������������������������������������������������������������������� 91
POLICY RECOMMENDATIONS ���������������������������������������������������������������������������������������������������������������������� 101
Country policy recommendations ���������������������������������������������������������������������������������������������������������������103

WORKING PAPER 5
ARRA American Recovery and Reinvestment Act
BEV battery electric vehicle
bln billion
CAP Climate Action Programme 2020 (Germany)
CCS carbon capture and storage
CHP combined heat and power
COP Conference of the Parties
COP21 21st Conference of the Parties, Paris, December 2015
CO₂ carbon dioxide
CSP concentrated solar power
C2E2 Copenhagen Centre on Energy Efficiency
DPRE Development Plan for Renewable Energy (China)
EDSAP Energy Development Strategy Action Plan (China)
EE energy efficiency
EEG Renewable Energy Sources Act (Germany)
EPA Environmental Protection Agency
EV electric vehicle
FIP feed-in premium
FIT feed-in tariff
GDP gross domestic product
GHG greenhouse gas
G20 Group of Twenty
ICE internal combustion engine
IEA International Energy Agency
INDC Intended Nationally Determined Contribution
IRENA International Renewable Energy Agency
m million
MMS mandatory market share (China)
N/A not applicable
NGCC natural gas combined cycle
NEEAP National Energy Efficiency Action Plan (Germany)
NEMA National Electrical Manufacturers Association (United States)
NDC Nationally Determined Contribution
NMEEE National Mission on Enhanced Energy Efficiency (India)
O&M operation and maintenance
PAT Perform and Trade (India)
PHEV plug-in hybrid electric vehicle
PPP purchasing power parity
PV photovoltaic
RE renewable energy
RE/EE renewable energy and energy efficiency
REmap IRENA Global Renewable Energy Roadmap
RPS Renewable Portfolio Standards
R&D research and development
SDG7 7th Sustainable Development Goal
SEforALL Sustainable Energy for All
SMS small and medium-sized
TFEC total final energy consumption
TPES total primary energy supply
UNFCCC United Nations Framework Convention on Climate Change
%pt percentage point
ABBREVIATIONS

SYNERGIES6
UNITS OF MEASURE
FIGURES
°C degree Celsius
EJ exajoule
ft² square foot
GJ gigajoule
Gt gigatonne
GtCO₂ gigatonne of carbon dioxide
GW gigawatt
GWe gigawatt electrical
kgCO₂ kilogram of CO₂
kW kilowatt
MJ megajoule
Mt million tonnes
MWh megawatt hour
m² square metre
PJ petajoule
pkm passenger kilometre
yr year
Figure 1: CO₂ emission reduction potential by technology in the Reference Case and REmap, 2015–50����������������������������������������������������������������������������������������������������������������������������12
Figure 2: Overview of the methods used in this study ������������������������������������������������������������������������������� 20
Figure 3: Global TPES in the Reference Case and REmap, 2015–50 �������������������������������������������������������23
Figure 4: Contributors to energy intensity improvement rate, 2050 ������������������������������������������������������24
Figure 5: Contribution of RE/EE to the increase in the renewable energy share, expressed as percentage of TPES ���������������������������������������������������������������������������������������������������28
Figure 6: Contribution of RE/EE to the decrease in energy intensity, expressed in primary energy terms per unit of GDP ���������������������������������������������������������������� 30
Figure 7: TPES in the United States and China for different cases ����������������������������������������������������������33
Figure 8: Renewable energy as share of TPES for the various cases ������������������������������������������������������35
Figure 9: Annual energy intensity improvement rate for the various cases ���������������������������������������� 36
Figure 10: CO₂ emission reduction potential by technology in the Reference Case and REmap, 2015–50�������������������������������������������������������������������������������������������������������������������������� 38
Figure 11: CO₂ emissions in Japan and India for the various cases ���������������������������������������������������������� 39
Figure 12: Incremental system costs and the average cost of abatement by technology, 2050 ����������� 41
Figure 13: Cost supply curve for Germany �������������������������������������������������������������������������������������������������������42

WORKING PAPER 7
Figure 14: Incremental annual system costs and externalities of the REmap Case and REmap + EE Case (low and high estimate given for the savings of the externalities) ��������� 43
Figure 15: Overview of the method used in this study����������������������������������������������������������������������������������52
Figure 16: Contribution of sectors to the increase in the renewable energy as a share of TPES (%pt) (left pie chart) and TPES reduction (EJ/yr) (right pie chart), China ������������� 63
Figure 17: TPES and contribution to the decrease in energy intensity, China ��������������������������������������� 64
Figure 18: Contribution of RE/EE to the increase in the renewable energy share of the TFEC in the REmap + EE Case, China �������������������������������������������������������������������������������������������� 65
Figure 19: Contribution of RE/EE to the decrease in energy intensity in the REmap + EE Case, China ������������������������������������������������������������������������������������������������������������������� 66
Figure 20: CO₂ emissions for the various analysed cases, China ��������������������������������������������������������������� 66
Figure 21: Incremental annual system costs and externalities of the REmap and REmap + EE Cases, China ������������������������������������������������������������������������������������������������������������������67
Figure 22: Contribution of sectors to the increase in renewable energy as a share of TPES (%pt) (left pie chart) and TPES reduction (EJ/yr) (right pie chart), Germany ������������ 70
Figure 23: TPES and contribution to the decrease in energy intensity, Germany ��������������������������������� 71
Figure 24: Contribution of RE/EE to the increase in the renewable energy share of the TFEC in the REmap + EE Case, Germany ��������������������������������������������������������������������������������������72
Figure 25: Contribution of RE/EE to the decrease in energy intensity in the REmap + EE Case, Germany �������������������������������������������������������������������������������������������������������������73
Figure 26: CO₂ emissions for the various analysed cases, Germany ���������������������������������������������������������74
Figure 27: Incremental annual system costs and externalities of the REmap and REmap + EE Cases, Germany �����������������������������������������������������������������������������������������������������������75
Figure 28: Contribution of sectors to the increase in the renewable energy as a share of TPES (%pt) (left pie chart) and TPES reduction (EJ/yr) (right pie chart), India ����������������78
Figure 29: TPES and contribution to the decrease in energy intensity, India �����������������������������������������79
Figure 30: Contribution of RE/EE to the increase in the renewable energy share of the TFEC in the REmap + EE Case, India ��������������������������������������������������������������������������������������������� 80
Figure 31: Contribution of RE/EE to the decrease in energy intensity in the REmap + EE Case, India �������������������������������������������������������������������������������������������������������������������� 80
Figure 32: CO₂ emissions for the various analysed cases, India ����������������������������������������������������������������� 81
Figure 33: Incremental annual system costs and externalities of the REmap and REmap + EE Cases, India �������������������������������������������������������������������������������������������������������������������82

SYNERGIES8
Figure 34: Contribution of sectors to the increase in the renewable energy as a share of TPES (%pt) (left pie chart) and TPES reduction (EJ/yr) (right pie chart), Japan ������������� 85
Figure 35: TPES and contribution to the decrease in energy intensity, Japan �������������������������������������� 86
Figure 36: Contribution of RE/EE to the increase in the renewable energy share of the TFEC in the REmap + EE Case, Japan ��������������������������������������������������������������������������������������������87
Figure 37: Contribution of RE/EE to the decrease in energy intensity in the REmap 2030 + EE Case, Japan ������������������������������������������������������������������������������������������������������� 88
Figure 38: CO₂ emissions for the various analysed cases, Japan �������������������������������������������������������������� 88
Figure 39: Incremental annual system costs and externalities of the REmap and REmap + EE Cases, Japan ���������������������������������������������������������������������������������������������������������������� 89
Figure 40: Contribution of sectors to the increase in renewable energy as a share of TPES (%pt) (left pie chart) and TPES reduction (EJ/yr) (right pie chart), United States ��������������������� 92
Figure 41: TPES and contribution to the decrease in energy intensity, United States ������������������������ 92
Figure 42: Contribution of RE/EE to the increase in the renewable energy share of the TFEC in the REmap + EE Case, United States ���������������������������������������������������������������������� 94
Figure 43: Contribution of RE/EE to the decrease in energy intensity in the REmap + EE Case, United States ���������������������������������������������������������������������������������������������������� 94
Figure 44: CO₂ emissions for the various analysed cases, United States ������������������������������������������������ 95
Figure 45: Incremental annul energy system costs and externalities of the REmap 2030 and REmap 2030 + EE Cases, United States ��������������������������������������������������������������������������������������� 96
WORKING PAPER 9
TABLES
Table 1 Effect of RE/EE on energy intensity and renewable energy share in 2030 and associated costs and savings �������������������������������������������������������������������������������������������������������������13
Table 2: Effect of energy efficiency options in the REmap + EE Case on TPES and renewable energy as share of TPES in Germany �������������������������������������������������������������������������������������������� 26
Table 3: Effect of renewable power technologies in the REmap Case on TPES and renewable energy as a share of TPES in the power sector, Japan ������������������������������������������������������������ 29
Table 4: Incremental energy system costs of the REmap and REmap + EE Cases by sector, India, 2030 �������������������������������������������������������������������������������������������������������������������������������������������� 44
Table 5: Performance indicators used in this study �����������������������������������������������������������������������������������53
Table 6: Energy efficiency categories investigated in this study ����������������������������������������������������������� 54
Table 7: Key literature studies ��������������������������������������������������������������������������������������������������������������������������55
Table 8: Key economic input data �������������������������������������������������������������������������������������������������������������������55
Table 9: Techno-economic input data for the EE Options ������������������������������������������������������������������������57
Table 10: Renewable energy share and annual rate of improvement of energy intensity over the period 2010–30, China ���������������������������������������������������������������������������������������������������������������� 65
Table 11: Cost supply data for China ��������������������������������������������������������������������������������������������������������������� 68
Table 12: Renewable energy share and annual rate of improvement of energy intensity over the period 2010–30, Germany ����������������������������������������������������������������������������������������������������������72
Table 13: Cost supply data for Germany ���������������������������������������������������������������������������������������������������������76
Table 14: Renewable energy share and annual rate of improvement of energy intensity over the period 2010–30, India ������������������������������������������������������������������������������������������������������������������79
Table 15: Cost supply data for India����������������������������������������������������������������������������������������������������������������� 83
Table 16: Renewable energy share and annual rate of improvement of energy intensity over the period 2010–30, Japan �������������������������������������������������������������������������������������������������������������� 86
Table 17: Cost supply data for Japan ��������������������������������������������������������������������������������������������������������������90
Table 18: Renewable energy share and annual rate of improvement of energy intensity over the period 2010–30, United States ��������������������������������������������������������������������������������������������������93
Table 19: Cost supply data for the United States ����������������������������������������������������������������������������������������� 96
Table 20: Overview of results of the five studied countries ���������������������������������������������������������������������� 99

SYNERGIES10
Table 21: Energy efficiency approaches and instruments in the five studied countries �������������������101
Table 22: Key targets and policies, China ����������������������������������������������������������������������������������������������������� 104
Table 23: Feasibility of energy efficiency measures in the EE 2030 Case under current policy scheme, China ������������������������������������������������������������������������������������������������������������������������105
Table 24: Key targets and policies, Germany ����������������������������������������������������������������������������������������������� 107
Table 25: Feasibility of energy efficiency measures in the EE 2030 Case under current policy scheme, Germany ������������������������������������������������������������������������������������������������������������������108
Table 26: Climate and energy targets, key renewable energy and energy efficiency policies, India ����������������������������������������������������������������������������������������������������������������������������������������110
Table 27: Feasibility of energy efficiency measures in the EE 2030 Case under current policy schemes, India �������������������������������������������������������������������������������������������������������������������������� 111
Table 28: Key targets and policies, Japan ������������������������������������������������������������������������������������������������������ 113
Table 29: Feasibility of energy efficiency measures in the EE 2030 Case under current policy scheme, Japan ������������������������������������������������������������������������������������������������������������������������� 114
Table 30: Key targets and policies, United States ���������������������������������������������������������������������������������������� 117
Table 31: Feasibility of energy efficiency measures in the EE 2030 Case under current policy scheme, United States ����������������������������������������������������������������������������������������������������������� 119

WORKING PAPER 11
The Paris Agreement reflected an unprecedented international determination to act on climate change� The focus of climate change mitigation must be on the decarbonisation of the energy system, given that it accounts for almost two-thirds of greenhouse gas (GHG) emissions worldwide�
Global energy-related carbon dioxide (CO₂) emissions can be reduced by 70% by 2050 with a net positive economic outlook, according to the report “Perspectives for the Energy Transition: Investment Needs for a Low-Carbon Energy Transition”, jointly prepared by the International Renewable Energy Agency (IRENA) and the International Energy Agency (IEA) (IRENA and IEA, 2017)� The report, which was prepared to inform the energy and climate agenda of the 2017 German Presidency of the Group of Twenty (G20), shows that increased deployment of renewable energy and energy efficiency (RE/EE) in G20 countries and globally can achieve the emission reductions needed to limit global temperature rise to no more than 2°C� This would avoid the most severe impacts of climate change�
In realising the decarbonisation of the global energy system, renewables would account for about half of total emission reductions in 2050, with another 45% coming from increased energy efficiency and electrification� RE/EE work in synergy� When pursued together, they result in higher shares of renewable energy, a faster reduction in energy intensity, and a lower cost for the energy system� This synergy also has important environmental and societal benefits, such as lower levels of air pollution�
IRENA has explored this synergy under its REmap programme, a global roadmap to significantly increase the share of renewable energy by 2030 compared to today’s level of 19%, and to explore what this would mean for decarbonisation of the energy system in the longer term, to 2050, in line with the Paris Agreement� REmap also supports initiatives such as Sustainable Energy for All (SEforALL) and the 7th Sustainable Development Goal (SDG7), both of which call for a substantial increase in renewable energy, as well as a doubling of the rate of improvement in energy efficiency by 2030�
Achievement of these goals requires a greater understanding of the potential of RE/EE at the country, sector and technology levels� It also needs an energy system perspective that looks at the interlinkages between technologies and sectors�
This report starts with an overview of the latest insights from IRENA’s study, with a focus on the role of RE/EE in realising decarbonisation of the global energy system by 2050� Subsequently, it pays particular attention to the five largest energy-using countries of the G20, namely the People’s Republic of China, Germany, India, Japan and the United States, but narrows down the focus to a shorter term, to 2030� Together, these five countries represent two-thirds of the G20’s total primary energy supply (TPES), and around half of global energy demand�
Three primary cases are examined from 2010 (the base year of the analysis) to 2030: a business- as-usual case (the Reference Case, which examines change predicted under current national plans), an accelerated renewable uptake case (REmap), and a case that combines accelerated renewables with enhanced efficiency (REmap + EE)� In order to put all these scenarios into perspective, a Frozen Efficiency Case is also explored, with no change from today’s level of RE/EE�
Five conclusions can be drawn from the analysis in this report:
• RE/EE measures can potentially achieve 90% of the carbon reductions required to limit global temperature rise to a maximum of 2°C above pre-industrial levels with a 66% probability, in line with the Paris Agreement goals. The remaining 10% would be achieved by fossil fuel switching and carbon capture and storage (CCS)� A combined approach of RE/EE offers the most timely and feasible route to decarbonising the global energy system� Both renewable energy and energy efficiency offer roughly the same amount of mitigation potential to 2030, but only when working in synergy� Working in isolation, they do not achieve as beneficial results�
EXECUTIVE SUMMARY
SYNERGIES12
1 This is explored in a separate scenario in the Annex of this report, which looks at the technical potential of energy efficiency, called the
TECH Case.
• All countries can benefit from important synergies between renewable energy and energy efficiency. Greater renewable energy reduces the demand for energy, and greater energy efficiency results in higher shares of renewable energy� These synergies vary depending on demand growth, the structure of a country’s energy demand, local resource availability and climate conditions�
• The cost-competitiveness of technologies varies by country, but deployment of RE/EE technologies together results in overall savings to the energy system across all countries. When accounting for their effect on reducing external costs relating to human health and climate change, these savings are significantly higher� However, a better assessment of such externalities is needed, alongside a better understanding of how RE/EE result in reductions in the costs associated with adverse effects on human health and the environment�
• All countries have significant untapped and economically attractive RE/EE deployment potential, beyond that foreseen in national plans. While this study identifies the potential of measures to increase both the share of renewable
energy and the level of energy efficiency improvement, even greater potential to improve exists, particularly in energy efficiency� Countries need to start deploying the technologies identified in this study today, and to accelerate deployment as more efficient technologies emerge�
• A greater understanding is needed of which countries and regions require which additional technologies to meet global climate and sustainability targets. While the five major economies addressed in this study make up around half of global energy demand, the scope of countries and the depth of technology analysis should be expanded to allow global conclusions to be drawn�
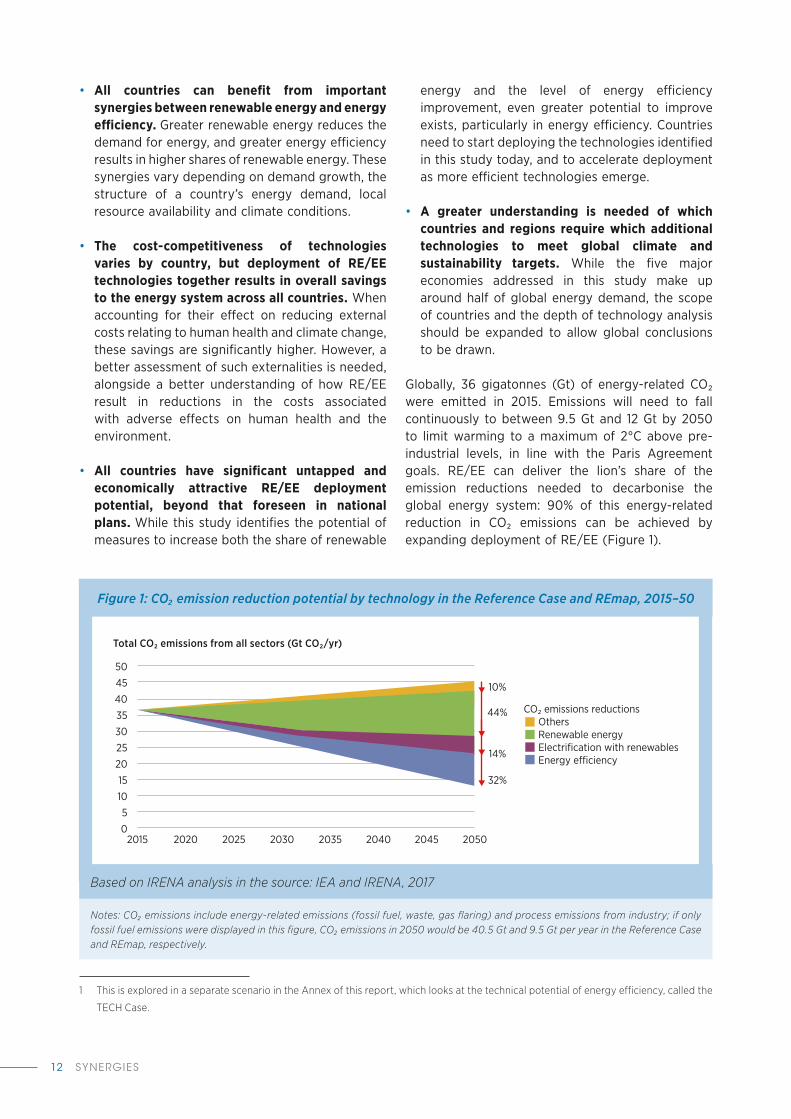
Globally, 36 gigatonnes (Gt) of energy-related CO₂ were emitted in 2015� Emissions will need to fall continuously to between 9�5 Gt and 12 Gt by 2050 to limit warming to a maximum of 2°C above pre-industrial levels, in line with the Paris Agreement goals� RE/EE can deliver the lion’s share of the emission reductions needed to decarbonise the global energy system: 90% of this energy-related reduction in CO₂ emissions can be achieved by expanding deployment of RE/EE (Figure 1)�
Figure 1: CO₂ emission reduction potential by technology in the Reference Case and REmap, 2015–50
Notes: CO₂ emissions include energy-related emissions (fossil fuel, waste, gas flaring) and process emissions from industry; if only fossil fuel emissions were displayed in this figure, CO₂ emissions in 2050 would be 40.5 Gt and 9.5 Gt per year in the Reference Case and REmap, respectively.
50
45
40
35
30
25
20
15
10
5
0
Total CO2 emissions from all sectors (Gt CO2/yr)
CO2 emissions reductionsOthersRenewable energyElectrification with renewablesEnergy e�ciency
2015 2020 2025 2030 2035 2040 2045 2050
10%
44%
14%
32%
Based on IRENA analysis in the source: IEA and IRENA, 2017

WORKING PAPER 13
This study shows that the combined deployment of RE/EE contributes significantly to a realistic, timely and affordable reduction pathway to meet global climate objectives� Their relative impact varies by country:
• Under the Reference Case, global CO₂ emissions increase by up to 10% between 2015 and 2030, with the increase being about 25% between 2015 and 2050� This growth varies by country: in developing countries they rise significantly, whereas in developed countries they stabilise or slightly decline�
• Significant potential exists to reduce CO₂ emissions by shifting to renewable energy, with fuel-switching to natural gas also an option as a transition fuel in certain applications� Additionally,
overall energy demand can be reduced through increased energy efficiency, which also yields decreases in emissions�
• The relative importance of these measures varies� In India and China, energy efficiency contributes by far the most to CO₂ emission reductions, as it results in slowing energy demand growth� Renewable energy technologies contribute the most to reductions in Germany, Japan and the United States�
• The largest CO₂ reductions are achieved in the power sector, followed by direct emissions from energy use in the buildings and transport sectors, in line with the current sectoral make-up of CO₂ emissions�
A more detailed look at the results for the year 2030 at the country level shows that all five countries covered in this study exhibit a strong synergy between energy efficiency and renewable energy (Table 1)� They all see either a strong reduction in energy intensity or growth in renewables’ share of energy consumption when efforts focused solely on either improving energy efficiency or increasing renewable energy are taken� The synergy comes into view when looking at the effect of energy efficiency measures on renewable energy share, or vice versa, meaning synergies exist at a technical level:
accelerated deployment of renewables can increase energy efficiency, while accelerated deployment of energy efficiency means energy demand is reduced so the same amount of renewable energy results in a higher share of renewables� In general, the effect that energy efficiency has on the share of renewables is greater than the effect renewables have on energy intensity� In three of the five countries, energy system costs are reduced due to this synergy, and in all five countries there are large cost savings as a result of this synergy when reduced externalities are accounted for�
In 2030 Energy intensity Renewable energy share Incremental system costs in 2030 for REmap + EE
synergy
Reduced externalities
resulting from REmap
and EE synergy
Reference Case With EE
With RE/EE (REmap
+ EE)
Reference Case With EE
With RE/EE (REmap
+ EE)
MJ/USD Renewables share of total final energy consumption
USD bln/yr in 2030
USD bln/yr in 2030
China 4�5 3�7 3�6 19�1% 28�1% 32�0% 198 −380
Germany 2�5 2�2 2�1 25�9% 35�6% 38�4% 1�2 −12�5
India 6�0 5�3 4�3 22�2% 25�9% 30�9% −106 −175
Japan 3�7 3�3 3�0 8�2% 15�5% 18�2% −30 −30
United States 4�5 4�1 3�9 9�0% 26�6% 30�0% −43 −225
Notes: EE refers to energy efficiency; REmap refers to the additional deployment of renewable energy option identified in the REmap study for the country; MJ = megajoule.
Table 1: Effect of RE/EE on energy intensity and renewable energy share in 2030 and associated costs and savings

SYNERGIES14
Greater deployment of RE/EE can create synergies in all sectors
This study examines the potential for greater RE/EE deployment across all sectors of the energy system, including the supply side power and district heat generation sectors, as well as the three main end-use sectors: buildings (residential and commercial), industry and transport� It finds that:
• More solar photovoltaic (PV), wind, geothermal, bioenergy and solar thermal can be deployed across all sectors in all countries than current plans outline�
• Energy efficiency can be improved in all sectors, especially by process and heat integration, efficient motor systems, industrial heat pumps, improved building envelopes, efficient lighting and appliances, heat pumps for heating and cooling, electric mobility, efficient gas power plants, and a shift from coal- to gas-fired power plants�
• Specific technologies are enablers for both energy efficiency and renewable energy, offering important RE/EE synergies in both the power and end-use sectors� On the end-use side, the electrification of energy services (such as passenger transport or cooking heat) results in higher efficiency, and at the same time enables deployment of renewable power� Electric vehicles (EVs) are two to three times as efficient as conventional gasoline and diesel cars� Heat pumps achieve efficiency four to five times higher than condensing gas boilers� On the supply side, most renewable energy technologies in the power sector result in lower primary energy demand� This is because in the power sector, power generation from many types of renewables are counted as having 100% efficiency in international energy statistics, as compared to fossil power plants that achieve 25–85% efficiency� This represents a significant improvement� The measured magnitude of this phenomenon can change depending on the primary energy accounting methodology�
• The contribution of various sectors to energy demand differs greatly between countries� Transport accounts for a large share of the Unites States energy demand, while China has the world’s largest industrial sector� In all countries, the power sector is of significant importance, and can contribute to both a greater renewable energy share and to energy efficiency improvements in TPES�
• Sector coupling (power, heat and mobility) has a large role to play in becoming an enabling solution for increased renewable energy deployment and is an area with significant potential for energy efficiency improvement� Electrification of end-use sectors results in greater power generation demand, which can be sourced from renewables� Electricity-based heating, cooling and transport technologies can also help to accommodate higher shares of variable renewable energy, as demand can be better synchronised with supply of power� Energy efficiency technologies in end-use sectors result in less power demand, meaning that the same capacity of renewables can cover a higher share of total demand�
• An energy system perspective – or system thinking – is necessary to achieve greater synergies, as the overall potential cannot be understood by studying sectors in isolation� Technology choices in one affect those in another, and no one technology offers a comprehensive solution to climate change� A long-term perspective is essential to achieving the dual goal of accelerating the renewable energy share and reducing energy intensity�
RE/EE cost less than the alternative
The cost-competitiveness of the technologies identified in this study varies by country, but RE/EE technologies result in cost savings across all countries when they are deployed together� Not only do consumers generally pay less for energy, but society also benefits due to a reduction in costs associated with the external effects of fossil fuels that result from air pollution and climate change� This study finds that:
• The cost-competitiveness of individual technologies depends on the cost of the incumbent fossil fuel prices, discount rates and other cost factors influenced by national circumstances�
• In general, energy efficiency technologies are found to result in savings: at least two out of three of them are cost-competitive across the five countries� Renewable energy technologies come with somewhat higher costs: between one-sixth and one-half of the technologies are found to be cost-effective in the REmap Case, depending on the country�

WORKING PAPER 15
2 Measured in primary energy terms (MJ) per unit of gross domestic product (GDP) in real 2010 USD at purchasing power parity (PPP).
Please see the Annex for further information on the method used to calculate primary energy and GDP.
• Total savings are higher when accounting for the external costs of fossil fuels (climate change, as well as the impact on human health and agricultural crops from air pollution)� It is important to look at external costs as well as energy system costs when assessing the cost-attractiveness of RE/EE�
RE/EE potential vary at country level
Important differences exist between developing countries (with rapidly growing energy demand) and countries with mature economies (which have shifted away from energy-intensive industries, or are in the process of doing so)� The study makes the following findings:
• To quantify the impact of existing policies on the future deployment of RE/EE technologies, it is necessary to understand how energy use would develop with no change in the deployment of technology� This is the purpose of the Frozen Efficiency Case, which has been developed for this report� Without any improvement in energy efficiency, total energy demand in developing countries would increase by three times between 2010 and 2030�
• Developing countries have a greater potential to implement energy efficiency technologies, as they typically have more energy-intensive industries, or use relatively less efficient energy technologies� In this study, developing countries’ energy intensity ranged from 7�5 to 9�0 MJ of primary energy per USD of gross domestic product (GDP) in 2010,² compared to between 4�2 and 6�8 MJ per USD of GDP in the developed economies�
• When additional energy efficiency options (EE) and renewable energy options (REmap) are deployed by 2030, the share of modern
renewable energy in TPES increases significantly in the selected countries – more so than when only renewable energy options are deployed� The magnitude of this increase depends on the starting point in the base year, resource potential and growth in energy demand�
• The selected countries in this study had a higher historical rate of improvement in average energy intensity in the period 1990–2010 than the global rate of 1�3% per year (all except Japan)� As a result, they do not double their rate of improvement in the period 2010–30� However, the objective of doubling the rate of improvement in energy intensity is a global one, not one measured at a country level�
• Doubling the annual rate of improvement in energy efficiency is a challenge for developed countries, even when their energy consumption per capita remains constant over time� Deep cuts in energy demand are only possible with significant renovation of the existing building stock and retirement of inefficient power generation and industry stock�
• The challenge of doubling the rate of improvement in energy efficiency is even greater for developing countries due to rapidly rising demand for energy� In the case of China and India, in the Reference Case this rising demand could result in a deterioration of current annual improvement rates�
• The results of the five countries in this study are not sufficient to determine the likelihood of meeting the global doubling objective� However, it is certain that the doubling of the global rate of improvement in energy intensity by 2030 will require major efforts in countries outside the scope of this study�

SYNERGIES16
RE/EE synergies are essential to decarbonise the global energy system
Greater efforts are being made to optimise RE / EE, but more work is needed to capitalise on the synergies identified in this study� This report identifies several key action areas to achieve this:
1� Develop smart and well-designed initiatives to realise the synergies of RE/EE technologies across and within all sectors of the energy system�
2� Accelerate the deployment of RE/EE technologies in the industrial and transport sectors, taking into account their wide diversity of energy use applications, technology deployment rate and availability of technologies�
3� Explore more ambitious technology solutions for buildings, including integrated RE/EE solutions, coupled with energy efficiency policies to avoid lock-in of emissions�
4� Plan for the period beyond 2030 to achieve long-term reductions in energy-related CO₂ emissions, incorporating a strategy to develop emerging technologies�
These action areas are detailed in greater depth in section and in the results for each country in the section Country policy recommendations, found in the Annex�

WORKING PAPER 17
3 For a discussion of this on the achievement of the energy efficiency targets within the policy framework of the European Union, see:
Harmsen et al. (2011).
1. INTRODUCTION
The Conference of the Parties (COP) to the United Nations Framework Convention on Climate Change (UNFCCC), at its 21st session in Paris in December 2015 (COP21), called for the transition to an energy system with net-zero carbon emissions by around 2050� This is a tremendous challenge, given increasing demand for energy services in many parts of the world� The carbon budget that is available with a limit on temperature rise of “well below 2°C” is the critical boundary, and any delay in deployment of low-carbon technologies is likely to result in this target being missed�
World leaders declared “access to affordable and clean energy for all” to be the 7th Sustainable Development Goal (SDG7) in the 2030 Agenda for Sustainable Development� The Sustainable Energy for All (SEforALL) initiative similarly focuses on doubling the share of renewable energy in the global mix of energy supply by 2030, while increasing and ensuring access to modern energy services to all people� The International Renewable Energy Agency (IRENA) has developed an action team under its Global Renewable Energy Roadmap (REmap) programme to explore the potential, costs and benefits of accelerating both renewable energy and energy efficiency (RE/EE), and to highlight the synergy between them�
Energy-related emissions represent two-thirds of all greenhouse gas (GHG) emissions� Immediate action is required to put the world on a pathway to net-zero emissions; countries need to embrace and implement policies to accelerate the energy transition starting today� Global energy-related carbon dioxide (CO₂) emissions can be reduced by 70% by 2050 with a net positive economic outlook, according to the report “Perspectives for the Energy Transition: Investment Needs for a Low-Carbon Energy Transition” (IRENA and IEA, 2017), jointly prepared by IRENA and the International Energy Agency (IEA)� The report, which was prepared to inform the energy and climate agenda of the 2017 German Presidency of the Group of 20 (G20), shows that increased deployment of RE/EE in G20 countries and globally can achieve the emission reductions needed to keep global
temperature rise to no more than 2°C� This would avoid the most severe impacts of climate change�
As demand for energy services grows (especially in developing countries), energy demand is likely to increase� Improving the efficiency of energy services can reduce the total amount of energy supply needed to meet this demand� Greater efficiency also makes it easier to achieve renewable energy targets, as less renewable energy capacity needs to be installed to achieve the same share of a smaller overall demand� Energy efficiency and renewable energy work hand in hand, as recognised by SEforALL (IEA and the World Bank, 2015), and play a crucial role in decarbonising the global energy system in line with the goals of the Paris Agreement� A better understanding of the synergies between them is needed to design smart policies, taking account of the following:
• Reducing energy demand through energy efficiency improvements will reduce overall energy demand, and can potentially reduce system costs and the investment in renewable energy capacity necessary to reach a given share of renewables in the overall supply mix�
• A more rapid switch to renewable energy sources may be enabled by shifting energy demand through energy-efficient technologies, towards increased electrification of energy services that are currently difficult to decarbonise (e� g� dispersed carbon sources such internal combustion in transport and heating of individual homes)�
• Many renewable energy technologies have higher efficiency than conventional sources� Increasing the share of these renewable energy technologies can therefore increase overall energy efficiency, and thus decrease total primary energy demand� Varying methods are used for calculating the primary energy equivalents of renewable energy sources; some methods may help countries achieve policy targets more easily, and contribute to a more rapid transition of the energy system�³

SYNERGIES18
IRENA is SEforALL’s hub for renewable energy, and supports the achievement of SDG7� Through its REmap programme, IRENA helps participating countries in the analysis and design of policies, as well as technology development, to achieve SEforALL’s objectives and the SDG7 targets� The REmap programme is also the basis for IRENA’s long-term energy and climate scenarios, which explore how the global energy system can be decarbonised�
To better understand the implications for policy making, a 2015 study by IRENA and the Copenhagen Centre on Energy Efficiency (C2E2) mapped the potential magnitude of the synergies between renewable energy and energy efficiency using a top-down approach (IRENA and C2E2, 2015)� It had the following findings:
• RE/EE technology options can provide synergies at both sector and country levels�
• The impact of synergies helps to:◦ realise higher shares of renewable energy;◦ accelerate energy efficiency improvement rates;
and◦ realise higher CO₂ emission reductions�
• The benefits of these synergies are higher than the incremental annual system costs that result from the use of those technologies�
• There are additional indicators beyond those considered by SEforALL to express progress in both renewable energy and energy efficiency, which can help to demonstrate these synergies�
While the 2015 study put forward the importance of the synergies in a quantitative way, the analysis was carried out based on a top-down approach, with limited focus on the cost of individual technologies, the dynamics within sectors or detail at a country level�
This report expands the analysis in a number of ways� The research focuses on the five largest G20 energy users: China, Germany, India, Japan and the United States� They represent two-thirds of the total primary energy supply (TPES) of the G20 and more than half of the total global supply� The five countries also represent differences in: the rate of development of energy services (e� g� slow vs� rapid growth); renewable energy supply; the potential for domestic renewable energy sources; and the policy environment�
The main findings of the analysis are discussed here, focusing on key results� Conclusions are drawn for policy makers� The details of the analysis are presented in the Annex, with the quantitative assessment of the potential for increased provision of RE/EE� For each country, a preliminary policy analysis evaluates whether policies are sufficient to achieve the available potential and utilise the identified synergies� Suggestions for both scientific and policy research are provided to deepen understanding of the potential offered by these synergies and the policies needed to realise them�
WORKING PAPER 19
An overview of the method used in this study is shown in Figure 2� The method is applied to five countries, all of which are members of IRENA and represent half of the effort required to double the global renewable energy share� In order to provide insight into different types of country, three developed and two rapidly developing countries were selected� Details of the method and results are presented in the Annex� The following points are important to consider while reading the findings of the study:
• Previous IRENA studies looked at the development of the renewable energy share of total final energy consumption (TFEC) between 2010 and 2030, in line with the methodology suggested by SEforALL (IEA and the World Bank, 2015)� This study focuses on the renewable energy share of TPES, as this gives a better overview of the synergies in the power sector and ensures that the renewable energy technology assessment is comparable with the energy efficiency analysis� In order to provide the reader with a complete picture, developments in the renewable energy share of TFEC can also be found in the Annex�
• All economic data are expressed in real 2010 USD�
• The Annex provides a detailed description of the results of the analysis for the five countries, as well as certain assumptions and data used�
• Five primary cases are presented here: namely base year 2010, Frozen Efficiency, Reference Case, REmap and REmap + EE� These are explained in Figure 2� In addition, a case is considered in which energy efficiency improvements take place in all segments of the economy� This goes beyond the potential achieved in the REmap + EE Case (which only includes energy efficiency measures that could be identified from a bottom-up technology perspective), and incudes the technical potential of energy efficiency measures� This so-called TECH Case covers additional energy efficiency measures in the total economy from a top-down perspective and is further described in the Annex� Finally, all improvements in energy efficiency that can arise from structural changes to the energy system (e� g� shifting from decentralised to centralised urban heating) are kept outside of the scope of this report� Fuel switching is analysed separately�
2. METHOD

SYNERGIES20
Figure 2: Overview of the methods used in this study
Notes: MJ = megajoule; yr = year.
Indicators – energy and emissions
Primary energy supply per sector.
CO₂ emissions per sector.
Renewable energy share of TPES.
Energy intensity of the economy (in MJ/USD).
Sectors: industry, transport, built environment, heating, and power.
Indicators – costs
Extra costs of additional RE/EE options compared to their conventional counterparts (in USD/yr per option).
Total additional system costs (in USD/yr).
Avoided external costs of climate change and air pollution (in USD/yr).
Feasibility of cases under current policy
Purpose: Insights into the capacity of current policy to facilitate additional measures on top of the Reference Case.
Method: Inventory of current RE/EE policies. Comparison of policy with policy requirements for additional measures.
Sources: REmap studies, databases, and literature.
2010 – Base year
Purpose: Shows the situation in the year 2010. Developments up to 2030 are compered with this base year.
Method: Collection of relevant statistical data for the year 2010.
Sources: REmap studies.
2030 – Frozen efficiency Case (baseline)
Purpose: This case shows how energy use and CO₂ emissions will develop without any implementation of RE/EE options.
Method: Extrapolation of 2010 data assuming no improvement in energy efficiency and based on assumptions with regard to population growth, GDP growth, and change in economic structure. In developed countries also the renewable energy share is kept constant.
Sources: REmap studies, literature, calculations in this study.
2030 – Reference Case (business-as-usual)
Purpose: This case shows how energy use and CO₂ emissions will develop taking into account current policy measures.
Method: Extrapolation of 2010 data based on assumptions with regard to population growth, GDP growth, and change in economic structure, and assessment of deployment of RE/EE options under current policies.
Sources: REmap studies.
2030 – REmap Case
Purpose: This case shows the energy system developments taking into account additional renewable energy options on top of the Reference Case.
Method: Identification of renewable energy options on top of Reference Case.
Sources: REmap studies.
2030 – REmap + EE Case
Purpose: This case shows the energy system developments taking into account additional energy efficiency options on top of the REmap Case.
Method: Identification of promising categories of energy efficiency measures including their costs and potentials.
Sources: REmap studies, literature, in-house expertise, calculations in this study.

WORKING PAPER 21
Box 1: Blurring the lines between renewables and efficiency
In a net-zero emission future, virtually all energy services should be provided without emissions� The huge number of small emission sources in the form of building heating systems presents a challenge in this future�
Heat pumps allow for a fourfold increase in the efficiency of providing heat (on a final energy basis), making electric heat pumps an energy-efficient alternative for domestic boilers� Heat pumps can use a renewable heat source (e� g� air, water, geothermal) and are therefore also classified as a renewable energy technology�
Electric heat pumps in combination with renewable power supply would allow for zero emission domestic heating, and are a key technology in the transition to a net-zero emission energy system� Various countries have developed policies to support the development and uptake of heat pumps�
In the transport sector the use of electricity also offers an important means for shifting its energy supply from fossil fuels with high carbon emissions to renewable electricity� Electric mobility, either in the form of EVs used for passenger and freight, or electrified trams, trains and other vehicles, can offer not just a low or zero carbon form of transport, but in the process also increase energy efficiency by two to four times for passenger or freight transport when paired with renewable power sources, such as solar or wind� This is due to the significant efficiency advantage of electric drives over internal combustion engines and the fact most renewable power sources do not require combustion, and so are highly efficient in primary energy terms�
Other technologies include building-integrated solar systems, such as thermal collectors and PV, which have higher efficiencies than fossil fuel systems and rely on renewable sources�
3. SYNERGIES
Technologies showing synergies between energy efficiency and renewable energy
Certain technologies enable technical, and often economical, synergies between energy efficiency and renewable energy� For example, electric heat pumps in buildings and industrial applications deliver the same energy service four times more efficiently than a conventional boiler� If the demand for electricity to run the heat pump motors is supplied by renewable power, such as solar
photovoltaic (PV) or wind, the efficiency gains in the overall system are even higher (see also Box 1)� Another example is electric mobility� Electric motors offer three to four times higher efficiency than internal combustion engines, so electric vehicles (EVs) can provide the same level of energy service (or activity such as passenger kilometres) using significantly less energy� Electrification of end-use energy services can be both a means for significant efficiency gains and also a means of increasing the amount of renewable power� Strategies that focus on harvesting these double benefits may result in cost-effective breakthroughs�
SYNERGIES22
Box 2: Electrification of end-use services offers opportunities for balancing
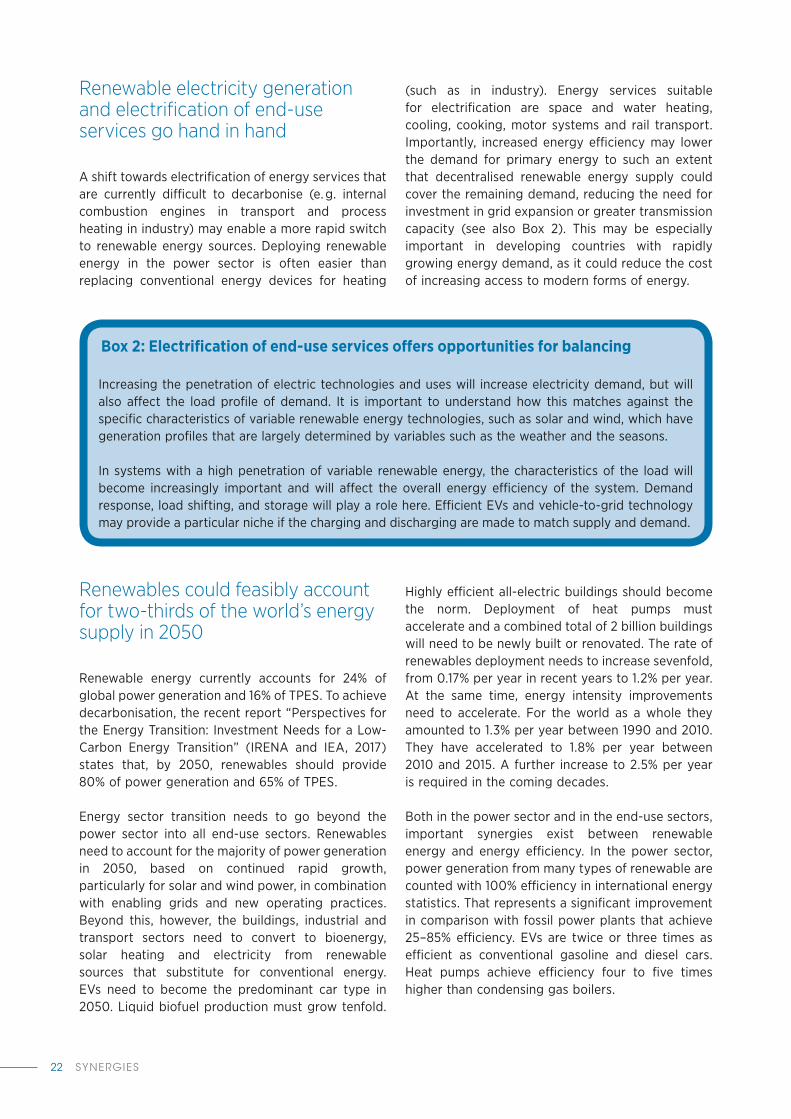
Increasing the penetration of electric technologies and uses will increase electricity demand, but will also affect the load profile of demand� It is important to understand how this matches against the specific characteristics of variable renewable energy technologies, such as solar and wind, which have generation profiles that are largely determined by variables such as the weather and the seasons�
In systems with a high penetration of variable renewable energy, the characteristics of the load will become increasingly important and will affect the overall energy efficiency of the system� Demand response, load shifting, and storage will play a role here� Efficient EVs and vehicle-to-grid technology may provide a particular niche if the charging and discharging are made to match supply and demand�
Renewable electricity generation and electrification of end-use services go hand in hand
A shift towards electrification of energy services that are currently difficult to decarbonise (e� g� internal combustion engines in transport and process heating in industry) may enable a more rapid switch to renewable energy sources� Deploying renewable energy in the power sector is often easier than replacing conventional energy devices for heating
(such as in industry)� Energy services suitable for electrification are space and water heating, cooling, cooking, motor systems and rail transport� Importantly, increased energy efficiency may lower the demand for primary energy to such an extent that decentralised renewable energy supply could cover the remaining demand, reducing the need for investment in grid expansion or greater transmission capacity (see also Box 2)� This may be especially important in developing countries with rapidly growing energy demand, as it could reduce the cost of increasing access to modern forms of energy�
Renewables could feasibly account for two-thirds of the world’s energy supply in 2050
Renewable energy currently accounts for 24% of global power generation and 16% of TPES� To achieve decarbonisation, the recent report “Perspectives for the Energy Transition: Investment Needs for a Low-Carbon Energy Transition” (IRENA and IEA, 2017) states that, by 2050, renewables should provide 80% of power generation and 65% of TPES�
Energy sector transition needs to go beyond the power sector into all end-use sectors� Renewables need to account for the majority of power generation in 2050, based on continued rapid growth, particularly for solar and wind power, in combination with enabling grids and new operating practices� Beyond this, however, the buildings, industrial and transport sectors need to convert to bioenergy, solar heating and electricity from renewable sources that substitute for conventional energy� EVs need to become the predominant car type in 2050� Liquid biofuel production must grow tenfold�
Highly efficient all-electric buildings should become the norm� Deployment of heat pumps must accelerate and a combined total of 2 billion buildings will need to be newly built or renovated� The rate of renewables deployment needs to increase sevenfold, from 0�17% per year in recent years to 1�2% per year� At the same time, energy intensity improvements need to accelerate� For the world as a whole they amounted to 1�3% per year between 1990 and 2010� They have accelerated to 1�8% per year between 2010 and 2015� A further increase to 2�5% per year is required in the coming decades�
Both in the power sector and in the end-use sectors, important synergies exist between renewable energy and energy efficiency� In the power sector, power generation from many types of renewable are counted with 100% efficiency in international energy statistics� That represents a significant improvement in comparison with fossil power plants that achieve 25–85% efficiency� EVs are twice or three times as efficient as conventional gasoline and diesel cars� Heat pumps achieve efficiency four to five times higher than condensing gas boilers�

WORKING PAPER 23
This means that synergies exist at a technical level: accelerated deployment of renewables can increase energy efficiency, while accelerated deployment of energy efficiency means energy demand is reduced, so the same amount of renewable energy results in renewables securing a higher share of energy supply�
Under REmap, total energy demand in 2050 would be similar to today’s level� But the supply mix would change substantially, compared to both today and to the Reference Case�
In the Reference Case, TPES is estimated to grow by more than 50% between 2015 and 2050� This is equivalent to average annual growth of about 1�2% per year, roughly half of the rate seen in the past two decades� Despite this slowdown, TPES would
increase to about 835 exajoules (EJ) by 2050 in the Reference Case� Just under 80% of this total would still be supplied by fossil fuels in 2050, down slightly from today’s level of 84%� Under current national energy plans, renewable energy would bring little change in the supply mix over this time frame, since those plans mainly reflect market trends�
Under REmap, the global TPES in 2050 would reach 635 EJ per year in 2050, only marginally higher than today’s level and 26% less than in the Reference Case� Total non-renewable energy use would be reduced by 67% to 180 EJ, compared to 560 EJ in the Reference Case� The share of renewable energy in TPES grows to about 65% by 2050 (Figure 3)�
Figure 3: Global TPES in the Reference Case and REmap, 2015–50
Notes: Data include the energy supply in the electricity generation, district heating/cooling, industrial, buildings and transport sectors; these sectors accounted for 85% of global TPES in 2015; non-energy use of fuels for the production of chemicals and polymers is excluded.
Total primary energy supply (EJ/yr)
Increase by 2050 undercurrent plans and policies
Decline by 2050 throughaccelerated uptake of renewables
800
700
600
500
400
300
200
100
02015 2030
Reference Case REmap2050 2030
Non-renewable Renewable
2050
84%
16%
80%
20%
24%
76%
60%
40%
65%
35%
+50%
−27%
Based on IRENA analysis in the source: IEA and IRENA, 2017

SYNERGIES24
While TPES under REmap remains more or less flat between 2015 and 2050, global gross domestic product (GDP) triples over this period� As a result, energy intensity drops from about 5 gigajoules (GJ) per USD to 2�1 GJ per USD between 2015 and 2050� This is equivalent to an energy intensity improvement rate of around 2�5% per year, a doubling compared to the trends observed between 1990 and 2010� In 2015 the improvement rate was 1�8%, which is still much lower than what is required to reach the 2050 goal�
Figure 4 shows the variables causing energy intensity to change in 2050 in the REmap Case compared to
the Reference Case� About half of the decline (53%) comes from energy efficiency improvements in heating� This is followed by accelerated deployment of renewables, which contributes around one-quarter of the improvement (with the largest contributor being electrification, as the electricity is considered to come from renewable sources)� On the other hand, carbon capture and storage (CCS) in industry requires heat for solvent regeneration as well as for compression and pumping of CO₂� These processes increase the primary energy demand by 6% in total therefore reducing energy intensity improvement�
Long-term perspective and policy required to avoid trade-offs between renewable energy and energy efficiency
Increased energy efficiency could reduce the business case for some renewable energy technologies� For example, reducing the heat demand in buildings (through better insulation and other measures) will affect the economics of technologies such as district heating� This is
typically more expensive at a smaller scale, as the same infrastructure costs (e� g� network and substations) have to be allocated to a lower amount of heat delivered� Moreover, the introduction of more energy-efficient equipment could lead to less need for renewable energy capacity to supply the reduced demand for electricity and heat� Therefore, system thinking and a long-term perspective are essential in the optimal selection of the technology mix, whilst meeting the dual goals of accelerating renewable energy share and energy intensity improvements�
Figure 4: The contribution of renewable energy to global energy intensity improvements in REmap, 2015–50
Renewable Energy
Energy E�ciency
24%
Heating/Fuels 4%
Power 4%
Electrification in transport 22%
Power for electrification & CCS −6%
76%
Heating/Fuels 53%
Power 22%
CCS penalty −1%
Structural changes 2%
Contributors to energy intensity reduction
Reference Caseimprovement rate in
energy intensity
REmapimprovement rate in
energy intensity
Incr
emen
tal
grow
th r
ate
0.7
%
2.5%
1.8%
Based on IRENA analysis in the source: IRENA, 2017b

WORKING PAPER 25
4 In this report, the assessment of end-use sectors of agriculture, fisheries, forestry and other small-scale sectors, which together account
for less than 5% of the total global final energy, are excluded.
5 For some countries additional energy efficiency categories were included as more specific data were available. For example, more
efficient cooling in the built environment was included for Japan and China, while best practice efficiency in dry process cement kilns
was included for China. In the United States and India, the category heat pumps in industry (India) and buildings (the United States) were
omitted due to a lack of sufficient reliable data.
6 Note that the energy savings potential of the REmap + EE Case is relatively small compared to other countries due to the highly
ambitious energy efficiency improvements assumed for the Reference Case, as mandated by the German government. This is especially
the case for the buildings and transport sectors.
In addition, policies may affect consumer choice� For example, policy decisions on net metering will affect the size of domestic PV systems that households install� Understanding the effects of policies on decision making as well as on the transition of the energy system is necessary� Attention to detail in policy design (in addition to policy evaluation) is necessary to ensure it does not negatively affect the transition to a net-zero emission energy system�
Energy efficiency technologies increase primary energy savings and the renewable energy share
Ten key energy efficiency categories were assessed for each of the selected countries, which apply to the three end-use sectors (industry, buildings and transport)⁴ and the power sector�
Table 2 gives an overview of the energy efficiency categories for Germany and identifies energy efficiency improvements that can be implemented over and above those in the Reference Case by 2030� The analysed energy efficiency categories are roughly similar for all five countries�⁵ Note that this study focuses on technologies to supply the same energy services as identified in the Reference Case� Reducing or shifting some energy services (see Box 3) may provide additional energy savings and would allow for further introduction of renewable energy (e� g� shifting from decentralised to centralised urban heating systems), but is excluded from this analysis�
The energy efficiency categories reduce total energy demand for energy services, which increases the share of renewable energy in TPES� The greatest energy efficiency improvement in Germany is achieved in the industrial and power sectors, in which, respectively, high-efficiency motor systems and switching from coal- to gas-based power plants are the main contributors to the TPES savings (see Table 2)� Overall, the energy efficiency categories reduce TPES by 8�6%, and increase the renewable energy share in the power sector by 3�7%, from 37�9% in the REmap Case to 41�6% in the REmap + EE Case�⁶
In all five countries, the energy efficiency categories with the greatest potential are similar� After high-efficiency motor systems in industry and fuel switching in the power sector, the largest reductions to TPES come from improved building envelopes and heat pumps in industry and buildings�

SYNERGIES26
Type of energy saved
Contribution to TPES savings
(% compared to Reference Case
by 2030)a
Renewable energy share increase
(in %ptb compared to Reference Case by
2030)a
INDUSTRYCross-cutting: Pumps, compressors, motors and fans
Electricity 1�9% 0�8%pt
Cross-cutting: Heat and process integration
Natural gas 1�1% 0�5%pt
Heat pumps Natural gas 1�6% 0�7%ptBUILDINGSBuilding envelope Natural gas 0�5% 0�2%ptLighting Electricity 0�3% 0�1%ptAppliances Electricity 0�3% 0�1%ptHeat pumps Natural gas 0�0%c 0�0%ptc
TRANSPORTFurther penetration EVsd Gasoline 0�1% 0�1%ptPOWERHigher-efficiency NGCC plant Natural gas 0�1% 0�0%ptSwitch from coal to gas power plantse Coal 2�7% 1�1%ptTOTAL 8�6% 3�7%pt
Table 2: Effect of energy efficiency options in the REmap + EE Case on TPES and renewable energy as share of TPES in Germany
Notes: NGCC = natural gas combined cycle; a Some values are zero owing to rounding. Additions in renewable energy share and TPES savings are for the energy system and not
for individual sectors; b %pt refers to the increase in renewable energy share percentage point, i.e. an increase in, for example, the renewable energy share
from 6% to 7% would be an increase of 1%pt;c The additional deployment potential of heat pumps in the buildings sector on top of the reference developments is rather low,
as the Reference Case by 2030 already assumes a far-reaching penetration of heat pumps under the current policy scheme;d Battery and hybrid EVs are assumed to be deployed both as a renewable energy option and as an energy efficiency option.
The former is included in the REmap Case, while both are included in the REmap + EE Case. EVs deployed as a renewable energy option are powered by renewables. This car fleet does not, however, represent the full technical potential of EVs. The remaining potential is deployed as an energy efficiency option, powered by fossil fuel-based electricity;
e Due to the higher conversion efficiency of natural gas power plants compared to coal power, this switch results in a lower level of fuel demand for the same amount of electricity. The result is lower overall primary energy demand, and a subsequent increase in the energy efficiency improvement rate. Having lower primary energy demand also has a positive effect on the renewable energy share, which, due to the same amount of renewable energy being present as primary energy, results in an increase in the renewable energy share.

WORKING PAPER 27
Figure 5 illustrates how the different sectors in the United States and India contribute to the renewable energy share, starting with the renewable share in 2010 on the left-hand side, and ending with the renewable share according to the REmap + EE Case on the right-hand side� These contributions include both renewable energy capacity and energy efficiency improvements expected under existing country plans, and the additional potential identified by the REmap + EE Case�
In both countries, the power sector accounts for around 55% of the increase in the renewable energy share� Of this contribution, more than 50% comes from power technologies, largely wind turbines
(both onshore and offshore) and solar PV systems� The remaining part comes from more efficient gas-fired power stations, and the replacement of coal with natural gas� Note that in both the power and end-use sectors, efficiency improvements contribute between 30% and over 50% to the increase in renewable energy share, which emphasises their crucial role� Efficiency improvements in buildings have a particularly large impact, with a contribution of 76% and 59% in the United States and India, respectively� In principle, efficiency improvements in buildings can result in net-zero energy use, with the little remaining energy demand sourced from renewables� This is why energy savings in buildings are imperative�
Box 3: Sources of energy savings excluded from this study
This study focuses on two sources of energy savings� The first group aims to install similar but more efficient technology to reduce the amount of energy required to provide products and services� For example, installing light-emitting diode (LED) lamps reduces the amount of electricity required to produce the same level of illumination compared with using traditional light bulbs� The second focus of attention is the shift to a completely different technology type to deliver the same service� For example, conventional natural gas boilers can be replaced by electric air-to-air heat pumps, leading to substantial energy savings, as the latter have a much higher efficiency (up to 400%) than boilers ( 95%)�
Another source of energy efficiency improvements is structural economic change, such as the shift from an industrial economy to a more service-oriented economy� In this study, this type of efficiency improvement is included in the Frozen Efficiency Case�
Lastly, energy savings can be achieved through modal shifts in transport, which involves the (partial) switch to a less energy-intensive means of transport; for example, using a bicycle instead of a motorised vehicle, or using a train for freight transport rather than a lorry� In the United States, truck-to-rail modal shift has great potential, because trucks are the dominant mode of freight transport, while rail serves many of the same routes and uses considerably less energy (NREL, 2013)� For urban areas in Europe, an estimated 42% of all motorised trips to move passengers and goods could potentially be shifted to bicycle transport (Cyclelogistics, 2014)� For trips beyond cities, high-speed long-distance trains can substitute planes� Governments can stimulate modal shift by offering a strong public transport infrastructure, encouraging walking and cycling, and offering financial incentives� Transport modal shift is beyond the scope of this study� Nevertheless, as it can result in large energy savings (IPCC, 2007), more research is required to quantify its potential�

SYNERGIES28
Renewable energy technologies increase the efficiency of the power and end-use sectors
Renewable energy technologies often result in lower TPES� The reason is that according to the primary energy accounting method employed by the IEA, they have an efficiency that is higher than that of the non-renewable technologies they replace (see Box 4)� This accounting method uses efficiencies of 100% for many renewable energy technologies, such as hydro, wind and solar PV, resulting in significant efficiency gains compared to conventional power plants, such as coal-fired power production (48% efficiency in 2030)� Primary energy consumption levels could therefore vary based on
the accounting method used to calculate primary energy equivalents for certain types of renewable energy, e� g� solar and wind�
Table 3 demonstrates the impact of renewables on the TPES and renewable energy share in the Japanese power sector in the REmap Case� Renewable power technologies reduce the TPES of the power sector by 6�5%, while they increase the renewable energy share of the sector by 5%pt, from 22% in the Reference Case to 27% in REmap� Solar PV and wind energy contribute most to the TPES savings and renewable share increases, not only because of their large installed capacities, but also due to their high efficiencies relative to the replaced conventional power source (coal-fired power generation)�
Notes: The left side of the graph shows the renewable energy share in the base year 2010, the right side the share in 2030 in the REmap + EE Case; note that EVs are included as both a renewable option and an energy efficiency option (see also note d of Table 2).
Figure 5: Contribution of RE/EE to the increase in the renewable energy share, expressed as percentage of TPES
In the United States, a country with low expected future growth in energy demand, one-third of the increase in the renewable energy share can be attributed to energy efficiency options. In India, a country with high growth in energy demand, energy efficiency options can be responsible for half the increase in the renewable energy share.
Renewable energy share (% TPES)
Renewable energy share (% TPES)
United States
India
7%
20102030
(REmap + EE Case)
20102030
(REmap + EE Case)
11% 15%
Renewable energy: 18%pt Energy e�ciency: 8%pt
Industry – renewables
Buildings – renewables
Transport – renewables
Power – renewables
Heat – renewables
Industry – energy e�ciency
Buildings – energy e�ciency
Transport – energy e�ciency
Power – energy e�ciency
Heat – energy e�ciencyRenewable energy: 13%pt Energy e�ciency: 12%pt
19% 23% 27% 31% 35%
8% 12% 16% 20% 24% 28% 32% 36%

WORKING PAPER 29
Figure 6 shows how the different sectors in the United States and India contribute to the improvement in energy intensity with RE/EE technologies, starting with the energy intensity in year 2010 on the right-hand side, and ending with the energy intensity of the REmap + EE Case on the left-hand side� The sector contributions include both renewable energy capacity and energy efficiency improvements�
Efficiency options play the key role in improving the energy intensity of the various sectors� In the United States, energy intensity reductions are partly due to autonomous changes in the country’s economic structure (as foreseen by the country’s national energy plan represented by the Reference Case), which is expected to see fewer energy-intensive activities over the coming decades particularly in the industrial sector�
Notes: GW = gigawatt; a The negative contribution to TPES savings is because biomass and geothermal have lower efficiencies than the conventional fossil
technology (e. g. coal-fired power generation) they replace; b Some values are zero owing to rounding.
Installed capacity
(GW)
Contribution to energy demand savings (in %)
compared to Reference Case by 2030a
Renewable energy share increase (in %pt) compared to Reference Case by 2030b
Hydro (small) 0�4 0�1% 0�1%ptWind onshore 17�8 0�9% 1�5%ptWind offshore 9�2 0�7% 1�2%pt
Solar PV (residential/commercial) 23�1 1�4% 1�4%ptSolar PV (utility) 91�9 3�4% 0�6%ptBiomass steam cycle 0�7 −0�1% 0�2%ptGeothermal 0�1 −0�2% 0�0%ptTidal, wave, ocean 1�5 0�2% 0�2%ptTotal 145 6.5% 5.0%pt
Box 4: Accounting of primary energy supply
Different accounting measures can be used to arrive at primary energy equivalents for renewables and nuclear, including the physical energy content method (used by the IEA and the Statistical Office of the European Union, EUROSTAT) and the substitution method (used by the United States Energy Information Administration)� The physical energy content method, which is used in this report, counts biofuel and renewable energy sources (e� g� wind, solar PV, hydropower) in primary energy as they appear in the form of secondary energy (i�e� using a 100% efficiency to convert them into primary energy equivalents), whereas geothermal, concentrated solar power (CSP) and nuclear electricity are counted using average process efficiencies (e� g� 10–33%) to convert them into primary energy equivalents� By contrast, in the substitution method renewable electricity is converted into primary energy using the average efficiency of the fossil fuel power which otherwise would have been required to produce these quantities� The TPES differs depending on the method, as does the renewable energy share�
Table 3: Effect of renewable power technologies in the REmap Case on TPES and renewable energy as a share of TPES in the power sector, Japan

SYNERGIES30
7 Increase in electric mobility in the transport sector has a large impact on the sector’s energy intensity, while it is hardly affected by
additional biofuel uptake. India shows a higher deployment of electric mobility in the REmap Case than the United States, thus explaining
the higher contribution of renewables to energy efficiency improvement in India’s transport sector than in the United States transport
sector, which is mainly geared towards biofuel expansion.
By comparison, energy-intensive industries are expected to continue to dominate the value added of India’s manufacturing sector, and therefore the country will see little change in its economic structure (see Figure 6)� The power and buildings sectors account for the largest share of improvements achieved in India’s energy intensity� The contribution of renewable energy to the energy intensity reduction varies strongly by sector, from a small impact in transport (for biofuels)⁷ to 75%
in the power sector of the United States� Unlike their effect in the industrial and transport sectors, renewable energy technologies significantly increase the power sector’s efficiency, with a large impact on energy intensity� For this reason, electrification of the end-use sectors through electric cooking, heat pumps and electric mobility is relevant to increasing the overall efficiency of the energy system, since a bioenergy-fired energy device can even reduce the system’s efficiency�
Figure 6: Contribution of RE/EE to the decrease in energy intensity, expressed in primary energy terms per unit of GDP
Notes: The right side of the graph shows the energy intensity in the base year 2010, the left side the energy intensity in 2030 in the REmap + EE Case; note also that EVs are included as both a renewable energy option and an energy efficiency option (see note d of Table 2).
Energy intensity (MJ/USD) United States
India
3.5
20102030
(REmap + EE Case)
Energy intensity (MJ/USD)
20102030
(REmap + EE Case)
4 4.5
Renewable e�ciency: 1.2 Renewableenergy: 0.5
Industry – renewables
Structural sectoral changes
Buildings – renewables
Transport – renewables
Power – renewables
Heat – renewables
Industry – energy e�ciency
Buildings – energy e�ciency
Transport – energy e�ciency
Power – energy e�ciency
Heat – energy e�ciency
5 5.5 6 6.5 7 7.5
4 4.5 5 5.5 6 6.5 7 7.5 8 8.5
Energy e�ciency: 2.4 Renewableenergy: 1.2
Renewable energy deployment has a synergistic effect on energy intensity. Of the total improvement in energy intensity, around 20–30% is due to renewables. This is similar in all countries studied, and the contribution is not affected by the growth of energy demand in a country.

WORKING PAPER 31
Synergies from sector coupling will become increasingly important
As countries move to even higher shares of renewable power, grid and sector coupling options will become increasingly important� This includes the electrification of the end-use sectors, in which surplus electricity from variable renewables can be used for transport, industry and heating buildings� At the same time, synergies can be exploited for accommodating higher shares of variable renewables in the power system� This also works the other way around: efficiency measures in end-use sectors result in less demand for electricity� The overall effect on the renewable energy share and efficiency of the power sector depends on whether the type of additional and substituted electricity is sourced from renewables or fossil fuels� Next to the electrification of end-use sectors, there are several other opportunities for sector coupling that should be considered in maximising the benefits of deploying RE/EE technologies:
• Lower heating demand in the buildings sector results in a lower amount of primary energy required in the heating sector�
• Waste heat from the industrial and power sectors can be utilised in the buildings sector for heating purposes�
• Battery EVs can be used to cope with the variability of the supply of renewable power� Flexible charging of batteries provides a (partial) solution to the intermittent character of decentralised solar PV and lowers the need for (fossil-based) electricity from the grid�
It is necessary to take an energy systems perspective to fully understand the potential of sector coupling� System thinking is essential to enabling the optimal selection of the technology mix, whilst meeting the dual goal of accelerating the renewable energy share and energy intensity improvements� It is also necessary to understand the interlinkages between the various sectors and technologies, and to increase system reliability and flexibility�
Energy efficiency is key to achieving high renewable energy shares in cities
Today, more than half of the global population lives in urban areas� This share is expecting to grow over the coming decades� Urban energy use per capita (for commercial energy carriers) is also growing due to continued economic growth, especially in developing countries� This makes cities high-density centres of energy demand, providing unique challenges to increasing the share of renewable energy in the energy supply mix�
An estimated 60% of energy use by buildings and transport takes place in cities� Based on IRENA’s recent estimates (2016a), urban energy use is likely to grow from 139 EJ in 2014 to between 153 EJ and 234 EJ by 2030� Key factors determining urban energy use are population density, climate and income levels� The main end-uses are electric appliances, transport, heating and cooling� In the future, the demand for transport and appliances is expected to outstrip growth in the other end-uses� While this excludes industrial energy demand, industry and cities are linked in developing energy solutions for urban areas�
An estimated 80% of urban energy use is currently supplied by fossil fuels� The high density of energy demand in cities provides a challenge for renewable energy supply, which is typically characterised by low energy densities, i�e� requiring relatively large surface areas to supply a given amount of energy� While renewable energy generation can be integrated into modern building design (e� g� rooftop and facade solar energy, micro wind turbines), this will not be sufficient to reach high levels of renewable energy use in urban areas� Reductions in urban energy demand are necessary to achieve higher renewable energy shares� These reductions can be achieved by low or zero energy buildings for different climate zones (see Box 5) and by urban planning (e� g� to reduce the reliance on energy-intensive modes of transport and reduce the urban heat island effect)�

SYNERGIES32
This study included improvements in the building envelope to reduce energy demand in buildings, and efficient appliances and lighting to reduce electricity demand� In various countries, reductions in per-capita energy use have been observed� Harnessing and enhancing this with new policies and tools is necessary to further reduce energy demand� Cities around the world are initiating experiments and policies to help reduce urban energy use, reduce GHG emissions, increase the share of renewables,
and improve public transport, while simultaneously improving air quality and the health of their citizens� Some cities go well beyond national policies and targets and are considered leaders in addressing climate change� Given the growing importance of urban energy use around the world, urban and local governments should be encouraged to actively and aggressively reduce energy demand to help realise the renewable energy goals as set forth by SEforALL�
Box 5: Zero energy buildings in Japan and “nearly zero energy buildings” in EuropeIn Japan, the government has announced the ambition for more than half of newly built homes to be zero energy homes by 2020� This includes criteria on efficient ventilation, a 20% higher level of energy efficiency compared to an ordinary home, and an on-site renewable energy system� By 2030, all new private buildings should be net-zero energy in Japan, while all new public buildings are to be net-zero energy from 2020 onwards� In Europe, private buildings should be nearly zero energy from 2020 onwards�

WORKING PAPER 33
4. COUNTRY FINDINGS
Opportunities and potential for synergies depend on national circumstances
Several key factors determine the contribution of RE/EE deployment to savings in energy use and, subsequently, CO₂ emission reductions� They include population growth, standard of living, demand for energy and material services (saturation vs� unmet demand), economic structure and development (industrialisation vs� shifting to a service economy), and endowment of readily available renewable energy sources (with current technology)� Economic growth typically makes the challenge for developing countries greater than for developed countries, in particular for energy efficiency improvements�
Developed countries have mature economies with relatively low economic growth, slowly growing (e� g� the United States) or even declining population (e� g� most countries in Europe), and industries that are shifting away from energy-intensive manufacturing sectors� Developing countries vary with respect to population growth (from low in China to high in India), but in general have rapid economic growth and rising standards of living� This combination of factors results in a growing energy-intensive industrial sector (e� g� India), and hence rapid increase in energy consumption� It is not possible to meet this rising energy demand with renewables alone, making energy efficiency a key element in any strategy to increase the renewable energy share�
Figure 7: TPES in the United States and China for different cases
Industry – renewables
Buildings – renewables
Transport – renewables
Power – renewables
Heat – renewables
China
−33%
−5% −21%
38.277.23
14.4819.86
103.38
24.95
37.23
41.43
80.15
17.3713.2325.11
75.35
16.4110.7624.97
60.60
12.769.2522.37
2010
Froz
en E�
cienc
y
Referen
ce C
ase
REmap
REmap +
EE
250
200
150
100
50
0
TPES (EJ/yr)TPES (EJ/yr) United States125
100
−17%
−8% −16%
7538.81
27.26
10.21
12.55
45.27
36.02
12.22
18.85
40.21
26.20
9.43
17.29
36.59
25.46
8.07
15.69
36.84
24.55
2.0114.53
50
25
0
2010
Froz
en E�
cienc
y
Referen
ce C
ase
REmap
REmap +
EE
For large energy consumers such as China and the United States, primary energy supply will be around one-fifth lower with additional renewable energy and energy efficiency options, in comparison to the path set by current plans and policies.
SYNERGIES34
Developed versus developing countries: the example of the United States and China
Figure 7 depicts the TPES for a developed country (the United States) and a developing country (China) and shows the differences in the (required) contribution of energy efficiency and renewable energy�
Figure 7 also depicts four cases of technology deployment� From left to right, the first bar represents the TPES in the year 2010, while the next bar depicts the indicative TPES in 2030 if economic growth was met with the same levels of efficiency in the supply of energy services as in 2010 (Frozen Efficiency) (see also Box 6)� The Reference Case shows that with current policies in place, energy efficiency improvements and shifts in energy sources will result in changes in energy demand� The REmap Case in the next bar reflects the TPES when additional renewables technologies are deployed on top of today’s existing policies (the potential of these technologies was identified in the REmap country reports for the China, India and the United States undertaken by IRENA (2014; 2015a; 2015b; 2017a)� The final bar depicts a case which realises the additional potential for energy efficiency improvement, as estimated in this study (REmap + EE)�
As Figure 7 demonstrates, while China realises large improvements in its energy efficiency under existing policy (compare the Frozen Efficiency Case with the Reference Case where a 33% improvement in overall efficiency is estimated), the anticipated growth in
energy services will still result in a net growth of primary energy demand� In contrast, changes in the economic structure and improved energy efficiency in the United States will result in only a very small growth in energy demand over the period 2010 to 2030� If the United States implemented further renewables options as identified in the REmap study, it would result in a reduction in net primary energy supply of 8 EJ/yr, or an 8% reduction compared to the Reference Case by 2030, due to the high efficiency of renewables such as solar PV and wind energy� By implementing the REmap and EE options together, a further reduction in primary energy use of 8% could be realised�
This total potential shift would therefore result not only in a large reduction in primary energy demand, but also in significant reductions in CO₂ emissions� The results for China demonstrate a similar trend for the different cases, but overall energy use would still increase if identified opportunities for energy efficiency and renewable energy supply were achieved� Realising the potential of RE/EE technologies and measures identified in the REmap + EE Case would result in a 21% reduction of TPES by 2030 (i�e� net savings of 30 EJ/yr) compared to the Reference Case� However, this still represents the supply of 27 EJ more energy per year higher than in 2010� This shows how the strongly increasing demand for energy services in developing countries makes it more challenging to achieve the SEforALL targets, unless the country is endowed with large and easily accessible renewable energy resources (e� g� hydropower)�
Box 6: “Frozen” EfficiencyThe Frozen Efficiency Case only reflects the impact of changes in economic structure on energy use, and excludes changes in energy efficiency or energy sources� Hence, it assumes that the efficiency of energy use and generation is similar to the base year 2010, while the economic structure is based on the assumed economy in 2030� As such, the Frozen Efficiency Case is helpful in evaluating the impact of energy policies or other autonomous improvements on total energy use� These policies and improvements are taken into account in the Reference Case in this study�

WORKING PAPER 35
Ambition in Reference Case differs considerably by country
Figure 8 depicts the share of renewable energy supply in TPES in the selected countries for the various cases�⁸ In developing countries, the share of renewable energy in the Reference Case will not increase rapidly due to the growth in demand� In India, the share of renewable energy will even
decline, as soaring energy demand is likely to be met mainly with coal-fired power generation� Among the developed countries, Germany will double the share of renewable energy if it follows its current policies, while Japan and the United States have more modest goals� Germany has an ambitious national energy plan, both with respect to deployment of renewable energy and improvements in energy efficiency (see Figure 8)�
Role of RE/EE varies by country
Figure 8 shows that most of the analysed countries can double their renewable energy share by 2030 relative to 2010� The exception is India, which sees significantly higher growth in energy demand by 2030� The results of REmap for Japan and the United States suggest significant untapped potential to accelerate renewable energy deployment, while additional efficiency improvements would increase the share of renewable energy even further�
Considerable differences exist between the developing countries, explained by the national circumstances of each country� If China realised its renewable energy potential according to the REmap Case, it could double its renewable energy share and achieve this even more easily if the identified potential of additional energy efficiency measures were deployed� As China is already close to peak production of key energy-intensive commodities (especially cement and steel), future energy demand growth is expected to slow� Assertive
8 Note that Figure 8 expresses the share of renewable energy on the basis of TPES. The type of renewable energy source and accounting
rules may result in differences between TPES and total final energy as a basis for the goal evaluation.
Figure 8: Renewable energy as share of TPES for the various cases
Notes: Traditional uses of bioenergy are excluded from the figure; the decline in renewable energy share in India is due to the significant growth in overall energy demand in the country in the Reference Case, and because most of this growth will be met with fossil fuels.
0%Germany
2010 Reference Case 2030 REmap 2030 REmap + EE 2030
USA Japan China India
5%
10%
15%
20%
25%
30%
35%
40%
45%
Renewable energy share in TPES (%)
Increasing energy efficiency not only lowers energy intensity, it also boosts the renewable energy share by 10–15% across the countries studied.

SYNERGIES36
energy efficiency policies are needed to achieve historical levels of energy efficiency improvement, and a more aggressive roll-out of renewable energy technologies is required to increase its rate of energy intensity improvement (see Figure 9)�
In India, where energy demand in industry and other sectors is assumed to increase rapidly, it is virtually impossible to increase the share of renewable energy in the TPES� A decline is observed according to the Reference Case� The REmap + EE Case, however, does not include all the potential for energy efficiency improvement assumed to exist across all sectors in India� New approaches will be needed to offset the planned increase in energy demand, and to improve the sustainability of the energy system�
In rural areas, new studies for selected developing countries show that distributed renewable energy generation is economically more attractive than grid expansion alone (Zeyringer et al�, 2015)� In combination with advanced energy efficiency technologies, such a strategy might allow rapidly developing countries to achieve significant shares
of renewable energy� For developing countries experiencing a combination of rapid industrialisation and urbanisation, their contribution to the SEforALL targets will be a major challenge� Increased attention to energy efficiency is an important way to increase the share of renewable energy in these countries�
SEforALL aims to double the global rate of improvement in energy intensity by 2030� When comparing energy intensity improvement rates in the REmap + EE Case with historical rates (measured over the 1990–2010 period), none of the five countries achieves a doubling except for Japan (see Figure 9)� This is mainly because of the relatively low efficiency improvements realised in Japan over the period 1990–2010� In China and India, energy efficiency improvement rates decrease in the Reference Case and REmap Case� Germany sees a rapid acceleration of its energy intensity improvement rate in the 2010– 30 Reference Case due to strong policy support� The results show that efficiency measures typically increase the annual energy intensity improvement rate more than renewables�
Figure 9: Annual energy intensity improvement rate for the various cases
Note: Historical values taken from IEA (2010) and the World Bank (2015), Sustainable Energy for All 2015 – Progress Toward Sustainable Energy.
Germany
1990–2010
Annual energy intensity improvements (%/yr)
0%
1%
2%
3%
4%
5%
2010–30 Referance Case 2010–30 REmap 2010–30 REmap + EE
United States Japan China India
Increased renewable energy deployment will also increase the rate of energy efficiency improvement by around one-fifth on average. For India, accelerated uptake of renewables could boost the rate of efficiency improvement by as much as two-thirds.
WORKING PAPER 37
5. CLIMATE CHANGE – BENEFITS OF AN INTEGRATED RE/EE APPROACH
The Paris Agreement reflected an unprecedented international determination to act on climate change� Many countries submitted their Intended Nationally Determined Contributions (INDCs) ahead of the 2015 climate summit in Paris and, as of January 2017, 117 have communicated their first Nationally Determined Contributions (NDCs) pursuant to the Paris Agreement� NDCs contain the country pledges to reduce CO₂ emissions, as per the objectives of the Paris Agreement and the UNFCCC� The focus must be on the decarbonisation of the global energy system, as it accounts for almost two-thirds of GHG emissions�
Global energy-related CO₂ emissions can be reduced by 70% by 2050 with a net positive economic outlook, according to the joint IRENA/IEA report “Perspectives for the Energy Transition: Investment Needs for a Low-Carbon Energy Transition” (IRENA and IEA, 2017)� Increased deployment of RE/EE in G20 countries and globally can achieve the emission reductions needed to keep global temperature rise to no more than 2°C, avoiding the most severe impacts of climate change�
Globally, 36 gigatonnes (Gt) of energy-related CO₂ were emitted in 2015� Emissions will need to fall continuously to 9�5–12 Gt by 2050 to limit warming to no more than 2°C above pre-industrial temperatures (see Figure 10)� RE/EE will deliver the lion’s share of the emission reductions needed to decarbonise the global energy system: 90% of this reduction in energy-related CO₂ emissions can be achieved through expanding renewable energy
deployment and improving energy efficiency� This is equivalent to the potential emission reductions offered by a doubling of the global share of renewable energy, highlighting once more that energy efficiency and renewable energy are two sides of the same coin�
Energy and materials efficiency improvements can reduce emissions by about 4 Gt by 2030, approximately 30% of the emission reductions needed� Electrification provides another 1�5 Gt, or 10% of what is needed� Renewable energy options that were identified based on the bottom-up analysis of the G20 countries can reduce emissions by another 10 Gt� As a result of these measures, emissions would fall to 25�5 Gt in 2030 (with the remaining fossil fuel combustion emitting about 20 Gt of CO₂ (GtCO₂) emissions per year)�
This is sufficient to put the world on a 2°C pathway in 2030� But to keep the world on this pathway, efforts need to be strengthened further between 2030 and 2050� This would require energy-related CO₂ emissions to drop to below 10 Gt by 2050, which would be 70% lower than 2015 levels and 31�5 Gt less than in the Reference Case� About half of these reductions would come from renewable energy technologies� Energy efficiency improvements and electrification would account for the bulk of the other half� The remaining 10% of reductions would come from additional measures in industry, notably CCS, material efficiency improvements and structural changes�

SYNERGIES38
Figure 11 shows what can be achieved in India and Japan with an accelerated uptake of RE/EE� CO₂ emissions in India rise compared to 2010, even in the REmap + EE Case, due to the projected tripling of its absolute GDP and related energy use over the period 2010–30� Japan shows a reduction even in the Reference Case by 2030� Relative to 2010, Japan can reduce its CO₂ emissions by 41%, while India can limit its emission increase by around 50% according to the REmap 2003 + EE Case� Figure 11 shows that in both countries energy efficiency is responsible for around two-thirds of the CO₂ emission reductions in the REmap + EE Case, while renewables account for one-third� Both India and Japan show that the majority of CO₂ emission reductions (50–66%) come from the power sector, mainly due to the substitution of coal-based power generation with renewables and gas-fired power plants� The CO₂ emission reductions depend strongly on
the non-renewable energy source that is replaced: the more carbon-intensive the substituted fuel, for instance coal, the higher the CO₂ emission reductions will be�
The first NDC efforts of India and Japan are partially included in the REmap + EE Case, but not all of them� Japan will have to do little to meet its 2020 GHG emission target of a 3�8% reduction compared to 2005 levels – however, the target is not particularly ambitious (Climate Action Tracker, 2016)� India aims to reduce its emission intensity by 33–35% by 2030 compared to 2005 levels (ibid�), which translates to a maximum CO₂ emission level of 3�8–4�0 Gt/yr in 2030� This is a reduction of 1�5–1�7 Gt/yr relative to the Reference Case by 2030� This target can only be achieved with a combination of RE/EE technologies�
Figure 10: CO₂ emission reduction potential by technology in the Reference Case and REmap, 2015–50
Notes: CO₂ emissions include energy-related emissions (fossil fuel, waste, gas flaring) and process emissions from industry; if only fossil fuel emissions were displayed in this figure, CO₂ emissions in 2050 would be 40.5 Gt and 9.5 Gt per year in the Reference Case and REmap, respectively.
50
45
40
35
30
25
20
15
10
5
0
Total CO2 emissions from all sectors (Gt CO2/yr)
Others Renewable energy Electrification with renewables Energy e�ciency
CO2 emissions reductions
2015 2020 2025 2030 2035 2040 2045 2050
10%
44%
14%
32%
Based on IRENA analysis in the source: IEA and IRENA, 2017
A combined portfolio of RE/EE technologies is required to achieve the deep CO₂ emission reductions necessary to meet the global target of well below 2°C temperature rise.

WORKING PAPER 39
Figure 11: CO₂ emissions in Japan and India for the various cases
Notes: CO₂ emissions include energy-related emissions (fossil fuel, waste, gas flaring) and process emissions from industry; if only fossil fuel emissions were displayed in this figure, CO₂ emissions in 2050 would be 40.5 Gt and 9.5 Gt per year in the Reference Case and REmap, respectively.
Industry – renewables
OtherBuildings – renewables
Transport – renewables
Power – renewables
Heat – renewables
India
−11%
−17% −46%
0.36
0.870.170.080.47
1.15
0.48
0.220.110.63
3.23
0.97
0.430.19
1.35
2.68
0.86
0.430.32
1.19
2.17
0.72
0.220.32
1.13
1.13
0.190.180.90
2010
2014
Froz
en E�
cienc
y
Referen
ce C
ase
REmap
REmap +
EE
CO2 emissions (Gt/yr)CO2 emissions (Gt/yr) Japan
1.8
1.6
1.4
−17%
−11% −33%1.2
1.0 0.46
0.17
0.26
0.17
0.38
0.17
0.25
0.44
0.17
0.37
0.16
0.27
0.49
0.19
0.42
0.14
0.22
0.36
0.17
0.38
0.12
0.21
0.31
0.11
0.37
0.09
0.21
0.15
0.090.29
0.8
0.6
0.4
0.2
0.0
7
6
5
4
3
2
1
0
2010
2014
Froz
en E�
cienc
y
Referen
ce C
ase
REmap
REmap +
EE
Renewables and energy efficiency will both be crucial to achieving sufficient reductions in CO₂ emissions. Options to scale up renewables and improve efficiency faster could reduce emissions by around one-third to one-half, compared to current plans and policies.

SYNERGIES40
6. COSTS AND BENEFITS
The costs of decarbonisation are small compared to the improvement in human welfare through reduced externalities
The economic case for the energy transition has never been stronger� Today around the world, renewable power plants are being built that will generate electricity at a lower cost than fossil-fuelled power plants� And through to 2050, decarbonisation can create more new jobs in renewables and energy efficiency than those lost in fossil fuel sectors�
While the overall energy investment needed for decarbonising the energy sector is substantial – an additional USD 29 trillion until 2050 – it amounts to a small share of global GDP (0�4%)� Furthermore, IRENA’s macroeconomic analysis suggests that such investment creates a stimulus that, together with other pro-growth policies, will:
• boost global GDP by 0�8% in 2050
• generate new jobs in the renewable energy sector that would more than offset job losses in the fossil fuel industry, with further jobs being created by energy efficiency activities
• improve human welfare through important additional environmental and health benefits thanks to reduced air pollution�
In economic terms, consideration of the synergies between energy efficiency and renewable energy can reduce the cost of emission mitigation�
A dramatic reduction in carbon emissions is not possible without significant additional spending� As noted above, additional investment needs on average amount to USD 0�83 trillion per year between 2015 and 2050�
When these investments are annualised, and any additional operation and maintenance costs of individual low-carbon technologies are included, the portfolio of technologies identified in REmap requires incremental system costs on top of the Reference Case that amount to USD 1�8 trillion per year by 2050 globally� This assumes a crude oil price of USD 80 per barrel and a discount rate of 10%� In the REmap analysis, CO₂ emissions are reduced by about 31�5 Gt per year in 2050 compared to the Reference Case� This translates to a cost of USD 60 per tonne of CO₂ emissions eliminated�
It is necessary to put these costs in the context of the total CO₂ emissions that would be avoided in 2050� This is indicated by the diamonds in Figure 12 that show the average cost of abatement for each technology� The most expensive technology is CCS for industry, where the abatement cost is USD 120 per tonne of CO₂� Energy efficiency measures, by comparison, have much lower costs: around USD 35 per tonne of CO₂� Abatement costs of electrification (excluding any investments associated with charging infrastructure) and renewable energy are estimated at USD 22 and USD 75 per tonne of CO₂, respectively�

WORKING PAPER 41
For the five selected countries, a total of around 60 renewable energy and 13 energy efficiency categories have been identified� Average substitution costs vary among RE/EE categories, depending on their performance, costs and energy prices� Despite significant technology learning that has and will continue to result in lower capital costs, some of the RE/EE technologies will continue to be more expensive than their non-renewable counterparts by 2030�
Each option has a different impact on the renewable energy share� Both can be plotted in a cost supply curve to gain insight into how the potential of the technologies and costs interrelate� Here, the cost supply curve plots the average incremental system costs of substitution of each option on the y-axis, beginning with the lowest cost, and plots the relevant renewable energy share along the x-axis� But costs should not be viewed entirely from a technology perspective, going from least cost to highest cost� For one, the substitution cost does not factor in cost savings that result from reduced externalities� Certain higher-cost technologies may substitute for conventional technologies that are particularly polluting, resulting in higher external
cost savings� This study also shows that in order to achieve deep reductions in CO₂ and significant increases in RE/EE, action will be required across a range of technologies and sectors�
Figure 13 shows the cost supply curve for Germany� The curve starts with the Reference Case at 28% renewable energy share, and increases by 14%pt to 42% with the introduction of RE/EE technologies according to the REmap + EE Case� The REmap options contribute 10%pt to the renewable energy share increase, while energy efficiency accounts for the other 4%pt� Negative substitution costs indicate a saving relative to the non-renewable counterpart, whereas a positive cost indicates additional costs� Over half of the RE/EE categories are cost-competitive without considering externalities, dominated by energy efficiency technologies� The specific cost of the energy efficiency categories ranges from USD −9�6 billion/yr to USD 8�6 billion/yr per percentage point increase in renewable energy share�
Figure 12: Incremental system costs and the average cost of abatement by technology, 2050
Renewableenergy
Energye�ciency
Electrification Other TotalCSS
BarsIncremental system costs in 2050(USD billion/yr)
DiamondsAverage costs of abatement in 2050
(USD/t CO2)
0
200
400
600
800
1 000
1 200
1 400
1 600
1 800
2 000
0
20
40
60
80
100
120
140
160
180
200
Energy efficiency technologies tend to be more cost-competitive than renewable energy options, but both are required to realise long-term climate change mitigation goals.
Based on IRENA analysis in the source: IEA and IRENA, 2017

SYNERGIES42
Most energy effi ciency categories are on the left side of the supply curve, implying that these options are cheaper than most renewables� Energy effi ciency technologies in buildings are particularly cost-eff ective, although heat pumps in buildings and the shift from coal- to gas-fi red power plants are two exceptions� These are more expensive
mainly because of the unfavourable ratios between electricity and natural gas prices, as well as natural gas and coal prices� In the four other countries studied, heat pumps in buildings show costs that are negative (the United States, China and India) or slightly above zero (Japan)�
Costs for energy effi ciency technologies are often negative and those for renewables can be negative� The combination of the two cuts total energy system costs signifi cantly – in other words, deploying RE/EE results in considerable cost savings for the energy system as a whole� When including the avoided external costs of air pollution and climate change (indicated by the CO₂ emission savings), savings are even higher� Yet in practice even the negative cost options may not be realised due to barriers that limit uptake by stakeholders, which may include high upfront costs, integration costs or organisational barriers�
Figure 14 shows the incremental annual energy system costs and externalities of the REmap Case and REmap + EE Case for India� Incremental annual system costs are the sum of the costs of
all technologies that are both more expensive and save money compared to fossil fuels� Costs related to technologies implemented in theReference Case are not included, as these developments are assumed to take place in any case� REmap results in a slight incremental system cost increase of USD 0�3 billion annually by 2030 (not easily visible in the fi gure as the amount is so small)� By adding EE options, incremental annual system costs fall to USD −105 billion, equivalent to nearly 1% of India’s GDP in 2030, because energy effi ciency measures show lower costs on average than renewables� Over 90% of the cost savings are related to the power and buildings sectors, with wind energy, solar PV and energy savings in water heating contributing the most�
Figure 13: Cost supply curve for Germany
Costs for energy effi ciency technologies are typically negative and costs for renewables are partly negative – the combination cuts total energy system costs signifi cantly.

WORKING PAPER 43
The drop in fossil fuel use (especially coal) resulting from the deployment of renewables and higher system efficiency reduces the external costs of climate change and air pollution considerably� The cost savings from reduced externalities range from between USD −18 billion and USD −70 billion¹⁰ as a result of higher deployment of renewables, with most of that related to climate change (social cost of
carbon)� Cost savings related to externalities increase by a factor of four when implementing the additional efficiency measures, resulting in a reduction of external costs of USD −72 billion to USD −280 billion� When these reduced external costs are combined with the savings that result from lower energy system costs of USD −105 billion, total savings are USD −390 billion for the REmap + EE Case�
The costs also vary by sector, depending on the mix of RE/EE options substituted� In general, buildings show the lowest costs� In all five countries, deploying energy efficiency measures on top of renewable energy technologies lowers the system costs for industry, buildings and transport (see Table 4 for India)� While the industrial sector displays positive
costs in the REmap Case, its incremental annual system costs become negative with the EE options that include options such as further industrial process and heat integration, replacement of inefficient motors with modern ones, and installation of industrial heat pumps�
10 A low and high estimation was given for the external costs related to climate change and air pollution. For climate change a social cost
of carbon of USD 17 (low) and USD 80 (high) per tonne CO₂ is used.
Figure 14: Incremental annual system costs and externalities of the REmap Case and REmap + EE Case (low and high estimate given for the savings of the externalities)
Incremental annual system costs and savings (bln USD/yr)
−300
Direct costs
CO2 emissions
Human health
−250
−200
−150
−100
−50
0
50
Direct costs
CO2 emissions
Human health
Costs
Low
REmap
High Low
REmap + EE
High
Costs SavingsSavings
India
The costs of adding RE/EE technologies vary by country and are sometimes less than other energy options. In all cases, savings on health and environmental externalities significantly outweigh the costs.
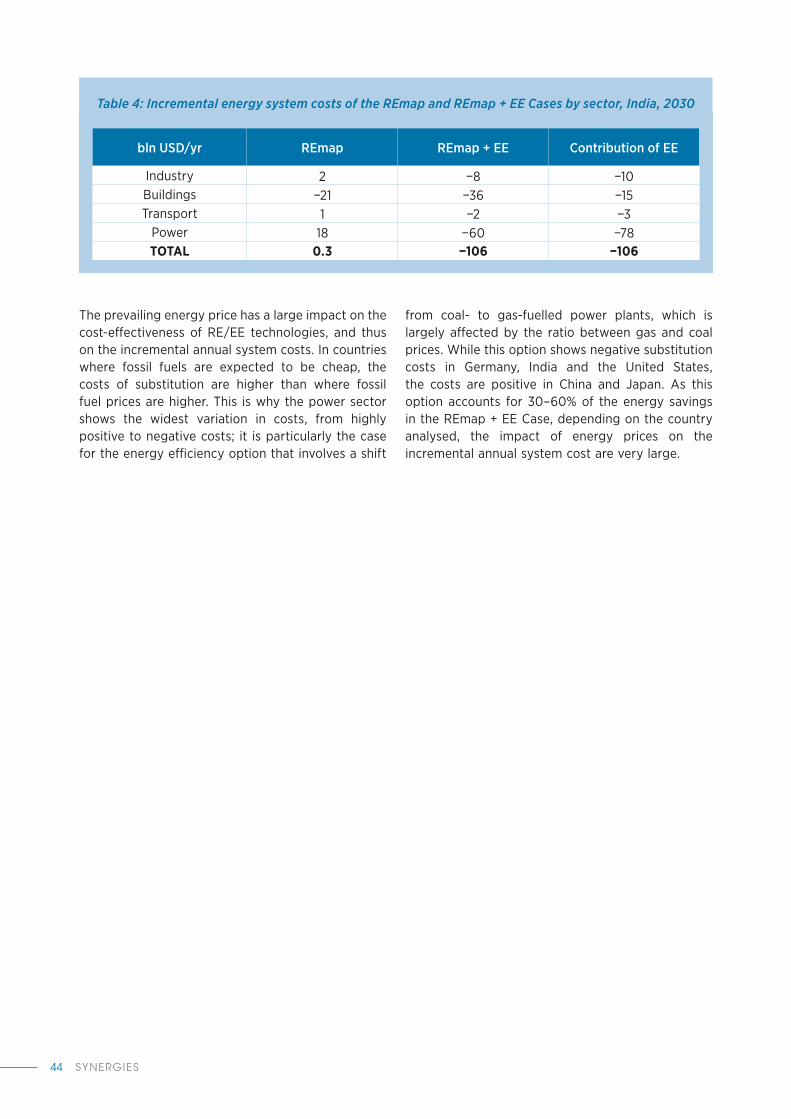
SYNERGIES44
The prevailing energy price has a large impact on the cost-effectiveness of RE/EE technologies, and thus on the incremental annual system costs� In countries where fossil fuels are expected to be cheap, the costs of substitution are higher than where fossil fuel prices are higher� This is why the power sector shows the widest variation in costs, from highly positive to negative costs; it is particularly the case for the energy efficiency option that involves a shift
from coal- to gas-fuelled power plants, which is largely affected by the ratio between gas and coal prices� While this option shows negative substitution costs in Germany, India and the United States, the costs are positive in China and Japan� As this option accounts for 30–60% of the energy savings in the REmap + EE Case, depending on the country analysed, the impact of energy prices on the incremental annual system cost are very large�
bln USD/yr REmap REmap + EE Contribution of EE
Industry 2 −8 −10Buildings −21 −36 −15Transport 1 −2 −3
Power 18 −60 −78TOTAL 0.3 −106 −106
Table 4: Incremental energy system costs of the REmap and REmap + EE Cases by sector, India, 2030

WORKING PAPER 45
7. DEVELOPING AN ACTION AGENDA
The systemic benefits of combining a deep reduction in energy use and the deployment of renewable energy technologies can not only achieve GHG emission reductions in line with long-term goals, but can also do so cost-effectively� This is especially true if all other benefits are considered� Ancillary environmental and broad macroeconomic benefits may be generated that go beyond energy or climate gains, e� g� considerable reductions in air pollution, resulting in improved public health� Also, in the majority of countries and sectors analysed, RE/EE reduce energy system or sector costs� Therefore, accelerated RE/EE deployment is not just better for governments who take a more societal view, but is also better for energy consumers�
The findings of this study point to the need for governments to consider adopting the following actions to take advantage of the multiple benefits afforded by the RE/EE synergies:
Develop smart and well-designed initiatives to realise the synergies of RE/EE technologies across and within all sectors of the energy system.
The level of policy ambition to increase energy efficiency and deploy renewable energy technologies varies between countries and does not reflect their full potential� In general, policies are insufficient to meet the ambitious targets associated with the SEforALL goals (see Annex for details)� A smart combination of efforts is needed to exploit the synergies of RE/EE�
Pricing GHG emissions is an essential element of efforts to promote both renewable energy and energy efficiency� This measure also provides flexibility in the way the targets are achieved, leading to cost-effective transition pathways� Other approaches – e� g� education and information dissemination, efficiency (or CO₂) standards for buildings, automobiles, lighting, and appliances – should play a key role in all countries� Heat pumps and EVs allow for electrification of space heating and transport, and can replace distributed small
emission sources with renewable energy sources, either locally or centrally generated�
The deployment of renewable energy in the power sector has a positive impact on both the renewable energy share and energy intensity� All five countries in this study already have a renewable energy programme that addresses the power sector� Feed-in tariffs are commonly applied, although instruments vary and can be further developed to improve cost-effectiveness through market-based mechanisms (such as auctions or portfolio standards)� All efforts need to be intensified; renewable energy technologies in the power sector are evolving rapidly, and costs may decrease further� Attention should be paid to interconnections and back-up systems, to integrate high levels of intermittent renewables in power systems�
Accelerate the deployment of RE/EE technologies in the industrial and transport sectors, taking into account their wide diversity of energy use applications, technology deployment rates and available technologies.An increased focus on energy efficiency in industry and transport is needed in every country� Globally, these sectors represent over 60% of primary energy demand� In all five countries studied, additional policies would be needed to realise the energy efficiency potential identified in the REmap + EE Case�
Switching to electric modes of transport (e� g� electric public transport, EVs) is key to success, as well as moving to vehicles with lighter, more aerodynamic designs� So far this is only supported in a few countries, with mixed success�
Policies are also needed to realise the potential for renewables and efficiency gains in industry� These should account for a wide variety of specific circumstances and opportunities� Lessons can be learned from individual policies in various countries, and these approaches can be combined to increase effectiveness�

SYNERGIES46
Explore more ambitious technology solutions for buildings, including integrated RE/EE solutions, coupled with energy efficiency policies to avoid lock-in of emissions.
As urbanisation increases, cities will play a growing role in achieving energy and climate goals� Cities often control local energy efficiency standards for buildings, and can make large gains with existing technology�
Urban planning is essential to reduce energy use in buildings and transport� Integrated approaches are needed to reduce energy use in individual buildings, combined with self-generation from renewable energy sources� Current technology can achieve zero emissions (and is improving), and smart combinations are cost-effective from a societal perspective� Efforts need to emphasise overall building energy performance, bearing in mind the long-term targets of net-zero energy buildings with zero emissions� This is important given the long lifetime of buildings and long lead times in construction and in the renovation of existing buildings�
Plan for the period beyond 2030 to achieve long-term reductions in energy-related CO₂ emissions, incorporating a strategy to develop emerging technologies.
International climate goals require that global GHG emissions reach net zero in 2050, or earlier� Beyond 2050, “negative” emissions may be needed� This study shows that a combination of RE/EE can contribute significantly to CO₂ emission reductions by 2030� But there is also a need to look further ahead and to incorporate the requirements of longer-term challenges�
Development plans need to avoid locking in long-term emissions that would exceed the carbon budget� This is especially important in the construction of new buildings, power plants and factories, and in large-scale renovation projects� This risk is reduced when energy efficiency and decentralised renewable energy generation are combined�
Research and development (R&D) and innovation will play a major role in improving the long-term performance of technologies (both economically and technically), and in reorganising the energy system� R&D can improve the cost-effectiveness of existing energy-efficient technologies (e� g� heat pumps, EVs, zero energy buildings)� Long-term targets can only be met with the development of new and emerging technologies�

WORKING PAPER 47
REFERENCES
ACEEE (2016), The 2016 ACEEE International Energy Efficiency Scorecard, American Council for an Energy-Efficient Economy, Washington, DC�
BMUB (2014), The German Government’s Climate Action Programme 2020 (Cabinet decision of 3 December 2014), Federal Ministry for the Environment, Nature Conservation, Building and Nuclear Safety (BMUB), Berlin, www�bmub�bund�de/fileadmin/Daten_BMU/Pools/Broschueren/aktionsprogramm_klimaschutz_2020_broschuere_en_bf�pdf�
BMWi (2014), A Good Bit of Work – Making More out of Energy: National Action Plan on Energy Efficiency, Federal Ministry for Economic Affairs and Energy (BMWi), Berlin�
BWT (2014), Entwicklung der Energiemärkte – Energiereferenzprognose (Endbericht), Projekt Nr� 57/12 Studie im Auftrag des Bundesministeriums für Wirtschaft und Technologie, Prognos AG, Energiewirtschaftliches Institut an der Universität zu Köln, Gesellschaft für Wirtschaftliche Strukturforschung GmbH, Basel/Cologne, Osnabrück�
Climate Action Tracker (2016), Climate Analytics, Ecofys, NewClimate Institute, Berlin, http://climateactiontracker�org/countries�html (accessed 1 November 2016)�
CNREC (2012), Key Information at a Glance: China 12th Five-Year Plan for Renewable Energy Development (2011–2015), China National Renewable Energy Centre, China National Energy Administration, Beijing�
CRS (2013), Renewable Fuel Standard (RFS): Overview and Issues, Congressional Research Service, Washington, DC�
CycleLogistics (2014), CycleLogistics – Moving Europe Forward: Potential to Shift Goods Transport from Cars to Bicycles in European Cities (authors: K� Reiter and S� Wrighton), cyclelogistics�eu�
DSIRE (2016), Database of State Incentives for Renewables & Energy Efficiency, US Department of Energy, NC Clean Energy Technology Center, NC State University, www�dsireusa�org/ (accessed 1 November 2016)�
ECB (2016), Statistical Data Warehouse, European Central Bank, Frankfurt am Main, http://sdw�ecb�europa�eu/quickview�do?SERIES_KEY=120�EXR�A�USD�EUR�SP00�A&periodSortOrder=ASC (accessed 1 November 2016)�
Ecofys (2009), Role and Potential of Renewable Energy and Energy Efficiency for Global Energy Supply Several energy efficiency reports for industry, buildings and transport, Vol� Climate Change 18/2009, Ecofys�
Fraunhofer/Öko-Institut (2016), Climate Protection Scenario 2050, Summary of Second Final Report, study conducted on behalf of the German Federal Ministry for the Environment, Nature Conservation, Building and Nuclear Safety, Fraunhofer ISI, Karlsruhe, Öko-Institut e� V�, Berlin�
Global Tracking Framework (2012), Global tracking framework, Sustainable energy for all, the World Bank, Washington D�C�
Harmsen, R� et al� (2011), “The unrecognized contribution of renewable energy to Europe’s energy savings target”, Energy Policy, Vol� 39, Elsevier, pp� 3425–3433�

SYNERGIES48
Heinrich Böll Foundation (2016), The German Energiewende, http://energytransition�de/ (accessed 1 November 2016)�
ICCT (2016), “White paper: Sustaining electric vehicle market growth in US cities” (authors: N� Lutsey, P� Slowik and J Lingzhi), International Council on Clean Transportation, Washington, DC�
IEA (International Energy Agency) (2016), World Energy Outlook 2016, OECD/IEA, Paris�
IEA (2014), Energy Technology Perspectives 2014, OECD/IEA, Paris�
IEA (2012), World Energy Outlook 2012, OECD/IEA, Paris�
IEA (2011), Energy-Efficiency Policy Opportunities for Electric Motor-Driven Systems, OECD/IEA, Paris�
IEA (2010), Energy Balances of non-OECD Countries, 2010 edition, OECD/IEA, Paris�
IEA and the World Bank (2015), Sustainable Energy for All 2015 – Progress Toward Sustainable Energy, World Bank, Washington, DC, doi: 10�1596/978-1-4648-0690-2, License: Creative Commons Attribution CC BY 3�0 IGO�
IEEJ (2011), Electricity Saving Potential and Cost and Benefit of LED Lighting in Japan (authors: S� Suehiro and Y� Shibata), Institute of Energy Economics Japan, https://eneken�ieej�or�jp/data/3985�pdf (accessed 1 November 2016)�
IHS (2016a), The IHS European Power Capital Costs Index, Information Handling Services Markit Ltd, London, www�ihs�com/info/cera/ihsindexes/index�html (accessed 1 November 2016)�
IHS (2016b), The IHS North American Power Capital Costs Index, Information Handling Services Markit Ltd, London, www�ihs�com/info/cera/ihsindexes/index�html (accessed 1 November 2016)�
IPCC (2007), Climate Change 2007: Synthesis Report� Contribution of Working Groups I, II and III to the Fourth Assessment Report of the Intergovernmental Panel on Climate Change, Geneva�
IRENA (2017a), Renewable Energy Prospects for India, a working paper based on REmap, International Renewable Energy Agency, Abu Dhabi, www�irena�org/remap�
IRENA (2017b), Accelerating the Energy Transition through Innovation, a working paper based on global REmap analysis, International Renewable Energy Agency, Abu Dhabi� www�irena�org/remap
IRENA (2016b), REmap: Roadmap for a Renewable Energy Future, 2016 Edition, International Renewable Energy Agency, Abu Dhabi, www�irena�org/remap�
IRENA (2016c), REmap: IRENA’s Roadmap for a Renewable Energy Future (database), International Renewable Energy Agency, Bonn, www�irena�org/remap/ (accessed 31 October 2016)�
IRENA (2016d), REmap: Roadmap for a Renewable Energy Future, REmap results by country, status as of March 2016, International Renewable Energy Agency, Bonn�
IRENA (2016e), IRENA’s Renewable Energy Roadmap – Renewable Energy Policy Targets for REmap Countries, International Renewable Energy Agency, Bonn, www�irena�org/remap/RE%20Targets_Summary%20REmap_14mar2016�pdf (accessed 31 October 2016)�
IRENA (2015a), Renewable Energy Prospects: Germany, REmap 2030 – A Renewable Energy Roadmap, International Renewable Energy Agency, November 2015, Bonn�

WORKING PAPER 49
IRENA (2015b), Renewable Energy Prospects: United States of America, REmap 2030 – A Renewable Energy Roadmap, International Renewable Energy Agency, January 2015, Bonn�
IRENA (2014), Renewable Energy Prospects: China, REmap 2030 – A Renewable Energy Roadmap, International Renewable Energy Agency, November 2014, Bonn�
IRENA and C2E2 (2015), “Synergies between renewable energy and energy efficiency” (working paper based on REmap 2030), International Renewable Energy Agency, Abu Dhabi, Copenhagen Centre on Energy Efficiency, Copenhagen�
IRENA and IEA (2017), Perspectives for the Energy Transition: Investment Needs for a Low-Carbon Energy Transition, International Renewable Energy Agency, Abu Dhabi, and International Energy Agency, Paris� www�irena�org/remap�
JAMA (2010), “Next-generation vehicles strategy in Japan”, Issue No� 4, Japan Automobile Manufacturers Association, www�jama-english�jp/europe/news/2010/no_4/art2�html (accessed 31 October 2016)�
Kermeli, K�, W� Graus and E� Worrell (2014), “Energy efficiency improvement potentials and a low energy demand scenario for the global industrial sector”, Energy Efficiency, Vol� 7, Springer, p� 987, doi:10�1007/s12053-014-9267-5�
Kuramochi, T� (2014), “Review of energy and climate policy developments in Japan before and after Fukushima”, Renewable and Sustainable Energy Reviews, Vol� 43, Elsevier, pp� 1320–1332�
LBNL (2012), China Energy and Emissions Paths to 2030 (2nd Edition) (LBNL-4866E), August 2012, (authors: D� Fridley et al�), Lawrence Berkeley National Laboratory, Berkeley, CA�
Ma, L� et al� (2012), “The future demand of transportation in China: 2030 scenario based on a hybrid model”, Procedia – Social and Behavioral Science, Vol� 54, 4 October 2012, pp� 428–437, proceedings of EWGT2012 – 15th Meeting of the EURO Working Group on Transportation, September 2012, Paris�
METI (2015), Long-Term Energy Supply and Demand Outlook – Related Documents, Agency for Natural Resources and Energy, Ministry of Economy, Trade and Industry (METI), Tokyo, www�meti�go�jp/english/press/2015/pdf/0716_01a�pdf�
NREL (2013), Transportation Energy Futures Study, National Renewable Energy Laboratory, Golden, CO�
PCGI (2014), The Final Report of the Expert Group on Low Carbon Strategies for Inclusive Growth, Planning Commission Government of India, New Delhi�
Saygin, D� (2012), “Assessing industrial energy use and CO₂ emissions: Opportunities for energy efficiency, biomass and CCS”, PhD thesis, Utrecht University, Utrecht�
USDEEE (2009), Ground-Source Heat Pumps: Overview of Market Status, Barriers to Adoption, and Options for Overcoming Barriers (Final report), submitted to US Department of Energy, Energy Efficiency and Renewable Energy, Geothermal Technologies Program, by Navigant Consulting, Inc�, Washington, DC�
US EIA (2013), Annual Energy Outlook 2013, US Energy Information Administration, Washington, DC�
US EIA (2014), Annual Energy Outlook 2014, US Energy Information Administration, Washington, DC�
US EPA (2015), Energy Efficiency Improvement and Cost Saving Opportunities for Petroleum Refineries: An ENERGY STAR® Guide for Energy and Plant Managers (authors: E� Worrell, M� Corsten and C� Galitsky), Document Number 430-R-15-002, United States Environmental Protection Agency�

SYNERGIES50
Wolf, S� et al� (2012), Industrial Heat Pumps in Germany: Potentials, Technological Development and Market Barriers, Institute for Energy Economics and the Rational Use of Energy (IER), University of Stuttgart, Stuttgart�
Yatabe, T� (2008), “The effect and potential of heat pump technology”, Business Coordination Dept� Heat Pump & Thermal Storage Technology Center of Japan, presented at 9th International IEA Heat Pump Conference, 20–22 May 2008, Zürich�
Zeyringer, M� et al� (2015), “Analysing grid extension and stand-alone photovoltaic systems for the cost-effective electrification of Kenya’, Energy for Sustainable Development, Vol� 25, Elsevier, pp� 75–86�
WORKING PAPER 51
ANNEX
11 In this report, the assessment of end-use sectors of agriculture, fisheries, forestry and other small-scale sectors, which together account
for less than 5% of the total global final energy, is excluded.
Method and data
Overview
An overview of the method used in this study is presented in Figure 15� The overview shows the purpose of each examined case, its approach and the underlying sources� Furthermore, it presents the performance indicators as well as the approach used to assess the feasibility of the various cases under current policy frameworks� This annex of the report shows further detail on the cases on county level than what was presented in the main section of the report, and includes two cases, the EE Case and TECH Case, that were not mention earlier, but were included as part of the analysis that was presented� These two cases were hidden from the previous sections for sake of simplicity but are shown in parts of this annex to provide deeper perspectives on the role of energy efficiency in particular� Figure 15 details all cases in detail� The analysis has been carried out for the period 2010–30 and for all sectors of the energy system, namely power and district heat sectors, buildings, industry and transport�¹¹
The starting point of the analysis is the IRENA REmap tool, which is an analytical approach for assessing the gap between current national renewable energy plans and additional renewable technology options that can be realistically deployed by 2030� The REmap analysis assesses current energy developments to 2030 (the Reference Case) by collecting data from countries about their national plans and goals that are currently in place or under consideration, including energy efficiency improvements� Subsequently, technology pathways are prepared that assess the realistic deployment potential of renewable energy beyond the national plans of countries – these pathways (REmap Case) include the so-called “REmap Options”� Further details on the REmap method can be found in IRENA (2016b)�
This study extended the REmap tool by adding energy efficiency technologies (referred to as “EE Options”)� The additional REmap + EE Case
shows the potential and costs when deploying both REmap and EE Options� The potential and costs of the EE Options were derived by employing the same formulae and data used for the REmap Options� Data for EE Options were standardised by converting cost figures to USD 2010� Costs that are reported in other currencies were first converted to USD using the year-average exchange rate data of the European Central Bank (ECB, 2016) for the year the cost data were reported, and were subsequently adjusted to the year 2010 using the Power Capital Cost Index for Europe (IHS, 2016a) or North America (IHS, 2016b)�
An important additional step in the analysis is the construction of the Frozen Efficiency Case, which is used to determine improvements in energy efficiency over time�
The policy analysis consists of three steps� First, an overview was made of current policies and targets on RE/EE in the selected countries� Second, the feasibility of the EE Options under current policies and targets was assessed and policy gaps were identified� Third, a policy menu was developed with the aim of driving the deployment of energy efficiency and exploiting synergies with renewable energy where possible�
Performance indicators
Table 5 presents the performance indicators used to measure progress in RE/EE when implementing REmap Options, EE Options, or both� The primary indicators measure the actual progress in these areas, while the secondary indicators measure changes in energy, emissions and costs, which are other important indicators for policy makers and researchers� The compound annual growth rate of energy intensity was chosen as an immediate proxy to measure the progress in energy efficiency improvements� Energy intensity is defined as the amount of energy required to produce a unit of economic activity�

SYNERGIES52
Previous IRENA studies have looked at the development of the renewable energy share in TFEC between 2010 and 2030, in line with the methodology suggested by SEforALL� This study focuses on the renewable energy share in TPES, as this gives a better overview of the synergies in the power sector and ensures that the renewable energy technology assessment is comparable with
the energy efficiency analysis� To estimate primary energy equivalents for non-fossil fuels or biofuels, the physical energy content method is used� The TPES values that result from the REmap analysis may exclude some energy activity that is outside of the boundaries of REmap, for instance fisheries, forestry and other sources�
Figure 15: Overview of the method used in this study
2010 – Base year
Purpose: Shows the situation in the year 2010. Developments up to 2030 are compared with this base year.
Method: Collection of relevant statistical data for the year 2010.
Sources: REmap studies, country statistics. Indicators – energy and emissions
Primary energy supply per sector.
CO₂ emissions per sector.
Renewable energy share of TPES.
Energy intensity of the economy (in MJ/USD).
Sectors: industry, transport, built environment, heating, and power.
Indicators – costs
Extra costs of additional RE / EE options compared to their conventional counterparts (in USD/yr per option).
Total additional system costs (in USD/yr).
Avoided external costs of climate change and air pollution (in USD/yr).
Feasibility of cases under current policy
Purpose: Insights into the capacity of current policy to facilitate additional measures on top of the Reference Case.
Method: Inventory of current RE/EE policies. Comparison of policy with policy requirements for additional measures.
Sources: REmap studies, databases, and literature.
2030 – Frozen efficiency Case (baseline)
Purpose: This case shows how energy use and CO₂ emissions will develop without any implementation of RE/EE options.
Method: Extrapolation of 2010 data assuming no improvement in energy efficiency and based on assumptions with regard to population growth, GDP growth, and change in economic structure. In developed countries also the renewable energy share is kept constant.
Sources: REmap studies, literature, calculations in this study.
2030 – Reference Case (business-as-usual)
Purpose: This case shows how energy use and CO₂ emissions will develop taking into account current policy measures.
Method: Extrapolation of 2010 data based on assumptions with regard to population growth, GDP growth, and change in economic structure, and assessment of deployment of RE/EE options under current policies.
Sources: REmap studies, government plans.
2030 – REmap + EE Case
Purpose: This case shows the energy system developments taking into account both renewable options and energy efficiency measures on top of the Reference Case.
Method: Identification of energy efficiency measures and renewable energy options.
Sources: REmap studies, literature, in-house expertise, calculations in this study.
2030 – REmap Case
Purpose: This case shows the energy system developments taking into account additional renewable energy options on top of the Reference Case.
Method: Identification of renewable energy options on top of Reference Case.
Sources: REmap studies.
2030 – EE Case
Purpose: This case shows the energy system developments taking into account additional energy efficiency measures on top of the Reference Case.
Method: Identification of energy efficiency measures on top of Reference Case.
Sources: Literature, calculations in this study.
2030 – TECH
Purpose: This case shows energy system developments taking into account the full technical potential of energy efficiency measures on top of the REmap Case.
Method: Identification of promising categories of energy efficiency measures and assuming full technical deployment of these measures.
Sources: Literature, in-house expertise, calculations in this study.

WORKING PAPER 53
12 An overview of the sources used in REmap analysis for the countries in this study is available at the following link:
www.irena.org/remap/RE%20Targets_Summary%20REmap_14mar2016.pdf.
13 In this report, the assessment of end-use sectors of agriculture, fisheries, forestry and other small-scale sectors, which together account
for less than 5% of the total global final energy, are excluded.
14 For some countries additional energy efficiency categories were included as more specific data were available. For example, more
efficient cooling in the built environment was included for Japan and China, while best practice efficiency in dry-process cement kilns
was included for China. In India and the United States, the category heat pumps in industry (India) and buildings (the United States) were
omitted due to a lack of sufficient reliable data.
To calculate energy intensity, a value for GDP is needed� The indicator for energy intensity that is used in this study assumes GDP in purchasing power parity (PPP)� For future years, including the target year of 2030 used in this analysis, projections for GDP are based on projected growth in GDP provided in the studies or sources that are used for the REmap analysis for that country� This growth rate is then applied to 2010 GDP in PPP at the calculated growth rate for the period; all values in this report are shown in 2010 USD�¹²
Selected countries
The method is applied to five countries that represent an important share of the renewable energy potential as quantified in IRENA’s global REmap study (IRENA, 2016d) – the combined potential of the five countries in this report represents half of the effort required to realise the global objective of doubling the renewable energy share� In order to gain insights into
different types of country, three developed (Germany, Japan, the United States) and two rapidly developing countries (China, India) were selected for the purpose of this study� The five countries represent differences in the degree of development of energy services supply (e� g� slow vs� rapid growth), the deployment rate of renewable energy supply, the potential for domestic renewable energy sources, and the policy environment�
EE Options
In this study, ten key energy efficiency categories (EE Options) were assessed, relevant to the selected countries� They fall within three end-use sectors (industry, buildings and transport)¹³ and the power sector (see Table 6), and can be implemented on top of energy efficiency improvements that are assumed to be already implemented in the Reference Case by 2030� The analysed energy efficiency categories are roughly similar for all five countries�¹⁴
Table 5: Performance indicators used in this study
Performance indicator Unit
Primary indicatorsEnergy efficiency Compound annual growth rate of energy intensity
between 2010 and 2030%/yr
Energy intensity MJ/USD
Renewable energy Renewable energy share in TPES %
Secondary indicators
Energy TPES EJ/yr
Climate change CO₂ emissions GtCO₂/yrCosts Substitution costs USD/yr per RE%pt
Annual system costs USD/yr
Avoided external costs USD/yr
Note: RE%pt = increase in the country’s renewable energy share of TPES by 1%pt.

SYNERGIES54
The EE Options can be divided into:
• direct efficiency measures, which reduce the specific energy consumption of an existing technology (e� g� more efficient pumps)
• technological change, which implies the replacement of a conventional technology with a more efficient, advanced technology (e� g� replacement of gas cooking with electric cooking)�
Note that this study focuses on technologies to supply the same energy services as identified in the Reference Case� Reducing or shifting some energy services may provide additional energy savings and would allow for further introduction of renewable energy (e� g� shifting from decentralised to centralised urban heating systems); however, these structural changes and modal shifts are excluded from this analysis�
Data
The data used for the various cases are primarily based on REmap country reports (China, Germany, the United States) and leading government publications (see Table 7)� Table 8 shows the discount rates and some of the energy prices used for the selected countries� Discount rates differ between developed and developing countries due to variations in the (perceived) risk level of investments in energy technologies� The variation in discount
rates and energy prices has a significant impact on the costs of energy technologies� More data on commodity prices, externalities and the techno-economic performance of the REmap Options can be found in IRENA country reports (2014; 2015a; 2015b; 2017a) and databases (2016c)�
The techno-economic input data for the EE Options were taken from literature and expert judgements and can be found in the section below�
Table 6: Energy efficiency categories investigated in this study
Note: BEV = battery electric vehicle.
INDUSTRY BUILDINGS
More efficient pumps, compressors, motors and fans Improved building envelope
Further heat and process integration More efficient lighting
Heat pumps More efficient appliances
POWER Heat pumps
Higher-efficiency NGCC plant TRANSPORT
Switch from coal to gas power plants Further penetration BEV

WORKING PAPER 55
REmap method and data
This annex provides additional information on the IRENA REmap method and data� A more detailed explanation, as well as data on commodity and emissions factors, energy prices, externalities and the techno-economic performance of the REmap Options, can be found on the IRENA website (2016c)�
A-1 General approach and options assessment
REmap is a roadmap of technology options to increase the global share of renewables� It is a bottom-up, iterative analysis approach based on 40 countries (as of March 2016), which account for 80% of total global energy demand� REmap identified the “realistic potential” of accelerating renewable energy deployment – one that can be accomplished with existing technologies, is economically practical, and achievable by 2030�
Table 7: Key literature studies
Table 8: Key economic input data
Base year / Frozen Efficiency Case
Reference Case REmap Case REmap + EE Case
Year 2010/2030 2030 2030 2030
China CNREC (2012); IEA (2012); LBNL (2012)
IRENA (2014); CNREC (2012); IEA (2012)
IRENA (2014) IRENA (2014); EE Options: see Table 9
Germany BWT (2014) IRENA (2015a); BWT (2014)
IRENA (2015a) IRENA (2015a); EE Options: see Table 9
India PCGI (2014) IRENA (2016c) IRENA (2016c) IRENA (2016c); EE Options: see Table 9
Japan METI (2015) IRENA (2016c) IRENA (2016c) IRENA (2016c) EE Options: see Table 9
United States US EIA (2013) US EIA (2013); IRENA (2015b)
IRENA (2015b) IRENA (2015b); EE Options: see Table 9
China Germany India Japan United States
Real discount rate (%) 8 6 12 3 7
Prices in 2030 (USD/GJ)
Steam coal 1�4 6�5 3�8 5�4 2�6
Natural gas household 16�0 28�6 6�9 37�5 13�3
Natural gas industry 14�8 18�5 6�3 14�0 7�8
Electricity household 56 350 104 299 136
Electricity industry 39 194 65 195 77
Gasoline 41�9 71�5 43�4 60�4 26�5
Source: IRENA (2016c).
SYNERGIES56
The REmap analysis starts with national-level data covering power and district heating sectors and buildings, industry and transport for the base year 2010� Countries then provided their latest national plans, which were used to produce business-as-usual Reference Cases, including each country’s targets for renewables and fossil fuels (IRENA, 2016e)� The Reference Case represents policies in place or under consideration, including energy efficiency improvements� It includes the final energy consumption for buildings, industry and transport separately and distinguishes between power, district heating and direct uses of energy, with a breakdown by energy carrier, for the period 2010–30�
The potential of renewable energy technology options beyond the Reference Case is subsequently investigated with the country� The potential of these technologies is described as REmap Options, and the resulting case when all options are deployed is called REmap� For each REmap Option, the analysis also considers the costs to substitute a non-renewable energy technology to deliver the same amount of heat, electricity or energy service�
A-2 REmap tool
IRENA has developed a spreadsheet tool that allows users to evaluate and create their country’s REmap 2030 analysis and assess the potential, cost and benefits of REmap Options� The tool provides a simplified but dynamic accounting framework to evaluate and verify Reference Case developments and REmap Options within each country�
The tool consists of two parts� In the first part, users can evaluate and adjust the country’s Reference Case for REmap Options between 2010 and 2030� In the second part, they can substitute non-renewable energy technologies assumed to be in place in 2020 and 2030 with REmap Options based on the Reference Case� For ease of use, the tool offers a range of technology options to choose from in the power and district heat sectors and in buildings, industry and transport� The tool allows the user to choose REmap Options, assess the options’ impacts on the country’s renewable energy share and evaluate their position within the country’s cost-supply curve, as well as see the result of the options for a range of cost and benefit co-analyses� At any time, the user can increase or decrease the size of REmap Options and choose a different substitute� Furthermore, the tool allows for a consistent analysis and comparison of results among countries�
The tool provides standard values for commodity prices and technology costs and performance for both renewable and non-renewable energy technologies� For each country these costs and performance are then localised for the technologies that are used in the analysis, i�e� adjusted based on national sources, projections, expert feedback, or IRENA’s own cost and technology briefs� An overview of these basic commodity price and technology performance assumptions is available on the IRENA website (2016c)�
A-3 Cost assessment
Each REmap Option is characterised by its costs, with the main metric represented by its substitution cost� The substitution costs are the costs when substituting a conventional fossil energy technology with a renewable energy technology� Hence, the costs not only depend on the techno-economic performance of the REmap Option, but also on the conventional technology it replaces� In this study, the substitution cost Cs is expressed in billion USD required to increase the renewable energy share in TPES of the country by 1%pt (bln USD/RE%pt):
(1)
where ∆Eng, ∆Ee and ∆Ef are the net change in annual natural gas (GJng/yr), electricity (GJe/yr), and fuel consumption (GJf/yr), Png, Pe and Pf are the prices of natural gas (USD/GJng), electricity (USD/ GJe), and fuel (USD/GJf) in 2030� I is the investment cost (USD), α is the annuity factor, and ∆CO&M is the net change in operation and maintenance (O&M) cost (USD/yr)� RE%2010 and RE%2030 are the renewable energy share of TPES (%) in 2010 and 2030, respectively�
The annuity factor is a function of the real interest rate r (%) and economic lifetime LT (years) of the technology (see equation 2)�
(2)
Based on the substitution cost of each REmap Option, country cost curves are developed� Note that assessments of all additional costs related to complementary infrastructure are excluded from the analysis (e� g� grid reinforcements)� The cost of identical technology options can vary from country to country, depending on resource quality, cost of capital and other factors� The REmap tool includes a standard set of about 80 renewable energy technologies�

WORKING PAPER 57
Based on the substitution cost, inference can be made as to the effect on system costs� This indicator is the sum of the differences between the total capital, operating and fuel expenditures of all energy technologies based on their deployment in REmap 2030 and the Reference Case in 2030�
A-4 Externality and CO₂ assessments
The external costs from generation of energy arise from the emissions produced in the form of fine particulate matter (PM2�5), mono nitrogen oxides (NOx), sulphur dioxide (SO₂), volatile organic compounds (VOCs) and ammonia (NH₃)� Additionally, the social costs of CO₂ are estimated� Emission effects covered are health effects arising from outdoor exposure, those arising from indoor exposure in the case of traditional use of bioenergy, and effects on agriculture�
The basic approach for the external cost assessment includes: (1) estimate the emissions factors for the local pollutants by sector; (2) apply external costs in USD per tonne to the estimates of emissions from fuel use by sector and country for 2010 and for the two cases in 2030, to derive estimates of the total external costs of fossil fuel use by country� REmap also assesses CO₂ emissions that are emitted from the sectors covered within the bounds of the REmap analysis� For these sectors two assessments are made: CO₂ resulting from direct combustion of fossil fuels, and CO₂ resulting from direct combustion and lifecycle emissions from fossil fuels and renewable energy technologies� A more detailed explanation of the externality and CO₂ assessment method can be found on the IRENA website (2016c)�
Table 9: Techno-economic input data for the EE Options
KEY PERFORMANCE PARAMETERS SAVINGS IN TOTAL ENERGY CONSUMPTION IN SECTOR (%)
Type of energy saved
Capacity factor
(%)
Conversion efficiency
energy saved (%)
Eco- nomic life-time (yr)
Power (e)/ fuel demand (f) (GJ/kW/yr)
Capital cost
(USD/kW)
O&M (USD/
GJ)Germany United
States Japan China India
INDUSTRYEFFICIENCY MEASURE ON EXISTING TECHNOLOGY
High-efficiency motors
Electricity industrya
80 48 a (coal -> electricity)
10 b N/A 4 070 c 0 c 10 d 10 d 10 d 10 d 15 d
Industrial heat and process integration
Natural gas/coal industrya
80 90/95 a (natural gas/ coal à heat)
15 b N/A 2 332 c 0 c 10 e 10 e 10 e 10 e 15 e
Cement: Best efficiency in dry process kilns
Coal industry a 80 90 a (coal à heat)
20 N/A 198 −0�5 f N/A N/A N/A 65 f N/A
TECHNOLOGY CHANGE
Energy used Conversion efficiency
New technology: Air-to-air heat pumps
Electricity industry
35 340 (electricity
à heat)
15 3�2(e) 750 26 29 g N/A 29 g N/A N/A
Conventional technology replaced: Natural gas boiler a
Natural gas industry a
35 95 a (Natural gas
à heat)
25 13�3 (f) 100 2�5
BUILDINGSEFFICIENCY MEASURE ON EXISTING TECHNOLOGY
High-efficiency building envelope
Natural gas/coal house-
holds
100 90/95 a
(Natural gas/
coal à heat)
30 h N/A 5 130 h 0 h 4 i 31 j N/A N/A 19 m

SYNERGIES58
KEY PERFORMANCE PARAMETERS SAVINGS IN TOTAL ENERGY CONSUMPTION IN SECTOR (%)
Type of energy saved
Capacity factor
(%)
Conversion efficiency
energy saved (%)
Eco- nomic life-time (yr)
Power (e)/ fuel demand (f) (GJ/kW/yr)
Capital cost
(USD/kW)
O&M (USD/
GJ)Germany United
States Japan China India
More efficient boiler
Natural gas/coal house-
holds
80 90/95 a (Natural
gas/ coal à heat)
30 h N/A 2 100 0 h N/A N/A 5 h 18 l N/A
High-efficiency lighting
Electricity households a
21 h 48 a (coal à electricity)
24 h N/A 1 365 h 0 h 16 h 16 h 40 k 33 l N/A
High-efficiency appliances
Electricity households a
60 48 a (coal à electricity)
12 N/A 30 h 0 h 5 h 5 h 5 h 39 l 31 m
Cooling Electricity households a
15 48 a (coal à electricity)
15 N/A 1 420 h 0 h N/A N/A 5 h 52 l N/A
TECHNOLOGY CHANGE
Energy used
New technology: Air-to-air heat pumps
Electricity households a
15 340 (electricity
à heat)
15 1�4 (e) 780 20 0�2 n 35 o 26 p N/A 26 p
Conventional technology replaced:Natural gas/coal boiler a
Natural gas/coal house-
holds a
35 95 a (Natural gas
à heat)
25 13�3 (f) 100 2�5
TRANSPORTEFFICIENCY MEASURE ON EXISTING TECHNOLOGY
Vehicle efficien-cy improvement
Gasoline N/A N/A 12 N/A 1 150 23 N/A N/A 42 N/A N/A
TECHNOLOGY CHANGE
Energy used pkm/yr/
vehicle
yr MJ/ pkm
USD/ vehicle
USD/ vehi-cle/yr
New technology: Further penetra-tion BEVs
Electricity households
15 000 N/A 12 0�47 (e)
32 700 2 943 2 i 3 q 0�2 9 r 3
Conventional technology replaced: gaso-line passenger card
Gasoline 15 000 N/A 12 1�06 (f) 28 000 2 800
POWEREFFICIENCY MEASURE ON EXISTING TECHNOLOGY
High-efficiency gas-fired power plants
Natural gas industry
85 62 (Natural gas à electricity)
30 N/A 200 0 6 q 6 q 6 q 6 q 6 q
TECHNOLOGY CHANGE
Energy used
New technology: Natural gas-based power plant
Natural gas industry
85 62 (Natural gas
à electricity)
30 43 (f) 1 000 40 10 4 7 11 29
Conventional technology replaced: Coal-based power plant
Coal industry 85 48 a (coal à
electricity)
55 56 (f) 3 000 120

WORKING PAPER 59
Notes: kW = kilowatt; N/A = not applicable; pkm = passenger kilometre;
a It was assumed that natural gas is saved in Germany, Japan and the United States, whereas coal is saved in China and India. In 2030, electricity and heat were assumed to be produced in a coal-fired power plant and natural gas/coal boiler with efficiencies (lower heating value) of 48% and 90%/95%, respectively;
b US EPA (2015) Energy Efficiency Improvement and Cost Saving Opportunities for Petroleum Refineries: An ENERGY STAR® Guide for Energy and Plant Managers;
c This was derived by using the simple payback formula. The annual electricity savings were used and assumed zero O&M costs and a payback period of three and five years for motors and heat and process integration, respectively (US EPA, 2015). Subsequently, the investment costs were divided with the output capacity of the EE Option;
d Several studies show a technical electricity saving potential of 20–30% (e. g. Kermeli, Graus and Worrell [2014], “Energy efficiency improvement potentials and a low energy demand scenario for the global industrial sector”, Energy Efficiency, Vol. 7, Springer, p. 987; IEA [2011], Energy-Efficiency Policy Opportunities for Electric Motor-Driven Systems). Given the energy improvements assumed in the Reference Cases in the five selected countries, it was estimated that the remaining potential for electricity reduction due to more efficient (variable drives for) pumps and compressors to be 10–15%, depending on the country;
e Kermeli, Graus and Worrell (2014) mention a technical saving potential of 20–30%. Around 10–15% of the potential has already been achieved in the References Cases of the five selected countries. It was estimated that the remaining potential in the REmap + EE Cases were 10–15%, depending on the country;
f Based on Ecofys (2009), Several energy efficiency reports for industry, buildings and transport, www.ecofys.com/en/search/?query=energy%20efficiency;
g Wolf et al. (2014), Industrial Heat Pumps in Germany: Potentials, Technological Development and Market Barriers. It was assumed that 70% of the energy carriers in industry are used for heating purposes (Saygin [2012], “Assessing industrial energy use and CO₂ emissions: Opportunities for energy efficiency, biomass and CCS”);
h Based on Ecofys (2009), assuming 5 hours of lighting per day; i BMWi (2014), A Good Bit of Work – Making More out of Energy: National Action Plan on Energy Efficiency; j USDEEE (2009), Ground-Source Heat Pumps: Overview of Market Status, Barriers to Adoption, and Options for Overcoming Barriers; k IEEJ (2011), Electricity Saving Potential and Cost and Benefit of LED Lighting in Japan; l LBNL (2012), China Energy and Emissions Paths to 2030; m PCGI (2014), The Final Report of the Expert Group on Low Carbon Strategies for Inclusive Growth; n The bulk of the heat pumps is already installed in the ambitious Reference Case; o US EIA (2014), Annual Energy Outlook 2014; p Yatabe (2008), “The effect and potential of heat pump technology”; q IEA (2014); r Ma et al. (2012), “The future demand of transportation in China: 2030 scenario based on a hybrid model”,
Procedia – Social and Behavioral Science, Vol. 54, 4 October 2012, pp. 428–437.

SYNERGIES60
HIGHLIGHTS
China
In China’s Reference Case, the share of modern renewables in China’s energy mix rises from 13% in 2010 to 19% in 2030 (excluding traditional use of bioenergy)� The growing renewables share will be driven mostly by an increase in renewable power generation from 19% in 2010 to 31% in 2030, due to rapid solar PV expansion, and a higher renewables share in the buildings sector from 16% to 42%, mainly because of the growing use of biogas for space heating�
Against a growth in TPES of over 150%, energy intensity falls from 9�1 to 4�5 MJ/USD, which is to a large extent due to structural sector changes (−2�3 MJ/USD), especially in the industrial sector which is expected to become less energy intensive over the coming decades� Renewable energy and particularly energy efficiency account for the other half of the energy intensity improvement, with more efficient appliances and efficient boilers in buildings showing the largest contribution�
The total renewable energy share is estimated to reach 28% when implementing all REmap Options, with the most important being solar PV at 298 GW and wind at 270 GW in the power sector� Deploying energy efficiency measures enables China to attain a TPES reduction of 22 EJ/yr, which is 16% lower than in the 2030 Reference Case� The main technologies are more efficient appliances in residential and commercial buildings� Energy efficiency accounts for one-fifth of the rise in the renewables share�
Incremental annual system costs are USD 198 billion per year, of which USD 52 billion is for renewable energy and USD 146 billion for energy efficiency� Including reduced externalities, total incremental annual system costs go down to USD −75 billion, while CO₂ emissions are projected to decline from around 11�3 billion tonnes to 6�5 billion tonnes – a reduction of 43% compared to the 2030 Reference Case�
Over two-thirds of the EE Options and nearly one-fifth of the REmap Options are already cost-competitive without considering externalities – meaning their substitution cost is negative�
Germany
In Germany’s Reference Case, the renewable energy share increases from 10% to 26% between 2010 and 2030� Over the same period, energy intensity decreases from over 4 MJ/USD 2010 to 2�5 MJ/ USD 2010, equalling a 2�6% annual improvement rate�
The largest driver for the shift to renewables is a significant uptake in the amount of renewable power generation, whereas for energy efficiency it is improved heating systems and insulation in buildings� Wind energy provides the largest contribution to the expansion of renewable energy�
With REmap Options, mainly 44 GW per year of wind and solar power and over 800 petajoules (PJ) per year of biomass for buildings and transport, the share of renewable energy would increase from 26% in the Reference Case (2030) to 35% in the REmap Case (2030)� By adding energy efficiency measures (REmap + EE), the renewable energy share increases to 44%� The greatest potential lies in the industrial and buildings sectors, in which heat pumps and improved building insulation are the main contributing technologies� Energy efficiency accounts for nearly half of the rise in the renewable energy share�
Incremental annual system costs are USD 0�4 billion per year, split into USD −2�7 billion for renewable energy and USD 1�5 billion for energy efficiency� The high costs of energy efficiency are due to the high natural gas to coal price ratio, which makes the EE Option that involves the shift from coal- to gas-based power plants expensive (9 USD/GJ)� As this option accounts for 30–60% of the energy savings in the REmap + EE Case, the impact of energy prices on the incremental annual system cost is very large� Benefits reduce the annual costs by USD 6–20 billion with most of that related to climate change, while the CO₂ emission reduction potential with additional EE Options and REmap Options is 35% compared to the Reference Case by 2030�
At the technology level, nearly 50% of the efficiency measures are cost-effective, whereas 70% of the renewables-related measures are cost-effective� The relatively small share of cost-effective EE Options is caused by the high costs related to the shift from coal- to gas-based power plants�
COUNTRY RESULTS

WORKING PAPER 61
India
Under India’s Reference Case, the share of modern renewable energy in TFEC is forecast to fall from 40% in 2010 to 12% in 2030� Against growth of over 200% in TFEC, the expansion of renewable energy, with wind for electricity production and solar thermal and cooling in industry, is smaller than for fossil fuels, especially coal�
Over the same period, energy intensity decreases from over 7�8 MJ/USD to 6�0 MJ/USD, equalling a 1�3% annual improvement rate� The main energy efficiency measures are better building insulation and more efficient power generation�
With the REmap Options the share of renewable energy would go up to 26%, mainly comprising solar PV for power of 261 GW, and 1 360 PJ per year of liquid biomass across all sectors� The energy efficiency potential of the EE Options is 12% of TPES, mostly in the buildings sector in which better insulation and higher-efficiency household appliances are the key efficiency measures�
The REmap Options result in incremental annual system costs of USD 0�3 billion by 2030� By adding efficiency measures, costs fall to USD −169 billion per year� Benefits reduce the costs by USD 290 billion, with most of that related to climate change� The CO₂ emission reduction potential with additional RE/EE under the REmap + EE Case is 56% compared to the Reference Case by 2030�
Nearly 78% of the individual energy efficiency measures and 36% of the renewables technologies are cost-effective even without considering externality costs�
Japan
In Japan’s Reference Case, the share of renewable energy increases by a factor of two from 3�8% in 2010 to 8�2% in 2030� Solar PV (60 GW) in the power sector and solid bioenergy (82 GW) in industry show the largest contributions to the renewables share increase�
Japan’s energy intensity is expected to fall by 8% per year, from 5�1 MJ/USD in 2010 to 3�7 MJ/ USD in 2030, mainly as a result of autonomous improvements in energy efficiency in the power and transport sectors� Replacing coal with gas-fired power generation and vehicle fuel economy improvements lead the way in reaching higher energy efficiency levels in these two sectors�
In REmap (2030), the rapid expansion of solar PV with 115 GW is followed by the uptake of wind energy with 27 GW in the power sector and heat pumps in the buildings sector, resulting in a doubling of the renewables share to 16%� The energy efficiency potential is 13%, mainly in the industrial sector in which heat pumps and far-reaching heat and process integration are the key efficiency measures� Combining REmap Options and EE Options (REmap + EE) has a positive effect on the share of renewables, which goes up to 20%�
A combination of REmap Options and EE Options results in incremental annual system costs of USD −31 billion, of which USD −3 billion comes from renewables and USD −28 billion from energy efficiency measures� If costs of avoided externalities are taken into account, the negative costs would increase to USD −62 billion, where CO₂ emissions can be brought down to 0�8 Gt/yr, a reduction of around 33% from 2030 Reference Case levels�
At the technology level, over 80% of the efficiency measures are cost-effective without externality costs, whereas 40% of the renewables measures are cost-effective�

SYNERGIES62
United States
The US Reference Case takes the renewable energy share from 7�5% today to only slightly above 9% by 2030, driven mostly by an increase in renewable power generation in the form of solar PV (35 GW) and wind energy (48 GW)�
Energy intensity falls from 6�9 MJ/USD to 4�5 MJ/USD due to more renewable energy, greater technical efficiency from the implementation of energy efficiency technologies, and structural economic changes resulting in the production and consumption of goods with lower energy intensity� The main energy efficiency measures include enhanced vehicle performance and air-to-air heat pumps in the transport and buildings sectors, respectively�
In REmap (2030), the share of renewable energy in the United States approaches 27%, driven equally by more renewables in the end-use sectors industry (biomass), buildings (solar heating and cooling) and transport (electric mobility), as well as in the power sector, led by wind (255 GW), but including a diverse mix of technologies� The energy efficiency potential is 6% of TPES and accounts for a renewable energy share increase of 5�4%pt� The largest efficiency gains to 2030 are in the transport sector, in which the EV share grows from 22% in the Reference Case to 73% in the REmap + EE Case�
The analysis shows that it is cost-effective to increase the renewables share to 30% by utilising both RE Options and EE Options� When accounting for costs related to externalities, system costs go down by between USD 100 billion and USD 450 billion� If the RE/ EE deployment envisaged in the analysis is achieved, the United States would reduce its CO₂ emissions by 44% compared to the 2030 business-as-usual level�
Nearly 90% of the individual energy efficiency measures and 38% of the renewables technologies are cost-effective even without considering externality benefits�

WORKING PAPER 63
Additional efforts: REmap and EE Cases
Figure 17 shows the TPES and energy intensity for the various studied cases in China with a breakdown by sector� The large increase in TPES (150%) in the Frozen Efficiency Case and Reference Case in 2030 is due to the rapid expected growth in GDP (240%) over the period 2010–30� Moreover, the annual number of transport passenger kilometres
using light-duty cars and specific energy use for space cooling, lighting and equipment energy in the commercial buildings sector are jointly projected to grow significantly (nearly tenfold) (LBNL, 2012)� Nevertheless, the energy intensity in the Frozen Efficiency Case in 2030 is lower than for the Reference Case in 2010, mainly because of the maturing economy, which shifts away from industrialisation (IRENA, 2014)�
China
Business as usual: Reference Case
Figure 16 presents the contribution of different sectors to the reduction in TPES and increase in the renewables share in China�
The renewable energy share in China’s TPES is projected to increase from 2�5% in the Frozen Efficiency Case to 13�9% in the Reference Case in 2030� Additional renewable energy capacity in the power and buildings sectors contribute most with 4�8%pt and 1�7%pt, respectively� In these sectors wind energy for electricity generation and biogas for space heating show the largest contributions� The industrial and transport sectors account for
0�8%pt of the increase in renewable energy share, mainly due to geothermal energy (industry) and the expansion of the EV fleet (transport)�
Energy efficiency measures account for a TPES reduction of 70 EJ/yr and renewable energy share increase of 4�1%pt� Efficiency measures in the buildings and industrial sectors contribute most to the decrease in TPES (38�4 EJ/yr) and renewables share increase (2�3%pt)� In these sectors, more efficient appliances and efficient boilers in buildings and far-reaching process and heat integration in industry are the main efficiency measures driving the TPES reductions� The remainder (20�3 EJ/yr) comes from the power and transport sectors, in which more efficient coal-fired power plants and better vehicle fuel economy show the largest contribution�
Figure 16: Contribution of sectors to the increase in the renewable energy as a share of TPES (%pt) (left pie chart) and TPES reduction (EJ/yr) (right pie chart), China
Industry – renewables
Buildings – renewables
Transport – renewables
Power – renewables
Heat – renewables
Industry – energy e�ciency
Buildings – energy e�ciency
Transport – energy e�ciency
Power – energy e�ciency
Heat – energy e�ciency
22.944.80%
1.73%
0.42%−0.07%
0.54%
1.52%
0.82%
9.07 0.01
0.701.060.86−0.73
6.87 15.46
0.36%
1.29%14.16

SYNERGIES64
On top of the Reference Case developments, the TPES can be reduced by 23 EJ/yr (16%) and 7 EJ/ yr (5%) by applying additional energy efficiency measures and renewable energy, respectively� Together, a TPES reduction of 30 EJ/ yr (−21%) is achieved in the REmap + EE Case� The TECH Case shows only limited improvement potential compared to the REmap + EE Case, as energy efficiency is already implemented to a large extent in the Reference Case and EE 2030 Case� The REmap + EE Case shows a decrease of 1�2 MJ/ USD (26%) compared to the Reference Case in 2030�
Table 10 presents the renewables share of TFEC and annual improvement rate of energy intensity� The results show that RE/EE measures affect both the renewables share and energy intensity� The largest improvements are made in the Reference Case: the renewables share increases from 13�2% to 19�1%� Overall, the respective renewables share and energy intensity improvement rate increase to 32�0% and 4�6%/yr in the REmap + EE Case in 2030� By implementing the full technical potential of efficiency measures together with the REmap Options, the renewables share and annual energy intensity improvement rate can further increase to 32�9% and 4�9%/yr, respectively�
Figure 17: TPES and contribution to the decrease in energy intensity, China
Industry – renewables
OtherBuildings – renewables
Transport – renewables
Power – renewables
Heat – renewables
2010
Froz
en E�
cienc
y
Referen
ce C
ase
REmap
REmap +
EETE
CHEE20
10
Froz
en E�
cienc
y
Referen
ce C
ase
REmap
REmap +
EETE
CHEE
Energy intensity (MJ/USD)TPES (EJ/yr)
250
150
200
80.15
38.27
3.60
7.2314.4819.86
3.61
24.95
103.38
37.23
41.43
4.33
17.3713.2325.11
4.33
13.72
65.40
11.7222.52
5.53
16.41
75.35
10.7624.97
5.53
12.76
60.60
9.2522.37
5.26
8.93
61.98
6.4721.78
4.20
0.39
0.79
1.59
2.18
0.12
0.81
3.34
1.20
1.34
0.14
2.59
0.560.430.81
0.14
0.44
2.11
0.380.73
0.18
0.53
2.43
0.350.81
0.18
0.41
1.96
0.300.72
0.17
0.29
2.00
0.210.70
100
50
0
10
6
8
4
2
0
−33%
−21%−16% −5% −26%
−33%
−21%−16% −5% −26%
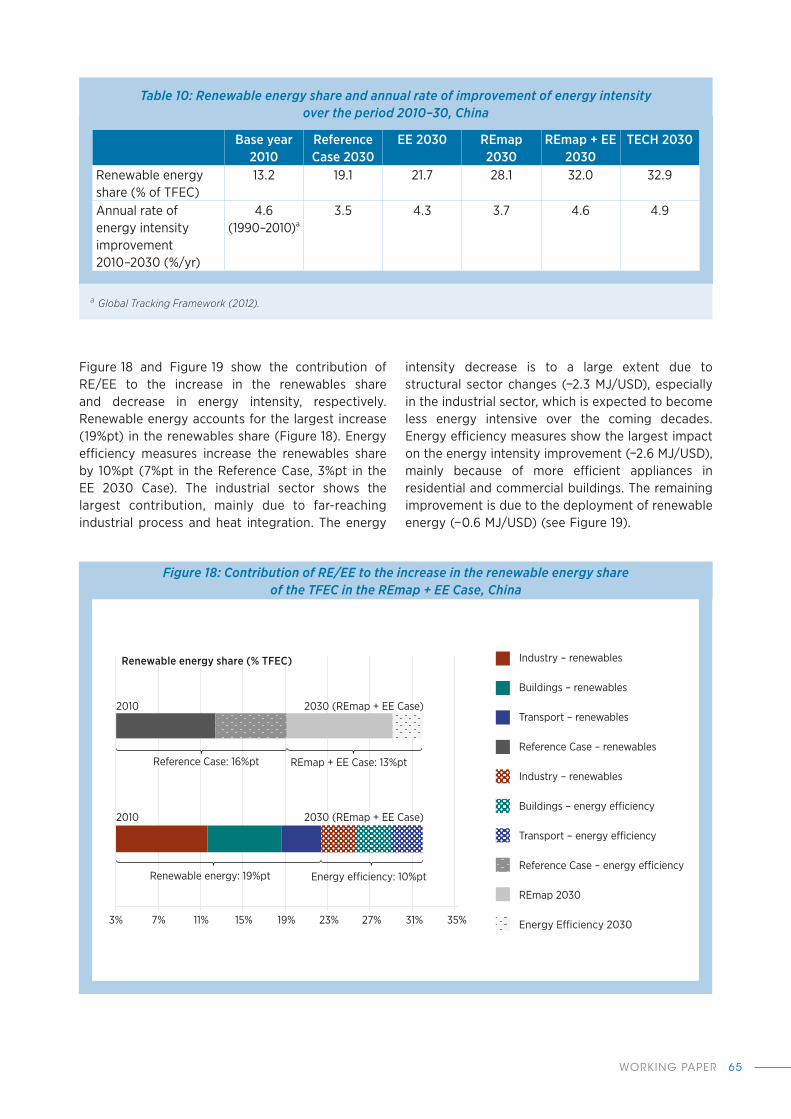
WORKING PAPER 65
Figure 18 and Figure 19 show the contribution of RE/EE to the increase in the renewables share and decrease in energy intensity, respectively� Renewable energy accounts for the largest increase (19%pt) in the renewables share (Figure 18)� Energy efficiency measures increase the renewables share by 10%pt (7%pt in the Reference Case, 3%pt in the EE 2030 Case)� The industrial sector shows the largest contribution, mainly due to far-reaching industrial process and heat integration� The energy
intensity decrease is to a large extent due to structural sector changes (−2�3 MJ/USD), especially in the industrial sector, which is expected to become less energy intensive over the coming decades� Energy efficiency measures show the largest impact on the energy intensity improvement (−2�6 MJ/USD), mainly because of more efficient appliances in residential and commercial buildings� The remaining improvement is due to the deployment of renewable energy (−0�6 MJ/USD) (see Figure 19)�
Figure 18: Contribution of RE/EE to the increase in the renewable energy share of the TFEC in the REmap + EE Case, China
2010 2030 (REmap + EE Case)
2010 2030 (REmap + EE Case)
Reference Case: 16%pt REmap + EE Case: 13%pt
Renewable energy: 19%pt Energy e�ciency: 10%pt
3% 7% 11% 15% 19% 23% 27% 31% 35%
Renewable energy share (% TFEC) Industry – renewables
Buildings – renewables
Transport – renewables
Industry – renewables
Buildings – energy e�ciency
Transport – energy e�ciency
Reference Case – energy e�ciency
REmap 2030
Energy E�ciency 2030
Reference Case – renewables
Base year 2010
Reference Case 2030
EE 2030 REmap 2030
REmap + EE 2030
TECH 2030
Renewable energy share (% of TFEC)
13�2 19�1 21�7 28�1 32�0 32�9
Annual rate of energy intensity improvement 2010–2030 (%/yr)
4�6 (1990–2010)a
3�5 4�3 3�7 4�6 4�9
Table 10: Renewable energy share and annual rate of improvement of energy intensity over the period 2010–30, China
a Global Tracking Framework (2012).

SYNERGIES66
Figure 20 presents the CO₂ emissions in China for the various analysed cases� The CO₂ emissions increase from 7�8 Gt/yr in Reference Case in 2010 to 11�3 Gt/yr in the Reference Case in 2030 is due to strong economic growth as well as higher transport and building demand� The CO₂ emissions in the
Reference Case in 2030 are 6�8 Gt/yr lower (−38%) than in the Frozen Efficiency Case, which demonstrates the ambitious deployment of renewable energy and efficiency measures assumed in the Reference Case� The REmap and EE Options would result in a further reduction of 3�4 and 1�7 GtCO₂/yr, respectively�
Figure 19: Contribution of RE/EE to the decrease in energy intensity in the REmap + EE Case, China
Figure 20: CO₂ emissions for the various analysed cases, China
3 4 5 6 7 8 9 10
ReferenceCase: 3.2
REmap +EE Case: 1.0
Renewableenergy: 0.6
Energye�ciency: 2.6
Energy intensity 2010–2030 (MJ/USD) Heat – energy e�ciency
Power – energy e�ciency
Transport – energy e�ciency
Buildings – energy e�ciency
Industry – energy e�ciency
Reference Case – renewables
Heat – renewables
Power – renewables
Transport – renewables
Buildings – renewables
Industry – renewables
Reference Case – energy e�ciency
REmap 2030
EE 2030
Structural sector changes
2010
20102030 (REmap + EE)
2030 (REmap + EE)
2.31 2.714.72
2.63 2.422.46 2.25 2.19
0.47 0.55
1.26
0.45 0.37 0.27 0.19 0.130.55 0.65
1.86
1.28 1.00 1.21 0.93 0.65
3.233.79
7.95
5.31
2.804.43
1.93 1.97
0.330.39
0.33
0.40
0.40
0.25
0.25 0.24
0.941.10
1.93
1.21
0.84
1.03
0
4
8
12
16
20
−38%
−30% −15% −51% −52%
Industry
Other
Buildings
Transport
Power
Heat
CO2 emissions (Gt/yr)
2010
2014
Froz
en E�
cienc
y
Referen
ce C
ase
REmap
REmap +
EETE
CHEE
0.00 0.25

WORKING PAPER 67
Figure 21 shows the costs and externalities of the REmap and REmap + EE Cases in 2030� Also, the incremental annual systems costs increase significantly from USD 52 billion per year (REmap)
to USD 198 billion per year (REmap + EE)� However, the cost savings related to human health and CO₂ emissions increase even further, thus leading to lower net incremental annual system costs�
Figure 21: Incremental annual system costs and externalities of the REmap and REmap + EE Cases, China
Note: A low and high estimate is given for the externality savings.
−600
−400
−500
−300
−200
−100
0
100
200
Direct costs
CO2 emissions
Human health
Costs
Low
REmap
High Low
REmap + EE
High
Costs SavingsSavings
Incremental annual system costs and savings (bln USD/yr) China

SYNERGIES68
Table 11 presents the cost supply data for China�
EE 2030 Case REmap 2030 Case
TFEC savings (PJ/yr)
TPES savings (PJ/yr)
Incre- mental costs:
primary energy (USD/
GJ)
Incre- mental system costs (bln
USD/yr)
RE share TPES
increase (%-pt)
TFEC replaced (PJ/yr)
TPES savings (PJ/yr)
Incre- mental costs:
primary energy (USD/
GJ)
Incre- mental system costs (bln
USD/yr)
RE share TPES
increase (%-pt)
INDUSTRY INDUSTRYINDUSTRY SECTOR Autoproducers,
CHP electricity part (solid biomass)
200 415 −3�4 −1�4 0�4%
Cross-cutting: Pumps, compressors, motors and fans
1 784 3 717 −3�1 −11�4 1�0% Solar cooling 200 −90 −3�8 0�3 −0�1%
Cross-cutting: Heat and process integration
2 014 2 014 −6�8 −13�7 0�5% Solar thermal 935 104 94�7 9�8 0�1%
Cement: Best practice efficiency in dry process kilns
577 577 −1�0 −0�6 0�1% Geothermal 145 16 49�4 0�8 0�0%
Space heating: Air-to-air heat pumps (LT Industry)
290 32 27�0 0�9 0�0%
Autoproducers, CHP heat part (solid biomass)
838 −311 −15�7 4�9 −0�3%
TECHNOLOGICAL CHANGE
Industrial sector: Heat pumps
0 0 0�0 0�0 0�0%
Iron and steel: Shift from basic oxygen furnace to electric arc furnaces
0 0 0�0 0�0 0�0%
BUILDINGS SECTOR BUILDINGS EFFICIENCY MEASURES
Space heating: Air-to-air heat pumps
320 1 179 −2�7 −3�1 1�1%
More efficient boilers 1 512 1 512 −3�2 −4�8 0�4% Water heating: Solar (thermosiphon)
570 633 3�6 2�3 0�6%
Lighting 1 089 2 270 0�6 1�4 0�6% Space heating: Biogas (coal rural)
200 178 5�9 1�0 0�2%
Appliances 1 278 2 663 −7�3 −19�4 0�7% Space heating: Pellet burners
500 500 −17�9 −9�0 0�5%
Cooling 620 1 291 7�6 9�8 0�3% Space heating: Biogas (replace traditional biomass)
216 259 2�3 0�6 0�2%
Space heating: Pellet burners
228 500 4�2 2�1 0�5%
Cooking biomass (solid)
81 74 8�9 0�7 0�1%
TECHNOLOGICAL CHANGE
Buildings sector: Heat pumps
0 0 0�0 0�0 0�0%
Table 11: Cost supply data for China

WORKING PAPER 69
EE 2030 Case REmap 2030 Case
TFEC savings (PJ/yr)
TPES savings (PJ/yr)
Incre- mental costs:
primary energy (USD/
GJ)
Incre- mental system costs (bln
USD/yr)
RE share TPES
increase (%-pt)
TFEC replaced (PJ/yr)
TPES savings (PJ/yr)
Incre- mental costs:
primary energy (USD/
GJ)
Incre- mental system costs (bln
USD/yr)
RE share TPES
increase (%-pt)
TRANSPORT SECTOR TRANSPORT EFFICIENCY MEASURES
PHEV (passenger road vehicles)
135 85 −40�9 −3�5 0�1%
Passenger vehicles: Best fuel economy
0 0 0�0 0�0 0�0% BEV (passenger road vehicles)
85 112 −20�7 −2�3 0�1%
Passenger vehicles: Reduction of resistance factors
0 0 0�0 0�0 0�0% BEV (public road vehicles)
10 23 5�3 0�1 0�0%
Freight vehicles: Weight reduction
0 0 0�0 0�0 0�0% BEV two-wheeler (passenger road)
15 114 6�2 0�7 0�1%
Freight vehicles: Reduction of resistance factors
0 0 0�0 0�0 0�0% City tram for passenger road vehicles
20 66 9�4 0�6 0�1%
Aviation: Improved air traffic management and procedures
0 0 0�0 0�0 0�0% High-speed train for passenger aviation
20 278 7�7 2�1 0�3%
TECHNOLOGICAL CHANGE
Further penetration BEV
2 031 3 649 −3�4 −12�3 0�9%
POWER SECTOR POWER EFFICIENCY MEASURES
Wind onshore 609 1 421 4�7 6�6 1�3%
Higher-efficiency NGCC plant
388 43 −9�9 −0�4 0�0% Wind offshore 97 227 12�0 2�7 0�2%
Solar PV (residen-tial/commercial)
225 525 4�5 2�4 0�5%
Solar PV (utility) 225 525 0�2 0�1 0�5%
Solar CSP, parabolic trough, no storage
100 30 119�7 3�6 0�0%
Landfill gas ICE 400 83 0�4 0�0 0�1%
Wind onshore (remote, existing)
830 1 936 6�8 13�2 1�8%
Wind offshore (remote, existing)
75 175 15�7 2�8 0�2%
Wind onshore 379 885 4�7 4�1 0�8%
TECHNOLOGICAL CHANGE
Solar PV (utility) 163 379 0�2 0�1 0�3%
Switch from coal to gas power plants
0 36 −3�4 197�6 3�1%
HEAT SECTOR HEATING
Biomass waste-to-energy
1 360 −1 209 −8�4 10�1 −1�1%
TOTAL 10 905 17 741 N/A 146 4.5% TOTAL 5 008 9145 N/A 53 8.4%
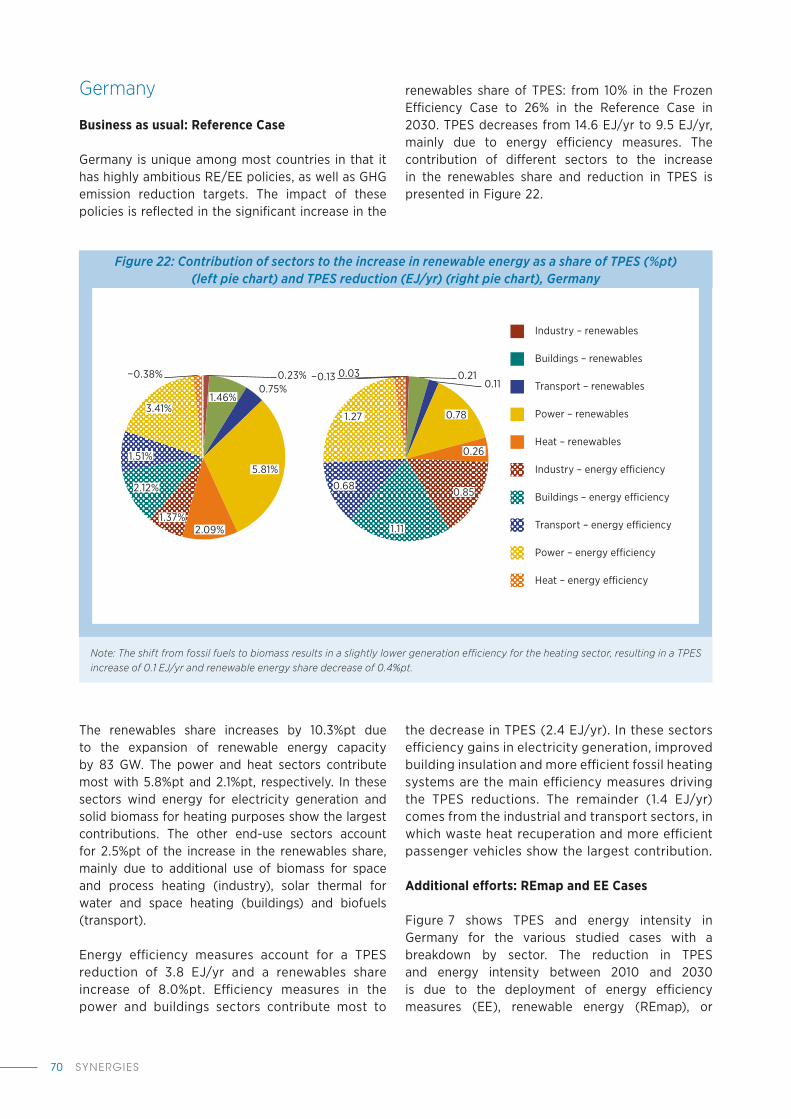
SYNERGIES70
Germany
Business as usual: Reference Case
Germany is unique among most countries in that it has highly ambitious RE/EE policies, as well as GHG emission reduction targets� The impact of these policies is reflected in the significant increase in the
renewables share of TPES: from 10% in the Frozen Efficiency Case to 26% in the Reference Case in 2030� TPES decreases from 14�6 EJ/yr to 9�5 EJ/yr, mainly due to energy efficiency measures� The contribution of different sectors to the increase in the renewables share and reduction in TPES is presented in Figure 22�
The renewables share increases by 10�3%pt due to the expansion of renewable energy capacity by 83 GW� The power and heat sectors contribute most with 5�8%pt and 2�1%pt, respectively� In these sectors wind energy for electricity generation and solid biomass for heating purposes show the largest contributions� The other end-use sectors account for 2�5%pt of the increase in the renewables share, mainly due to additional use of biomass for space and process heating (industry), solar thermal for water and space heating (buildings) and biofuels (transport)�
Energy efficiency measures account for a TPES reduction of 3�8 EJ/yr and a renewables share increase of 8�0%pt� Efficiency measures in the power and buildings sectors contribute most to
the decrease in TPES (2�4 EJ/yr)� In these sectors efficiency gains in electricity generation, improved building insulation and more efficient fossil heating systems are the main efficiency measures driving the TPES reductions� The remainder (1�4 EJ/yr) comes from the industrial and transport sectors, in which waste heat recuperation and more efficient passenger vehicles show the largest contribution�
Additional efforts: REmap and EE Cases
Figure 7 shows TPES and energy intensity in Germany for the various studied cases with a breakdown by sector� The reduction in TPES and energy intensity between 2010 and 2030 is due to the deployment of energy efficiency measures (EE), renewable energy (REmap), or
Figure 22: Contribution of sectors to the increase in renewable energy as a share of TPES (%pt) (left pie chart) and TPES reduction (EJ/yr) (right pie chart), Germany
Note: The shift from fossil fuels to biomass results in a slightly lower generation efficiency for the heating sector, resulting in a TPES increase of 0.1 EJ/yr and renewable energy share decrease of 0.4%pt.
Industry – renewables
Buildings – renewables
Transport – renewables
Power – renewables
Heat – renewables
Industry – energy e�ciency
Buildings – energy e�ciency
Transport – energy e�ciency
Power – energy e�ciency
Heat – energy e�ciency
0.110.210.030.23%
0.75%
5.81%
2.09%1.37%
2.12%
1.51%
−0.38%
1.46%
−0.13
0.68
1.11
0.85
0.26
0.783.41%
1.27

WORKING PAPER 71
both (Reference Case; REmap + EE; TECH)� The Frozen Efficiency Case shows the TPES and energy intensity in 2030 whereby energy efficiency and the renewables share remain constant over the period 2010–30� The increase in TPES in this case is due to the growth in GDP from 3�1 trillion USD to
3�9 trillion USD (23%)� The TECH Case represents a combination of the REmap Options and the full technical potential of energy efficiency measures in 2030�
The reductions in TPES (5�2 EJ/yr; 35%) and energy intensity (4�1 to 2�4 MJ/USD; 35%), related to the implementation of RE/EE measures over the period 2010–30 in the Reference Case, are represented by the grey arrows�
The white arrows denote the changes relative to the Reference Case in 2030� The TPES can be reduced by 0�8 EJ/yr (−8%) and 0�4 EJ/yr (−4%) by applying additional energy efficiency measures and renewable energy, respectively� Together, a TPES reduction of 1�2 EJ/yr (−12%) is achieved in the REmap + EE Case� The total technical potential of energy efficiency measures together with the REmap Options was estimated to be 1�4 EJ/yr (−15%)� The small difference (−0�2 EJ/yr) between the REmap + EE Case and TECH Case is due to the ambitious Reference Case made for Germany, which assumes the assertive adoption of energy efficiency
measures across all sectors� The decrease in energy intensity is directly related to the decline in TPES� The REmap 2030 + EE Case shows a total decrease of 0�3 MJ/USD�
Table 12 presents the renewables share and annual improvement rate of energy intensity over the period 2010–30� Note that the deployment of RE/EE in the Reference Case accounts for the largest increase in both the renewables share and annual energy intensity improvement rate�
Figure 23: TPES and contribution to the decrease in energy intensity, Germany
Industry – renewables
Buildings – renewables
Transport – renewables
Power – renewables
Heat – renewables
Energy intensity (MJ/USD)TPES (EJ/yr)
2010
Froz
en E�
cienc
y
Referen
ce C
ase EE
REmap
REmap +
EETE
CH
1.95 2.30 1.42 1.03 1.34 1.95 0.91
2.793.10
1.77 1.73 1.61 1.56 1.51
2.502.92
2.141.97 2.07
1.90 1.81
4.89
5.19
3.152.98 3.06
2.89 2.90
0.79
1.05
0.920.92 0.92
0.92 0.88
0
3
6
9
12
15
−8% −4% −12% −15%
−35%
2010
Froz
en E�
cienc
y
Referen
ce C
ase EE
REmap
REmap +
EETE
CH
0.62 0.60 0.37 0.27 0.35 0.25 0.24
0.89 0.81
0.46 0.45 0.42 0.41 0.39
0.80 0.76
0.56 0.51 0.54 0.49 0.47
1.561.35
0.820.77 0.80
0.75 0.75
0.250.27
0.240.24 0.24
0.24 0.23
0
1
2
3
4
5
−35%
−8% −4% −12% −15%
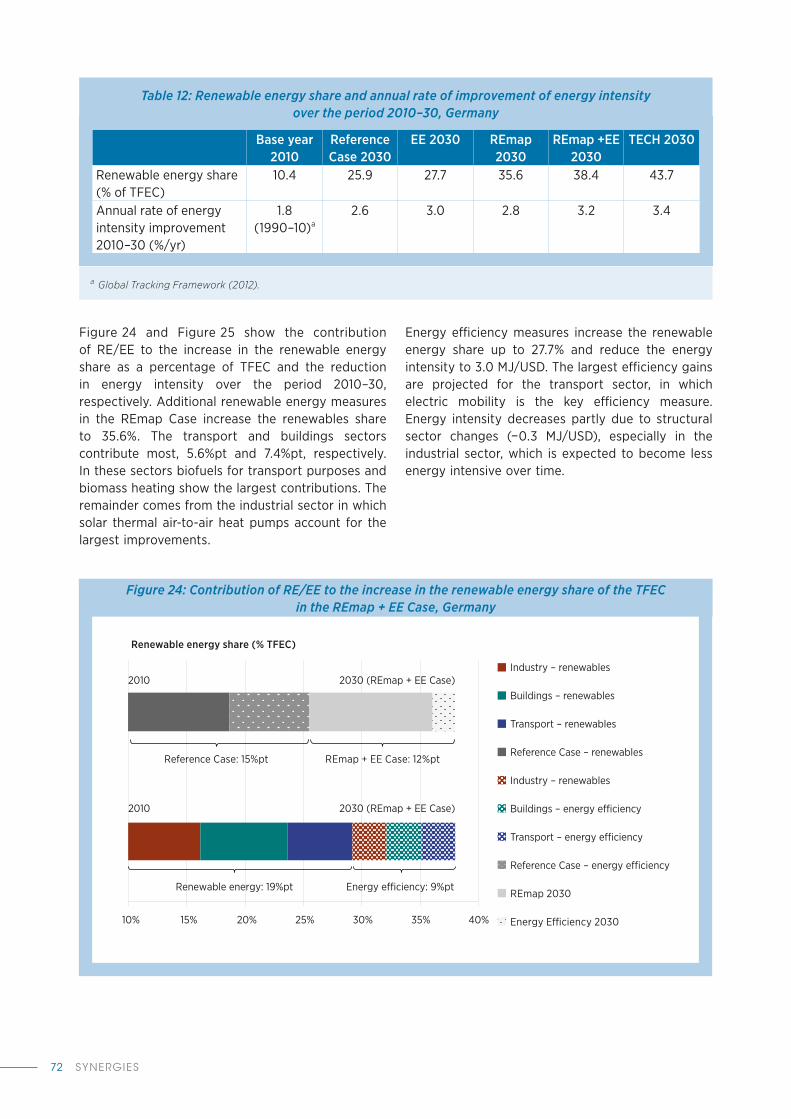
SYNERGIES72
Base year 2010
Reference Case 2030
EE 2030 REmap 2030
REmap +EE 2030
TECH 2030
Renewable energy share (% of TFEC)
10�4 25�9 27�7 35�6 38�4 43�7
Annual rate of energy intensity improvement 2010–30 (%/yr)
1�8 (1990–10)a
2�6 3�0 2�8 3�2 3�4
Figure 24 and Figure 25 show the contribution of RE/EE to the increase in the renewable energy share as a percentage of TFEC and the reduction in energy intensity over the period 2010–30, respectively� Additional renewable energy measures in the REmap Case increase the renewables share to 35�6%� The transport and buildings sectors contribute most, 5�6%pt and 7�4%pt, respectively� In these sectors biofuels for transport purposes and biomass heating show the largest contributions� The remainder comes from the industrial sector in which solar thermal air-to-air heat pumps account for the largest improvements�
Energy efficiency measures increase the renewable energy share up to 27�7% and reduce the energy intensity to 3�0 MJ/USD� The largest efficiency gains are projected for the transport sector, in which electric mobility is the key efficiency measure� Energy intensity decreases partly due to structural sector changes (−0�3 MJ/USD), especially in the industrial sector, which is expected to become less energy intensive over time�
Table 12: Renewable energy share and annual rate of improvement of energy intensity over the period 2010–30, Germany
Figure 24: Contribution of RE/EE to the increase in the renewable energy share of the TFEC in the REmap + EE Case, Germany
Industry – renewables
Buildings – renewables
Transport – renewables
Reference Case – renewables
Industry – renewables
Buildings – energy e�ciency
Transport – energy e�ciency
Reference Case – energy e�ciency
REmap 2030
Energy E�ciency 203010% 15% 20% 25% 30% 35% 40%
REmap + EE Case: 12%ptReference Case: 15%pt
Energy e�ciency: 9%ptRenewable energy: 19%pt
2030 (REmap + EE Case)
2030 (REmap + EE Case)2010
2010
Renewable energy share (% TFEC)
a Global Tracking Framework (2012).

WORKING PAPER 73
Figure 25: Contribution of RE/EE to the decrease in energy intensity in the REmap + EE Case, Germany
2 2.5 3 3.5 4 4.5
REmap +EE Case: 0.3
ReferenceCase: 1.3
Energy e�ciency: 1.2 Renewable energy: 0.5
2030 (REmap + EE Case)
2030 (REmap + EE Case) 2010
2010
Energy intensity 2010–2030 (MJ/USD) Heat – energy e�ciency
Power – energy e�ciency
Transport – energy e�ciency
Buildings – energy e�ciency
Industry – energy e�ciency
Reference Case – renewables
Heat – renewables
Power – renewables
Transport – renewables
Buildings – renewables
Industry – renewables
Reference Case – energy e�ciency
REmap 2030
EE 2030
Structural sector changes
The potential for CO₂ emission reductions in Germany as a result of RE/EE measures is substantial (see Figure 26)� CO₂ emissions already decreased from 0�94 Gt/yr in 2010 to 0�90 Gt/yr in 2015� By 2030, under the Reference Case, emissions will fall to 0�62 Gt/yr, a reduction of 34% from 2010 levels� The EE and REmap Options would result in a further reduction of 0�10 and 0�11 GtCO₂/yr by 2030, respectively� By combining RE/EE measures, total CO₂ emissions can be reduced to 0�41 GtCO₂/ yr� By implementing all efficiency measures in the TECH Case, CO₂ emissions can be brought
down to 0�39 GtCO₂� The German government is planning to publish a Climate Action Plan for 2050, which specifies the further reduction steps needed to realise as high as 80–90% emission reductions by 2050 compared to 1990 levels� One study that explores this significant level of emission reduction was done by Fraunhofer and Öko Institute (2016), which modelled how the country can achieve between 80–95%� The study shows how both renewable energy and energy efficiency will play the key role in achieving this emission reduction potential�
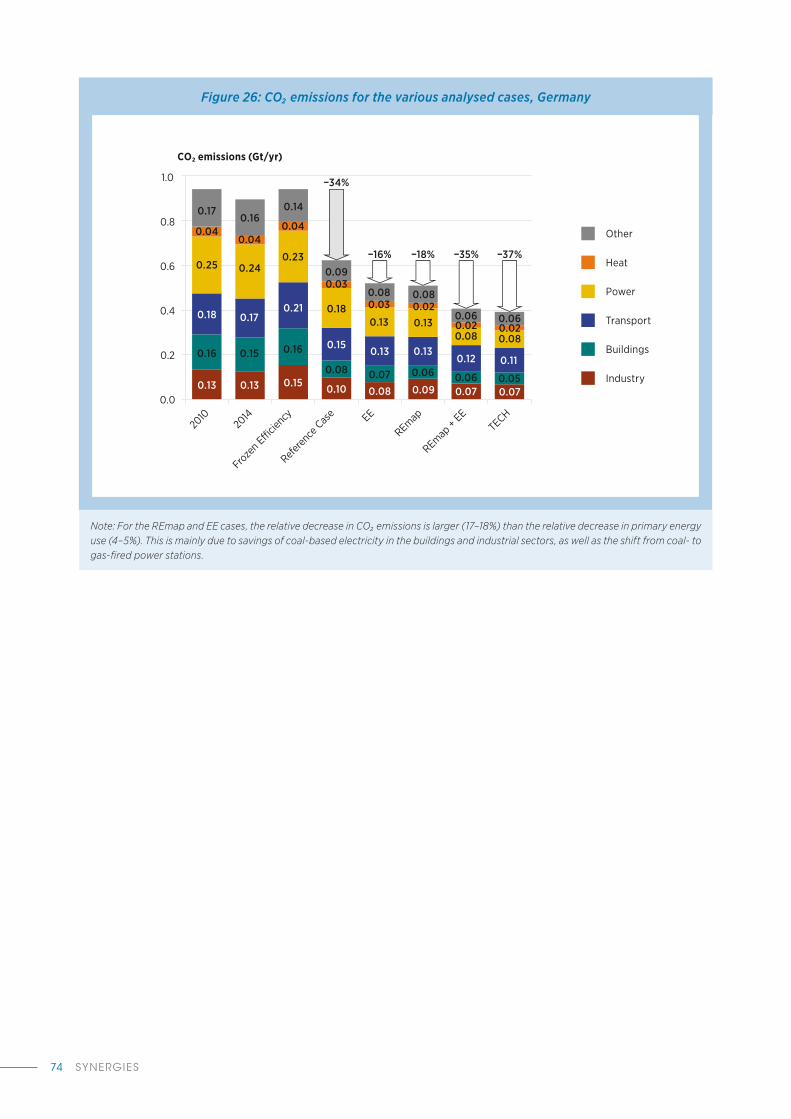
SYNERGIES74
Figure 26: CO₂ emissions for the various analysed cases, Germany
Note: For the REmap and EE cases, the relative decrease in CO₂ emissions is larger (17–18%) than the relative decrease in primary energy use (4–5%). This is mainly due to savings of coal-based electricity in the buildings and industrial sectors, as well as the shift from coal- to gas-fired power stations.
0.17
0.04
0.25
0.18
0.16
0.13
0.08
−34%
−16% −18% −35% −37%
0.03
0.13
0.13
0.07
0.08
0.080.020.13
0.13
0.06
0.09
0.060.020.08
0.12
0.060.07
0.060.020.08
0.11
0.050.07
0.090.03
0.18
0.15
0.08
0.10
0.14
0.04
0.23
0.21
0.16
0.15
0.16
0.04
0.24
0.17
0.15
0.13Industry
Other
Buildings
Transport
Power
Heat
CO2 emissions (Gt/yr)
0.0
0.2
0.4
0.6
0.8
1.0
2010
2014
Froz
en E�
cienc
y
Referen
ce C
ase EE
REmap
REmap +
EETE
CH
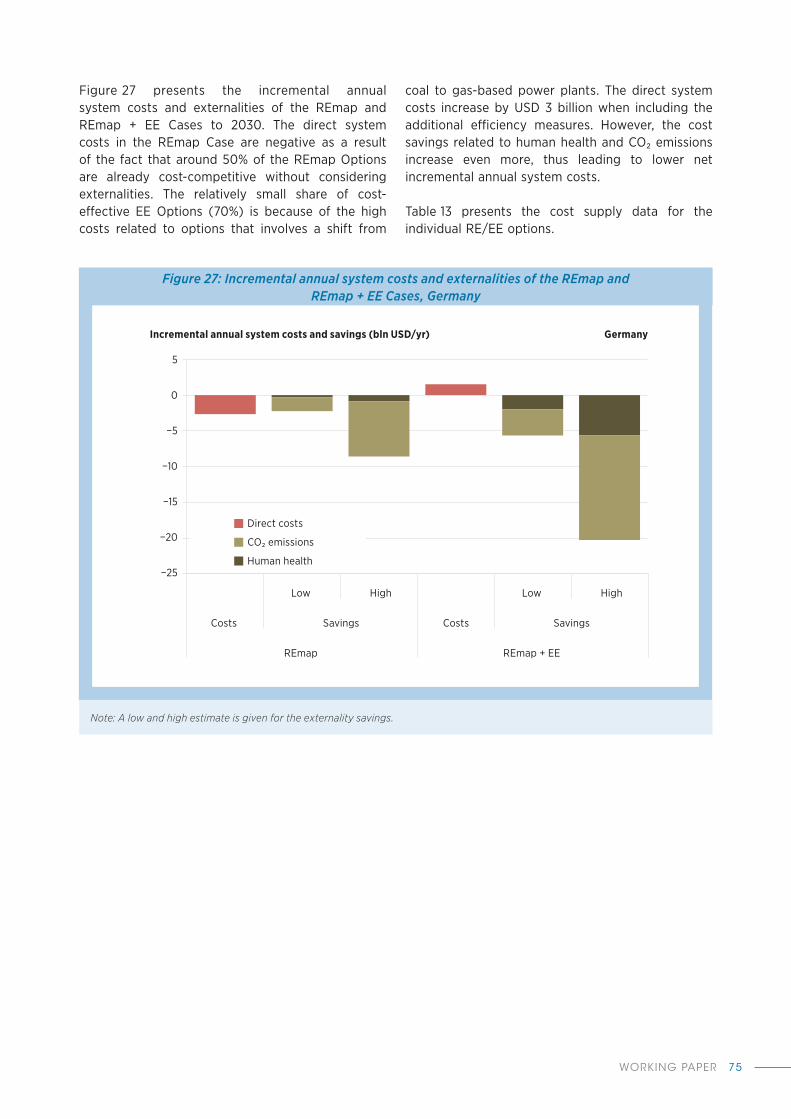
WORKING PAPER 75
Figure 27: Incremental annual system costs and externalities of the REmap and REmap + EE Cases, Germany
Note: A low and high estimate is given for the externality savings.
Incremental annual system costs and savings (bln USD/yr)
−25
−20
−15
−10
−5
0
5
Direct costs
CO2 emissions
Human health
Costs
Low
REmap
High Low
REmap + EE
High
Costs SavingsSavings
Germany
Figure 27 presents the incremental annual system costs and externalities of the REmap and REmap + EE Cases to 2030� The direct system costs in the REmap Case are negative as a result of the fact that around 50% of the REmap Options are already cost-competitive without considering externalities� The relatively small share of cost-effective EE Options (70%) is because of the high costs related to options that involves a shift from
coal to gas-based power plants� The direct system costs increase by USD 3 billion when including the additional efficiency measures� However, the cost savings related to human health and CO₂ emissions increase even more, thus leading to lower net incremental annual system costs�
Table 13 presents the cost supply data for the individual RE/EE options�
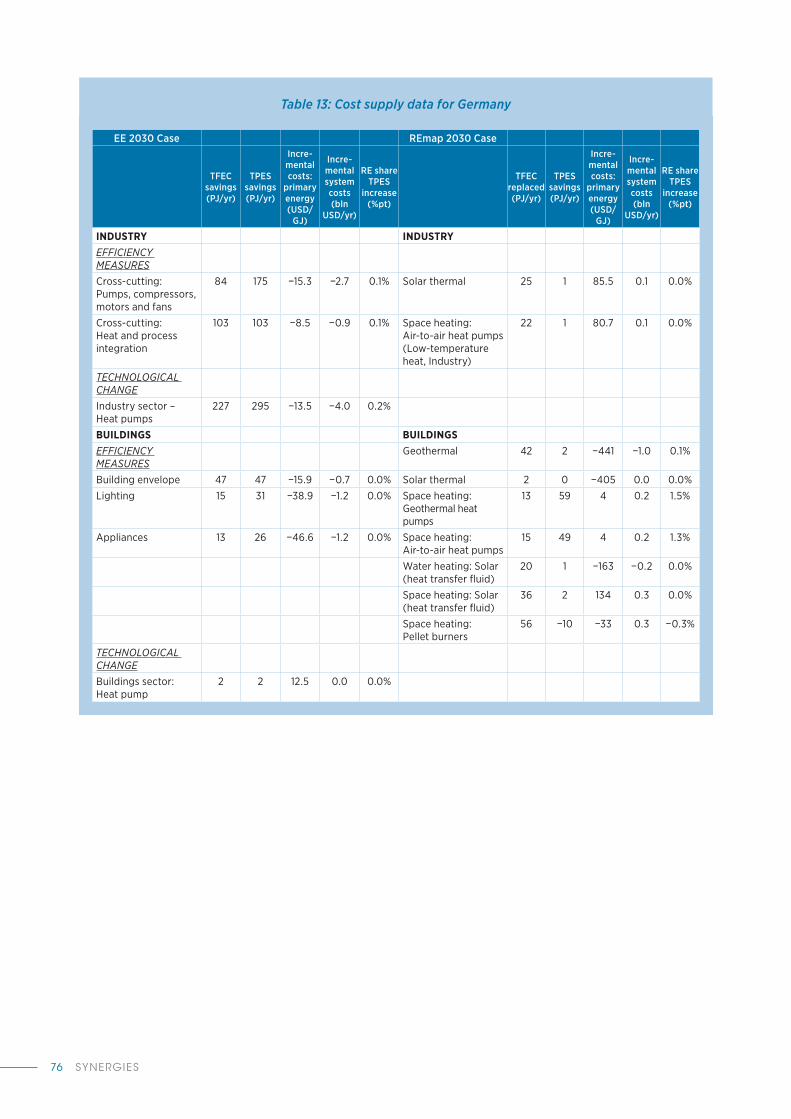
SYNERGIES76
EE 2030 Case REmap 2030 Case
TFEC savings (PJ/yr)
TPES savings (PJ/yr)
Incre- mental costs:
primary energy (USD/
GJ)
Incre- mental system costs (bln
USD/yr)
RE share TPES
increase (%pt)
TFEC replaced (PJ/yr)
TPES savings (PJ/yr)
Incre- mental costs:
primary energy (USD/
GJ)
Incre- mental system costs (bln
USD/yr)
RE share TPES
increase (%pt)
INDUSTRY INDUSTRYEFFICIENCY MEASURES
Cross-cutting: Pumps, compressors, motors and fans
84 175 −15�3 −2�7 0�1% Solar thermal 25 1 85�5 0�1 0�0%
Cross-cutting: Heat and process integration
103 103 −8�5 −0�9 0�1% Space heating: Air-to-air heat pumps (Low-temperature heat, Industry)
22 1 80�7 0�1 0�0%
TECHNOLOGICAL CHANGE
Industry sector – Heat pumps
227 295 −13�5 −4�0 0�2%
BUILDINGS BUILDINGSEFFICIENCY MEASURES
Geothermal
42 2 −441 −1�0 0�1%
Building envelope 47 47 −15�9 −0�7 0�0% Solar thermal 2 0 −405 0�0 0�0%
Lighting
15 31 −38�9 −1�2 0�0% Space heating: Geothermal heat pumps
13 59 4 0�2 1�5%
Appliances
13 26 −46�6 −1�2 0�0% Space heating: Air-to-air heat pumps
15 49 4 0�2 1�3%
Water heating: Solar (heat transfer fluid)
20 1 −163 −0�2 0�0%
Space heating: Solar (heat transfer fluid)
36 2 134 0�3 0�0%
Space heating: Pellet burners
56 −10 −33 0�3 −0�3%
TECHNOLOGICAL CHANGE
Buildings sector: Heat pump
2 2 12�5 0�0 0�0%
Table 13: Cost supply data for Germany

WORKING PAPER 77
Note: PHEV = plug-in hybrid electric vehicle.
EE 2030 Case REmap 2030 Case
TFEC savings (PJ/yr)
TPES savings (PJ/yr)
Incre- mental costs:
primary energy (USD/
GJ)
Incre- mental system costs (bln
USD/yr)
RE share TPES
increase (%pt)
TFEC replaced (PJ/yr)
TPES savings (PJ/yr)
Incre- mental costs:
primary energy (USD/
GJ)
Incre-mental system costs (bln
USD/yr)
RE share TPES
increase (%pt)
TRANSPORT TRANSPORT EFFICIENCY MEASURES
Second-generation bioethanol (passen-ger road vehicles)
4�2 0 0 0�0 0�0%
Biodiesel (passenger road vehicles)
77�6 0 0 0�5 0�0%
Biodiesel (freight road vehi-cles)
7�0 0 661 0�0 0�0%
Biomethane (public road vehicles)
5�2 2 39 0�1 0�1%
Biofuels (passenger aviation)
51�0 0 0 −1�1 0�0%
PHEV (passenger road vehicles)
17�9 1 −51 −0�1 0�0%
PHEV (light-freight road vehicles)
6�2 −1 −32 0�0 0�0%
BEV (passenger road vehicles)
9�6 12 −6 −0�1 0�3%
BEV (light-freight road vehicles)
4�7 0 266 0�1 0�0%
Battery electric two-wheeler (passenger road)
1�0 10 −4 0�0 0�2%
TECHNOLOGICAL CHANGE
Further penetration BEV
95 171 −3�4 −0�6 0�1%
Further penetration PHEV
31 410 −3�8 −1�6 0�3%
POWER POWEREFFICIENCY MEASURES
Hydro (small) 10�1 11 20 0�2 0�3%
Higher-efficiency NGCC plant
4 7 −18�2 −0�1 0�0% Hydro (large) 4�3 5 1 0�0 0�1%
Wind onshore 109�2 118 −6 −0�7 3�0%
Wind offshore 72�0 78 −2 −0�1 2�0%
Solar PV (residential/commercial)
46�8 51 0 0�0 1�3%
Solar PV (utility) 3�6 4 −10 0�0 0�1%
Geothermal 11�2 −89 −1 0�1 −2�3%
Wind onshore 75�3 82 −6 −0�5 2�1%
TECHNOLOGICAL CHANGE
Switch from coal to gas power plants
0 1 753 9�2 16�2 1�5%
TOTAL 615 3 020 N/A 3 2.6% TOTAL 416 391 N/A −2 9.9%

SYNERGIES78
India
Business as usual: Reference Case
Figure 28 presents the contribution of different sectors to the increase in the renewables share and reduction in TPES in India�
The renewable energy share increases from 8�0% in the Frozen Efficiency Case to 14�9% in the Reference Case in 2030, due to both additional renewable energy capacity and energy efficiency measures� Additional renewable energy capacity in the power and industrial sectors makes the
greatest contribution (2�5 EJ/yr; 3�0%pt), mainly via solar PV for electricity production and solar thermal and cooling in industry� The other 0�6%pt comes from the expansion of the EV fleet in the transport sector and biomass use in the buildings and heat sectors�
Energy efficiency improvements in the buildings (9�8 EJ/yr) and power (1�9 EJ/yr) sectors show the largest contribution to the decrease in TPES� In these sectors better building insulation and more efficient power generation are the main drivers behind the TPES reductions� The remainder (1�6 EJ/yr) comes mainly from the industrial sector�
Figure 28: Contribution of sectors to the increase in the renewable energy as a share of TPES (%pt) (left pie chart) and TPES reduction (EJ/yr) (right pie chart), India
Additional efforts: REmap and EE Cases
Figure 29 shows the TPES and energy intensity in India for the various analysed cases with a breakdown by sector� The increase in TPES in the Frozen Efficiency Case and Reference Case in 2030 is due to the growth in GDP from USD 3�7 trillion to USD 11�4 trillion (203%)� Moreover, the annual amount of transport kilometres as well as the residential and commercial building floor area, and thus specific energy consumption, is expected to increase significantly (US EIA, 2014)�
The TPES in 2030 falls from 90 EJ/yr in the Frozen Efficiency Case to 68 EJ/yr in the Reference Case; accordingly, the energy intensity decreases from 7�9 MJ/USD to 6�0 MJ/USD (25%)� The TPES can be further reduced by 8 EJ/yr (12%) and 11 EJ/yr (16%) by applying additional energy efficiency measures and renewable energy, respectively� Together, therefore, a TPES reduction of 19 EJ/yr (28%) is achieved� The REmap + EE Case shows a decrease of 1�7 MJ/USD (28%) compared to the Reference Case in 2030�
Industry – renewables
Buildings – renewables
Transport – renewables
Power – renewables
Heat – renewables
Industry – energy e�ciency
Buildings – energy e�ciency
Transport – energy e�ciency
Power – energy e�ciency
Heat – energy e�ciency
0.62 0.380.10
1.86
1.68
9.780.302.33%
0.12%0.74%
0.46%
1.53%
0.05%
1.44%
0.23%
7.29

WORKING PAPER 79
Table 14 presents the renewables share and annual rate of improvement rate in energy intensity over the period 2010–30� In the Reference Case, the renewables share decreases from 39�9% to 22�2%� This reduction is due to the fact that fossil energy
use grows faster than renewable energy use� By deploying both the REmap Options and additional efficiency measures, the renewables share and energy intensity improvement rate can increase to 30�9% and 3�0%/yr, respectively�
Figure 29: TPES and contribution to the decrease in energy intensity, India
Base year 2010
Reference Case 2030
EE 2030 REmap 2030
REmap + EE 2030
TECH 2030
Renewable energy share (% of TFEC)
39�9 22�2 26�1 25�9 30�9 43�3
Annual rate of energy intensity improvement 2010–30 (%/yr)
2�4 (1990–2010)a
1�3 2�0 2�2 3�0 3�7
Table 14: Renewable energy share and annual rate of improvement of energy intensity over the period 2010–30, India
Industry – renewables
Buildings – renewables
Transport – renewables
Power – renewables
Heat – renewables
Energy intensity (MJ/USD)TPES (EJ/yr)
2010
Froz
en E�
cienc
y
Referen
ce C
ase EE
REmap
REmap +
EETE
CH
2010
Froz
en E�
cienc
y
Referen
ce C
ase EE
REmap
REmap +
EETE
CH
6.3218.67 16.37 13.98 16.40 13.98 9.68
10.53
25.0514.88
12.30 8.295.71
4.562.21
6.12
5.725.36 3.35
2.991.51
10.37
40.54
31.3928.33 29.30
26.2326.06
0
20
40
60
80
100−24%
−12% −16% −28% −39%
1.68 1.64 1.44 1.22 1.44 1.23 0.85
2.802.20
1.301.08 0.73
0.500.40
0.590.54
0.500.47 0.29
0.260.13
2.76 3.55
2.752.48 2.57
2.302.28
0
2
4
6
8
10
−24%
−12% −16% −28% −39%
a Global Tracking Framework (2012).

SYNERGIES80
Figure 30 and Figure 31 show the contribution of RE/EE to the increase in the renewable energy share and the reduction in energy intensity over the period 2010–30, respectively� Additional renewable energy measures in the REmap Case increase the renewable energy share to 25�9% in 2030� The buildings and industrial sectors contribute most with 6�6%pt and 5�3%pt, respectively� In these sectors biomass (buildings) and geothermal (industry) for
heating purposes show the largest contributions� The remainder comes from the transport sector, in which EVs account for the largest improvements� Energy efficiency measures increase the renewable energy share to 2�1% and reduce the energy intensity to 5�3 MJ/USD� The largest efficiency gains are projected for the buildings sector, in which better insulation and higher-efficiency household appliances are the key efficiency measures�
Figure 30: Contribution of RE/EE to the increase in the renewable energy share of the TFEC in the REmap + EE Case, India.
Figure 31: Contribution of RE/EE to the decrease in energy intensity in the REmap + EE Case, India
Renewable energy share (% TFEC)
2010 2030 (REmap + EE)
2010 2030 (REmap + EE)
Reference Case: 16%pt REmap + EE Case: 9%pt
Renewable energy: 16%pt Energy e�ciency: 9%pt
6% 11% 16% 21% 26% 31% 36%
Industry – renewables
Buildings – renewables
Transport – renewables
Industry – renewables
Buildings – energy e�ciency
Transport – energy e�ciency
Reference Case – energy e�ciency
REmap 2030
Energy E�ciency 2030
Reference Case – renewables
4 54.5 76.565.5 7.5 8 8.5
Reference Case: 1.9REmap + EE case: 1.7
Renewable energy: 1.2Energy e�ciency: 2.4
2010
20102030 (REmap + EE)
2030 (REmap + EE)
Energy intensity 2010–2030 (MJ/USD) Heat – energy e�ciency
Power – energy e�ciency
Transport – energy e�ciency
Buildings – energy e�ciency
Industry – energy e�ciency
Reference Case – renewables
Heat – renewables
Power – renewables
Transport – renewables
Buildings – renewables
Industry – renewables
Reference Case – energy e�ciency
REmap 2030
EE 2030
Structural sector changes

WORKING PAPER 81
Figure 32 presents the CO₂ emissions in India for the various analysed cases� The CO₂ emissions increase from 1�9 Gt/yr in the Reference Case in 2010 to 5�5 Gt/yr in the 2030 Reference Case� The CO₂ emissions in the Reference Case are 0�7 Gt/yr (−11%) lower compared to the Frozen Efficiency Case
in 2030 due to RE/EE measures� The REmap and EE 2030 Options would result in a further reduction of 1�7 and 0�9 GtCO₂/yr, respectively� By combining RE/EE measures (REmap + EE), total CO₂ emissions can be reduced to 2�4 Gt/yr�
Figure 32: CO₂ emissions for the various analysed cases, India
Industry
Other
Buildings
Transport
Power
Heat
0
1
2
3
4
5
6
7
0.470.080.17
0.87
0.36
0.630.110.22
1.15
0.48
1.35
0.190.43
3.23
0.97
0.620.140.10
1.12
0.90
0.180.19
1.13
1.13
0.320.22
2.17
0.72
1.19
0.320.43
2.68
0.86
0.96
0.180.40
1.64
0.59
11%
−31% −17% −56% −64%
CO2 emissions (Gt/yr)
2010
2014
Froz
en E�
cienc
y
Referen
ce C
ase
REmap
REmap +
EETE
CHEE
0.000.00
Figure 33 presents the incremental annual system costs and externalities of the REmap and REmap + EE Cases in 2030� The low incremental annual system costs are a result of the fact that around 36% of the REmap options and nearly 80% of all efficiency measures are already cost-competitive
without considering externalities� The annual costs of the REmap Case (USD 0�3 bln) become negative (USD −106 bln) when including the extra efficiency measures� Cost savings related to human health and CO₂ emissions increase by a factor of four when implementing the additional efficiency measures�
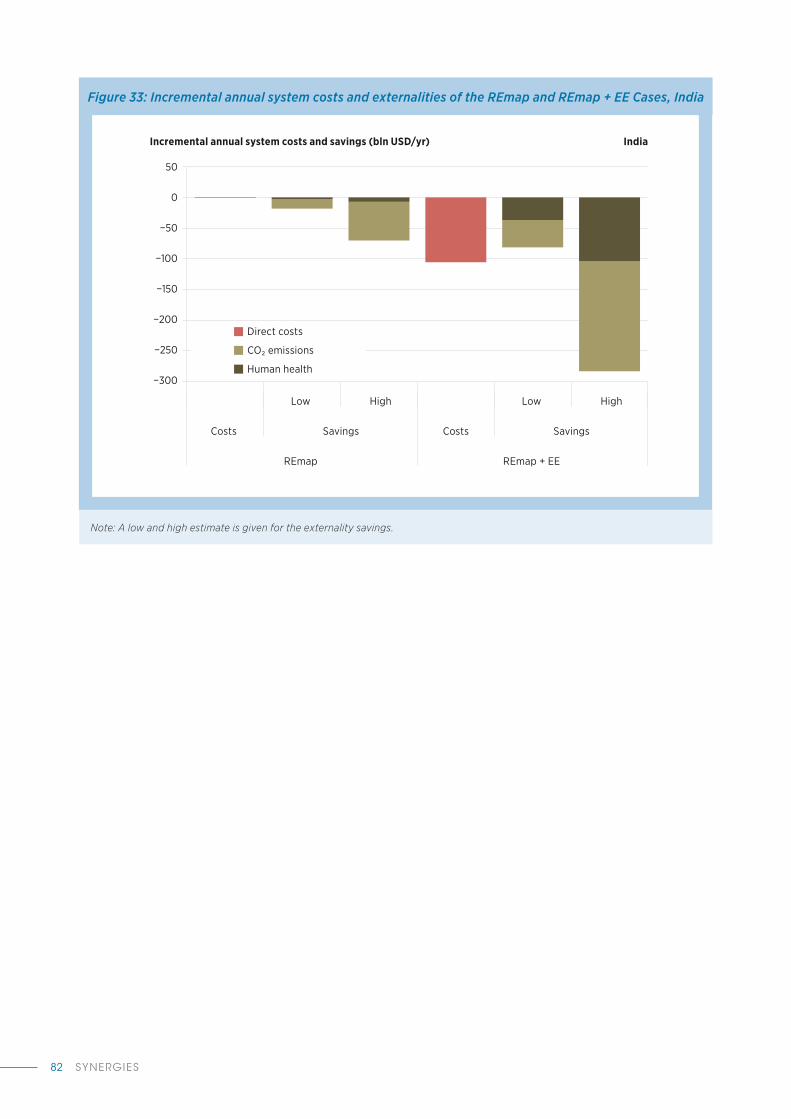
SYNERGIES82
Figure 33: Incremental annual system costs and externalities of the REmap and REmap + EE Cases, India
Note: A low and high estimate is given for the externality savings.
Incremental annual system costs and savings (bln USD/yr) India
−300
−250
−200
−150
−100
−50
0
50
Direct costs
CO2 emissions
Human health
Costs
Low
REmap
High Low
REmap + EE
High
Costs SavingsSavings

WORKING PAPER 83
Table 15 presents the cost supply data for India�
Table 15: Cost supply data for India
EE 2030 Case REmap 2030 Case
TFEC savings (PJ/yr)
TPES savings (PJ/yr)
Incre- mental costs:
primary energy (USD/
GJ)
Incre- mental system costs (bln
USD/yr)
RE share TPES
increase (%-pt)
TFEC replaced (PJ/yr)
TPES savings (PJ/yr)
Incre- mental costs:
primary energy (USD/
GJ)
Incre- mental system costs (bln
USD/yr)
RE share TPES
increase (%-pt)
INDUSTRY INDUSTRYEFFICIENCY MEASURES
Cross-cutting: Pumps, compressors, motors and fans
699 1 996 −4 −7 0�4% Autoproducers, CHP electricity part (solid biomass)
67 96 −4 −0�4 0�2%
Cross-cutting: Heat and process integration
1 813 1 813 −2 −3 0�4% Solar thermal 100 11 15 0�2 0�02%
Fuel savings in Iron & Steel sector
603 603 2 1 0�1% Geothermal 10 1 156 0�2 0�002%
Biomass gasification 75 −17 6 −0�1 −0�03%
Solar thermal (CST) 50 6 93 0�5 0�01%
Biogas heat industry (from AD)
150 −35 5 −0�2 −0�1%
Autoproducers, CHP heat part (solid biomass)
282 −105 −14 1�5 −0�2%
BUILDINGS BUILDINGSEFFICIENCY MEASURES
Energy Conservation Building Code
2 230 2 230 2 4 0�5% Space Cooling: Solar
8 11 10 0�1 0�02%
Appliances 587 1 677 −10 −17 0�4% Water heating: Solar (thermosiphon)
399 70 −149 −10�5 0�1%
Cooking: Solar 32 213 −2 −0�5 0�4%
Cooking: Solar 32 213 −2 −0�5 0�4%
Cooking biogas (from AD)
582 −194 27 −5�2 −2�3%
Cooking biogas (gasification)
100 300 −3 −0�9 0�6%
TECHNOLOGICAL CHANGE
Building sector – Heat pumps for heat-ing and cooling
270 119 −18 −2 0�03%
TRANSPORT TRANSPORTEFFICIENCY MEASURES
Vehicle efficiency improvement
65 65 −38 −2 0�01% First generation bioethanol (passen-ger road vehicles)
66 −7 −2 0�02 −0�01%

SYNERGIES84
EE 2030 Case REmap 2030 Case
TFEC savings (PJ/yr)
TPES savings (PJ/yr)
Incre- mental costs:
primary energy (USD/
GJ)
Incre- mental system costs (bln
USD/yr)
RE share TPES
increase (%-pt)
TFEC replaced (PJ/yr)
TPES savings (PJ/yr)
Incre- mental costs:
primary energy (USD/
GJ)
Incre- mental system costs (bln
USD/yr)
RE share TPES
increase (%-pt)
Second generation bioethanol (passen-ger road vehicles)
36 −4 −99 0�4 −0�01%
Biodiesel (public road vehicles)
227 363 −30 −11�1 0�7%
Biodiesel (passenger rail)
30 0 0�0 0�0 0�0%
Battery electric (pas-senger road vehicles)
140 22 −44 −1�0 0�04%
Battery electric (public road vehicles)
118 −31 −43 1�3 −0�1%
Battery Electric Two-wheeler (passenger road)
120 737 9 6�7 1�44%
City tram for passen-ger road vehicles
150 499 8 3�9 1�0%
High speed train for passenger aviation
60 199 6 1�2 0�4%
TECHNOLOGICAL CHANGE
Further penetration BEV
164 −79 13 −1 −0�02%
POWER POWEREFFICIENCY MEASURES
Hydro (Small) 214 397 3 1�1 0�77%
Higher efficiency NGCC plant
49 5 −1 0 0�001% Hydro (Large) 143 265 −2 −0�5 0�5%
Wind onshore 270 501 8 4�0 1�0%
Wind offshore 30 56 11 0�6 0�11%
Solar PV (Residen-tial/Commercial)
143 266 10 2�6 0�5%
Solar PV (Utility) 664 1 233 2 2�5 2�4%
Solar CSP PT no storage
100 −17 −157 2�7 −0�03%
Biomass steam cycle 88 20 78 1�8 0�04%
Biomass Fixed-bed Gasifer
29 −110 0�3 0�0 −0�2%
TECHNOLOGICAL CHANGE
Biomass Anaerobic Digester
29 0 0 0�2 0�00%
Switch from coal to gas power plants
0 8 387 −9 −78 1�8% Geothermal 59 −423 −2 0�9 −0�8%
Biomass gasifier/ biogas AD, offgrid
4 −11 −6 0�1 −0�02%
Solar PV – offgrid, partial storage, mobile towers
38 52 −40 2�1 0�10%
PV/Wind minigrid – partial storage, households
54 −54 −64 3�4 −0�1%
Biomass steam cycle (waste)
40 −11 −6 0�1 −0�02%
Wind onshore 54 101 8 0�8 0�2%
Solar PV (Utility) 54 101 2 0�2 0�2%
TOTAL 6 429 16 816 N/A −106 4% TOTAL 3 602 3 301 N/A 1 6%

WORKING PAPER 85
Japan
Business as usual: Reference Case
Figure 34 presents the contribution of different sectors to the reduction in TPES and increase in the renewables share in Japan�
Renewable energy as a share of TPES increases from 6�5% in the Frozen Efficiency Case to 12�5% in the Reference Case in 2030� The power and industrial sectors contribute most at 3�8%pt and 0�3%pt, respectively� In these sectors solar energy for electricity generation and solar thermal for heating in industry show the largest contributions�
TPES falls from 22�5 EJ/yr in the Frozen Efficiency Case to 18�4 EJ/yr in the Reference Case in 2030� Energy efficiency measures account for a TPES reduction of 3�1 EJ/yr and a renewables share increase of 1�8%pt� The power and transport sectors show the largest contribution (2�5 EJ/yr; 1�5%pt), mainly via more efficient power generation as well as vehicle fuel economy improvements� The remainder comes from the buildings and industrial sectors, in which high-efficiency lighting, improved insulation, energy management programmes (industry) and high-efficiency equipment (industry) show the largest contribution�
Figure 34: Contribution of sectors to the increase in the renewable energy as a share of TPES (%pt) (left pie chart) and TPES reduction (EJ/yr) (right pie chart), Japan
Additional efforts: REmap and EE Cases
Figure 35 shows the TPES and energy intensity in Japan for the various analysed cases with a breakdown by sector� The increase in TPES in the Frozen Efficiency Case is due to the growth in GDP from USD 4�0 trillion to USD 5�0 trillion (27%)�
In the Reference Case TPES falls from 20�0 EJ/ yr in 2010 to 18�4 EJ/yr in 2030� Over the same period,
energy intensity decreases from 5�1 MJ/USD to 3�7 MJ/USD (28%)� The TPES is further reduced by 2�4 EJ/yr (13%) and 1�1 EJ/yr (6%) by applying additional energy efficiency measures and renewable energy, respectively� The REmap + EE Case shows a decrease of 3�6 MJ/USD (20%) compared to the Reference Case in 2030� When implementing the full technical potential of energy efficiency up to 2030, TPES can be reduced to 13�0 EJ/yr (TECH Case)�
3.78%
0.14%0.20%0.33%
1.15%0.33%
0.01%0.08%
0.080.02
0.90
1.86
0.27
0.38
0.60
Industry – renewables
Buildings – renewables
Transport – renewables
Power – renewables
Heat – renewables
Industry – energy e�ciency
Buildings – energy e�ciency
Transport – energy e�ciency
Power – energy e�ciency
Heat – energy e�ciency

SYNERGIES86
Table 16 presents the renewables share and annual rate of improvement in energy intensity over the period 2010–30� In the Reference Case, the renewables share increases from 3�8% to 8�2%, while the annual energy intensity improvement rate rises from 1�2%/yr (1990–2010) to 1�6%/yr (2010–30)�
By deploying both the REmap Options and additional efficiency measures, the renewables share and energy intensity improvement rate increase to 18�2% and 2�7%/yr, respectively�
Figure 35: TPES and contribution to the decrease in energy intensity, Japan
Base year 2010
Reference Case 2030
EE 2030 REmap 2030
REmap + EE 2030
TECH 2030
Renewable energy share (% of TFEC)
3�8 8�2 9�6 15�5 18�2 20�0
Annual rate of energy intensity improvement 2010–30 (%/yr)
0�3 (1990–2010)a
1�6 2�3 1�9 2�7 3�3
Industry – renewables
Buildings – renewables
Transport – renewables
Power – renewables
Heat – renewables
Energy intensity (MJ/USD)TPES (EJ/yr)
3.74 4.22 3.86 2.38 3.83 2.35 2.22
2.61 2.88 2.502.30
1.441.24 0.66
3.36 3.552.93
2.92 2.822.81
2.18
10.2411.82
9.06
8.309.11
8.367.94
0.02
0.02
0
5
10
15
20
25−18%
−13% −6% −20% −29%
0.95 0.84 0.77 0.47 0.76 0.47 0.44
0.66 0.57 0.500.46
0.290.25 0.13
0.850.71
0.580.58 0.56
0.560.43
2.592.35
1.801.65 1.82
1.661.58
0.01
0.00
0
1
2
3
4
5
6
−18%
−13% −6% −20% −29%
2010
Froz
en E�
cienc
y
Referen
ce C
ase
REmap
REmap +
EETE
CHEE20
10
Froz
en E�
cienc
y
Referen
ce C
ase
REmap
REmap +
EETE
CHEE
0.02
0.020.02
0.020.02
0.00
0.000.00
0.000.00
a Global Tracking Framework (2012).
Table 16: Renewable energy share and annual rate of improvement of energy intensity over the period 2010–30, Japan

WORKING PAPER 87
Figure 36 and Figure 37 show the contribution of renewable energy and energy efficiency to the increase in the renewables share as a percentage of TFEC and the reduction in energy intensity over the period 2010–30, respectively�
Additional renewable energy measures in the REmap Case increase the renewable energy share to 15�5%� The buildings and industrial sectors contribute most with 3�8%pt and 3�3%pt, respectively� In these sectors heat pumps and solar thermal heating show the largest contributions� The remainder
comes from the transport sector (2�0%pt) in which biofuels and electric mobility account for the largest improvements�
Energy efficiency measures increase the renewable energy share up to 9�6% and reduce the energy intensity to 3�2 MJ/USD� With the REmap + EE Case the renewable energy share increases to over 18%� The largest efficiency gains are projected for the industrial sector, in which heat pumps and far-reaching heat and process integration are the key efficiency measures�
Figure 36: Contribution of RE/EE to the increase in the renewable energy share of the TFEC in the REmap + EE Case, Japan
Renewable energy share (% TFEC)
2010 2030 (REmap + EE Case)
2010 2030 (REmap + EE Case)
Reference Case: 5%pt REmap + EE Case: 9%pt
Renewable energy: 9%pt Energy e�ciency: 5%pt
4% 6% 8% 12%10% 18%16%14% 20%
Industry – renewables
Buildings – renewables
Transport – renewables
Industry – renewables
Buildings – energy e�ciency
Transport – energy e�ciency
Reference Case – energy e�ciency
REmap 2030
Energy E�ciency 2030
Reference Case – renewables

SYNERGIES88
Figure 38 presents the CO₂ emissions in Japan for the various analysed cases� The amount of CO₂ emissions decreased from 1�44 Gt/yr in 2010 to 1�39 Gt/yr in 2014� By 2030, under the Reference Case, CO₂ emissions are expected to fall to 1�27 Gt/ yr,
a reduction of around 17% from 2010 levels� In total, CO₂ emissions can be brought down to 0�8 Gt/yr by implementing both the REmap and EE Options, and to 0�7 Gt/yr in the TECH Case�
Figure 37: Contribution of RE/EE to the decrease in energy intensity in the REmap 2030 + EE Case, Japan
3 3.5 4.54 5 5.5
ReferenceCase: 0.8
REmap +EE Case: 0.7
Renewableenergy: 0.4
Energye�ciency: 1.1
2010
20102030 (REmap + EE)
2030 (REmap + EE)
Energy intensity 2010–2030 (MJ/USD) Heat – energy e�ciency
Power – energy e�ciency
Transport – energy e�ciency
Buildings – energy e�ciency
Industry – energy e�ciency
Reference Case – renewables
Heat – renewables
Power – renewables
Transport – renewables
Buildings – renewables
Industry – renewables
Reference Case – energy e�ciency
REmap 2030
EE 2030
Structural sector changes
Figure 38: CO₂ emissions for the various analysed cases, Japan
−44%−34%−11%−22%
−17%
Industry
Other
Buildings
Transport
Power
Heat
2010
2014
Froz
en E�
cienc
y
Referen
ce C
ase EE
REmap
REmap +
EETE
CH
1.8
1.6
1.4
1.2
1.0
0.8
0.6
0.4
0.2
0.0
0.170.00
0.46
0.26
0.17
0.38
0.170.00
0.44
0.25
0.17
0.37
0.140.00
0.36
0.22
0.17
0.38
0.110.000.20
0.22
0.16
0.30
0.120.00
0.31
0.21
0.11
0.37
0.090.000.15
0.21
0.09
0.29
0.080.000.15
0.160.05
0.28
0.160.00
0.49
0.27
0.19
0.42
CO2 emissions (Gt/yr)

WORKING PAPER 89
Figure 39: Incremental annual system costs and externalities of the REmap and REmap + EE Cases, Japan
Figure 39 presents the incremental annual system costs and externalities of the REmap and REmap + EE Cases to 2030� The negative incremental annual system costs are a result of the fact that around 40% of the REmap Options and over 80% of the efficiency measures are already cost-competitive without considering externalities�
The annual negative costs of the REmap Case increase by USD 28 billion when including the extra efficiency measures; in other words, direct system costs decrease� Cost savings related to human health and CO₂ emissions increase by a factor four by implementing the additional efficiency measures�
Note: A low and high estimate is given for the externality savings.
Incremental annual system costs and savings (bln USD/yr)
−50
−40
−30
−20
−10
0
Japan
Direct costs
CO2 emissions
Human health
Costs
Low
REmap
High Low
REmap + EE
High
Costs SavingsSavings

SYNERGIES90
Table 17 presents the cost supply data for Japan�
EE 2030 Case REmap 2030 Case
TFEC savings (PJ/yr)
TPES savings (PJ/yr)
Incre- mental costs:
primary energy (USD/
GJ)
Incre- mental system costs (bln
USD/yr)
RE share TPES
increase (%pt)
TFEC replaced (PJ/yr)
TPES savings (PJ/yr)
Incre- mental costs:
primary energy (USD/
GJ)
Incre- mental system costs (bln
USD/yr)
RE share TPES
increase (%pt)
INDUSTRY INDUSTRYEFFICIENCY MEASURES
Solar thermal 50 6 74�7 0�4 0�0%
Cross-cutting: Pumps, compressors, motors and fans
120 249 −15�4 −3�8 0�1% Biomass boilers 8 −2 −34�3 0�1 0�0%
Cross-cutting: Heat and process integration
283 283 −6�5 −1�8 0�2% Space heating: Air-to-air heat pumps (LT Industry)
5 24 −18�9 −0�5 0�1%
TECHNOLOGY CHANGE
Industry sector: Heat pump
923 1 201 −13�3 −16�0 0�7%
BUILDINGS BUILDINGS
EFFICIENCY MEASURES
Space heating: Air-to-air heat pumps
287 1 058 −3�0 −3�2 3�8%
More efficient boilers −25 −25 85�0 −2�2 0�0% Water heating: Solar (thermosiphon)
31 33 −16�4 −0�5 0�1%
Lighting 213 443 −31�9 −14�1 0�3%
Appliances 32 67 −39�7 −2�6 0�0%
Cooling 15 31 −25�0 −0�8 0�0%
TECHNOLOGY CHANGE
Buildings sector: Heat pumps for heating and cooling
79 103 8�5 0�9 0�1%
TRANSPORT TRANSPORT
EFFICIENCY MEASURES
First-generation bioethanol (passenger road vehicles)
49 −1 200�0 −0�2 0�0%
Hydrogen (passenger road vehicles)
1 0 151�6 0�0 0�0%
PHEV (passenger road vehicles)
20 12 8�3 0�1 0�0%
BEV (passenger road vehicles)
15 19 −1�5 0�0 0�1%
BEV (public road vehicles)
2 3 30�8 0�1 0�0%
BEV (light-freight road vehicles)
37 2 2�6 0�0 0�0%
TECHNOLOGY CHANGE
Further penetration BEV
6 11 −3�4 0�0 0�0%
Table 17: Cost supply data for Japan

WORKING PAPER 91
EE 2030 Case REmap 2030 Case
TFEC savings (PJ/yr)
TPES savings (PJ/yr)
Incre- mental costs:
primary energy (USD/
GJ)
Incre- mental system costs (bln
USD/yr)
RE share TPES
increase (%pt)
TFEC replaced (PJ/yr)
TPES savings (PJ/yr)
Incre- mental costs:
primary energy (USD/
GJ)
Incre- mental system costs (bln
USD/yr)
RE share TPES
increase (%pt)
POWER POWER
EFFICIENCY MEASURES
Hydro (small) 8 8 −12�9 −0�1 0�0%
Higher-efficiency NGCC plant
99 11 −9�2 −0�1 0�0% Wind onshore 112 85 7�2 0�6 0�3%
Wind offshore 87 66 29�5 1�9 0�2%
Solar PV (residential/commercial)
87 131 −32�3 −4�2 0�5%
Solar PV (utility) 42 31 4�0 0�1 0�1%
Biomass steam cycle 18 −10 −81�1 0�8 0�0%
Geothermal 2 −16 −0�1 0�0 −0�1%
Tide, wave, ocean 14 15 26�6 0�4 0�1%
Solar PV (utility) 364 275 4�0 1�1 1�0%
TECHNOLOGY CHANGE
Switch from coal to gas power plants
0 2 727 4�7 12�7 1�6%
TOTAL 1 644 5 100 N/A −28 2.9% TOTAL 505 1 739 N/A −3 6.2%
United States
Business as usual: Reference Case
Figure 40 presents the contribution of different sectors to the increase in the renewables share and reduction in TPES in the United States�
The renewable energy share increases by 1�0%pt in the Reference Case compared to the Frozen Efficiency Case due to the expansion of renewable energy capacity, mainly in the power sector (0�8%pt) in the form of solar PV and wind energy� The other 0�2%pt comes from the use of biomass in the transport, industrial and heating sectors�
Energy efficiency improvements show a larger contribution than renewable energy to the decrease in TPES (16�9 EJ/yr) and increase in the renewables share (1�4%pt)� Transport and buildings show the largest contribution� In these sectors enhanced vehicle performance and air-to-air heat pumps are the main drivers behind the TPES reductions� The remainder (5�9 EJ/yr) comes from the industrial and power sectors in which industrial heat and process integration, as well as more efficient electricity generation, show the largest contribution�

SYNERGIES92
Additional efforts: REmap and EE Cases
Figure 41 shows the TPES and energy intensity for various cases in the United States with a breakdown by sector� The TPES decrease (19 EJ/yr; 17%) in the Reference Case over the period 2010–30 is relatively low compared to Germany (35%)� Over the
same period, the energy intensity decreases from 6�9 to 4�5 MJ/USD� The REmap and EE Options would result in a further reduction each of 8 EJ/ yr (8%) by 2030� The decrease in energy intensity is directly related to the decline in TPES� The REmap + EE Case shows a decrease of 0�7 MJ/USD compared to the Reference Case�
Figure 40: Contribution of sectors to the increase in renewable energy as a share of TPES (%pt) (left pie chart) and TPES reduction (EJ/yr) (right pie chart), United States
Figure 41: TPES and contribution to the decrease in energy intensity, United States
Industry – renewables
Buildings – renewables
Transport – renewables
Power – renewables
Heat – renewables
Industry – energy e�ciency
Buildings – energy e�ciency
Transport – energy e�ciency
Power – energy e�ciency
Heat – energy e�ciency
0.03
1.44
2.80
9.53
2.96 2.10
0.30-0.010.12
0.160.11%0.05%0.02%
0.28%
0.80%
0.21%
0.83%
0.10%0.01%
Industry – renewables
Buildings – renewables
Transport – renewables
Power – renewables
Heat – renewables
Energy intensity (MJ/USD)TPES (EJ/yr)
12.55 18.85 17.29 16.12 15.69 14.53 8.73
10.2112.22 9.43
3.37 8.07 2.011.73
27.26
36.0226.20
25.2825.46
24.5520.77
38.81
45.27
40.2140.46 36.59
36.84
35.28
1.13
1.17
0
30
60
90
120 −17%
−8% −8% −16% −28%
0.97 0.90 0.83 0.77 0.75 0.70 0.42
0.79 0.59 0.45 0.16 0.39 0.100.08
2.101.73
1.251.21 1.22
1.180.99
2.99
2.17
1.931.94 1.75
1.761.69
0.09
0.06
0
2
4
6
8
−17%
−8% −8% −16% −28%
2010
Froz
en E�
cienc
y
Referen
ce C
ase
REmap
REmap +
EETE
CHEE20
10
Froz
en E�
cienc
y
Referen
ce C
ase
REmap
REmap +
EETE
CHEE
0.980.98 0.98
0.98
0.93 0.050.05 0.05
0.050.04

WORKING PAPER 93
Table 18 presents the renewables share and annual improvement rate of energy intensity over the period 2010–30� In the Reference Case, the renewables share increases from 7�5% to 9�0%, while the annual energy intensity improvement rate rises from
1�7%/yr (1990–2010) to 2�2%/yr (2010–30)� By deploying both the REmap and EE Options, the renewables share and energy intensity improvement rate increase to 34�7% and 3�2%/yr, respectively�
Base year 2010
Reference Case 2030
EE 2030 REmap 2030
REmap + EE 2030
TECH 2030
Renewable energy share (% of TFEC)
7�5 9�0 14�4 26�6 30�0 35�6
Annual rate of energy intensity improvement 2010–30 (%/yr)
1�7 (1990–2010)a
2�1 2�6 2�5 3�0 3�7
Table 18: Renewable energy share and annual rate of improvement of energy intensity over the period 2010–30, United States
Figure 42 and Figure 43 show the contribution of RE/EE to the increase in the renewable energy share as a percentage of TFEC and to the reduction in energy intensity over the period 2010–30, respectively� The REmap Options increase the renewables share to 26�6%� The three end-use sectors each show a contribution of around 6%pt� In these sectors, biomass use, solar heating and cooling and electric/hybrid vehicles show the largest contributions� Also, the higher share of renewables in the power sector is an important factor in the higher renewables share seen in the end-use sectors�
The energy intensity decrease is, to a large extent, due to structural sector changes (−1�5 MJ/USD)� RE/EE reduce the energy intensity further to 4�2 MJ/ USD� The largest efficiency gains are projected for the transport sector (0�5 MJ/USD), in which the share of passenger EVs grows from 22% in the Reference Case in 2030 to 73% in the EE 2030 Case� The buildings and industrial sectors contribute to an increase of 0�4 MJ/USD and 0�1 MJ/ USD� In these sectors, heat and process integration (industry) and heat pumps (buildings) are the key efficiency measures�
a Global Tracking Framework (2012).

SYNERGIES94
Figure 42: Contribution of RE/EE to the increase in the renewable energy share of the TFEC in the REmap + EE Case, United States
Renewable energy share (% TFEC)
2010 2030 (REmap + EE Case)
2010 2030 (REmap + EE Case)
ReferenceCase: 2%pt
REmap +EE Case: 25%pt
Renewableenergy: 17%pt
Energye�ciency: 6%pt
7.5% 12.5% 17.5% 27.5%22.5% 32.5%
Industry – renewables
Buildings – renewables
Transport – renewables
Industry – renewables
Buildings – energy e�ciency
Transport – energy e�ciency
Reference Case – energy e�ciency
REmap 2030
Energy E�ciency 2030
Reference Case – renewables
Figure 43: Contribution of RE/EE to the decrease in energy intensity in the REmap + EE Case, United States
3.5 4 54.5 5.5 6 6.5 7 7.5
ReferenceCase: 0.9
REmap +EE Case: 0.7
Renewableenergy: 0.5
Energye�ciency: 1.2
2010
20102030 (REmap + EE)
2030 (REmap + EE)
Energy intensity 2010–2030 (MJ/USD) Heat – energy e�ciency
Power – energy e�ciency
Transport – energy e�ciency
Buildings – energy e�ciency
Industry – energy e�ciency
Reference Case – renewables
Heat – renewables
Power – renewables
Transport – renewables
Buildings – renewables
Industry – renewables
Reference Case – energy e�ciency
REmap 2030
EE 2030
Structural sector changes
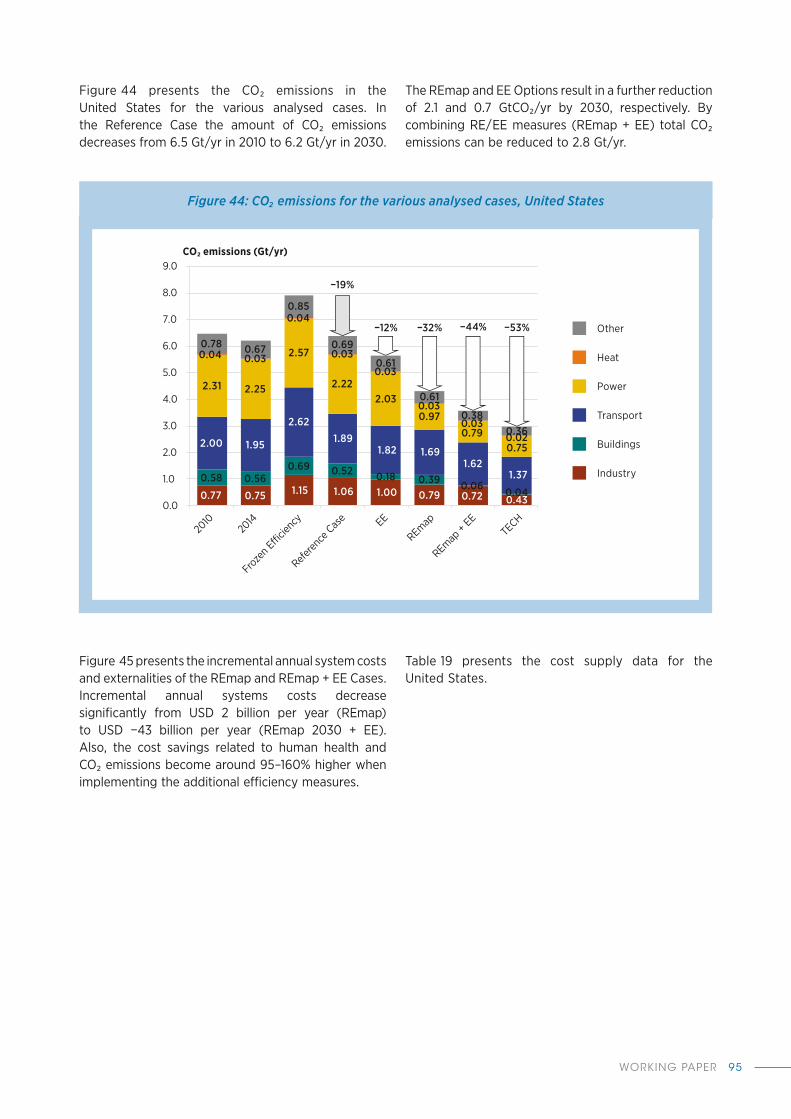
WORKING PAPER 95
Figure 44 presents the CO₂ emissions in the United States for the various analysed cases� In the Reference Case the amount of CO₂ emissions decreases from 6�5 Gt/yr in 2010 to 6�2 Gt/yr in 2030�
The REmap and EE Options result in a further reduction of 2�1 and 0�7 GtCO₂/yr by 2030, respectively� By combining RE/ EE measures (REmap + EE) total CO₂ emissions can be reduced to 2�8 Gt/yr�
Figure 44: CO₂ emissions for the various analysed cases, United States
0.77 0.75 1.15 1.06 1.00 0.79 0.72 0.43
0.58 0.560.69 0.52 0.18 0.39 0.06 0.04
2.00 1.95
2.62
1.891.82 1.69
1.621.37
2.31 2.25
2.57
2.222.03
0.970.79
0.75
0.04 0.03
0.04
0.03
0.03
0.03
0.030.02
0.78 0.67
0.85
0.69
0.61
0.61
0.380.36
0.0
1.0
2.0
3.0
4.0
5.0
6.0
7.0
8.0
9.0
−19%
−12% −32% −44% −53%
Industry
Other
Buildings
Transport
Power
Heat
2010
2014
Froz
en E
cienc
y
Referen
ce C
ase EE
REmap
REmap +
EETE
CH
CO2 emissions (Gt/yr)
Figure 45 presents the incremental annual system costs and externalities of the REmap and REmap + EE Cases� Incremental annual systems costs decrease significantly from USD 2 billion per year (REmap) to USD −43 billion per year (REmap 2030 + EE)� Also, the cost savings related to human health and CO₂ emissions become around 95–160% higher when implementing the additional efficiency measures�
Table 19 presents the cost supply data for the United States�
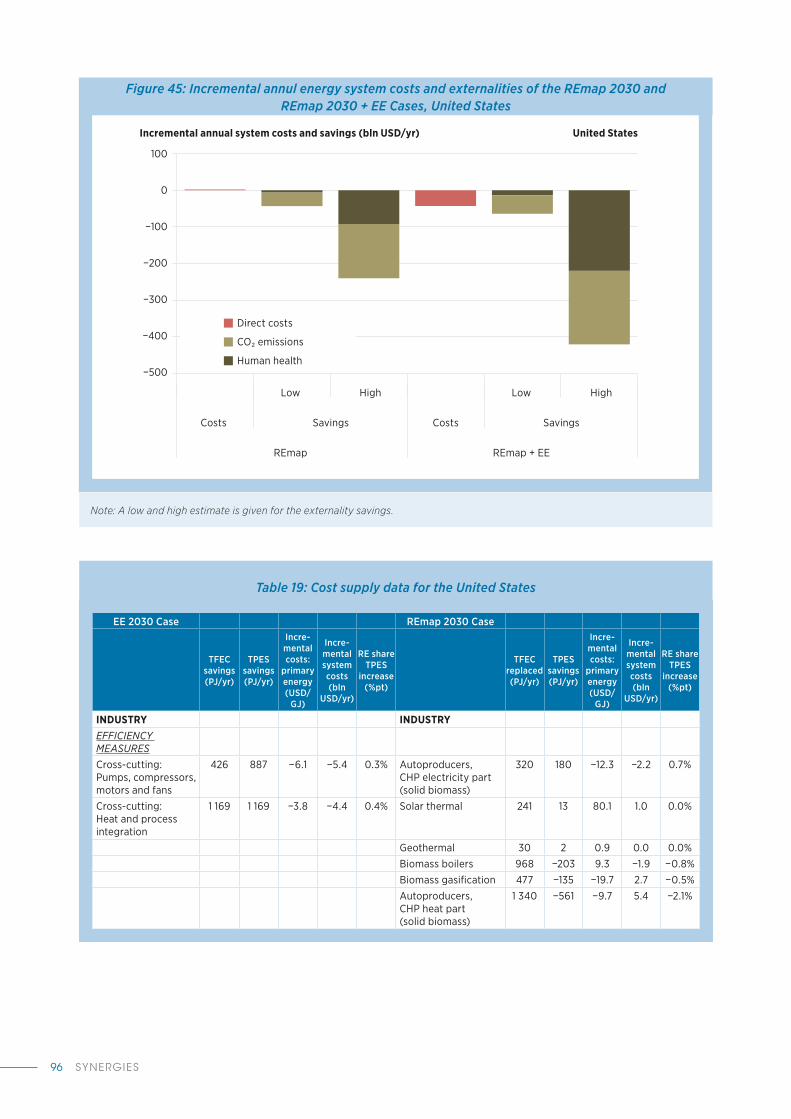
SYNERGIES96
Figure 45: Incremental annul energy system costs and externalities of the REmap 2030 and REmap 2030 + EE Cases, United States
Note: A low and high estimate is given for the externality savings.
EE 2030 Case REmap 2030 Case
TFEC savings (PJ/yr)
TPES savings (PJ/yr)
Incre- mental costs:
primary energy (USD/
GJ)
Incre- mental system costs (bln
USD/yr)
RE share TPES
increase (%pt)
TFEC replaced (PJ/yr)
TPES savings (PJ/yr)
Incre- mental costs:
primary energy (USD/
GJ)
Incre- mental system costs (bln
USD/yr)
RE share TPES
increase (%pt)
INDUSTRY INDUSTRYEFFICIENCY MEASURES
Cross-cutting: Pumps, compressors, motors and fans
426 887 −6�1 −5�4 0�3% Autoproducers, CHP electricity part (solid biomass)
320 180 −12�3 −2�2 0�7%
Cross-cutting: Heat and process integration
1 169 1 169 −3�8 −4�4 0�4% Solar thermal 241 13 80�1 1�0 0�0%
Geothermal 30 2 0�9 0�0 0�0%
Biomass boilers 968 −203 9�3 −1�9 −0�8%
Biomass gasification 477 −135 −19�7 2�7 −0�5%
Autoproducers, CHP heat part (solid biomass)
1 340 −561 −9�7 5�4 −2�1%
Table 19: Cost supply data for the United States
Incremental annual system costs and savings (bln USD/yr)
−500
−400Direct costs
CO2 emissions
Human health
−300
−200
−100
0
100
Costs
Low
REmap
High Low
REmap + EE
High
Costs SavingsSavings
United States
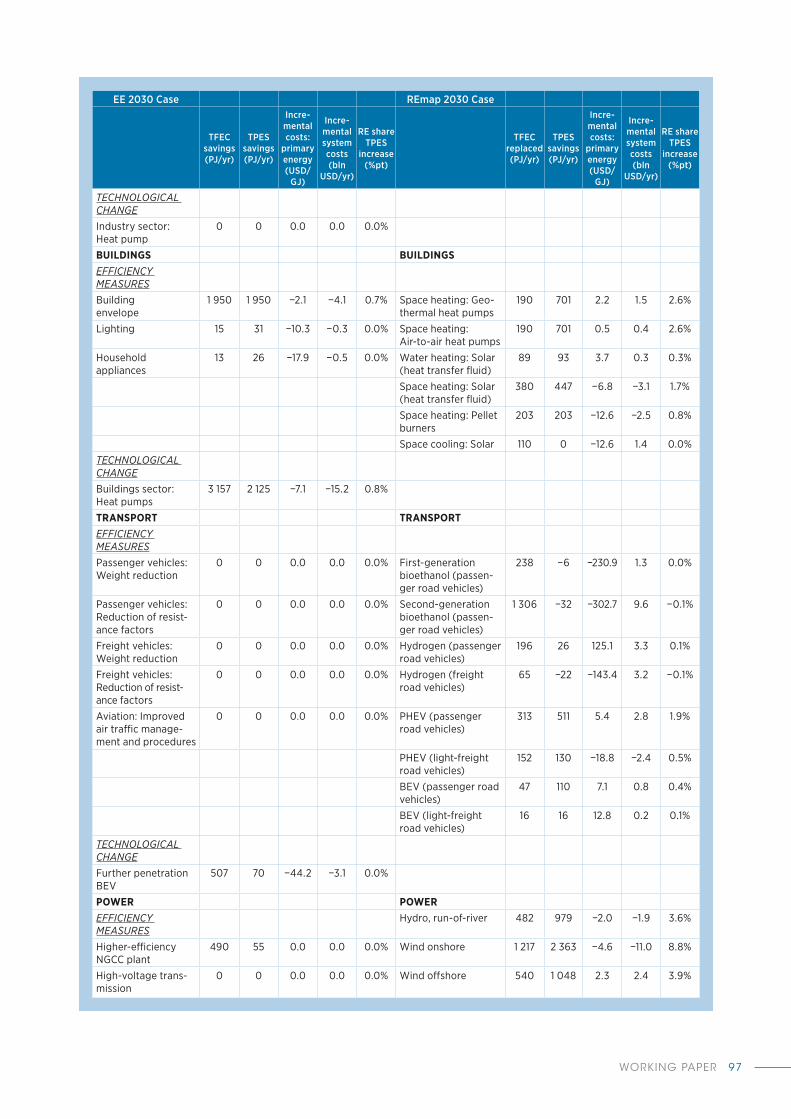
WORKING PAPER 97
EE 2030 Case REmap 2030 Case
TFEC savings (PJ/yr)
TPES savings (PJ/yr)
Incre-mental costs:
primary energy (USD/
GJ)
Incre- mental system costs (bln
USD/yr)
RE share TPES
increase (%pt)
TFEC replaced (PJ/yr)
TPES savings (PJ/yr)
Incre- mental costs:
primary energy (USD/
GJ)
Incre- mental system costs (bln
USD/yr)
RE share TPES
increase (%pt)
TECHNOLOGICAL CHANGE
Industry sector: Heat pump
0 0 0�0 0�0 0�0%
BUILDINGS BUILDINGSEFFICIENCY MEASURES
Building envelope
1 950 1 950 −2�1 −4�1 0�7% Space heating: Geo-thermal heat pumps
190 701 2�2 1�5 2�6%
Lighting 15 31 −10�3 −0�3 0�0% Space heating: Air-to-air heat pumps
190 701 0�5 0�4 2�6%
Household appliances
13 26 −17�9 −0�5 0�0% Water heating: Solar (heat transfer fluid)
89 93 3�7 0�3 0�3%
Space heating: Solar (heat transfer fluid)
380 447 −6�8 −3�1 1�7%
Space heating: Pellet burners
203 203 −12�6 −2�5 0�8%
Space cooling: Solar 110 0 −12�6 1�4 0�0%
TECHNOLOGICAL CHANGE
Buildings sector: Heat pumps
3 157 2 125 −7�1 −15�2 0�8%
TRANSPORT TRANSPORTEFFICIENCY MEASURES
Passenger vehicles: Weight reduction
0 0 0�0 0�0 0�0% First-generation bioethanol (passen-ger road vehicles)
238 −6 −230�9 1�3 0�0%
Passenger vehicles: Reduction of resist-ance factors
0 0 0�0 0�0 0�0% Second-generation bioethanol (passen-ger road vehicles)
1 306 −32 −302�7 9�6 −0�1%
Freight vehicles: Weight reduction
0 0 0�0 0�0 0�0% Hydrogen (passenger road vehicles)
196 26 125�1 3�3 0�1%
Freight vehicles: Reduction of resist-ance factors
0 0 0�0 0�0 0�0% Hydrogen (freight road vehicles)
65 −22 −143�4 3�2 −0�1%
Aviation: Improved air traffic manage-ment and procedures
0 0 0�0 0�0 0�0% PHEV (passenger road vehicles)
313 511 5�4 2�8 1�9%
PHEV (light-freight road vehicles)
152 130 −18�8 −2�4 0�5%
BEV (passenger road vehicles)
47 110 7�1 0�8 0�4%
BEV (light-freight road vehicles)
16 16 12�8 0�2 0�1%
TECHNOLOGICAL CHANGE
Further penetration BEV
507 70 −44�2 −3�1 0�0%
POWER POWEREFFICIENCY MEASURES
Hydro, run-of-river 482 979 −2�0 −1�9 3�6%
Higher-efficiency NGCC plant
490 55 0�0 0�0 0�0% Wind onshore 1 217 2 363 −4�6 −11�0 8�8%
High-voltage trans-mission
0 0 0�0 0�0 0�0% Wind offshore 540 1 048 2�3 2�4 3�9%

SYNERGIES98
EE 2030 Case REmap 2030 Case
TFEC savings (PJ/yr)
TPES savings (PJ/yr)
Incre-mental costs:
primary energy (USD/
GJ)
Incre- mental system costs (bln
USD/yr)
RE share TPES
increase (%pt)
TFEC replaced (PJ/yr)
TPES savings (PJ/yr)
Incre- mental costs:
primary energy (USD/
GJ)
Incre- mental system costs (bln
USD/yr)
RE share TPES
increase (%pt)
Transmission: Three-phase design for distribution
0 0 0�0 0�0 0�0% Solar PV (residential/commercial)
376 729 −1�8 −1�3 2�7%
Transmission: Higher-efficiency transformers
0 0 0�0 0�0 0�0% Solar PV (utility) 264 512 −6�9 −3�6 1�9%
Solar CSP, parabolic trough, storage
48 −4 −83�2 0�4 0�0%
Biomass steam cycle 588 182 25�3 4�6 0�7%
Landfill gas ICE 10 −2 50�2 −0�1 0�0%
Geothermal 493 −3 481 −0�1 0�5 −12�9%
TECHNOLOGICAL CHANGE
Solar PV (residential/commercial), low solar irradiance
95 194 0�4 0�1 0�7%
Switch from coal to gas power plants
0 1 580 −7�7 −12�2 0�6% Wind onshore, low wind resource
799 1 552 −1�5 −2�3 5�8%
Solar PV (utility), low solar irradiance
117 238 −8�7 −2�1 0�9%
Wind onshore 520 −520 4�4 −2�3 −1�9%
Solar PV (utility) 346 −346 8�8 −3�1 −1�3%
TOTAL 7 237 7 894 N/A −45 3.0% TOTAL 6 871 5 617 N/A 2 20.9%
Notes: CHP = combined heat and power; ICE = internal combustion engine.
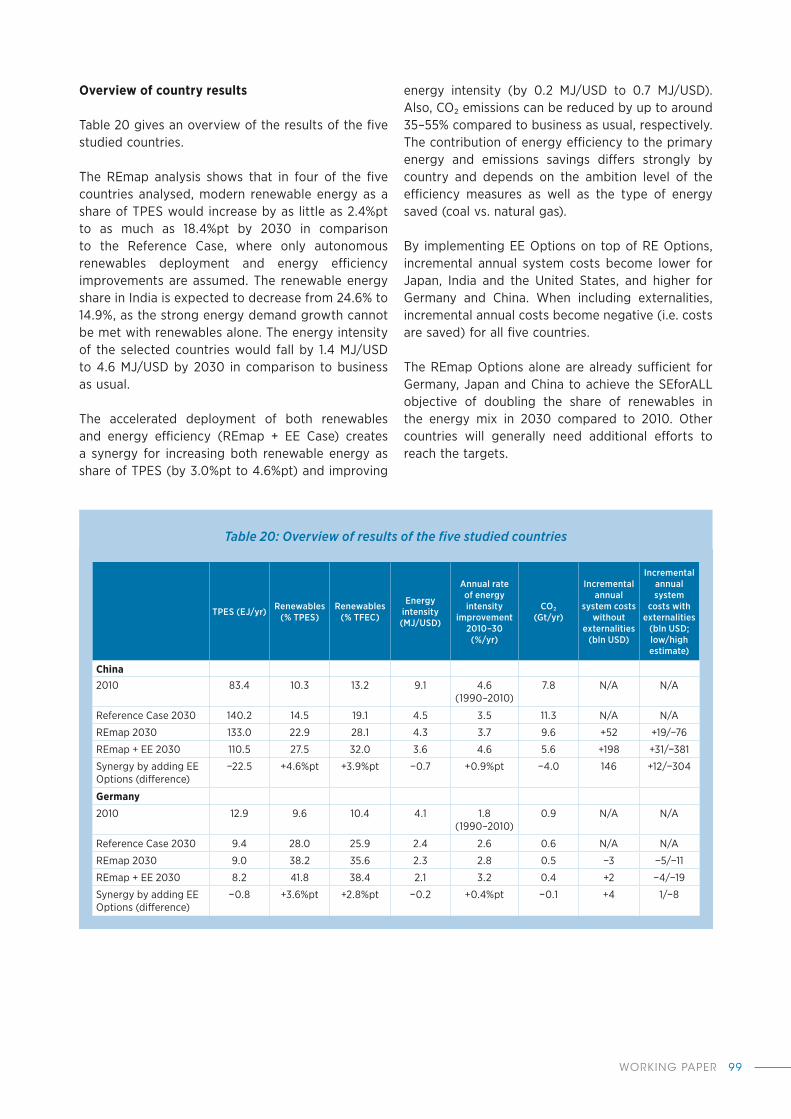
WORKING PAPER 99
Table 20: Overview of results of the five studied countries
TPES (EJ/yr) Renewables (% TPES)
Renewables (% TFEC)
Energy intensity (MJ/USD)
Annual rate of energy intensity
improvement 2010–30 (%/yr)
CO₂ (Gt/yr)
Incremental annual
system costs without
externalities (bln USD)
Incremental annual system
costs with externalities
(bln USD; low/high estimate)
China2010 83�4 10�3 13�2 9�1 4�6
(1990–2010)7�8 N/A N/A
Reference Case 2030 140�2 14�5 19�1 4�5 3�5 11�3 N/A N/A
REmap 2030 133�0 22�9 28�1 4�3 3�7 9�6 +52 +19/−76
REmap + EE 2030 110�5 27�5 32�0 3�6 4�6 5�6 +198 +31/−381
Synergy by adding EE Options (difference)
−22�5 +4�6%pt +3�9%pt −0�7 +0�9%pt −4�0 146 +12/−304
Germany
2010 12�9 9�6 10�4 4�1 1�8 (1990–2010)
0�9 N/A N/A
Reference Case 2030 9�4 28�0 25�9 2�4 2�6 0�6 N/A N/A
REmap 2030 9�0 38�2 35�6 2�3 2�8 0�5 −3 −5/−11
REmap + EE 2030 8�2 41�8 38�4 2�1 3�2 0�4 +2 −4/−19
Synergy by adding EE Options (difference)
−0�8 +3�6%pt +2�8%pt −0�2 +0�4%pt −0�1 +4 1/−8
Overview of country results
Table 20 gives an overview of the results of the five studied countries�
The REmap analysis shows that in four of the five countries analysed, modern renewable energy as a share of TPES would increase by as little as 2�4%pt to as much as 18�4%pt by 2030 in comparison to the Reference Case, where only autonomous renewables deployment and energy efficiency improvements are assumed� The renewable energy share in India is expected to decrease from 24�6% to 14�9%, as the strong energy demand growth cannot be met with renewables alone� The energy intensity of the selected countries would fall by 1�4 MJ/USD to 4�6 MJ/USD by 2030 in comparison to business as usual�
The accelerated deployment of both renewables and energy efficiency (REmap + EE Case) creates a synergy for increasing both renewable energy as share of TPES (by 3�0%pt to 4�6%pt) and improving
energy intensity (by 0�2 MJ/USD to 0�7 MJ/USD)� Also, CO₂ emissions can be reduced by up to around 35–55% compared to business as usual, respectively� The contribution of energy efficiency to the primary energy and emissions savings differs strongly by country and depends on the ambition level of the efficiency measures as well as the type of energy saved (coal vs� natural gas)�
By implementing EE Options on top of RE Options, incremental annual system costs become lower for Japan, India and the United States, and higher for Germany and China� When including externalities, incremental annual costs become negative (i�e� costs are saved) for all five countries�
The REmap Options alone are already sufficient for Germany, Japan and China to achieve the SEforALL objective of doubling the share of renewables in the energy mix in 2030 compared to 2010� Other countries will generally need additional efforts to reach the targets�

SYNERGIES100
TPES (EJ/yr) Renewables (% TPES)
Renewables (% TFEC)
Energy intensity (MJ/USD)
Annual rate of energy intensity
improvement 2010–30 (%/yr)
CO₂ (Gt/yr)
Incremental annual
system costs without
externalities (bln USD)
Incremental annual system
costs with externalities
(bln USD; low/high estimate)
India2010 29�4 24�6 39�9 7�8 2�4
(1990–2010)1�9 N/A N/A
Reference Case 2030 68�4 14�9 22�2 6�0 1�3 5�5 N/A N/A
REmap 2030 57�3 21�3 25�9 5�0 2�2 4�6 0 −18/−70
REmap + EE 2030 48�9 25�0 30�9 4�3 3�0 2�4 −106 −187/−389
Synergy by adding EE Options (difference)
−8�4 +3�7%pt +5�0%pt −0�7 +0�8%pt −2�2 −106 −169/−319
Japan
2010 20�0 6�5 3�8 5�1 0�3 (1990–2010)
1�4 N/A N/A
Reference Case 2030 18�4 12�5 8�2 3�7 1�6% 1�3 N/A N/A
REmap 2030 17�2 18�7 15�5 3�4 1�9% 1�1 −3 −6/−15
REmap + EE 2030 14�8 21�8 18�2 2�9 2�7% 0�8 −31 −45/−78
Synergy by adding EE Options (difference)
−2�4 +3�1%pt +2�7%pt −0�5 +0�8%pt −0�3 −28 −38/−64
United States
2010 90�0 6�8 7�5 6�9 1�7 (1990–2010)
6�5 N/A N/A
Reference Case 2030 94�1 9�2 9�0 4�5 2�1 6�4 N/A N/A
REmap 2030 86�8 30�1 26�6 4�2 2�5 4�3 +2 −41/−238
REmap + EE 2030 78�9 33�1 30�0 3�8 3�0 3�6 −43 −107/−464
Synergy by adding EE Options (difference)
−7�9 +3�0%pt +3�4%pt −0�4 +0�5%pt −0�7 −45 −66/−226

WORKING PAPER 101
POLICY RECOMMENDATIONS
Ambitions differ in the selected countries, but a first-order estimate shows that they are all currently insufficient to achieve the potential levels of RE/EE identified in this study� Table 21 presents an overview of the main approaches and instruments in the five studied countries for energy efficiency� RE/EE targets, and their related policy frameworks, differ considerably� Germany is a global frontrunner in both targets and policy design (having the most ambitious Reference Case of the countries in this study), while India is lagging behind in the implementation of its policies, particularly for energy efficiency�
The main drivers for RE/EE policies in the analysed countries are climate protection, energy security, industrial development, employment, and the increasing cost-competitiveness of renewables� For Germany, the phase-out of nuclear power provides an additional incentive� Further drivers, such as supply disruptions due to rapidly increasing demand, air pollution and water availability, are contributing to a shift towards greater energy efficiency in China and India�
The energy efficiency measures in the REmap + EE Case are on top of efficiency improvements already occurring in the Reference Case� The strength of current efforts varies by country� Germany’s current policy framework provides sufficient support for the realisation of almost all of the energy savings identified in the buildings sector, whereas additional measures are needed in Japan, China and India� Policies in the United States are adequate for the deployment of more efficient lighting and appliances, but are insufficient for measures related to the building envelope (as building codes vary widely by state)� None of the countries’ policies are sufficient to support the implementation of the proposed efficiency measures in industry and transport, except in Japan� Accelerated uptake of EVs is deemed possible under India’s and Japan’s efforts, but not in China, Germany or the United States�
Table 21: Energy efficiency approaches and instruments in the five studied countries
Main existing energy efficiency efforts
Main existing instruments Main additional instruments required to realise all energy efficiency categories in
REmap + EE Case
China Federal policies/ programmes on energy and climate
(e� g� Five-Year Plan for Renewables; National Climate Change Programme; Medium- and Long-term Development Plan for Renewable Energy; Energy Development Strategic Action Plan)
• Economic incentives• Regulations• Voluntary agreements with
industry• Standards/building codes• Labelling• Information dissemination and
advisory services
Industry• Financial incentives• Stricter efficiency standards for
equipment and industrial processes
Buildings• Stricter building codes• Better enforcement of building codes• Implementing building labelling
programmes• Expansion of appliance and equipment
standards to larger number of products
Transport• Long-running financial incentives for EVs• Promote/build EV infrastructure

SYNERGIES102
Main existing energy efficiency efforts
Main existing instruments Main additional instruments required to realise all energy efficiency categories in
REmap + EE CaseGermany National energy and
climate policy (e� g� National Energy Efficiency Action Plan;a Climate Action Programme 2020)b
2020 and 2030 EU level targets, directives (e� g� EU policy framework for climate and energy in the period from 2020 to 2030)
• Economic incentives (e� g� the KfW programmes for building rehabilitation, subsidies for energy audits and measures in small industries) or exemption from taxes on energy and electricity for industries which carry out energy-saving measures
• Regulations, in particular standards for appliances, CO₂ standards for cars and building codes
• Learning networks for energy efficiency in industry
• EU Emissions Trading System• Energy-saving tender• Labelling of appliances and
building certificates• Information dissemination and
advisory services
Industry• Stricter efficiency standards for
equipment and industrial processes• Favourable loan conditions
Transport• Long-running financial incentives for EVs• Promote/build EV infrastructure
India Federal policies on energy efficiency (e� g� National Mission for Enhanced Energy Efficiency)
• Economic incentives• Regulations• Building codes• Labelling• Information dissemination• Energy conservation awards
Industry• Minimum efficiency standards for
equipment and industrial processes• Voluntary partnerships between
government and industry
Buildings• Appliance and equipment standards • Stricter building codes• Implementing building and appliance
labelling programmes
Japan National energy efficiency policies (e� g� Energy Conservation Act; Keidanren Voluntary Action Plan on the Environment)
• Economic incentives• Regulations• Standards/building codes• Labelling• Information dissemination and
advisory services• R&D into innovative technologies• Mandatory energy efficiency
management plans
Buildings• Better appliance and equipment
standards • Stricter <building codes• Implementing building labelling
programmes• Comprehensive building retrofit policy
Transportc
• Long-running financial incentives for EVs• Promote/build EV infrastructure
United States
Federal policies on energy efficiency (e� g� US Climate Action Plan; Save Energy Now program) State policies on energy efficiency
• Economic incentives• Regulations• Voluntary agreements with
industry• Standards/building codes• Labelling• Information dissemination and
advisory services• R&D into innovative technologies
Industry• More voluntary partnerships between
government and industry • Training programmes for engineers
Buildings• Better building retrofit policies• Stricter building codes• Oblige use of energy labels for buildings
Transport• Long-running financial incentives for EVs• Promote/build EV infrastructure
a The National Energy Efficiency Action Plan (NEEAP) is required by the European Union within the framework of the Energy Efficiency Directive (EED). Although not a German policy as such, it was added as it is part of the political framework in Germany;
b BMUB (2014), The German Government’s Climate Action Programme 2020, www.bmub.bund.de/fileadmin/Daten_BMU/Pools/ Broschueren/aktionsprogramm_klimaschutz_2020_broschuere_en_bf.pdf;
c Although Japan can realise the energy savings related to passenger EVs with existing instruments, the technical potential is likely to be higher than assessed in the quantitative analysis. Hence, additional transport instruments are needed.

WORKING PAPER 103
Significant differences were also found in renewable energy target setting and the levels of ambition of national renewables plans� China and India employ five-year plans that have targets to 2020 and 2022, respectively, and these include a wide range of targets for individual renewable energy technologies (e� g� supply and demand, and enabling technologies such as EVs)� Among the industrialised countries, Germany has by far the most ambitious renewable energy plan with a long-term vision to 2050, encompassing all sectors of its economy� The United States does not have any federal targets, but various states have made strong progress� In its plan of July 2015, Japan has a detailed outlook for various power generation technologies to 2030� Both the United States and Japan have a separate nationwide plan for transport�
Additional measures are required to fully exploit the potential offered by energy efficiency as well as its synergies with renewable energy� Interestingly, examples of specific sound instruments can be found among all five countries (see Table 21)� For example, the core framework of Germany’s stringent building codes and financial support for both new and existing buildings could also be adopted by China, India and Japan� Japan’s policy framework has elements that would be useful to incorporate in the industrial sectors of Germany and the United States� Key instruments and elements include setting energy efficiency targets, R&D on innovative technologies, stringent mandatory energy efficiency standards, building and appliance labelling, financial incentives, information programmes, and the build-up of effective compliance and enforcement institutions� Identifying further lessons from these and other countries could improve the effectiveness of policies, and promote an energy transition in line with the Paris Agreement�
This preliminary analysis has shown that current policies are insufficient to meet the ambitious targets needed to meet the SEforALL goals� It also shows that the level of ambition varies amongst countries, even when a greater potential for energy efficiency (and renewable energy) exists� This highlights the need for a smart combination of initiatives that can exploit the synergies of RE/EE�
The years 2030 and 2050 are not far away in terms of (energy) infrastructure and the typical lifetime of buildings and industrial facilities� Streamlined, complementary policies are needed to achieve targets� Policies need to address a variety of decision
makers and barriers to investment� The growing body of literature on barriers to energy efficiency typically treat sectors as homogeneous and fail to effectively address the cross-cutting barriers� Smart policy mixes that account for diversity are expected to be more effective� Examples can be found in Germany and China, where different policies focusing on a single sector are used to address a variety of barriers or types of decision makers� A systems perspective is key, as the impacts affect investments throughout the energy system� This is important even with the short-term (micro-) economics of renewable energy projects�
Country policy recommendations
China
Current policies
China’s energy policy matters globally� The country is the world’s largest energy user, accounting for one-fifth of all global energy consumption� Therefore, China’s energy choices will have a major influence on the world’s ability to combat climate change� RE/EE policies are mainly driven by rapidly rising energy demand and concerns over climate change, supply security and local air pollution�
China’s energy policy is developed in a two-step procedure� Central government develops broad policy goals, which are communicated in the Five-Year Plans� Ministries, parliament and government agencies use the plans to design specific policies� Although central government plays the central role in the implementation of energy policy, the enforcement of environmental regulations is devolved to provincial governments�
The Five-Year Plans set out a strategy for sustainable development, including climate mitigation actions such as economic restructuring and RE/EE� Renewable energy policy is based on three main components: tariff-based support mechanisms, mandatory market share (MMS) for renewables by sector and technology, and government financial support for renewable energy projects� Two types of tariff-based mechanisms have been adopted: competitive tendering (auction mechanism) and FITs (government-fixed pricing)� The MMS sets goals for the country’s mid-term and long-term development plans for renewable energy (see Table 22)� Several

SYNERGIES104
changes have been made to improve the MMS, including increased monitoring of target compliance by the government� Possible future caps on coal consumption to limit air pollution may also help to encourage the uptake of renewable energy options� Renewable heating policy specifically focuses on solar water heating, while transport sector policy is mostly concentrated on direct subsidies for EVs� Several support programmes aiming to establish a large renewable energy industry focus on both R&D and an increase in renewables manufacturing capacity�
Energy efficiency policy is founded on the Medium and Long-Term Development Plan for Renewable Energy (DPRE) for the period 2004–20 and Energy Development Strategy Action Plan (EDSAP)� These
plans promote energy conservation as a top priority in all sectors� The DPRE lays out ten key energy conservation programmes, as well as a specific regulation for indices of energy consumption and energy efficiency� The conservation programmes include energy conservation for electric machinery, waste heat utilisation, energy conservation in construction, development of combined heat and power plants, and sustainable lighting� Estimations show that these projects will save energy equivalent to 7 090 PJ (IEA, 2016)� The EDSAP sets, among other things, requirements for efficiency targets for coal-fired power plants by 2020 (300 grams of coal equivalent per kilowatt hour), strengthens national building energy efficiency standards and fosters the development of EVs and energy efficient transport�
Table 22: Key targets and policies, China
2010 2020 2030Policies/programmes/
directivesOverallEnergy intensity improvement (base year: 2005)
9�1 MJ/USD 8�4–9�0 MJ/USD
(20–25%)
N/A • 12th Five-Year Plan
Carbon intensity of GDP (base year: 2005)
0�7 0�6–0�65 (−40-to −45%)
0�38–0�43 (−60% to −65%)
• INDC
BuildingsBiogas (million households) 47 (2012) 50 N/A • 12th Five-Year PlanSolar thermal capacity (million m²)
258 (2012) 400 N/A
Solar cooker (million sets) 2 N/AGeothermal (PJ) 135 (2010) 440 N/ATransportBioethanol (Mt) 2 (2012) 10 N/A • 12th Five-Year PlanBiodiesel (Mt) 0�5 (2012) 2 N/A • 12th Five-Year PlanPHEVs/ BEVs (million) 5 N/A • 12th Five-Year PlanPowerRenewable power capacity 29 GW 2020:
Solar PV: 100 GWe CSP: 3 GWe
Onshore wind: 200 GWe Offshore wind: 30 GWe
Biomass: 30 GWe Hydro: 350 GWe
Pumped hydro: 70 We
• 12th Five-Year Plan• INDC
Note: GWe = gigawatt electrical; Mt = million tonnes; m² = square metre.Sources: IEA (2016), World Energy Outlook 2016; IRENA (2014), Renewable Energy Prospects: China, REmap 2030 – A Renewable Energy Roadmap.

WORKING PAPER 105
Policies: Evaluation and recommendations
Table 23 presents the feasibility of the energy efficiency measures in the EE 2030 Case under the current policy scheme�
Even though the high energy intensity of China’s industrial sector is expected to fall due to the shift to less energy-intensive manufacturing, serious efforts are needed to reach efficiency levels similar to those in several developed countries� The relevant policy measures for the industrial sector, which are incorporated mainly in the Strategic Plan for Industrial Efficiency and the Top 1000 Industrial Energy Conservation Programme, are insufficient to realise most of the suggested energy efficiency measures� Financial incentives, demonstration projects and policies targeting heat and process integration, as well as best practices in cement production, are required to reach deep energy savings� Moreover, authorities should strengthen mandatory energy performance standards for electric motors (ACEEE, 2016)�
In the buildings sector, mandatory residential and commercial building codes in urban areas are relatively strict and more ambitious than in India
and Japan� However, building codes need to be strengthened in order to achieve the full energy savings as found for the EE 2030 Case� Additionally, better compliance with and enforcement of the building codes are needed, as well as energy efficiency labelling of certain buildings (ACEEE, 2016)� The appliance and lighting standards and labels are already quite strict, but should be expanded to an even larger number of products�
Despite mandatory fuel economy standards for passenger vehicles, as well as subsidy schemes and tax benefits for EVs, more effort should be taken to drive a further expansion of EVs� Accelerated deployment of charging stations (especially in and around cities), larger funds, preferential loan conditions, improved information dissemination and privileges for EVs will stimulate the uptake of EVs� Energy efficiency policies in the power plant sector relate to minimum conversion efficiencies for coal-fired power plants� Even though old, inefficient coal-fired power plants may be replaced with cleaner gas-fired power plants, policies provide insufficient incentive for a nationwide switch� Stricter emission caps and policy favouring gas over coal would be necessary to expedite this transition�
Reduction potential energy efficiency measures 2030
(PJ/yr)
Relevant policy (measure) in place
Feasibility of measure under current policy
schemeIndustryMore efficient pumps, motors, compressors and fans
3 717 • Strategic plan for industrial efficiency
• Minimum Energy Performance Standards for motors, compressors, pumps, trans-formers, etc�
• Top 1 000 Industrial Energy Conservation Programme Voluntary agreements with industry
• Provincial-level monitoring and supervision systems
×
Heat and process inte-gration
2 014 ×
Cement: best practice efficiency in dry process kilns
577 ×
Table 23: Feasibility of energy efficiency measures in the EE 2030 Case under current policy scheme, China

SYNERGIES106
Germany
Current policies
Germany is unique in its advanced energy policy� The German Energy Transition aims to transform the country’s energy system and is based on the two pillars of RE/EE� Other important focuses include future grid, markets and system integration as well as support for energy sector research and development� In its “Energy Concept”, adopted in September 2010, the German government formulated a number of ambitious targets� The targets and the key RE/EE policies in place today are presented in Table 24� By the end of 2014, the government had introduced a new set of policy measures targeting energy efficiency (National Energy Efficiency Action Plan (NEEAP)) and climate protection (Climate Action Programme 2020 (CAP)) with the goal of accelerating progress in energy efficiency, which is essential to achieving the national policy objectives� NEEAP and CAP lay out a mix of economic incentives,
regulations and improved information and advisory services to harness the further efficiency potential of private households, companies and the public sector on their own initiative�
Another important development in 2014 was the amendment of the Renewable Energy Sources Act (2014) (EEG)� For years the EEG has promoted renewable energy mainly by stipulating a feed-in tariff (FIT) by requiring that transmission system operators connect, fully integrate and compensate for the supply of renewable energy fed into the power grid� As of early 2017, Germany will start to switch away from the FIT system to a system based on feed-in premium (FIP) payments and energy auctions�
Reduction potential energy efficiency measures 2030
(PJ/yr)
Relevant policy (measure) in place
Feasibility of measure under current policy
schemeBuildingsMore efficient boilers 1 512 • Energy conservation in
buildings• Building energy codes• National Building Energy
Standard• Minimum energy performance
standards for appliances and lighting
• Energy efficiency labels• Efficient light bulb subsidy
programme• Energy conservation in
government operations
×Lighting 2 270 ×Appliances 2 663 ×Cooling 1 291 ×
TransportFurther penetration of BEVs
278 • Subsidies for EVs • Minimum Energy Performance
Standards for passenger vehicles
×
Power ×Higher-efficiency NGCC plant
43 • N/A ×
Switch from coal to gas power plants
8 219 • N/A ×

WORKING PAPER 107
Table 24: Key targets and policies, Germany
2014 2020 2030 Policies/programmes/directives
OverallGHG emissions (base year = 1990)
−27% minimum −40%
minimum −55%
EU Emissions Trading System
Primary energy consumption (base year = 2008)
−8�7% −20% EU policy framework for climate and energy in the period 2020–30; CAP; NEEAP
Renewables share in TFEC 13�5% 18% 30% CAPFinal energy productivity 1�6%/yr
(2008–14)2�1%/yr
(2008–50)PowerRenewables share in power production
27�4% minimum 35%
minimum 50%
EEG
Gross electricity consumption (base year = 2008)
−4�6% −10%
Electricity share from CHP 17% 20% Cogeneration ActBuildingsPrimary energy demand buildings (base year = 2008)
−14�8% EU Directive on the energy performance of buildings (Directive 2010/31/EU of the European Parliament and of the Council of 19 May 2010); EU Ecodesign Direc-tive (Directive 2009/125/EC of the European Parliament and of the Council of 21 October 2009);a Energy Saving Ordinance; financial support schemes; NEEAP; CAP
Heat demand buildings (base year = 2008)
−12�4% −20%
Renewables share in heat production
12% 14% Renewable Energies Heat Act; market incentive programme/building codes
TransportFinal energy consumption transport (base year = 2008)
1�7% −10% Motor vehicle tax; CAP; Climate Protection Quota
Renewables share in transport sector
5�6%
EVs 0�03 million 1 million 6 millionBiofuels in transport sector 5�6% 6% EU Directive on the promotion of
the use of energy from renewable sources (Directive 2009/28/EC of the European Parliament and of the Council of 23 April 2009); Climate Protection Quota
a The Ecodesign Directive sets minimum standards for many different product categories from both appliances used in residential and commercials buildings as well as in industry.
Source: Heinrich Böll Foundation (2016).
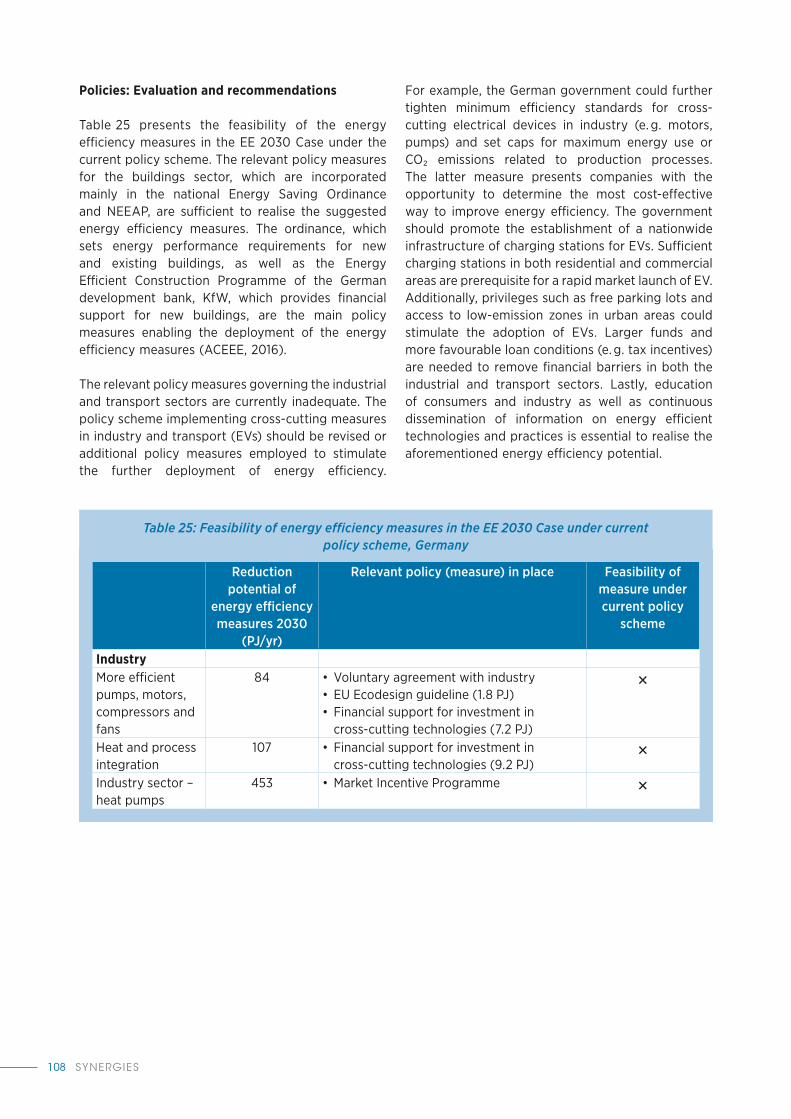
SYNERGIES108
Policies: Evaluation and recommendations
Table 25 presents the feasibility of the energy efficiency measures in the EE 2030 Case under the current policy scheme� The relevant policy measures for the buildings sector, which are incorporated mainly in the national Energy Saving Ordinance and NEEAP, are sufficient to realise the suggested energy efficiency measures� The ordinance, which sets energy performance requirements for new and existing buildings, as well as the Energy Efficient Construction Programme of the German development bank, KfW, which provides financial support for new buildings, are the main policy measures enabling the deployment of the energy efficiency measures (ACEEE, 2016)�
The relevant policy measures governing the industrial and transport sectors are currently inadequate� The policy scheme implementing cross-cutting measures in industry and transport (EVs) should be revised or additional policy measures employed to stimulate the further deployment of energy efficiency�
For example, the German government could further tighten minimum efficiency standards for cross-cutting electrical devices in industry (e� g� motors, pumps) and set caps for maximum energy use or CO₂ emissions related to production processes� The latter measure presents companies with the opportunity to determine the most cost-effective way to improve energy efficiency� The government should promote the establishment of a nationwide infrastructure of charging stations for EVs� Sufficient charging stations in both residential and commercial areas are prerequisite for a rapid market launch of EV� Additionally, privileges such as free parking lots and access to low-emission zones in urban areas could stimulate the adoption of EVs� Larger funds and more favourable loan conditions (e� g� tax incentives) are needed to remove financial barriers in both the industrial and transport sectors� Lastly, education of consumers and industry as well as continuous dissemination of information on energy efficient technologies and practices is essential to realise the aforementioned energy efficiency potential�
Reduction potential of
energy efficiency measures 2030
(PJ/yr)
Relevant policy (measure) in place Feasibility of measure under current policy
scheme
IndustryMore efficient pumps, motors, compressors and fans
84 • Voluntary agreement with industry• EU Ecodesign guideline (1�8 PJ)• Financial support for investment in
cross-cutting technologies (7�2 PJ)
×
Heat and process integration
107 • Financial support for investment in cross-cutting technologies (9�2 PJ)
×
Industry sector – heat pumps
453 • Market Incentive Programme ×
Table 25: Feasibility of energy efficiency measures in the EE 2030 Case under current policy scheme, Germany
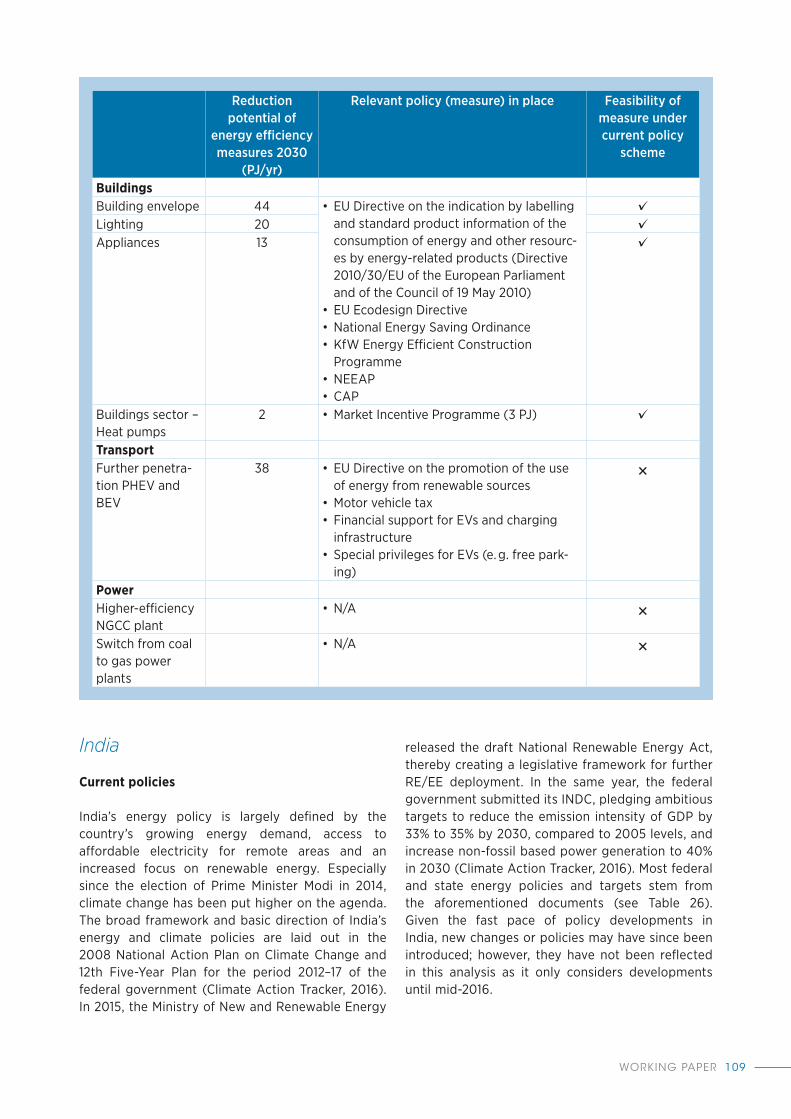
WORKING PAPER 109
Reduction potential of
energy efficiency measures 2030
(PJ/yr)
Relevant policy (measure) in place Feasibility of measure under current policy
scheme
BuildingsBuilding envelope 44 • EU Directive on the indication by labelling
and standard product information of the consumption of energy and other resourc-es by energy-related products (Directive 2010/30/EU of the European Parliament and of the Council of 19 May 2010)
• EU Ecodesign Directive• National Energy Saving Ordinance• KfW Energy Efficient Construction
Programme• NEEAP• CAP
✓Lighting 20 ✓Appliances 13 ✓
Buildings sector – Heat pumps
2 • Market Incentive Programme (3 PJ) ✓
TransportFurther penetra-tion PHEV and BEV
38 • EU Directive on the promotion of the use of energy from renewable sources
• Motor vehicle tax • Financial support for EVs and charging
infrastructure• Special privileges for EVs (e� g� free park-
ing)
×
PowerHigher-efficiency NGCC plant
• N/A ×
Switch from coal to gas power plants
• N/A ×
India
Current policies
India’s energy policy is largely defined by the country’s growing energy demand, access to affordable electricity for remote areas and an increased focus on renewable energy� Especially since the election of Prime Minister Modi in 2014, climate change has been put higher on the agenda� The broad framework and basic direction of India’s energy and climate policies are laid out in the 2008 National Action Plan on Climate Change and 12th Five-Year Plan for the period 2012–17 of the federal government (Climate Action Tracker, 2016)� In 2015, the Ministry of New and Renewable Energy
released the draft National Renewable Energy Act, thereby creating a legislative framework for further RE/EE deployment� In the same year, the federal government submitted its INDC, pledging ambitious targets to reduce the emission intensity of GDP by 33% to 35% by 2030, compared to 2005 levels, and increase non-fossil based power generation to 40% in 2030 (Climate Action Tracker, 2016)� Most federal and state energy policies and targets stem from the aforementioned documents (see Table 26)� Given the fast pace of policy developments in India, new changes or policies may have since been introduced; however, they have not been reflected in this analysis as it only considers developments until mid-2016�
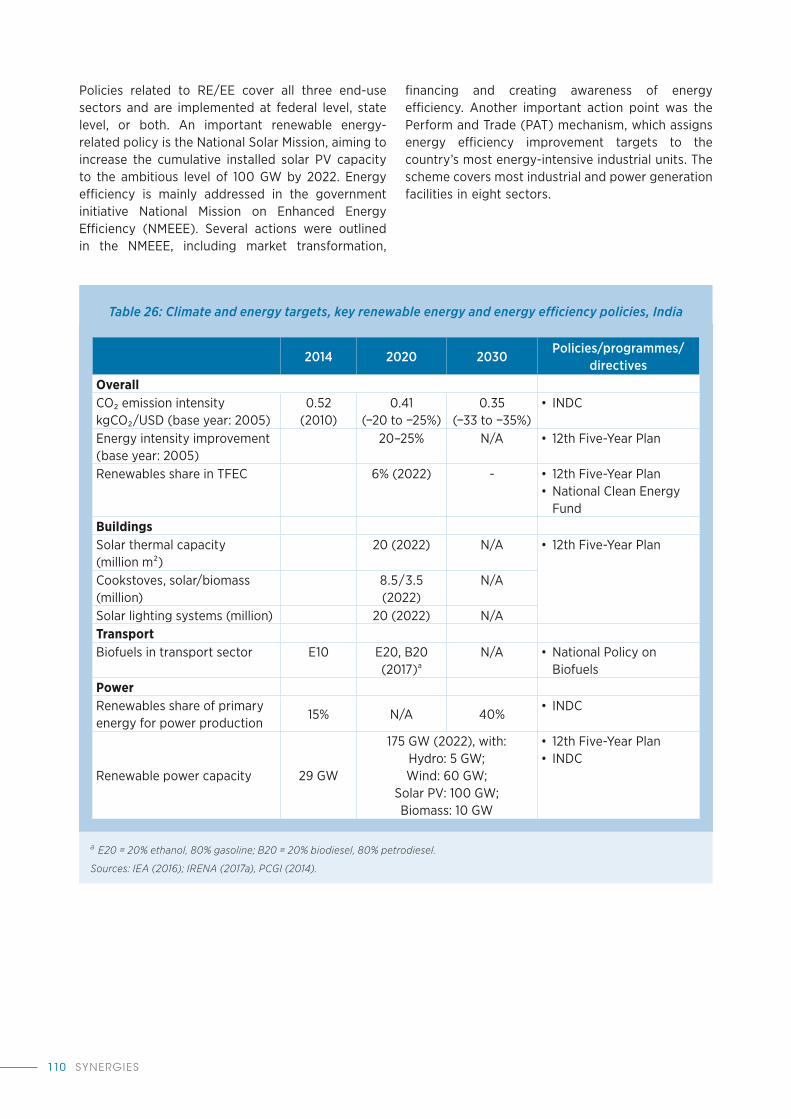
SYNERGIES110
Policies related to RE/EE cover all three end-use sectors and are implemented at federal level, state level, or both� An important renewable energy-related policy is the National Solar Mission, aiming to increase the cumulative installed solar PV capacity to the ambitious level of 100 GW by 2022� Energy efficiency is mainly addressed in the government initiative National Mission on Enhanced Energy Efficiency (NMEEE)� Several actions were outlined in the NMEEE, including market transformation,
financing and creating awareness of energy efficiency� Another important action point was the Perform and Trade (PAT) mechanism, which assigns energy efficiency improvement targets to the country’s most energy-intensive industrial units� The scheme covers most industrial and power generation facilities in eight sectors�
2014 2020 2030Policies/programmes/
directivesOverallCO₂ emission intensity kgCO₂/USD (base year: 2005)
0�52(2010)
0�41(−20 to −25%)
0�35(−33 to −35%)
• INDC
Energy intensity improvement (base year: 2005)
20–25% N/A • 12th Five-Year Plan
Renewables share in TFEC 6% (2022) - • 12th Five-Year Plan• National Clean Energy
FundBuildingsSolar thermal capacity(million m²)
20 (2022) N/A • 12th Five-Year Plan
Cookstoves, solar/biomass (million)
8�5 / 3�5(2022)
N/A
Solar lighting systems (million) 20 (2022) N/ATransportBiofuels in transport sector E10 E20, B20
(2017)aN/A • National Policy on
BiofuelsPowerRenewables share of primary energy for power production
15% N/A 40%• INDC
Renewable power capacity 29 GW
175 GW (2022), with:Hydro: 5 GW; Wind: 60 GW;
Solar PV: 100 GW; Biomass: 10 GW
• 12th Five-Year Plan• INDC
Table 26: Climate and energy targets, key renewable energy and energy efficiency policies, India
a E20 = 20% ethanol, 80% gasoline; B20 = 20% biodiesel, 80% petrodiesel.
Sources: IEA (2016); IRENA (2017a), PCGI (2014).

WORKING PAPER 111
Policies: Evaluation and recommendations
Table 27 presents the feasibility of the energy efficiency measures in the REmap + EE 2030 Case under the current policy scheme�
India’s industrial sector shows large potential for energy efficiency improvements� The current policy measures are, however, not sufficient to realise the identified energy savings in the iron and steel sector, or savings from more efficient motors and pumps and heat integration across all sectors� Even though the PAT scheme, labelling system and information service are in place, there are currently no mandatory efficiency standards for motors and other industrial processes� The institution of these standards, as well as voluntary agreements with industry, are required for the realisation of these measures�
Federal policies targeting the buildings sector, among them the voluntary building codes and National Energy Labelling Programme, are not enough to bring about the energy savings offered by the analysed EE Options� The energy savings resulting from more efficient appliances cannot be realised without strong appliance equipment standards, which are currently lacking� Also, the voluntary building codes for both commercial and residential buildings are insufficient and should be further strengthened by adding requirements, especially for existing buildings� Better labelling programmes for both appliances and buildings would also help to create more transparency with respect to energy performance (ACEEE, 2016)� As for most countries, there is no specific policy for
the promotion of heat pumps� Specific incentives, regulation and demonstration projects are needed to drive the uptake of the technology and realise its full potential�
India currently performs very well in energy efficiency in the transport sector, due to the low number of passenger kilometres travelled per capita and high passenger vehicle fuel economy� In addition, more than 65% of passenger trips are by public transport (ACEEE, 2016)� This will, however, change with the growing economy over the coming decades, allowing more people to purchase a car and travel further� The current transport programme and aggressive National Electric Mobility Mission Plan provide sufficient incentives to realise higher fuel economy in passenger cars and a higher share of electric mobility, respectively�
Although India’s renewable energy targets represent a rapid growth in renewables generation, this cannot keep pace with the strong growth in electricity demand� The growth in fossil-based power generation capacity, especially coal, will be significantly larger than the additional capacity of renewables� The demand for coal-fired power plants will be even larger considering the ageing power plant fleet� Currently, no policies are in place to encourage the shift from coal- to gas-fired power plants as envisioned in the EE 2030 Case� Considering the large impact of this on the TPES, the government should come up with a clear policy, for example, by setting emission caps on thermal power plants�
Reduction potential energy efficiency
measures 2030 (PJ/yr)
Relevant policy (measure) in place
Feasibility of measure under current policy
schemeIndustryMore efficient pumps, motors, compressors and fans
1 996 • PAT scheme: market- based trading scheme
• National Energy Labelling Programme
• Energy Conservation Awards
• Information Service on Energy Efficiency
×
Heat and process integration
1 813 ×
Fuel savings in iron and steel sector
603 ×
Table 27: Feasibility of energy efficiency measures in the REmap + EE 2030 Case under current policy schemes, India

SYNERGIES112
Reduction potential energy efficiency
measures 2030 (PJ/yr)
Relevant policy (measure) in place
Feasibility of measure under current policy
schemeBuildingsEnergy Conservation Building Code
2 230 • Energy Conservation Building Code
• National Energy Labelling Programme
• Purchase of energy- efficient appliances by federal/state organisa-tions
• Energy Conservation Act, 2001: Schemes for energy audits for small and medium-sized enterprises
×
Appliances 1 677 ×Buildings sector – Heat pumps
119 ×
TransportVehicle efficiency improvement
65 • Transport programme: increasing fuel efficiency
✓
Further penetration PHEV and BEV
79 • National Electric Mobility Mission Plan 2020
✓
PowerHigher-efficiency NGCC plant
5 • N/A ✓
Switch from coal to gas power plants
8 387 • N/A ×
Japan
Current policies
Japan’s energy policies have changed greatly since the Fukushima catastrophe in 2011� They have shifted away from a planned expansion of nuclear power, although it is still not fully clear how Japan’s energy plants will look without nuclear power (Kuramochi, 2014)� Japan has stated the ambition to phase out nuclear energy by 2030, reduce GHG emissions and increase the share of renewables in the energy mix� The main targets and their related policies are shown in Table 28�
In 2013, Japan revised an earlier pledge and now aims to reduce its GHG emissions by 2020 by 3�8% compared to 2005 levels� The target will mean that by 2020, Japan’s emissions will have increased by 3�1% above 1990 levels� Japan will have to do little to fulfil its new 2020 pledge, as the implementation of all currently approved renewables capacity until 2020 will be sufficient to meet this new target� The
Long-term Energy Supply and Demand Outlook of 2014 set targets for the renewables share of electricity generation by 2030, broken down into sub-targets for specific renewables� Subsequent new policies may be enacted, occurring after the completion of the analysis for this report�
The growth of renewable power in Japan is mainly driven by the institution of the relatively ambitious FIT under the act on Special Measures Concerning the Procurement of Renewable Energy by Operators of Electric Utilities� As of early 2015 around 75 GW (95% of which is solar PV) had been approved for the FIT� In its Strategic Energy Plan, the government set out Japan’s long-term energy policy, focusing among other things on accelerating the introduction of renewable energy and enhancing energy efficiency and conservation across all sectors�
The main foundation of Japan’s energy efficiency and conservation policy is the 1978 Energy Conservation Act, revised in 2013� In 2016 the Japanese government decided to introduce new

WORKING PAPER 113
energy efficiency measures; however, this occurred after the completion of the analysis for this report� The 2013 revision of the act specifies regulations for all three end-use sectors, including mandatory energy efficiency management plans in the industrial and buildings sectors, a unified energy conservation
label for products and appliances, and promotion of eco-driving in transport�, The government is currently developing new measures on the minimum efficiency of thermal power plant facilities and the exploitation of unused heat sources�
Table 28: Key targets and policies, Japan
2010 2020 2030Policies/programmes/
directivesOverallGHG emissions (base year: 1990)
1�4 +10% −18% INDCs; Innovative Strategy for Energy and Environment
Renewables share in TPES 6�5% - 13–14% Long-term Energy Supply and Demand Outlook
TransportPassenger car fleeta 2–3% next-
generation cars (2008)
20% next- generation
cars
50% next- generation
cars
Next-Generation Vehicle Strategy 2010
PowerRenewables share of electricity generation
8�6% 12�5% 22–24% 2010 Basic Energy Plan; Renewable Energy Act; Long-term Energy Supply and Demand Outlook
Specific targets for electricity generation from hydro, wind, solar PV/CSP and biomass
Hydro: 21 GWWind: 2 GW
PV/CSP: 4 GW
Biomass: 3 GW
- Hydro: 48�5 GW
Wind: 10 GWPV/CSP: 64 GW
Biomass: 6�0 GW
Long-term Energy Supply and Demand Outlook
a Without accounting for land use, land use change and forestry;
Sources: Climate Action Tracker (2016); JAMA; Kuramochi (2014).

SYNERGIES114
Policies: Evaluation and recommendations
Table 29 presents the feasibility of the energy efficiency measures in the EE 2030 Case under the current policy scheme�
Japan performs well in the industrial sector� The Energy Conservation Act comprises a mix of regulatory measures, voluntary agreements, financial incentives and benchmarking systems, obligating companies to achieve specific medium- and long-term energy efficiency targets (ACEEE, 2016)� Current policy measures are likely to be sufficient to realise more efficient electric motors as well as further heat and process integration� Nevertheless, tailored policy measures are needed to encourage the deployment of industrial heat pumps, for example by providing a mix of financial incentives, regulations and information for companies� Promotional projects may prove useful to demonstrate the feasibility of the technology�
In spite of the broad package of policy measures for the buildings sector, which are mainly incorporated in the Energy Conservation Act, Japan’s buildings policy does not sufficiently support efficiency
improvements in lighting, appliances and heating systems in the commercial sector� Unlike the residential sector, the commercial sector has a lack of building codes and labelling initiatives� Therefore, it is uncertain whether the analysed efficiency options of the REmap + EE 2030 Case will be realised by 2030� Japan has the opportunity to fill the policy gaps by implementing better appliance and equipment standards, strengthening (commercial) building codes, implementing building labelling programmes, and designing a comprehensive building retrofit policy (ACEEE, 2016)� Heat pumps in buildings can be promoted by using a similar policy mix as proposed for the industrial sector�
The financial incentives and ambitious fuel efficiency standards in the transport sector are expected to be enough to drive the uptake of EVs, as envisaged in the REmap + EE 2030 Case� The shift to higher-efficiency natural gas-fired power plants is covered by the Energy Conservation Act, which provides efficiency benchmarks for the electric power generation business� However, this act does not promote the shift from coal- to gas-fired power stations�
Reduction potential energy efficiency measures 2030
(PJ/yr)
Relevant policy (measure) in place
Feasibility of measure under current policy
schemeIndustryMore efficient pumps, motors, compressors and fans
249 • Keidanren Voluntary Action Plan for the Environment
• Energy Star Program: voluntary product labelling programme
• Energy Conservation Regu-lation for Industry: standards and benchmarks of energy efficiency
• Financial measures for energy efficiency in SMS enterprises
• Guidebook on Energy Conservation in Buildings
✓
Heat and process integration
283 ✓
Industrial heat pumps 1 201 ×
Table 29: Feasibility of energy efficiency measures in the REmap + EE 2030 Case under current policy scheme, Japan

WORKING PAPER 115
Reduction potential energy efficiency measures 2030
(PJ/yr)
Relevant policy (measure) in place
Feasibility of measure under current policy
schemeBuildingsMore efficient boilers 89 • Energy Conservation Act
• Regulation and Standard for Housing and Building; Housing energy saving label; Environment and Energy Friendly Building Mark
• Financial measures for houses and SMS enterprises: low-interest loans and tax benefits for making buildings and enterprises more energy efficient�
• Several promotional policies; programmes for energy efficient appliances, products and buildings
×Lighting 443 ×Appliances 67 ×Buildings sector – Heat pumps
103 ×
TransportFurther penetration of PHEVs and BEVs
11 • Eco-Car Tax Break and subsidies for vehicles
• Fuel Efficiency Standards for Vehicles – Top Runner Programme
✓
PowerHigher-efficiency NGCC plant
11 • Energy Conservation Act ✓
Switch from coal to gas power plants
2 727 • N/A ×
Note: SMS = small and medium-sized.

SYNERGIES116
18 Most other building codes are, however, implemented at the state and local level.
19 In addition to federal measures, several state governments provide financial incentives and technical assistance for energy efficiency
measures for individual industries.
United States
Current policies
Note: this report and the analysis for the US is based on policies that were in place or planned as of mid-2016, and does not include changes that have taken place since that time�
RE/EE policy in the United States has mainly been driven by supply security concerns at the federal level, and economic activity and GHG mitigation concerns at the state level� The United States has numerous local and state-level policies� Policy initiatives vary widely by state, especially with respect to Renewable Portfolio Standards (RPS), which oblige local utilities to supply consumers with a certain percentage of their power from renewable sources� Certain states have adopted federal energy efficiency standards as well� For a detailed overview of state-level policies, see for example DSIRE (2016)�
Table 30 presents the key targets and policies at the federal level� The country has no nationwide targets aiming to reach a certain share of renewables� However, a number of federal policies and subsidies have supported the deployment of renewable power generation capacity over the years, such as the production tax credit, investment tax credit and renewable portfolio standards� Furthermore, the Environmental Protection Agency (EPA) has set more stringent emission requirements for both new and existing coal-fired power plants through clean air standards� In its Clean Power Plan, President Obama and the EPA announced the goal of reducing carbon pollution from the power sector by 32% below 2005 levels, corresponding to 870 million tonnes of carbon� For end-use sectors, policies related to transport focus largely on biofuel� In the buildings and industrial sectors, tax incentives and R&D subsidies are used to stimulate the uptake of renewable energy�
In 2013, the Obama administration set out the goal of doubling energy productivity over the period 2010–30 by means of assertive energy efficiency policies in buildings and appliances, improved automobile fuel efficiency, and support for renewable energy� The United States has several tax credit and loan programmes for energy efficiency initiatives and focuses
on investing in R&D of energy-efficient technologies� Energy building codes set minimum requirements for energy-efficient design and construction of new and renovated federal buildings�¹⁸ The United States’ ENERGY STAR® labels are praised as among global best practice for the development of voluntary appliance standards (ACEEE, 2016)� The government aims to reduce industry’s energy intensity by 25%, from 13 MJ/USD in 2010 to 10 MJ/USD in 2030, mainly via information dissemination and financial incentives�¹⁹ In the transport sector, policies focus mainly on reducing fuel consumption through fuel economy standards� Tax credits are available for PHEVs�

WORKING PAPER 117
Table 30: Key targets and policies, United States
2010 2020 2030Policies/programmes/
directivesOverallEnergy intensity 7�1 MJ/USD - 3�3 MJ/USD Blueprint for a Secure
Energy Future; US Climate Action Plan
IndustryEnergy intensity (base year: 2010) (MJ/USD)
13 10 (−25%) - Save Energy Now Program
BuildingsEnergy consumption in commercial and industrial buildings (base year: 2010)
−20% - Energy Conservation and Production Act; US Climate Action Plan; Better Building Challenge
Renewables share in federal buildings
16% 25% Executive Order 13693: Planning for Federal Sustainability in the Next Decade
Energy use savings federal buildings (base year: 2015)
2�5%/ft²/yr2015–25
net-zero buildings
TransportBiofuels (bln gallons/yr)
13 36 (2022), of which maximum of 15 from conventional biofuel
Renewable Fuel Standard Program
Specific energy consumption (miles per gallon)
23�5–27�5a 25–49a - Corporate Average Fuel Economy standards
PowerCO₂ emissions (base year: 2005)
~7 Gt −17% −32% US pledge to the Copenhagen Accord; Clean Power Plan
Renewables share of electricity use of federal government
20% - US Climate Action Plan
Electricity generation from wind, solar and geothermal sources (bln MWh)
4�1 8�2 -
a Reflects range of different types of passenger cars and light trucks; ft² = square foot; MWh = megawatt hour.
Sources: CRS (2013); IRENA (2015b).

SYNERGIES118
Policies: evaluation and recommendations
Table 31 presents the feasibility of the energy efficiency measures in the REmap + EE 2030 Case under the current policy scheme�
Federal policies targeting the buildings sector, among which are the mandatory appliance and equipment standards and ENERGY STAR® labels, are most likely sufficient to achieve higher efficiency in lighting, household appliances and commercial equipment as modelled in the REmap + EE 2030 Case� However, additional efforts are needed to realise the efficiency improvements in building envelopes� Building retrofit policies should be improved to better address older, more inefficient residential and commercial buildings� Building codes could be made more ambitious (both at the federal and state level) by setting stricter energy performance standards for buildings undergoing alterations, or by requiring building renovations to be conducted by a certain end date (ACEEE, 2016)� Such policies would accelerate the renovation rate and improve energy efficiency, particularly of older buildings� In addition to retrofit policies and comprehensive building codes, the government should create more transparency regarding the energy footprint and energy costs of buildings, for instance by obliging the use of energy labels that allows the comparison of buildings on their energy performance (ACEEE, 2016)�
The policies governing the industrial and transport sectors are not sufficient to drive the implementation of the measures in the REmap + EE 2030 Case� Even though the United States already has a solid equipment standards system, setting targets for reductions in industrial energy use is desirable for achieving increased energy savings� Such targets would encourage manufacturers to adopt globally recognised energy-efficient manufacturing standards, such as ISO 50001� Additionally, increased participation in existing voluntary partnerships, including ENERGY STAR® and the Superior Energy Performance Program, and greater investment in workforce development and training programmes for engineers, would improve energy efficiency across the sector (ACEEE, 2016)� As for the transport sector, the uptake of EVs is progressing as rapidly as needed to achieve the REmap + EE Case 2030 target� A well-designed strategy is imperative, combining the provision of long-running financial incentives to signal long-term support for EVs, transparent and easily accessible information on EVs, and non-monetary incentives such as charging stations, free parking, high-occupancy vehicle lane access and preference for EVs in public fleets (ICCT, 2016)� Additionally, strengthening fuel economy and GHG emission standards for passenger vehicles would contribute to an accelerated adoption of EVs�

WORKING PAPER 119
Reduction potential energy
efficiency measures
2030 (PJ/yr)
Relevant policy (measure) in place Feasibility of measure
under current policy
scheme
IndustryMore efficient pumps, motors, com-pressors and fans
426 • ENERGY STAR for industry; Energy Performance ratings• Save Energy Now Program• NEMA efficiency motor programa
×
Heat and process integration
1 111 • ENERGY STAR for industry• Save Energy Now Program• Superior Energy Performance (SEP) Program
×
BuildingsBuilding envelope 1 823 • US Climate Action Plan
• Better Buildings Challenge• Appliance and equipment standards, including ENERGY
STAR Program and energy performance ratings• Several energy conservation programmes providing
subsidies, tax deductions and loansb
×Lighting 15 ✓Appliances 13 ✓
Buildings sector – Heat pumps
3 904 • Residential Energy Efficiency Tax Credit ×
TransportFurther penetration of PHEVs and BEVs
404 • ARRAc: tax incentives for EVs• 37 states: financial incentives and tax or fee exemptions
as well as other non-monetary incentives such as free parking and high-occupancy vehicle lane access
×
PowerHigher-efficiency NGCC plant
490 • N/A ×
Switch from coal to gas power plants
3 359 • Clean Power Plan ✓
Table 31: Feasibility of energy efficiency measures in the EE 2030 Case under current policy scheme, United States
a NEMA: National Electrical Manufacturers Association; b See for overview of programmes: http://programs.dsireusa.org/system/program; c ARRA: American Recovery and Reinvestment Act.

SYNERGIES120
![[PPT]Chapter 18 Renewable Energy 18-1 Renewable …environmentalscienceclass.weebly.com/.../ch_18_notes.ppt · Web viewChapter 18 Renewable Energy 18-1 Renewable Energy Today Renewable](https://static.fdocuments.in/doc/165x107/5b029fb97f8b9a6a2e900bdf/pptchapter-18-renewable-energy-18-1-renewable-envir-viewchapter-18-renewable.jpg)