Renewable Electricity Storage with Ammonia Fuel: A … Engineering Research Center Renewable...
23
Resilience Engineering Research Center Renewable Electricity Storage with Ammonia Fuel: A Case Study in Japan with Optimal Power Generation Mix Model Ryoichi Komiyama, Yasumasa Fujii The University of Tokyo USAEE/IAEE 35th North American Conference, Concurrent Session 19, Royal Sonesta Hotel, Houston TX USA, November 14, 2017 1
Transcript of Renewable Electricity Storage with Ammonia Fuel: A … Engineering Research Center Renewable...

Resilience Engineering Research Center
Renewable Electricity Storage with Ammonia Fuel: A Case Study in Japan with Optimal Power Generation Mix Model
Ryoichi Komiyama, Yasumasa Fujii
The University of Tokyo
USAEE/IAEE 35th North American Conference, Concurrent Session 19, Royal Sonesta Hotel, Houston TX USA, November 14, 2017
1

Resilience Engineering Research Center
Contents
Introduction
Modelling Analysis for RE-based Ammonia Storage in Power Grid
Inter-Sectoral Analysis for RE-based Ammonia:• Electricity Sector & Chemical (Ammonia) Industrial Sector• RE-based Ammonia vs NG-based Ammonia
2

Resilience Engineering Research Center 3
Background
RE-based hydrogen system has attracted keen attention for carbon reduction in Japan. e.g. Basic Energy Plan in Japan, 2014
RE-based hydrogen system, however, requires massive investment.
Ammonia is regarded as one of the candidates for H2 carrier and a possible fuel, due to key properties of energy density and logistics
• Well-established transport and storage infrastructure already in place• Availability like propane (LPG), transported easily at low pressures• Relatively higher energy density than H2
[Unit: MJ / liter]H2 (70MPa) 9, H2 (liquid) 10, NH3 (liquid) 15, Methanol 18, Ethanol 23, Propane (liquid) 29, Gasoline 36
• R&D progress for direct combustion tech.(e.g. SOFC) • Possible contribution for low-carbon chemical industry• Possible usage for energy storage for power grid
Objective: Energy modeling analysis is conducted for positioning ammonia in low-carbon power grid and energy system

Resilience Engineering Research Center
Hydrogen‐Based Energy System
4(Source) Cabinet Office, Government of Japan, SIP ”Pioneering the Future: Japanese Science, Technology and Innovation 2015”
MCH (Methylcyclohexane) (C7H14⇔C7H8)• (Advantage) higher H2 density (500 times as much as gaseous H2), availability in existing gasoline infrastructure• (Disadvantage) dehydrogenation (400℃ steam, energy loss (30%)), Bulky, need of H2 refining for hydrogen station
Liquefied Hydrogen• (Advantage) higher H2 density (800 times as much as gaseous H2), no need of H2 refining for hydrogen station,
commercialized in power generation (dual fuel at H2 70%)• (Disadvantage) liquefaction(-253℃, energy loss (15%)), investment cost for infrastructure, boil-off (difficulty in long-
term storage)
Ammonia• (Advantage) higher H2 density (1200 times as much as gaseous H2(-33℃ or 8Pa)), availability in existing LPG
infrastructure, direct combustion in FC (fuel cell), cheap cost• (Disadvantage) toxicity, energy loss in dehydrogenation if needed, need of H2 refining for hydrogen station
* Demonstration stage
* Commercialized in small-scale project
* R&D stage, Demonstration stage
Resilience Engineering Research Center
Chemical Industry & Ammonia Market
5
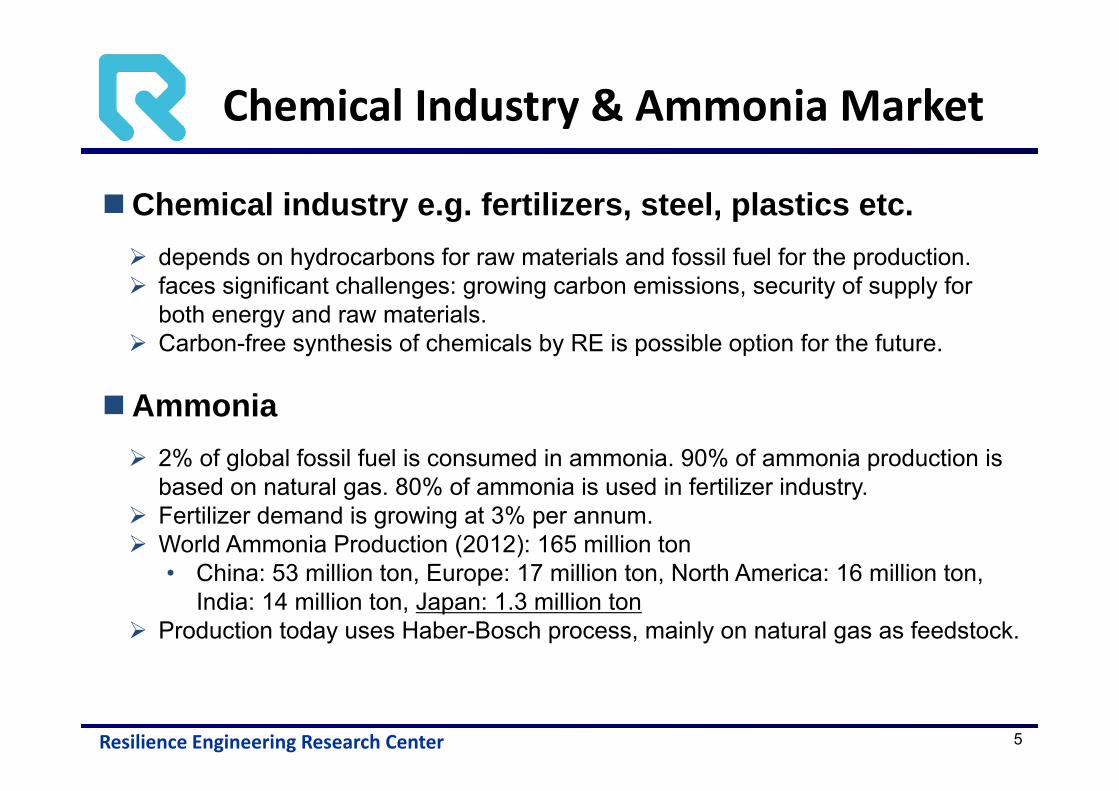
Chemical industry e.g. fertilizers, steel, plastics etc. depends on hydrocarbons for raw materials and fossil fuel for the production. faces significant challenges: growing carbon emissions, security of supply for
both energy and raw materials. Carbon-free synthesis of chemicals by RE is possible option for the future.
Ammonia 2% of global fossil fuel is consumed in ammonia. 90% of ammonia production is
based on natural gas. 80% of ammonia is used in fertilizer industry. Fertilizer demand is growing at 3% per annum. World Ammonia Production (2012): 165 million ton
• China: 53 million ton, Europe: 17 million ton, North America: 16 million ton, India: 14 million ton, Japan: 1.3 million ton
Production today uses Haber-Bosch process, mainly on natural gas as feedstock.

Resilience Engineering Research Center
Ammonia Production (Conventional Haber‐Bosch Process & RE‐based)
6
N2+3H2→2NH3
Gas Preparation Ammonia Conversion and Separation
CH4+H2O→CO+3H2
2CH4+O2→2CO+4H2
Methane, Water(CH4, H2O)
Air (O2, N2)
H2, N2, CO
H2OH2, N2, CO2
H2O H2O, CO2
H2, N2 H2, N2, NH3
H2, N2Catalysor
SeparatorReactor Cooler
Ammonia(Fluid)
Conventional(HB, NG-based)
N2+3H2→2NH3
Gas Preparation Ammonia Conversion and Separation
H2, N2 H2, N2, NH3
H2, N2
Reactor Cooler
Ammonia(Fluid)
RE-based NH3(Electrolysis + HB)
Air Separation Unit
Hydrogen ElectrolyserH2
N2
H2O
Air
Renewable Electricity

Resilience Engineering Research Center
Direct Ammonia SOFC (Solid Oxide Fuel Cell)
7
4NH3+3O2→2N2+6H2O
Utilizes inexpensive base metal catalyst (Ni or Co)Operating temperature 800-1000°C, depending on electrolyte
Ammonia Oxidation (overall reaction for complete combustion of ammonia):
Utilizes inexpensive base metal catalyst (Ni or Co)Operating temperature 450-700°C, depending on catalyst
(F. Ishak et al, 2012)
SOFC is attractive fuel cell concepts, because of their ability to accommodate a range of fuels.SOFC conventionally runs at temperatures above 500 ℃ (typically 800-1000 ℃), and one of
the advantages of this is that the cracking process, necessary to free the hydrogen from the fuel, and the generation of electricity can be combined. Ammonia can be directly input into the SOFC without any pre-treatment.Conversion Efficiency: around 60%
Oxygen ion-conducting DA-SOFC Hydrogen proton-conducting DA-SOFC
NH3 → 3/2H2+1/2N2
O2-
H2OH2
O2
NH3N2, H2, H2O, NH3
AnodeElectrolyte
Cathode
O2, N2 O2, N2
V
NH3 → 3/2H2+1/2N2
H2O
H2
O2
NH3 N2, H2, NH3
AnodeElectrolyte
Cathode
O2, N2 O2, N2 ,H2O
VH+

Resilience Engineering Research Center
Optimal Power Generation Mix Model (OPGM)
8
Linear programming model. Single-year minimization of total electricity system cost Power grid topology: 135 nodes, 166 power lines (high-voltage) Time-resolution: 10-min hours on 365 days ⇒ 52,560 time segments per year
(=6×26×365)
(Power plants)• Construction cost• Capital recovery factor• Fuel cost• Life time (or legal durable years)• Conversion efficiency• Annual average availability• Seasonal peak availability• Load following capability• Ratio of DSS mode operation• Minimum output constraints• Schedule of plant maintenance• Fuel supply constraints• Existing power plant capacity• Constraints on newly built capacity
Electricity load curve
PV and wind power output
• Carbon regulation• Carbon tax
High Time-Resolution Optimal Power Generation Mix Model
(Calculated results)• Newly constructed capacity• Power generation• Power generation cost• Fuel consumption• CO2 emissions• Optimal power dispatch
(Energy storage technology)• kW、kWh construction cost• Cost of consumable parts• Life cycle• Round-trip efficiency• Self discharge loss• C-rate constraints• Maximum kWh ratio to kW• Usage ratio
The model evaluates the installable potential of RE-based ammonia storage system in the Japanese power grid.
Optimal Power Generation Mix Model (OPGM) Power Grid Topology and Demand in Japan
(Reference)• Komiyama, R., Fujii, Y., Energy Policy, Vol.101, pp.594–611 (2017)• Komiyama, R., Fujii, Y, Energy, Vol.81, pp.537–555 (2015)

Resilience Engineering Research Center
Optimal Power Generation Mix Model (OPGM) ,combined with RE‐based Ammonia Storage
9
• Wind• PV system
Electrolyzer
NH3 Synthesis (HB)
Fuel Cell (SOFC)
NH3
Suppression ControlRE‐based Ammonia Storage System
• Nuclear• Coal‐fired• LNG‐fired• Oil‐fired• Hydro• Geothermal
• NAS Battery• Li‐ion Battery• Pumped‐hydro
Electricity
Power Grid Electricity LoadElectricity Electricity
Electricity
Electricity Electricity
Power Generators
Energy Storage
N2 Separation
NH3 Liquefaction
NH3 TankO2 Production O2
N2
H2
NH3
RE‐based NH3 Supply
The model considers cost trade-off of ammonia with rechargeable battery, RE output curtailment and inter-node power transmission exchange.

Resilience Engineering Research Center
Case Setting
CO2 RegulationBase (No Regulation), ‐50%, ‐60%, ‐70%, ‐80%
10
Cost of NH3 technology (electrolyzer, NH3 production and storage, SOFC) is assumed as -80% reduction from reference values.
Nuclear, thermal, hydro, pumped, electricity demand etc. are assumed on the basis of METI’s energy outlook in 2030.
PV and wind installations are endogenized (determined through the optimization)• Lower limit values: PV (64 GW), wind (10 GW) from METI’s energy outlook in 2030 • Upper limit values: PV (330 GW ), wind (260 GW) from potential survey by Ministry of Environment, Japan.

Resilience Engineering Research Center
0
100
200
300
400
500
600
700
800
900
Base
(MET
I 203
0)
CO2
50%
Red
.
CO2
60%
Red
.
CO2
70%
Red
.
CO2
80%
Red
.
GW AmmoniastorageSOFC
NH3 plant (HB)
Electroyzer
Battery2
Battery1
Pumped
PV
Wind
Oil
LNG GCC
-400
-200
0
200
400
600
800
1000
1200
1400
Base
(MET
I 203
0)
CO2
50%
Red
.
CO2
60%
Red
.
CO2
70%
Red
.
CO2
80%
Red
.
TWh LossSuppressed PVSuppressed WindAmmonia(PV)Ammonia(wind)Ammonia(out)Battery2(out)Battery1(out)Pumped(ont)Ammonia(in)Battery2(in)Battery1(in)Pumped(in)PVWindElectrolyzerAmmonia(out) & SOFCOilLNG GCCLNG STCoalNuclearMarineBiomassGeothermalHydro
Power Generation Mix in Japan
• Strict CO2 regulation policy accelerates the installations of PV, wind and energy storage system, such as NAS battery and NH3 storage, which replace carbon-intensive thermal power plants.
• Power transmission loss increases, due to nation-wide power exchange caused by massive RE integration.• Installation of NH3 storage is smaller than that of NAS battery
CapacityPower Generation
11
LNGCCCoal
WindPV
NAS
NH3(wind)
Nuclear
NASPower trans. loss
LNGCCCoal
Wind
PV
NAS
NH3 storage
Nuclear
NH3 storage

Resilience Engineering Research Center
Optimal Installation of PV and WindCO2: ‐80% reduction case
PV
• PV tends to be installed in demand-intensive region such as Kanto, Kansai and Chubu which have enough power balancing resources.
• Wind turbine (onshore) is introduced in the resource rich regions such as Tohoku and Kyushu.
PV[GW] Wind[GW]
Wind
12

Resilience Engineering Research Center
Locational Marginal Price (LMP) of ElectricityAnnual Average, CO2: ‐80% reduction case
Nodal Price Range[yen per kWh]
• Electricity price is lower in northern part of Japan, due to the installation of renewable energy.
13

Resilience Engineering Research Center
Ammonia Storage[GWh]
Ammonia Storage Installation
CO2 regulation plays an important role to accelerate the introduction of RE‐based ammonia energy system.
14
210,000 ton is equal to three units of LNG bulk storage tank.
Ammonia Storage CapacityAmmonia Storage Capacity in CO2 ‐80% Red. Case
(=37 [1,000 ton of LNG])
0
50
100
150
200
250
Base (METI2030)
CO2 50%Red.
CO2 60%Red.
CO2 70%Red.
CO2 80%Red.
(1,000 LNG‐ton)

Resilience Engineering Research Center
-8
-6
-4
-2
0
2
4
6
8
10
12
14Po
wer
Sys
tem
Ope
ratio
n [G
W]
LossInter ChangeSuppressed PVSuppressed WindAmmonia(PV)Ammonia(wind)Battery2(out)Battery1(out)Pumped(ont)Ammonia(in)Battery2(in)Battery1(in)Pumped(in)PVWindAmmonia(out) & SOFCOilLNG GCCLNG STCoalNuclearMarineBiomassGeothermalHydroLoad
-40
-20
0
20
40
60
80
Pow
er S
yste
m O
pera
tion
[GW
]
LossInter ChangeSuppressed PVSuppressed WindAmmonia(PV)Ammonia(wind)Battery2(out)Battery1(out)Pumped(ont)Ammonia(in)Battery2(in)Battery1(in)Pumped(in)PVWindAmmonia(out) & SOFCOilLNG GCCLNG STCoalNuclearMarineBiomassGeothermalHydroLoad
-60
-40
-20
0
20
40
60
80
100
Pow
er S
yste
m O
pera
tion
[GW
]
LossInter ChangeSuppressed PVSuppressed WindAmmonia(PV)Ammonia(wind)Battery2(out)Battery1(out)Pumped(ont)Ammonia(in)Battery2(in)Battery1(in)Pumped(in)PVWindAmmonia(out) & SOFCOilLNG GCCLNG STCoalNuclearMarineBiomassGeothermalHydroLoad
-20
-10
0
10
20
30
40
Pow
er S
yste
m O
pera
tion
[GW
]
LossInter ChangeSuppressed PVSuppressed WindAmmonia(PV)Ammonia(wind)Battery2(out)Battery1(out)Pumped(ont)Ammonia(in)Battery2(in)Battery1(in)Pumped(in)PVWindAmmonia(out) & SOFCOilLNG GCCLNG STCoalNuclearMarineBiomassGeothermalHydroLoad
Power Dispatch in May
15
Aug.1
Hokkaido
Tohoku
Tokyo
Kyushu NH3(PV)NH3(wind)
Wind
NH3 storage
NH3(out) & SOFC
NH3(wind)
NH3(wind)
Power Interchange
Suppressed Wind
Wind
NAS
NH3 storage NAS
NH3(out) & SOFC
NH3 storage
Suppressed PV
Suppressed PVSuppressed Wind
Power Interchange
NAS
NAS
Pumped(in)
Pumped(out)
Suppressed Wind
Power Interchange
NAS
NAS
NH3(wind)
Wind
PV
LNGCC
LNGCC
Suppressed PV
CO2: -80% reduction case

Resilience Engineering Research Center
0
500
1000
1500
2000
2500
1‐Jan
1‐Feb
1‐Mar
1‐Apr
1‐May
1‐Jun
1‐Jul
1‐Aug
1‐Sep
1‐Oct
1‐Nov
1‐Dec
31‐Dec
Stored
Electricity
[GWh]
Pumped
NaS
Li‐ion
Ammonia
Annual SOC of Electricity Storage in Japan
16
Round‐trip efficiency of NH3 storage is not good, and it is not suitable for a daily cycle.
Charge and discharge cycle of NH3 storage tank shows a monthly or seasonal cycle, while that of NAS battery exhibits a daily cycle .
Since a storage loss of NH3 tank is very low, the model selects a long‐term NH3storage of surplus RE output as an optimal solution under strict CO2 regulation.
Ammonia is a suitable option for a long-term storage of RE energy.
SOC of NH3 storage tank and battery
NH3
NAS Battery
Jan.,1 Feb.,1 Mar.,1 Apr.1 May,1 Jun.,1 Jul.,1 Aug.,1 Sep.,1 Oct.,1 Nov.,1 Dec.,1 Dec.,31
CO2: -80% reduction case

Resilience Engineering Research Center
Inter‐Sectoral Analysis for RE‐based Ammonia(Electricity Sector & Chemical Industrial Sector)
17
• Wind• PV system
Electrolyzer
NH3 Synthesis (HB)
Fuel Cell (SOFC)
NH3
Suppression ControlAmmonia Storage System integrated with VRs
• Nuclear• Coal‐fired• LNG‐fired• Oil‐fired• Hydro• Geothermal
• NAS Battery• Li‐ion Battery• Pumped‐hydro
Electricity
Power Grid Electricity LoadElectricity Electricity
Electricity
Electricity Electricity
Power Generators
Energy Storage
N2 Separation
NH3 Liquefaction
NH3 TankO2 Production O2
N2
H2
NH3 NH3 Demand
Haber‐Bosch (HB)Process
RE‐based NH3 Supply
NH3
NH3
Electricity SectorChemical Industrial Sector
(Ammonia)
NH3 Demand:1.3 mil. ton
CO2 Coefficient of NH3: 1.6 t/t-NH3NH3 Price: 570 $/t-NH3
Optimal Power Generation Mix Model, combined with RE-based Ammonia and Conventional (NG-based) Ammonia Supply
Conventional NH3 Supply
CH4
Natural Gas

Resilience Engineering Research Center
RE‐based & Conventional (NG‐based) Ammonia
18
CO2 Regulation for Total Emissions of both Electricity & Chemical Sectors BAU (No Regulation), ‐10%, ‐20%, ‐30%, ‐40%, ‐50%, ‐60%, ‐70%, ‐80%
Ammonia Sales Composition
0
200
400
600
800
1000
1200
1400
BAU 10%red.
20%red
30%red.
40%red.
50%red.
60%red.
70%red.
80%red.
Ammon
ia Produ
ction [100
0 ton]
CO2 Regulation Scenario
RE‐based NH3
Conventional NH3
Which is economically affordable option under carbon regulation ? Carbon regulation, around after CO2 40% reduction case,
encourages RE-based NH3 supply
Conventional(NG‐based)
RE‐based

Resilience Engineering Research Center
CO2 Price (Shadow Price)
19
0
200
400
600
800
1000
1200
1400
1600
1800
10%red.
20%red
30%red.
40%red.
50%red.
60%red.
70%red.
80%red.
CO2 Marginal Price [$/t]
CO2 Regulation Scenario
Carbon price shows accelerative increase as severe carbon regulations are assigned.e.g.
Carbon Price: 200 [$/t] → LNG Price: +11 [$/MMBtu]LNG Price in Japan (2015): 9.3 [$/MMBtu] → 20 [$/MMBtu] Carbon Price: 1600 [$/t] → LNG Price: +89 [$/MMBtu]LNG Price in Japan (2015): 9.3 [$/MMBtu] → 98 [$/MMBtu]
CO2 Price (CO2 Shadow Price)

Resilience Engineering Research Center
Summary
CO2 regulation are prerequisite for promoting RE‐based ammonia
Severe carbon regulation potentially replaces conventional ammonia supply with RE‐based ammonia
Ammonia is a suitable option for a long‐term storage of RE energy, such as in a seasonal or monthly cycle.
RE‐based ammonia is not dominant even under severe carbon regulation, due to its competition with rechargeable battery and other measures such as internode power exchange.
20

Resilience Engineering Research Center
Thanks for your kind attention.
Ryoichi KomiyamaAssociate Professor
The University of Tokyo
AcknowledgmentThis work was supported by JSPS KAKENHI Grant Number JP17H03531, JP15H01785,and by the Environment Research and Technology Development Fund 2‐1704 of the
Environmental Restoration and Conservation Agency .
21

Resilience Engineering Research Center
PV [GW]Wind [GW]
PV and Wind Potential in Japanestimated by Ministry of Environment, Japan
PV Wind
22
Upper limit of PV and wind in each node is set by using those potential estimations by Ministry of Environment, Japan

Resilience Engineering Research Center
0
20
40
60
80
100
120
Hokkaido Tohoku Kanto Chubu Hokuriku Kansai Shikoku Chugoku Kyushu
TWh
Suppressed Wind
Ammonia(wind)
Wind
0
20
40
60
80
100
Hokkaido Tohoku Kanto Chubu Hokuriku Kansai Shikoku Chugoku Kyushu
TWh
Suppressed PV
Ammonia(PV)
PV
23
Wind (Japan)
PV (Japan)
PV, Wind and NH3 Production
In CO2 80% reduction case, 10% of wind output is utilized NH3 production. Wind-based NH3 is observed in Tohoku, Kyushu and Hokkaido. NH3 is not so much produced from PV output. In Kyushu, however, 30% of PV output is utilized for NH3 production.
Wind (by region, CO2 -80%)
PV (by region, CO2 -80%)
0
50
100
150
200
250
300
350
Base
(MET
I 203
0)
CO2
50%
Red
.
CO2
60%
Red
.
CO2
70%
Red
.
CO2
80%
Red
.
TWh
Suppressed Wind
Ammonia(wind)
Wind
0
50
100
150
200
250
300
Base
(MET
I 203
0)
CO2
50%
Red
.
CO2
60%
Red
.
CO2
70%
Red
.
CO2
80%
Red
.
TWh
Suppressed PV
Ammonia(PV)
PV
NH3
NH3
NH3NH3NH3
NH3