Renewable Electricity Markets & Policies...European balancing markets are often technology-neutral....
18
© OECD/IEA 2018 Renewable Electricity Markets & Policies An IEA Perspective Dr. Paolo Frankl, Head Renewable Energy Division, IEA METI Sub-Committee, Tokyo, 10 June 2019 IEA 資料2-1
Transcript of Renewable Electricity Markets & Policies...European balancing markets are often technology-neutral....

© OECD/IEA 2018
Renewable Electricity Markets & Policies An IEA Perspective
Dr. Paolo Frankl, Head Renewable Energy Division, IEA
METI Sub-Committee, Tokyo, 10 June 2019
IEA
資料2-1

2© OECD/IEA 2018
Distributed generation capacity growth makes the difference in solar PV’s leadership
Cumulative PV capacity could reach 1.1 TW and wind over 0.9 TW by 2023 under the accelerated case
Renewable electricity capacity growth by technology
Solar PV and wind expanding very fast in the next five years
0
100
200
300
400
500
600
700
800
2006-2011 2012-2017 2018-2023
GW
Wind Utility-scale PV Distributed PV HydropowerBioenergy Other renewables Accelerated case
Notes: Utility-Scale PV: more than 1MW, Distributed PV: less than 1MW but the data also takes into account country definitions due to availability of information and may include projects
larger than 1 MW under the distributed PV category. For instance, China’s definition of distributed PV may include projects up to 5 MW but these are connected to the distribution grid.

3© OECD/IEA 2018
Japan is #6 worldwide in terms of cumulative installed renewable power capacity; #3 for solar PV
Renewable electricity status and forecast
Cumulative installed renewable power capacity in selected countries, 2017 & forecast 2023

4© OECD/IEA 2018
Both country-specific conditions and policy design influence the cost of wind and solar PV
Renewable investment costs are relatively high in Japan
Investment cost of onshore wind and solar PV by technology
Source: IRENA
0
1 000
2 000
3 000
4 000
5 000
6 000
7 000
8 000
2010 2012 2014 2016 2018
USD
/kW
China Germany India Japan United States Korea Italy
Solar PV
0
500
1 000
1 500
2 000
2 500
3 000
3 500
4 000
2010 2012 2014 2016 2018
Onshore wind
5© OECD/IEA 2018
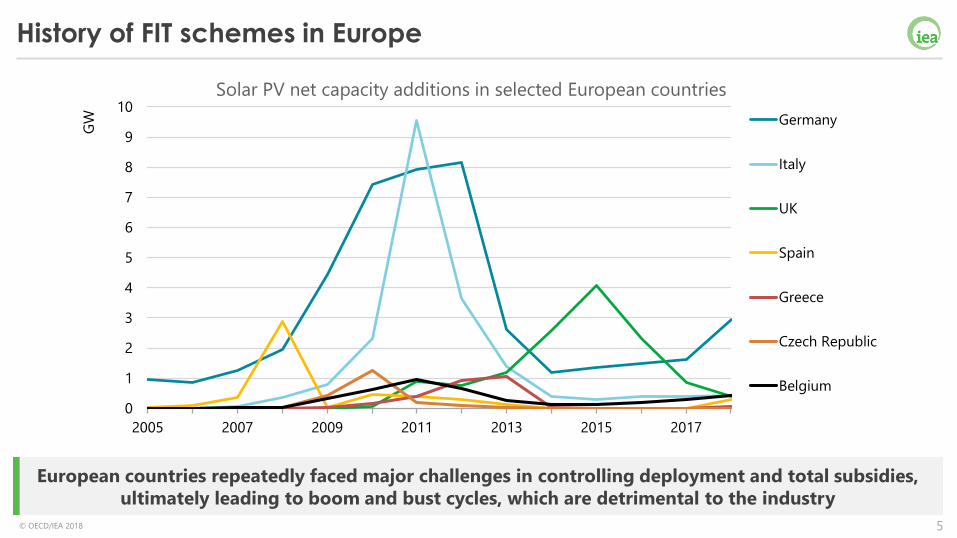
European countries repeatedly faced major challenges in controlling deployment and total subsidies,
ultimately leading to boom and bust cycles, which are detrimental to the industry
History of FIT schemes in Europe
0
1
2
3
4
5
6
7
8
9
10
2005 2007 2009 2011 2013 2015 2017
GW Germany
Italy
UK
Spain
Greece
Czech Republic
Belgium
Solar PV net capacity additions in selected European countries

6© OECD/IEA 2018
Almost 60% of renewable capacity additions over 2018-23 remunerated by competitive auctions;
announced contract prices need to be verified as project delivery schedules and final costs may differ
Competition accelerating cost reductions
Average auction price by project commissioning date
0
50
100
150
200
250
300
2012 2014 2016 2018 2020 2022
USD/MWh
Onshore wind price Offshore wind price Solar PV price
Fixed remuneration type of utility-scale projects
0
100
200
300
400
500
600
700
800
900
2012-17 Renewables 2017,2017-22
Renewables 2018,2018-23
GW
Administratively set Competitively set
Notes: For countries all over the world
7© OECD/IEA 2018
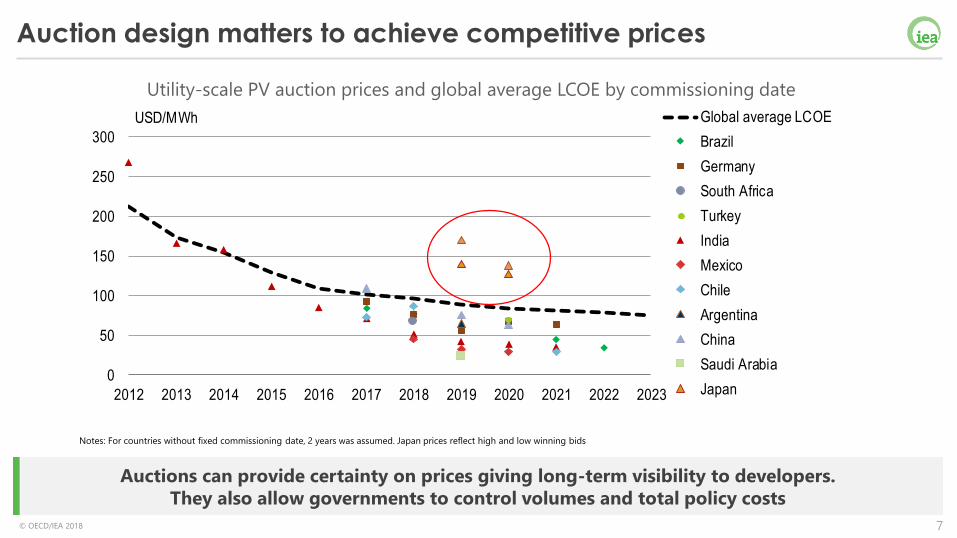
Auctions can provide certainty on prices giving long-term visibility to developers.
They also allow governments to control volumes and total policy costs
Auction design matters to achieve competitive prices
0
50
100
150
200
250
300
2012 2013 2014 2015 2016 2017 2018 2019 2020 2021 2022 2023
USD/MWh Global average LCOE
Brazil
Germany
South Africa
Turkey
India
Mexico
Chile
Argentina
China
Saudi Arabia
Japan
Utility-scale PV auction prices and global average LCOE by commissioning date
Notes: For countries without fixed commissioning date, 2 years was assumed. Japan prices reflect high and low winning bids

8© OECD/IEA 2018
Transferring risk
Demonstration
projects
• No risk for developers
Capital grants
• Few risks, in the installation phase
FiT• Technology and resource
risk (energy must be produced for some years)
Sliding FiP
• Some exposure to market prices
• Imbalance risk
Fixed FiP
• Larger exposure to market prices
Administratively set prices
Lack of project selection
Auction schemes
Project selection

9© OECD/IEA 2018
Specific power system regions can be at higher VRE integration phases due to limited interconnection
and VRE penetration. This can require market reforms to meet increased flexibility requirements
System integration: different phases
% V
RE o
f an
nu
al ele
ctri
city
gen
era
tio
n
0%
10%
20%
30%
40%
50%
60%
70%
VRE shares in total electricity generation by region in 2018
Phase 1 - No relevant impact on system Phase 2 - Minor to moderate impact on system operation
Phase 3 - VRE determines the operation pattern of the system Phase 4 - VRE makes up almost all generation in some periods

10© OECD/IEA 2018
The challenges faced by specific subsystems will vary according to the flexibility resources available.
Even at low VRE shares, integration can require policy and regulatory innovation.
Flexibility requirements depend on a combination of factors
Denmark Hokkaido Ireland Kyushu
VRE Share 63% 8% 29% 11%
Area (1000*km2) 42.9 83.4 84.4 36.7
Peak electricity
demand (GW)
5.8 5.3 4.9 15.9
Total electricity
demand (TWh)
31.7 30.6 28.2 87.8
Interconnector
capacity
8 GW combined
AC and HVDC
900 MW HVDC 420 MW 2.78 GW AC
Population
(million)
5.75 5.28 4.78 12.97

11© OECD/IEA 2018
Flexibility requirements depend on phase
A comprehensive approach to system flexibility covers not only technical aspects, but also policy,
market and regulatory frameworks, as well as institutional arrangements.

12© OECD/IEA 2018
System-friendly renewables policies
System services: wind and sun contribute to balance system24/7
Spain: wind activeon balancing market
Location: siting VRE closer to existing network capacity and/or load centers
Mexico: auctions reflect time-and location- value of electricity
Technology mix: balanced mix of VRE resources can foster lasting synergies
South Africa: Integrated Resource Plan
Local integration with other resources such as demand-side response, storage
Australia: incentives for self-consumption
Optimising generation time profile: design of wind and solar plants
California: incentive to produce at peak times
Integrated planning: wind and solar embedded in energy strategy
Denmark: integrated energy strategy
Action area Policy example
13© OECD/IEA 2018
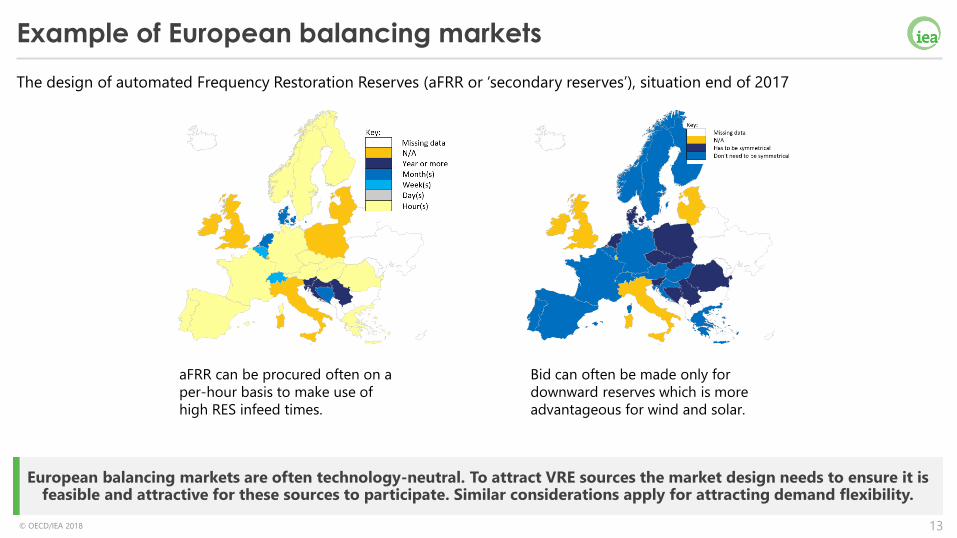
European balancing markets are often technology-neutral. To attract VRE sources the market design needs to ensure it is feasible and attractive for these sources to participate. Similar considerations apply for attracting demand flexibility.
Example of European balancing markets
The design of automated Frequency Restoration Reserves (aFRR or ‘secondary reserves’), situation end of 2017
aFRR can be procured often on a
per-hour basis to make use of
high RES infeed times.
Bid can often be made only for
downward reserves which is more
advantageous for wind and solar.

14© OECD/IEA 2018
Also in liberalized energy markets, there is value in having an integrated planning exercise to understand
system limits, guide investment plans and create incentives for VRE connection in suitable locations.
Pro-active communication on system hosting capacities
(Example: Vito, Belgian voluntary study on hosting
capacity for PV on substation level)
(Example: PG&E Distribution Resource
Plan in line with CPUC code)

15© OECD/IEA 2018
Potential of self-consumption critically depends on the match between PV supply and load demand,
which can strongly vary across countries, type of end-uses and remuneration schemes
High retail prices are a driver for self-consumption
Residential electricity prices compared with average residential PV LCOE, 2017
0
150
300
450
0 0.5 1 1.5 2 2.5
Average variable retail electricity price (USD/MWh)
Average variable retail electricity price / Average residential PV LCOE
Italy
Australia
Spain
Germany
Japan
France
Korea
UK
India
China
Mexico
California
PV profitable for self-consumptionPV not profitable for self-consumption
Notes: Residential PV: less than 10kW

16© OECD/IEA 2018
A new Clean Energy Ministerial horizontal accelerator focused on sector coupling will be considered in
2019 to broaden understanding and share experiences of this trend.
Sector Coupling addresses wider energy system decarbonisation
• Sector coupling efforts have the potential to enroll new flexible loads at scale to enhance power system flexibility.
• As all energy sectors are impacted there is a need for coordination of economic policies beyond the power system.
• Interlinkage of taxes and tariffs between various sectors of electricity, fuels, gas and bioenergy should not become barriers for wider system decarbonization
17© OECD/IEA 2018
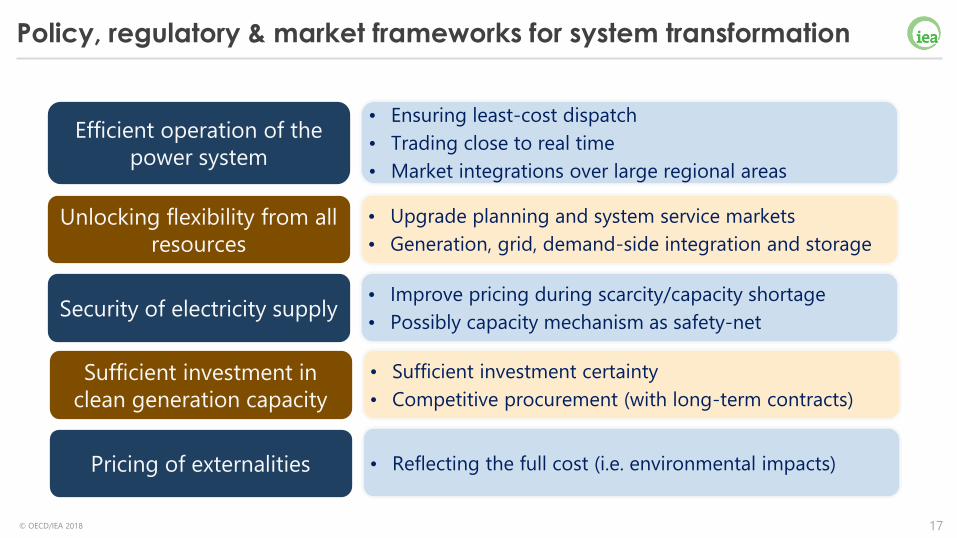
Policy, regulatory & market frameworks for system transformation
• Ensuring least-cost dispatch
• Trading close to real time
• Market integrations over large regional areas
Efficient operation of the
power system
• Upgrade planning and system service markets
• Generation, grid, demand-side integration and storage
Unlocking flexibility from all
resources
• Improve pricing during scarcity/capacity shortage
• Possibly capacity mechanism as safety-netSecurity of electricity supply
• Sufficient investment certainty
• Competitive procurement (with long-term contracts)
Sufficient investment in
clean generation capacity
• Reflecting the full cost (i.e. environmental impacts)Pricing of externalities

18© OECD/IEA 2018
Recommendations for Japan
• Increase competition and complete transition from FITs to auctions (except for small-
scale installations)
• Aim at deploying a larger portfolio of renewables, including wind off-shore, bioenergy,
geothermal
• Make renewables responsible for balancing and allow them to participate in ancillary
service markets
• Implement integrated planning and provide information on system-readiness to
integrate renewables
• Foster distributed energy resources, self-consumption and distributed flexibility
• Plan in advance coherent sector-coupling, including looking at tariffs and taxation