Renault Mégane Berline dCi 110 Diesel - Transport · PDF fileecoTECHNOLOGY for...
35
__________________________________________________________________________________ ecoTECHNOLOGY for Vehicles 1 Renault Mégane Berline dCi 110 Diesel Test results report June 2011
Transcript of Renault Mégane Berline dCi 110 Diesel - Transport · PDF fileecoTECHNOLOGY for...
__________________________________________________________________________________ ecoTECHNOLOGY for Vehicles 1
Renault Mégane Berline dCi 110 Diesel
Test results report
June 2011
__________________________________________________________________________________ ecoTECHNOLOGY for Vehicles 2
Disclaimer notice
Transport Canada's ecoTECHNOLOGY for Vehicles program ("eTV") tests emerging vehicle technologies to assess their performance in accordance with established Canadian motor vehicle standards. The test results presented herein do not, in themselves, represent an official determination by Transport Canada regarding fuel consumption or compliance with safety and emission standards of any motor vehicle or motor vehicle component. Transport Canada does not certify, approve or endorse any motor vehicle product. Technologies selected for evaluation, and test results, are not intended to convey policy or recommendations on behalf of Transport Canada or the Government of Canada. Transport Canada and more generally the Government of Canada make no representation or warranty of any kind, either express or implied, as to the technologies selected for testing and evaluation by eTV, nor as to their fitness for any particular use. Transport Canada and more generally the Government of Canada do not assume nor accept any liability arising from any use of the information and applications contained or provided on or through these test results. Transport Canada and more generally the Government of Canada do not assume nor accept any liability arising from any use of third party sourced content. Any comments concerning its content should be directed to: Transport Canada Environmental Initiatives (AHEC) ecoTECHNOLOGY for Vehicles (eTV) Program 330 Sparks Street Place de Ville, Tower C Ottawa, Ontario K1A 0N5 E-mail: [email protected] © Her Majesty in Right of Canada, as represented by the Minister of Transport, 2009-2010
__________________________________________________________________________________ ecoTECHNOLOGY for Vehicles 3
TABLE OF CONTENTS
EXECUTIVE SUMMARY ................................................................................................ 4
1.0 INTRODUCTION................................................................................................... 7
2.0 TESTING PROGRAM ........................................................................................... 7
3.0 TESTING LOCATIONS ........................................................................................ 7
4.0 VEHICLE OVERVIEW ........................................................................................ 8
5.0 PHASE I - FUEL CONSUMPTION AND EMISSIONS TESTING.................. 9 5.1 2-CYCLE VS. 5-CYCLE FUEL CONSUMPTION CALCULATIONS ........................... 10
5.1.1 2-Cycle Fuel Consumption Results ................................................. 12 5.1.2 5-Cycle Fuel Consumption Results ................................................. 13
5.2 GHG EMISSIONS VERSUS OTHER REGULATED EMISSIONS ............................... 15 5.2.1 CO2 Emissions Results .................................................................... 16 5.2.2 Regulated Emissions Results ........................................................... 16
5.3 CONSTANT SPEED TESTING .............................................................................. 17 5.3.1 CO2 Emissions Results .................................................................... 17 5.3.2 Regulated Emissions Results ........................................................... 19 5.3.3 Cold Starting Performance ............................................................. 21
6.0 PHASE II - DYNAMIC TESTING ..................................................................... 21 6.1 ACCELERATION EVALUATION .......................................................................... 22 6.2 MAXIMUM SPEED IN GEAR ............................................................................... 23 6.3 LATERAL ACCELERATION ................................................................................. 24
6.3.1 Skid Pad Test ...................................................................................... 24 6.3.2 Emergency Lane Change Manoeuvre ................................................ 25 6.3.3 Slalom ................................................................................................ 27
6.4 NOISE EMISSIONS TESTS ................................................................................... 28 6.4.1 Exterior Noise (CMVSS 1106) ........................................................... 28 6.4.2 Interior Noise ..................................................................................... 30
6.5 BRAKING .......................................................................................................... 32 6.5.1 Light Vehicle Braking Systems (CMVSS 135) ................................... 32
6.6 TURNING CIRCLE .............................................................................................. 32
7.0 PHASE III - ON-ROAD EVALUATIONS ......................................................... 33
8.0 CONCLUSIONS ................................................................................................... 34
9.0 WHAT DOES THIS MEAN FOR CANADIANS? ............................................ 35
__________________________________________________________________________________ ecoTECHNOLOGY for Vehicles 4
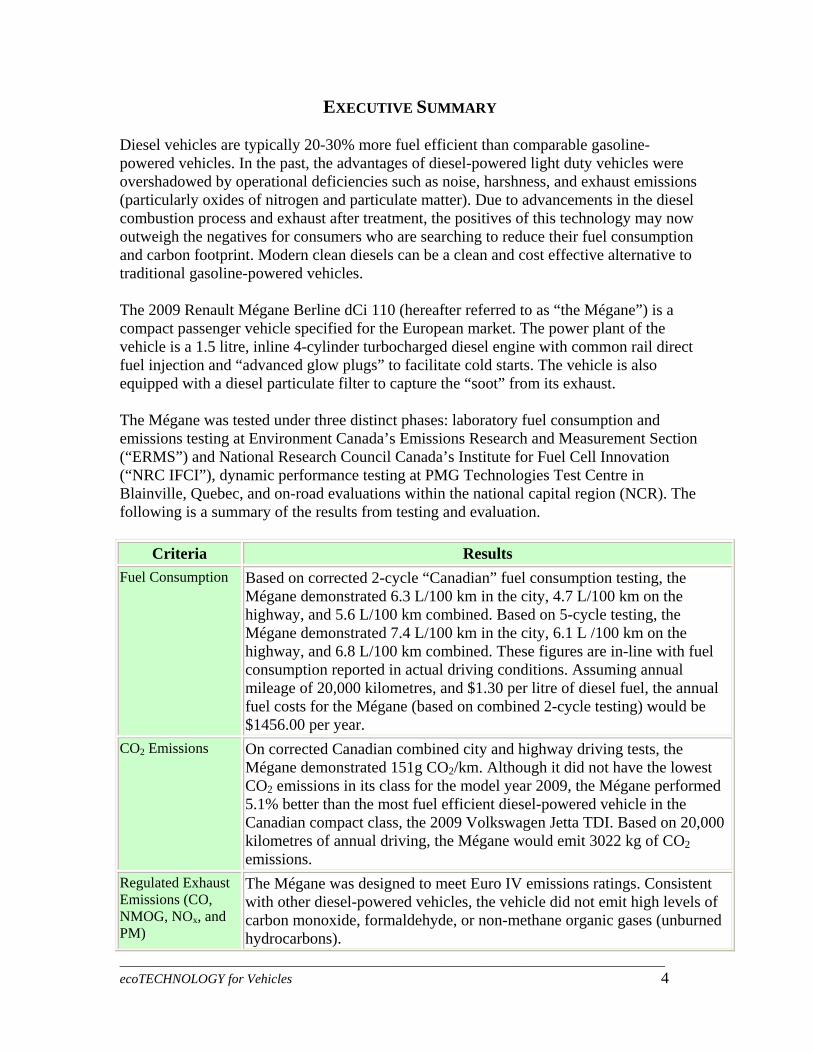
EXECUTIVE SUMMARY Diesel vehicles are typically 20-30% more fuel efficient than comparable gasoline-powered vehicles. In the past, the advantages of diesel-powered light duty vehicles were overshadowed by operational deficiencies such as noise, harshness, and exhaust emissions (particularly oxides of nitrogen and particulate matter). Due to advancements in the diesel combustion process and exhaust after treatment, the positives of this technology may now outweigh the negatives for consumers who are searching to reduce their fuel consumption and carbon footprint. Modern clean diesels can be a clean and cost effective alternative to traditional gasoline-powered vehicles. The 2009 Renault Mégane Berline dCi 110 (hereafter referred to as “the Mégane”) is a compact passenger vehicle specified for the European market. The power plant of the vehicle is a 1.5 litre, inline 4-cylinder turbocharged diesel engine with common rail direct fuel injection and “advanced glow plugs” to facilitate cold starts. The vehicle is also equipped with a diesel particulate filter to capture the “soot” from its exhaust. The Mégane was tested under three distinct phases: laboratory fuel consumption and emissions testing at Environment Canada’s Emissions Research and Measurement Section (“ERMS”) and National Research Council Canada’s Institute for Fuel Cell Innovation (“NRC IFCI”), dynamic performance testing at PMG Technologies Test Centre in Blainville, Quebec, and on-road evaluations within the national capital region (NCR). The following is a summary of the results from testing and evaluation.
Criteria Results Fuel Consumption Based on corrected 2-cycle “Canadian” fuel consumption testing, the
Mégane demonstrated 6.3 L/100 km in the city, 4.7 L/100 km on the highway, and 5.6 L/100 km combined. Based on 5-cycle testing, the Mégane demonstrated 7.4 L/100 km in the city, 6.1 L /100 km on the highway, and 6.8 L/100 km combined. These figures are in-line with fuel consumption reported in actual driving conditions. Assuming annual mileage of 20,000 kilometres, and $1.30 per litre of diesel fuel, the annual fuel costs for the Mégane (based on combined 2-cycle testing) would be $1456.00 per year.
CO2 Emissions On corrected Canadian combined city and highway driving tests, the Mégane demonstrated 151g CO2/km. Although it did not have the lowest CO2 emissions in its class for the model year 2009, the Mégane performed 5.1% better than the most fuel efficient diesel-powered vehicle in the Canadian compact class, the 2009 Volkswagen Jetta TDI. Based on 20,000 kilometres of annual driving, the Mégane would emit 3022 kg of CO2 emissions.
Regulated Exhaust Emissions (CO, NMOG, NOx, and PM)
The Mégane was designed to meet Euro IV emissions ratings. Consistent with other diesel-powered vehicles, the vehicle did not emit high levels of carbon monoxide, formaldehyde, or non-methane organic gases (unburned hydrocarbons).
__________________________________________________________________________________ ecoTECHNOLOGY for Vehicles 5
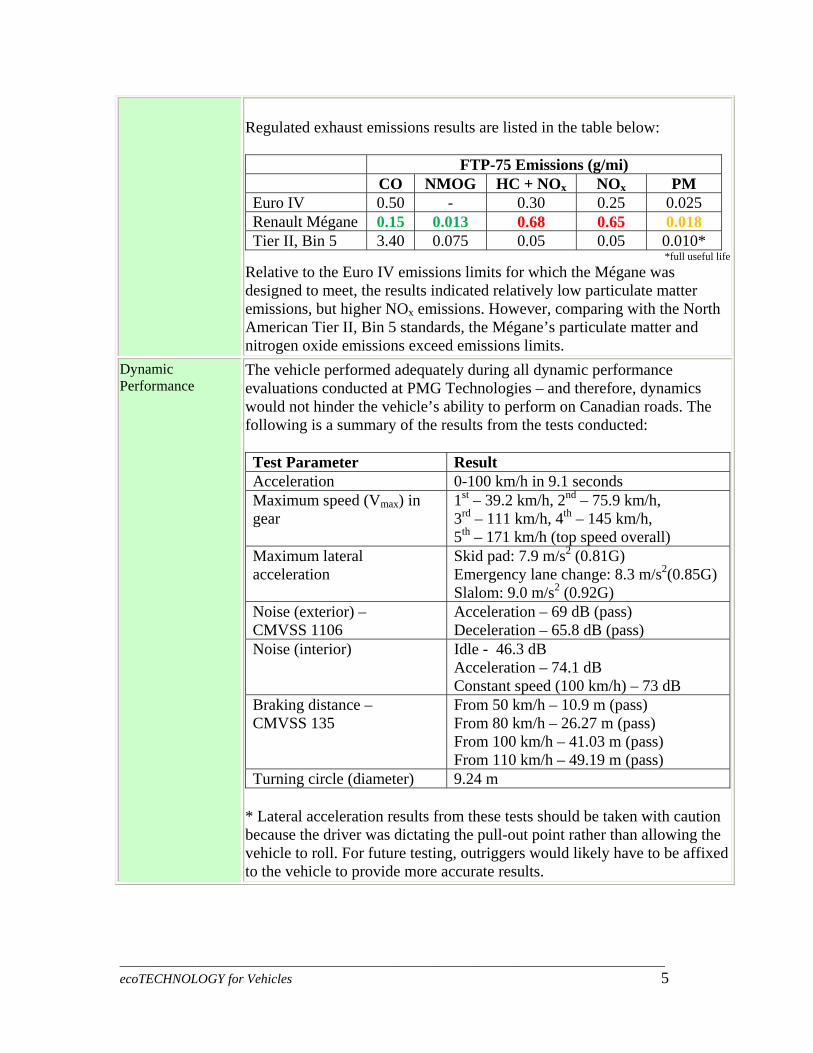
Regulated exhaust emissions results are listed in the table below: FTP-75 Emissions (g/mi) CO NMOG HC + NOx NOx PM Euro IV 0.50 - 0.30 0.25 0.025 Renault Mégane 0.15 0.013 0.68 0.65 0.018 Tier II, Bin 5 3.40 0.075 0.05 0.05 0.010*
*full useful lifeRelative to the Euro IV emissions limits for which the Mégane was designed to meet, the results indicated relatively low particulate matter emissions, but higher NOx emissions. However, comparing with the North American Tier II, Bin 5 standards, the Mégane’s particulate matter and nitrogen oxide emissions exceed emissions limits.
Dynamic Performance
The vehicle performed adequately during all dynamic performance evaluations conducted at PMG Technologies – and therefore, dynamics would not hinder the vehicle’s ability to perform on Canadian roads. The following is a summary of the results from the tests conducted: Test Parameter Result Acceleration 0-100 km/h in 9.1 seconds Maximum speed (Vmax) in gear
1st – 39.2 km/h, 2nd – 75.9 km/h, 3rd – 111 km/h, 4th – 145 km/h, 5th – 171 km/h (top speed overall)
Maximum lateral acceleration
Skid pad: 7.9 m/s2 (0.81G) Emergency lane change: 8.3 m/s2(0.85G) Slalom: 9.0 m/s2 (0.92G)
Noise (exterior) – CMVSS 1106
Acceleration – 69 dB (pass) Deceleration – 65.8 dB (pass)
Noise (interior) Idle - 46.3 dB Acceleration – 74.1 dB Constant speed (100 km/h) – 73 dB
Braking distance – CMVSS 135
From 50 km/h – 10.9 m (pass) From 80 km/h – 26.27 m (pass) From 100 km/h – 41.03 m (pass) From 110 km/h – 49.19 m (pass)
Turning circle (diameter) 9.24 m * Lateral acceleration results from these tests should be taken with caution because the driver was dictating the pull-out point rather than allowing the vehicle to roll. For future testing, outriggers would likely have to be affixed to the vehicle to provide more accurate results.
Driver Evaluations Several evaluators commented on the vehicle’s high torque when accelerating from a standing start, sufficient cargo space, smoothness of transmission, and quiet performance. Evaluators also remarked on the obstructed view of hand controls (most notably the radio controls behind the steering wheel), and the 4-way hazard lights icon on the driver display (even though the hazard lights themselves were not on).
Barriers to the Introduction of Diesel Technologies in Canada Potential barriers to the introduction of clean diesel technologies into Canada include: 1) Consumers perceptions of diesel technologies: Recently, acceptance of diesel technology has improved in North America – a rebound from misperceptions that have lingered over the past several years. In fact, when a diesel powered vehicle is available as an option over the traditional gasoline powered vehicle, the consumer chose the diesel up to 30% of the time (in comparison to 10% for hybrids over their gasoline counterparts)1. A major concern consumers have with purchasing new vehicle technologies is the capital acquisition cost. High costs of diesel exhaust treatment technologies could lead to a longer return on investment time. By disseminating the Mégane’s emissions and performance results to Canadians, the eTV program is challenging outdated misperceptions of diesel engine technology. 2) Regulatory Barriers: There are important emissions and safety compliance differences between North America and Europe. Currently, it is up to the original equipment manufacturer (OEM) to ensure compliance with the market being sold in. Sometimes modifications required for compliance may come at a large cost– thus creating a financial burden on the manufacturer. In collaboration with manufacturers and industry associations, eTV is demonstrating how diesels, if equipped with the proper exhaust treatment technologies, can offer a clean alternative for internal combustion engine (ICE) powered light duty vehicles in Canada.
__________________________________________________________________________________ ecoTECHNOLOGY for Vehicles 6
1 “Research and Markets: Analysis of Diesel Powertrain Outlook and Technology Roadmap in NA”. http://www.pr-inside.com/research-and-markets-analysis-of-diesel-r2516746.htm, Business Wire, 2011.
__________________________________________________________________________________ ecoTECHNOLOGY for Vehicles 7
1.0 INTRODUCTION In the past, the advantages of diesel-powered light duty vehicles were overshadowed by operational deficiencies such as noise, vibration, harshness (NVH), presence of oxides of nitrogen (NOx) and particulate matter (PM) in the exhaust, and poor cold starting performance. Due to advancements in the diesel combustion process and exhaust treatment, the advantages of this technology may now outweigh the disadvantages as consumers reduce their fuel consumption and carbon footprint. The 2009 Renault Mégane Berline is powered with a 1.5 litre, inline 4-cylinder turbocharged diesel engine with common rail direct fuel injection and “advanced glow plugs” to facilitate cold starts. The vehicle is also equipped with a passive diesel particulate filter to capture the unburned carbon “soot” from the vehicle’s exhaust. 2.0 TESTING PROGRAM The Mégane was tested and evaluated over three phases: laboratory fuel consumption and emissions testing; dynamic track testing; and on-road evaluations. These different phases were intended to assess the vehicle’s overall performance, as well as to identify any possible regulatory or consumer barriers that may negatively impact the introduction of the various advanced technologies featured in the vehicle in Canada. The Mégane was evaluated using standard testing procedures for conventional vehicles based on the Canadian motor vehicle safety standards (CMVSS), the Code of Federal Regulations (CFR) established by the U.S. Environmental Protection Agency (EPA), the U.S. Department of Transportation (DoT), the International Organization for Standardization (ISO) and the Society of Automotive Engineers (SAE). For more information, please see Renault Mégane Test Plan . 3.0 TESTING LOCATIONS Phase I testing was performed in partnership with Environment Canada at the Emissions Measurement and Research Section (ERMS) located in Ottawa, Ontario, and with National Research Council Canada (NRC) at the Institute for Fuel Cell Innovation (NRC IFCI) in Vancouver, British Columbia. Fuel consumption testing was performed in a controlled laboratory using a vehicle chassis dynamometer. The laboratory environment ensured that testing was completed within ± 1 degree Celsius. Additionally, the vehicle was tested according to separate driving cycles and was maintained within a ± 1.5 km/h limit of the required speed. Phase II testing was performed at Transport Canada’s test track facility in Blainville, Québec. The closed test track environment was necessary to ensure that testing was performed in a controlled setting and under controlled conditions. The test track is equipped with over 25 kilometres of road, including a high-speed and a low-speed circuit, to allow for a variety of tests.
Phase III testing consisted of on-road evaluations. Transport Canada staff were invited to drive the vehicle and then complete a detailed evaluation questionnaire. Automotive journalists were also given the opportunity to drive the vehicle at eTVs media day in August 2010. 4.0 VEHICLE OVERVIEW
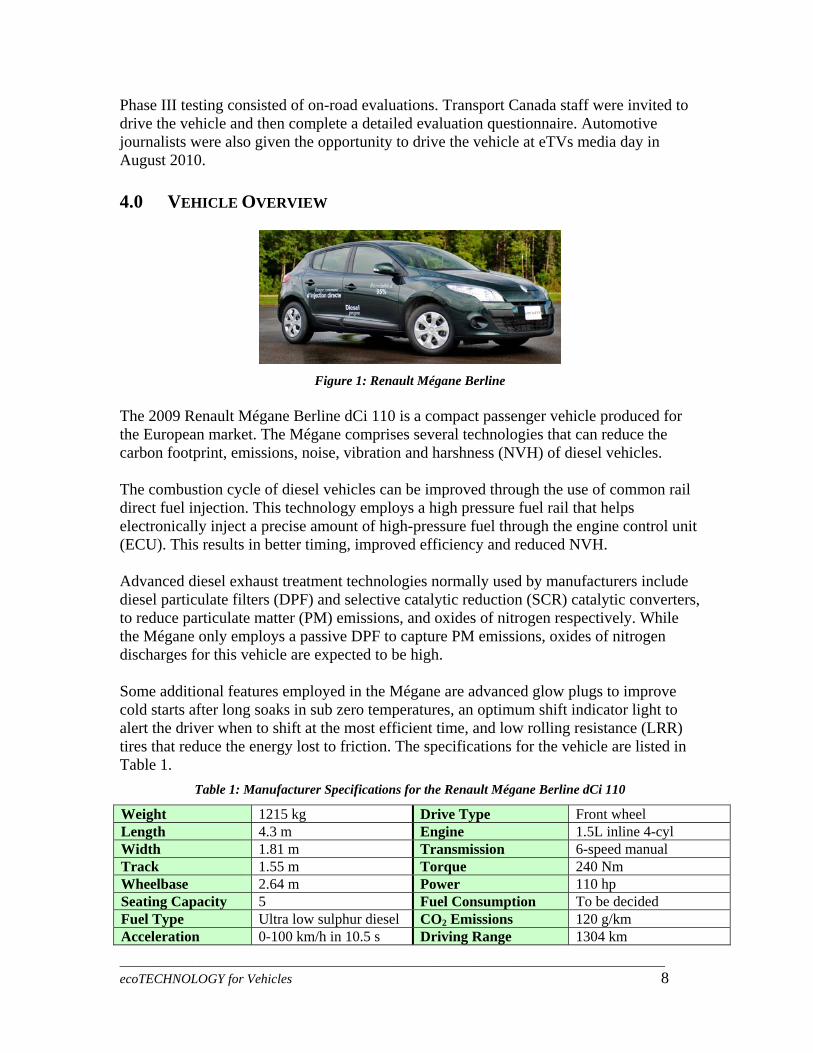
Figure 1: Renault Mégane Berline
The 2009 Renault Mégane Berline dCi 110 is a compact passenger vehicle produced for the European market. The Mégane comprises several technologies that can reduce the carbon footprint, emissions, noise, vibration and harshness (NVH) of diesel vehicles. The combustion cycle of diesel vehicles can be improved through the use of common rail direct fuel injection. This technology employs a high pressure fuel rail that helps electronically inject a precise amount of high-pressure fuel through the engine control unit (ECU). This results in better timing, improved efficiency and reduced NVH. Advanced diesel exhaust treatment technologies normally used by manufacturers include diesel particulate filters (DPF) and selective catalytic reduction (SCR) catalytic converters, to reduce particulate matter (PM) emissions, and oxides of nitrogen respectively. While the Mégane only employs a passive DPF to capture PM emissions, oxides of nitrogen discharges for this vehicle are expected to be high. Some additional features employed in the Mégane are advanced glow plugs to improve cold starts after long soaks in sub zero temperatures, an optimum shift indicator light to alert the driver when to shift at the most efficient time, and low rolling resistance (LRR) tires that reduce the energy lost to friction. The specifications for the vehicle are listed in Table 1.
Table 1: Manufacturer Specifications for the Renault Mégane Berline dCi 110
Weight 1215 kg Drive Type Front wheel Length 4.3 m Engine 1.5L inline 4-cyl Width 1.81 m Transmission 6-speed manual Track 1.55 m Torque 240 Nm Wheelbase 2.64 m Power 110 hp Seating Capacity 5 Fuel Consumption To be decided Fuel Type Ultra low sulphur diesel CO2 Emissions 120 g/km Acceleration 0-100 km/h in 10.5 s Driving Range 1304 km
__________________________________________________________________________________ ecoTECHNOLOGY for Vehicles 8
__________________________________________________________________________________ ecoTECHNOLOGY for Vehicles 9
echanical
5.0 PHASE I - FUEL CONSUMPTION AND EMISSIONS TESTING In keeping with the Code of Federal Regulations (CFR) mileage accumulation procedures (which require that more than 3,500 kilometres be accumulated on the vehicle prior to dynamometer testing), the Mégane was driven 3,733 kilometres prior to the first test. Once mileage accumulation was completed, the vehicle was soaked2 at the specified temperature (for the particular test) for no less than eight hours before each test. This is toensure that the vehicle may be compared against other test vehicles undergoing the sameemissions and fuel/energy consumption evaluations, and that all electrical and mcomponents and fluids have reached the chosen temperature by the time of testing. Fuel consumption tests were performed as per the standard CFR procedures, which were all performed at the facilities operated by the Emissions Research and Measurement Section (ERMS) of Environment Canada. Evaluations were performed over the US federal test procedure (FTP) driving cycles listed in Table 2.
Table 2: Chassis Dynamometer Test Schedule
Test Parameter Test Standard Number of tests
Urban Driving FTP-75 4 Cold Test FTP-72 1
Aggressive Driving US06 (SFTP) 2 Highway Driving US HWFET 2 Electrical Load US SC03 2
The vehicle was mounted on a chassis dynamometer, where the front wheels were allowed to roll against a resistance drum. The drum resistance was pre-programmed based on the vehicle’s road load force parameters. The road load force parameters were obtained from a series of coastdowns from 115 km/h to 15 km/h, as specified by SAE J1263 – Road Load Measurement and Dynamometer Simulation Using Coastdown Techniques. The result was a model for road load force as a function of speed, while driving on a dry, level road, under reference conditions of 20°C (68°F) and approximately 101 kPa (29.00 in-Hg), with no wind or precipitation and with the transmission in neutral.
Environment Canada collected and analyzed exhaust emissions for each of the duty cycles listed in Table 2. The emissions data were analyzed for: • carbon dioxide (CO2); • carbon monoxide (CO); • oxides of nitrogen (NOx); • particulate matter (PM);
2 To soak a vehicle means to park it in the test chamber with the engine turned off, to allow the entire vehicle, including the engine, fluids, transmission and drive train, to reach the test cell temperature prior to beginning the test.
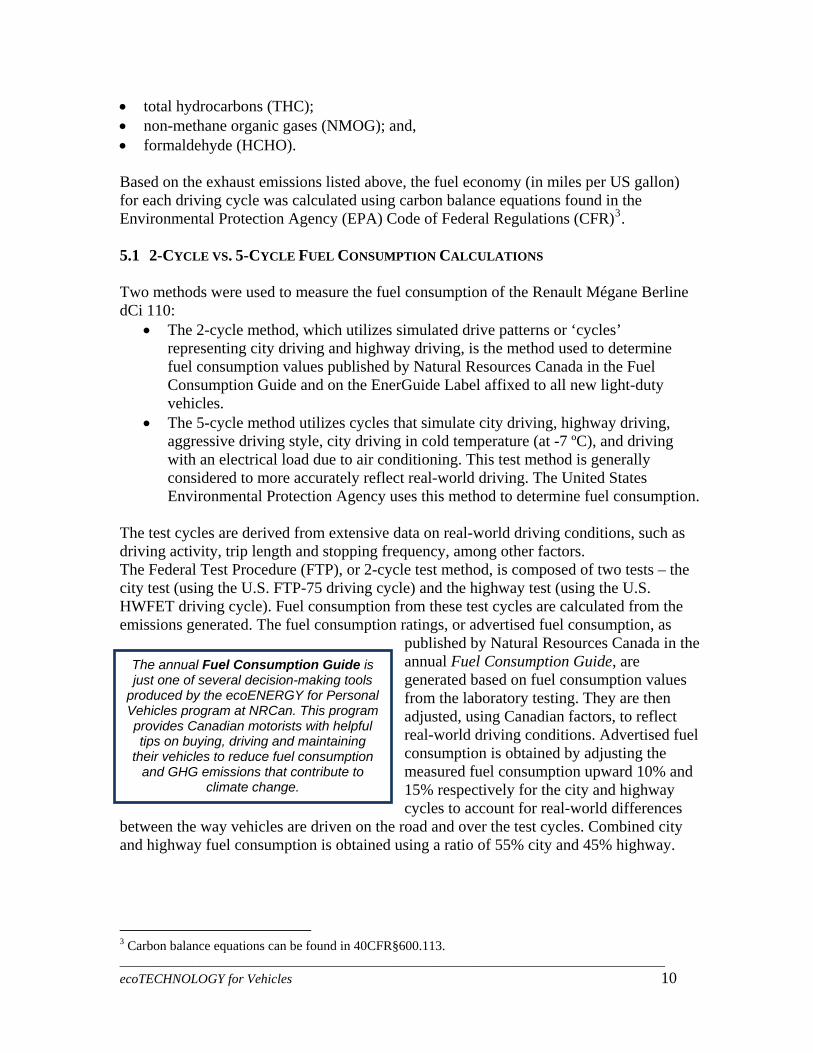
• total hydrocarbons (THC); • non-methane organic gases (NMOG); and, • formaldehyde (HCHO). Based on the exhaust emissions listed above, the fuel economy (in miles per US gallon) for each driving cycle was calculated using carbon balance equations found in the Environmental Protection Agency (EPA) Code of Federal Regulations (CFR)3. 5.1 2-CYCLE VS. 5-CYCLE FUEL CONSUMPTION CALCULATIONS Two methods were used to measure the fuel consumption of the Renault Mégane Berline dCi 110:
• The 2-cycle method, which utilizes simulated drive patterns or ‘cycles’ representing city driving and highway driving, is the method used to determine fuel consumption values published by Natural Resources Canada in the Fuel Consumption Guide and on the EnerGuide Label affixed to all new light-duty vehicles.
• The 5-cycle method utilizes cycles that simulate city driving, highway driving, aggressive driving style, city driving in cold temperature (at -7 ºC), and driving with an electrical load due to air conditioning. This test method is generally considered to more accurately reflect real-world driving. The United States Environmental Protection Agency uses this method to determine fuel consumption.
The test cycles are derived from extensive data on real-world driving conditions, such as driving activity, trip length and stopping frequency, among other factors.
The annual Fuel Consumption Guide is just one of several decision-making tools
produced by the ecoENERGY for Personal Vehicles program at NRCan. This program provides Canadian motorists with helpful tips on buying, driving and maintaining
their vehicles to reduce fuel consumption and GHG emissions that contribute to
climate change.
The Federal Test Procedure (FTP), or 2-cycle test method, is composed of two tests – the city test (using the U.S. FTP-75 driving cycle) and the highway test (using the U.S. HWFET driving cycle). Fuel consumption from these test cycles are calculated from the emissions generated. The fuel consumption ratings, or advertised fuel consumption, as
published by Natural Resources Canada in the annual Fuel Consumption Guide, are generated based on fuel consumption values from the laboratory testing. They are then adjusted, using Canadian factors, to reflect real-world driving conditions. Advertised fuel consumption is obtained by adjusting the measured fuel consumption upward 10% and 15% respectively for the city and highway cycles to account for real-world differences
between the way vehicles are driven on the road and over the test cycles. Combined city and highway fuel consumption is obtained using a ratio of 55% city and 45% highway.
__________________________________________________________________________________ ecoTECHNOLOGY for Vehicles 10
3 Carbon balance equations can be found in 40CFR§600.113.

__________________________________________________________________________________ ecoTECHNOLOGY for Vehicles 11
ures
s. The ), and
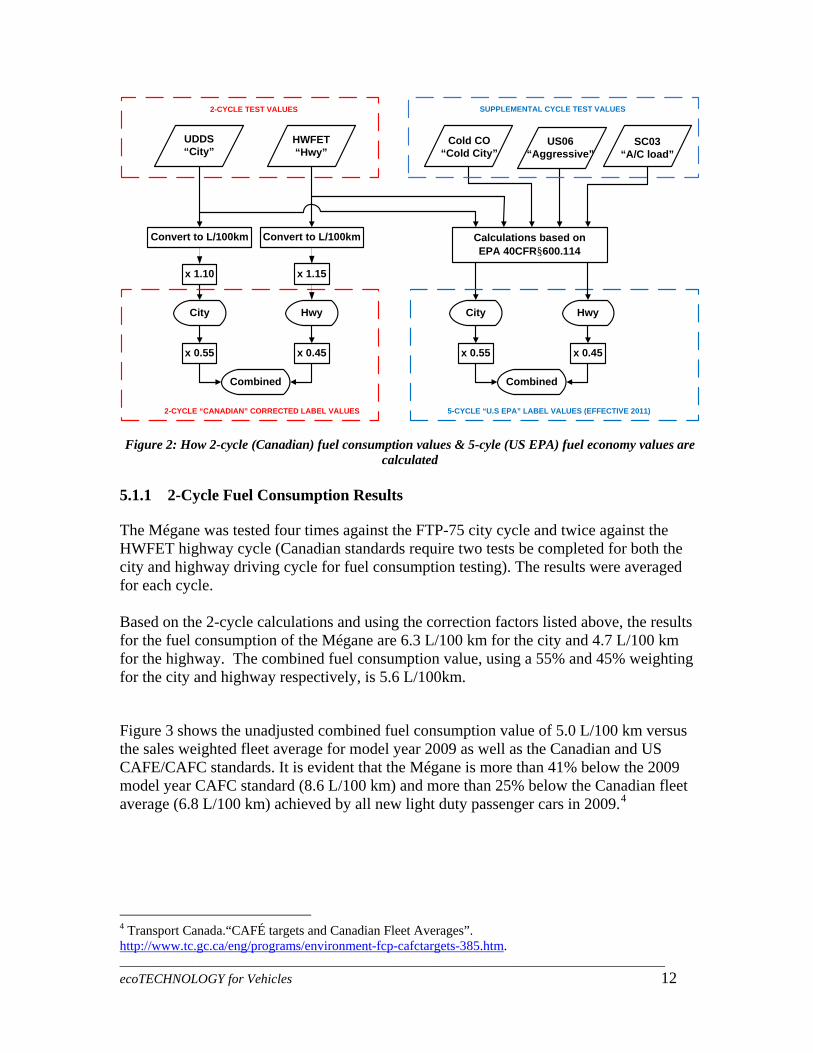
The 5-cycle test method takes into consideration additional driving conditions including: aggressive driving style, use of air conditioning, and urban driving in cold conditions. The U.S. EPA began to implement the additional test cycles, known collectively as the Supplemental Federal Test Procedure (SFTP), for fuel consumption in 2006, and started publishing fuel consumption results according to the 5-cycle test procedure for model year 2008 vehicles. Prior to this, both Canada and the United States used both the FTP and SFTP, or 5-cycle method, for emissions testing of vehicles only. The 5-cycle method includes testing over a wider range of driving patterns and temperature conditions than those tested under the 2-cycle method. For example, the US06 aggressive driving cycle takes into account aggressive driving. Furthermore, drivers often use air conditioning in warm and/or humid conditions. The US SC03 test cycle reflects the added fuel needed to operate the air conditioning system. As well, given Canada’s climate, a typical vehicle will be driven below 0°C on a fairly regular basis. The U.S. FTP-72 cold test cycle, conducted at 20°F (-7°C), is used to reflect the effect on fuel consumption when starting and operating an engine at lower temperatures. Fuel consumption values derived from either the 2-cycle or 5-cycle method have merit when used to compare the fuel consumption of one vehicle to that of another. However, comparisons are only valid when the method for obtaining the fuel consumption value is consistent. For example, a fuel consumption value derived from the 2-cycle method should only be compared to other fuel consumption values derived from the 2-cycle method. Because it takes other factors into account that typically increase fuel consumption the 5-cycle method usually yields fuel consumption values that are approximately 10% to 20% higher than the advertised 2-cycle fuel consumption value for the same make and model. However, accurate forecasting of fuel consumption is difficult in practice due to the many unpredictable factors that affect driving efficiency. Figure 2 shows a schematic of the process that is used to determine the advertised or ‘label’ fuel consumption values. As figured, the 2-cycle method used in Canada measfuel consumption based on the city and highway drive cycles. These results are adjusted upward 10% and 15% respectively to produce the advertised fuel consumption value5-cycle method uses the city, highway, aggressive (US06), air conditioning (SC03cold city drive cycles, all of which are used to calculate the advertised city and highway fuel consumption estimates in the United States.
UDDS “City”
HWFET “Hwy”
Cold CO“Cold City”
SC03“A/C load”
x 1.10
2-CYCLE TEST VALUES
x 1.15
Calculations based on EPA 40CFR§600.114
US06“Aggressive”
SUPPLEMENTAL CYCLE TEST VALUES
City
2-CYCLE “CANADIAN” CORRECTED LABEL VALUES
Hwy
x 0.55 x 0.45
Combined
City
5-CYCLE “U.S EPA” LABEL VALUES (EFFECTIVE 2011)
Hwy
x 0.55 x 0.45
Combined
Convert to L/100km Convert to L/100km
Figure 2: How 2-cycle (Canadian) fuel consumption values & 5-cyle (US EPA) fuel economy values are
calculated 5.1.1 2-Cycle Fuel Consumption Results The Mégane was tested four times against the FTP-75 city cycle and twice against the HWFET highway cycle (Canadian standards require two tests be completed for both the city and highway driving cycle for fuel consumption testing). The results were averaged for each cycle. Based on the 2-cycle calculations and using the correction factors listed above, the results for the fuel consumption of the Mégane are 6.3 L/100 km for the city and 4.7 L/100 km for the highway. The combined fuel consumption value, using a 55% and 45% weighting for the city and highway respectively, is 5.6 L/100km. Figure 3 shows the unadjusted combined fuel consumption value of 5.0 L/100 km versus the sales weighted fleet average for model year 2009 as well as the Canadian and US CAFE/CAFC standards. It is evident that the Mégane is more than 41% below the 2009 model year CAFC standard (8.6 L/100 km) and more than 25% below the Canadian fleet average (6.8 L/100 km) achieved by all new light duty passenger cars in 2009.4
__________________________________________________________________________________ ecoTECHNOLOGY for Vehicles 12
4 Transport Canada.“CAFÉ targets and Canadian Fleet Averages”. http://www.tc.gc.ca/eng/programs/environment-fcp-cafctargets-385.htm.
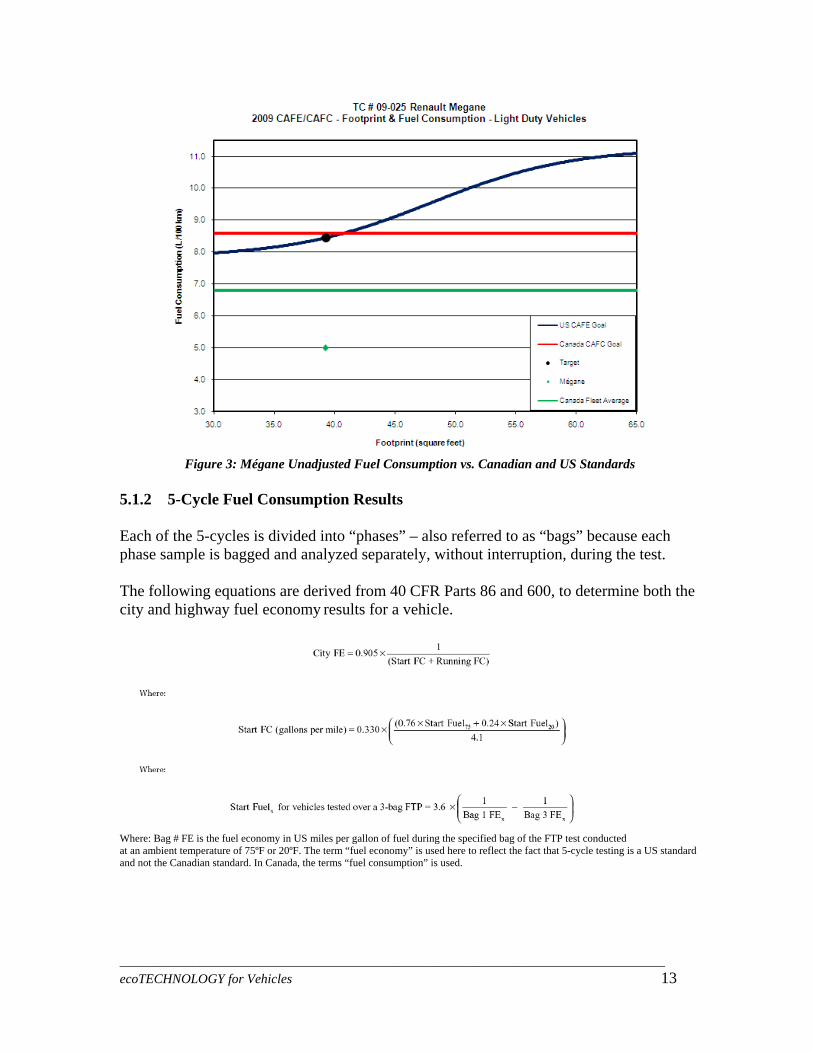
Figure 3: Mégane Unadjusted Fuel Consumption vs. Canadian and US Standards
5.1.2 5-Cycle Fuel Consumption Results Each of the 5-cycles is divided into “phases” – also referred to as “bags” because each phase sample is bagged and analyzed separately, without interruption, during the test. The following equations are derived from 40 CFR Parts 86 and 600, to determine both the city and highway fuel economy results for a vehicle. Where: Bag # FE is the fuel economy in US miles per gallon of fuel during the specified bag of the FTP test conducted at an ambient temperature of 75ºF or 20ºF. The term “fuel economy” is used here to reflect the fact that 5-cycle testing is a US standard and not the Canadian standard. In Canada, the terms “fuel consumption” is used.
__________________________________________________________________________________ ecoTECHNOLOGY for Vehicles 13
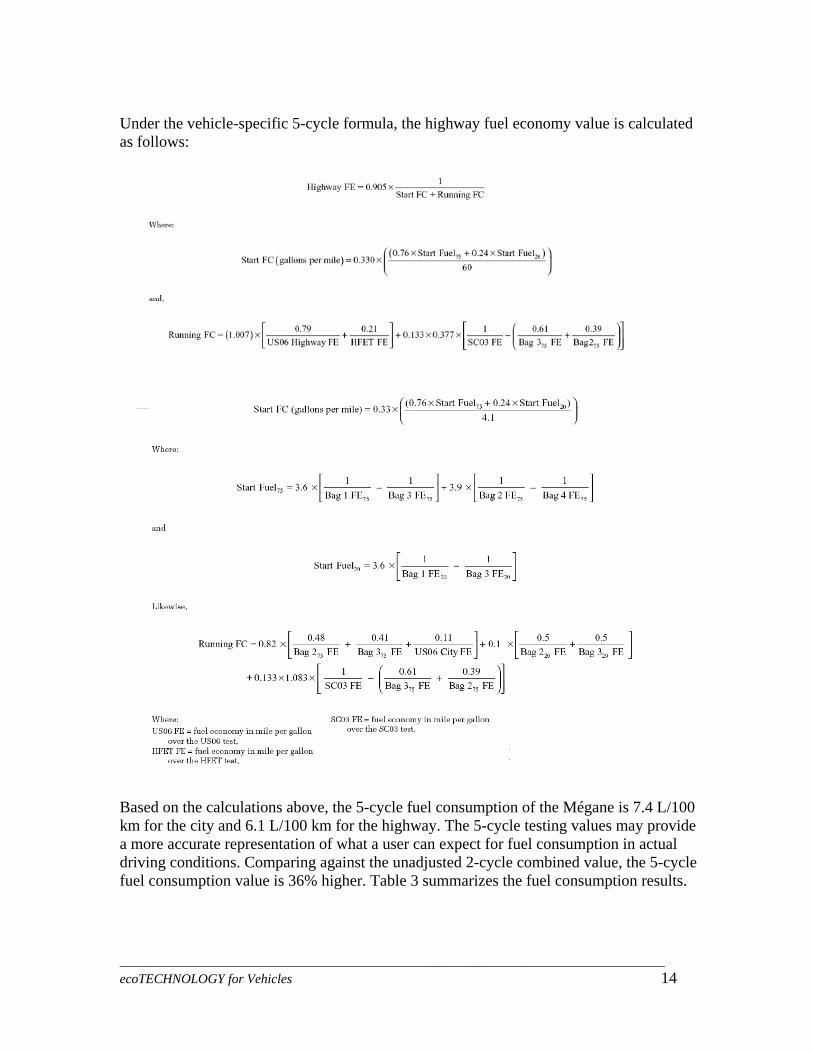
Under the vehicle-specific 5-cycle formula, the highway fuel economy value is calculated as follows:
Based on the calculations above, the 5-cycle fuel consumption of the Mégane is 7.4 L/100 km for the city and 6.1 L/100 km for the highway. The 5-cycle testing values may provide a more accurate representation of what a user can expect for fuel consumption in actual driving conditions. Comparing against the unadjusted 2-cycle combined value, the 5-cycle fuel consumption value is 36% higher. Table 3 summarizes the fuel consumption results. __________________________________________________________________________________ ecoTECHNOLOGY for Vehicles 14
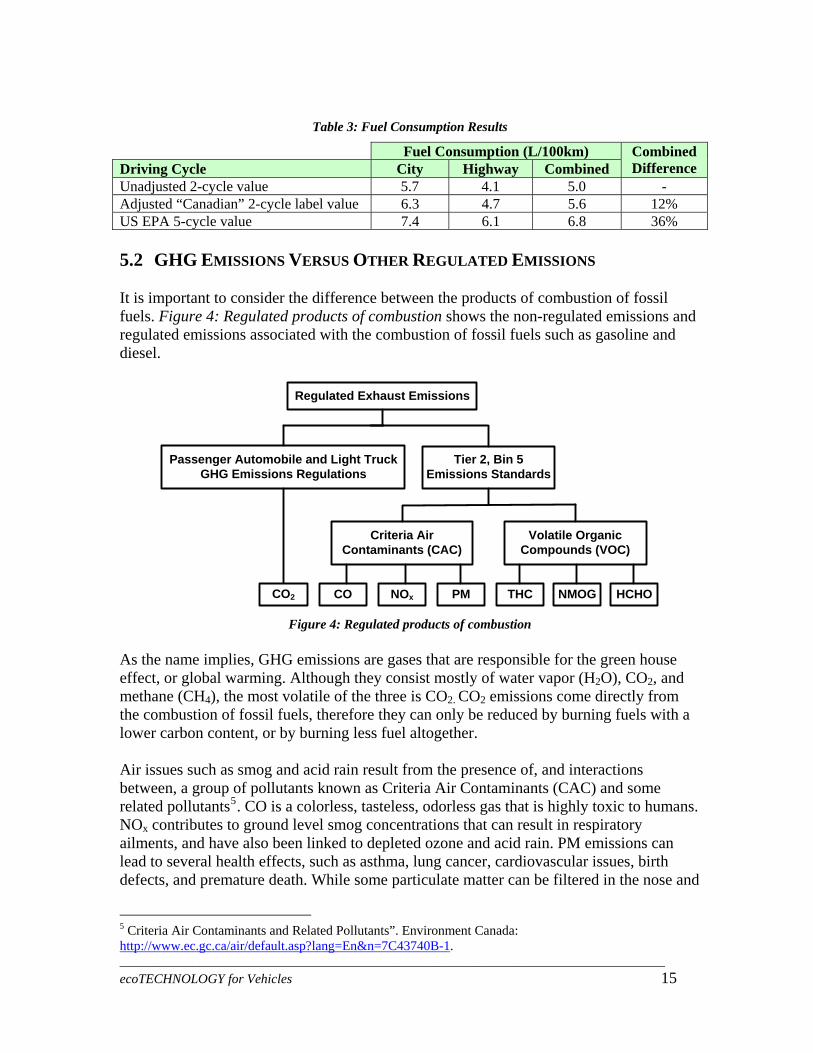
Table 3: Fuel Consumption Results
Fuel Consumption (L/100km) Combined Difference Driving Cycle City Highway Combined
Unadjusted 2-cycle value 5.7 4.1 5.0 - Adjusted “Canadian” 2-cycle label value 6.3 4.7 5.6 12% US EPA 5-cycle value 7.4 6.1 6.8 36% 5.2 GHG EMISSIONS VERSUS OTHER REGULATED EMISSIONS It is important to consider the difference between the products of combustion of fossil fuels. Figure 4: Regulated products of combustion shows the non-regulated emissions and regulated emissions associated with the combustion of fossil fuels such as gasoline and diesel.
Passenger Automobile and Light Truck GHG Emissions Regulations
Volatile Organic Compounds (VOC)
Tier 2, Bin 5Emissions Standards
Regulated Exhaust Emissions
Criteria Air Contaminants (CAC)
CO2 CO PMNOx THC HCHONMOG Figure 4: Regulated products of combustion
As the name implies, GHG emissions are gases that are responsible for the green house effect, or global warming. Although they consist mostly of water vapor (H2O), CO2, and methane (CH4), the most volatile of the three is CO2. CO2 emissions come directly from the combustion of fossil fuels, therefore they can only be reduced by burning fuels with a lower carbon content, or by burning less fuel altogether. Air issues such as smog and acid rain result from the presence of, and interactions between, a group of pollutants known as Criteria Air Contaminants (CAC) and some related pollutants5. CO is a colorless, tasteless, odorless gas that is highly toxic to humans. NOx contributes to ground level smog concentrations that can result in respiratory ailments, and have also been linked to depleted ozone and acid rain. PM emissions can lead to several health effects, such as asthma, lung cancer, cardiovascular issues, birth defects, and premature death. While some particulate matter can be filtered in the nose and
__________________________________________________________________________________ ecoTECHNOLOGY for Vehicles 15
5 Criteria Air Contaminants and Related Pollutants”. Environment Canada: http://www.ec.gc.ca/air/default.asp?lang=En&n=7C43740B-1.
__________________________________________________________________________________ ecoTECHNOLOGY for Vehicles 16
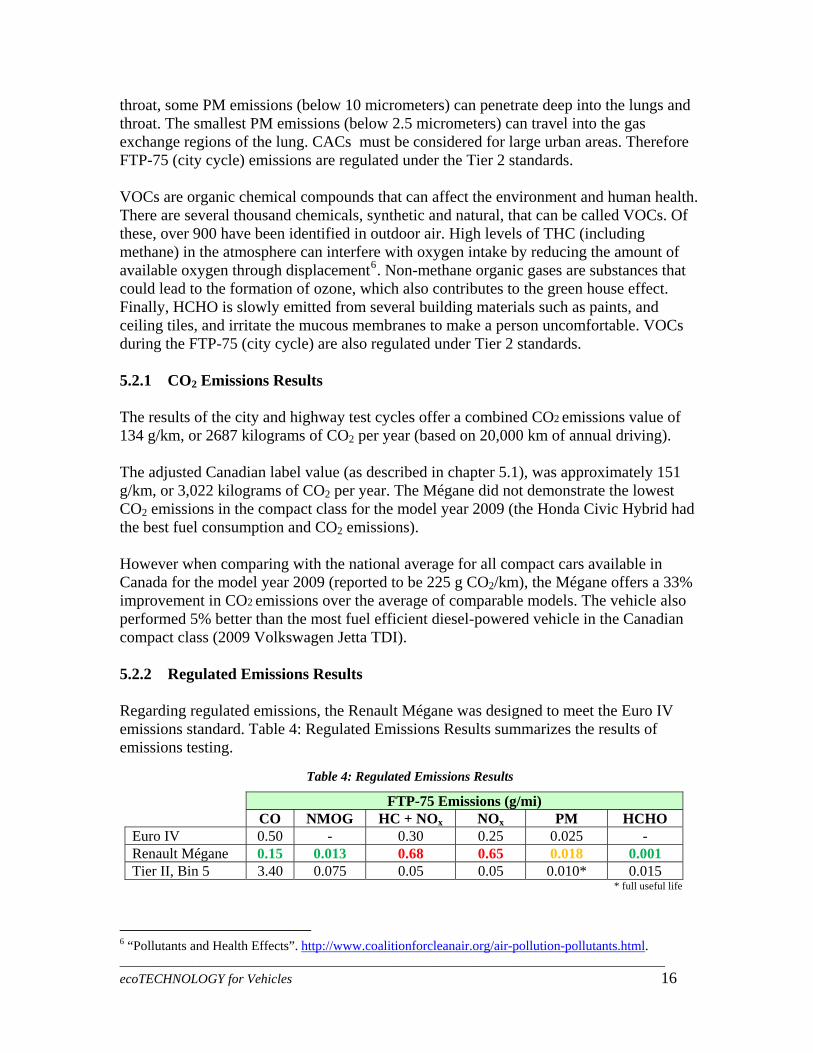
throat, some PM emissions (below 10 micrometers) can penetrate deep into the lungs and throat. The smallest PM emissions (below 2.5 micrometers) can travel into the gas exchange regions of the lung. CACs must be considered for large urban areas. Therefore FTP-75 (city cycle) emissions are regulated under the Tier 2 standards. VOCs are organic chemical compounds that can affect the environment and human health. There are several thousand chemicals, synthetic and natural, that can be called VOCs. Of these, over 900 have been identified in outdoor air. High levels of THC (including methane) in the atmosphere can interfere with oxygen intake by reducing the amount of available oxygen through displacement6. Non-methane organic gases are substances that could lead to the formation of ozone, which also contributes to the green house effect. Finally, HCHO is slowly emitted from several building materials such as paints, and ceiling tiles, and irritate the mucous membranes to make a person uncomfortable. VOCs during the FTP-75 (city cycle) are also regulated under Tier 2 standards. 5.2.1 CO2 Emissions Results The results of the city and highway test cycles offer a combined CO2 emissions value of 134 g/km, or 2687 kilograms of CO2 per year (based on 20,000 km of annual driving). The adjusted Canadian label value (as described in chapter 5.1), was approximately 151 g/km, or 3,022 kilograms of CO2 per year. The Mégane did not demonstrate the lowest CO2 emissions in the compact class for the model year 2009 (the Honda Civic Hybrid had the best fuel consumption and CO2 emissions). However when comparing with the national average for all compact cars available in Canada for the model year 2009 (reported to be 225 g CO2/km), the Mégane offers a 33% improvement in CO2 emissions over the average of comparable models. The vehicle also performed 5% better than the most fuel efficient diesel-powered vehicle in the Canadian compact class (2009 Volkswagen Jetta TDI). 5.2.2 Regulated Emissions Results Regarding regulated emissions, the Renault Mégane was designed to meet the Euro IV emissions standard. Table 4: Regulated Emissions Results summarizes the results of emissions testing.
Table 4: Regulated Emissions Results
FTP-75 Emissions (g/mi) CO NMOG HC + NOx NOx PM HCHO Euro IV 0.50 - 0.30 0.25 0.025 - Renault Mégane 0.15 0.013 0.68 0.65 0.018 0.001 Tier II, Bin 5 3.40 0.075 0.05 0.05 0.010* 0.015
* full useful life
6 “Pollutants and Health Effects”. http://www.coalitionforcleanair.org/air-pollution-pollutants.html.
__________________________________________________________________________________ ecoTECHNOLOGY for Vehicles 17
In order to meet both Euro V and the average North American emissions standards for a light-duty vehicle (Tier 2, Bin 5), the Mégane’s particulate matter and oxides of nitrogen emissions would need to be reduced. Oxides of nitrogen (NOx) are also a common bi-product of the diesel combustion process, due to higher combustion temperatures. The Mégane exceeds the Euro IV limit of 0.25 g/mi and also exceeds the Canadian standard of 0.05 g/mi by a significant margin. Anti-NOx technologies such as selective catalytic reduction (SCR) would likely need to be included in order to conform to both Euro IV and Canadian NOx emissions standards. PM emissions are a common byproduct of the diesel combustion process. Technologies such as diesel particulate filters are designed to limit the amount of particulates that pass through the exhaust stream and into the surrounding atmosphere. The Mégane was tested for PM on the FTP-75 test cycle. The average PM value was 0.018 g/mi. As such, the Mégane is below the Euro IV PM emissions standards of 0.025 g/mi, but exceeds the current Canadian limit of 0.010 g/mi. Levels of CO, formaldehyde (HCHO), or non-methane organic gases (NMOG) were in line with Tier 2, Bin 5 emissions standards. 5.3 CONSTANT SPEED TESTING The objective of this section was to test clean diesel systems during Canadian driving conditions, and assess how diesel emissions systems would operate, particularly at cold temperatures. The vehicle was subjected to a pre-defined set of loads, speeds and temperatures, and the emissions were measured over a 10-minute period of driving. The Mégane was tested on a dynamometer at the National Research Council’s Institute for Fuel Cell Innovation (NRC IFCI) environmental test chamber in Vancouver, British Columbia. A series of constant speed tests at 15°C, 0°C and -30°C were conducted and rates of CO2, CO, NOx and THC were measured using the Semtech DS portable emissions measurement system (PEMS). The testing over cold temperatures also evaluated how well the advanced glow plugs operate after a long cold soak at -30°C 5.3.1 CO2 Emissions Results The CO2 emissions of the Mégane were measured for each test condition. The results are illustrated in Figure 5: CO2 emissions for the Mégane during constant speed testing.
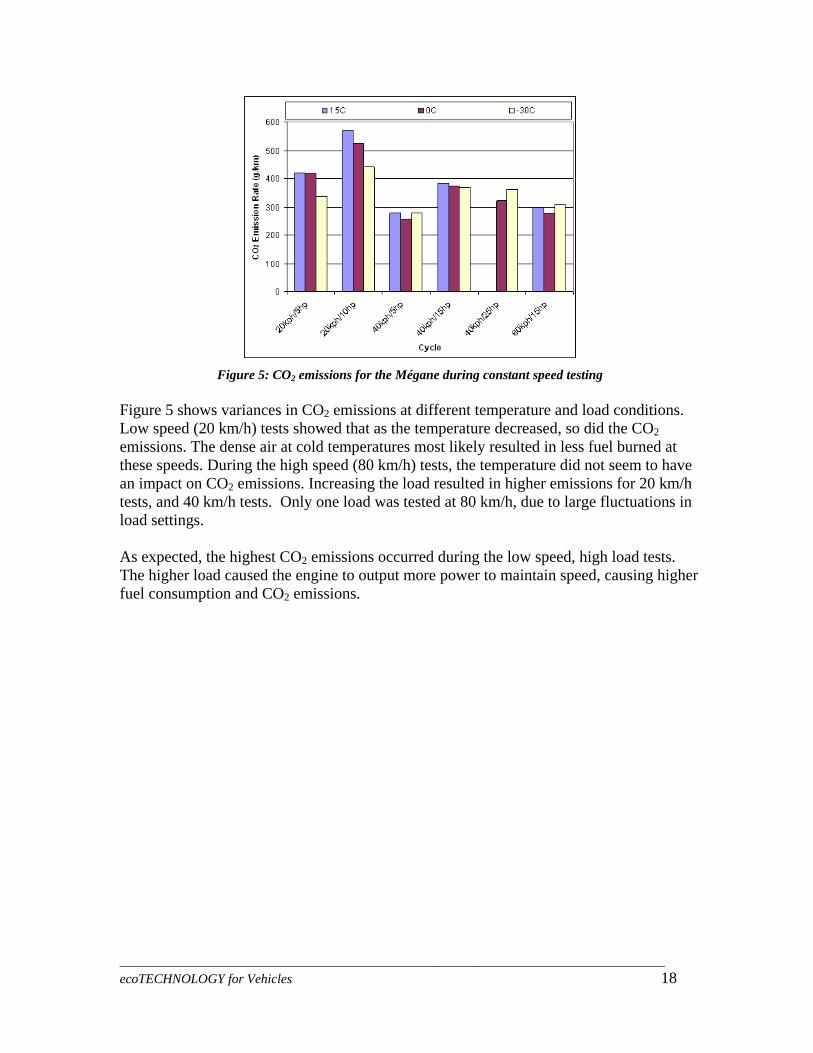
Figure 5: CO2 emissions for the Mégane during constant speed testing
Figure 5 shows variances in CO2 emissions at different temperature and load conditions. Low speed (20 km/h) tests showed that as the temperature decreased, so did the CO2 emissions. The dense air at cold temperatures most likely resulted in less fuel burned at these speeds. During the high speed (80 km/h) tests, the temperature did not seem to have an impact on CO2 emissions. Increasing the load resulted in higher emissions for 20 km/h tests, and 40 km/h tests. Only one load was tested at 80 km/h, due to large fluctuations in load settings. As expected, the highest CO2 emissions occurred during the low speed, high load tests. The higher load caused the engine to output more power to maintain speed, causing higher fuel consumption and CO2 emissions.
__________________________________________________________________________________ ecoTECHNOLOGY for Vehicles 18
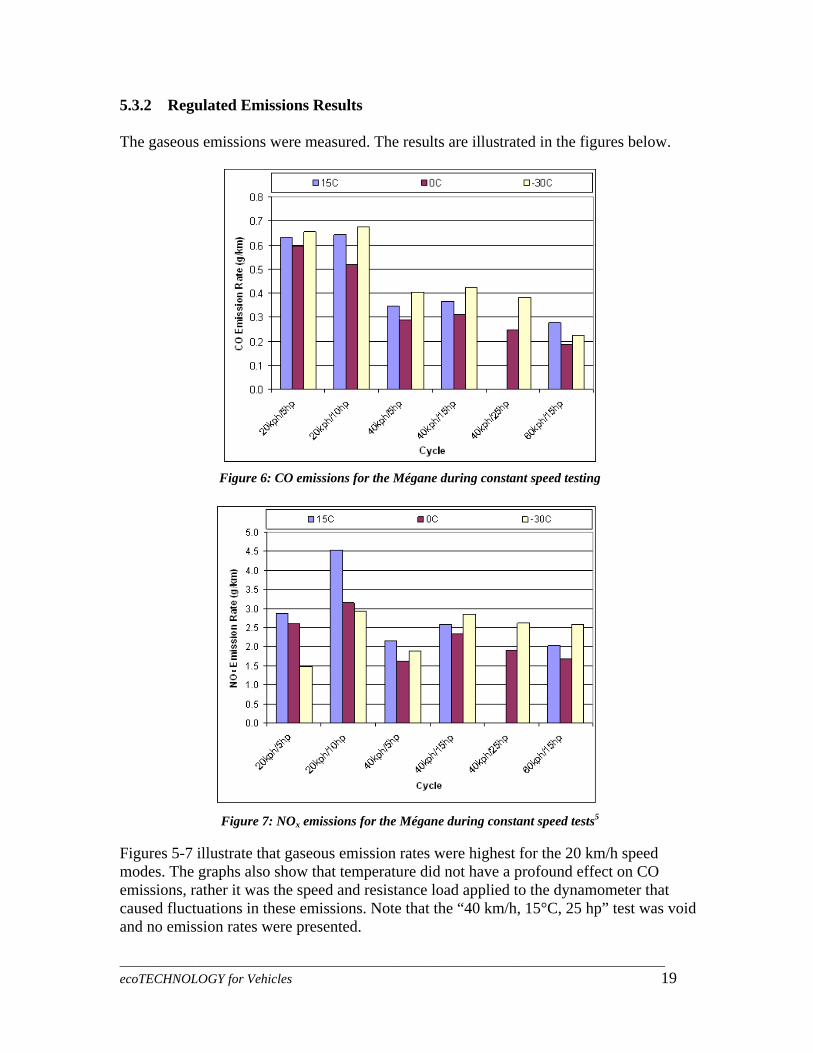
5.3.2 Regulated Emissions Results The gaseous emissions were measured. The results are illustrated in the figures below.
Figure 6: CO emissions for the Mégane during constant speed testing
Figure 7: NOx emissions for the Mégane during constant speed tests5 Figures 5-7 illustrate that gaseous emission rates were highest for the 20 km/h speed modes. The graphs also show that temperature did not have a profound effect on CO emissions, rather it was the speed and resistance load applied to the dynamometer that caused fluctuations in these emissions. Note that the “40 km/h, 15°C, 25 hp” test was void and no emission rates were presented.
__________________________________________________________________________________ ecoTECHNOLOGY for Vehicles 19
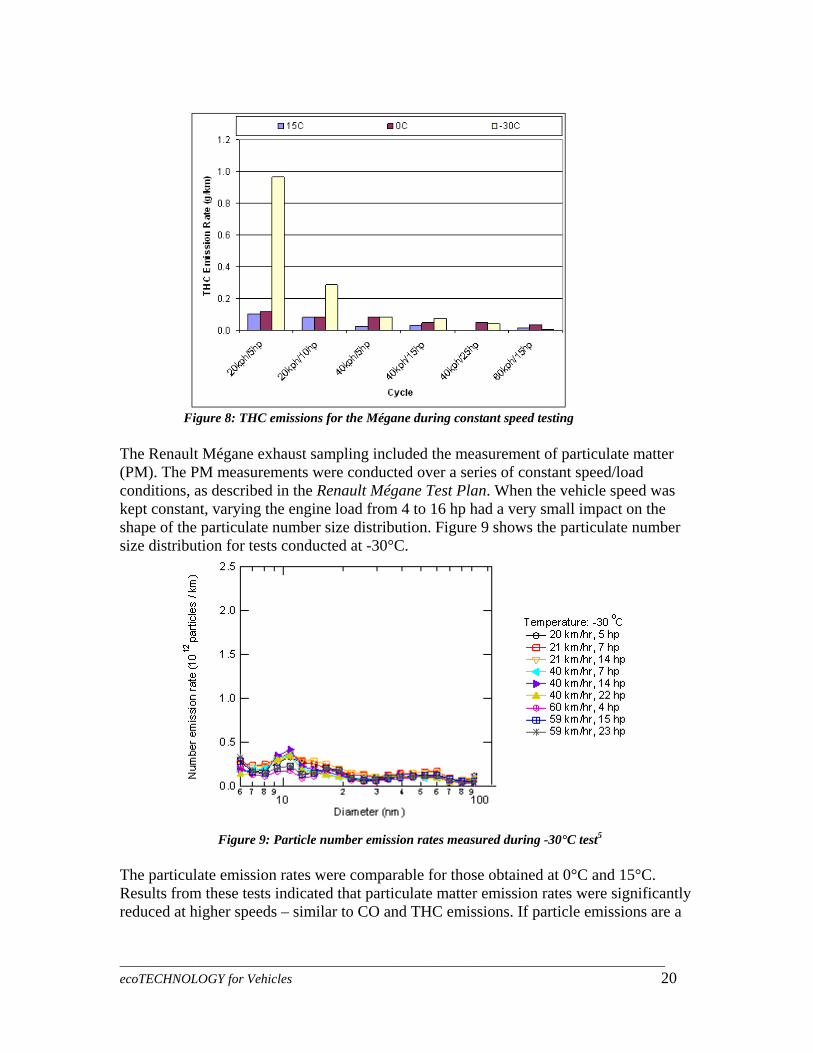
Figure 8: THC emissions for the Mégane during constant speed testing The Renault Mégane exhaust sampling included the measurement of particulate matter (PM). The PM measurements were conducted over a series of constant speed/load conditions, as described in the Renault Mégane Test Plan. When the vehicle speed was kept constant, varying the engine load from 4 to 16 hp had a very small impact on the shape of the particulate number size distribution. Figure 9 shows the particulate number size distribution for tests conducted at -30°C.
Figure 9: Particle number emission rates measured during -30°C test5
The particulate emission rates were comparable for those obtained at 0°C and 15°C. Results from these tests indicated that particulate matter emission rates were significantly reduced at higher speeds – similar to CO and THC emissions. If particle emissions are a
__________________________________________________________________________________ ecoTECHNOLOGY for Vehicles 20
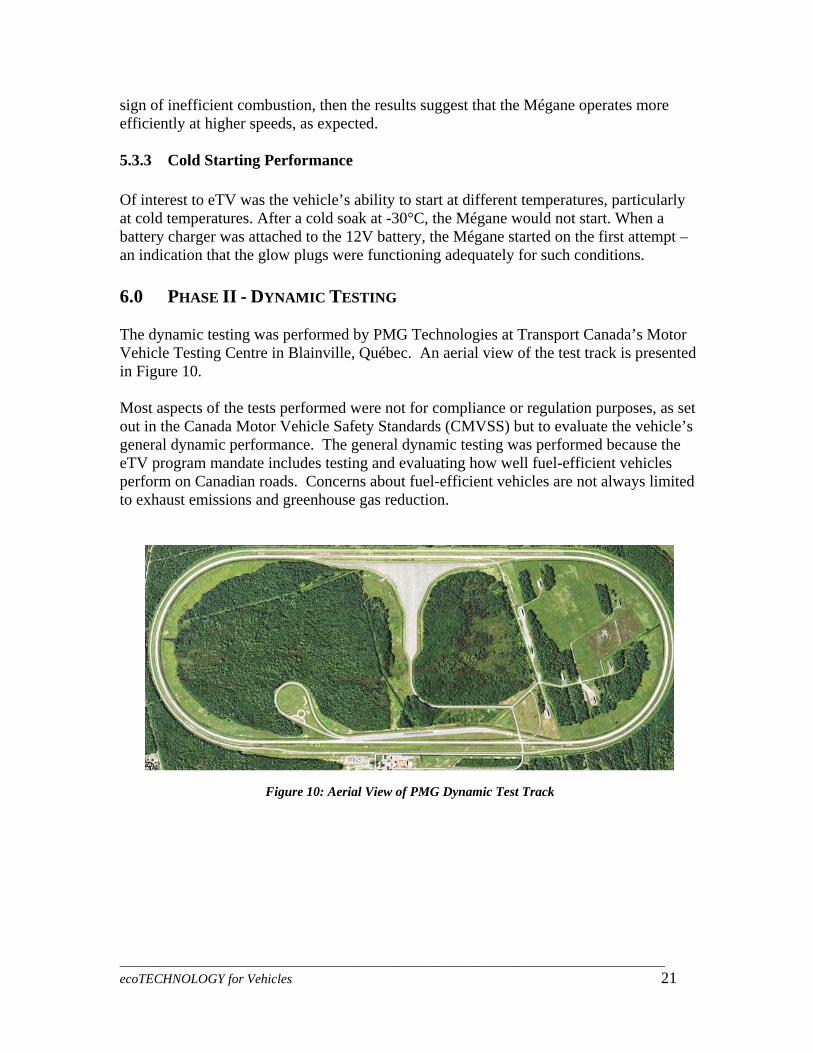
sign of inefficient combustion, then the results suggest that the Mégane operates more efficiently at higher speeds, as expected. 5.3.3 Cold Starting Performance Of interest to eTV was the vehicle’s ability to start at different temperatures, particularly at cold temperatures. After a cold soak at -30°C, the Mégane would not start. When a battery charger was attached to the 12V battery, the Mégane started on the first attempt – an indication that the glow plugs were functioning adequately for such conditions. 6.0 PHASE II - DYNAMIC TESTING The dynamic testing was performed by PMG Technologies at Transport Canada’s Motor Vehicle Testing Centre in Blainville, Québec. An aerial view of the test track is presented in Figure 10. Most aspects of the tests performed were not for compliance or regulation purposes, as set out in the Canada Motor Vehicle Safety Standards (CMVSS) but to evaluate the vehicle’s general dynamic performance. The general dynamic testing was performed because the eTV program mandate includes testing and evaluating how well fuel-efficient vehicles perform on Canadian roads. Concerns about fuel-efficient vehicles are not always limited to exhaust emissions and greenhouse gas reduction.
Figure 10: Aerial View of PMG Dynamic Test Track
__________________________________________________________________________________ ecoTECHNOLOGY for Vehicles 21
6.1 ACCELERATION EVALUATION Procedure The maximum acceleration was determined by starting the vehicle from a standing start and following the procedure set out below.
• The vehicle was evaluated by accelerating to the maximum attainable speed in a quarter mile (402.3 m).
• The vehicle was evaluated by accelerating to the maximum attainable speed in a kilometre (1,000 m).
Results & Analysis Shifting occurred at the optimum shift point, or when the shift indicator requested an upshift to the next gear. Testing was performed on July 20, 2010. The wind speed was 6 km/h from the south. To account for variation in wind, the vehicle was driven in both directions, with the results averaged. The results are illustrated in Table 5 .
Table 5: Acceleration Evaluation Results
Distance Speed ( km/h ) 1/4 mile (402.3 m) 115.3
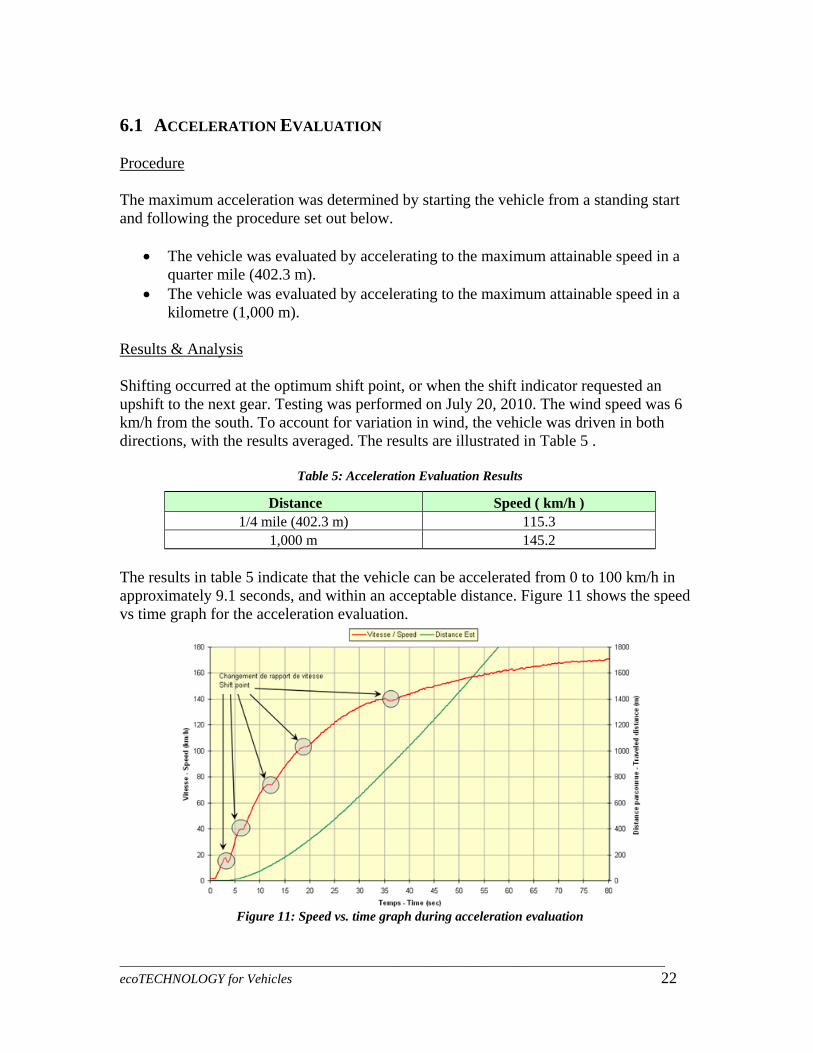
1,000 m 145.2 The results in table 5 indicate that the vehicle can be accelerated from 0 to 100 km/h in approximately 9.1 seconds, and within an acceptable distance. Figure 11 shows the speed vs time graph for the acceleration evaluation.
Figure 11: Speed vs. time graph during acceleration evaluation
__________________________________________________________________________________ ecoTECHNOLOGY for Vehicles 22
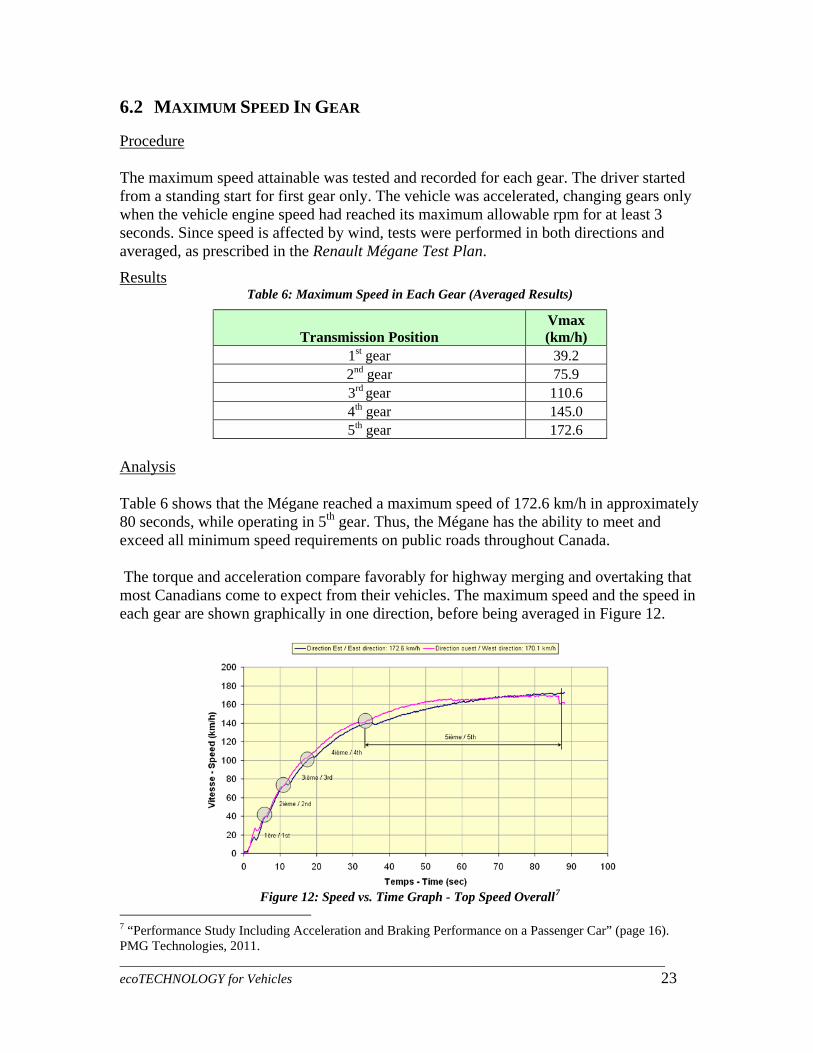
6.2 MAXIMUM SPEED IN GEAR Procedure The maximum speed attainable was tested and recorded for each gear. The driver started from a standing start for first gear only. The vehicle was accelerated, changing gears only when the vehicle engine speed had reached its maximum allowable rpm for at least 3 seconds. Since speed is affected by wind, tests were performed in both directions and averaged, as prescribed in the Renault Mégane Test Plan.
Results Table 6: Maximum Speed in Each Gear (Averaged Results)
Transmission Position Vmax (km/h)
1st gear 39.2 2nd gear 75.9 3rd gear 110.6 4th gear 145.0 5th gear 172.6
Analysis Table 6 shows that the Mégane reached a maximum speed of 172.6 km/h in approximately 80 seconds, while operating in 5th gear. Thus, the Mégane has the ability to meet and exceed all minimum speed requirements on public roads throughout Canada. The torque and acceleration compare favorably for highway merging and overtaking that most Canadians come to expect from their vehicles. The maximum speed and the speed in each gear are shown graphically in one direction, before being averaged in Figure 12.
7Figure 12: Speed vs. Time Graph - Top Speed Overall
__________________________________________________________________________________ ecoTECHNOLOGY for Vehicles 23
7 “Performance Study Including Acceleration and Braking Performance on a Passenger Car” (page 16). PMG Technologies, 2011.
__________________________________________________________________________________ ecoTECHNOLOGY for Vehicles 24
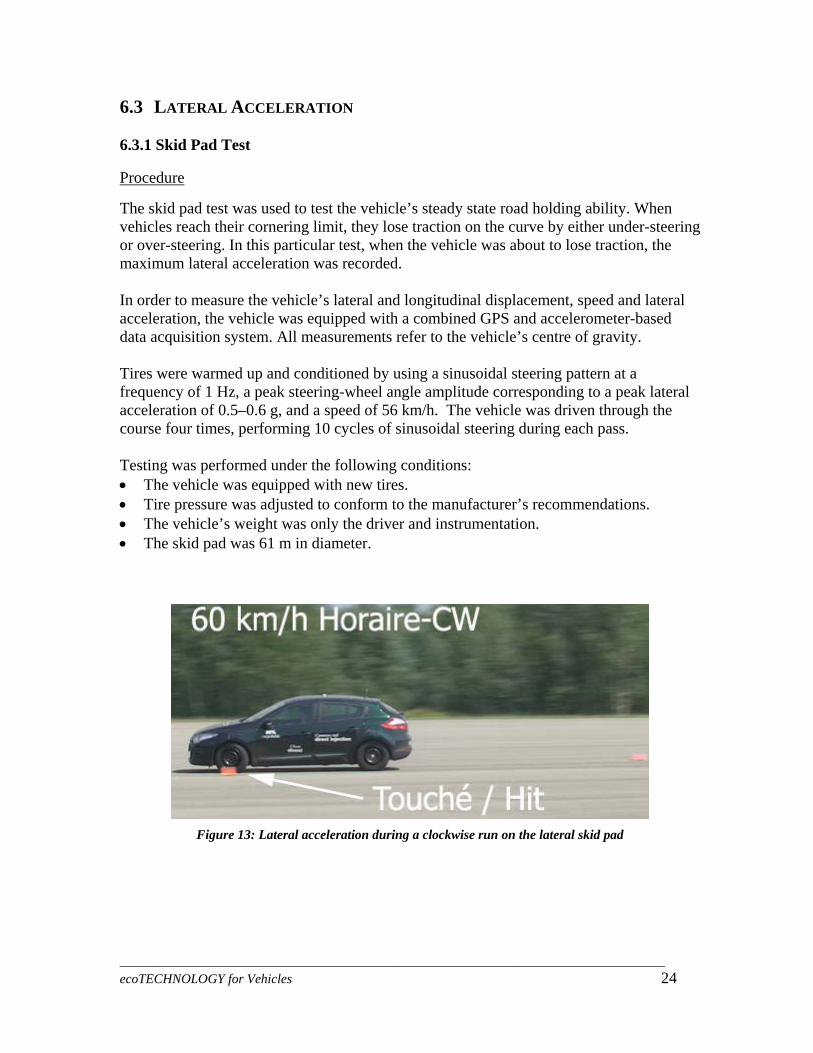
6.3 LATERAL ACCELERATION 6.3.1 Skid Pad Test Procedure The skid pad test was used to test the vehicle’s steady state road holding ability. When vehicles reach their cornering limit, they lose traction on the curve by either under-steering or over-steering. In this particular test, when the vehicle was about to lose traction, the maximum lateral acceleration was recorded. In order to measure the vehicle’s lateral and longitudinal displacement, speed and lateral acceleration, the vehicle was equipped with a combined GPS and accelerometer-based data acquisition system. All measurements refer to the vehicle’s centre of gravity.
d by using a sinusoidal steering pattern at a equency of 1 Hz, a peak steering-wheel angle amplitude corresponding to a peak lateral
6 g, and a speed of 56 km/h. The vehicle was driven through the ourse four times, performing 10 cycles of sinusoidal steering during each pass.
Tires were warmed up and conditionefracceleration of 0.5–0.c Testing was performed under the following conditions: • The vehicle was equipped with new tires. • Tire pressure was adjusted to conform to the manufacturer’s recommendations. • The vehicle’s weight was only the driver and instrumentation. The skid pad was 61 m in diameter. •
Figure 13: Lateral acceleration during a clockwise run on the lateral skid pad
__________________________________________________________________________________ ecoTECHNOLOGY for Vehicles 25
Results The results of the lateral skid pad are summarized in Table 7.
Table 7: Maximum lateral acceleration (skid pad) Clockwise Counter Clockwise
Speed (km/h) Stay inside? Speed (km/h) Stay inside? 40 Yes 46 Yes 50 Yes 50 Yes 55 Yes 55 Yes 55 Yes 55 Yes 60 No 60 No
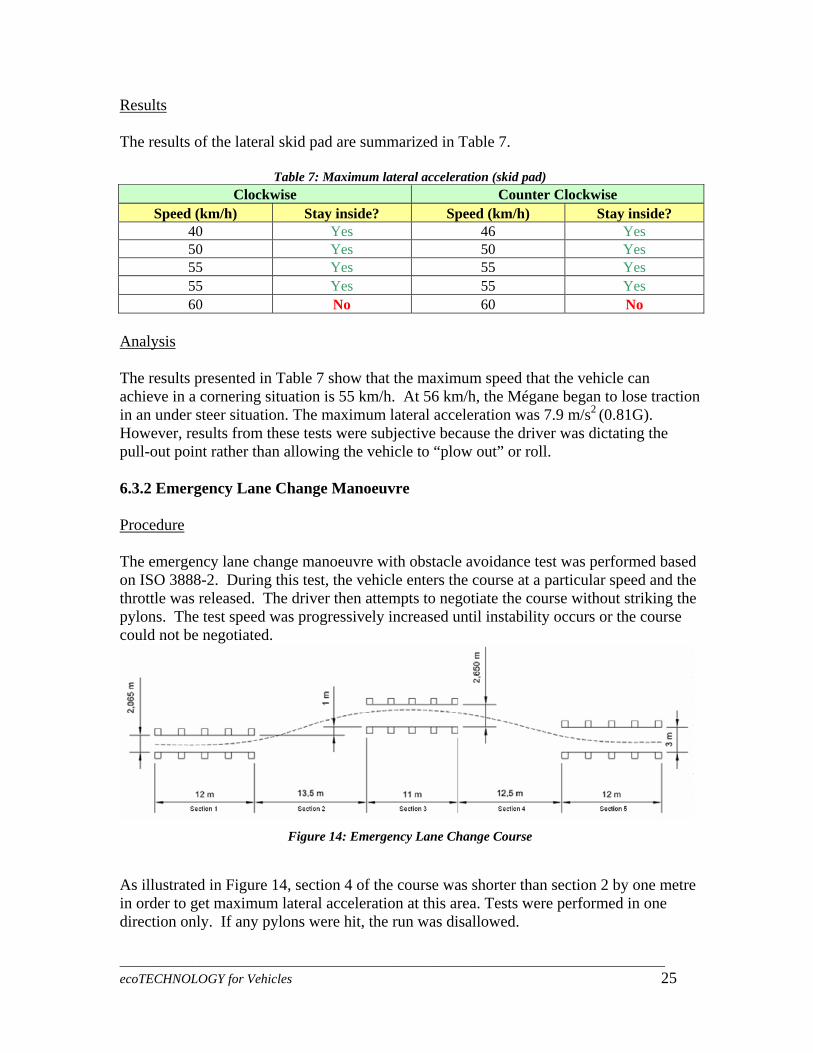
Analysis The results presented in Table 7 show that the maximum speed that the vehicle can achieve in a cornering situation is 55 km/h. At 56 km/h, the Mégane began to lose traction in an under steer situation. The maximum lateral acceleration was 7.9 m/s2 (0.81G). However, results from these tests were subjective because the driver was dictating the pull-out point rather than allowing the vehicle to “plow out” or roll. 6.3.2 Emergency Lane Change Manoeuvre Procedure The emergency lane change manoeuvre with obstacle avoidance test was performed based on ISO 3888-2. During this test, the vehicle enters the course at a particular speed and the throttle was released. The driver then attempts to negotiate the course without striking the pylons. The test speed was progressively increased until instability occurs or the course could not be negotiated.
Figure 14: Emergency Lane Change Course
As illustrated in Figure 14, section 4 of the course was shorter than section 2 by one metre in order to get maximum lateral acceleration at this area. Tests were performed in one direction only. If any pylons were hit, the run was disallowed.
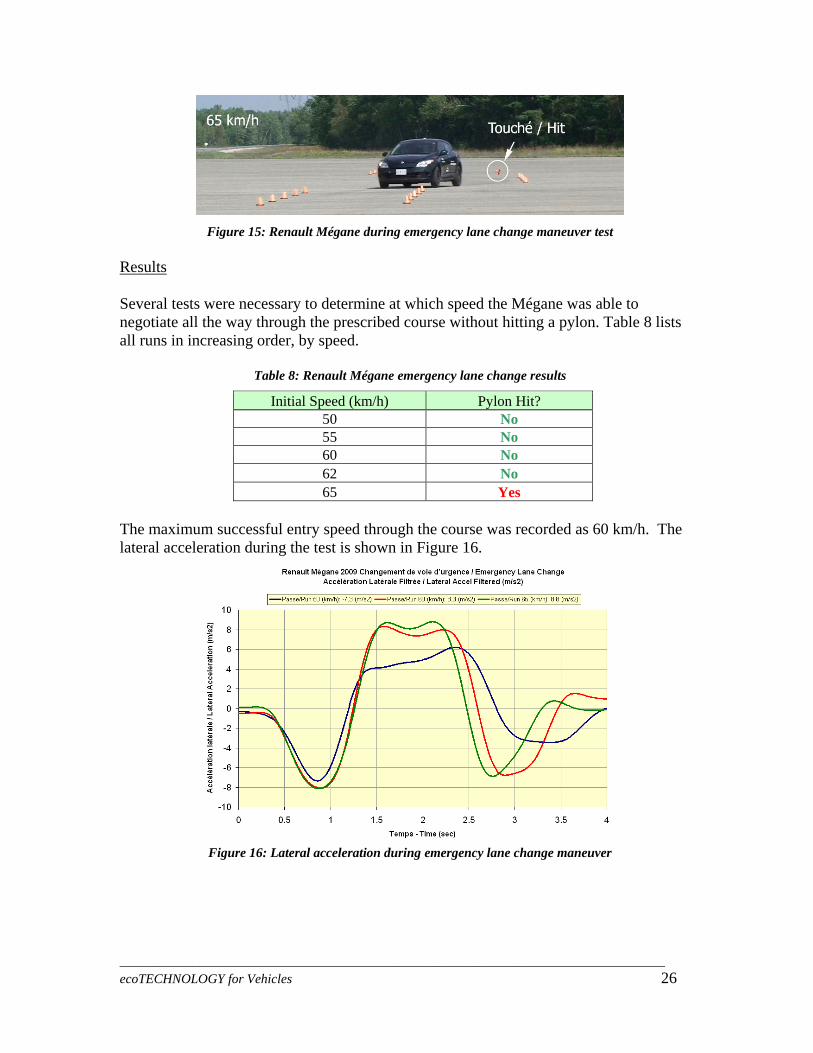
Figure 15: Renault M during emergency la ange maneuver test
Results
égane ne ch
Several tes ere necessary to determine at which speed Mégane was ableegotiate all the way through the prescribed course without hitting a pylon. Table 8 lists
increasing order, by speed.
ts w the to nall runs in
Table 8: Renault Mégane emergency lane change results
Initial Speed (km/h) Pylon Hit? 50 No 55 No 60 No 62 No 65 Yes
The maximum successful entry speed through the course was recorded as 60 km/h. The
teral acceleration during the test is shown in Figure 16. la
Figure 16: Lateral acceleration during emergency lane change maneuver
__________________________________________________________________________________ ecoTECHNOLOGY for Vehicles 26
__________________________________________________________________________________ ecoTECHNOLOGY for Vehicles 27
Analysis The graph above illustrates a couple of key points. The blue data series shows that the driver can negotiate the course several ways at low speeds. From Figure 16, the lateral acceleration in the emergency lane change manoeuvre was 8.3 m/s2 (0.85G). However, results from these tests were subjective because the driver was dictating the pull-out point rather than allowing the vehicle to “plow out” or roll. .3.3 Slalom
rocedure
6 P
ing situation and prepare for the next cornering
tuation. Please see the Renault Megane Test plan for the test procedure. Several factors affect th t response, such as the location of the center of gravity, mass distribution, and s ension travel and firmne
The slalom course was a test to determine the vehicle’s “transient response”, or the abilityof the vehicle to recover from a cornersi
e vehicle’s transienusp ss.
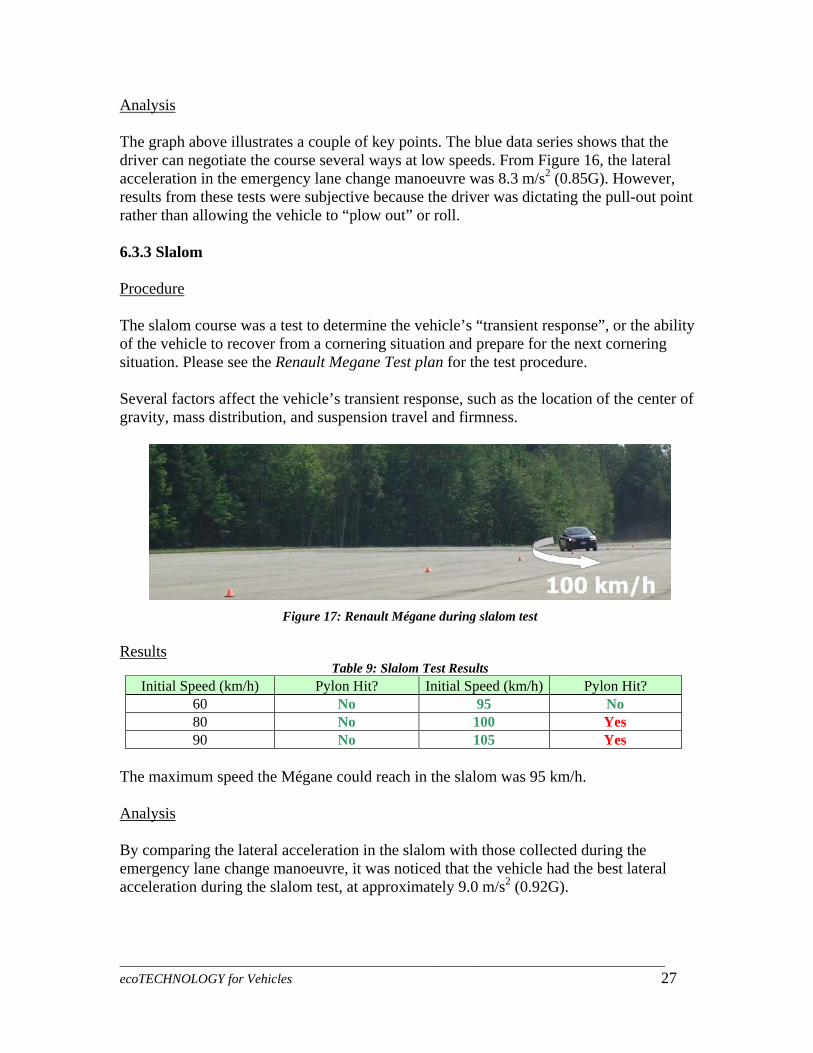
Figure 17: Renault Mégane during slalom test
Results
Table 9: Slalom Test Results Initial Speed (km/h) Pylon Hit? Initial Speed (km/h) Pylon Hit?
60 No 95 No 80 No 100 Yes 90 No 105 Yes
The maximum speed the Mégane could reach in the slalom was 95 km/h. Analysis By comparing the
ergency lane change manoeuvre, it was noticed that the vehicle had the best lateral cceleration during the slalom test, at approximately 9.0 m/s2 (0.92G).
the lateral acceleration in the slalom with those collected during ema
__________________________________________________________________________________ ecoTECHNOLOGY for Vehicles 28
SE EMISSIONS TESTS
6.4 NOI
6.4.1 Exterior Noise (CMVSS 1106) Procedure Noise pollution is of concern with diesel vehicles. A common misconception is that iesels are always significantly louder than gasoline powered vehicles. The Mégane was
dance with the CMVSS 1106 Noise Emissions Test, SAE Recommended ractice J986, Sound Level for Passenger Cars and Light Trucks, and SAE Standard
surement of Noise Emitted by Accelerating Highway Vehicles.
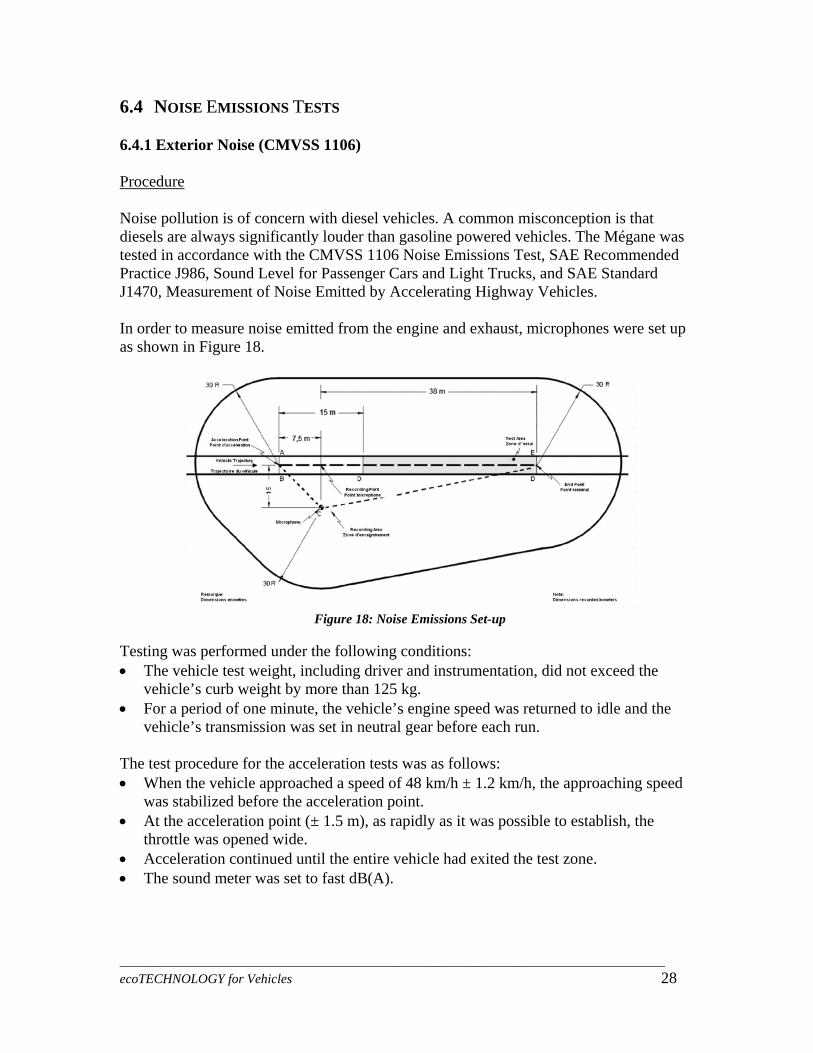
dtested in accorPJ1470, Mea In order to measure noise emitted from the engine and exhaust, microphones were set up as shown in Figure 18.
Figure 18: Noise Emissions Set-up
as performed under the following conditions:
• The vehicle test weight, inclu tation, did not exceed the ht by m 5 kg.
• For a period of one minute, the vehicle’s engine speed was returned to idle and the vehicle’s transmission was set eutral gear before each run.
aching speed e acceleration point.
acceleration point (± 1.5 m), as rapidly as it was possible to establish, the
Testing wding driver and instrumen
vehicle’s curb weig ore than 12
in n The test procedure for the acceleration tests was as follows: • When the vehicle approached a speed of 48 km/h ± 1.2 km/h, the appro
was stabilized before th At the•
throttle was opened wide. • Acceleration continued until the entire vehicle had exited the test zone. • The sound meter was set to fast dB(A).
__________________________________________________________________________________ ecoTECHNOLOGY for Vehicles 29
same procedure as above, with one modification—at the deceleration point, the vehicle was returned to its idle position until it was equal to one
he entire vehicle had exited the test zone.
The deceleration tests followed the
half of the approaching speed or until t Results Results from all tests show that the ambient noise levels are within the limits of the CMVSS 1106 standards. Due to the logarithmic nature of the decibel scale, a level of 61-63 dB is significantly lower than the 93.8 decibel limit. Generally 60 dB is considered tobe the level of normal human conversation while 90 dB would be the sound generateda typical lawn mower.
by
d design improvements and years of refining vehicle design. Most
f the noise being generated from the vehicle at these speeds was due to tire and wind resistance, which is acceptable and similar across any vehicle platform. The results from the noise emissions tests are summarized in Table 10 and Table 11: Full deceleration external noise test results.
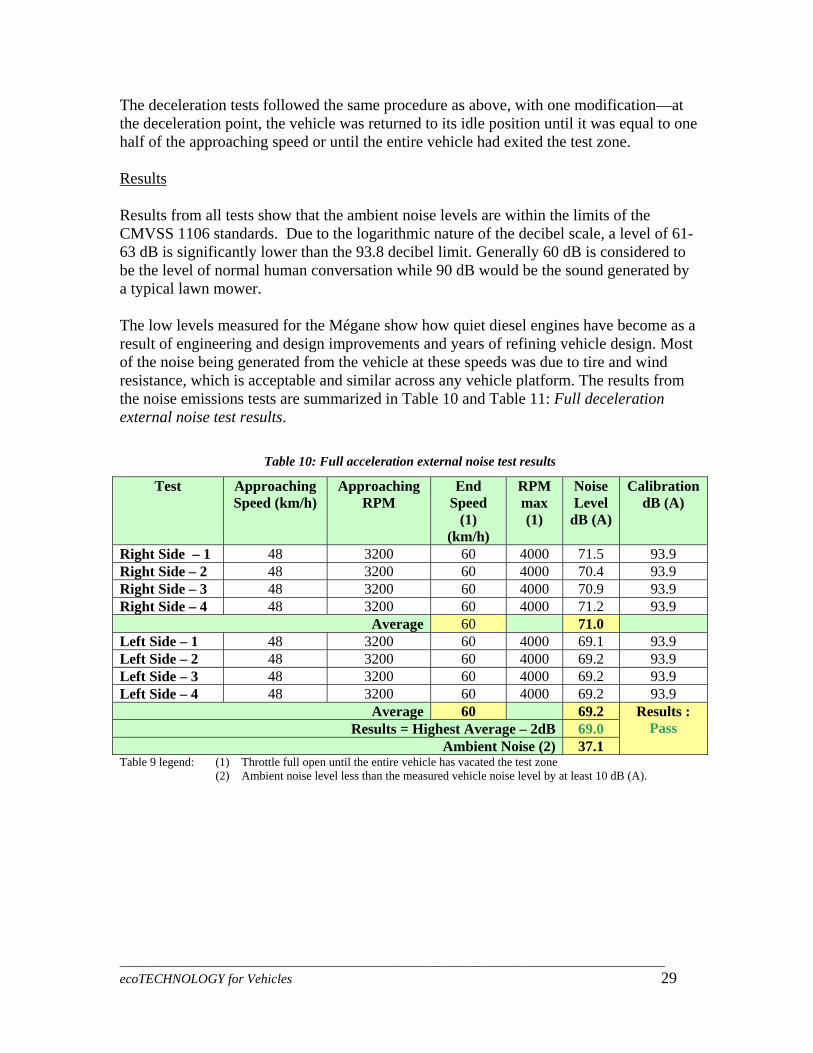
Table 10: Full acceleration external noise test results
The low levels measured for the Mégane show how quiet diesel engines have become as aresult of engineering ano
Test Approaching Speed (km/h)
Approaching RPM
End Speed
(1) (km/h)
RPM max (1)
Noise Level
dB (A)
CalibrationdB (A)
Right Side – 1 48 3200 60 4000 71.5 93.9 Right Side – 2 48 3200 60 4000 70.4 93.9 Right Side – 3 48 3200 60 4000 70.9 93.9 Right Side – 4 48 3200 60 4000 71.2 93.9
Average 60 71.0 Left Side – 1 48 3200 60 4000 69.1 93.9 Left Side – 2 48 3200 60 4000 69.2 93.9 Left Side – 3 48 3200 60 4000 69.2 93.9 Left Side – 4 48 3200 60 4000 69.2 93.9
Average 60 69.2 Results : Pass Results = Highest Average – 2dB 69.0
Ambient Noise (2) 37.1 Table 9 legend: (1) Throttle full open until the entire vehicle has vacated the test zone (2) Ambient noise level less than the measured vehicle noise level by at least 10 dB (A).
__________________________________________________________________________________ ecoTECHNOLOGY for Vehicles 30
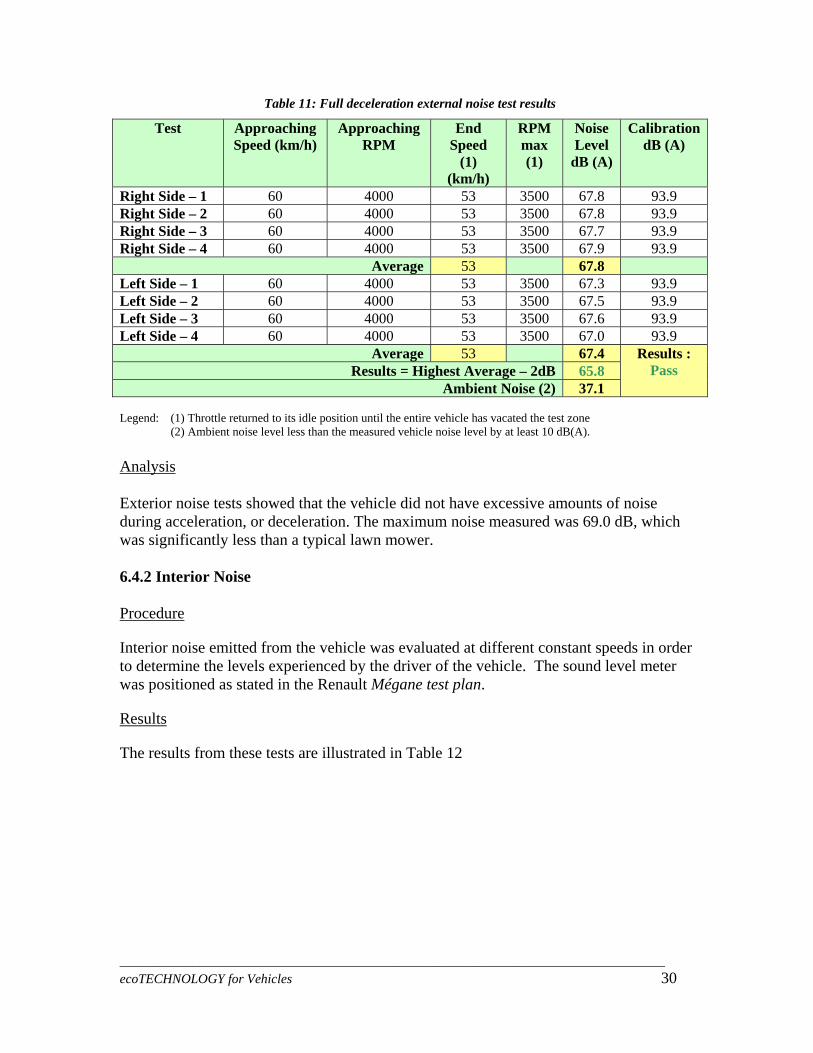
Table 11: Full deceleration external noise test results
Test
Approaching Speed (km/h)
Approaching RPM
End Speed
(1) (km/h)
RPM max (1)
Noise Level
dB (A)
CalibrationdB (A)
Right Side – 1 60 4000 53 3500 67.8 93.9 Right Side – 2 60 4000 53 3500 67.8 93.9 Right Side – 3 60 4000 53 3500 67.7 93.9 Right Side – 4 60 4000 53 3500 67.9 93.9
Average 53 67.8 Left Side – 1 60 4000 53 3500 67.3 93.9 Left Side – 2 60 4000 53 3500 67.5 93.9 Left Side – 3 60 4000 53 3500 67.6 93.9 Left Side – 4 60 4000 53 3500 67.0 93.9
Average 53 67.4 Results : Pass Results = Highest Average – 2dB 65.8
Ambient Noise (2) 37.1 Legend: (1) Throttle returned to its idle position until the entire vehicle has vacated the test zone
(2) Ambient noise level less than the measured vehicle noise level by at least 10 dB(A).
Analysis
Exterior noise tes the v id not ces mo f noduring acceleration, or deceleration. The maximum noise meas w B, which was significantly less than a typical lawn mower.
Noise
ts showed that ehicle d have ex sive aured
unts oas 69.0 d
ise
6.4.2 Interior Procedure
Interior noise emitted f the vehicle valuated at differe sta eeds i r the levels erienced by the driver of the vehicle. The sound level md as stated in the Renaul ne test p
Results
rom was e nt con nt sp n ordeto determine exp eter was positione t Méga lan.
The results from these tests are illustrated in Table 12
__________________________________________________________________________________ ecoTECHNOLOGY for Vehicles 31
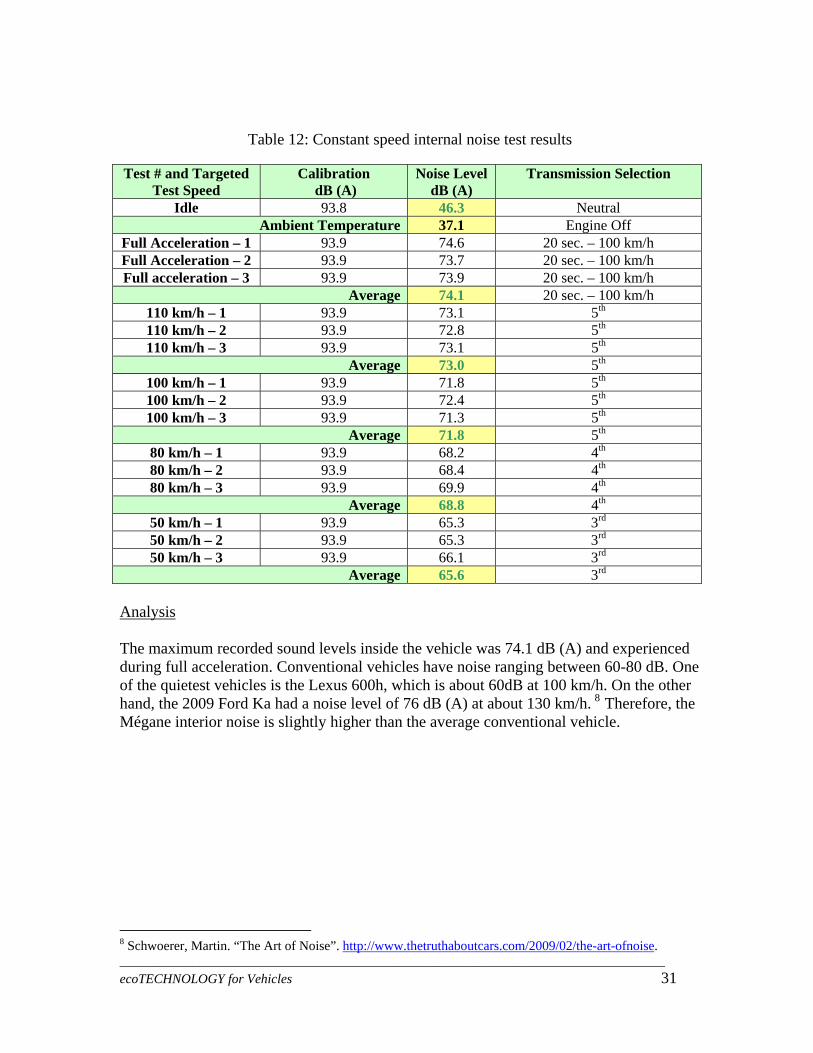
onstant speed intern tes ltsTable 12: C al noise t resu
Test # and Targeted Test Speed
Calibration dB (A)
Noise Level dB (A)
Transmission Selection
Idle 93.8 46. l 3 NeutraAmbient Temperature 37. Engine Off 1
Full Acceleration – 1 93.9 74. sec 0 km/6 20 . – 10 h Full Acceleration – 2 93.9 73. /h7 20 sec. – 100 km Full acceleration – 3 93.9 73. sec 0 km/9 20 . – 10 h
Average 74. sec 0 km/1 20 . – 10 h 110 km/h – 1 93.9 73.1 5 th
110 km/h – 2 93.9 72.8 5 th
110 km/h – 3 93.9 73.1 5 th
Average 73.0 5 th
100 km/h – 1 93.9 71.8 5th 100 km/h – 2 93.9 72.4 5th 100 km/h – 3 93.9 71.3 5th
Average 71.8 5th 80 km/h – 1 93.9 68.2 4th 80 km/h – 2 93.9 68.4 4th 80 km/h – 3 93.9 69.9 4th
Average 68.8 4th 50 km/h – 1 93.9 65.3 3rd 50 km/h – 2 93.9 65.3 3rd 50 km/h – 3 93.9 66.1 3rd
Average 65.6 3rd Analysis
ne 0dB at 100 km/h. On the other
hand, the 2009 Ford Ka had a noise level of 76 dB (A) at about 130 km/h. 8 Therefore, the interior noise is slightly higher than the average conventional vehicle.
The maximum recorded sound levels inside the vehicle was 74.1 dB (A) and experienced during full acceleration. Conventional vehicles have noise ranging between 60-80 dB. Oof the quietest vehicles is the Lexus 600h, which is about 6
Mégane
8 Schwoerer, Martin. “The Art of Noise”. http://www.thetruthaboutcars.com/2009/02/the-art-ofnoise.
__________________________________________________________________________________ ecoTECHNOLOGY for Vehicles 32
6.5 BRAKING
rakin CMV Procedu
6.5.1 Light Vehicle B g s (System SS 135)
re Brake testing was performed in accordance with the procedures in CMVSS 135 - Light
s, as described in the Renau gane test p Res
Vehicle Brake System lt Mé lan.
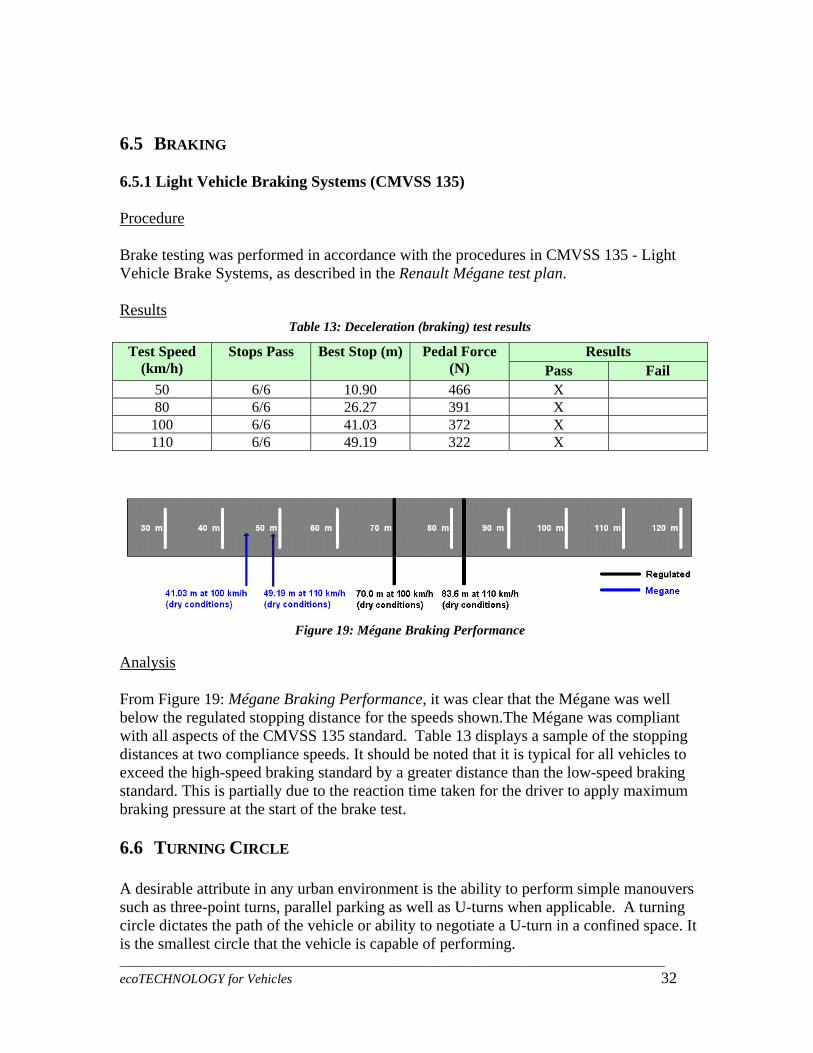
ults Table eceleration (br test results 13: D aking)
Test Speed (km/h)
Stops Pass Best Stop (m) Pedal Force Results (N) Pass Fail
50 6/6 .90 X 10 46680 6/6 .27 X 26 391100 6/6 X 41.03 372110 6/6 X 49.19 322
Figure 19: Mégane Braking Performance
Analysis From Figure 19: Mégane Braking Performance, it was clear that the Mégane was well below the regulated stopping distance for the speeds shown.The Mégane was compliant with all aspects of the CMVSS 135 standard. Table 13 displays a sample of the stopping distances at two compliance speeds. It should be noted that it is typical for all vehicles to exceed the high-speed braking standard by a greater distance than the low-speed braking standard. This is partially due to the reaction time taken for the driver to apply maximum braking pressure at the start of the brake test. 6.6 TURNING CIRCLE A desirable attribute in any urban environment is the ability to perform simple manouvers such as three-point turns, parallel parking as well as U-turns when applicable. A turning circle dictates the path of the vehicle or ability to negotiate a U-turn in a confined space. It is the smallest circle that the vehicle is capable of performing.
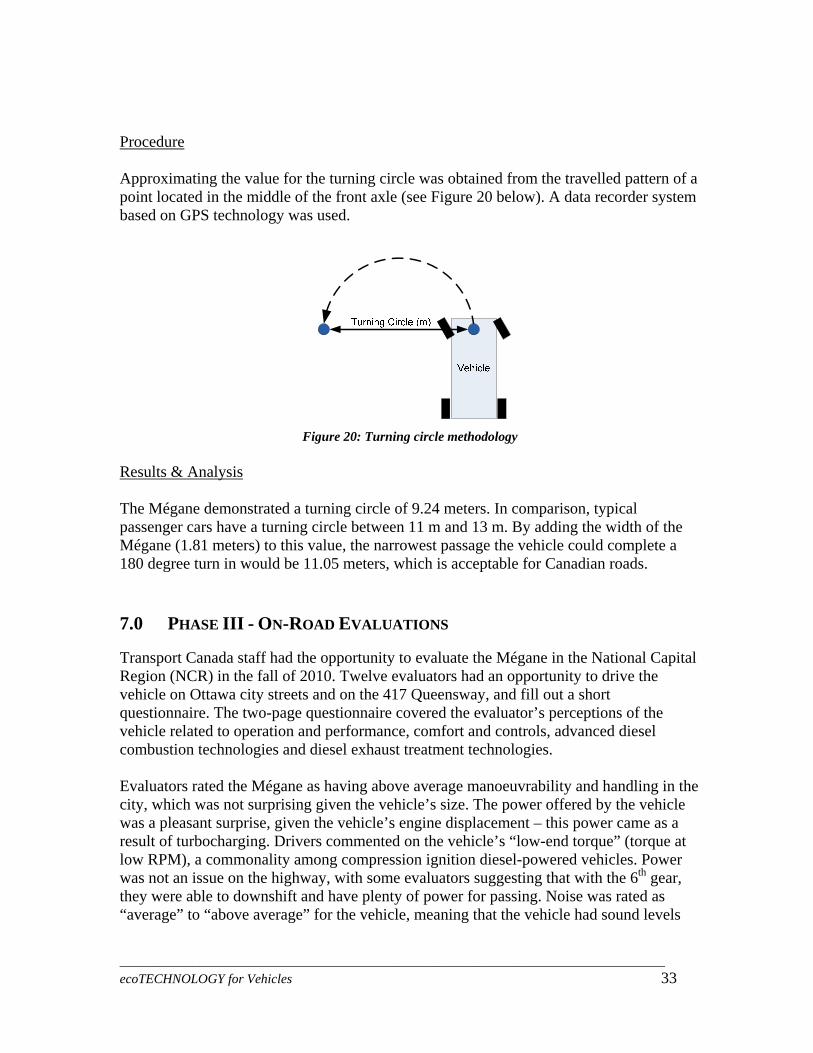
Procedure Approximating the value for the turning circle was obtained from the travelled pattern of a
oint located in the middle of the front axle (see Figure 20 below). A data recorder system PS technology was used.
pbased on G
Figure ng circle ology
esults & Analysis
20: Turni method R
The Mégane demonstrated a turning circle of 9.24 meters. In comparison, typical passenger cars have a turning circle between 11 m and 13 m. By adding the width of the Mégane (1.81 meters) to this value, the narrowest passage the vehicle could complete a 180 degree turn in would be 11.05 meters, which is acceptable for Canadian roads. 7.0 PHASE III - ON-R
Canada staff had the opportunity to evaluate the Mégane in the National Capital egion (NCR) in the fall of 2010. Twelve evaluators had an opportunity to drive the
gine displacement – this power came as a vers commented on the vehicle’s “low-end torque” (torque at mong compression ignition diesel-powered vehicles. Power
th
OAD EVALUATIONS Transport Rvehicle on Ottawa city streets and on the 417 Queensway, and fill out a short questionnaire. The two-page questionnaire covered the evaluator’s perceptions of the vehicle related to operation and performance, comfort and controls, advanced diesel combustion technologies and diesel exhaust treatment technologies. Evaluators rated the Mégane as having above average manoeuvrability and handling in thecity, which was not surprising given the vehicle’s size. The power offered by the vehicle
as a pleasant surprise, given the vehicle’s enwresult of turbocharging. Driow RPM), a commonality al
was not an issue on the highway, with some evaluators suggesting that with the 6 gear, they were able to downshift and have plenty of power for passing. Noise was rated as “average” to “above average” for the vehicle, meaning that the vehicle had sound levels
__________________________________________________________________________________ ecoTECHNOLOGY for Vehicles 33
__________________________________________________________________________________ ecoTECHNOLOGY for Vehicles 34
milar, if not quieter than conventional internal combustion engine vehicles – a stark ontrast to misperceptions of diesel-powered vehicles.
he vehicle’s comfort and controls were rated as average to above average. One small
erage for the vehicle. Occupant space, including eadroom and legroom, were not an issue.
Overall, evaluators rated the Mégane as average to above average, with some evaluators suggesting that the vehicle was “a pleasure” to drive, and that they would consider purchasing one if it were available in Canada. 8.0 CONCLUSIONS The Renault Mégane was tested by the eTV program to study the environmental performance of a diesel-powered light duty vehicle, evaluate the vehicle’s dynamic performance, and thus be more informed on how this technology performs in Canada.
sting, the vehicle demonstrated uncorrected test results of 6.3 L/100 /100 km on the highway, and 5.6 L/100 km combined. The
, t
ombined city and highway driving tests, the Mégane demonstrated 151 g/km. Although it id not have the lowest CO emissions in its class for the model year 2009, the Mégane
esel-powered vehicle in the compact lass. Based on 20,000 kilometres of annual driving, the Mégane would emit 3,022 kg of
an the 2-
consumption.
the vehicle in order to conform to Canadian regulations.
sic Tconcern was a location of the radio control stalk, which was located behind the steering wheel, and difficult to use. Evaluators were not fond of the vehicle’s convex door mirrors – but blind spots were regarded as avh
During laboratory tekm in the city, 4.7 Lsupplemental cold city, aggressive driving and electrical load driving cycles resulted in 7.4 L/100 km in the city, 6.1 L/100 km on the highway, and 6.8 L/100 km combined. Assuming annual mileage of 20,000 kilometres per year, and $1.30 per liter of diesel fuelthe annual fuel costs for the Mégane (based on combined 2-cycle testing) would be abou$1,456 per year (based on combined fuel consumption. On corrected “Canadian” cd 2performed 5.1% better than the most fuel efficient dicCO2 per year. Although the 5-cycle fuel consumption ratings are normally 10-20% higher thcycle ratings, the Mégane averaged about 36% higher fuel consumption on the 5-cycletesting than the uncorrected 2-cycle test. This shows how cold climates, aggressive driving, and electrical loads (such as air conditioning) can affect fuel During steady state testing, the Mégane demonstrated the highest CO2 emissions during the low speed, high load tests. This was expected because higher loads caused the engine to output more power to maintain speed, causing higher fuel consumption and CO2 emissions. Carbon monoxide, and total hydrocarbon emissions were higher during these tests. Particulate matter emissions did not meet North American Tier 2, Bin 5 standards. NOx emissions for the Mégane exceeded the Tier 2, Bin 5 standard of 0.05 g/mi by a significant margin. A more powerful diesel particulate filter and better anti-NOx technologies such as selective catalytic reduction (SCR) would likely need to be added to
__________________________________________________________________________________ ecoTECHNOLOGY for Vehicles 35
When a battery charger was ttached to the 12V battery, the Mégane started on the first attempt – an indication that the
eration was tested on a skid pad, emergency ne change and slalom procedures. However, results from these tests were subjective
he
IS MEAN FOR CANADIANS?
related r
. t that time, advanced glow plugs, diesel combustion technologies (common rail direct
d.
und
brids
After a cold soak at -30°C, the Mégane would not start.aglow plugs were functioning adequately for such conditions. Dynamic testing results have shown that the Mégane meets the relevant Canadian standards in terms of external noise and braking. The vehicle’s acceleration and braking performance were acceptable. Lateral accellabecause the driver was dictating the pull-out point rather than allowing the vehicle to “plow out” or roll. For future testing, outriggers would likely have to be affixed to tvehicle to provide more accurate results. 9.0 WHAT DOES TH Common misperceptions of diesel technologies have stemmed from performance challenges in the late 1970’s – some of the challenges included the ability to start aftecold soaks (sub zero temperatures), noise vibration and harshness (NVH), and pollutionAfuel injection, piezoelectric injectors) and exhaust treatment technologies (diesel particulate filters, selective reduction catalytic converters) were not yet develope Recently, acceptance of diesel technology has improved in North America – a rebofrom misperceptions that have lingered over the past several years. In fact, when a diesel powered vehicle is available as an option over the traditional gasoline powered vehicle, the consumer chose the diesel up to 30% of the time (in comparison to 10% for hyover their gasoline counterparts)9.
9 Research and Markets: Analysis of Diesel Powertrain Outlook and Technology Roadmap in NA”. http://www.pr-inside.com/research-and-markets-analysis-of-diesel-r2516746.htm, Business Wire, 2011.


![Motor unit MTR-DCI€¦ · Description MTR-DCI-...IO Description 539616 en 1209d [763197] Motor unit MTR-DCI](https://static.fdocuments.in/doc/165x107/5f50cafd0ff31e4afa1c4f9b/motor-unit-mtr-dci-description-mtr-dci-io-description-539616-en-1209d-763197.jpg)