Renal Responses to Differential Rates of Blood Volume ...
60
Portland State University Portland State University PDXScholar PDXScholar Dissertations and Theses Dissertations and Theses 7-11-1995 Renal Responses to Differential Rates of Blood Renal Responses to Differential Rates of Blood Volume Expansion in the Toad, Bufo marinus Volume Expansion in the Toad, Bufo marinus Mark Edward Bolke Portland State University Follow this and additional works at: https://pdxscholar.library.pdx.edu/open_access_etds Part of the Biology Commons Let us know how access to this document benefits you. Recommended Citation Recommended Citation Bolke, Mark Edward, "Renal Responses to Differential Rates of Blood Volume Expansion in the Toad, Bufo marinus" (1995). Dissertations and Theses. Paper 4973. https://doi.org/10.15760/etd.6849 This Thesis is brought to you for free and open access. It has been accepted for inclusion in Dissertations and Theses by an authorized administrator of PDXScholar. Please contact us if we can make this document more accessible: [email protected].
Transcript of Renal Responses to Differential Rates of Blood Volume ...

Portland State University Portland State University
PDXScholar PDXScholar
Dissertations and Theses Dissertations and Theses
7-11-1995
Renal Responses to Differential Rates of Blood Renal Responses to Differential Rates of Blood
Volume Expansion in the Toad, Bufo marinus Volume Expansion in the Toad, Bufo marinus
Mark Edward Bolke Portland State University
Follow this and additional works at: https://pdxscholar.library.pdx.edu/open_access_etds
Part of the Biology Commons
Let us know how access to this document benefits you.
Recommended Citation Recommended Citation Bolke, Mark Edward, "Renal Responses to Differential Rates of Blood Volume Expansion in the Toad, Bufo marinus" (1995). Dissertations and Theses. Paper 4973. https://doi.org/10.15760/etd.6849
This Thesis is brought to you for free and open access. It has been accepted for inclusion in Dissertations and Theses by an authorized administrator of PDXScholar. Please contact us if we can make this document more accessible: [email protected].
,/I ,r ,,
,/
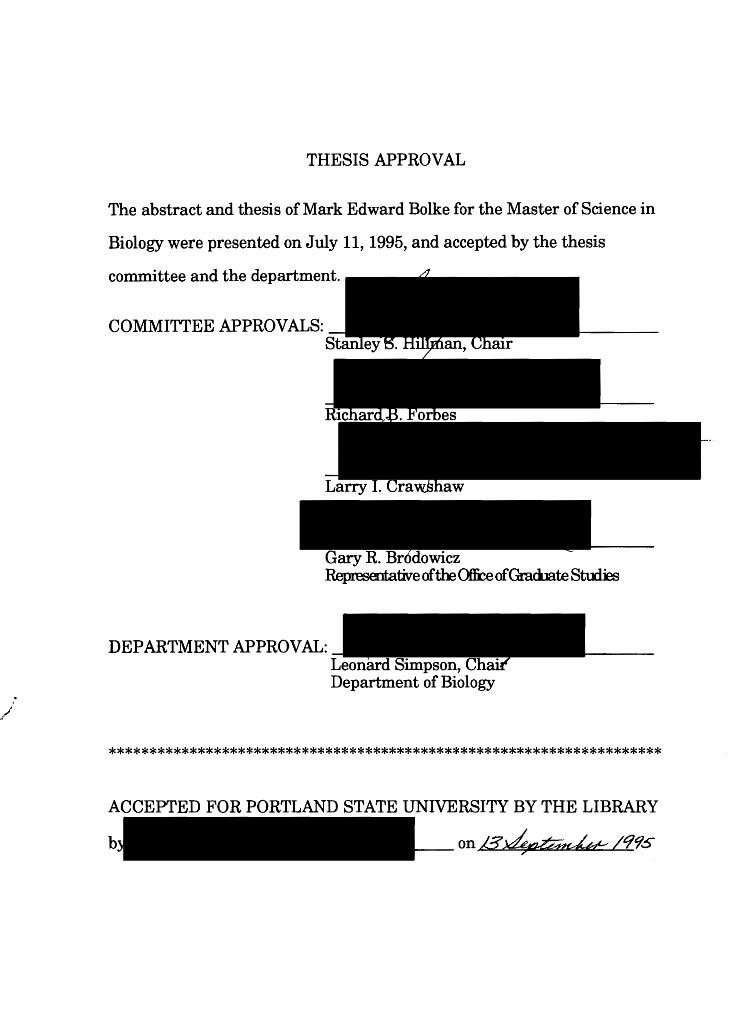
THESIS APPROVAL
The abstract and thesis of Mark Edward Boike for the Master of Science in
Biology were presented on July 11, 1995, and accepted by the thesis
committee and the department.
COMMITTEE APPROVALS: sta J
Ri
Larry I. Cra haw
Gary R. Br6dowicz Representativeof t.OOC>f&e ofGradiate StulEs
DEPARTMENTAPPROVAL: Leonard Simpson, Cha· Department of Biology
*********************************************************************
ACCEPTED FOR PORTLAND STATE UNIVERSITY BY THE LIBRARY
on~/99s
ABSTRACT
An abstract of the thesis of Mark Edward Boike for the Master of Science in
Biology presented July 11, 1995.
Title: Renal Responses to Differential Rates of Blood Volume Expansion in
the Toad, Bufo marinus
Three aspects of renal function were measured in the toad, Bufo
marinus (N=lO): (1) effect of rate of blood volume expansion on renal
functions (UFR; GFR; urine and plasma ion concentrations; and ion
excretion rates), (2) effect of hypo- and hyperosmotic blood volume
expansions on renal functions, and (3) role of GFR and tubular processes in
the differential response of UFR under different osmotic expansion stresses.
Renal responses to differential rates of blood volume expansion have not
been investigated in amphibians. Rate responses will be analyzed
considering effects: ( 1) during infusion (neural, or, short term regulation of
extracellular fluid volume) and (2) post infusion (hormonal, or, long term
regulation of extracellular fluid volume).
Volume expansions were administered with hypoosmotic (0.4%)
saline and hyperosmotic (1.4%) saline, and ranged in rate from 4.0 to 20.6
ml/kg/min. This protocol is designed to present volume regulatory
mechanisms with increased volume stimuli and different osmotic stimuli.
Overall, infusion rate had no significant effects on renal responses
measured: urine flow rate (UFR); glomerular filtration rate (GFR); urine and
plasma ion concentrations; natriuresis; or kaliuresis. This was true for the

2
infusion period and for the observed post infusion period (90 min). Rate was
correlated with GFR in the hypoosmotic group (r=0.30, p=0.04) and
natriuresis in the hyperosmotic group (r=0.34, p=0.03).
A significant positive correlation was observed between UFR and
GFR. Relative to treatment, UFR differed significantly; GFR response was
inherently similar despite differences at individual intervals, indicating UFR
differences between the treatments is due to tubular processes.
Responses to hypoosmotic infusion included a significant diuresis,
natriuresis, and a decreased urine sodium concentration, relative to
hyperosmotic infusion. At low UFRs the hyperosmotic group produced urine
relatively concentrated in sodium.
Urine sodium concentration and UFR were positively correlated in
the hypoosmotic infusion group -- at high UFRs, kidneys were unable to
produce a dilute urine.

RENAL RESPONSES TO DIFFERENTIAL RATES
OF BLOOD VOLUME EXPANSION
IN THE TOAD, Bufo marinus
by
MARK EDWARD BOLKE
A thesis submitted in partial fulfillment of the requirements for the degree of
MASTER OF SCIENCE in
BIOLOGY
Portland State University 1995
m
ACKNOWLEDGEMENTS
I would like to acknowledge the following people for their support and
inspiration. In one way or another, they are all a part of this thesis.
Dr. Stan Hillman, for his guidance, confidence, wisdom, "know-how",
and Hillman logic.
The committee members, Dr. Larry Crawshaw, Dr. Gacy Brodowicz,
and Dr. Richard Forbes for their time and review of the draft. Special thanks
to Dr. Forbes for invaluable and immeasurable input and also for being one
of the finest people I've ever known.
The boys in the swamp, Ed, Dane, Jonn, and Brian whose antics and
intellectual discussions yielded laughter and enlightenment.
Leslee Parr for inspiring me with her tenacious pursuit of life and
science, also for her friendship and encouragement.
Jim Campbell for inspiration and confidence.
Michelle, my wife, for endless support, encouragement, and love.
Little Conor, my newly arrived son, who has taught me the
importance of the little things and the need to finish the big things.

TABLE OF CONTENTS
PAGE
ACKNOWLEDGEMENTS . .. . .. .. .. . .. .. . .. .. . .. .. .. . .. .. . .. .. iii
LIST OF TABLES ............................................. v
LIST OF FIGURES . . . . . . . . . . . . . . . . . . . . . . . . . . . . . . . . . . . . . . . . . . . vi
INTRODUCTION .. .. . .. . .. . .. .. . .. . .. .. . .. . .. . .. .. . . .. .. . .. . . 1
REVIEW OF THE LITERATURE ............................... 3
MATERIALS AND METHODS .. .. .. . . . .. . . .. . . .. . . .. . . .. . . .. . . 12
RESULTS .................................................... 15
Pre-infusion Comparisons . . . . . . . . . . . . . . . . . . . . . . . . . . . . . . . . 15
Hematocrit . . . . . . . . . . . . . . . . . . . . . . . . . . . . . . . . . . . . . . . . . . . . . 16
Infusion Rate . . . . . . . . . . . . . . . . . . . . . . . . . . . . . . . . . . . . . . . . . . . 1 7
Electrolytes . . . . . . . . . . . . . . . . . . . . . . . . . . . . . . . . . . . . . . . . . . . . . 18
UFR and GFR ........................................... 24
Ion Excretion . . . . . . . . . . . . . . . . . . . . . . . . . . . . . . . . . . . . . . . . . . . 31
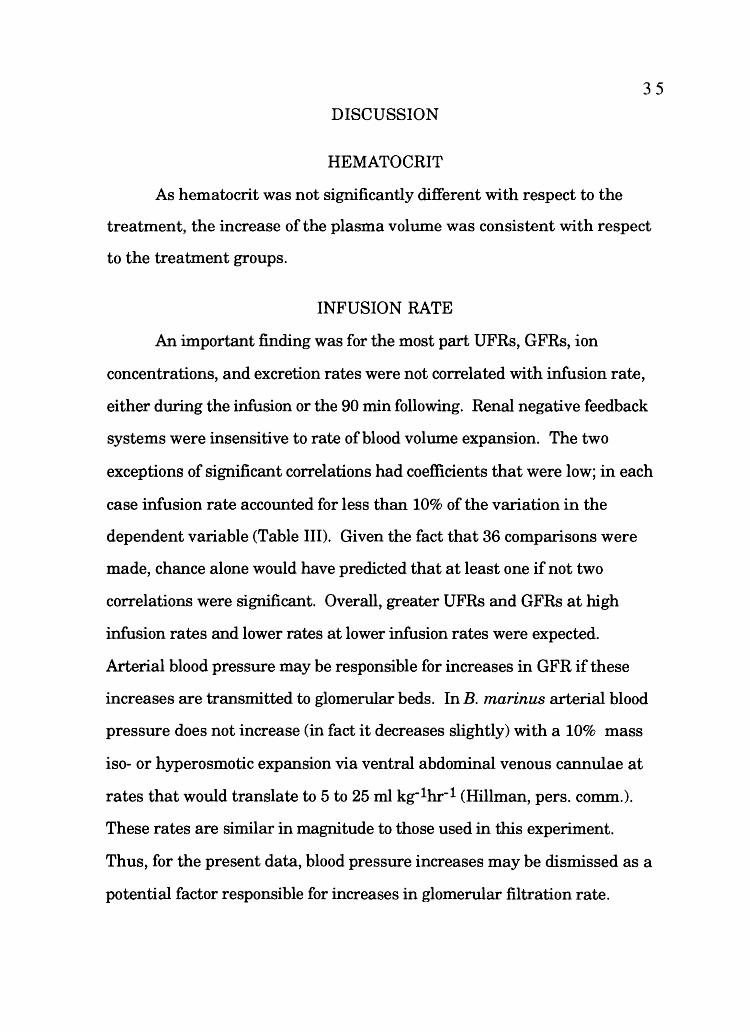
DISCUSSION ................................................ 35
Hematocrit ............................................. 35
Infusion Rate ........................................... 35
UFR and GFR ........................................... 36
Electrolytes . . . . . . . . . . . . . . . . . . . . . . . . . . . . . . . . . . . . . . . . . . . . . 3 9
SUMMARY ................................................... 44
REFERENCES CITED ........................................ 46
IV

v
LIST OF TABLES
TABLE
I
II
PAGE
Comparison of pre-infusion for renal functions . . . . . . . . . . . 15
Correlation coefficients for infusion rate and renal
responses during the infusion period . . . . . . . .. . . . . . . 1 7
III Correlation coefficients for infusion rate and renal
responses post infusion period . . . . . . . . . . . . . . . . . . . 18
IV Tukey test results of urine sodium concentration
response relative to pre-infusion values of
urine sodium concentration . . . . . . . . . . . . . . . . . . . . . . 21
V Standardized(~) regression weights of independent
variables on urine sodium concentration and
corresponding multiple correlation coefficients ..... 22
VI Correlation coefficients ofUFR and GFR ................ 28
VII Standardized (~) regression weights of independent
variables on UFR and corresponding multiple
correlation coefficients . . . . . . . . . . . . . . . . . . . . . . . . . . 2 8
VIII Standardized (~) regression weights of independent
variables on urine potassium concentration and
corresponding multiple correlation coefficients . . . . . 3 0
IX Standardized(~) regression weights of independent
variables on natriuresis and corresponding
multiple correlation coefficients . . . . . . . . . . . . . . . . . . 32
X Standardized(~) regression weights of independent
variables on kaliuresis and corresponding multiple
correlation coefficients ........................... 34

vi
LIST OF FIGURES
FIGURE PAGE
1. Experimental model . . . . . . . . . . . . . . . . . . . . . . . . . . . . . . . . . . 13
2. Effect of treatment on hematocrit ...................... 16
3. Effect of treatment on plasma sodium concentration . . . . . 19
4. Effect of treatment on urine sodium concentration ....... 20
5. Effect of treatment on plasma potassium concentration .. 23
6. Effect of treatment on urine potassium concentration .... 24
7. Effect of treatment on urine flow rate (UFR) . . . . . . . . . . . . 2 5
8. Effect of treatment on glomerular filtration rate (GFR) . . 26
9. Correlation ofUFR and GFR. .......................... 27
10. Correlation ofUFR and urine sodium concentration ....... 29
11. Correlation of UFR and urine potassium concentration . . . 3 0
12. Effect of treatment on natriuresis ...................... 31
13. Effect of treatment on kaliuresis ....................... 33

1
INTRODUCTION
At the physiological interface of aquatic life and terrestrial life,
amphibians make good models for water balance studies. Kidneys, lymph
hearts, nephrostomes, and the urinary bladder all function as regulatory
organs of blood volume and composition in amphibians. Investigation of
renal response to blood volume and changes in osmotic pressure sheds light
on processes involved and the mechanisms behind these processes. Volume
expansion protocols have been used for decades (Adolph 1927) to apply
various stresses to volume regulatory systems.
Hyperosmotic volume expansion presents two separate signals to the
animal; 1) a volume stimulus that under normal circumstances would elicit
a diuresis (Adolph 1927), and 2) an osmotic stimulus that alone would elicit
an antidiuresis (Schmidt-Nielsen and Forster 1954). Hyperosmotic volume
expansion allows these stimuli to be administered simultaneously. The
renal responses to hyperosmotic expansion are similar to those observed
during dehydration--reduced urine flow rate (UFR) and glomerular filtration
rate (GFR), and increased tubular reabsorption (Eliassen and J0rgensen
1951; Schmidt-Nielsen and Forster 1954; Sawyer 1957).
Hypoosmotic expansions present dual signals of excess volume and
diluted concentrations of electrolytes, which both elicit diuresis (Adolph
1927; Sawyer 1951). Increased GFR and decreased tubular reabsorption
are correlated with hypoosmotic expansion-induced diuresis (Schmidt
Nielsen and Forster 1954; Sawyer 1957). Blood volume expansion
experiments are excellent models for studies of renal function because of the
kidney's inherent role in blood volume regulation.

2
There are no data for the renal responses to differential blood volume
expansion rates in amphibians. Hillman and Schimpf(1994) volume
expanded B. marinus at a constant infusion rate without accounting for the
mass of individual toads. While this protocol results in different infusion
rates for each animal due to variation of body mass, this was not one of
their variables. By varying the expansion rate one can determine if this
factor elicits rate-dependent renal responses. Hillman and Schimpf (1994)
observed dramatic differences between treatments in UFRs (hypo- and
isosmotic expansions resulted in diuresis while hyperosmotic expansion
resulted in diuresis). This variation in UFR may be a result of differences in
either GFR or tubular reabsorption. Inclusion of GFR measurements would
answer this question of UFR variability. This thesis examines (1) the role of
rate of blood volume expansion on amphibian renal functions (UFR; GFR;
urine and plasma sodium and potassium concentrations; and ion excretion
rates), (2) the influence of hypo- and hyperosmotic blood volume expansions
on renal functions, and (3) the role of GFR and tubular processes in the
differential response of UFR under different osmotic expansion stresses in
the toad, Bufo marinus. Observations of the rate responses will be twofold:
consideration of effects (1) during the infusion (neural, or, short term
regulation of extracellular fluid volume) and (2) post infusion (hormonal, or,
long term regulation of extracellular fluid volume).

REVIEW OF THE LITERATURE
A necessary and vital condition of life is the maintenance of
homeostasis. An important aspect of homeostasis is the constancy of the
internal environment, which is consists of the extracellular fluid, composed
of blood plasma, lymph, and interstitial fluid. Cells of multicellular
organisms are continually bathed in extracellular fluid. Their normal
physiologic function and, thus, that of the organism is dependent on the
homeostasis of the fluid.
3
Vertebrate kidneys are major effector organs in the regulation of
homeostasis of the body fluids. Kidneys participate in regulating the volume
and composition of blood plasma, and thus determine concentrations of
interstitial fluid. Homeostasis of extracellular fluid concentration and
volume is a result of the kidney processes of filtration, reabsorption, and
secretion. Fluid volume is a direct result of sodium concentration in
extracellular fluid (Guyton 1991). Sodium, as the prevalent ion in
extracellular fluid, provides the majority of the osmotic pressure of the
extracellular fluid. Therefore, sodium concentration indirectly determines
the volume of the extracellular fluid. Hemodynamics (Guyton 1991),
concentrations of electrolytes other than sodium (Persson and Persson
1981), hormones ( Sawyer 1951, 1957; Pang et al. 1980; Lang et al. 1987),
and the nervous system (Morris and Gibbins 1983) also influence renal
function.
Amphibians occupy a key position in vertebrate phylogeny.
Ancestral amphibians made the transition from an aquatic to a terrestrial
environment. Living amphibians may be characterized as aquatic species,

which spend their lives in water, and terrestrial species, some of which
return to water only for reproduction purposes.
The terrestrial invasion carried with it a host of physiological
challenges to osmoregulation. Water balance had to be maintained in the
terrestrial mode of life despite the relative scarcity of water and increased
driving force for evaporative and convective water losses.
4
Water balance for terrestrial amphibians is the sum of input and
output. Input is comprised of cutaneous uptake, preformed water from food,
and metabolic water. Output is comprised of cutaneous and respiratory
evaporation, and urinary and fecal losses. Evaporative water loss for most
amphibian species approaches that of a free surface of water due to their
highly permeable skin (Spotila and Berman 1976). Dehydration is much
more of a challenge in terrestrial life as opposed to that of an aquatic life,
where cutaneous osmotic influx is continuous. Terrestrial species are able
to withstand remarkable dehydration. Hillman (1980) showed that some
bufonids tolerated dehydration to greater than 40% of body mass.
Dehydration presents amphibians with the cardiovascular stresses of
hypovolemia, hyperosmolality, and hyperviscosity (Hillman 1978a; Hillman
1978b; Hillman et al. 1985). Management of these stresses is crucial for
survival.
Increases in blood volume are generally hypoosmotic; i.e., anurans
experience cutaneous influx of water which increases plasma volume while
decreasing plasma osmotic concentration. Experimental hyperosmotic
expansion is not natural for these animals, but it allows study of effects of
volume expansion coupled with an increase in osmotic pressure. In contrast
to that of mammals, urine formed by the amphibian kidney is subject to

modification in the bladder, where solutes and water may be reabsorbed to
meet osmoregulatory needs (Middler et al. 1968; Bentley 1973). Therefore,
to evaluate kidney function urine must be collected by ureteral
catheterization.
5
Amphibians differ from other vertebrates as osmoregulation is
accomplished by the skin and bladder as well as the kidneys. The skin and
bladder may have profound impacts on body fluid composition depending on
hydrational state and presence of circulating hormones which influence
bladder and cutaneous transport processes (Bentley 1966; 1976).
The functional unit of the vertebrate kidney is the nephron. The
nephron consists of the glomerulus, Bowman's capsule, and a tubule which
is functionally and histologically separated into proximal, intermediate, and
distal portions. Functionally, the glomerulus is a leaky capillary bed. Blood
is delivered to glomeruli via afferent arterioles and exits via efferent
arterioles. Blood delivered to the glomerulus is under relatively high
pressure because of the relatively short renal arteries and their proximity to
the ventricle. Plasma is filtered across the membranes of the glomerulus
and Bowman's capsule into the lumen of Bowman's capsule, driven by
hydrostatic pressure. The filtration is non-specific, passing all plasma
constituents except large plasma proteins, so the filtrate is nearly identical
to blood plasma. Nutrients and ions are reabsorbed by active transport
processes in the proximal tubule, thus avoiding depletion. Plasma proteins
(albumins) are too large to pass; they partially affect hydrostatic filtration
via the exertion of a colloid osmotic pressure. The distal tubule primarily
reabsorbs and secretes ions. The intermediate tubule varies in function
among vertebrate class. In Mammalia, it is termed the loop of Henle and

6
serves a concentrating function. At the distal end of the distal tubule, the
filtrate contains substances not reabsorbed and also those secreted. It
flows into collecting tubules, and subsequently into the bladder. Vertebrate
bladders differ tremendously. Birds and most reptiles do not store urine,
while mammals have a thick muscular bladder which does, and voids it
periodically. Amphibians possess a thin-walled bladder which in some
species may hold fluid amounting to 50% of body weight (Bentley 1966).
Their bladder also serves as a storage organ for water and salts which may
be mobilized during dehydration (Ruibal 1962; Bentley 1966).
Glomerular filtration is the first mechanical step in the excretion of
nitrogenous waste and osmoregulation. The rate of glomerular filtration
(GFR) is under many influences. It is under the influence of hydrostatic
pressures modulated by humoral (ionic) (Persson and Persson 1981),
hormonal (Pang et al. 1980), and neural influences in the afferent and
efferent arterioles (Morris and Gibbins 1983); capillary permeability;
capillary surface area; net pressure (hydrostatic and colloid osmotic)
gradient between the glomerular capillary and capsular space; glomerular
blood flow; and the number of actively filtering glomeruli (Forster 1942). The
net pressure gradient is a result of hydrostatic pressures in the glomerular
bed and capsular space as well as colloid osmotic pressures in these two
spaces. Afferent and efferent arterioles are subject to constriction and
dilation, which, by altering vascular resistances, may affect plasma flow
rates through the glomerulus, thus modifying GFR. Among other factors
influencing GFR is regulation of the renal blood flow, by
constriction/dilatation of afferent and efferent arterioles. GFR is modified by
hormonal and neural factors affecting glomerular capillary pressure and/or

7
changes in renal blood flow. If renal plasma flow increases, then G FR
increases as a result of increasing glomerular hydrostatic pressure.
Dilatation of the afferent arteriole increases the hydrostatic pressure in the
glomerulus which increases GFR. Constriction of the afferent arteriole
decreases glomerular pressure, which decreases GFR. Constriction of the
efferent arteriole increases GFR by increasing in glomerular pressure
because of an increased resistance to blood flow from the glomerulus. If the
constriction were severe, however, an overall decrease in GFR could occur
because of reduced flow through the glomerulus.
Renal blood flow is also subject to an autoregulation feedback
mechanism of its own termed "juxtaglomerular feedback". This feedback is
mediated by tubule juxtaglomerular cells which respond to low ion
concentrations in the luminal fluid. These low ion concentrations are the
result oflow GFR. Luminal fluid moves slowly, allowing for a relative
greater amount of reabsorption, yielding lower concentrations in the filtrate.
The low ion concentration has two similar vascular effects (Guyton 1991).
One is dilation of the afferent arteriole, allowing an increase in GFR. In
addition the low ionic concentration causes the release of renin and the
subsequent actions of the renin-angiotensin system which ultimately
constricts the efferent arteriole, also increasing GFR.
GFR is measured by measuring plasma and urine concentrations of a
substance and the volume of urine produced over a time period in which the
samples are taken. The substance must be completely filterable at the
glomerulus and neither secreted nor absorbed by the tubules. Inulin, a
polysaccharide of molecular weight 5200, filters across the glomerulus into
Bowman's capsule without hindrance (Hendrix et al. 1937). As inulin is

neither secreted or reabsorbed by the tubules, it is an ideal substance with
which to measure GFR; the clearance ofinulin is the same as the rate of
glomerular filtration. Inulin has been established as a means of evaluating
GFR (Hendrix et al. 1937) and is suitable for use in amphibians (Forster
1938).
Once filtered plasma enters the capsular lumen, it is called filtrate.
The filtrate flows through the remainder of the nephron --the proximal,
intermediate, distal tubules, and collecting ducts-- before flowing into the
ureter as urine. Along the length of the tubule, reabsorption and secretion
modify the filtrate. These processes are performed by the tubule epithelial
cells and determine the final composition ofureteral urine. Nutrients such
as glucose, amino acids, and vitamins, ions, and water are reabsorbed;
metabolic end products such as urea are excreted. Absorptive processes
include osmosis and primary and secondary active transport. Secretion is
an active, energy-requiring process.
8
Reabsorption occurs mostly in the proximal tubule via active
transport of sodium ions. Sodium accounts for over 90% of the osmotic
pressure of plasma. It is so important in its osmotic role that regulation of
intravascular sodium concentration directly affects blood volume. The
reabsorption of sodium occurs via the operation of sodium-potassium
pumps in the basolateral membrane of the tubule cells. By continually
pumping sodium into the interstitium, these cells maintain a low
intracellular concentration of sodium in addition to a negative intracellular
potential. Studying Necturus and Amphiuma, several investigators (Maude
et al. 1966; Sullivan 1968; Boulpaep 1971; Grandchamp and Boulpaep
197 4) have demonstrated transepithelial potentials ranging from -6 to -45
9
m V across proximal and distal tubular cell membranes. Not all tubule
potentials are negative; Wilbrandt (1938) demonstrated an intermediate
tubule potential of +6 mV. The combination oflow intracellular sodium
concentration and the negative intracellular potential sets up a diffusion
gradient for sodium from the luminal space into the intracellular space. As
there are carrier proteins in the luminal membrane for sodium, this
movement of sodium amounts to facilitated diffusion. The diffusion of
sodium powers secondary active absorption, or "cotransport", of potassium,
chloride (in mammalian intermediate portions), glucose, and amino acids.
This process occurs in the proximal tubule via sodium carriers which
cotransport glucose, amino acids, and potassium. As solutes move out of
the luminal space, the filtrate becomes more dilute and increasing
extratubular osmotic pressure facilitates a passive diffusion of water out of
the tubule. In this way, the kidney conserves ions, nutrients, and water.
Secretion occurs mainly in the distal tubule. Among the substances
secreted are ions of hydrogen, potassium, and urea. The mechanism is
secondary active secretion, or "counter transport". As sodium is carried into
the cell, the carrier is energized and pumps the other substance into the
lumen.
Kidneys respond to changes in blood plasma volume in order to
maintain an optimal blood volume. Responses to perturbations in blood fluid
volume include pressure diuresis, volume receptor-antidiuretic hormone
mechanism, aldosterone release, and the colloid osmotic pressure effect
(Navar and Guyton 1975). Pressure diuresis is a mechanical process. As
volume increases, arterial pressure increases, pressure in the afferent
arteriole increases. This increased pressure drives more fluid across the

10
glomerulus, increasing GFR. The increased GFR and filtrate flow rate, in
conjunction with increased peritubular capillary pressure, diminishes
tubular reabsorption, increasing UFR and thus correcting for the increase in
blood fluid volume. Volume and osmotic receptors respond to increased fluid
volumes via hormonal and neural reflexes. Volume receptors, also called
baroreceptors, are located in the atria of the heart and respond to stretch by
releasing atrial natriuretic factor (ANF) (Dietz 1984; Lang et al. 1987).
ANF increases natriuresis and so decreases blood volume because of the
additional water required to excrete the additional sodium. Other
baroreceptors are present in the vasculature, notably the pulmocutaneous
artery. They respond to increases in pressure by initiating neural
mechanisms for peripheral vasodilatation (Ishii and Ishii 1978). The
vasodilatation decreases pressure to appropriate physiological levels.
Osmoreceptors in the hypothalamic region of the brain respond to reduced
osmotic pressure by inhibiting the release of the amphibian anti diuretic
hormone, arginine vasotocin (A VT), from the hypophysis. This inhibition of
A VT release has the effect of increasing urine production through diuresis
(Sawyer 1951), returning blood volume to pre-perturbation levels.
Aldosterone has not been shown to have any renal effects in amphibians
(Bentley 1976). Its effects are on the skin and bladder, where it responds to
low blood volume by increasing sodium transport into the blood (Bentley
1976). Starling forces at the capillaries also figure into the blood volume
equation, as changes in volume directly affect the colloidal osmotic pressure
of the blood. As blood volume increases, colloidal osmotic pressure
decreases. This decrease facilitates an increase in glomerular filtration due
to lowered plasma oncotic pressure. The decreased oncotic pressure in the

capillaries also reduces tubular uptake, increasing urine production and
reducing blood volume.
1 1
12
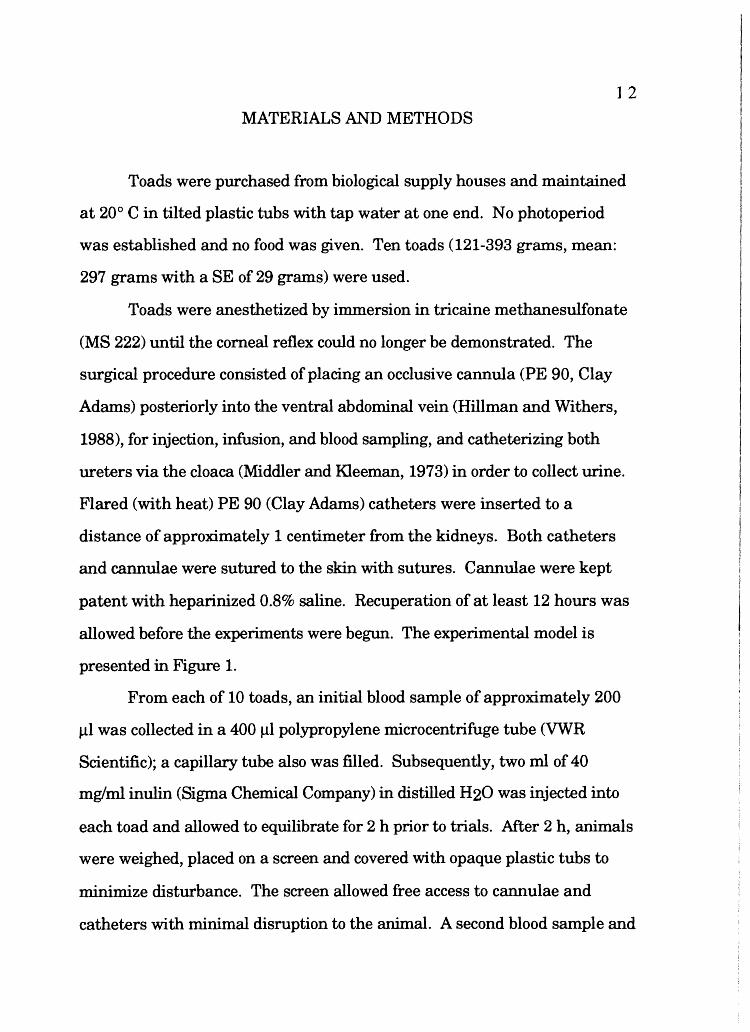
MATERIALS AND METHODS
Toads were purchased from biological supply houses and maintained
at 20° C in tilted plastic tubs with tap water at one end. No photoperiod
was established and no food was given. Ten toads (121-393 grams, mean:
297 grams with a SE of 29 grams) were used.
Toads were anesthetized by immersion in tricaine methanesulfonate
(MS 222) until the corneal reflex could no longer be demonstrated. The
surgical procedure consisted of placing an occlusive cannula (PE 90, Clay
Adams) posteriorly into the ventral abdominal vein (Hillman and Withers,
1988), for injection, infusion, and blood sampling, and catheterizing both
ureters via the cloaca (Middler and Kleeman, 1973) in order to collect urine.
Flared (with heat) PE 90 (Clay Adams) catheters were inserted to a
distance of approximately 1 centimeter from the kidneys. Both catheters
and cannulae were sutured to the skin with sutures. Cannulae were kept
patent with heparinized 0.8% saline. Recuperation of at least 12 hours was
allowed before the experiments were begun. The experimental model is
presented in Figure 1.
From each of 10 toads, an initial blood sample of approximately 200
µl was collected in a 400 µl polypropylene microcentrifuge tube (VWR
Scientific); a capillary tube also was filled. Subsequently, two ml of 40
mg/ml inulin (Sigma Chemical Company) in distilled H20 was injected into
each toad and allowed to equilibrate for 2 h prior to trials. After 2 h, animals
were weighed, placed on a screen and covered with opaque plastic tubs to
minimize disturbance. The screen allowed free access to cannulae and
catheters with minimal disruption to the animal. A second blood sample and

1 3
Independent Independent Covariate Repeated Measures Variable Variable of Renal Responses
Time Treatment Sequence Infusion Rate (15 min intervals)
0.4% saline Toads #1-5 - day 1 10 different 1 2 3 4 5 6 7 8 infusion Toads #6-10 - day 2 rates
1.4% saline Toads #6-10 - day 1 same 10 rates same sampling infusion Toads #1-5 - day 2 as above periods
Fieure 1. Experimental model. The first two sampling periods (pre-infusion) were used to establish "control" values for measured parameters. Volume expansion was administered at 30 min. Renal responses measured at time intervals were UFR; GFR; urine and plasma ion concentrations; and ion excretion rates. N = 10 toads.
capillary tube of blood were collected from each toad at this time and at 15
min intervals following for a time period of 120 min beginning with the
second sample. Beginning also with the second sample, urine from each
toad was collected in tared 12 X 7 5 mm polypropylene test tubes (Elkay
Products, Inc.) for 15 min intervals. At 30 min, each toad's blood volume
was expanded by 10% of its body mass with saline (either 0.4 or 1.4% saline)
via infusion pump (Sage Instruments, model 341B).
Treatment was randomized for each toad. On the first day following
surgery, five of the animals (n=5) received a hypoosmotic (0.4% NaCl) blood
volume expansion equal to 10% of body mass (HO group); on the second day
this group received a hyperosmotic (1.4% NaCl) blood volume expansion
equal to 10% of body mass (HR group). This treatment sequence was
reversed for the other of the animals. Infusion rates were converted to
mass specific rates for each animal resulting in ten different infusion rates
and varied from 4.0 to 20.6 ml kg-1 min-1. Blood samples were centrifuged
(Beckman Microfuge B) for 4 min to separate plasma for inulin analysis and

14
determination of ion concentrations. Inulin concentrations in urine and
plasma were determined with the use of a spectrophotometer (Bausch and
Lamb) via the colorimetric method introduced by Yatzidis (1976). Flame
photometry (Instrumentation Laboratory Inc. model 143) was used for
plasma and urine sodium and potassium concentration .
G FR was calculated as inulin clearance according to the equation
GFR = UV/P, where U is [inulin]urine, Vis volume of urine produced over the
measured period, and Pis [inulin]plasma· UFR was determined by weighing
the collection tubes and subtracting the tare after urine collection, dividing
by the appropriate time factor, and assuming urine density is 1 g/ml. In
order to observe blood volume changes, hematocrits were recorded for each
animal, at 15 min intervals over the same time period. Blood samples were
centrifuged (Adams Autocrit Centrifuge) for 5 min before hematocrit
readings were taken.
Statistical analyses were performed with Statistica/Mac (R3, part 1,
StatSoft, Inc. Copyright 1992) on a Macintosh Ilx computer. All values are
mean± one SE. Analysis of covariance (ANCOVA) with repeated
measures was used to evaluate the overall responses to treatment and
investigate differences in those responses with respect to the treatment. In
order to evaluate differences between two means at specific times, post hoc
Tukey tests were used. Simple linear regression and multiple regression
were employed to investigate relationships between variables. Means of
pre-infusion values were compared using t-tests. Results are interpreted as
statistically significant at an alpha level of 0.05. With reference to the
figures, saline infusion occurred at t = 0 h; values indicated at t=O hare the
pre-infusion values.

RESULTS
PRE-INFUSION COMPARISONS
1 5
Results of two-tailed t-tests on the pre-infusion data confirm that the
treatment group means did not differ significantly pre-infusion (Table I). In
addition, the pre-infusion UFRs and GFRs were not mass dependent, and no
significant correlation existed for either variable. The infusion sequence (day
1 or day 2) had no significant effect on pre-infusion rates of UFR or GFR.
TABLE I
COMPARISON OF PRE-INFUSION VALUES FOR RENAL FUNCTIONS
HO group HR group Both groups t
UFR 35.2 ± 5.7 30.1 ± 5.9 32.8 ± 4.0 1.14 (ml/kg/hr) (N=lO) (N=9) (N=19)
GFR 50.3 ± 9.0 47.8± 6.0 47.1 ± 5.1 0.28 (ml/kg/hr) (N=8) (N=8) (N=16)
[Na]plasma 97.3 ± 2.8 99.5 ± 1.1 98.3 ± 1.6 0.02 (mEq/L) (N=lO) (N=8) (N=18)
[KJplasma 1.87 ± 0.12 1.85 ± 0.09 1.86 ± 0.07 0.48 (mEq/L) (N=lO) (N=8) (N=18)
[Na]urine 11.3 ± 2.5 7.1 ± 1.1 9.6 ± 1.6 2.1 (mEq/L) (N=lO) (N=7) (N=17)
[KJurine 0.37 ± 0.05 0.39 ± 0.05 0.38 ± 0.03 0.55 (mEq/L) (N=9) (N=6) (N=15)
Natriuresis 0.35 ± 0.07 0.20 ± 0.04 0.29 ± 0.05 2.1 (mEq/kg/hr) (N=lO) (N=7) (N=17)
Kaliuresis 14.8 ± 4.3 14.6 ± 4.2 14.7 ± 3.0 1.5 (mEq/kg/hr) (N=9) (N=6) (N=15)
Hematocrit 16.3 ± 1.7 16.4 ± 1.6 16.3 ± 1.2 0.08 (%) (N=lO) (N=lO) (N=20)
p
0.29
0.79
0.98
0.65
0.08
0.61
0.08
0.19
0.94

1 6
HEMATOCRIT
Hematocrits for both treatment groups showed an initial significant
decrease (post hoc Tukey tests: HO, 16% to 13%, p=0.002; HR, 16% to 12%,
p=0.006) which was maintained for the duration of the experiment (Figure
2). No significant difference in mean hematocrit between treatments was
found.
18-------------------------------
...........
§ 16 g = Q) 0
Plj
~ 14 ~ S2t
'fl!. -t: 0 0 12 ~ e Q)
!I:
····-o···· 0.4% saline infusion
• 1.4 % saline infusion
1 10-----------------------------------
0 0.5 1 1.5 Time post infusion (hours)
Fi~re 2. Effect of treatment on hematocrit. Values are means± 1 SE.

1 7
INFUSION RATE
Infusion rate was not significantly correlated with UFR; GFR; urine
ion concentrations; or ion excretion rates during the infusion period when
treatment groups were combined or partitioned (TABLE II).
TABLE II
CORRELATION COEFFICIENTS FOR INFUSION RATE AND RENAL RESPONSES DURING THE INFUSION PERIOD
r p r p r p HO HO HR HR Both Both
eroup group group group groups groups UFR -0.11 0.77 -0.10 0.79 -0.12 0.62
N=lO N=9 N=19 GFR -0.30 0.26 -0.65 0.08 0.07 0.88
N=B N=8 N=16 Urine [Na] 0.16 0.66 0.50 0.26 0.29 .027
N=lO N=7 N=17 Natriuresis 0.28 0.43 0.62 0.14 0.032 0.21
N=lO N=7 N=17 Urine [K] 0.43 0.25 0.31 0.55 0.27 0.34
N=9 N=6 N=15 Kaliuresis 0.03 0.94 0.23 0.67 0.08 0.78
N=9 N=6 N=15
With two exceptions, over the duration of the experiment, infusion
rate did not correlate with UFR or maximal UFR; GFR or maximal GFR;
urine ion concentrations; natriuresis or kaliuresis when treatment groups
were combined or when the data were partitioned into treatment groups
(Table III). The correlations for GFR in the HO group and natriuresis in the
HR group are significant but the coefficient is low.

TABLE III
CORRELATION COEFFICIENTS FOR INFUSION RATE AND RENAL RESPONSES POST
INFUSION PERIOD. * p< 0.05.
r p r p r p HO HO HR HR Both Both
group group group group groups groups UFR 0.25 0.06 0.01 0.94 0.17 0.08
N=58 N=52 N=llO UFRmax -0.38 0.28 -0.16 0.70 0.24 0.33
N=9 N=lO N=19 GFR -0.30* 0.04* 0.13 0.38 0.20 .052
N=46 N=46 N=92 GFRmax 0.59 0.13 0.05 0.90 -0.27 0.30
N=8 N=B N=16 Urine [Na] 0.09 0.51 0.08 0.60 0.08 0.41
N=58 N=42 N=lOO N atriuresis 0.10 0.47 0.34* 0.03* 0.01 0.92
N=58 N=42 N=lOO Urine [KJ 0.22 0.11 0.03 0.87 0.06 0.56
N=52 N=36 N=88 Kaliuresis 0.10 0.46 0.14 0.42 0.04 0.74
N=52 N=36 N=88
ELECTROLYTES
Sodium Concentration In Plasma
1 8
Sodium concentrations in plasma differed significantly (p=0.000001)
between the HO and HR groups (Figure 3). The HR group showed an
immediate and significant (p=0.0001, Tukey test) increase in plasma
sodium concentration which did not diminish over the data collection period,
thus providing a consistent osmotic stimulus to regulatory systems.
Hypoosmotic treatment did not significantly affect plasma sodium
concentrations relative to the pre-infusion concentration.

· · ·· 0 · · · 0.4 % saline infusion 130
.__ 1.4 % saline infusion
-...J 120 Ct T
s ....._,,
ti z 110 ......... (\1
E 1:'1.1 (\1 -~ 100 T T T
a .. o-·-· -o -O · .• T / .l l ... T
1...... T .... " l . ····· ...
"() ..••• .a '() 90 .l J.
0 0.5 1 1.5 Time post infusion (hours)
Fi~re 3. Effect of treatment on plasma sodium concentration. Values are means± 1 SE.
Sodium Concentration in Urine
Sodium concentration in urine differed significantly (p=0.00004)
between the HO and HR groups (Figure 4). The HO group showed a peak
forconcentration at 30 min, after which it returned to pre-infusion values.
1 9

20
80 I
····-O···· 0.4% saline infusion
---- 1.4% saline infusion
I 1 60
,,....... ...J °04 a .........
'"{? 40 I z ........
l ·~ ## •
# • # •
# • # •
# •
::J # • . 20 " .. J
b.... T 1 .......... T T O······o-······O 1 1 1
I • 0
0 0.5 1 1.5
Time post infusion (hours)
Fi~ 4. Effect of treatment on urine sodium concentration. Values are means± 1 SE.
Post hoc results of urine sodium concentration relative to pre-infusion
are in Table IV. Sodium concentration in urine of the HO group was not
significantly different, with the exception 30 min, from pre-infusion values;
in the HR group sodium concentration in urine was significantly different
from pre-infusion values at each time period (Table IV).
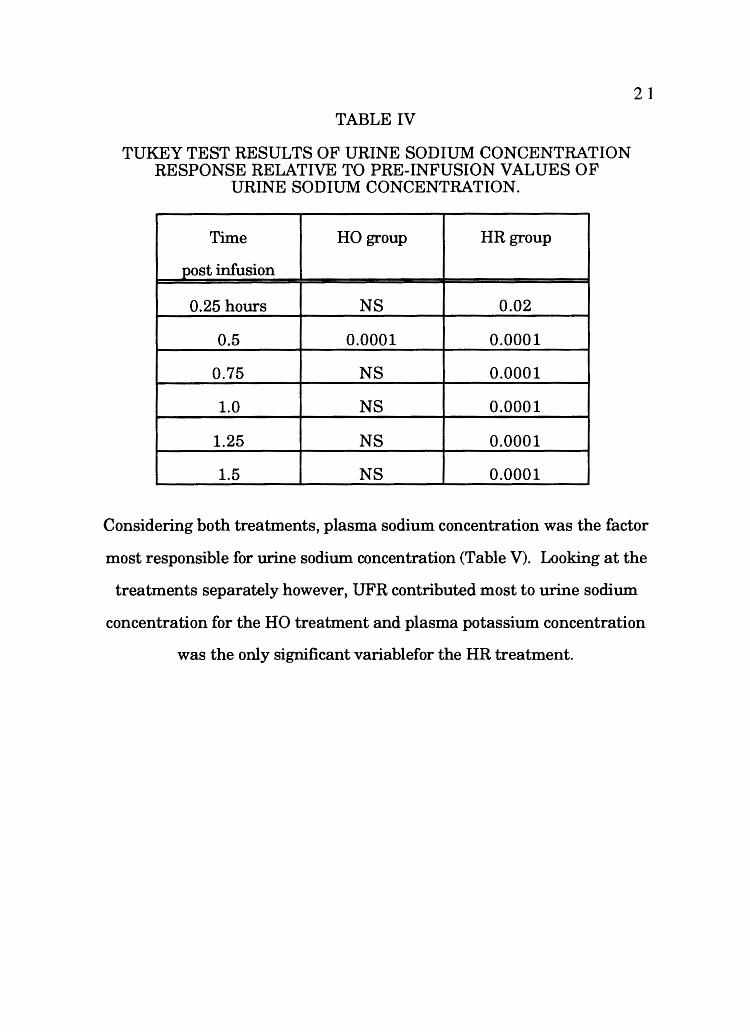
TABLE IV
TUKEY TEST RESULTS OF URINE SODIUM CONCENTRATION RESPONSE RELATIVE TO PRE-INFUSION VALUES OF
URINE SODIUM CONCENTRATION.
Time HO group HR group
post infusion
0.25 hours NS 0.02
0.5 0.0001 0.0001
0.75 NS 0.0001
1.0 NS 0.0001
1.25 NS 0.0001
1.5 NS 0.0001
21
Considering both treatments, plasma sodium concentration was the factor
most responsible for urine sodium concentration (Table V). Looking at the
treatments separately however, UFR contributed most to urine sodium
concentration for the HO treatment and plasma potassium concentration
was the only significant variablefor the HR treatment.

22 TABLE V
STANDARDIZED (p) REGRESSION WEIGHTS OF INDEPENDENT VARIABLES ON URINE SODIUM CONCENTRATION AND
CORRESPONDING MULTIPLE CORRELATION COEFFICIENTS *p< 0.05
UFR GFR [Na]plasma [KJplasma R p N
HO 0.88* -0.38 0.45* -0.12 0.69* 0.00002 46
HR -0.19 -0.27 -0.04 -0.43* 0.60* 0.007 36
Both 0.18 -0.19 0.57* -0.26* 0.68* 0.00001 82
Potassium Concentration in Plasma
There was no significant (p=0.22) difference between the HO and the
HR groups (Figure 5). The HR treatment resulted in a significant (p=0.01,
Tukey test) decrease relative to pre-infusion values and remained
significantly (p< 0 .02, Tukey test) decreased until 60 min post infusion.
Potassium concentration in plasma did not differ significantly from pre
infusion concentration for the HO group.

2 ····<>··· 0.4% saline infusion
..._ 1.4% saline infusion
,,.......
~ 1.8
8 \ l \ I T...() '-"
f2" ..... t\1
' ,' l l .. ,, ' , .. ,' ts' ·-··
a ~ 1.6
T~I ..... P-4
l 1.4-----.---..---...---...... ---
0 0.5 1 1.5 Time post infusion (hours)
Fi2Jlre 5. Effect of treatment on plasma potassium concentration. Values are means ± 1 SE.
Potassium Concentration in Urine
23
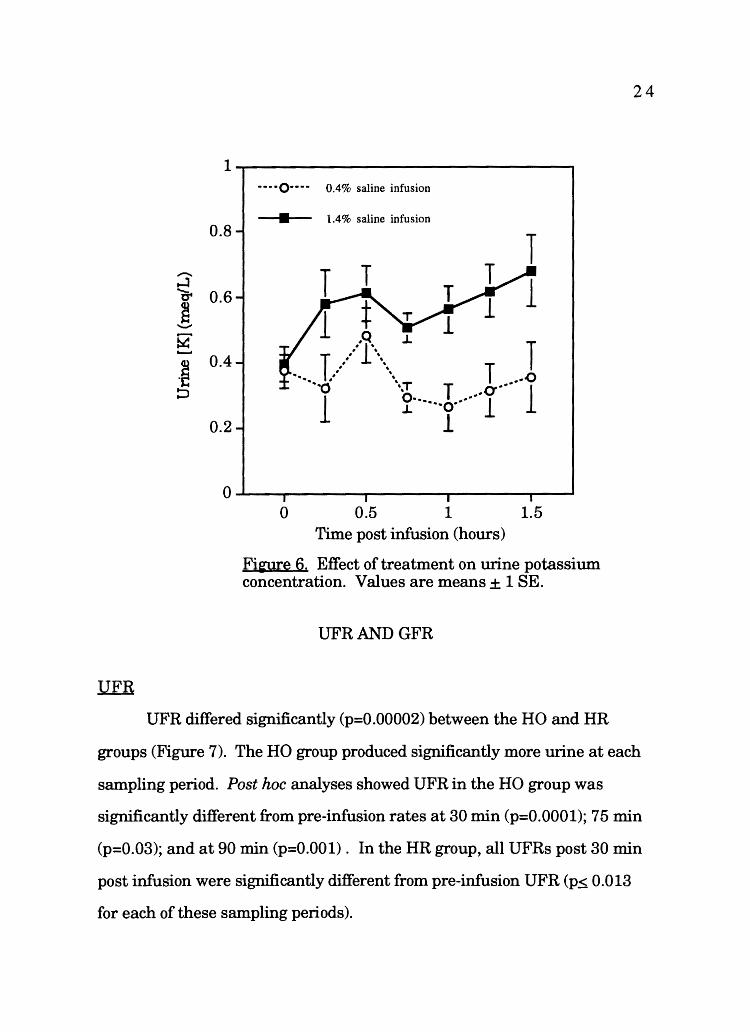
Urine potassium concentrations were significantly different (p=0.003)
between the HO and the HR groups, (Figure 6), with the HR group having
higher potassium concentration in the urine than the HO group. Post !we
analyses showed in the HO group, at no time was the potassium
concentration in urine significantly different from pre-infusion potassium
concentration in urine. For the HR group, potassium concentration in the
urine was only significantly different at t=90 min (p=0.03).
ll.ER
!----------------------------····O··· · 0.4% saline infusion
a.- 1.4% saline infusion 0.8
-....l T ~ 0.6 s •
1 + -~ ..__,
·~ ~
0.4
0.2
Q - T #1' #. " T T #.· '\ .... o
...... .#: ',"T T .... a...... 1 ··o , .. 1 .. o-......... 0 ...... l J. l
o--__,~---------------------~ 0 0.5 1 1.5
Time post infusion (hours)
Fi'3lfe 6. Effect of treatment on urine potassium concentration. Values are means± 1 SE.
UFRANDGFR
24
UFR differed significantly (p=0.00002) between the HO and HR
groups (Figure 7). The HO group produced significantly more urine at each
sampling period. Post hoc analyses showed UFR in the HO group was
significantly different from pre-infusion rates at 30 min (p=0.0001); 75 min
(p=0.03); and at 90 min (p=0.001). In the HR group, all UFRs post 30 min
post infusion were significantly different from pre-infusion UFR (p~ 0.013
for each of these sampling periods).

GFR
l ----O---- 0.4% saline infsuioa
60
~
,/::>f' -I , '
I ,:': .... , , '
"1: \~ # '
/ ' # ' , '
• 1.4% saline infusion
f 40 I....... i I l '',, ...........
~ tz.. :::::>
'·\,
', T t) .........
20 .. ,, "., T
9--.... ...... 0 ~
0------------------------------0 0.5 1 1.5
Time post infusion (hours)
Fi~e 7. Effect of treatment on urine flow rate (UFR). Values are means± 1 SE.
25
GFR differed significantly (p=0.01) between HO and HR groups
(Figure 8). Hypoosmotic infusions resulted in higher GFRs. Post hoc
analysis demonstrated GFR was not significantly different (p= 0.8) between
the HO and HR groups at 15 min. The overall difference manifested itself at
30 min, for which the post hoc analysis yielded a significant difference (p =
0.01). GFR of the HO group was significantly different (p=0.008) from pre
infusion HO GFR only at 90 min. GFR of the HR group was significantly

26
different (p~ 0.047) from pre-infusion GFR at each sampling period post 30
min infusion.
100----~~~----~~------~~--
80
......... ~ 60
f ......,.. ~ 40 ~ d
20
----O---- 0.4% saline infusion
l • 1.4% saline infusion
,' '•, , .... l , ....
....... 1 "01·· ...... , .... / ' T
.... 0.
1 .... "•.,., T
"•o ........ T ......... 0 ..
.1 .... ...... T .... o
.L
0-------~-------~~------------0 0.5 1 1.5
Time post infusion (hours)
Figure 8. Effect of treatment on glomerular filtration rate (GFR). Values are means± 1 SE.
UFR, GFR, and Ion Concentrations
Considering both treatments together, a significant correlation
between UFR and GFR was found (r=0.88, p< 0.000001; Figure 9).

27
80 I
0 0.4% saline infusion
• 1.4% saline infusion I e---0-
60-I l l -~ .,___o-----
1 f 40 T ..... o .... ......... ~ (z..
:::::>
1
T 1-Q-41 l 1
20-1 ----·----4 .-e. ... 1 T 1 ...g ...
--··---~•-.::. ·•· 0 0 20 40 60 80 100
GFR (ml/kg/hr)
Fi~e 9. Correlation ofUFR and GFR. Error bars represent ± lSE.
Table VI contains the regression results with treatments separated.
Regression equations for the groups are: HO group: UFR = -6.5 + 0.9*GFR;
HR group: UFR = -0.05 + 0.37*GFR.

TABLE VI
CORRELATION COEFFICIENTS OF UFRANDGFR.
r p N HO 0.90* 0.000001 46 HR 0.82* 0.000001 46
Both 0.88* 0.000001 92
Additionally, UFR was correlated with GFR, plasma sodium and
potassium concentrations (Table VII).
TABLE VII
28
STANDARDIZED (b) REGRESSION WEIGHTS OF INDEPENDENT VARIABLES ON UFR AND CORRESPONDING MULTIPLE
CORRELATION COEFFICIENTS. *p< 0.05
GFR [Na]plasm [KJplasma R p,< N a
HO 0.87* -0.06 -0.12 0.91* 0.0001 46 HR 0.84* 0.10 0.06 0.84* 0.0001 36
Both 0.80* -0.2* -0.05 0.90* 0.0001 82
Urine sodium concentration for both groups was correlated with UFR,
GFR, and plasma sodium and potassium concentrations (R=0.68, p<0.0001;
Table V). Additionally, urine sodium concentration was regressed on UFR
(HO group, r= 0.49, p=0.0001, N=58; HR group, r=0.41, p=0.007, N=42;
Figure 10). The regression equations are: HO group: urine[Na] = 6.9 +
0.35*UFR; HR group: urine[Na] = 64.4 - 1.13*UFR.

-.....l a. s -(;' z ..__.
-~ ::J
80 ., 0 0.4% saline infusion
• n • 1.4% saline infusion
60 1, 1 --·--1
40 l -0--1
l 1 l
20 ~
._..._..,. .,__0----t
1 I l t-Q--t T 1 .. c) .... c, ...... o ...
... .L J.
0 ...------------------------------------t 0 20 40 60
UFR (ml/kg/hr)
Fi~e 10. Correlation ofUFR and urine sodium concentration. Error bars represent± 1 SE.
80
29
Urine potassium concentration was correlated with UFR, GFR,
plasma sodium and potassium concentrations (Table VIII). In addition,
urine potassium concentration was regressed on UFR (HO group, r= 0.10,
p=0.47, N=52; HR group, r=0.01, p=0.94, N=36; Figure 11). The regression
equations are HO group: urine [K] = 0.3 + 0.0006(UFR); HR group: urine [K]
= 0.6 - 0.004(UFR).

30
TABLE VIII
STANDARDIZED (b) REGRESSION WEIGHTS OF INDEPENDENT VARIABLES ON URINE POTASSIUM CONCENTRATION AND
CORRESPONDING MULTIPLE CORRELATION COEFFICIENTS. *p< 0.05
UFR GFR [Na]plasma [KJplasma R p N
HO 0.19 0.03 0.003 -0.09 0.24 NS 40
HR -0.50 0.49 -0.32 0.48* 0.56* 0.046 30
Both -0.29 0.32 0.49* -0.03 0.54* 0.0001 70
0.8
ll l 0 0.4% saline infsuion
• 1.4% saline infusion
,,_..... h ~~I ....:J 0.6 Ct
1·1· rr s I .._.. ~~ 52' -- 1 ..,__o~
·~ I :::> 0.4 l
•O .. l l l •0 .. T t--0---t
l .. !~ ~o ...... 1 1 1
0.2 0 20 40 60 80
UFR (ml/kg/hr)
Fi~e 11. Correlation ofUFR and urine potassium concentration. Error bars represent± 1 SE.

3 1
ION EXCRETION
N atriuresis
Between the treatment groups, natriuresis did not differ significantly
(p=0.07) after 90 min, but did differ significantly over the first 60 min
(p=0.04; Figure 12). Post hoc analysis revealed a significant difference
(p=0.0001) between natriuresis of the HO and HR groups at 30 min post
infusion; natriuresis of the HO group was significantly different (p=0.0001)
from pre-infusion natriuresis at 30 min; the HR group did not significantly
differ from pre-infusion natriuresis during any sampling period.
3-------------------------------
2.5
2
-v-···
l
____ ,,..._
.·~r ,' . . . . . . . . . . . ' . . . . . . .
0.4% saline infusion
1.4% saline infusion
~ ~ s """ 1.5 . . . . . .
J .... \
~ ·-~ ·~ 1\1 z
1
0.5
. . . . . .. /l \
.. ·· . . . l ...
0-------------------------------------0 0.5 1 1.5
Time post infusion (hours)
Fi~e 12. Effect of treatment on natriuresis. Values are means+ 1 SE.

Natriuresis was correlated with UFR, GFR, urine sodium and
potassium concentrations, and plasma sodium and potassium
concentrations for both treatments (Table IX). The only significant
independent variables were UFR and urine sodium concentration.
TABLE IX
32
STANDARDIZED (b) REGRESSION WEIGHTS OF INDEPENDENT VARIABLES ON NATRIURESIS AND CORRESPONDING
MULTIPLE CORRELATION COEFFICIENTS *p< 0.05
UFR GFR [Na]urine [KJurine [Na]pl [KJpl R p,< N
HO 0.55* -0.22 0.74* 0.10* -0.07 0.05 0.97* 0.01 40
HR 0.79* 0.08 0.57* 0.02 -0.01 0.02 0.86* 0.01 30
Both 0.97* -0.24 0.59* 0.05 -0.02 -0.02 0.85* 0.01 70
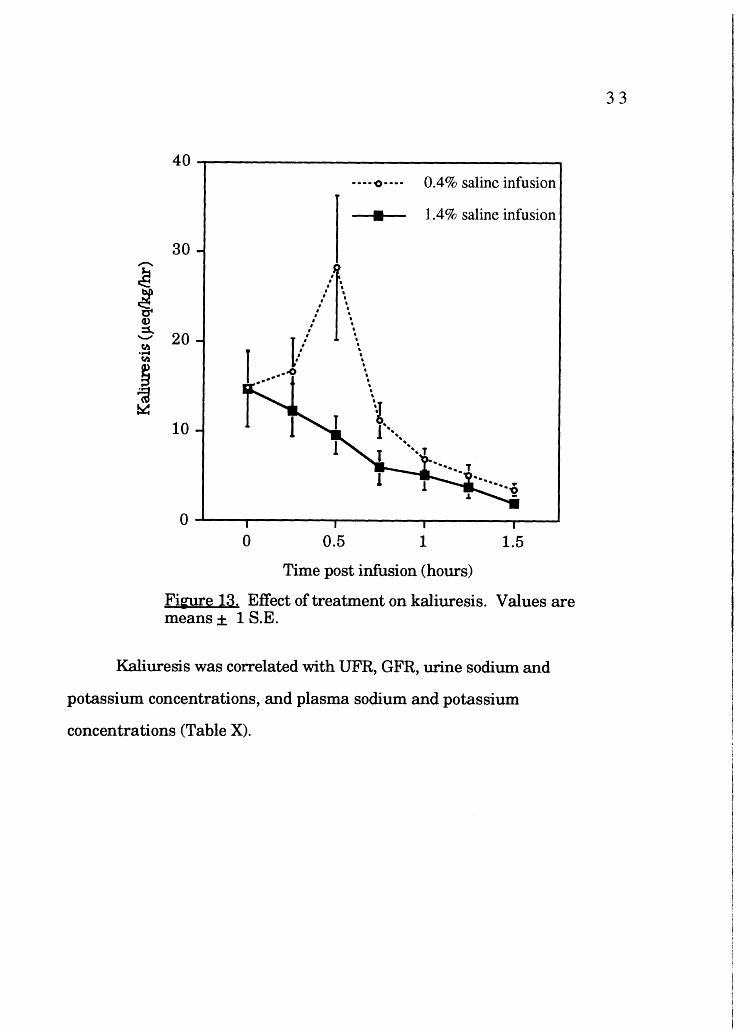
Kaliuresis
Kaliuresis was not significantly different between the HO and HR
groups (p=0.13). Post hoc analysis demonstrates significantly different
(p=0.006) values for kaliuresis between treatments at 30 min (Figure 13);
kaliuresis at 30 min in the HO group differed significantly (p=0.02) from pre
infusion kaliuresis; kaliuresis in the HR group did not differ significantly from
pre-infusion kaliuresis.
40--------------------------------··-·o···· 0.4% saline infusion
• 1.4% saline infusion
30 ,,_....
~ ~
I t . ' I t . ' I t I t
Cl>
..::;. 20 fl.I
I ··]·
.· ' T ,•' ,
l .... 4.
..... fl.I
~ ~
10
' •• 1 ~ ' ' '
1 !' ...... ......
.... T
0----,..--------.,~-----------------~ 0 0.5 1 1.5
Time post infusion (hours)
Fi~e 13. Effect of treatment on kaliuresis. Values are means ± 1 S.E.
Kaliuresis was correlated with UFR, GFR, urine sodium and
potassium concentrations, and plasma sodium and potassium
concentrations (Table X).
33
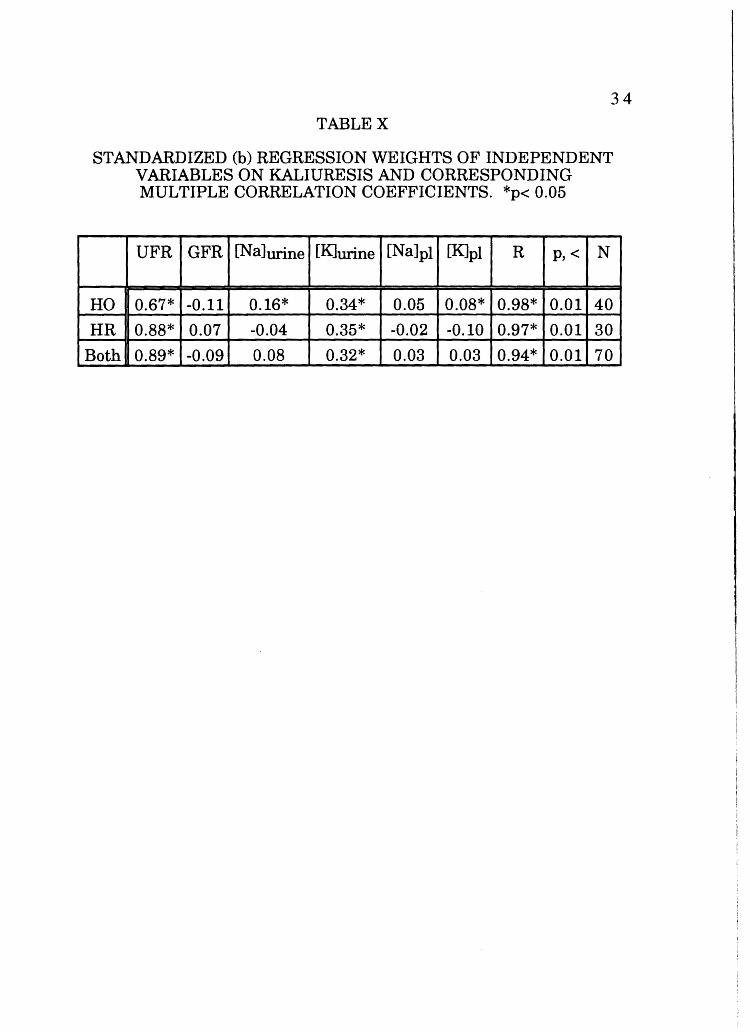
34
TABLEX
STANDARDIZED (b) REGRESSION WEIGHTS OF INDEPENDENT VARIABLES ON KALIURESIS AND CORRESPONDING MULTIPLE CORRELATION COEFFICIENTS. *p< 0.05
UFR GFR [Na]urine [KJurine [Na]pl [K]pl R p,< N
HO 0.67* -0.11 0.16* 0.34* 0.05 0.08* 0.98* 0.01 40
HR 0.88* 0.07 -0.04 0.35* -0.02 -0.10 0.97* 0.01 30
Both 0.89* -0.09 0.08 0.32* 0.03 0.03 0.94* 0.01 70
DISCUSSION
HEMATOCRIT
35
As hematocrit was not significantly different with respect to the
treatment, the increase of the plasma volume was consistent with respect
to the treatment groups.
INFUSION RATE
An important finding was for the most part UFRs, GFRs, ion
concentrations, and excretion rates were not correlated with infusion rate,
either during the infusion or the 90 min following. Renal negative feedback
systems were insensitive to rate of blood volume expansion. The two
exceptions of significant correlations had coefficients that were low; in each
case infusion rate accounted for less than 10% of the variation in the
dependent variable (Table III). Given the fact that 36 comparisons were
made, chance alone would have predicted that at least one if not two
correlations were significant. Overall, greater UFRs and GFRs at high
infusion rates and lower rates at lower infusion rates were expected.
Arterial blood pressure may be responsible for increases in GFR if these
increases are transmitted to glomerular beds. In B. marinus arterial blood
pressure does not increase (in fact it decreases slightly) with a 10% mass
iso- or hyperosmotic expansion via ventral abdominal venous cannulae at
rates that would translate to 5 to 25 ml kg-lhr-1 (Hillman, pers. comm.).
These rates are similar in magnitude to those used in this experiment.
Thus, for the present data, blood pressure increases may be dismissed as a
potential factor responsible for increases in glomerular filtration rate.

36
UFRandGFR
UFR
UFR differed significantly between the HO and HR groups. A strong
antidiuresis was observed in the HR group, as was observed by Hillman and
Schimpf ( 1994) in B. marinus and Stiffler et al. ( 1982) in Ambystoma
tigrinum, when using a 10% body weight hyperosmotic volume expansion.
The HR group, which received a hyperosmotic as well as volume stimulus,
responded to the osmotic stimulus preferentially, decreasing urine output
immediately (Figure 7) while increasing urine sodium concentration (Figure
4). The volume stimulus was present for both treatments, so the
antidiuresis is the result of increased osmotic concentration of the plasma.
Animals that received the HO volume expansion responded with a
marked diuresis, an effect also observed by Hillman and Schimpf(1994).
The difference in UFR between the groups is predominantly accounted for
by increased tubular reabsorption in the HR group, as there was only a
slight difference in GFR response relative to treatment (Figure 8). The
strong difference in UFR indicates that the HR group reabsorbed relatively
large amounts of water in order to affect the anti diuresis. This antidiuretic
response is similar to the decreased urine flow observed in animals removed
from water (Tufts and Toews 1986). This is due to the osmotic-stimulated
release of antidiuretic neurohypophyseal hormone, arginine vasotocin, A VT
(Levinsky and Sawyer 1953; Bentley 1969) The effect of AVT is reduction
of GFR via (1) vasoconstriction of the afferent arterioles (Richards and
Schmidt 1924; Sawyer, 1951; Pang et al., 1980), and (2) increased tubular
reabsorption of water in the tubules (Sawyer 1957).

37
It is interesting to note that Hillman and Schimpf ( 1994) observed an
increase in UFR with an isosmotic (0.8% saline) 10% mass expansion,
although not to the degree they observed with hypoosmotic expansion. This
indicates that at this level of osmotic stimulation, the animal will excrete
some of the excess water.
GFR
Uranga (1963) and Sawyer (1957) demonstrated a positive
correlation between plasma volume and GFR in Bufo arenarum The
current data show a similar GFR response to plasma volume expansion; in
all cases for both treatments, GFR initially increased.
Though ANCOVA indicates significant differences for GFR, the
overall response was fundamentally similar, and post hoc analyses
demonstrated GFRs were significantly different at 30 and 45 minutes post
infusion (Figure 8). GFR in vertebrates is regulated by vasomotor tone of
the afferent and efferent arterioles. In addition, it has been shown that
amphibians may vary the number of individual glomeruli functioning at any
one moment (Richards and Schmidt 1924; Forster 1942; and Schmidt
Nielsen and Forster 1954). These investigators all demonstrated that
amphibians vary the number of active glomeruli participating in plasma
ultrafiltration. An increased plasma volume may elicit this response. In
fact, Uranga (1965) showed that 1 % increase in plasma volume results in
an increase in renal plasma flow in Bufo arenarum without accompanying
increases in arterial blood pressure. Increases in arterial blood pressure are
prevented through the feedback of arterial baroreceptors. Increases in
pressure are sensed by baroreceptors in the pulmocutaneous artery (Van
Vliet and West 1986a). Feed back to peripheral vasculature via the

38
recurrent laryngeal nerve causes a decrease in systemic resistance (Ishii
and Ishii 1978; Van Vliet and West 1986b) to accommodate the increase in
arterial pressure. An increase in renal plasma flow without a concurrent
rise in arterial pressure would necessitate either an increase in the number
of active glomeruli or a decrease in renal vessel resistance in the beds
already open. Pressure in the renal circuit would be maintained (i.e., not
increase) because of the decrease in overall renal resistance when the
additional glomerular beds open or, for the second case, as vasorelaxation
occurs. The effect this decrease in renal resistance has on total peripheral
resistance and arterial pressure is not clear. It appears that additional
factors account for the lack of increase in arterial pressure, since the
glomerular capillary beds are a small portion of the entire systemic capillary
system, and thus account for a relatively small fraction of total peripheral
resistance.
A difference in GFR response was not observed until 30-45 minutes
post infusion. Persson and Persson (1981) discussed a tubuloglomerular
feedback mechanism in nephrons of Amphiuma where an increase in GFR
results in an increase in luminal chloride concentration. This chloride
increase is sensed by distal tubule cells (Persson and Marsh 1987) and
elicits a negative feedback vasoconstriction response on the afferent
arteriole, decreasing GFR (Persson and Persson 1981). The mechanism
employed by tubuloglomerular feedback is a possible explanation of the
observed difference in G FR. As the plasma of the HR group has a
significantly higher sodium chloride concentration, more NaCl is filtered.
Subsequently, the relative increase in distal delivery of Na Cl may be
sufficient to decrease GFR relative to the HO treatment.

39
Values observed for UFR were correlated with observed GFR values;
77% of the variation in UFR was due to GFR. To a large extent, glomerular
activity determined the urine volume produced by the animal. Tubules were
not effective at significantly altering this parameter when GFR was low. At
lower GFR values, the correlation is stronger (Figure 9) than at higher GFRs
where there is a divergence of the values of UFR between groups for similar
GFRs. The data show that UFR between groups was significantly different
and the overall GFR between groups was similar. This indicates at high
GFRs, the difference in urine production between the groups is a result of
tubular reabsorption. The present data are in agreement with Schmidt
Nielsen and Forster (1954), who determined diuresis is correlated with an
increase in GFR and a decrease in tubular reabsorption.
The correlation between these two variables was tighter for the HO
group (r=0.90) as compared to the HR treatment (r=0.82). This supports
the assertion, made above for the HR group, that the increased osmotic
pressure of the filtrate feeds back to depress GFR. It naturally follows that
the hypoosmotic group had a GFR that was more indicative of UFR.
ELECTROLYTES
Urine electrolyte concentration is a net result of: ( 1) the amount
filtered into Bowman's capsule space--a direct consequence of plasma
concentration; (2) tubular processes of reabsorption and secretion; and (3)
rate of flow of tubular filtrate.
Volume expansions of either hypo- or hyperosmotic nature present
fluid volume regulation mechanisms with dual stimuli. One of these is of

volume stimulus and the other is an osmotic stimulus, primarily due to
sodium concentration.
40
The HR group responded preferentially to the osmotic stimulus,
becoming oligouric. Precedence was placed on sodium plasma
concentration. The response to volume expansion was antidiuresis. The
increase in urine sodium concentration in the HR treatment group is
attributable to the plasma Na Cl load this group experienced. Due to the
indiscriminate nature of glomerular filtration, it is presumed that the
tubular load of sodium was greater in the HR treatment group. Tubule
sodium concentration and filtrate flow rates have a direct effect on the
amount of sodium reabsorbed in mammals (Guyton 1991). According to
Guyton, sodium is transported in mammalian proximal tubule cells via a
gradient-time transport mechanism. The transport depends on the lumen
tubule cell sodium concentration gradient as well as the amount of time the
filtrate is in the lumen (luminal flow rate). Distally, sodium transport is of
the more conventional type, i.e. tubular maximum transport rates are
based on the number of sodium pumps present. This may be the case for
amphibian transport processes as well.
At high flow rates, tubular uptake mechanisms may be unable to
remove the sodium present in the filtrate due to the high rate of filtrate flow
even though concentration is not sufficient for saturating transport
processes. Multiple regression for the hypoosmotic data supports this
(Table V). When UFR was elevated (30 minutes post infusion), urine
sodium concentration was also high (Figures 4 and 7). The occurrence of
high UFRs with high urine sodium concentrations (Figure 10) suggests that
the flow rate in the nephron may have overwhelmed the ability of the

41
luminal cell transport mechanisms to remove much sodium. At low UFRs,
as in the HR group (Figure 7), urine sodium was also high (Figure 4). This
suggests tubular sodium transport mechanisms were inhibited or saturated,
leaving more sodium in the urine. However, urine sodium levels may also be
due to increased flow rate. An apparent saturation kinetic response with
the accompanying high urine sodium concentration was observed by
Hillman and Schimpf (1994). Implications of this effect on organismal
sodium balance are discouraged as anurans may reclaim water and ions
from the bladder (Bentley 1966) as physiological needs dictate. This
apparent organismic "loss" of sodium is negated. This differs from
mammalian systems where bladder contents are not available for
reabsorption.
Natriuresis is the product of urine sodium concentration and urine
flow rate. For both treatments, these two variables were significant
contributors to natriuresis (Table IX). Results of multiple regression showed
a reversal in the dominance of UFR and urine sodium concentration in ·
determining natriuresis (Table IX) for the treatments. The natriuresis of
the HO group was determined mostly by the sodium concentration of the
urine, while depressed UFR was more instrumental in determination of
natriuresis for the HR group. The HR group had low UFRs, so the sodium
uptake mechanisms were likely saturated for the urine to contain such large
quantities of sodium (Figure 4). Natural expansions of blood volume for B.
marinus are hypoosmotic (i.e., cutaneous or bladder influx of water), which
would increase plasma volume and decrease plasma osmotic pressure. The
situation of saline loading is not a natural one for these animals, but it
allows for consideration of effects of volume expansion with the presence of

42
an osmotic stimulus. Hillman and Schimpf(1994) expanded the blood
volume of B. marinus isosmotically and observed an intermediate response
of UFR and natriuresis, relative to hypo- and hyperosmotic expansions.
The HO treatment yielded relatively high sodium concentrations in
the urine at 30 minutes post infusion, which was when UFR peaked for this
group. With high UFRs, filtrate flow rates may be sufficient to overcome
transport and end up in the urine. In blood volume expanded dogs, an
increase in natriuresis has been observed (Bahlmann et al. 1967; Rector et
al. 1964) and determined to be a result of diminished tubular reabsorption
(Rector et al. 1964), confirming either transport saturation or increased
filtrate flow allowing sodium to bypass transport processes.
For the HR group, potassium concentrations in the urine were
significantly higher than the values observed for the HO treatment. An
effect that may be partially responsible is the action of N a/K exchange
transporters. These transport proteins are located in the basolateral
membranes of luminal cells. Since the basolateral pumps would have
increased activity due to the high sodium filtrate concentration, more
potassium would be present in the intracellular space. With a high
intracellular potassium concentration, more potassium is present to diffuse
down concentration gradients, namely into the luminal space. This
increased concentration of potassium may facilitate the lumenward
diffusion necessary to achieve the observed high potassium urine
concentrations.
In the HO group, it is interesting that high UFRs coincided with an
increased urine potassium concentration (Figure 11). This is similar to the

43
condition of urine sodium concentration. This suggests that the toads may
be unable to conserve ions renally at high urine flow rates.
As kaliuresis is the product ofUFR and urine potassium
concentration, it is little surprise that the HO group showed such a great
increase in kaliuresis at 30 min post infusion, when UFR was maximal.
Multiple regression showed that urine flow rate was the most heavily
weighted independent variable in detennination of kaliuresis, with urine
potassium second (Table XI). Except at 30 min, both groups decreased
kaliuresis during the experiment, an overall conservation of this important
ion.

44
SUMMARY
The most surprising result was the apparent lack of effect of rate of
infusion on UFR, G FR, and ion excretion rates both in short term (during
infusion) and long term (90 min) situations. It seemed rate of volume
expansion was not crucial in the determination of observed responses.
UFR and GFR were highly correlated with each other for both
treatments. At high GFRs, there is a divergence of data for UFR, the
difference between treatments is apparent. Indications are that at high
G FRs, the difference between UFR response is due to tubular processes.
The urine volume produced by the HR group was less than half that
produced by the HO group. Tubular uptake mechanisms must account for
the difference in UFR response, since G FR response was fundamentally the
same with respect to an initial increase to similar values (Figure 8). The
difference was that the HR group displayed a faster decline following the
initial rise. As GFR for the HR group rose initially, the volume stimulus
initially overrode the osmotic stimulus in determining GFR. Decreased urine
volume in HR group, coupled with the high sodium load, worked
synergistically to give the observed high urine sodium concentration. The
HR group responded to the osmotic and volume stress by excreting
significantly higher sodium concentrations in urine while becoming
increasingly anuric.
In the HO group, GFR and UFR increased. An increase in water
concentration for this group may be the reason for this classic diuretic
response to decreased plasma solute loads. In response to volume
expansion and a reduced plasma sodium concentration, the homeostatic

45
priority was to return the plasma volume to a lower level, disregarding the
accompanying sodium loss. The volume stimulus resulted in an override of
sodium conservation mechanisms (Figure 10).
As volume expansions likely stimulate the release of ANF (DeBold
1985), it must be considered to play a role in effecting the natriuresis at
least for the HO expansion. Assays for circulating ANF levels in both HO
and HR expansion would be of interest. ANF may be responsible for some of
the natriuresis in the hypoosmotic group, if so, however, it's "control" is
overridden in the HR group, as the natriuresis was not nearly so pronounced
(Figure 12).
From an organismal perspective, terrestrial amphibians experience
hypoosmotic blood volume expansion as a result of transcutaneous and
bladder water uptake. Renal responses to this expansion have been
delineated in this paper. However, the overall organismal effect of renal
responses are not obvious. The ability to reasbsorb water and solutes from
the bladder could modify the urine solute and water concentration, therefore,
net solute and water excretion are not directly measured by renal responses.

46
REFERENCES CITED
ADOLPH, E. F., 1927. The excretion of water by the kidneys of frogs. Am.
J. Physiol. 81:315-324.
BAHLMANN, J., S. J. MC DONALD, M. G. VENTON, and H. E. DE WARDENER,
1967. The effect of urinary sodium excretion of blood volume
expansion without changing composition of blood in the dog. Clin. Sci.
32: 403-413.
BENTLEY, P. J., 1966. The physiology of the urinary bladder of Amphibia.
Biol. Rev. 41:275-316.
BENTLEY, P. J., 1969. Neurohypophysial function in amphibia: Hormone
activity in the plasma. J. Endocrinol. 43:359-369.
BENTLEY, P. J., 1973. Osmoregulation in the aquatic urodeles Amphiuma
means (the Congo eel) and Siren lacertina (the mud eel). Effects of
vasotocin. Gen. Comp. Endocrin 20:386-391.
BENTLEY, P. J., 1976. Hormones and Osmoregulation in Comparative
Vertebrate Endocrinology. Pages 275-308. Cambridge University
Press. Cambridge, London, New York, Melbourne.
BOULPAEP, E. L., 1971. Electrophysiologic properties of the proximal tubule:
importance of intercellular transport and extracellular pathways.
Pages 91-118. in G. GIEBISCH, ed. Electrophysiology of Epithelial
Cells. Symp. Med. Hoechst. Stuttgart-Schattauer.
DE BOLD, A. J., 1985. Atrial natriuretic factor: a hormone produced by the
heart. Science 230:767-770.
DIETZ, J. R., 1984. Release of natriuretic factor from rat heart-lung
preparation by atrial distension. Am. J. Physiol. 24 7 (Regulatory
Integrative Comp. Physiol. 16): R1093-1096.

47
ELIASSEN E., and C. B. J0RGENSEN C.B. ,1951. The effect of increase in
osmotic pressure of the body fluid on the water balance of anurans.
Acta. Physiol. Scand. 23:143-151.
FORSTER, R. P., 1938. Use of inulin and creatinine as glomerular filtrate
measuring substances in the frog. J. Cell. Comp. Physiol. 12(2):213-
222.
FORSTER, R. P., 1942. The nature of the glucose reabsorptive process in the
frog renal tubule: Evidence for intermittency of glomerular function in
the intact animal. J. Cell. Comp. Physiol. 20:55-69 (5).
GRANDCHAMP, A., and E. L. BOULPAEP, 197 4. Pressure control of sodium
reabsorption and intercellular backflux across the proximal kidney
tubule. J. Clin. Invest. 54:69-82.
GUYTON, A. C., 1991. Textbook of Medical Physiology, eighth edition. W. B.
Saunders Company. Philadelphia.
HENDRIX, J.P., B. B. WESTFALL, and A. N. RICHARDS, 1937. Quantitative
studies of the composition of glomerular urine. XIV. The glomerular
excretion ofinulin in frogs andNecturi. J. Biol. Chem. 116:735.
HILLMAN, S.S., 1978a. Some effects of dehydration on internal distributions
of water and solutes inXenopus laevis. Comp. Biochem. Physiol.
61A: 303-307.
HILLMAN, S. S., 1978b. The roles of oxygen delivery and electrolyte levels in
the dehydrational death of Xenopus laevis. J. Comp. Physiol. 128:169-
175.
HILLMAN, S.S., 1980. Physiological correlates of differential dehydration
tolerance in anuran amphibians. Copeia. 1:125-129.

48
HILLMAN, S.S., and P. C. WITHERS, 1988. The hemodynamic consequences
of hemorrhage and hypernatremia in two amphibians. J. Comp.
Physiol. 157B:807-812.
HILLMAN, S.S., and B. SCHIMPF, 1994. Renal responses to blood volume
expansion of varying osmotic concentrations and atriopeptin infusion
in two species of amphibian, Bufo marinus and Rana catesbeiana.
Physiol. Zool. 67(4):995-1005.
HILLMAN, S. S., 1P. C. WITHERS, M. S. HEDRICK, and P. B. KIMMEL, 1985.
The effects of erythrocemia on blood viscosity, maximal systemic
oxygen transport capacity and maximal rates of oxygen consumption
in an amphibian. J. Comp. Physiol. 155:577-581.
ISHII, K., and K. ISHII, 1978. A reflexogenic area for controlling the blood
pressure in toad (Bufo vulgaris formosa). Jap. J. Physiol. 28:423-431.
LANG, R. E., H. RUSKOAHO, M. TOTH, D. GANTEN, T. UNGER, and R. DIETZ,
1987. Mechanisms Controlling Release of Atrial Natriuretic Peptide.
in P. J. MULROW and R. SCHRIER, eds. Atrial Hormones and Other
N atriuretic Factors. Waverly Press Inc., Baltimore.
LEVINSKYN.G., and W. H. SAWYER, 1953. Significance of the
neurohypophysis in regulation of fluid balance in the frog. Proc.
Soc. Exp. Biol. Med. 82:272-274.
MAUDE, D. L., I. SHEHADEH, and A. K. SOLOMON, 1966. Sodium and water in
single perfused distal tubules of Necturus kidney. Am. J. Physiol.
221:1043-1049.
MIDDLER, S. A., C.R.. KLEEMAN, and E. EDWARDS, 1968. The role of the
urinary bladder in salt and water metabolism of the toad Bufo
marinus. Comp. Biochem. Physiol. 26:57-68.

49
MIDDLER, S. A., and C.R. KLEEMAN, 1973. Method of ureteral
catheterizaton and hypophysectomy of the toad. Pages 27 -39 in J. F.
GROSS, and E. WE'ITERER eds. Modem Techniques in Physiological
Sciences. Academic Press, London, New York, 1973.
MORRIS, J. L., and I. L. GIBBINS, 1983. Innervation of the renal vasculature
of the toad (Bufo marinus). Cell Tiss. Res. 231:357-376.
NAVAR, L. G., and A. C. GUYTON, 1975. Intrarenal mechanisms for
regulating blood fluid volume. in A. C. GUYTON, A. E. TAYLOR, and H.
J. GRANGER, eds. Circulatory Physiology II: Dynamics and control of
the body fluids. W. B. Saunders Company, Philadelphia.
PANG, P. K. T., S. M., GALLI-GALLARDO, N. COLLIE, and W. H. SAWYER,
1980. Renal and peripheral vascular responsiveness to arginine
vasotocin in the bullfrog Rana catesbeiana. Am. J. Physiol. 239:R156
-R160.
PERSSON, B. E., and D. J. MARsH, 1987. GFR regulation and flow-dependent
electrophysiology of early distal tubule of Amphiuma. Am. J.
Physiology. 253:F263-F268.
PERSSON, B. E., and A. E. G. PERSSON, 1981. The existence of a
tubuloglomerular feedback mechanism in the Amphiuma nephron.
Pflug. Archiv. 392(5):129-134.
RECTOR, F. C., JR., G. VAN GIESEN, F. KIIL, and D. W. SELDIN, 1964.
Influence of expansion of extracellular volume on tubular
reabsorption of sodium independent of changes in glomerular filtration
rate and aldosterone activity. J. Clin. Invest. 43(3):341-356.

50
RICHARDS, A. N., and C. F. SCHMIDT, 1924. A description of the glomerular
circulation in the frog's kidney and observations concerning the action
of adrenalin and various other substances upon it. Am. J. Physiol.
71: 178-208.
RUIBAL, R., 1962. The adaptive value of bladder water in the toad Bufo
cognatus. Physiol. Zool. 35:218-223.
SAWYER, W. H., 1951. Effect of posterior pituitary extracts on urine
formation and glomerular circulation in the frog. Am. J. Physiol.
164:457-466.
SAWYER, W. H., 1957. Increased renal reabsorption of osmotically free
water by the toad Bufo marinus in response to neurohypophyseal
hormones. Am. J. Physiol. 189(3):564-568.
SCHMIDT-NIELSEN, B., and R. P. FORSTER, 1954. The effect of dehydration
and low temperature on renal function in the bullfrog. J. Cell. Comp.
Phys. 44:233-246.
SPOTILA, J. R., and E. N. BERMAN, 1976. Determination of skin resistance
and the role of the skin in controlling water loss in amphibians and
reptiles. Comp. Biochem. Physiol. 55:A407-411.
STIFFLER, D. F., B. J. ATKINS, L. D. BURT, and S. C. ROACH, 1982. Control
of renal function in larvalAmbystoma tigrinum. J. Comp. Physiol.
149:91-97.
SULLIVAN, J ., 1968. Electrical potential differences across distal renal
tubules of Amphiuma. Am. J. Physiol. 214:1096-1103.
TUFTS, B. L ., and D. P. TOEWS, 1986. Renal function and acid base balance
in the toad Bufo marinus during short term dehydration. Can. J. Zool.
64: 1054-1067.

5 1
URANGA, J., 1963. The influence of changes in plasma volume on GFR and
ureteral pressure in the toad. Acta physiol. lat. amer. 13: 177-183.
URANGA, J., 1965. Relationship between plasma volume and plasma flow in
the toad. Acta physiol. lat. amer. 15:215-217.
VAN VLIET, B. N., and N. H. WEST, 1986a. Response characteristics of
pulmocutaneous arterial baroreceptors in the toad, Bufo marinus.
J. Physiol. 388:55-70.
VAN VLIET, B. N., and N. H. WEST, 1986b. Cardiovascular responses to
electrical stimulation of the recurrent laryngeal nerve in conscious
toads (Bufo marinus ). J. Comp. Physiol. 156:363-375.
WILBRANDT, W., 1938. Electrical potential differences across the wall of the
kidney tubules of Necturus. J. Cell. Comp. Physiol. 11:425-431.
YATZIDIS, H. 1976. Simplified determination of plasma inulin in testing
kidney function. Clin. Chem 22:1239.