Renaissance Star Charts - Anna F. Herlihy
24
4 • Renaissance Star Charts Anna Friedman Herlihy 99 Between the early fifteenth and the early seventeenth cen- turies, star charts progressed from imprecise, often deco- rative illustrations based on medieval manuscripts to sophisticated map projections with systematized nomen- clature for the stars. The reimportation into Europe of technical classical texts such as Ptolemy’s Almagest, as well as Islamic works such as Abu ¯ al-H . usayn Abd al- Rah . ma ¯ n ibn Umar al-S . u ¯ fı ¯’s constellation maps, appears to have played a significant role in this transformation. By the early sixteenth century, with the publication of Al- brecht Dürer’s pair of maps in 1515, the most popular format for small celestial maps was definitively set: two hemispheres, north and south, on some sort of polar pro- jection. Around the turn of the seventeenth century, when Johannes Bayer published his 1603 Uranometria, the ba- sic star atlas format was solidified, with one page for each constellation and perhaps a few hemispherical charts covering larger regions of the sky. The revolutionary star charts of Conrad of Dyffenbach and the earliest of Paolo dal Pozzo Toscanelli’s comet maps mark the beginning of a new focus on a more pre- cise representation of the night sky than had previously been apparent in medieval manuscripts. Three distinct traditions for Renaissance star charts emerged: decora- tive—in which star positions do not conform to observ- able star patterns; rigorous—where star positions more accurately reflect the star patterns in the night sky and attention to mathematical and scientific precision; and specialized—where star maps help record celestial phe- nomena and/or new discoveries or demonstrate prac- tical uses for the stars. By the end of the sixteenth cen- tury, the decorative tradition began to wane, although the others coexisted throughout the Renaissance and beyond. Many factors came into play in the evolution of Re- naissance star maps, in addition to classical and Islamic scientific texts. Medieval manuscripts set the stage for all three traditions. 1 Globes influenced star charts, pro- viding new information and artistic styles. Star charts likewise influenced globes. 2 Astrolabes also played a role in the evolution of star charts, providing a model of the stereographic projection. As was the case in much of cartography in general, makers often drew upon the work of their predecessors for both technical data and artistic style, with certain works reflecting moments of break- through and the founding of new traditions. Historiography Despite the recent publication of a number of lavish illus- trated books intended for a general public audience, 3 the study of Renaissance star charts (and indeed star charts in general) has been largely neglected by the scholarly I would like to thank Elly Dekker for her invaluable feedback and comments on the draft of this chapter, especially regarding the Hip- parchus rule, and for several additional references of which I was un- aware. I would also like to thank the Adler Planetarium & Astronomy Museum History of Astronomy Department for providing space, time, and resources to work on parts of this chapter. A note on terminology: given the lack of consensus on the proper term for a two-dimensional rendering of the stars (among the options— star/celestial /astronomical chart and star/celestial /astronomical map), “star chart” and “star map” are used interchangeably in this chapter; “celestial and astronomical chart /map” refers, in my opinion, to a much broader category of maps than those of the stars. Abbreviations used in this chapter include: Globes at Greenwich for Elly Dekker et al., Globes at Greenwich: A Catalogue of the Globes and Armillary Spheres in the National Maritime Museum, Greenwich (Ox- ford: Oxford University Press and the National Maritime Museum, 1999), and Adler for the Adler Planetarium & Astronomy Museum, Webster Institute for the History of Astronomy, Chicago. 1. In this chapter I attempt to partially redress the omission of a com- plete discussion of medieval European star charts in volume 1 of The History of Cartography series. 2. Although the main focus of this chapter remains star charts, globes are introduced into the discussion as appropriate due to the overlap- ping and complementary histories of these two forms of maps of the stars. 3. For example, see (in chronological order): George Sergeant Snyder, Maps of the Heavens (London: Deutsch, 1984); Giuseppe Maria Sesti, The Glorious Constellations: History and Mythology, trans. Karin H. Ford (New York: Harry N. Abrams, 1991); Carole Stott, Celestial Charts: Antique Maps of the Heavens (London: Studio Editions, 1991); Peter Whitfield, The Mapping of the Heavens (San Francisco: Pome- granate Artbooks in association with the British Library, 1995); and Marc Lachièze-Rey and Jean-Pierre Luminet, Celestial Treasury: From the Music of the Spheres to the Conquest of Space, trans. Joe Loredo (Cambridge: Cambridge University Press, 2001).
description
Αστρονομία
Transcript of Renaissance Star Charts - Anna F. Herlihy

4 • Renaissance Star ChartsAnna Friedman Herlihy
99
Between the early fifteenth and the early seventeenth cen-turies, star charts progressed from imprecise, often deco-rative illustrations based on medieval manuscripts to sophisticated map projections with systematized nomen-clature for the stars. The reimportation into Europe oftechnical classical texts such as Ptolemy’s Almagest, aswell as Islamic works such as Abu al-H. usayn �Abd al-Rah.man ibn �Umar al-S. ufı’s constellation maps, appearsto have played a significant role in this transformation. Bythe early sixteenth century, with the publication of Al-brecht Dürer’s pair of maps in 1515, the most popularformat for small celestial maps was definitively set: twohemispheres, north and south, on some sort of polar pro-jection. Around the turn of the seventeenth century, whenJohannes Bayer published his 1603 Uranometria, the ba-sic star atlas format was solidified, with one page for eachconstellation and perhaps a few hemispherical chartscovering larger regions of the sky.
The revolutionary star charts of Conrad of Dyffenbachand the earliest of Paolo dal Pozzo Toscanelli’s cometmaps mark the beginning of a new focus on a more pre-cise representation of the night sky than had previouslybeen apparent in medieval manuscripts. Three distincttraditions for Renaissance star charts emerged: decora-tive—in which star positions do not conform to observ-able star patterns; rigorous—where star positions moreaccurately reflect the star patterns in the night sky and attention to mathematical and scientific precision; andspecialized—where star maps help record celestial phe-nomena and/or new discoveries or demonstrate prac-tical uses for the stars. By the end of the sixteenth cen-tury, the decorative tradition began to wane, althoughthe others coexisted throughout the Renaissance andbeyond.
Many factors came into play in the evolution of Re-naissance star maps, in addition to classical and Islamicscientific texts. Medieval manuscripts set the stage for all three traditions.1 Globes influenced star charts, pro-viding new information and artistic styles. Star chartslikewise influenced globes.2 Astrolabes also played a rolein the evolution of star charts, providing a model of thestereographic projection. As was the case in much of cartography in general, makers often drew upon the work
of their predecessors for both technical data and artisticstyle, with certain works reflecting moments of break-through and the founding of new traditions.
Historiography
Despite the recent publication of a number of lavish illus-trated books intended for a general public audience,3 thestudy of Renaissance star charts (and indeed star chartsin general) has been largely neglected by the scholarly
I would like to thank Elly Dekker for her invaluable feedback andcomments on the draft of this chapter, especially regarding the Hip-parchus rule, and for several additional references of which I was un-aware. I would also like to thank the Adler Planetarium & AstronomyMuseum History of Astronomy Department for providing space, time,and resources to work on parts of this chapter.
A note on terminology: given the lack of consensus on the properterm for a two-dimensional rendering of the stars (among the options—star/celestial /astronomical chart and star/celestial /astronomical map),“star chart” and “star map” are used interchangeably in this chapter;“celestial and astronomical chart /map” refers, in my opinion, to a muchbroader category of maps than those of the stars.
Abbreviations used in this chapter include: Globes at Greenwich forElly Dekker et al., Globes at Greenwich: A Catalogue of the Globes andArmillary Spheres in the National Maritime Museum, Greenwich (Ox-ford: Oxford University Press and the National Maritime Museum,1999), and Adler for the Adler Planetarium & Astronomy Museum,Webster Institute for the History of Astronomy, Chicago.
1. In this chapter I attempt to partially redress the omission of a com-plete discussion of medieval European star charts in volume 1 of TheHistory of Cartography series.
2. Although the main focus of this chapter remains star charts, globesare introduced into the discussion as appropriate due to the overlap-ping and complementary histories of these two forms of maps of thestars.
3. For example, see (in chronological order): George Sergeant Snyder,Maps of the Heavens (London: Deutsch, 1984); Giuseppe Maria Sesti,The Glorious Constellations: History and Mythology, trans. Karin H.Ford (New York: Harry N. Abrams, 1991); Carole Stott, CelestialCharts: Antique Maps of the Heavens (London: Studio Editions, 1991);Peter Whitfield, The Mapping of the Heavens (San Francisco: Pome-granate Artbooks in association with the British Library, 1995); andMarc Lachièze-Rey and Jean-Pierre Luminet, Celestial Treasury: Fromthe Music of the Spheres to the Conquest of Space, trans. Joe Loredo(Cambridge: Cambridge University Press, 2001).

community.4 Celestial globes, on the other hand, havebeen more extensively researched.5 This is, to a large extent, the result of a historiographical separation of two-dimensional and three-dimensional material. Thehistory of celestial globes has tended to be subsumed bythe study of globes in general, whereas celestial charts are infrequently discussed in general histories of two-dimensional cartography. This division of globes andcharts has carried over into the popular literature as well,where the broad term “celestial cartography” has beenprimarily applied to star charts, with a limited inclusionof globes and other types of celestial charts. Occasionally,however, scholarly studies of celestial material havebridged this divide.6
Historians of art and astronomy have contributed thegreatest numbers of works about star charts, many, if notmost, of which are cited in this chapter. Prior to 1979,however, no specialized catalog of celestial cartographywas published.7 To be sure, there were some early attemptsat general histories, but these suffer from inaccuracies andoften limited information. For example, in his 1932 workAstronomical Atlases, Maps and Charts: An Historicaland General Guide, Brown asserts that “the earliest actualmap of the heavens, with figures of constellations shownand the stars of each group marked with any precision,appears to be that of Peter Apian”—one of many grosserrors in the volume.8 In addition to star charts, Browndoes, however, include sections on many other types ofcelestial cartography excluded from most later generalworks on “celestial charts” or “celestial cartography.”
In 1979, Warner authored The Sky Explored: CelestialCartography 1500–1800. Although its scope was pri-marily limited to star charts (including specialized starcharts such as comet path maps) and a few important celestial globes, her work provided a sound foundationupon which future scholars could build.9 Yet despite thisgroundbreaking work, new scholarship on star charts issparse. Journal articles, both pre- and post-Warner, haveprovided detailed research on particular makers andthemes, most notably those by various authors on theDürer hemispherical maps and their manuscript prede-cessors and Dekker’s many articles; exhibit catalogs haveprovided brief accounts of a number of other charts.10
100 The History of Renaissance Cartography: Interpretive Essays
4. There are many examples, of which only a few are mentioned: The History of Cartography series neglected to cover medieval starcharts in volume 1. Leo Bagrow, in History of Cartography, rev. andenl. R. A. Skelton, trans. D. L. Paisey, 2d ed. (Chicago: Precedent Pub-lishing, 1985), makes but two fleeting references to celestial globes.Norman J. W. Thrower, although regularly discussing the contributionsof astronomy and astronomers to terrestrial mapping in Maps & Civi-lization: Cartography in Culture and Society, 2d ed. (Chicago: Univer-sity of Chicago Press, 1999), rarely mentions any sort of celestial mapor globe, except for brief discussions of the contributions of EdmondHalley and a slightly more extensive discussion of lunar maps, startingwith Galileo and ending with modern technology; his only two celestialillustrations are both lunar maps. A survey of all issues of Imago Mundi
finds that only a handful of articles have been written about any aspectof celestial cartography, half of which are about celestial globes. In a rel-atively recent guide to map terminology, Wallis and Robinson relegate“astronomical maps” to “maps of natural phenomena” rather than cat-egorizing them as a major “type of map,” as they do celestial globes;Helen Wallis and Arthur Howard Robinson, eds., Cartographical In-novations: An International Handbook of Mapping Terms to 1900(Tring, Eng.: Map Collector Publications in association with the Inter-national Cartographic Association, 1987), 135–38.
5. Much of this work has been done in journals such as Der Globus-freund, with more recent work in catalogs; see, for example, Globes atGreenwich or Peter van der Krogt, Globi Neerlandici: The Productionof Globes in the Low Countries (Utrecht: HES, 1993).
6. For example, see Zofia Ameisenowa, The Globe of Martin Bylicaof Olkusz and Celestial Maps in the East and in the West, trans. An-drzej Potocki (Wrociaw: Zakiad Narodowy Imienia Ossolinskich,1959); Deborah Jean Warner, The Sky Explored: Celestial Cartography,1500–1800 (New York: Alan R. Liss, 1979); Rochelle S. Rosenfeld,“Celestial Maps and Globes and Star Catalogues of the Sixteenth andEarly Seventeenth Centuries” (Ph.D. diss., New York University, 1980);and many of the works of Elly Dekker, in particular “Der Himmels-globus—Eine Welt für sich,” in Focus Behaim Globus, 2 vols. (Nurem-berg: Germanisches Nationalmuseums, 1992), 1:89–100, and “An-dromède sur les globes célestes des XVIe et XVIIe siècles,” trans. LydieÉchasseriaud, in Andromède; ou, Le héros à l’épreuve de la beauté, ed.Françoise Siguret and Alain Laframboise (Paris: Musée duLouvre / Klincksieck, 1996), 403–23.
7. Many of the major Renaissance works are cited in Ernst Zinner,Geschichte und Bibliographie der astronomischen Literatur in Deutsch-land zur Zeit der Renaissance (1941; 2d ed. Stuttgart: A. Hiersemann,1964); however, this listing is not indexed or arranged by type of work,so it is impossible to tell which volumes contain celestial charts exceptin the occasional instances when Zinner annotates an entry. For me-dieval and early Renaissance manuscript charts and constellation draw-ings, see the four volumes of Fritz Saxl, Verzeichnis astrologischer undmythologischer illustrierter Handschriften des lateinischen Mittelalters:vol. 1, [Die Handschriften] in römischen Bibliotheken (Heidelberg: CarlWinters Universitätsbuchhandlung, 1915); vol. 2, Die Handschriftender National-Bibliothek in Wien (Heidelberg: Carl Winters Univer-sitätsbuchhandlung, 1927); vol. 3, in two parts, with Hans Meier,Handschriften in Englischen Bibliotheken (London: Warburg Institute,1953); and vol. 4, by Patrick McGurk, Astrological Manuscripts in Ital-ian Libraries (Other than Rome) (London: Warburg Institute, 1966).The latter two volumes have the series title translated into English asCatalogue of Astrological and Mythological Illuminated Manuscripts ofthe Latin Middle Ages. For both medieval and Renaissance sources, seealso A. W. Byvanck, “De Platen in de Aratea van Hugo de Groot,” Me-dedelingen der Koninklijke Nederlandsche Akademie van Wetenschap-pen 12 (1949): 169–233.
8. Basil Brown, Astronomical Atlases, Maps and Charts: An Histori-cal and General Guide (London: Search, 1932), 13. The well-known1515 Dürer hemispherical maps predate the Apian map, as do severalimportant manuscript maps. Interestingly, Brown laments the general ne-glect of celestial cartography within both academic and collecting circles.
9. Warner’s work should, however, be used with caution, as manymore star charts have come to light since its publication more than aquarter century ago.
10. Useful museum catalogs include: Celestial Images: AstronomicalCharts from 1500 to 1900 (Boston: Boston University Art Gallery,1985); Focus Behaim Globus, 2 vols. (Nuremberg: Germanisches Na-tionalmuseums, 1992); Anna Felicity Friedman [Herlihy], Awestruck bythe Majesty of the Heavens: Artistic Perspectives from the History of As-tronomy Collection (Chicago: Adler Planetarium & Astronomy Mu-seum, 1997); and the online catalog Out of this World: The Golden Ageof the Celestial Arts (Kansas City, Mo.: Linda Hall Library, ongoing),<http://www.lindahall.org/pubserv/hos/stars/>.

Medieval and Renaissance StarKnowledge and Representation
measuring and plotting star locations
Very few medieval star maps can be considered scien-tifically rigorous.11 Late medieval astronomers did con-duct some direct observation of the sky, especially ofcomets and eclipses and for time-finding purposes, butmost astronomical scholarship was literary and mathe-matical in nature, derived from texts translated from orbased on classical works as well as a few Arabic ones.12
Many, if not most, of the constellation illustrations thataccompanied medieval astronomical and astrologicaltexts were intended as decorative illustration, not some-thing that an astronomer or student would take outsideand compare to the sky.13 Since astronomers, astrologers,students, and others rarely conducted actual observationof the sky during this period, the decorative images suf-ficed, even for such weighty scientific texts as Ptolemy’sAlmagest.
There are early indications of a move toward scien-tifically rigorous mapping of the sky in a handful of Ara-bic-influenced manuscripts dating from the late medievalperiod. With very few exceptions, medieval and Renais-sance mapmakers did not look at the stars and directlysketch the patterns they were seeing to create a new map;instead, scientific star mapping was a process of indirectobservation. Mapmakers or astronomers used the coor-dinates listed in a star catalog to plot star positions ontoa map grid. In many cases, however, they did not evencreate original maps, but copied from earlier maps orglobes, bypassing both star catalogs and observation ofthe sky.
To create a new star chart prior to Tycho Brahe’s pub-lication of his catalog of stars, astronomers and map-makers relied on existing star catalogs that were essentiallyversions of the star catalog contained in Ptolemy’s Al-magest but updated to account for the effects of preces-sion. Such catalogs often contained errors due to inaccu-rate precessional calculations or miscopied or misreadvalues. In essence, medieval and some early Renaissancemapmakers relied upon the eyes of classical scholars fortheir star positions.
By the early Renaissance, several astronomers began tofocus on observational astronomy, and enough observa-tions were conducted to determine that there were seriousproblems with practicing an astronomy that relied on antiquated sources.14 Finally, in the late 1500s, after hun-dreds of years of reliance on outdated stellar measure-ments, Tycho Brahe undertook his project to reobserveand measure the position of every visible star with newand significantly more accurate instruments, creating astar catalog so momentous that it made its way into celestial globes and star charts circulated around Europe
through manuscript versions before the catalog had evenbeen printed. It must be noted that prior to about 1660,all astronomers used the naked eye (aided by instrumentssuch as the cross staff, torquetum, and quadrant—nottelescopes) to determine positions of celestial bodies.15
internal versus external perspective and the hipparchus rule
From antiquity until well into the seventeenth century,scholars envisioned the stars as being located on a spheresurrounding the earth (with, post-Copernicus, the solarsystem at its center). This gave rise to two possible waysto map the stars, either from inside the sphere, as seenfrom a point standing on the earth looking up at the sky,or from outside the sphere, as if looking down upon thesurface of a celestial globe. The resulting “internal” and
Renaissance Star Charts 101
11. In this chapter I attempt to address the assertion by many recentauthors that scientifically rigorous manuscript maps of the heavens werecommonplace or widespread. Such maps are the exception rather thanthe rule. Both Warner, in Sky Explored, xi, and Wallis and Robinson,in Cartographical Innovations, 136, erroneously assert that in medievalconstellation images the stars were often correctly positioned.
12. For more on astronomical scholarship and teaching in the MiddleAges, see Olaf Pedersen, “European Astronomy in the Middle Ages,” inAstronomy before the Telescope, ed. Christopher Walker (New York:St. Martin’s, 1996), 175–86, and Michael Hoskin and Owen Gingerich,“Medieval Latin Astronomy,” in The Cambridge Illustrated History ofAstronomy, ed. Michael Hoskin (Cambridge: Cambridge UniversityPress, 1997), 68–97.
13. One of the few well-documented instances of early medieval starviewing concerned the monastic practice of timekeeping after dark.Monks kept time by watching certain constellations. Gregory of Tourscreated and illustrated his own constellations for this purpose in thesixth century in his “De cursu stellarum,” although it is unclear whethercreating such constellations was common practice or an unprecedentednovelty. See Stephen C. McCluskey, “Gregory of Tours, Monastic Time-keeping, and Early Christian Attitudes to Astronomy,” Isis 81 (1990):9–22; republished in The Scientific Enterprise in Antiquity and theMiddle Ages: Readings from Isis, ed. Michael H. Shank (Chicago: Uni-versity of Chicago Press, 2000), 147–61. A later instance concerns theuse of the Pole Star and a Ursa majoris to tell the time at night, docu-mented as early as 844 in the writing of Pacificus of Verona. See JoachimWiesenbach, “Pacificus von Verona als Erfinder einer Sternenuhr,” inScience in Western and Eastern Civilization in Carolingian Times, ed.Paul Leo Butzer and Dietrich Lohrmann (Basel: Birkhäuser, 1993),229–50. In general, however, such explicit references to observation ofthe stars and realistic illustrations are rare from this time.
14. For details about some of these men, see N. M. Swerdlow, “As-tronomy in the Renaissance,” in Astronomy before the Telescope, ed.Christopher Walker (New York: St. Martin’s, 1996), 187–230. There issome evidence for star charts drawn in the early Renaissance with orig-inal observations, for example, the comet maps of Paolo dal PozzoToscanelli, some of which feature carefully plotted star positions.
15. Telescopes were, however, used from the early seventeenth cen-tury on for the observation of the moon and stars. For a detailed ac-count of the instruments of observation during the classical, medieval,and Renaissance periods, see J. A. Bennett, The Divided Circle: A His-tory of Instruments for Astronomy, Navigation and Surveying (Oxford:Phaidon, Christie’s, 1987), esp. 7–26.
“external” perspectives become an issue in looking at starcharts.16
A result of this issue relates to the orientation of the figures depicted in star charts and globes. The so-calledHipparchus rule, described by Hipparchus in the secondcentury b.c. (although it may be from an even earliersource), prescribed that human constellation figuresshould be depicted such that when observed from Earth,the front of the figure faces the viewer. Thus figures onexternal perspective charts and on celestial globes shouldbe depicted from the back.17 Problems arose with adher-ence to this rule, although for the most part, Renaissancecelestial cartography (both charts and globes) faithfullyfollowed it.18
precession of the equinoxes and epochs
Although the apparent positions of the stars are “fixed”with respect to one another, resulting in unchanging constellation patterns, the position of the celestial spherewith respect to the earth gradually shifts over a cycle of25,800 years because of the wobble of the earth’s axis, asif around a cone, due to differential gravity effects of thesun and moon. Thus the points at which the celestialequator crosses the ecliptic (the equinoxes) gradually driftwestward. Precession affects the stellar longitude at a constant rate (around one degree of change every seventyyears), but not stellar latitude. This resulting precessionof the equinoxes causes star maps to be useful for obser-vational purposes for only a limited time.
From Ptolemy on, astronomers had proposed variousvalues that could be added to celestial longitude to correct for the effects of precession. All these proposedcorrections were inaccurate to a greater or lesser degree;thus the accuracy of star charts for a particular date de-pended on which updated star catalog a mapmaker wasusing. This complicates determining the epoch (the actualdate that corresponds to the star positions on a map) ofany particular map; it can be dramatically different fromthe date of the making of the map (for example, althoughthe well-known Dürer et al. star maps are dated 1515,they were actually drawn for an epoch of ca. 1440).19 De-termining the epoch of a map can help to unravel whatstar catalog and precessional constant a mapmaker mayhave used in creating the map; determining the epochs ofsimilar maps can help to trace whether their makers wereusing the same star catalog.
new constellations and astronomicaldiscoveries
During the Middle Ages, the constellations depicted fol-lowed the text that they were illustrating—the forty-eightPtolemaic constellations, the forty-four of Aratus, the
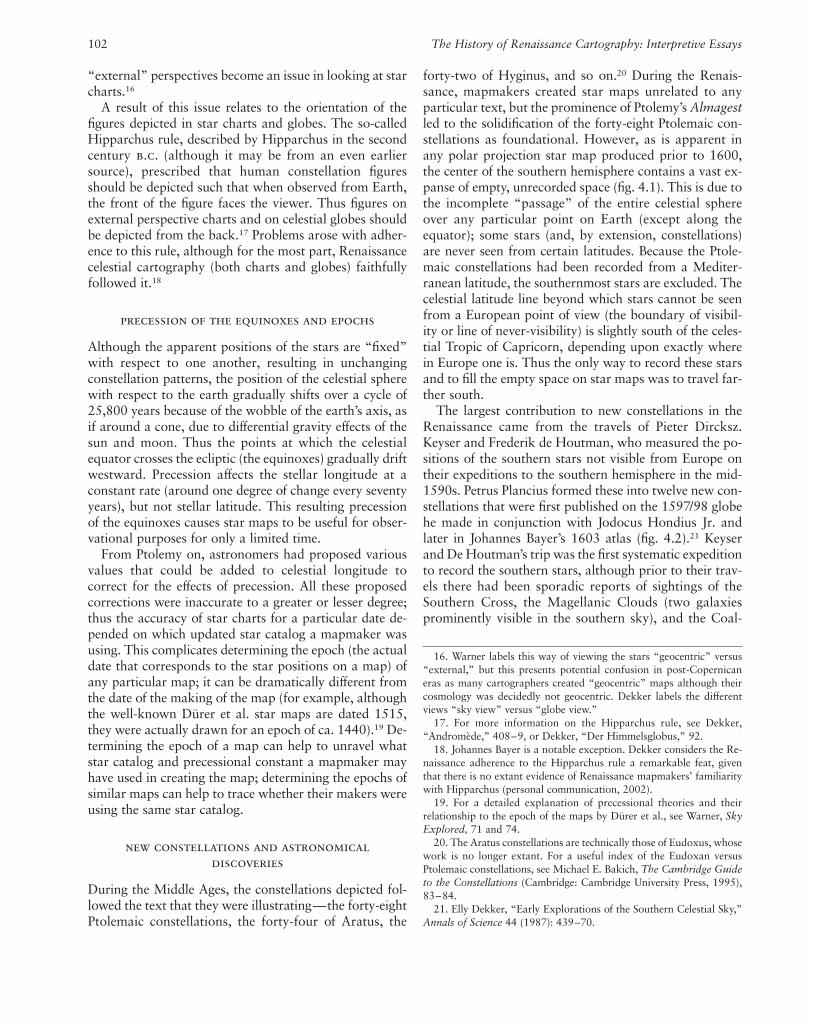
forty-two of Hyginus, and so on.20 During the Renais-sance, mapmakers created star maps unrelated to anyparticular text, but the prominence of Ptolemy’s Almagestled to the solidification of the forty-eight Ptolemaic con-stellations as foundational. However, as is apparent inany polar projection star map produced prior to 1600,the center of the southern hemisphere contains a vast ex-panse of empty, unrecorded space (fig. 4.1). This is due tothe incomplete “passage” of the entire celestial sphereover any particular point on Earth (except along theequator); some stars (and, by extension, constellations)are never seen from certain latitudes. Because the Ptole-maic constellations had been recorded from a Mediter-ranean latitude, the southernmost stars are excluded. Thecelestial latitude line beyond which stars cannot be seenfrom a European point of view (the boundary of visibil-ity or line of never-visibility) is slightly south of the celes-tial Tropic of Capricorn, depending upon exactly wherein Europe one is. Thus the only way to record these starsand to fill the empty space on star maps was to travel far-ther south.
The largest contribution to new constellations in theRenaissance came from the travels of Pieter Dircksz.Keyser and Frederik de Houtman, who measured the po-sitions of the southern stars not visible from Europe ontheir expeditions to the southern hemisphere in the mid-1590s. Petrus Plancius formed these into twelve new con-stellations that were first published on the 1597/98 globehe made in conjunction with Jodocus Hondius Jr. andlater in Johannes Bayer’s 1603 atlas (fig. 4.2).21 Keyserand De Houtman’s trip was the first systematic expeditionto record the southern stars, although prior to their trav-els there had been sporadic reports of sightings of theSouthern Cross, the Magellanic Clouds (two galaxiesprominently visible in the southern sky), and the Coal-
102 The History of Renaissance Cartography: Interpretive Essays
16. Warner labels this way of viewing the stars “geocentric” versus“external,” but this presents potential confusion in post-Copernicaneras as many cartographers created “geocentric” maps although theircosmology was decidedly not geocentric. Dekker labels the differentviews “sky view” versus “globe view.”
17. For more information on the Hipparchus rule, see Dekker, “Andromède,” 408–9, or Dekker, “Der Himmelsglobus,” 92.
18. Johannes Bayer is a notable exception. Dekker considers the Re-naissance adherence to the Hipparchus rule a remarkable feat, giventhat there is no extant evidence of Renaissance mapmakers’ familiaritywith Hipparchus (personal communication, 2002).
19. For a detailed explanation of precessional theories and their relationship to the epoch of the maps by Dürer et al., see Warner, SkyExplored, 71 and 74.
20. The Aratus constellations are technically those of Eudoxus, whosework is no longer extant. For a useful index of the Eudoxan versusPtolemaic constellations, see Michael E. Bakich, The Cambridge Guideto the Constellations (Cambridge: Cambridge University Press, 1995),83–84.
21. Elly Dekker, “Early Explorations of the Southern Celestial Sky,”Annals of Science 44 (1987): 439–70.

fig. 4.1. CELESTIAL MAP BY JOST AMMAN. This map ex-hibits an unusual vertical arrangement that is also seen in itscompanion terrestrial map. The border, unusually decorativefor a celestial map from this time, features portraits of sixprominent ancient philosophers and a variety of scientific in-struments. The artistry of some constellations reflects those ofJohannes Honter, in that many of the characters are clothed.However, others, such as Orion, reflect the Dürer tradition.
Amman employs an external perspective and has added theconstellation Coma Berenices. Note that there is a large emptyspace in the center of the southern hemisphere; this is due tothe invisibility of that area of the sky from European latitudes.Ptolemaeus, Geographia, libri octo (Cologne, 1584). Photo-graph courtesy of the John Carter Brown Library at BrownUniversity, Providence.

sack nebula.22 Small, regional maps sometimes docu-mented these three celestial features. In northern skies,several comets and novae appeared during the Renais-sance; they were sometimes recorded on celestial globesand on star charts, but more often formed the basis forregional, topical star charts that focused on these unusualphenomena.23
Other new constellations were created during the Re-naissance in order to corporealize areas of stars that hadbeen recorded, but were noted as unformed or outside theboundaries of any particular Ptolemaic constellation. In1536, Caspar Vopel introduced Coma Berenices and An-tinous on a new globe. In 1589, Petrus Plancius and Ja-cob Floris van Langren added Crux and TriangulusAntarcticus, likewise on a globe. In 1592, Plancius cre-ated Columba and Polophylax on the inset celestial mapsof a larger world map. Plancius added nine biblical-
104 The History of Renaissance Cartography: Interpretive Essays
22. See Elly Dekker, “The Light and the Dark: A Reassessment of the Discovery of the Coalsack Nebula, the Magellanic Clouds and theSouthern Cross,” Annals of Science 47 (1990): 529–60, for an exten-sive account of the recording and mapping of the Southern Cross.
23. For a chronology of comets appearing over Europe in the Renais-sance, see Donald K. Yeomans, Comets: A Chronological History of Ob-servation, Science, Myth, and Folklore (New York: John Wiley and Sons,1991), 405–19, and Gary W. Kronk, Cometography: A Catalog ofComets (Cambridge: Cambridge University Press, 1999–), 1:260–347.
24. For a detailed listing of Plancius’s biblical constellations, seeWarner, Sky Explored, 206.
25. See Elly Dekker, “Conspicuous Features on Sixteenth Century Ce-lestial Globes,” Der Globusfreund 43– 44 (1995): 77–106 (in English
fig. 4.2. MAP OF THE NEW SOUTHERN CONSTELLA-TIONS. Shortly after Plancius and Hondius introduced con-stellations based on Keyser and De Houtman’s newly recordedsouthern stars, Johannes Bayer published this two-dimensionalversion. In addition to the twelve new constellations ofPlancius, Bayer includes the two Magellanic Clouds (labeled
“Nubacula Major” and “Nubacula Minor”), visible at thecenter of the map. It is unclear why he did not assign letters tothe stars in these new constellations, as he did throughout therest of his atlas.Johannes Bayer, Uranometria (1603). Photograph courtesy ofthe Adler.
themed constellations in 1612 on a globe produced inconjunction with Pieter van den Keere.24 Jakob Bartschreplaced Plancius’s Apes with his own Vespa in 1624, andIsaac Habrecht II introduced Rhombus (an early prede-cessor of Reticulum) on his celestial globe of 1625.25

Medieval Constellation Illuminations as Precursors to the Renaissance
Most early Renaissance constellation images derivedfrom medieval manuscript examples. Except for a fewmanuscripts based on the work of the Islamic astronomeral-S. ufı and the occasional planisphere and planisphere-like celestial depiction,26 European constellation imagesfrom the medieval period are not, in fact, maps, but in-stead are fanciful drawings with star configurations ren-dered in a manner that does not conform to the appear-ance of the stars in the sky. Typically, each constellationappears as a separate drawing, although some manu-scripts include a circular celestial image encompassing thevisible sky. In some illustrations, stars are placed withinconstellation figures according to mythological accountsof their position, in essence mapping the text rather thanthe sky; in other illustrations, stars are merely decorativeadditions that embellish the constellation figures. Manu-scripts also commonly featured constellation illustrationswithout any stars, but with only the mythological figures.
Throughout the Middle Ages, various astronomical,astrological, and mythological texts were illustrated withconstellation figures. The oldest images accompany ver-sions of the mythological “Aratea,”27 dating back at leastas far as the early ninth century, and they continued to bepopular texts until at least the seventeenth century (figs.4.3 and 4.4).28 Other texts illuminated with constellationfigures during the Middle Ages include the “Poeticon As-tronomicon” of Hyginus, Bede’s “De signis coeli” (oftenreferred to as the Pseudo-Bedan catalog), the “Liber introductorius” of Michael Scot, and the astronomicalwork of the ancient astronomer Nimrod.29
Most constellation images from the early medieval pe-riod tend to follow the model of the early “Aratea” manu-scripts in terms of the design of the figures, retaining a clas-sical aesthetic. As time progressed, constellation imagesbegan to reflect Romanesque and Gothic styles; as Islamicconstellation texts became available, certain Arabic attrib-utes began to be incorporated into constellation iconogra-phy.30 Some authors, such as Michael Scot, included atyp-ical constellations, such as Tarabellum and Vexillum, alongwith the traditional Aratean choices (fig. 4.5).31
By the late thirteenth century, a body of manuscriptsemerged that began to lean in the direction of scien-tifically rigorous maps of individual constellations, in thatthe positions of the stars reflected the actual patterns inthe sky, although without any sort of map projection.Called the Sufi Latinus corpus, they were derived from al-S. ufı’s constellation treatise, which included a completePtolemaic star catalog with individual constellationmaps.32 The earliest seems to have been derived from anow lost manuscript from Sicily (plate 3);33 others date tothe early years of the Renaissance. In the Sufi Latinusmanuscripts, the figures have been modified to fit a West-
Renaissance Star Charts 105
and German), for information on the depiction of Coma Berenices andAntinous on sixteenth-century celestial globes; see also her listing of newconstellations, including when and by whom they were introduced, inGlobes at Greenwich, 559–60.
26. The term “planisphere” should be used only in the specific senseof a representation based on the stereographic projection, as inPtolemy’s Planisphaerium. For many of the medieval and early Renais-sance maps that depict the entire visible sky, it is impossible to deter-mine if the projection was intended to be stereographic. In addition, cir-cular hemispherical maps in a projection other than the stereographichave also commonly been called planispheres in the past. In this chap-ter I use the term “planisphere-like map” to describe these two types ofcircular maps when a general descriptor is needed, as their overall cir-cular format and coverage of either the visible sky or each hemisphereis reasonably similar.
27. Three main versions of the astronomical myths of Aratus were usedduring the Middle Ages. They are commonly referred to as the AratusLatinus, the Germanicus Aratea, and the Ciceronian Aratea. For a gooddiscussion of the various Aratea versions and an annotated list of Car-olingian Aratus manuscripts, see Patrick McGurk, “Carolingian Astro-logical Manuscripts,” in Charles the Bald: Court and Kingdom, ed. Mar-garet T. Gibson and Janet L. Nelson (Oxford: B.A.R., 1981), 317–32.
28. The earliest extant illustrated Aratea appears to be Vienna, Öster-reichische Nationalbibliothek, Cod. 387 (dated between 809 and 821);for many others, see the Aratus sections in the source lists of illustratedastronomical manuscripts in Byvanck, “De Platen in de Aratea,” 204 –33. Byvanck cites relevant catalog pages and illustrations for Saxl, vol.1, [Die Handschriften] in römischen Bibliotheken, and vol. 2, DieHandschriften der National-Bibliothek in Wien, among other sec-ondary source materials. See also Alfred Stückelberger, “Sternglobenund Sternkarten: Zur wissenschaftlichen Bedeutung des Leidener Ara-tus,” Museum Helveticum 47 (1990): 70–81; revised and published inAntike Naturwissenschaft und ihre Rezeption 1–2 (1992): 59–72.
29. For numerous illustrations, see the four Saxl volumes and also By-vanck, “De Platen in de Aratea,” 204 –33. For a discussion of Bede’s“pseudepigrapha,” including De signis coeli, see Charles William Jones,Bedae Pseudepigrapha: Scientific Writings Falsely Attributed to Bede(Ithaca: Cornell University Press, 1939). For a detailed study on one ofthe Michael Scot manuscripts, see Ulrike Bauer [Bauer-Eberhardt], DerLiber introductorius des Michael Scotus in der Abschrift Clm 10268 derBayerischen Staatsbibliothek München (Munich: Tuduv-Verlagsge-sellschaft, 1983). For a brief description of Nimrod’s constellation im-ages, see Charles Homer Haskins, Studies in the History of MediaevalScience (1924, reprinted New York: Frederick Ungar, 1960), 338– 41;Haskins reports that of the two manuscripts he discusses, only one (MS.Lat. VIII 22, at the library of St. Mark’s in Venice) has illustrations.
30. For a useful account of stylistic and iconographic changes in con-stellation renderings throughout the Middle Ages, see Erwin Panofskyand Fritz Saxl, “Classical Mythology in Mediaeval Art,” MetropolitanMuseum Studies 4 (1933): 228–80, esp. 230– 41.
31. Bauer, Michael Scotus; Franz Boll, Sphaera: Neue griechischeTexte und Untersuchungen zur Geschichte der Sternbilder (Leipzig:B. G. Teubner, 1903), 439– 49; and Lynn Thorndike, Michael Scot(London: Thomas Nelson and Sons, 1965), 100–102.
32. Emilie Savage-Smith, “Celestial Mapping,” in HC 2.1:12–70,esp. 60. For detailed information on the Sufi Latinus corpus, see PaulKunitzsch, “The Astronomer Abu ’l-H. usayn al-S. ufı and His Book onthe Constellations,” Zeitschrift für Geschichte der Arabisch-IslamischenWissenschaften 3 (1986): 56 –81, or idem, “S.ufı Latinus,” Zeitschriftder Deutschen Morgenländischen Gesellschaft 115 (1965): 65–74.
33. BNF (Arsenal MS. 1036 [Bologna, ca. 1270]). See Kunitzsch,“Astronomer Abu ’l-H. usayn al-S. ufı,” 74.
ern European aesthetic to varying degrees, but all retainArabic iconographic and stylistic influence to a greater or

lesser extent.34 Like the al-S. ufı maps, these renderingsalso include a numbering system for the stars corre-sponding to that of the Ptolemaic star catalog and a grad-uation of sizes of stars, reflecting different magnitudes.
In addition to the manuscripts derived from al-S. ufı,medieval circular celestial charts constitute a rudimentarytype of map. The majority mapped the relationship of neighboring constellations, and in this capacity theylack stars (fig. 4.6). The earliest map of this type, in an“Aratea” manuscript, dates to 818, and examples of suchcharts, in varying stages of complexity, appeared until the early years of the Renaissance.35 Most include circlesrepresenting the tropics, equator, or ecliptic, and someseem to have been constructed using a rough version ofthe stereographic projection.36 Some are divided intonorthern and southern hemispheres; others depict onlythe portion of the sky visible from a typical European lat-itude (from either the north ecliptic or equatorial pole tothe boundary of visibility). Such maps also vary betweeninternal and external perspective. One unusual variant, in
106 The History of Renaissance Cartography: Interpretive Essays
34. Kunitzsch classifies them into four groups. See Kunitzsch, “As-tronomer Abu ’l-H. usayn al-S. ufı,” 68–71.
35. Munich, Bayerische Staatsbibliothek (Clm. 210). For more infor-mation on such charts, see Saxl, Die Handschriften der National-Bibliothek in Wien, 19–28, or Savage-Smith, “Celestial Mapping,” 13–17 (both also include the relationship of such charts to similar Islamic examples).
36. For a diagram of such charts, see Savage-Smith, “Celestial Map-ping,” 15 and fig. 2.3.
37. Stiftsbibliothek St. Gallen, Switzerland (Cod. Sangall. 902). Thismanuscript is pictured in Saxl, Die Handschriften der National-Bibliothek in Wien, 22.
an “Aratea” manuscript that dates from ca. 900, uses anequatorial projection of sorts.37
Advances in Two-Dimensional Mapping
It seems that it was not until the early fifteenth century thatrigorous star maps appeared with map grids and preciselyplaced stars, despite the availability in Europe (via Moor-ish Spain) as early as the tenth century of astrolabes, whichprovided a model of the stereographic projection, and Is-
fig. 4.3. AQUARIUS FROM ARATUS, “PHAENOMENA,”MANUSCRIPT. The printed version of the constellationAquarius seen in figure 4.4 derives directly from this Leiden“Aratea” manuscript predecessor. Most of the stars, especiallythose in the stream of water, are merely decorative; others,however, do correspond to mythological descriptions of starplacement within this constellation, although not to their ac-tual patterns in the sky.Size of the original: 17.5 � 15.3 cm. Photograph courtesy of theUniversiteitsbibliotheek Leiden (MS. Voss. Lat. Q 79, fol. 48v).
fig. 4.4. AQUARIUS FROM ARATUS, PHAENOMENA,PRINTED VERSION BY HUGO GROTIUS. Compare figure4.3.Aratus of Soli, Syntagma Arateorum opus antiquitatis et as-tronomiae studiosis utilissimum . . . , ed. Hugo Grotius (Lei-den: Christophorus Raphelengius, 1600). Photograph cour-tesy of the Adler.

lamic and classical resources such as al-S. ufı and Ptolemyfrom the late thirteenth century. The earliest extant two-dimensional star maps other than astrolabes with identifi-able projections appear to be those in the Vatican librarymanuscript attributed to the copyist Conrad of Dyffen-bach and dated 1426.38 This manuscript contains fourmaps that chart a limited number of stars with sketched-in outlines of selected constellations (fig. 4.7). The star cat-alog information derives from Gerard of Cremona’s Latintranslation of an Arabic version of Ptolemy’s Almagest; theconstellations do not seem to have been influenced by thework of al-S. ufı.39 Numbers indicate the positions of thestars and represent their magnitudes. Three of the mapsemploy unusual trapezoidal projections that may havebeen developed based on the works of Hipparchus (trans-mitted through Arabic sources);40 these maps appear to
Renaissance Star Charts 107
fig. 4.5. MICHAEL SCOT’S CONSTELLATIONS TARA-BELLUM AND VEXILLUM. Scot’s “Liber introductorius,”an astronomical and astrological manuscript, enjoyed a cer-tain amount of popularity between the thirteenth and fifteenthcenturies; the particular copy in which these constellations ap-pear dates from the second half of the fifteenth century. Scotintroduced a number of unusual constellations not seen inother astronomical works. Tarabellum and Vexillum are bothlocated in the southern celestial hemisphere; the former is anawl, while the latter is a flag or banner.Photograph courtesy of the Pierpont Morgan Library, NewYork (MS. M.384, fol. 28).
fig. 4.6. MAP SHOWING GENERAL RELATIONSHIP OFCONSTELLATIONS TO ONE ANOTHER FROM ATENTH-CENTURY ARATUS MANUSCRIPT. This map,while not showing star positions, conveys the general rela-tionship of one constellation to another in the sky. The con-stellations are arranged according to an internal perspective,and the figures are facing forward following the Hipparchusrule. The map is constructed with the center on the eclipticpole; the celestial equator is indicated by the offset circle.Size of the original: 37 � 28.5 cm; diameter: ca. 23.5 cm. Photograph courtesy of the Burgerbibliothek, Bern (Cod. 88,fol. 11v).
38. Vatican City, Biblioteca Apostolica Vaticana (Codex Palat. Lat.1368), 63r, 63v, 64r, and 64v. For detailed information on these maps,see Dana Bennett Durand, The Vienna-Klosterneuburg Map Corpus ofthe Fifteenth Century: A Study in the Transition from Medieval to Mod-ern Science (Leiden: E. J. Brill, 1952), 114 –17, and Saxl, [Die Hand-schriften] in römischen Bibliotheken, 10–15. Two are illustrated in Du-rand, pl. I, the other two in Saxl, pl. XI. See also John Parr Snyder,Flattening the Earth: Two Thousand Years of Map Projections (Chi-cago: University of Chicago Press, 1993), 9 and 29–30.
39. Kunitzsch, “Astronomer Abu ’l-H. usayn al-S. ufı,” 67, n. 36.Kunitzsch corrects Saxl’s assertion that the style of the constellations exhibits Arabic influence.
40. Durand, Vienna-Klosterneuberg, 115.41. Durand suggests that this projection may have come from an Ara-
bic source, possibly Abu al-Rayh. an Muh.ammad ibn Ah.mad al-Bırunı(Vienna-Klosterneuberg, 116).
have had no influence on other contemporary charts. Thefourth map is a circular map drawn using the azimuthalequidistant projection and centered on the ecliptic pole.41

fig. 4.7. TRAPEZOIDAL PROJECTION MAP FROM 1426BY CONRAD OF DYFFENBACH. One of the four earliest ex-tant, nonastrolabic star maps, this map curiously uses thetrapezoidal projection, one usually reserved for smaller arearegional maps. It shows a portion of the ecliptic (Sagittarius,Capricorn, Aquarius, and Pisces) and several surrounding con-
stellations (for example, the Great Square of Pegasus asterismis indicated above Pisces). The star positions are indicated withnumbers that correspond to their magnitude.Photograph © Biblioteca Apostolica Vaticana, Vatican City(Codex Palat. Lat. 1368, fol. 64v).

The circular Conrad of Dyffenbach map may haveserved as a model for later polar projection maps of thenorth and south celestial hemispheres, such as the morecomplete and elaborate maps of ca. 1440 occasionally attributed to Johannes von Gmunden (they were pro-duced in Vienna and are hereafter referred to as the Vi-enna maps); the Vienna manuscript also contains indi-vidual maps of each constellation with star lists.42 TheVienna maps also use the Ptolemaic star catalog as the basis for star positions—each star is numbered to corre-spond to the Ptolemaic catalog. This numbering featurewas present on individual-constellation maps in medievalEuropean copies of al-S. ufı manuscripts as well as originalIslamic al-S. ufı manuscripts.43 Despite their overall West-ern appearance, the Vienna maps manifest Arabic influ-ence in certain iconographic attributes of constellations.44
They also adhere to the Hipparchus rule, faithfully show-ing the constellations from their backs, given that these areexternal perspective charts (which is notable given that Is-lamic cartographers regularly ignored the Hipparchusrule).45 The Vienna maps appear to have influenced sev-eral celestial globes, including that of Hans Dorn from1480 and that of Johannes Stöffler from 1493.46
Around the turn of the sixteenth century, polar pro-jection star maps shifted from the equidistant to thestereographic projection, which had been well estab-lished centuries earlier on astrolabes.47 This change to the stereographic is exhibited by the next extant maps inthe early Renaissance chronology—a pair of northernand southern hemispheres from 1503 (now in Nurem-berg, and hereafter referred to as the Nuremberg maps).48
These planispheres seem to be derived from a map in the tradition of the ca. 1440 Vienna maps; they share the epoch 1424 as well as similar artistry and a star-numbering system that corresponds to that used in thePtolemaic catalog. There may also be evidence for at least one other pair of manuscript maps in this tradi-tion, said to have been owned by Johannes Regiomon-tanus, and perhaps also a set that predates the ca. 1440Vienna maps.49
Individual-Constellation Illustrationsin the Early Renaissance
By the beginning of the fifteenth century, the rendering ofindividual constellations had split into two strains: onecontinued in the decorative tradition of the Middle Ages,while the other began to render star positions in keepingwith the actual appearance of the night sky. Both tradi-tions seem to have been influenced by Islamic maps andglobes and the reimportation of classical authors, al-though to different extents.
Decorative manuscript images of individual constella-tions began to coalesce into a more uniform iconography,
regardless of which text they were illustrating.50 Reflect-ing Renaissance scholars’ renewed interest in the scholar-ship of the classical period, the selection of illuminatedtexts narrowed: Caius Julius Hyginus and the Germani-cus edition of the “Aratea” predominated, with occasionalreference to works by other authors, such as the “Astro-nomicon” by the Renaissance humanist Basinio daParma.51 As with earlier medieval illustrations, certainconstellation figures manifest Islamic attributes, but theoverall aesthetic followed Western European traditions.
Early Renaissance illuminations that did indeed mapthe stars as seen in the sky were comparatively rare, aswas the case with medieval manuscripts. Several maps ofthe Sufi Latinus corpus of manuscripts date to the earlyRenaissance.52 Other manuscript maps of individual constellations from the Renaissance, which depict rea-
Renaissance Star Charts 109
42. Vienna, Österreichische Nationalbibliothek (Cod. 5415). Durandattributes these maps to “Magister Reinhardus” at Salzburg in 1434(Vienna-Klosterneuberg, 116). For more information, see Saxl, DieHandschriften der National-Bibliothek in Wien, 25 and 150–55, andpls. IX and X.
43. Such as Paris, Bibliothèque Nationale (Arsenal MS. 1036).44. Kunitzsch, however, asserts that they are not part of the Sufi La-
tinus corpus (“Astronomer Abu ’l-H. usayn al-S. ufı,” 6 n. 3).45. Elly Dekker, “From Blaeu to Coronelli: Constellations on Seven-
teenth-Century Globes,” in Catalogue of Orbs, Spheres and Globes, byElly Dekker (Florence: Giuti, 2004), 52–63, esp. 56, and Savage-Smith,“Celestial Mapping,” 60–61.
46. Dekker, “Andromède,” 409. The Stöffler globe also exhibits in-fluence from Hyginus constellation illustrations, and there is also ananonymous globe influenced by these maps. The Dorn globe was ownedby Martin Bylica and is described in detail in Ameisenowa, Globe ofMartin Bylica; see esp. 36 – 41 for the relationship to the Vienna maps,and see also Savage-Smith, “Celestial Mapping,” 60–61.
47. Very few polar projection maps used the equidistant projectionafter this point, most notably those of Peter Apian, Lucas Jansz.Waghenaer, and Johannes Bayer.
48. Germanisches Nationalmuseum; see Focus Behaim Globus, 2:519–21, and W. Voss, “Eine Himmelskarte vom Jahre 1503 mit denWahrzeichen des Wiener Poetenkollegiums als Vorlage Albrecht Dür-ers,” Jahrbuch der Preussischen Kunstsammlungen 64 (1943): 89–150.For an English account of these charts and their relationship to a nonex-tant celestial globe that belonged to Conrad Celtis, professor at the Uni-versity of Vienna around the turn of the sixteenth century, and also tothe celestial globe of Martin Bylica, see Ameisenowa, Globe of MartinBylica, 47–55.
49. Ameisenowa, Globe of Martin Bylica, 40.50. McGurk, Astrological Manuscripts in Italian Libraries, xxi.51. McGurk, Astrological Manuscripts in Italian Libraries, xxi.
McGurk also lists copies of Michael Scot, Ludovicus de Angulo, and theAlphonsine Tables as other illustrated fifteenth-century manuscripts,with limited copies of the Aratus Latinus and the Ciceronian Aratea,and no copies of the Carolingian Pseudo-Bedan and anonymous starcatalogs.
52. Such as the Vienna and the Catania; for Vienna (MS. 5318[1474]), see Saxl, Die Handschriften der National-Bibliothek in Wien,132– 41, and for Catania (MS. 85 [fifteenth century]), see McGurk, As-trological Manuscripts in Italian Libraries, 10–16.

sonably accurate star configurations, do not seem to bestylistically influenced by the al-S. ufı maps.53
The presence of individual-constellation star maps thatcorresponded to actual star configurations had little impacton printed constellation images during the earliest years ofthe Renaissance. Such illustrations continued in the decora-tive tradition, with Hyginus and Aratus manuscripts pre-dominating as sources for constellation information. Thisattests to an interest in the constellation myths in those pub-lications rather than any scientific content pertaining to ob-serving the sky. Erhard Ratdolt appears to have been thefirst to publish constellation illustrations in 1482 in an edi-tion of Hyginus’s Poeticon astronomicon. Although no onehas identified a particular manuscript that served as a modelfor Ratdolt’s illustrations, the figures in several Renaissanceconstellation manuscripts exhibit similarities to his fig-ures.54 Ratdolt’s edition served, in turn, as a model for manyother illustrated editions of both the Poeticon astronomiconand Aratus’s Phaenomena.55
Astrological texts, on occasion, also included constel-lation illustrations, especially for sections on the zodiac.For example, Ratdolt’s 1489 edition of a Latin translationof the Kitab al-qiranat (Book of conjunctions) by AbuMa�shar Ja�far ibn Muh.ammad al-Balkhı illustrates thezodiacal constellations with the woodblocks used in his1485 edition of Hyginus’s text.56 Although most earlyprinted constellation images seem to be limited to eitherthe Hyginus or Aratus texts or images derived from them,there appear to be at least a few works that contain illus-trations of some of the anomalous constellations reportedby Michael Scot.57
The impact of printing on the dissemination of text andimage turned the Poeticon Astronomicon and Phaeno-mena into popular Renaissance texts. It was not until1540, with the publication of Alessandro Piccolomini’sstar atlas (discussed later), that the stellar placementswithin printed individual maps of the constellations re-sembled those seen in the night sky. The copying of manuscript sources for constellation illustrations con-tinued even as late as 1600 with the publication of HugoGrotius’s elaborate edition of the Phaenomena. The artistJacob de Gheyn III made nearly exact renderings of the il-lustrations contained in a Carolingian Aratus manuscript,the Leiden “Aratea” (figs. 4.3 and 4.4).58
Early Renaissance Printed Planispheresand Planisphere-like Maps
As with the first printed constellation illustrations, thefirst printed planisphere-like map followed an older me-dieval model that predated the Islamic-influenced ad-vances in celestial mapping of the early fifteenth century.Contained in the aforementioned Pisanus edition of thePhaenomena,59 it may be traceable to particular manu-
script sources, although it is a mirror image of possiblemodels.60 Like its sources, the planisphere-like map lacksstars and simply shows the general arrangement of theconstellation figures, with the north celestial pole at thecenter and the boundary of visibility at the edge.61
110 The History of Renaissance Cartography: Interpretive Essays
53. For Vienna (MS. 5415), see Saxl, Die Handschriften der Na-tional-Bibliothek in Wien, 150–55. For information correcting Saxlabout this manuscript, see Kunitzsch, “Astronomer Abu ’l-H. usayn al-S. ufı,” 67 n. 36. For the fifteenth-century Florence manuscript, Bi-blioteca Nazionale Centrale (MS. Angeli 1147 A. 6), see McGurk, As-trological Manuscripts in Italian Libraries, 33.
54. Such as Vatican City, Biblioteca Apostolica Vaticana (Urb. Lat.1358), and Florence, Biblioteca Medicea Laurenziana (Cod. Plut. 89); seeSaxl with Meier, Handschriften in Englischen Bibliotheken, pt. 1, lvii–lviii.
55. For example, Thomas de Blavis, a fellow Venetian printer, copiedthe second edition (1485) of Ratdolt’s work, creating mirror images ofRatdolt’s constellations during the process of tracing them onto newwoodblocks. Many of these reversed (and artistically cruder) printingblocks were then used in a 1488 edition of the Phaenomena publishedby Antonius de Strata and edited by Victor Pisanus. Ara, Boötes, andthe Pleiades have been replaced with wood-engraved images, presum-ably because the publisher was lacking these particular woodblocks.These particular representations of Boötes and Ara deviate from thestandard models.
An unusual example of an early Poeticon astronomicon edition is onepublished by Melchior Sessa (Venice, 1512). A later edition was pub-lished in 1517 by Sessa with Pietro di Ravani. Many of the constellationillustrations differ dramatically from those by Ratdolt and his imitators.Some descriptions of star placements and numbers of stars have been al-tered to be in keeping with Ptolemaic star positions (the source for therevised star numbers and positions is unclear; they closely resemblethose of Ptolemy, but do not correspond exactly), and the illustrationsthat accompany these altered passages reflect the new text. Certainmaps, such as those for Ursa Major and Taurus, seem to reflect the in-fluence of direct observation of the night sky. Some constellations, how-ever, mimic earlier models, particularly those in the southernmost partof the sky; the illustrations for these constellations derive from Ratdolt.
56. Ten of the woodblocks are reused; the woodblock that fused the fig-ures of Scorpio and Libra was recut so as to create two separate illustrations.
57. Warner mentions an anonymous work, Astronomia Teutsch,Himmels Lauf, Wirckung unnd Natürlich Influenz der Planeten unndGestirn . . . (Frankfurt, 1578) that depicts Michael Scot’s constellationsTarabellum and Vexillum. She surmises that the anonymous Eyn newescomplexions-buchlein (Strassburg: Jakob Cammerlander, 1536), whichis an illustrated Michael Scot text, likewise contains images of these twoconstellations (Sky Explored, 272–73).
58. Leiden, Bibliotheek der Rijksuniversiteit (MS. Voss. Lat. Q. 79).Warner’s assertion that the de Gheyn illustrations derive from the Rat-dolt images is incorrect. For more information on the Leiden “Aratea,”see Ranee Katzenstein and Emilie Savage-Smith, The Leiden Aratea: An-cient Constellations in a Medieval Manuscript (Malibu, Calif.: J. PaulGetty Museum, 1988), and Dekker, “Blaeu to Coronelli.”
59. Warner, Sky Explored, 270.60. Possible models include the manuscript maps in the Pierpont
Morgan Library, New York (Giovanni Cinico, Naples, 1469), and theBL (Add. MS. 15819).
61. As happened with individual constellation images, this map wascopied and reprinted in other texts, such as Scriptores astronomici ve-teres, 2 vols. (Venice: Aldus Manutius, 1499). The map is not derivedfrom Ratdolt, as were the other illustrations in the volumes.

Albrecht Dürer was the first to publish scientifically rig-orous star charts in 1515; they derive from manuscriptsources—either the Vienna ca. 1440 maps or the Nurem-berg 1503 maps.62 Dürer created this pair of planispheresin collaboration with two mathematicians: JohannesStabius, who drew the coordinates, and Conrad Heinfo-gel, who positioned the stars; Dürer was responsible forthe artistry of the constellation figures surrounding thestars.63 Dürer’s charts closely resemble the manuscriptpredecessors, including his labeling of the stars with num-bers corresponding to those in the Ptolemaic catalog. As with the 1503 Nuremberg maps, they employ thestereographic projection. The corners of the northernmap contain drawings of four figures that reference theinfluence of classical and Arabic authors (Aratus, Mani-lius, Ptolemy, and al-S. ufı). The Dürer charts influenced the style of many subsequent planispheres and plani-sphere-like maps, individual-constellation maps, special-ized charts, and globes.64 In 1537, Gemma Frisius copiedDürer’s charts nearly exactly for a globe, creating essen-tially a three-dimensional version of the two maps fusedtogether along the ecliptic.65 François Demongenet, whoproduced celestial globes in 1552 and ca. 1560, appearsto have been influenced by the Dürer tradition, althoughhe added elements such as the hunting dogs of Boötes,Caspar Vopel’s constellation Antinous, and a figure in theconstellation Eridanus.66 Demongenet’s work in turnserved as source material for the elaborate celestial ceilingby Giovanni Antonio Vanosino (ca. 1575) in the Sala delMappamondo at Caprarola, as well as globes by a varietyof makers.67 The Dürer maps also helped to popularizethe representation of the constellation Lyra as a hybrid ofan eagle and a lyre; the roots for such iconography can betraced to Islamic influence.68
As popular as the Dürer charts, if not more so, was apair of planispheres by Johannes Honter, published ini-tially in 1532.69 Honter was obviously influenced by theDürer maps, but made significant changes. He reversedthe perspective of the stars from external to internal, aswell as changing the artistry to reflect a less classical aes-thetic. Curiously, Honter constructed these star charts
Renaissance Star Charts 111
62. Dekker mentions the source as “an earlier manuscript map dated1440” (presumably the Vienna Cod. 5415 maps); see Dekker, “Con-spicuous Features,” 81. Warner says that the source could be “the starcatalog and planisphere in the mid-fifteenth-century Viennese astro-nomical manuscript (Vienna Codex 5415)” or “the manuscript plani-sphere of 1503, drawn by an anonymous artist of Nuremberg in col-laboration with Conrad Heinfogel, Sebastian Sperantius, and TheodoreUlsenius.” This is because of similar mistakes in labeling the stars; seeWarner, Sky Explored, 71–75, quotations on 74. Ameisenowa surmisesthat Dürer’s model may have been a manuscript chart that is no longerextant (Globe of Martin Bylica, 40– 44). See also the extensive articlelinking Dürer’s work to the 1503 manuscript planisphere, Voss, “EineHimmelskarte vom Jahre 1503”; the detailed description of the chartsin Rosenfeld, “Celestial Maps and Globes and Star Catalogues,” 154–72;
and articles by Edmund Weiss, “Albrecht Dürer’s geographische, as-tronomische und astrologische Tafeln,” Jahrbuch der KunsthistorischenSammlungen des Allerhöchsten Kaiserhauses 7 (1888): 207–20, andGünther Hamann, “Albrecht Dürers Erd- und Himmelskarten,” in Al-brecht Dürers Umwelt: Festschrift zum 500. Geburtstag Albrecht Dürers am 21. Mai 1971 (Nuremberg: Selbstverlag des Vereins fürGeschichte der Stadt Nürnberg, 1971), 152–77.
63. The roles of the three men are clearly described in the attributionon the southern hemisphere map.
64. Maps include those by Eufrosino della Volpaia (1530), PeterApian (1536 and 1540), Caspar Vopel (1545), and several anonymousversions. Volpaia included non-Ptolemaic southern hemisphere stars ac-cording to Andrea Corsali. Apian’s original map, Imagines syderumcoelestium . . . (Ingolstadt, 1536), was reprinted as a volvelle in the As-tronomicum Caesareum (Ingolstadt, 1540), which was an importantwork in the history of astronomy, filled with volvelles (mostly plane-tary). In contrast to Dürer, however, Apian employed the polar equidis-tant projection instead of the stereographic. Apian also slightly modi-fied Dürer’s figures, adding the hunting dogs to Boötes and a figure inEridanus; the hunting dogs had previously appeared on the 1493 man-uscript globe of Johannes Stöffler (for more information on this globe,see the entry by Elly Dekker in Focus Behaim Globus, 2:516 –18). TheApian map was copied in turn by James Bassantin in Astronomique dis-cours (Lyons, 1557); see Warner, Sky Explored, 10, and Dekker, “Con-spicuous Features,” 81. For a detailed account of Apian and his work,including his connections to Islamic source material, see Paul Kunitzsch,Peter Apian und Azophi: Arabische Sternbilder in Ingolstadt im frühen16. Jahrhundert (Munich: Bayerische Akademie der Wissenschaften,1986). Individual constellation maps include those by Heinrich Deci-mator (1587) and Zacharias Bornmann (1596). Specialized charts in-clude those of Cornelius Gemma (of the comet of 1577) and ThaddaeusHagecius ab Hagek (of the nova of 1572 and the comet of 1577). Fur-ther information on all two-dimensional maps cited in this note can befound in Warner, Sky Explored. The globes include, in addition to theGemma Frisius and Demongenet works mentioned in the text, one from1506 by Johannes Prätorius; see Dekker in Focus Behaim Globus, 2:637–38. For a study of six globes from the mid-sixteenth century, seeDekker, “Conspicuous Features,” in which she uses the Dürer maps asa basis for comparison.
65. The only significant difference is the constellation Eridanus; seeElly Dekker, “Uncommonly Handsome Globes,” in Globes at Green-wich, 87–136, esp. 87–91 (including complete photographic documen-tation); idem, “Conspicuous Features”; and Elly Dekker and Peter vander Krogt, “Les globes,” in Gérard Mercator cosmographe: Les tempset l’espace, ed. Marcel Watelet (Antwerp: Fonds Mercator, 1994), 242–67, esp. 263–66.
66. The 1552 gores included only the hunting dogs. For more on theDemongenet tradition, see Elly Dekker, “The Demongenet Tradition inGlobe Making,” in Globes at Greenwich, 69–74.
67. For other Demongenet-influenced globes, see Dekker, “Demon-genet Tradition,” 72. For more on the Caprarola celestial ceiling, seeLoren W. Partridge, “The Room of Maps at Caprarola, 1573–75,” ArtBulletin 77 ( 1995): 413– 44; Kristen Lippincott, “Two AstrologicalCeilings Reconsidered: The Sala di Galatea in the Villa Farnesina andthe Sala del Mappamondo at Caprarola,” Journal of the Warburg andCourtauld Institutes 53 (1990): 185–207; and Deborah Jean Warner,“The Celestial Cartography of Giovanni Antonio Vanosino da Varese,”Journal of the Warburg and Courtauld Institutes 34 (1971): 336 –37.Vanosino also created the celestial ceiling in the Sala Bologna in the Vatican.
68. For more information on this particular manifestation of Lyra, seePaul Kunitzsch, “Peter Apian and ‘Azophi’: Arabic Constellations in Re-naissance Astronomy,” Journal for the History of Astronomy 18 (1987):117–24, esp. 122, or idem, Peter Apian und Azophi, 45–50.
69. Warner, Sky Explored, 123.

fig. 4.8. AN ASTROLABE-LIKE STAR MAP, 1596. Not onlya mapmaker, but an instrumentmaker as well, John Blagravedesigned this map as part of his work describing one of his in-ventions, the Uranical astrolabe. The design of the map reflectsthe rete of a traditional astrolabe. It is also a good example ofa single planispheric star map that shows only the sky visiblefrom Europe. Notice that the outside boundary is not theecliptic or celestial equator, as might have been expected at
this time, but instead a latitude somewhat south of the Tropicof Capricorn (which is not marked on this map because it is inecliptic rather than equatorial coordinates). Although in mostrespects the style of Blagrave’s figures follows Mercator, Lyrais quite different, looking somewhat like the Dürer model.Size of the original: ca. 25.7 � 25.7 cm. “Astrolabium vranicumgenerale” (London, 1596). Photograph courtesy of the BL(Harl. MS. 5935, fol. 14).

Renaissance Star Charts 113
with the coordinate system shifted by thirty degrees lon-gitude from what would have been correct for the date,putting the vernal equinox in the constellation Aries. It isunclear whether Honter intended the maps to be for anancient epoch or if this was an unintentional mistake. De-spite their lack of utility for the epoch in which they werepublished, this pair of maps was republished numeroustimes, in 1541, 1553, 1559, and 1576, as the woodblockschanged hands between various publishers.70 This mayindicate that the pair of maps was not actually used forserious scientific work, but rather was intended to merelyillustrate the classical texts they were accompanying,which included an edition of Ptolemy’s Almagest and sev-eral Aratea editions.71
The manuscript maps of the fifteenth century and thoseof Dürer and Honter mark a drastic change in the con-struction of star maps.72 These new, scientifically rigorousmaps plotted the stars according to the celestial coordi-nates assigned to them, resulting in significantly more ac-curate representations of stellar patterns. In addition, po-lar projection charts of the northern and southerncelestial hemispheres (either stereographic or equidistant)became the typical way in which mapmakers rendered theentire celestial sphere, in contrast to maps of individualconstellations that focused on small sections of the sky.73
Even at the end of the sixteenth century, when mapmak-ers began to use models other than Dürer or Honter, theystill regularly employed a pair of polar projections. Forexample, Thomas Hood’s maps from 1590 show the in-fluence of Gerardus Mercator’s celestial globe of 1551,but retain the double hemisphere format.
Occasionally, post-Dürer maps hearkened back to anearlier model, one often seen in manuscript planispheresand planisphere-like maps and likely influenced by astro-labe retes. A single polar projection map was drawn thatencompassed the entire visible sky rather than drawingtwo maps representing the entire sky (including thoseparts not visible). In contrast to astrolabe retes, however,such maps were not limited to the brightest stars and in-cluded constellation figures. The format made sense, be-cause at this time much of the center of the southernhemisphere maps (beyond the boundary of visibility forEuropeans) contained expanses of blank space as thesouthernmost stars had not been recorded adequately, ifat all. Peter Apian seems to have been the first to create adetailed map of this sort in 1536, followed by John Bla-grave in 1596 (fig. 4.8); such printed maps were relativelyrare in the Renaissance.74
Early Atlases
In 1540, Alessandro Piccolomini created what might becalled the first star atlas. Writing in the vernacular (Ital-ian, in this case) rather than Latin, Piccolomini sought to
expand his audience beyond scholarly confines. De lestelle fisse featured individual maps for each of the Ptole-maic constellations, rendered from an internal perspec-tive.75 In contrast to those who had produced earlierworks, however, Piccolomini charted the stars simply,with no adornment from constellation figures (fig. 4.9), afeature unique to atlases (although not single maps) untilthe late seventeenth century, except for Julius Schiller’spublished counterproofs (discussed later). Piccolomini’smaps lacked grid lines and were designed to be read withthe assistance of a device that would enable the user todetermine star positions.76 His atlas also attempted to create a system of nomenclature for the stars; in contrastto the Dürer charts and their manuscript predecessors,which assigned numbers to the stars, Piccolomini’s usedletters, with the brightest star typically labeled “a” andsubsequent letters assigned based on decreasing magni-tude, a system similar to that employed by Johannes Bayerover sixty years later.
Other attempts at star atlases followed those of Pic-colomini: Heinrich Decimator published Libellus de stel-lis fixis et erraticis in 1587, and Giovanni Paolo Galluccipublished Theatrum mundi, et temporis . . . in 1588. Al-though different in many respects, the two works, likelycreated independently despite their closeness in date, fea-ture grid lines and constellation figures, and would allowa user to locate star patterns or individual stars more eas-ily than Piccolomini’s atlas. Decimator’s charts seem tohave been copied from either a chart or globe in the Dürertradition, although from which specific work it is un-
70. The 1541 republication illustrated the Ptolemaic star catalog inClaudius Ptolemy, Omnia, quae extant opera, geographia excepta(Basel: Henrich Petri, 1541). Other republications are listed in Warner,Sky Explored, 123–26.
71. The Honter maps served as inspiration for a number of othermakers, including Adam Gefugius (1565), Lucilio Maggi (1565), JanJanuszowski (1585), and Simon Girault (1592); they also seem to haveinfluenced the style of certain figures (although not the overall star map)of Jost Amman (1564). See individual entries in Warner, Sky Explored.The Amman map is listed in Sky Explored, 274, as “Anonymous VII”;it has a terrestrial mate listed in Rodney W. Shirley, The Mapping of theWorld: Early Printed World Maps, 1472–1700, 4th ed. (Riverside,Conn.: Early World, 2001), 129 and 132 (no. 113), which mentions thecelestial companion.
72. For a brief discussion of the projections employed by these twocartographers, see Snyder, Flattening the Earth, 22–23.
73. Snyder asserts that the equidistant was “only half as popular forpolar celestial maps as the stereographic”(Flattening the Earth, 29).
74. See Savage-Smith, “Celestial Mapping,” 15, for a diagram of apolar stereographic projection as it pertains to a Byzantine map, whichalso helps to explain maps such as Blagrave’s that extend to the bound-ary of visibility.
75. For detailed information about Piccolomini and his atlas, see Ru-fus Suter, “The Scientific Work of Allesandro Piccolomini,” Isis 60(1969): 210–22.
76. Suter, “Allesandro Piccolomini,” 221.

clear.77 The stars seem to be numbered according to thePtolemaic catalog, although again there are variations.78
Information about the constellations, compiled from avariety of sources, accompanies each map.
Gallucci’s Theatrum mundi, et temporis is a compre-hensive six-book volume about astronomy and geogra-phy noted for its numerous volvelles.79 The maps aremore complicated than those of Decimator. Gallucci ren-dered the charts using a trapezoidal projection, and hesubstantially increased the number of grid lines over anymaps previously published, enabling the user to more eas-ily read star coordinate positions off of the charts. Theconstellation figures in this atlas are extremely rudimen-tary, rough outlines of the overall shapes of the figures,and their source is unclear. Some scholars have deemedGallucci’s atlas the first “true” star atlas, as rough coor-
dinates of the stars can be determined from the chartsthemselves without reference to a star catalog or otheraid.80 Yet, although Theatrum mundi, et temporis in-cluded a star catalog, there is no attempt at labeling thestars to correspond to the catalog, another feature thatwould have enhanced its utility. It was not until the nextcentury that all the sixteenth-century modifications de-signed to enhance practical use—internal perspective, asystem of stellar numbering/nomenclature, map grids,and scales, introduced by such cartographers as Dürer,Honter, Piccolomini, and Gallucci—would be synthe-sized into a single atlas.
Trends and Changes RegardingIconography and Format
The overall aesthetic of most celestial maps during thesixteenth and early seventeenth century appeared rela-tively similar whether their makers used Dürer, Honter,Mercator, or another artistic tradition as inspiration.There were some notable exceptions to the aesthetic ofelaborate constellation figures adorning the stars. Draw-ing perhaps upon Piccolomini’s charts that representedthe stars with no constellation figures, a few large-scalemaps were published in this spartan form. GuillaumePostel appears to have been the first to create a pair ofplanispheres, in 1553,81 followed by Lucas Jansz. Waghe-naer, whose popular navigational maps were first printedin 1584.82
Most sixteenth-century star charts illustrated the Ptole-maic constellations, with the exception of editions of Hy-ginus and Aratus. A few maps, however, began to includethe new constellations that had been introduced by suchmap and globe makers as Vopel and Plancius.83 At leastone chart, however, presented constellation figures never
114 The History of Renaissance Cartography: Interpretive Essays
77. There are slight differences between the Decimator charts and the Dürer charts. For example, in the Decimator charts Lyra lacksstrings and the face of Ophiuchus is quite different. The Decimatorcharts also contain an increased number of grid lines, similar to Dürertradition charts such as Warner’s “Anonymous III” or a globe (Sky Ex-plored, 271).
78. For example, Taurus has thirty-four stars numbered instead of thethirty-three on the Dürer charts.
79. Gallucci’s work was published in several editions (Warner, SkyExplored, 91).
80. For example, see Warner, Sky Explored, xi.81. In Guillaume Postel, Signorum coelestium vera configuratio aut
asterismus . . . (Paris: Jerome de Gourmont, 1553).82. Lucas Jansz. Waghenaer, Spieghel der zeevaerdt (Leiden: Christof-
fel Plantijn, 1584 –85); for more information and other editions, see C.Koeman, Atlantes Neerlandici: Bibliography of Terrestrial, Maritime,and Celestial Atlases and Pilot Books Published in the Netherlands Upto 1880, 6 vols. (Amsterdam: Theatrum Orbis Terrarum, 1967–85), 4:465–501.
83. For example, Coma Berenices appears in Amman (1564) andJanuszowski (1585), and Antinous appears on a Cornelius Gemmacomet chart of 1578 (discussed later in this chapter).
fig. 4.9. ORION, FROM THE FIRST EDITION OF PIC-COLOMINI’S DE LE STELLE FISSE, 1540. This atlas is un-usual for the time because the stars are unadorned with deco-rative constellation figures. It may have been the first work ofcelestial cartography intended specifically for a popular audi-ence; it was written in the vernacular (Italian, in this case) anddedicated to Lady Laudomia Forteguerri, with the intentionthat she (and others) use it to educate themselves about thestars. De le stelle fisse’s numerous republications in several lan-guages attest to its popularity. Note the three bright starsforming Orion’s belt in the center of the image (labeled c, d,and e).Photograph courtesy of the Adler.

before seen on European works: Peter Apian includedseveral traditional Bedouin constellations in the chart thatappeared in his Instrument Buch and Horoscopion.84
In the mid-sixteenth century, polar projection celestialmaps began to appear as small insets on maps of the world(for example, see fig. 3.9). Vopel seems to have been thefirst to include such charts on his large wall map of 1545.This map is now lost,85 but the Bernard van den Puttereissue of 1570 shows that, as with Vopel’s celestial globe,the original chart would likely have followed in the Dürertradition, with the addition of Vopel’s Coma Berenicesand Antinous; the 1570 reissue even goes so far as to in-clude mirror images of the four personages that inhabitthe corners of Dürer’s northern hemisphere map, al-though it is unknown whether this feature was present inthe original edition.
Soon thereafter, numerous mapmakers from all areasof Europe began including similar inset charts on theirworld maps, continuing this tradition well into the sev-enteenth century; many of these cartographers never pub-lished separately issued celestial charts of their own.86
Copies and reprintings of these and other similar mapscomprise at least several dozen known instances of starcharts inset into world maps from the mid-sixteenth tothe late seventeenth century.87
Nearly all star maps inset into world maps view the skyfrom an external perspective; early charts follow in thetradition of Dürer, while later charts draw upon thenewly created artistic traditions of such map and globemakers as Mercator, Hondius, and Blaeu.88 Only a fewemploy an internal perpective, most notably the ca. 1561map of Giacomo Gastaldi (but not the Matteo Pagano ca. 1550 copy of his 1546 map) and the 1582 map of Pos-tel; both cartographers used the Honter charts as sourcematerial for their insets. Gerard de Jode’s map includesonly one star map, rather than a pair, and it is renderedin what appears to be an oblique orthographic projectionto give it a globelike appearance. As cartographers draftednew constellations, they added them to the inset maps.89
Although small and often overlooked, star charts includedon world maps provided a widespread form of access tostellar information. During the first half of the seven-teenth century, they by far outnumbered separately issuedstar maps.
Despite the overwhelming popularity of the equatorialstereographic projection for world maps, there were fewattempts in the fifteenth and sixteenth centuries at creat-ing star maps that showed a large region of the sky in anyformat other than that of polar projections of the northand south celestial hemispheres. The equatorial formatwas not commonly seen until the mid- to late seventeenthcentury.90 One exception can be found in Globe dumonde, contenant un bref traité du ciel & de la terre(1592), a book designed by Simon Girault to teach as-tronomy to his children. In addition to including rough
copies of the Honter charts, Girault created a pair ofequatorial hemispherical maps (fig. 4.10). They are quitecrude, however and merely contain the outlines of the fig-ures without stars.91 Occasionally cartographers also em-ployed formats that gave their maps a globelike appear-ance; this seems to have been the case most often withmaps of comet paths.92 For regional maps, such as thosein atlases like Gallucci’s Theatrum mundi, and some top-ical maps, such as comet path maps, the trapezoidal pro-jection became the favored choice.
Bayer’s URANOMETRIA: A Model for the Future
Johannes Bayer’s Uranometria broke new ground in thehistory of star charts. Published in Augsburg in 1603, theUranometria far surpassed any celestial atlas or map cre-ated before it, in both scope and artistry. Alexander Mair
Renaissance Star Charts 115
84. Both works were published in Ingolstadt in 1533. This chart wasdescribed in great detail in Savage-Smith, “Celestial Mapping,” 61–62;Kunitzsch, “Peter Apian and ‘Azophi,’” 117–24; and idem, Peter Apianund Azophi.
85. For the copies of Vopel’s map, see Jerónimo Girava (1556), Gio-vanni Andrea Valvassore (1558), and Bernard van den Putte (1570);they are described in Shirley, Mapping of the World, 114 –17 (nos. 101–2), 146 and 148– 49 (no. 123). The 1556 edition is a very sketchy copy,whereas the other two can be considered much closer to the original.
86. Maps included those by Giacomo Gastaldi and Matteo Pagano(ca. 1550), Giacomo Gastaldi (and others) (ca. 1561), Gerard de Jode(1571), Guillaume Postel (1582), Petrus Plancius (1592 and 1594),Willem Jansz. Blaeu (ca. 1608 and 1619), Jodocus Hondius Jr. (1617),John Speed (1626), Cornelis Danckerts (1628), Jean Boisseau (1636 andca. 1645), Claes Jansz. Visscher (1638), Melchior II Tavernier (1643),Joan Blaeu (1648), Nicolas I Berey (ca. 1650), and Hugo Allard (ca.1652).
87. Further information on all of these charts can be found in Shirley,Mapping of the World. It is unclear as to whether the Gastaldi 1546map was originally designed to have inset celestial maps, as does thePagano copy; the only extant copy of the earlier map is a proof thatlacks the border illustrations.
88. For more information on the influence and development of dif-ferent artistic styles as they relate to Renaissance celestial globes and starcharts, see Dekker, “Blaeu to Coronelli.”
89. For example, the aforementioned Vopel example; Plancius firstpublished his new constellations Columba and Polophylax on his 1592world map, including Crux, Triangulum Australe, and the MagellanicClouds that he had introduced on his 1589 globe.
90. It is possible that there were instances of equatorial celestial hemi-spheres inset into world maps during the sixteenth century, althoughnone survive from that period. A 1795 copy of a map presumably from 1559 contains such star charts (Shirley, Mapping of the World,118–19 [no. 103]).
91. It is doubtful that Girault devised this map himself given the crudeartistry, history of copying from other makers, and likely precedent forthe existence of equatorial maps during the sixteenth century, althoughnone survive.
92. For example, the 1533 Prugner comet map discussed later in this chapter. For information on globular and other globelike projec-tions such as the oblique orthographic, see Snyder, Flattening the Earth,14 –18.

engraved the elegant illustrations, but rather than follow-ing the model of one particular star chart or globe, Mair(presumably in consultation with Bayer) seems to have re-lied on a variety of sources for guidance.93 Prominentamong them is Grotius’s edition of Aratus, which Bayerquoted. However, several constellations were derivedfrom other sources, and the Grotius models were oftenmarried with aspects of iconography from other constel-lation renderings such as Ratdolt’s Hyginus illustrationsand a Dutch Saenredam-style globe.94
Many of Bayer’s constellation figures violate the Hip-parchus rule. According to the rule, since Bayer’s atlasmapped the stars from an internal perspective, the con-stellation figures that adorn the stars should have been de-picted from the front. However, only some Uranometriafigures face forward; others face backward. Whether thiswas due to Bayer’s unfamiliarity with the Hipparchus ruleor represented an intentional break with historical prece-dent is unclear.
Bayer plotted the stars in the Uranometria on a trape-zoidal projection, and the star positions were determinedlargely from Tycho Brahe’s 1,005-star catalog, which, al-though not yet published at this time, had been availablein the form of manuscript copies and had been incorpo-rated into several globes. For the southern sky, however,Bayer turned to Hondius’s 1597/98 celestial globe, whichfeatured constellations formed from Keyser and De Hout-man’s star positions. At the end of the volume, Bayer
included the first printed two-dimensional map of theserecently charted southern stars (see fig. 4.2).
Bayer’s greatest legacy, perhaps, is the system of stellarnomenclature he introduced in the Uranometria, one thatis still used today for most stars visible with the nakedeye, although over half a century passed before other as-tronomers began to use Bayer’s system.95 Bayer departedfrom the Ptolemaic model, which used long and oftenambiguous phrases of text to describe each star. He mayhave been influenced by Piccolomini’s system, which la-beled the stars with letters, or the Dürer maps and pre-ceding manuscripts (including al-S. ufı manuscripts andEuropean copies derived from them), which numberedthe stars according to their order in the Ptolemaic cata-log. Bayer’s system, for most constellations, assigned theGreek letter alpha to the brightest star, then each subse-quent Greek letter to the other stars in order of descend-
116 The History of Renaissance Cartography: Interpretive Essays
93. This is contrary to Warner’s assertion that they came strictly fromde Gheyn’s illustrations in the Grotius Aratus (Sky Explored, 18). Cer-tain constellations do correspond, such as Andromeda, Cassiopeia, Ce-tus, and some of the zodiac, but many others do not.
94. Bayer also incorporated the Islamic-influenced eagle-instrumentcombination for Lyra, although the design of the instrument part onlyis from the Grotius Aratus. For more information on Bayer’s influences,see Dekker, “Blaeu to Coronelli,” 55–57. For more on the Saenredamstyle, which refers to Jan Pietersz. Saenredam, the engraver of Blaeu’s ce-lestial gores of about 1598, see “Blaeu to Coronelli,” 52 and 57.
95. Austin Royer was the first in 1679; see Warner, Sky Explored, 18.
fig. 4.10. EARLY EQUATORIAL CELESTIAL MAP, 1592.Simon Girault designed this map in part to show the points ofintersection between the equator (labeled “le eqvinoctial”) andthe ecliptic (labeled “le zodiac”). The only stars indicated arethose of the Big Dipper in Ursa Major, but presumably the
other chart in his book—a pair of polar projection mapscopied from Honter—fulfilled the need for illustrating the ap-proximate patterns of the stars.Simon Girault, Globe du monde (Langres: Iehan des Preyz,1592), 37. Photograph courtesy of the Adler.

ing brightness; when all twenty-four Greek letters hadbeen used, Bayer switched to Latin letters.96
Curiously, the Uranometria inspired few copies, per-haps because it was republished in so many editions.97
Aegidius Strauch, however, produced a tiny pocket atlasbased on Bayer, Astrognosia synoptice et methodice inusum gymnastorum academicum adornata (Wittenberg,1659), which lacks grid lines and the nomenclature sys-tem, and consequently was likely designed as a noveltyrather than for actual use.
After Bayer’s monumental publication, few star chartsor atlases seem to have been published until the mid-seventeenth century, aside from the tiny star charts insetinto world maps (discussed earlier).98 Several publicationsappeared during the 1610s: an illustrated star catalog byChristoph Grienberger (1612) and a pair of celestialcharts by Jodocus Hondius Jr. (1616). Also producedduring this decade were a number of charts showing thepath of the comet of 1618. Grienberger employed thegnomonic projection; he was the first to use this projec-tion for a significant number of maps.99 Only one chart isrecorded from the 1630s: an unusual hand fan design em-bellished with tiny star charts by Melchior Tavernier(1639).100 No separately issued star charts or atlases seemto have been drafted in the 1640s. The paucity of new starcharts during the first half of the seventeenth century may also be due in part to possible decreased academicproduction during the Thirty Years War of 1618– 48.
The 1620s, however, saw the publication of severalcharts and an atlas. In 1623, Wilhelm Schickard pub-lished a pair of conical star maps in his Astroscopium, profacillima stellarum cognitione noviter excogitatum; thevolume was republished in 1655. In addition to the in-novative conical projection, Schickard provided alternatebiblical names for a number of the traditional constella-tions.101 The next year, Jakob Bartsch included three ce-lestial maps in his Usus astronomicus planisphaerii stel-lati . . . (1624). Employing new formats for star charts,Bartsch devised two rectangular projection maps, eachcovering half of the zodiacal region, in addition to a polarprojection chart of the night sky to somewhat outside theTropic of Cancer. Additionally, Bartsch included all of thenew biblical-themed constellations of Plancius. In a moretraditional vein, Isaac Habrecht II published a pair ofhemispherical charts in 1628 based on his globe of 1621,which was in turn based on the work of Plancius; thesewere the first two-dimensional maps to include the con-stellation Rhombus.102
Julius Schiller oversaw the production of Coelum stel-latum christianum—the most significant of the star at-lases published between Bayer’s atlas and that of JohannesHevelius (1690). Published posthumously in 1627,Schiller’s atlas implemented a thorough and radical re-working of the constellations. Each constellation was
transformed into a figure from the Bible, and elaboratenew maps were engraved (fig. 4.11). No other cartogra-pher had carried out such a detailed reassignment proj-ect—or has since. The maps, however, are often ne-glected by historians, perhaps dismissed because of thebiblical content. Schiller’s Coelum stellatum christianumwas essentially a revision of Bayer’s atlas, and Bayer him-self consulted on the project. It incorporated an extensiveamount of new material that had been published since1603.103 A team of scholars worked on the project, in-cluding Schickard, who had included many biblical iden-tifications for constellations on his maps from 1623, andBartsch, who finished the project after Schiller’s death.
Schiller’s atlas included fifty-one maps, forty-nine ofwhich were centered on a constellation; some of the ex-isting constellations were combined into larger stargroups.104 The twelve apostles replaced the zodiacal con-stellations, while figures from the New Testament popu-lated the north celestial hemisphere, and figures from theOld Testament the South. Although they represented a re-vision of Bayer’s internal perspective atlas, these mapsemployed an external perspective, likely so that theywould be represented from a “God’s-eye” view. Schillerproduced a companion volume, Coelum stellatum chris-tianum concavum (published in 1627), which featuredcounterproofs of the star maps before the figures hadbeen engraved, resulting in internal perspective, stars-
Renaissance Star Charts 117
96. Certain of Bayer’s constellations were labeled inconsistently. Fora detailed description of Bayer’s assignment of letters, see Joseph Ash-brook, “Johann Bayer and His Star Nomenclature,” in his The Astro-nomical Scrapbook: Skywatchers, Pioneers, and Seekers in Astronomy,ed. Leif J. Robinson (Cambridge: Cambridge University Press, 1984),411–18.
97. For a listing of later editions, see Warner, Sky Explored, 19.98. The distribution of celestial charts in the first half of the seven-
teenth century is based on both the Warner survey of celestial charts inSky Explored and that of Anna Friedman Herlihy in Star Charts of theAdler Planetarium & Astronomy Museum (Chicago: Adler Planetarium& Astronomy Museum, forthcoming).
99. Snyder, Flattening the Earth, 19. Johannes Kepler seems to be thefirst to have used this projection for a celestial map of the nova of 1604(1606). Orazio Grassi also used this projection in his three comet maps(1619). The next significant use of this projection seems to have been byIgnace Gaston Pardies (1673).
100. Friedman, Awestruck, 16. It is not know whether this is Mel-chior I or Melchior II Tavernier.
101. For more about the use of conical projections in star charts, seeSnyder, Flattening the Earth, 31 and 68. There has been little researchabout biblical constellation forming and renaming projects. For Chris-tian interpretations of the zodiac, see the following detailed study: Wolf-gang Hübner, Zodiacus Christianus: Jüdisch-christliche Adaptationendes Tierkreises von der Antike bis zur Gegenwart (Königstein: Hain,1983).
102. Warner, Sky Explored, 104 –5.103. For details of the additions, see Warner, Sky Explored, 229–32.104. For a complete listing of the biblical constellations and their tra-
ditional counterparts, see Warner, Sky Explored, 231.

only charts (fig. 4.12).105 Two equatorial stereographicprojection planispheres illustrated the entire heavens,later republished in a larger format in the Harmoniamacrocosmica seu atlas universalis et novus (1660/61) ofAndreas Cellarius.106
After the mid-seventeenth century, three sets of charts(ca. 1650) by Antoine de Fer, Melchior II Tavernier, and Pierre I Mariette marked the beginning of a flurry of celestial mapmaking, much of it influenced by theworks of both Willem Jansz. and Joan Blaeu. The highlydecorative maps of Andreas Cellarius in the Harmoniamacrocosmica may have sparked the publication of manysuch maps throughout the last decades of the seventeenth century.
Specialized Star Charts
In this period, several specialized types of star chartsemerged, intended to do more than merely map the loca-tions of the stars. Many depicted the location of astro-nomical phenomena, while others demonstrated new dis-
118 The History of Renaissance Cartography: Interpretive Essays
fig. 4.11. ONE OF SCHILLER’S NEW BIBLICAL CON-STELLATIONS. Julius Schiller replaced the constellation Tau-rus with that of Saint Andrew. The V shape that makes up thehorns and face of the bull in the traditional constellation con-stitutes half of the cross that Saint Andrew carries. The stars
of the Pleaides are positioned in the figure’s shoulder, trans-ferring what had been in the shoulder of an animal to that ofa man. Compare figure 4.12.Julius Schiller, Coelum stellatum christianum (Augsburg,1627). Photograph courtesy of the Adler.
105. Counterproofs are reverse images taken from freshly inkedprints. Not all copies of the atlas have the counterproofs. An example atthe Adler features stars-only proofs from an external perspective, despitehaving the “concave” title page. Additionally, at least one copy (in pri-vate hands) has counterproofs of the maps with the constellation figures.
106. Andreas Cellarius, The Finest Atlas of the Heavens, intro. andtexts R. H. van Gent (Hong Kong: Taschen, 2006), and Warner, Sky Ex-plored, 53–54.

coveries. Some showed readers how to use instrumentsthat relied on stellar positions or how to use the starsthemselves to solve problems. In contrast to large-scalecharts and atlases, which on occasion also show phe-nomena and discoveries, specialized charts constitute aseparate category because of their small, regional formatand their topical focus on something other than a generalmapping of the night sky, as well as their variable stan-dards of mathematical and scientific exactness within thesubgenre.
Charts that map the location and/or path of comets ap-pear to be the first such specialized charts, as well as byfar the most common. Significantly, a map of the path ofa comet exhibits a new kind of mapping, one that is con-cerned with mapping movement across space rather thanmapping static objects in space. A format of depicting thecomet’s path as linear became the most common way tochart these phenomena, particularly during the comet-rich seventeenth century. Medieval attempts to representcomet locations lacked the precision of Renaissance andlater efforts, depicting decorative constellation imagesthat only vaguely hinted at their place in the sky, if theysuggested it at all.107 In addition to precise maps, cometillustrations similar to the medieval models continued toappear throughout the Renaissance.108
Comet maps range from the general, merely locating a comet in a particular area of the sky, to the specific,showing a precise location or path in the sky on particu-lar dates and at particular times; in many instances come-
tary locations were charted with respect to the positionsof the surrounding stars and/or constellations, whichwere relevant to their prognosticative meaning. Cometmaps often included the length and direction of the tail of the comet; direction was an important component ofdivination.109
The earliest extant comet maps are those by Paolo dalPozzo Toscanelli, an avid comet observer and recorderfrom Italy (fig. 4.13).110 Toscanelli’s manuscript chartstrack the path of the comets of 1433, 1449–50, and1456, and the two in 1457 as a series of dots labeled withdates; these dots are superimposed upon the backgroundof the fixed stars. Some charts include sketched-in con-stellation figures and comet tails. The implied line that
Renaissance Star Charts 119
fig. 4.12. PUBLISHED COUNTERPROOF OF SCHILLER’SCONSTELLATION SAINT ANDREW. This internal perspec-tive star map is a mirror image of figure 4.11, although ren-dered without the constellation figures.Julius Schiller, Coelum stellatum christianum concavum(Augsburg, 1627), 69. Photograph courtesy of the Linda HallLibrary of Science, Engineering & Technology, Kansas City.
fig. 4.13. COMET PATH MAP BY PAOLO DAL POZZOTOSCANELLI. Toscanelli’s chart of the comet of 1449-50clearly shows a linear progression against a backdrop of stars(with a few constellation figures sketched in). The length anddirection of the tail and the date on which each observationwas made are given. Size of the original: 29.8 � 44.6 cm. Biblioteca NazionaleCentrale, Florence (Banco Rari 30, fols. 251v-250r). By con-cession of the Ministero per i Beni e le Attività Culturali dellaRepubblica Italiana.
107. For example, the often reproduced section of the Bayeux tapes-try (1073–83) showing the comet of 1066.
108. For example, the Nuremberg Chronicle (1493) or the DieboldSchilling manuscript (ca. 1508–13). For other examples, see RobertaJ. M. Olson, “ . . . And They Saw Stars: Renaissance Representations ofComets and Pretelescopic Astronomy,” Art Journal 44 (1984): 216 –24,and Sara Schechner Genuth, Comets, Popular Culture, and the Birth ofModern Cosmology (Princeton: Princeton University Press, 1997).
109. For detailed information on divination based on cometary ap-pearances, see Schechner Genuth, Comets.
110. For more information on Toscanelli, see Clarisse Doris Hellman,The Comet of 1577: Its Place in the History of Astronomy (New York:Columbia University Press, 1944), 74 –75; Jane L. Jervis, CometaryTheory in Fifteenth-Century Europe (Wrociaw: Ossolineum, PolishAcademy of Sciences Press, 1985), 43– 48; and Yeomans, Comets,24 –26.
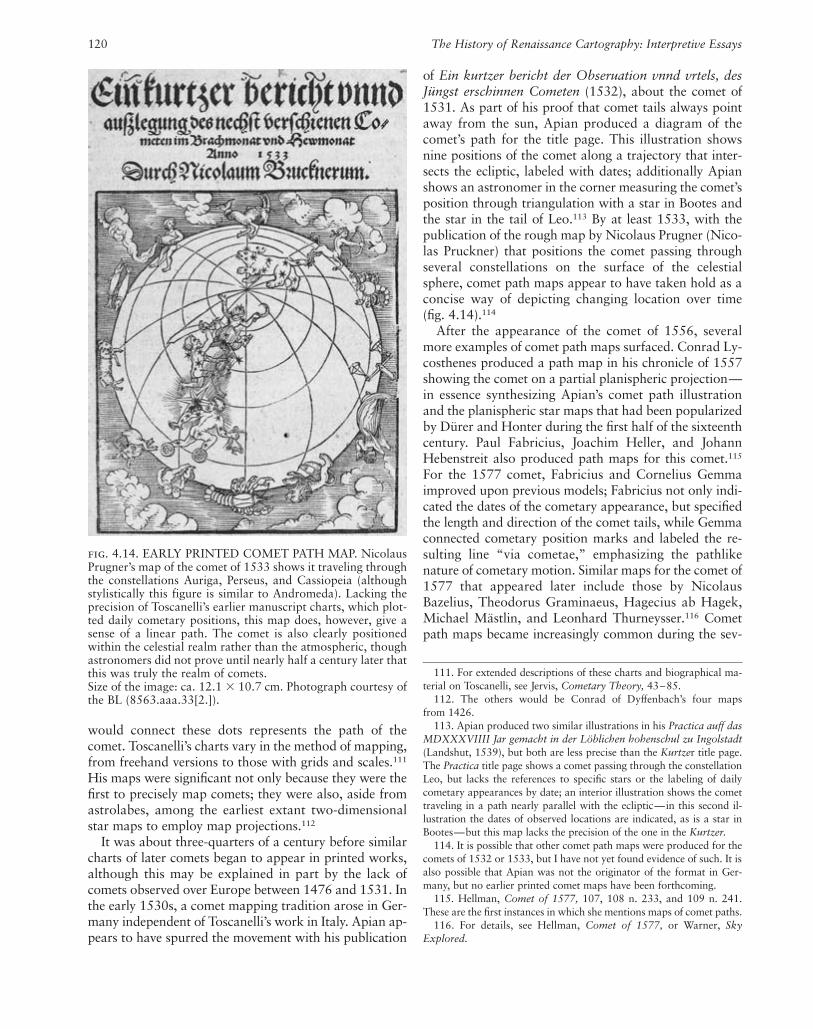
would connect these dots represents the path of thecomet. Toscanelli’s charts vary in the method of mapping,from freehand versions to those with grids and scales.111
His maps were significant not only because they were thefirst to precisely map comets; they were also, aside fromastrolabes, among the earliest extant two-dimensionalstar maps to employ map projections.112
It was about three-quarters of a century before similarcharts of later comets began to appear in printed works,although this may be explained in part by the lack ofcomets observed over Europe between 1476 and 1531. Inthe early 1530s, a comet mapping tradition arose in Ger-many independent of Toscanelli’s work in Italy. Apian ap-pears to have spurred the movement with his publication
of Ein kurtzer bericht der Obseruation vnnd vrtels, desJüngst erschinnen Cometen (1532), about the comet of1531. As part of his proof that comet tails always pointaway from the sun, Apian produced a diagram of thecomet’s path for the title page. This illustration showsnine positions of the comet along a trajectory that inter-sects the ecliptic, labeled with dates; additionally Apianshows an astronomer in the corner measuring the comet’sposition through triangulation with a star in Bootes andthe star in the tail of Leo.113 By at least 1533, with thepublication of the rough map by Nicolaus Prugner (Nico-las Pruckner) that positions the comet passing throughseveral constellations on the surface of the celestialsphere, comet path maps appear to have taken hold as aconcise way of depicting changing location over time (fig. 4.14).114
After the appearance of the comet of 1556, severalmore examples of comet path maps surfaced. Conrad Ly-costhenes produced a path map in his chronicle of 1557showing the comet on a partial planispheric projection—in essence synthesizing Apian’s comet path illustrationand the planispheric star maps that had been popularizedby Dürer and Honter during the first half of the sixteenthcentury. Paul Fabricius, Joachim Heller, and JohannHebenstreit also produced path maps for this comet.115
For the 1577 comet, Fabricius and Cornelius Gemma improved upon previous models; Fabricius not only indi-cated the dates of the cometary appearance, but specifiedthe length and direction of the comet tails, while Gemmaconnected cometary position marks and labeled the re-sulting line “via cometae,” emphasizing the pathlike nature of cometary motion. Similar maps for the comet of1577 that appeared later include those by NicolausBazelius, Theodorus Graminaeus, Hagecius ab Hagek,Michael Mästlin, and Leonhard Thurneysser.116 Cometpath maps became increasingly common during the sev-
120 The History of Renaissance Cartography: Interpretive Essays
fig. 4.14. EARLY PRINTED COMET PATH MAP. NicolausPrugner’s map of the comet of 1533 shows it traveling throughthe constellations Auriga, Perseus, and Cassiopeia (althoughstylistically this figure is similar to Andromeda). Lacking theprecision of Toscanelli’s earlier manuscript charts, which plot-ted daily cometary positions, this map does, however, give asense of a linear path. The comet is also clearly positionedwithin the celestial realm rather than the atmospheric, thoughastronomers did not prove until nearly half a century later thatthis was truly the realm of comets.Size of the image: ca. 12.1 � 10.7 cm. Photograph courtesy ofthe BL (8563.aaa.33[2.]).
111. For extended descriptions of these charts and biographical ma-terial on Toscanelli, see Jervis, Cometary Theory, 43–85.
112. The others would be Conrad of Dyffenbach’s four maps from 1426.
113. Apian produced two similar illustrations in his Practica auff dasMDXXXVIIII Jar gemacht in der Löblichen hohenschul zu Ingolstadt(Landshut, 1539), but both are less precise than the Kurtzer title page.The Practica title page shows a comet passing through the constellationLeo, but lacks the references to specific stars or the labeling of dailycometary appearances by date; an interior illustration shows the comettraveling in a path nearly parallel with the ecliptic—in this second il-lustration the dates of observed locations are indicated, as is a star inBootes—but this map lacks the precision of the one in the Kurtzer.
114. It is possible that other comet path maps were produced for thecomets of 1532 or 1533, but I have not yet found evidence of such. It isalso possible that Apian was not the originator of the format in Ger-many, but no earlier printed comet maps have been forthcoming.
115. Hellman, Comet of 1577, 107, 108 n. 233, and 109 n. 241.These are the first instances in which she mentions maps of comet paths.
116. For details, see Hellman, Comet of 1577, or Warner, Sky Explored.

enteenth century, especially for the comets of 1618, 1664,1665, and 1680.
Accompanying many Renaissance comet tracts werecharts that illustrated the position of the comet in relationto the elemental spheres, similar to the center of cosmo-graphical diagrams of the universe. Until Tycho Brahe’srevolutionary determination that comets existed in a su-perlunary realm, they were thought to be atmosphericphenomena. These types of maps show the comet as ex-isting in the sphere of air, often with reference to the cardinal directions, the ecliptic, or certain constellations.Other maps take still different approaches at mapping thelocations of comets and documenting the passage of time.One interesting work from 1619 by Johann Baptist Cysatcreates a series of such static images, much like a filmstrip,showing the comet of 1618 progressing through severaldifferent constellations.
Novae, in addition, were a popular subject of special-ized charts. The 1572 nova in Cassiopeia was charted byBrahe, Cunradus Dasypodius, Thomas Digges, Hageciusab Hagek, Cyprianus Leovitius, and Michael Mästlin,among others. Willem Jansz. Blaeu included the novae of1572, 1600 (in Cygnus), and 1604 (in Serpentarius) onhis globes; he observed the latter two himself.117 The1604 nova was also charted by Johannes Kepler.118
Another function of specialized charts was to demon-strate how the Pole Star could be located. Peter Apianpublished several different versions of such charts (fig.
4.15),119 and similar ones appeared in books rangingfrom those on navigation to, in later centuries, those forteaching astronomy to children. Diagrams of nocturnaluse often included maps of Ursa Major and Ursa Minor,as certain stars in the dipper-shaped asterisms in thesetwo constellations figure directly into finding the time atnight with this instrument; such diagrams can be tracedto medieval illustrations of horologium nocturnum usefrom the eleventh and twelfth centuries.120 Other special-ized star charts that relate to instrument use are less ob-vious—for example, to help the reader locate certainstars used in the design of some of his instruments, Apianincludes non-coordinate maps of the brightest stars in ahandful of relevant constellations.121
Discoveries sparked the creation of topical charts. Asdescribed earlier, Bayer included a chart of the new south-ern constellations developed by Plancius. Earlier manu-scripts and texts, especially those concerned with naviga-tion and the voyages of discovery, contained diagrams of the Southern Cross, including those by Alvise Cà daMosto (ca. 1470), João de Lisboa (1514), Fracanzio da Montalboddo (1507), and Pedro de Medina (1545).122
Amerigo Vespucci’s observations of the southern sky, in-cluding the Coalsack nebula, were published in 1503 or1504. In 1500, João Faras (Maître João) sent a letter tothe Portuguese king containing a map of the stars sur-rounding the Antarctic pole. Later maps by Andrea Cor-sali (1516) and Piero di Dino (1519) include not onlystars but the Magellanic Clouds.123
Galileo Galilei produced what are perhaps the mostwell-known specialized star charts of all time. With thenewly developed telescope, Galileo observed stars notable to be seen by the naked eye. He published four non-coordinate drawings of the formations of these new stars
Renaissance Star Charts 121
fig. 4.15. A POLE STAR CHART BY PETER APIAN. This di-agram shows how to use stars in the Big Dipper asterism aspointers to find the Pole Star. Ursa Major, however, is depictedaccording to an old, non-Ptolemaic model that views thisarrangement of stars as a wagon being led by three horses.Note also the early inclusion of the star Alcor and the foot ofthe constellation Cepheus. A sundial—an instrument designedto be used during the day—is curiously included as part of thisillustration; this is because one must orient a sundial towardthe north in order for it to tell the time properly.Peter Apian, Quadrans Apiani astronomicus et iam recensinuentvs et nunc primum editus (Ingolstadt, 1532), fol. 24v.Photograph courtesy of the Adler.
117. R. H. van Gent, “De nieuwe sterren van 1572, 1600 en 1604 opde hemelglobes van Willem Jansz. Blaeu,” Caert-Thresoor 12 (1993):40– 46, and Van der Krogt, Globi Neerlandici, 493, 494, 504, 507, and 517.
118. For more information about these maps, see Warner, Sky Explored.
119. Warner, Sky Explored, 8.120. Medieval examples can be seen in Wiesenbach, “Pacificus von
Verona,” 233 and 236. A typical Renaissance example is the nocturnalillustration from Peter Apian, Cosmographicus liber (Landshut, 1524,and numerous later editions).
121. For example, Apian’s quadrant design includes sixteen principalstars that aid in its function; in his illustrations of the quadrants, thestars are numbered to correspond to star maps included later in thebook. Peter Apian, Instrument Buch (Ingolstadt, 1533; reprintedLeipzig: ZA-Reprint, 1990), and idem, Quadrans Apiani astronomicuset iam recens inuentvs et nunc primum editus (Ingolstadt, 1532).
122. Dates refer to first extant copy or publication.123. Although Corsali and de Dino’s maps predate Magellan’s voy-
age, these two celestial formations (which are now known to be galax-ies) are today commonly called the Magellanic Clouds, using a termseemingly created in the seventeenth century. For a comprehensive studyof the early mapping of the southernmost sky, see Dekker, “The Lightand the Dark.”

in the Sidereus nuncius (1610): the belt and sword ofOrion, the Pleiades (fig. 4.16),124 the stars comprising theOrion nebula, and the stars comprising the Praesepe neb-ula.125 Significantly, Galileo’s maps showed not only thatthere were far more stars than previously believed, butthat nebulous stars were, in actuality, many stars clus-tered close together.
Concluding Remarks
Dramatic changes in the mapping of stars marks the Re-naissance period, as authors and mapmakers moved awayfrom a reliance on classical scholarship to original work.By 1650, star maps had become firmly entrenched as sci-entific illustrations intended for scholarship or educationrather than as decorative additions. Yet at both the be-ginning and the end of the Renaissance, technology lim-ited star mapmakers. In the early years prior to TychoBrahe, instruments lacked precision, and in the lateryears, Galileo’s experiments with the telescope yielded anew world of stars that needed to be mapped.
Despite the newfound ability to see more stars, by themid-seventeenth-century instruments had not been devel-oped that could aid astronomers in accurately measuringtheir positions and, by extension, charting them. It wasnot until the end of the seventeenth century that tele-scopically viewed stars came to be charted on traditionalstar maps. By the beginning of the eighteenth century, thetelescope became an integral part of mapping the stars,and the mapping of ever-increasing numbers of telescop-ically viewed stars would radically alter the aesthetic ofcelestial charts. Despite technological advances that en-abled astronomers to better locate, measure, and subse-quently map more stars, Renaissance star charts had alasting impact on these later mapping projects. Artisticconstellation styles have dramatically changed over time, but the formats for atlases and planispheric mapsdeveloped during the Renaissance have persisted for hun-dreds of years and continue to influence modern-daymapmakers.
122 The History of Renaissance Cartography: Interpretive Essays
fig. 4.16. A CHART OF THE PLEIADES BY GALILEOGALILEI. Included around the six easily visible stars of thisgroup are thirty previously invisible stars that Galileo observed.Size of the original page: 24 � 17 cm. Photograph courtesy ofthe Smithsonian Institution Libraries, Washington, D.C.
124. The first accurate separate map of the Pleiades was produced byMästlin in 1579; see Warner, Sky Explored, 169. Prior to Mästlin’schart, this asterism had often been separately illustrated in both manu-script and printed versions of Hyginus and Aratus.
125. For details on these maps, see Warner, Sky Explored, 88–89.