REN21 Recommendations for Improving the Effectiveness of Renewable
Global Status Report
on Local Renewable Energy Policies
Comments and Additional Information Invited
This report complements the REN21 Renewables Global Status Report by providing more detailed information at the city and local levels about policies and activities to promote renewable energy. It is intended to facilitate dialogue and illuminate pathways for future policies and actions at the local level. This “working draft” version is intended to solicit comments and additional information. Data in this
draft are not necessarily complete or accurate.
A Collaborative Report by:REN21 Renewable Energy Policy Network for the 21st Century
Institute for Sustainable Energy Policies (ISEP)ICLEI–Local Governments for Sustainability
May 2011 Version
2
Additions and corrections: please address to Eric Martinot, [email protected] New researchers, contributors, and reviewers will be acknowledged in the next edition. ABOUT REPORT COLLABORATORS REN21 convenes international multi-stakeholder leadership to enable a rapid global transition to renewable energy. It promotes appropriate policies that increase the wise use of renewable energies in developing and industrialized economies. Open to a wide variety of dedicated stakeholders, REN21 connects governments, international institutions, nongovernmental organizations, industry associations, and other partnerships and initiatives. REN21 leverages their successes and strengthens their influence for the rapid expansion of renewable energy worldwide. See www.ren21.net. ISEP is an independent, non-profit research organization, founded in 2000 by energy experts and climate change campaigners. ISEP aims to provide resources and services to realize sustainable energy policies. Activities include promotion of renewable energy, improvement of energy efficiency, and restructuring energy markets. ISEP provides policy analysis and advice for national and local governments, brings together stakeholders worldwide, and facilitates renewable energy activities by local groups. See www.isep.or.jp. ICLEI – Local Governments for Sustainability is an association of over 1220 local government Members who are committed to sustainable development. Local government members come from 70 different countries and represent a combined population of more than 570 million people. Founded in 1990, ICLEI works with its members and other local governments through performance-based, results-oriented campaigns and programs, such as the Cities for Climate Protection Campaign, the Local Government Climate Roadmap, and the Local Renewables Initiative. See details on all initiatives at www.iclei.org. Disclaimer: The views expressed in this report do not necessarily reflect the positions or views of REN21 or any associated organization. Although the information given in this report is the best available to the authors at the time, REN21 and its participants cannot be held liable for its accuracy and correctness.
3
ACKNOWLEDGMENTS Lead Author and Research Director Eric Martinot (Institute for Sustainable Energy Policies) Collaborating Authors Vincent Tan (Columbia University); Risa Irie (ISEP and Columbia University); Maryke van Staden (ICLEI European Secretariat); Noriaki Yamashita (ISEP); Monika Zimmermann (ICLEI World Secretariat). Researchers Andy Belen (Meister Consultants Group), Katie Burns (Town of Markham), Woodrow Clark (Clark Strategic Parnters), Jose Etcheverry (York University), Francesco Francisci (Ecosoluzioni), Shota Furuya (ISEP), Emmanuel Gómez, Daniele Guidi (Ecosoluzioni), Ryan Hodum (David Gardiner & Associates LLC), Coreen Jones (York University), Kei Kawaguchi (ISEP), Sandi MacPherson (York University), Ana Maria Gómez (National Autonomous University of Mexico), Noriko Nakao (ISEP), Lynda O Malley (ICLEI Europe), Viive Sawler (Town of Markham), Patrick Schroeder (Victoria University), Laura Serrano Mendoza (ICLEI Europe), Erin Shapero (Town of Markham); Donald van den Akker (Urgenda). Contributors and Reviewers D.H. Brahmbhatt (City of Rajkot), Stuart Conerly (ISEP), Emani Kumar (ICLEI South Asia), Lee Yujin (Green Korea), Christine Lins (EREC), Jan Logie (Otago University), Monica Oliphant (ISES), Lily Riahi (ICLEI Europe), Wilson Rickerson (Meister Consultants Group), Holger Robrecht (ICLEI Europe), Ian Schearer (ICLEI New Zealand), Jonas Tolf (City of Stockholm).
4
CONTENTS 1. The Promise of Local Action for Renewable Energy .............................................................. 6
2. International, Regional and National Influences on Local Renewables .................................. 7
3. Types of Local Policies and Activities to Promote Renewable Energy ................................. 11
4. Survey of Local Renewable Energy Policies in 210 Cities Worldwide.................................. 14
5. Towards 100% Renewables – Cities, Communities, and Regions Leading the Way........... 25
6. Links Between Local and National Policy: Example of Japan ....................................................36
7. Case Summaries of Local Policies in 40 Cities Worldwide................................................... 39
8. Further Research.................................................................................................................. 49
BOXES Box 1: Emerging Lessons from Implementing Local Renewables............................................. 8 Box 2: Chicago Climate Exchange (CCX) ............................................................................... 10 Box 3: EU Covenant of Mayors ............................................................................................... 10 Box 4: Mexico City Pact and Cities Climate Registry......................................................................10
TABLES Policy Framework
Table 1: Local Government Policies/Activities that Can Influence Renewable Energy ........... 13 Surveys of Local Renewable Energy Policies
Table 2: Europe ....................................................................................................................... 18 Table 3: United States ............................................................................................................. 19 Table 4: Canada ...................................................................................................................... 20 Table 5: Japan ......................................................................................................................... 21 Table 6: Australia and New Zealand........................................................................................ 22 Table 7: China, India, and Asia/Other...................................................................................... 23 Table 8: Latin America............................................................................................................. 24 Examples of Cities Moving Towards 100% Renewable Energy Table 9: Towards 100%: Cities and Communities Under 50,000 Population ................................30 Table 10: Towards 100%: Cities and Regions Over 50,000 Population ........................................33 Local Policy Examples
Table P1: Targets for CO2 Emissions Reductions ................................................................... 50 Table P2: Targets for Share of Renewable Electricity .............................................................. 51 Table P3: Targets for Share or Amount of Renewable Energy................................................. 51

5
Table P4: Targets for Installed Capacity of Renewable Energy ............................................... 52 Table P5: Targets for Local Government Own-Use Purchases of Renewable Energy ............ 53 Table P6: Targets for Share of Buildings with Renewable Energy ........................................... 53 Table P7: Urban Planning......................................................................................................... 53 Table P8: Building Codes and Mandates ................................................................................. 54 Table P9: Tax Credits and Exemptions .................................................................................... 55 Table P10: Transport Infrastructure and Fuel Mandates, Operation, Investment, Subsidies .. 56 Table P11: Carbon Cap-and-Trade Schemes .......................................................................... 56 Table P12: Promotion and Market-Facilitation Agencies and Departments ............................. 57 Table P13: Electric Utility Policies ............................................................................................ 57 Table P14: Subsidies, Grants, and Loans ................................................................................ 57 Table P15: Local Government Funds and Investments ........................................................... 59 Table P16: Support for Private and Community Initiative ......................................................... 59

6
1. THE PROMISE OF LOCAL ACTION FOR RENEWABLE ENERGY City and local governments can play a key role in encouraging renewable energy at the local level.
The multiple roles of these local governments–as decision-makers, planning authorities, managers
of municipal infrastructure, and role models for citizens and businesses–are crucial to the global
transition to renewable energy now underway. It is their political mandate that makes local
governments ideal drivers of change–to govern and guide their communities, provide services, and
manage municipal assets.
Most significantly, local governments have legislative and purchasing power that they can use to
implement change in their own operations and in the wider community. With such capacity, local
governments can become beacons for change in their region or country, demonstrating the
effectiveness of policies and local action. And as early leaders among local governments take
initiative, others can follow and improve upon the early efforts, replicating and scaling-up good-
practice and successful examples.
Local governments can also play a key role as facilitators of change, particularly in terms of raising
awareness and facilitating community and business actions by a range of stakeholders. Often the
participation of many different local, regional, and even national stakeholders is important to
achieving planned outcomes. For example, “model cities” in India and Brazil have been designed
to involve local craftspeople, schools, scientists, and regional and national agencies.
While cities are beginning to include renewable energy in urban planning, there are still relatively
few explicit local renewable energy policies. Rather, renewable energy is often addressed
indirectly, within other themes such as sustainability, climate change, clean transportation, and
“green” or “eco” programs. Often, energy savings and energy efficiency are the main priorities,
which makes sense due to the enormous opportunities for reducing demand. Reduced demand
also enables renewables to meet a larger share of the remaining demand. However, it is also true
that the potential for renewable energy is often overlooked, shortchanged, or needlessly postponed
within these broader themes and programs.
The “energy system of tomorrow,” a system that could enable the realization of a 100% renewable
future, will consist of a partially distributed, decentralized energy system with embedded energy
storage, demand side management, and modern communications technologies. It also will likely
include a large role for electric vehicles charged from local renewable energy sources. The role of
local governments in shepherding and managing these transitions is highly significant. The future
will likely reveal an interesting and multi-faceted interplay between local policies and these future
energy transitions.
Local renewable energy targets and policies across the globe vary extensively. One common
theme for many communities, whether metropolitan regions, cities, towns, villages, or counties, is

7
the importance of renewable energy in local climate action plans–from both mitigation and
adaptation perspectives. This is particularly true for many developed countries, where the
importance of climate action at the local level is translating more and more into action to promote
renewable energy. In developing countries, access to energy, energy security, and industrial
development can be key motivators for renewable energy policy and action. In all communities, a
focus on local job creation often shapes policies.
This report makes clear that there are many different approaches to renewable energy policy.
Many factors influence the approaches that local governments choose. Some of these include
geographic resource availability, financing availability, relationship to state and national
governments, local regulatory authority and legal jurisdiction, social and cultural conditions,
existence of stakeholder groups, local business interests, climate, type of building stock, and
housing density and transport patterns. Since there are large variations in the types of local
targets and policies, both within and between countries, it is difficult to generalize trends for
renewable energy policies. Yet this report attempts to portray an overall “policy landscape.”
More and more cities and local governments are addressing renewable energy in some way, and
are also becoming more ambitious in their targets and in policies designed to meet these targets.
Local leaders increasingly look to renewable energy to produce energy locally; to secure the local
energy supply and improve community resilience; to save energy and money; to create local jobs;
to involve local stakeholders; to contribute to climate protection; to support national and
international CO2 reduction goals, and to promote sustainable urban development. Among many
local leaders, there is broad agreement on these benefits and the promise of renewable energy.
2. INTERNATIONAL, REGIONAL AND NATIONAL INFLUENCES ON LOCAL RENEWABLES
In recent years, international, regional, national, and state/provincial policies for energy and climate
have been increasingly affecting local government policies and actions for renewable energy.
Europe is a good example at the regional level. European Union (EU) regional policy and national
policies have fostered local renewable energy goals and actions, particularly among a number of
local governments in Austria, Finland, Germany, Sweden, and the United Kingdom. Since 2007,
many European cities have been considering renewable energy targets and policies in support of
the 2008 European Climate and Energy package. That package established an EU-wide target for
20% share of final energy consumption from renewables by 2020 and 10% share of transport
energy, with individual national targets contributing to the EU-wide target. Also in 2008, the
Covenant of Mayors was launched by the European Commission to bring together interested
8
Box 1: Emerging Lessons from Implementing Local Renewables The experience of ICLEI in working with cities on a variety of projects is beginning to illuminate some emerging lessons for implementing local renewables. 1. Community size determines approaches and possibilities. There are clear differences between the policies enacted and implemented by smaller versus larger communities. Smaller communities are enacting targets for 100% renewable energy, or have even reached this level already, whereas larger cities would find this impossible in the short and medium term. Smaller communities also tend to be motivated and supported in a regional context and cooperate with other municipalities in their region. Among those pioneers, many see an “early adopter” advantage and aim at competitive advantages from innovation. Larger cities, in contrast, tend to start by targeting specific renewable energy opportunities, such as solar, wind, or bio-energy. Larger cities may then use these opportunities to portray the city as progressive (for example, as a “solar city”) and to explore business ventures that will benefit the city. 2. Mid-sized cities can start easier then large cities. As observed in other local policy sectors as well, cities and towns of between 100,000–-500,000 inhabitants tend to be pioneers and among the most active. Innovation and implementation is often much easier for these mid-size cities than for larger cities, although international attention may focus more on the larger cities. 3. Renewable energy policies often follow sustainability goals. Among the advanced local governments in developed countries (especially among the cities), there are many governments that have started some type of sustainability policy, sometimes following past “Local Agenda 21” programs. Promoting renewable energy can become a natural continuation of past sustainability policies, as understanding and policy sophistication increase. 4. Early innovators can produce a “snowball effect.” In some countries, pioneering local governments have taken initiative and then other local governments have followed. This is why “model cities” are so relevant and why city-to-city transfer of information and motivation are key. One of the best examples is Barcelona s Solar Ordinance mandating solar hot water in new construction, which was then copied by dozens of local governments in Spain and elsewhere. 5. Local governments react to national enabling (framework) conditions. National and state/provincial energy policies and mandates create enabling (framework) conditions to which local governments react. Such enabling conditions could be national or state targets for renewable energy, incentive programs, funds for demonstrations, electric utility policies like feed-in tariffs, competitions and awards, or funding for urban development that explicitly incorporates renewables, to name some. 6. Awards and competitions motivate and create practitioner-communities. In some countries, awards are given for “solar cities”, “solar towns” and “solar villages,” often on a regular or annual basis. This creates communities of motivated and like-minded individuals and local officials, who can then serve as mentors and resources for those who wish to start similar activities in their own community. 7. Renewable energy demonstration centers provide training and “critical mass.” Come, see, touch and learn – this is the best way for people to acquaint themselves with new technologies. Many “model cities” have established information and demonstration centers for renewable energy and energy efficiency to provide training and expertise, and to bring together a critical mass of experts, small businesses, and stakeholders to move local innovation.
9
European cities in a voluntary effort to go beyond those EU targets. By early 2011, the Covenant
involved more than two thousand local governments, and was continuing to grow (see Box 3).
At the international level, local governments are increasingly involved in climate change
discussions and meetings associated with the United Nations Framework Convention on Climate
Change (UNFCCC). Local governments expanded their participation at the 13th Conference of the
Parties (COP-13) in Bali in December 2007 and at COP-14 in Poznan in December 2008. In Bali,
an association of local governments launched the “Local Government Climate Roadmap.” This
roadmap calls for greater recognition of the crucial role that local governments play in achieving
energy and climate goals, explicitly recognizes the role of renewable energy, and also highlights
the need for proper enabling (framework) conditions for local governments. The roadmap also is
mobilizing local governments towards preparations for COP-15 in Copenhagen in December 2009.
Plans for COP-15 feature a decision “Cities and Climate”, which has been brought to UNFCCC
negotiations by local governments. Also coming from COP-13 was the World Mayors and Local
Government Climate Protection Agreement, in which signatories agree to measure and report on
annual reductions of greenhouse gas emissions and act to reduce emissions consistent with a
60% global reduction in greenhouse gas emissions by 2050 (from 1990 levels). Most recently, the
Mexico City Pact and Cities Climate Registry were established in late 2010 in conjunction with
COP-16 in Cancun, Mexico (see Box 4).
At national levels, groupings of cities and local governments continue to form, expand, plan, and
take collective action, sometimes through a national initiative. For example, India is establishing 60
“solar cities” that would reduce conventional energy demand by at least 10 percent with
renewables and efficiency by 2012. National funds are supporting urban planning and policy
development in these 60 cities to establish policy roadmaps and local resource centers as
catalysts for change. In the United States, the U.S. Mayors Climate Protection Agreement grew to
include over 930 mayors from all 50 states in 2008, representing an urban population of over 83
million people. That agreement targets a 7% reduction in greenhouse-gas emissions by 2012 from
efficiency and renewables (from 1990 levels). The U.S. Department of Energy s Solar America
Partnership likewise grew in 2008, doubling to 25 participating cities in 2008. In Germany, a
publicly-funded research and facilitation network is working with over 50 small municipal
governments around the country to develop and implement plans for becoming “100% renewable
energy regions.” In Australia, there are six “solar cities” supported by a national government
program. And in Japan, more than 300 municipalities continue to provide solar photovoltaic (PV)
subsidies and support green power purchasing and other renewables policies in concert with a
national policy and networking platform “Japan Regional New Energy Vision.”
State/provincial level policies and targets for renewable energy are also affecting local
governments. By early 2009, there were over 55 states/provinces worldwide with renewable energy
targets, mostly in the United States and Canada based on renewable portfolio standards, and also
in India and other sub-national jurisdictions like Scotland. Canada is a good example of targets
10
and policies at the province level that encourage local action. As such “enabling conditions”
improve at state/provincial levels, local communities find more support to become active toward
renewable energy.
Box 2: Chicago Climate Exchange The Chicago Climate Exchange (CCX) is a voluntary greenhouse gas cap and trade system. CCX members make a voluntary, but legally binding commitment to meet certain annual greenhouse gas emission reduction targets. Founded in 2000, CCX welcomed its first members from Australia, China and India in 2006. From 2007 to 2010, CCX grew to over 300 members and by 2010 included members and projects based in Australia, Brazil, Canada, Chile, China, Costa Rica, India and New Zealand. During Phase I (2003-2006), members committed to a 1% annual reduction compared to their average contributions between 1998 and 2001, or an overall reduction of direct greenhouse gas emissions of 4% below an agreed baseline. Phase II was extended through 2010 and committed members to reduce greenhouse gas emissions by 6% below the baseline. Members include corporations, cities, municipalities, and states. Municipalities include the Cities of: Aspen; Berkeley; Boulder; Chicago; Fargo; Melbourne, Australia; Oakland; and Portland. Counties include: King County, Washington; Miami-Dade County, Florida; and Sacramento County, California. States include the State of Illinois and the State of New Mexico.
Box 3: EU Covenant of Mayors The EU Covenant of Mayors is an initiative that created a community of local governments focused on climate protection. On the 10th of February 2009, more than 370 cities from thirty countries came together to attend a prestigious signature ceremony in Brussels. Since then, over two thousand local authorities have opted to join the Covenant. Signatories of the Covenant of Mayors formally commit to achieve the ambitious targets set in the EU Climate Action and Energy Package. However, non-European cities may also join the covenant. Currently, non-European cities include Buenos Aires and Christchurch. The Climate and Energy Package aims to: (1) reduce EU greenhouse gas emissions by at least 20% from 1990 levels by 2020; (2) increase the EU s use of renewable energy to account 20% of total consumption; and (3) reducing energy consumption by 20% through increased energy efficiency. Upon signing the Covenant, local authorities commit themselves to submitting their Sustainable Energy Action Plans (SEAPs). Each SEAP lays forth in greater detail how each local government intends to reach its CO2 targets by 2020. A Covenant of Mayors office has been establish to provide coordinate and support to cities as well as to monitor the progress and SEAP implementation by various participating cities.
Box 4: Mexico City Pact and Cities Climate Registry The Mexico City Climate Pact was launched in November 2010 in conjunction with the UNFCCC Conference of the Parties meeting in Cancun, Mexico. The Pact is a voluntary initiative of mayors and local representatives that consists of 10 action points. By March 2011, it had been signed by 179 local governments committing to implement low carbon options and register emissions inventories. Pact members pledge to take actions in a measurable, reportable and verifiable manner. Renewable energy will play a major role in implementing these commitments.
(continued next page)
11
Box 4: Mexico City Pact and Cities Climate Registry (continued) The Pact envisages that signatories report their climate commitments, performance and actions regularly through the “carbonn” Cities Climate Registry (cCCR). The cCCR was also established in late 2010 to provide a focal point for local government reporting of climate-related actions and commitments. It also encourages city-to-city knowledge transfer of best practices for local climate action.The cCCR is another example of growing global recognition of the key role cities and towns play in shaping and guiding local energy agendas. For more information, see: http://www.worldmayorscouncil.org/the-mexico-city-pact.html
There are a number of international collaborative associations that support local action. Most well-
known are several initiatives by ICLEI that bring together local stakeholders from around the world,
including a local renewables “model communities” network linked to ICLEI s Local Renewables
Initiative. Other examples include the C40 Cities Climate Leadership Group (which has focused on
energy efficiency improvements in 40 major cities); the European Green Cities Network (which
provides analysis and training on sustainable urban housing); and the International Solar Cities
Initiative (which convenes biennial conferences). In Asia, the cities of Bangkok Jakarta, Manila,
and Vientiane came together in 2009 to adopt a founding declaration establishing the “Cool
ASEAN, Green Capitals” initiative to address climate change. Initially spearheaded through ASEAN
by Bangkok s Governor, Mom Rajawongse Sukhumbhand Paribatra, this framework is set to
launch sometime in 2010, and includes renewable energy as one of the major fronts that will
contribute towards carbon reduction. Finally, there are also national and regional awards and
recognition programs emerging, such as the European Commission s “European Green Capital”
awards, which have already recognized cities as “capital of the year” for 2010 and 2011. (Note: a
comprehensive list of associations, programs and resources is planned for future editions of this
report.)
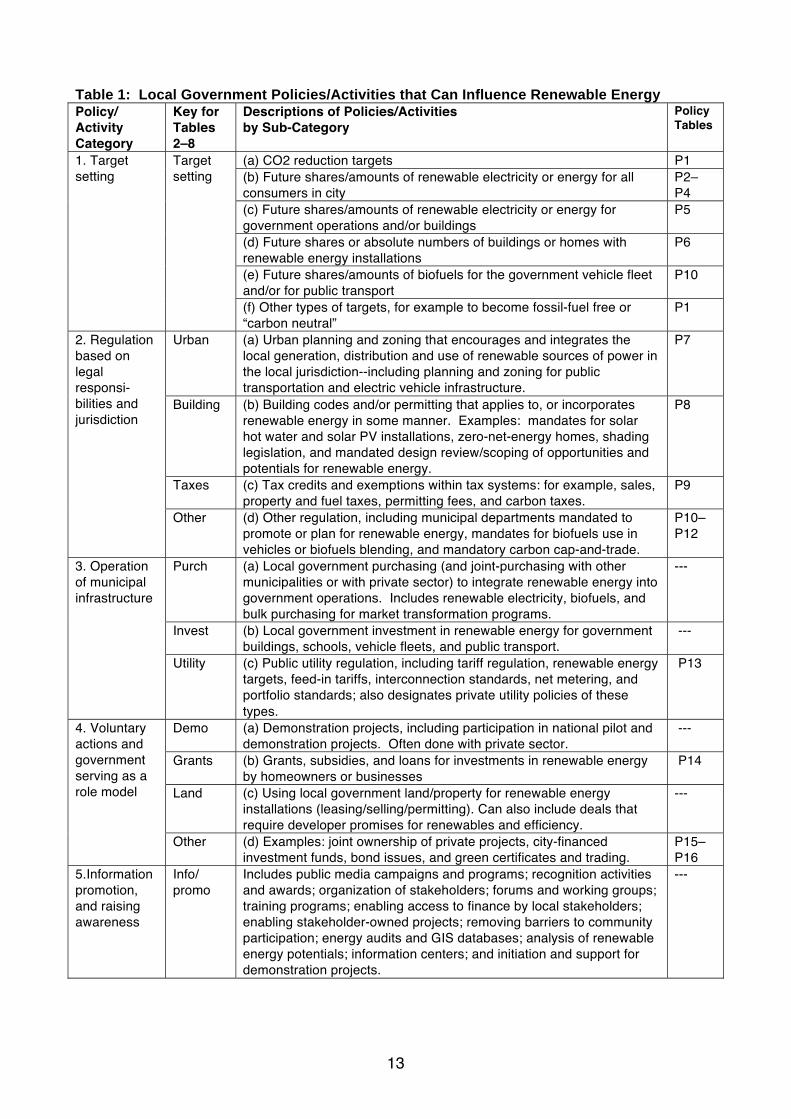
3. TYPES OF LOCAL POLICIES AND ACTIVITIES TO PROMOTE RENEWABLE ENERGY Local policies and activities to promote renewable energy can be grouped into five main categories
(see Table 1 and indicated policy example tables P1–P16). (Note: Only some policies in Table 1
may be relevant to a given situation, depending on local jurisdiction. And not all possible policies
are shown in Table 1.) These five categories are:
1. Target setting. The local government establishes a target (goal) for some future level of
renewable energy. The target can be for government-only consumption or investment, or apply to
all or some classes of energy consumers within the local government s jurisdiction. This is a
voluntary activity that is often the starting point for adopting policies and actions. There are many
different types of targets that cities can adopt. Many targets are for future emissions reductions of
CO2, to be met by a combination of energy conservation, energy efficiency, changes in energy
demand patterns (such as transport modal shifts), and investment in or purchase of renewable
energy. (Note: most commonly, the proportion of the CO2 reduction to be met by renewables is
12
unspecified, so CO2 reduction targets are considered “partial” targets for renewable energy. In
most cases, CO2 reduction targets alone, without a corresponding explicit renewable energy
target, imply a larger proportion of reductions from energy savings and efficiency than from
renewable energy.)
2. Regulation based on legal responsibilities and jurisdiction. These policies and activities are
regulatory in nature, based upon the legal responsibilities and jurisdiction of the local government
that are provided by charters or similar articles of incorporation, and by national and state laws.
Primary examples are urban planning, building codes, and local taxes.
3. Operation of municipal infrastructure. These policies and activities modify the ongoing operation
of municipal infrastructure to incorporate renewable energy, for example government energy
purchases or infrastructure investment, or policies or activities by public utility companies
(particularly electric utilities) that can be controlled or regulated by the local government. (Note:
public utility policies may depend upon utility infrastructure being under local control or jurisdiction.)
This category also includes renewable energy policies by private local utilities that may be enacted
independently of government control.
4. Voluntary actions and government serving as role model. These policies and activities go
beyond legal responsibilities and jurisdiction to take advantage of the various possible roles of a
local government as market facilitator, promoter, and role model. Many of these policies and
activities may also contribute to raising general awareness.
5. Information, promotion and raising awareness. These policies and activities target the general
public, specific stakeholders or groups, and/or private businesses, with the aim of facilitating or
enabling support for renewable energy. Activities may also include informational and media
campaigns, support for education and training programs, analysis of renewable energy potentials,
building-specific audits, and geographic information system (GIS) databases.
13
Table 1: Local Government Policies/Activities that Can Influence Renewable Energy Policy/ Activity Category
Key for Tables 2–8
Descriptions of Policies/Activities by Sub-Category
Policy Tables
(a) CO2 reduction targets P1 (b) Future shares/amounts of renewable electricity or energy for all consumers in city
P2– P4
(c) Future shares/amounts of renewable electricity or energy for government operations and/or buildings
P5
(d) Future shares or absolute numbers of buildings or homes with renewable energy installations
P6
(e) Future shares/amounts of biofuels for the government vehicle fleet and/or for public transport
P10
1. Target setting
Target setting
(f) Other types of targets, for example to become fossil-fuel free or “carbon neutral”
P1
Urban (a) Urban planning and zoning that encourages and integrates the local generation, distribution and use of renewable sources of power in the local jurisdiction--including planning and zoning for public transportation and electric vehicle infrastructure.
P7
Building (b) Building codes and/or permitting that applies to, or incorporates renewable energy in some manner. Examples: mandates for solar hot water and solar PV installations, zero-net-energy homes, shading legislation, and mandated design review/scoping of opportunities and potentials for renewable energy.
P8
Taxes (c) Tax credits and exemptions within tax systems: for example, sales, property and fuel taxes, permitting fees, and carbon taxes.
P9
2. Regulation based on legal responsi-bilities and jurisdiction
Other (d) Other regulation, including municipal departments mandated to promote or plan for renewable energy, mandates for biofuels use in vehicles or biofuels blending, and mandatory carbon cap-and-trade.
P10– P12
Purch (a) Local government purchasing (and joint-purchasing with other municipalities or with private sector) to integrate renewable energy into government operations. Includes renewable electricity, biofuels, and bulk purchasing for market transformation programs.
---
Invest (b) Local government investment in renewable energy for government buildings, schools, vehicle fleets, and public transport.
---
3. Operation of municipal infrastructure
Utility (c) Public utility regulation, including tariff regulation, renewable energy targets, feed-in tariffs, interconnection standards, net metering, and portfolio standards; also designates private utility policies of these types.
P13
Demo (a) Demonstration projects, including participation in national pilot and demonstration projects. Often done with private sector.
---
Grants (b) Grants, subsidies, and loans for investments in renewable energy by homeowners or businesses
P14
Land (c) Using local government land/property for renewable energy installations (leasing/selling/permitting). Can also include deals that require developer promises for renewables and efficiency.
---
4. Voluntary actions and government serving as a role model
Other (d) Examples: joint ownership of private projects, city-financed investment funds, bond issues, and green certificates and trading.
P15– P16
5.Information promotion, and raising awareness
Info/ promo
Includes public media campaigns and programs; recognition activities and awards; organization of stakeholders; forums and working groups; training programs; enabling access to finance by local stakeholders; enabling stakeholder-owned projects; removing barriers to community participation; energy audits and GIS databases; analysis of renewable energy potentials; information centers; and initiation and support for demonstration projects.
---

14
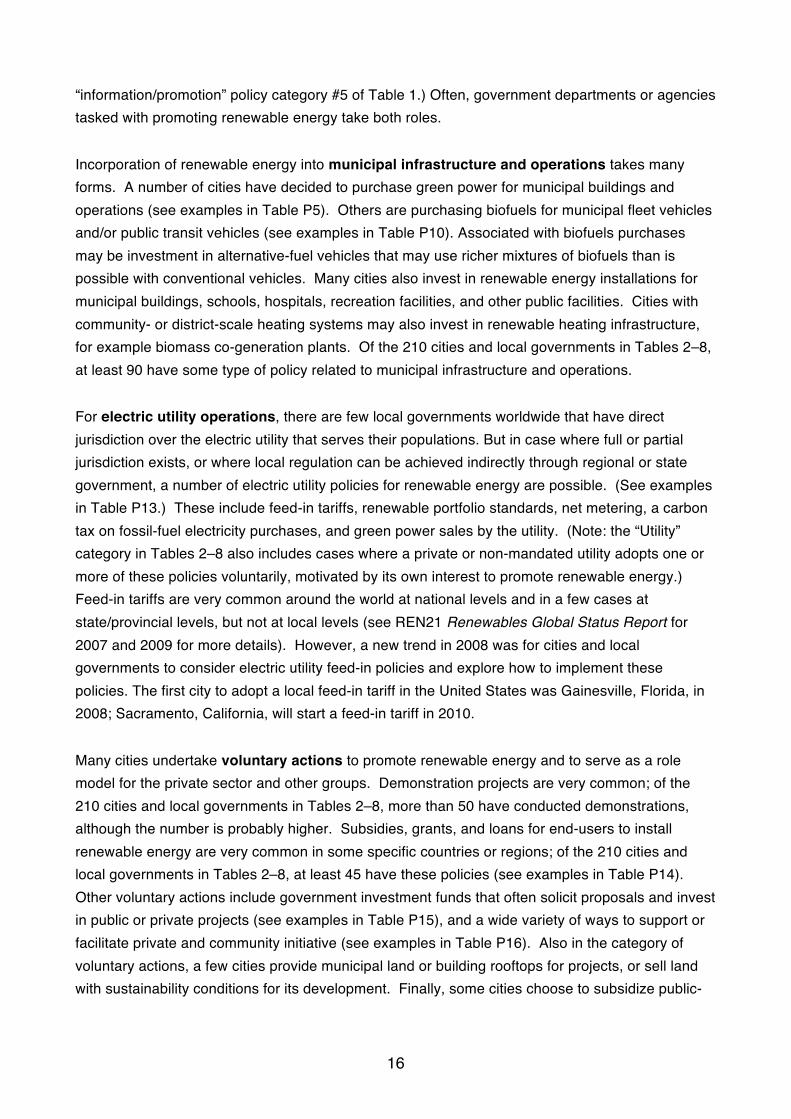
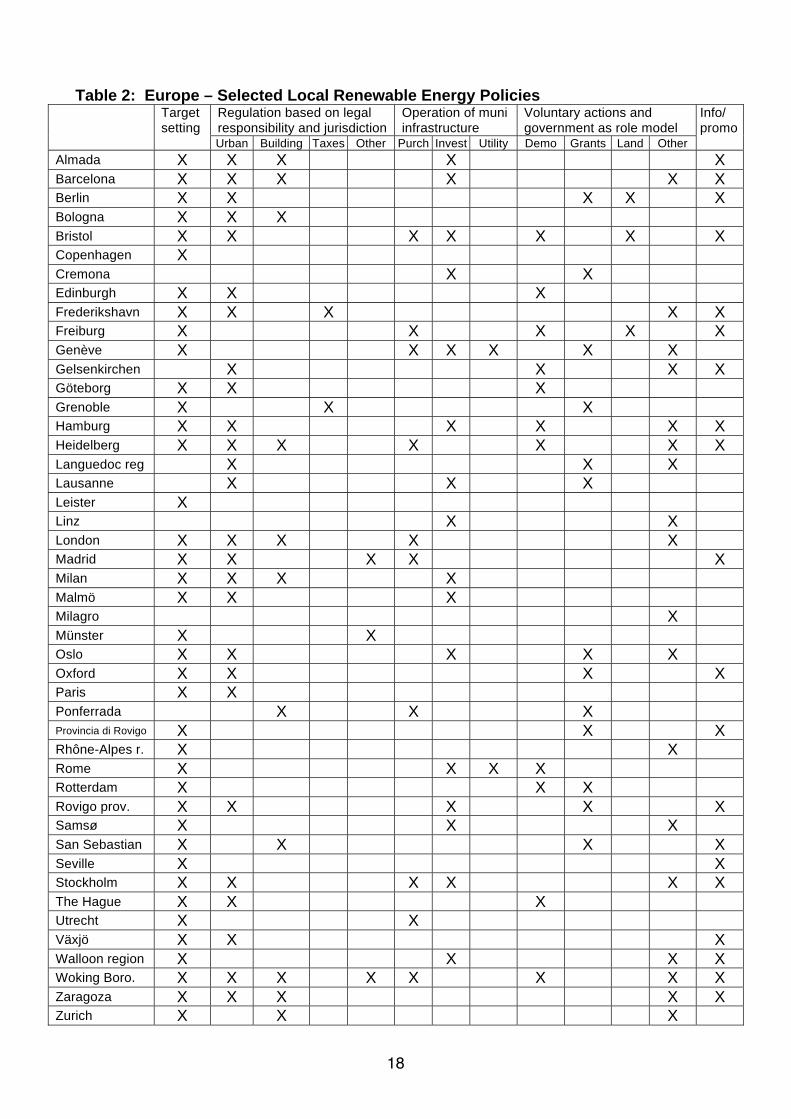
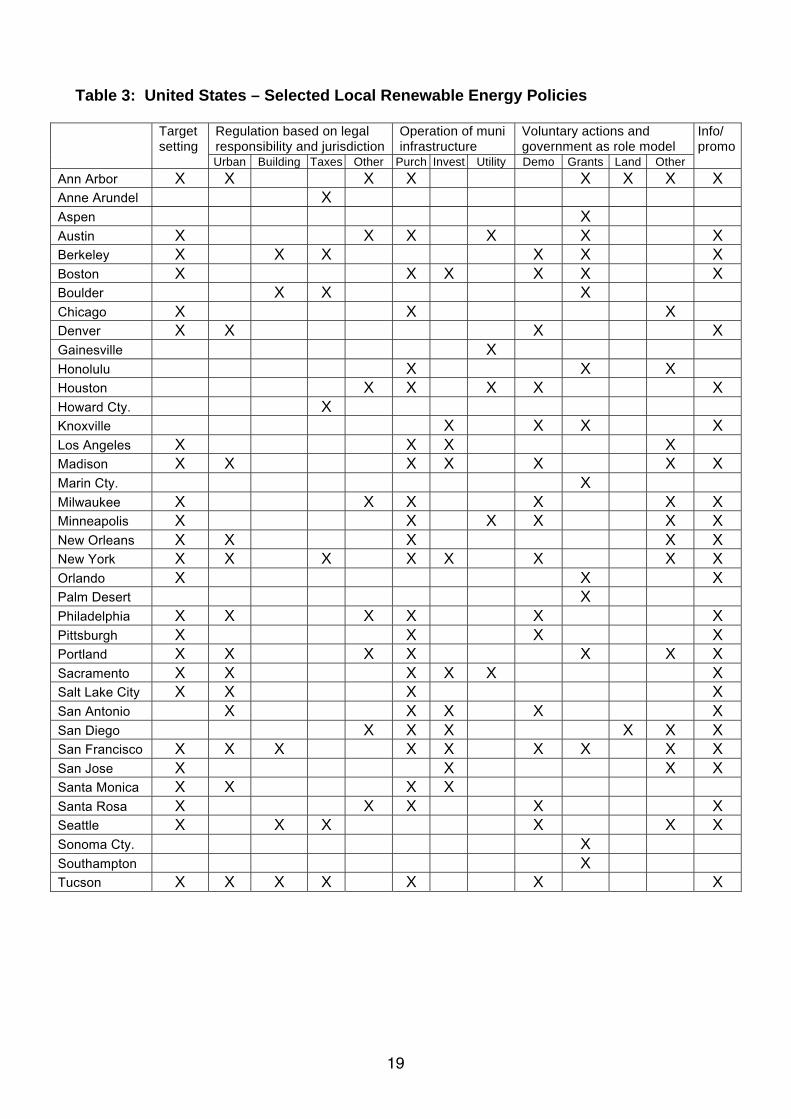
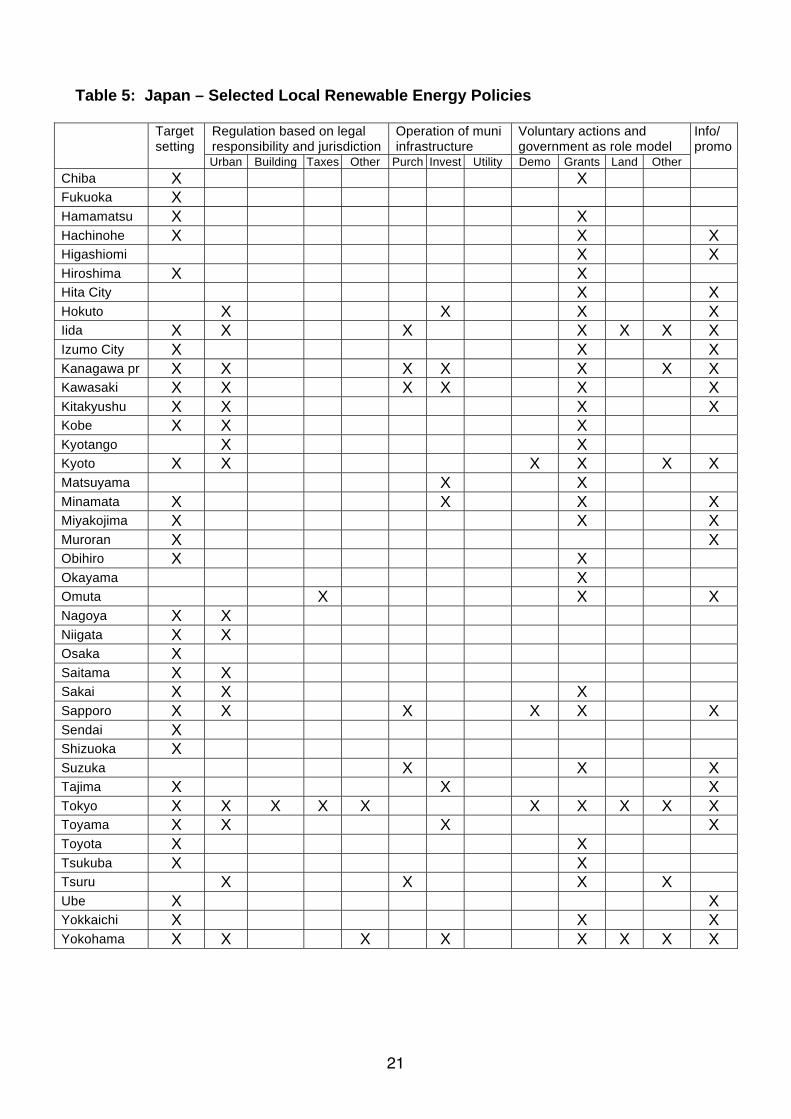
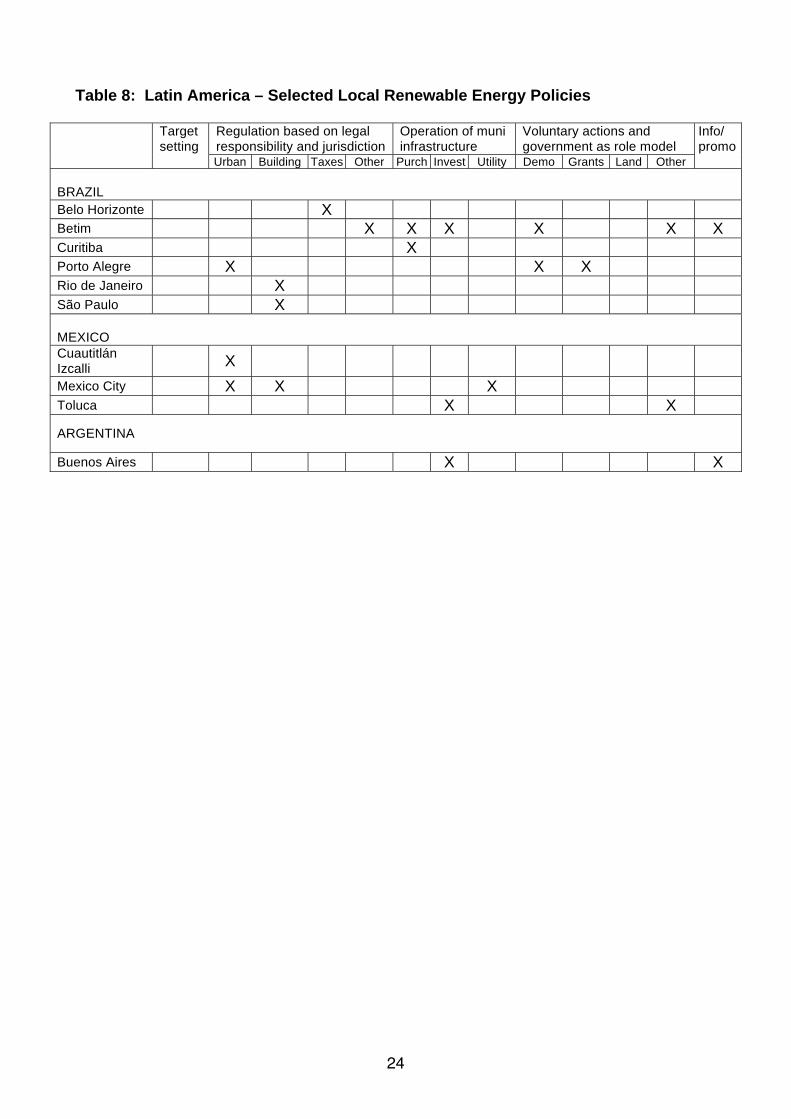
4. SURVEY OF LOCAL RENEWABLE ENERGY POLICIES IN 210 CITIES WORLDWIDE Policies and activities to promote renewable energy at the local level by 210 selected cities and
local governments worldwide are shown in Tables 2–8. Columns correspond to the categories and
sub-categories from Table 1.
(Notes: There are many more cities and hundreds of smaller local governments that could be
shown in these tables. The cities and local governments shown in these tables are based on data
availability and well-known cases, but have not been selected according to any formal criteria.
Check-boxes for specific policies in specific cities are based on judgment of the lead author, given
available information. Further drafts of this report will include more cities and local governments
and may establish criteria for inclusion in some categories. For details of state and national policies
for renewable energy that often underlie and support local policies, see the global “Policy
Landscape” section of the REN21 Renewables Global Status Report, available at www.ren21.net,
and also links to a wide variety of policy references and databases at
www.martinot.info/policies.htm.)
The most common type of policy is target setting. (See examples in Tables P1–P6.) Almost all
cities working to promote renewable energy at the local level have established some type of
renewable energy or CO2 reduction target. Of the 210 cities and local governments in Tables 2–8,
at least 145 have some type of future target for renewable energy and/or CO2. Often, cities set
targets based on analysis of energy consumption and reduction potentials. Some of the pioneering
cities in target setting have even met their goals, or are now setting stronger targets based on
accumulated experience.
CO2 or greenhouse-gas reduction targets are common for the years 2010–2012, similar to Kyoto
Protocol targets at the national level, and typically for 10–20% reduction of emissions from 1990
levels. CO2 targets for 2020 and beyond have appeared in recent years and are typically for 20–
40% reductions by 2020, with some CO2 targets now even extending to 2050. Other cities have
targets to become fully or partially “carbon neutral” (zero net emissions) by a future year. One
novel type of CO2 target is emissions per-capita, with several cities targeting a reduction in this
indictor over time.
There are several types of renewable-energy-specific targets. One type is for the renewable share
of total electricity consumption, with several cities in the range 10–30%. Some cities target the
share of electricity consumed by the government itself, for its own buildings, vehicle fleets, and
operations. Such “own-use” targets can range from 10% to 100%. Another type of target is total
share of energy from renewables (e.g., including transport and heating, not just electricity), or
share of energy just for a specific sector like buildings. Some targets are for total amounts of
installed renewable energy capacity, such as megawatts of solar PV or wind power, or the number
or total surface area of solar hot water collectors.
15
Another common policy is urban planning that incorporates renewable energy. (See examples in
Table P7.) Urban plans take many forms and titles, ranging from “vision” to “strategy” to “plan” but
the essential feature is that a plan call for integrating renewable energy in some systematic and
long-term fashion into city development. The first element of a plan is often the targets mentioned
above, followed by elaboration of specific policies or activities. Some plans are relative short-term,
for example 5 years or less, while many others extend to 2020, 2030, or even 2050. Of the 210
cities and local governments in Tables 2–8, at least half have some type of urban planning that
incorporates renewable energy.
One type of policy emerging in recent years is incorporation of renewable energy in building
codes or permitting. (See examples in Table P8.) Barcelona, Spain, was one of the pioneers
with this type of policy, and mandated solar hot water in all new construction above a certain size
threshold (the threshold was later eliminated). Barcelona s ordinance was then followed by over 70
other municipalities in Spain, and also by the national government. (See Barcelona case
description in Section 5.) Other types of mandates are for design reviews prior to construction that
reveal the opportunities for integrating solar into building designs, or for building designs to include
“stub-outs” or other features that allow for future installation of renewables. A number of cities in
China have mandated solar hot water in new multi-family apartment buildings, and 12 stories in
height appears to be the cut-off point for such mandates (with more stories, roof area becomes
inadequate). Of the 210 cities and local governments in Tables 2–8, at least 30 have some type of
building code or permitting policy that incorporates renewable energy.
In contrast to renewable energy policy at the state and national levels in many countries around the
world, tax credits and exemptions for renewable energy at the local level are not very common.
(See examples in Table P9.) Of the 210 cities and local governments in Tables 2–8, only 15 were
found to have some form of these policies. Property tax credits or abatement for residential
installations appear to be the most common.
Many other regulatory measures for renewable energy are possible. There are just a few
examples identified so far, however. One example is a mandate for blending biofuels with all
gasoline and/or diesel fuel sold within city limits (see Portland example in Table P10). Another
example is mandating that all taxis use biofuels (see Betim example in Table P10). A third
example is mandating a carbon cap-and-trade system on large businesses within city jurisdiction
(see Tokyo example in Table P11).
Related to regulatory measures are a number of cases where local governments have established
city departments or public market-facilitation agencies that are planning, regulating, and/or
promoting renewable energy. (See examples in Table P12.) These agencies may have a
regulatory function, or they may be “market facilitation” agencies that provide information, training,
finance, stakeholder convening, public outreach, etc. (The later are best categorized under the
16
“information/promotion” policy category #5 of Table 1.) Often, government departments or agencies
tasked with promoting renewable energy take both roles.
Incorporation of renewable energy into municipal infrastructure and operations takes many
forms. A number of cities have decided to purchase green power for municipal buildings and
operations (see examples in Table P5). Others are purchasing biofuels for municipal fleet vehicles
and/or public transit vehicles (see examples in Table P10). Associated with biofuels purchases
may be investment in alternative-fuel vehicles that may use richer mixtures of biofuels than is
possible with conventional vehicles. Many cities also invest in renewable energy installations for
municipal buildings, schools, hospitals, recreation facilities, and other public facilities. Cities with
community- or district-scale heating systems may also invest in renewable heating infrastructure,
for example biomass co-generation plants. Of the 210 cities and local governments in Tables 2–8,
at least 90 have some type of policy related to municipal infrastructure and operations.
For electric utility operations, there are few local governments worldwide that have direct
jurisdiction over the electric utility that serves their populations. But in case where full or partial
jurisdiction exists, or where local regulation can be achieved indirectly through regional or state
government, a number of electric utility policies for renewable energy are possible. (See examples
in Table P13.) These include feed-in tariffs, renewable portfolio standards, net metering, a carbon
tax on fossil-fuel electricity purchases, and green power sales by the utility. (Note: the “Utility”
category in Tables 2–8 also includes cases where a private or non-mandated utility adopts one or
more of these policies voluntarily, motivated by its own interest to promote renewable energy.)
Feed-in tariffs are very common around the world at national levels and in a few cases at
state/provincial levels, but not at local levels (see REN21 Renewables Global Status Report for
2007 and 2009 for more details). However, a new trend in 2008 was for cities and local
governments to consider electric utility feed-in policies and explore how to implement these
policies. The first city to adopt a local feed-in tariff in the United States was Gainesville, Florida, in
2008; Sacramento, California, will start a feed-in tariff in 2010.
Many cities undertake voluntary actions to promote renewable energy and to serve as a role
model for the private sector and other groups. Demonstration projects are very common; of the
210 cities and local governments in Tables 2–8, more than 50 have conducted demonstrations,
although the number is probably higher. Subsidies, grants, and loans for end-users to install
renewable energy are very common in some specific countries or regions; of the 210 cities and
local governments in Tables 2–8, at least 45 have these policies (see examples in Table P14).
Other voluntary actions include government investment funds that often solicit proposals and invest
in public or private projects (see examples in Table P15), and a wide variety of ways to support or
facilitate private and community initiative (see examples in Table P16). Also in the category of
voluntary actions, a few cities provide municipal land or building rooftops for projects, or sell land
with sustainability conditions for its development. Finally, some cities choose to subsidize public-

17
access biofuels stations, including conversion costs for conventional tanks and pumps, and also
biofuels production and distribution (see examples in Table P10).
Voluntary information and promotion activities are very diverse. Activities among many of the
210 cities and local governments in Tables 2–8 include public media campaigns and programs;
recognition activities and awards; organization of stakeholders; forums and working groups;
training programs; enabling access to finance by local stakeholders; enabling stakeholder-owned
projects; removing barriers to community participation; energy audits and GIS databases; analysis
of renewable energy potentials; information centers; and initiation and support for demonstration
projects.
18
Table 2: Europe – Selected Local Renewable Energy Policies Regulation based on legal responsibility and jurisdiction
Operation of muni infrastructure
Voluntary actions and government as role model
Target setting
Urban Building Taxes Other Purch Invest Utility Demo Grants Land Other
Info/ promo
Almada X X X X X Barcelona X X X X X X Berlin X X X X X Bologna X X X Bristol X X X X X X X Copenhagen X Cremona X X Edinburgh X X X Frederikshavn X X X X X Freiburg X X X X X Genève X X X X X X Gelsenkirchen X X X X Göteborg X X X Grenoble X X X Hamburg X X X X X X Heidelberg X X X X X X X Languedoc reg X X X Lausanne X X X Leister X Linz X X London X X X X X Madrid X X X X X Milan X X X X Malmö X X X Milagro X Münster X X Oslo X X X X X Oxford X X X X Paris X X Ponferrada X X X Provincia di Rovigo X X X Rhône-Alpes r. X X Rome X X X X Rotterdam X X X Rovigo prov. X X X X X Samsø X X X San Sebastian X X X X Seville X X Stockholm X X X X X X The Hague X X X Utrecht X X Växjö X X X Walloon region X X X X Woking Boro. X X X X X X X X Zaragoza X X X X X Zurich X X X
19
Table 3: United States – Selected Local Renewable Energy Policies
Regulation based on legal responsibility and jurisdiction
Operation of muni infrastructure
Voluntary actions and government as role model
Target setting
Urban Building Taxes Other Purch Invest Utility Demo Grants Land Other
Info/ promo
X X X X X X X X
X
X
X X X X X X
X X X X X X
X X X X X X
X X X
X X X
X X X X
X
X X X
X X X X X
X
X X X X
X X X X
X X X X X X X
X
X X X X X X
X X X X X X
X X X X X
X X X X X X X X
X X X
X
X X X X X X
X X X X
X X X X X X X
X X X X X X
X X X X
X X X X X
X X X X X X
X X X X X X X X X
X X X X
X X X X
X X X X X
X X X X X X
X
X
X X X X X X X
20
Table 4: Canada – Selected Local Renewable Energy Policies
Regulation based on legal responsibility and jurisdiction
Operation of muni infrastructure
Voluntary actions and government as role model
Target setting
Urban Building Taxes Other Purch Invest Utility Demo Grants Land Other
Info/ promo
Caledon ON X X X X X X Calgary AB X X X X Craik SK X X X Edmonton AB X X Guelph ON X X X X Halifax NS X X X X Hamilton ON X X X X Markham ON X X X X X Mississauga ON X X X Montreal QC X X X Oakville ON X X X Okotoks AB X X X X X Ottawa ON X X X X Richmond Hill ON
X X X X
Sudbury ON X X Surrey BC X X Toronto ON X X X X X X X X Vancouver BC X X X X Winnipeg MB X X Whitehorse YT X X X
21
Table 5: Japan – Selected Local Renewable Energy Policies
Regulation based on legal responsibility and jurisdiction
Operation of muni infrastructure
Voluntary actions and government as role model
Target setting
Urban Building Taxes Other Purch Invest Utility Demo Grants Land Other
Info/ promo
Chiba X X Fukuoka X Hamamatsu X X Hachinohe X X X Higashiomi X X Hiroshima X X Hita City X X Hokuto X X X X Iida X X X X X X X Izumo City X X X Kanagawa pr X X X X X X X Kawasaki X X X X X X Kitakyushu X X X X Kobe X X X Kyotango X X Kyoto X X X X X X Matsuyama X X Minamata X X X X Miyakojima X X X Muroran X X Obihiro X X Okayama X Omuta X X X Nagoya X X Niigata X X Osaka X Saitama X X Sakai X X X Sapporo X X X X X X Sendai X Shizuoka X Suzuka X X X Tajima X X X Tokyo X X X X X X X X X X Toyama X X X X Toyota X X Tsukuba X X Tsuru X X X X Ube X X Yokkaichi X X X Yokohama X X X X X X X X

22
Table 6: Australia and New Zealand – Selected Local Renewable Energy Policies
Regulation based on legal responsibility and jurisdiction
Operation of muni infrastructure
Voluntary actions and government as role model
Target setting
Urban Building Taxes Other Purch Invest Utility Demo Grants Land Other
Info/ promo
AUSTRALIA
Adelaide X X X X X X X Alice Springs X X X X X Ballarat X X X Blacktown X X X Brisbane X X X Canberra, ACT X X X Clarence Vly. X X Darwin X Hepburn Sh. X X X X Melbourne X X X X X Moreland X X X New Castle X X X X Perth X X X X Sydney X X X X X Townsville X X X X NEW ZEALAND
Christchurch X X X X X X X X X Dunedin X X X Nelson X X X X X Waitakere X X X X X X Wellington X X X X

23
Table 7: China, India, and Asia/Other – Selected Local Renewable Energy Policies
Regulation based on legal responsibility and jurisdiction
Operation of muni infrastructure
Voluntary actions and government as role model
Target setting
Urban Building Taxes Other Purch Invest Utility Demo Grants Land Other
Info/ promo
CHINA Baoding X X X Beijing X X X X X Dezhou X X X Kunming X X X X X X X Lianyungang X Rizhao X X X X Shanghai X X X X X Shenzhen X Taipai City X X X Tianjin X X X X Wuhan X INDIA Bhubaneswar X X X X Delhi X X X X X Coimbatore X Nagpur X X X X X X Rajkot X X X X X X KOREA Busan X Daegu X X X X X Gwangju X X X Jeju prov. X Seoul X OTHER ASIA Hong Kong X Iloilo City X Kuala Lumpur X Quezon City X X Singapore X X X AFRICA/MIDDLE EAST Abu Dhabi X X X X Cape Town X X Dubai X X Durban X X Johannesburg X X Nelson Mandela Bay
X X
24
Table 8: Latin America – Selected Local Renewable Energy Policies
Regulation based on legal responsibility and jurisdiction
Operation of muni infrastructure
Voluntary actions and government as role model
Target setting
Urban Building Taxes Other Purch Invest Utility Demo Grants Land Other
Info/ promo
BRAZIL Belo Horizonte X Betim X X X X X X Curitiba X Porto Alegre X X X Rio de Janeiro X São Paulo X MEXICO Cuautitlán Izcalli
X
Mexico City X X X Toluca X X
ARGENTINA
Buenos Aires X X
25
5. TOWARDS 100% RENEWABLES – LEADING CITIES, COMMUNITIES, AND REGIONS
A 100% renewable energy society is perceived by many to be a fanciful dream reserved only for
the distant future. However, a growing number of cities, communities, and other local governments
are challenging that perception. And a few have already reached that 100% goal. This section
explores a number of examples of cities and local governments that are leading the way, and also
highlights some successful approaches.
Working towards supplying 100% of local energy needs from renewable sources is an immense
challenge. The initiatives undertaken by community leaders, businesses, and local residents reflect
the diverse regions, cultures, and political regimes from which they originate. Yet, local
governments also share a set of common experiences, both in the types of hurdles they face, and
the objectives they strive to achieve. For example, a prominent recurring theme from local
communities that have successfully achieved, or are close to achieving, the 100% target is that the
benefits of renewable energy is not a mantra preached solely from local leaders or figures of
authority, instead it is a stance that is accepted by all levels of a society.
For the purposes of this survey, “100%” cities, communities, and regions are defined as local
governments that have achieved or have in place strategies to move towards achieving 100% of
their energy requirements from renewable energy sources. This includes regions that have
exceeded the 100% benchmark to become exporters of renewable energy. The term carbon
neutral is also used interchangeably to mean 100% renewable.
“100%” Communities Already Exist
One of the earliest pioneering efforts to succeed in becoming 100% renewable is seen in the
community of Dardesheim, in the state of Saxony Anhalt, Germany. With less than 1,000
inhabitants, Dardesheim is one of Germany s smallest towns. Yet, Dardesheim s experience in
transforming itself into a renewable energy community encompasses many of the same themes
witnessed in other renewable energy cities and communities. In particular, renewable energy
projects were championed by local pioneers who earned the public s backing by re-characterizing
the discourse not as one relating to climate change per se, but instead as part of a town s efforts to
stimulate the local economy, create new employment and increase business opportunities.
Dardesheim s renewable energy story began when Heinrich Bartelt envisioned the construction of
an entire wind park in Saxony Anhalt. Bartelt, along with local pioneer Karl Radach, advocated for
the expansion of wind energy by inviting and encouraging local citizens to become involved in the
project. Their tireless campaigns meant that it was not until 2004 that the wind park was built –
almost a decade after plans for the wind park were first conceived. As a result of Bartelt and
Radach s efforts, the wind project enjoys a high degree of citizen participation and support. Not
26
only were the residents thoroughly informed about both the impacts and benefits of the project, but
the wind park s turbines were also financially structured in a way that incentivizes citizens to
become involved. For example, project participants enjoy a share in the rent revenues and hold
shares that offer a minimum rate of return of eight percent. This proved to be especially appealing
to the residents because, just like many rural areas in Europe, Dardesheim was economically
depressed due to the effects of structural changes after German reunification. The decision for a
wind park was thus also a means of revitalizing the local economy by not only creating new job
opportunities, but also by bringing in additional revenue by becoming an energy exporter. Indeed,
the town currently produces ten times the amount of energy the city consumes using local
renewable energy sources.
The Dardesheim example is illustrative of the form of leadership evidenced in other local
governments working towards 100% renewables. In the Danish island of Samsø, local project
leader Søren Hermansen played an invaluable role in convincing local opinion of the wind project s
benefits. Hermansen s team believed that a high degree of civic participation was needed to
ensure the long-term viability of the project. As a result, Samsø is now completely powered by
renewable-electricity. And all onshore turbines and one offshore turbine are owned by locals, either
through a cooperative or with private ownership schemes.
In both the Austrian city of Güssing and the Japanese city of Kuzumaki, local authorities
endeavoured to familiarize the local populace with renewable energy through demonstration
projects and awareness campaigns. In Kuzumaki, the city council took great measures to increase
awareness and involvement of its residents by holding town meetings, establishing educational
tours, and publishing a newsletter. Similarly, numerous renewable energy demonstration facilities,
including a rapeseed-based biodiesel plant and local biomass heating systems, were built by the
city of Güssing. Once again, the initial push was set in motion by local pioneers and leaders, as
opposed to foreign investors or the national government. In Güssing, the local mayor Peter Vadasz
and Reinhard Koch, then technical director for the city council, came together to convince the city
council to strive to achieve 100% local renewable energy use. The former mayor of Kuzumaki, Mr.
Nakamura, strongly supported the renewable energy-related activities of staff-members. For
example, the former mayor supported Mr. Shimotenma s collaboration with private businesses to
promote and implement wind power, biomass plants and other renewables. Both Güssing and
Kuzumaki now produce more than 100% of their energy needs through renewable sources. In fact,
Güssing achieved its 1990 target to use 100% renewable energy in just over a decade, in 2001,
and now feeds the surplus energy produced back into the public grid.
Another pivotal consideration in analyzing Dardesheim, Samsø, Güssing, and Kuzumaki is the
actual size of the communities and their comparatively weak economic standing. While Kuzumaki
has the comparatively large population size of 8,200 inhabitants, the remaining three European
100% communities all have a population size of fewer than 5,000. The transformation into a
renewable energy community undoubtedly does not occur in a vacuum. The experience of these
27
four communities suggest that along with favourable local weather conditions and a willing local
leadership, a slowing economy, and a smaller population size have also been critical factors in
providing a solid underpinning for a renewable energy paradigm shift.
It is perhaps not surprising that smaller communities – with less energy demand – are the ones to
first achieve energy independence. The presence of a declining economy as well as a smaller
population size can make renewable energy a clearly favorable proposition to local residents.
However, the concept of supplying an entire city completely with renewable energy is a
revolutionary break from the fossil-fuel driven development of the previous century. Furthermore,
from the perspective of the residents of towns such as Samsø and Güssing in the 1990s, the
ambition to be completely renewable was an uncharted step into new territory. Had the push to
become 100% renewable occurred first in a major metropolis or during a period of economic boom,
it is unclear whether it would have garnered the same amount of public support in the face of larger
diversity in interest groups, and a population not beset by a lack of opportunities.
Before the renewable energy projects were initiated, Güssing was in economic decline. The city is
located in the peripheral area of Eastern Austria, was not connected with any motorway or railway
line and had no large-scale industry. As a result, Güssing was among Austria s poorest
municipalities, suffering from high unemployment (around 28-30%), and the emigration of its young
people. Mayor Vadasz, Koch and the city council relied upon the large-scale introduction of
renewable energies to improve the local economic situation – and it worked. The growth of the
renewable industry in Güssing created more than 1,000 jobs, produced a regional value added of
around 14 million every year, and increased municipal tax revenue from 400,000 (1990) to 1.4
million (2008). Similarly, the island town of Samsø suffered from rising unemployment and
migration rates prior to the local renewable energy project. The residents of Samsø thus welcomed
the renewable energy initiative as an opportunity for new business and jobs. Ten years on, the
renewable energy project has indeed increased local employment, tourism, and helped reverse the
island s economic decline.
Towards 100% Futures
The gradual acceptance that the development of a clean energy infrastructure is consistent with
economic growth will undoubtedly spur many communities and larger cities to strive towards a
100% renewable energy future. After all, cities of all sizes share mutual concerns of energy
security, job creation, cost reductions, pollution reduction, climate change and the desire to
development sustainably. In fact, the success of smaller communities to transform their economies
and become 100% renewable should inspire and assist larger cities regions to consider doing
likewise.
Increasingly, global initiatives recognize that local green development can act as a strong driving
force behind economic growth. Evidence of this can be seen in the Spanish region of Navarra

28
where 4,000 new jobs have been created in the past decade. Navarra is an example of a small-
scale renewables initiative taking place within a larger region. With a population of over 600,000,
Navarra now generates almost 70% of all electricity from wind and solar energies, including over
1,100 wind turbines. Local investors are enticed by the prospect of renewable technology s ability
to yield a certain level of annual income as well as tax breaks offered by the local government.
The local government in Navarra sought to induce local participation in the renewable project by
offering financial incentives to buyers of solar panels. As a result, Navarra now has one of the
world s largest cooperative solar parks, with each panel owned by an individual investor.
The Navarra case highlights the involvement of corporations and institutional investors. In Navarra,
individual local investors work in tandem with large multinational corporations. While each investor
commits approximately 50,000 per panel, it is a major business corporation, Acciona, which
helps arrange the financing, operates the site, and collects the feed-in tariffs. A similar case exists
in the Danish town of Frederickshavn, population 25,000, where a fund has been established to
finance renewables. To achieve the goal of becoming 100% renewable by 2015, the town
estimated needing a total investment of KR1 billion (about USD 170 million). In contrast to the
Samsø citizen-finance model, Frederickshavn is also soliciting finance from outside investors.
Unlike smaller initiatives, larger cities and regions usually also involve local residents in ways other
than direct ownership of solar power plants or wind farms. In Munich, the city initiated the München
Ecology Alliance program to bring together stakeholders from various sectors of the economy
regarding energy and CO2 reductions. This network of architects, industrial firms, banks,
chambers, corporations, building societies and other market participants reflect the growing
complexity in aligning the different incentives, policy needs, and economic determinations in a
major urban center.
Larger cities and regions illustrate a diverse approach to the most achievable targets. This includes
climate and renewable energy education, partnerships, municipal procurement policies and
financial subsidies. For example, the city of Munich launched an initiative for solar panels in
municipal buildings at a cost of 1.5 million. Such initiatives bring the use of renewable energy
into public attention and demonstrate the feasibility of solar energy. Munich has also introduced
public awareness campaigns; a climate protection program with the local utility; and a marketing
campaign for “10,000 solar roofs for Munich.” Similarly, the city of Copenhagen, which has plans to
become carbon neutral by 2025, integrates dozens of initiatives that covers energy supply,
alternative fuel vehicles, energy efficiency in buildings and urban development and adaptation.
(See Section 7 for these and other case summaries.) In addition, climate education programs and
various incentives offered by the municipality (such as free parking in the city for electric or
hydrogen powered cars) seek to effect climate- and renewable energy-friendly behavioural
changes in Copenhagen residents.
29
The Roles of National Governments
A common theme in many local initiatives towards 100% renewables is the presence of a
supportive national policy. National support comes in different forms, from outright sponsorship to
indirect promotion. The India Solar Cities Program and the U.S. Solar America Cities Programs are
good examples of national support for whole groups of cities collectively. In the India program, the
Ministry of New and Renewable Energy (MNRE) is providing financial support for 60 cities to
develop energy master plans, which aim at increasing significantly the share of renewable energy.
In other instances, national governments can play a more direct role in the promotion of renewable
energy in the local level. For example, Navarra has benefited from similarly progressive renewable
energy policies on the national level. The Spanish “Plan de Energias Renovables 2005-2010” set
the target for renewable energy at 12% of total energy consumption by 2010. Spain s main
renewable energy policies include a feed-in-tariff; fuel tax exemptions for biofuels; low interest
loans; and a new Technical Buildings Code which requires that new buildings cover 30-70% of
domestic hot water demand from solar thermal energy. Similarly, local renewable energy efforts in
the German cities of Dardesheim and Hamburg have benefited from strong national support.
Masdar City in the United Arab Emirates is an example of a planned city supported at the national
level and designed from the beginning to be completely reliant on renewable energy. The national
government has put up to $15 million in seed capital and the city is still under construction.
Selected Examples
Tables 9 and 10 give selected examples of cities and local governments striving towards 100%
renewables in the future. The growing number of cities in this category illustrates that the notion
that a community or city can meet all of its energy needs with renewable energy is not only
becoming accepted, it is becoming more widespread. There are also many other cities,
communities, and regions not listed in Tables 9 and 10 that will be included in future editions of this
report.
30
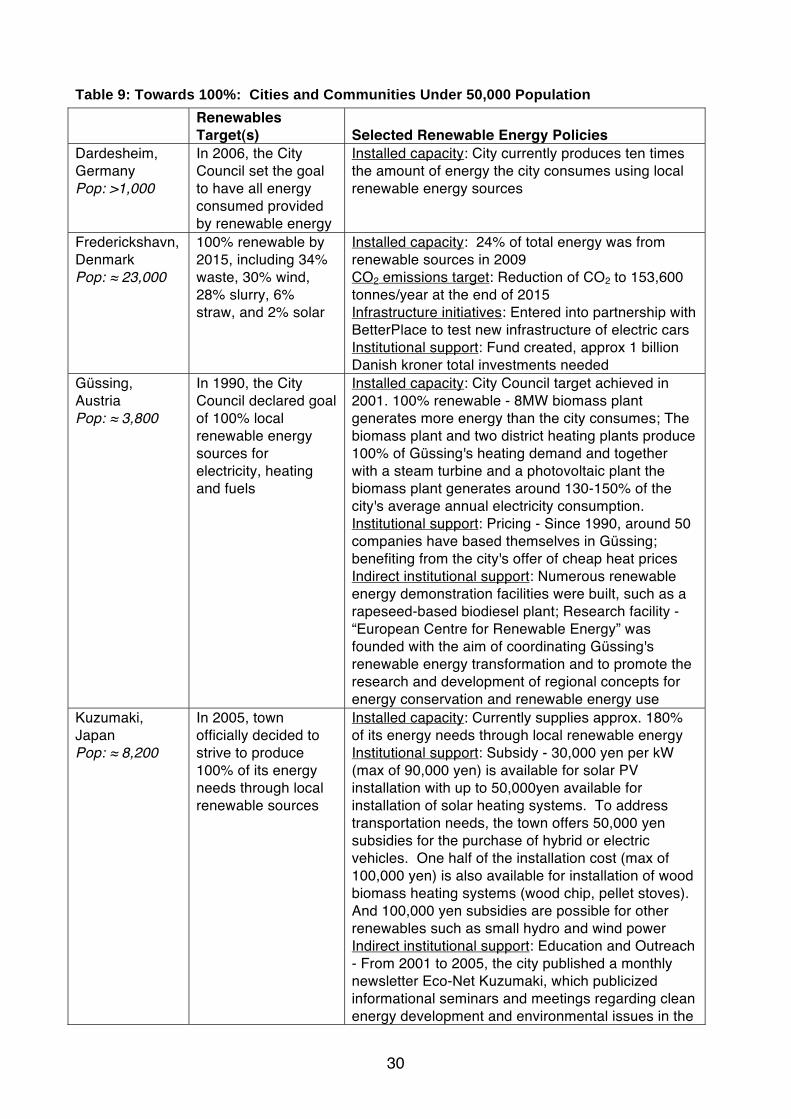
Table 9: Towards 100%: Cities and Communities Under 50,000 Population
Renewables Target(s)
Selected Renewable Energy Policies
Dardesheim, Germany Pop: >1,000
In 2006, the City Council set the goal to have all energy consumed provided by renewable energy
Installed capacity: City currently produces ten times the amount of energy the city consumes using local renewable energy sources
Frederickshavn, Denmark Pop: 23,000
100% renewable by 2015, including 34% waste, 30% wind, 28% slurry, 6% straw, and 2% solar
Installed capacity: 24% of total energy was from renewable sources in 2009 CO2 emissions target: Reduction of CO2 to 153,600 tonnes/year at the end of 2015 Infrastructure initiatives: Entered into partnership with BetterPlace to test new infrastructure of electric cars Institutional support: Fund created, approx 1 billion Danish kroner total investments needed
Güssing, Austria Pop: 3,800
In 1990, the City Council declared goal of 100% local renewable energy sources for electricity, heating and fuels
Installed capacity: City Council target achieved in 2001. 100% renewable - 8MW biomass plant generates more energy than the city consumes; The biomass plant and two district heating plants produce 100% of Güssing's heating demand and together with a steam turbine and a photovoltaic plant the biomass plant generates around 130-150% of the city's average annual electricity consumption. Institutional support: Pricing - Since 1990, around 50 companies have based themselves in Güssing; benefiting from the city's offer of cheap heat prices Indirect institutional support: Numerous renewable energy demonstration facilities were built, such as a rapeseed-based biodiesel plant; Research facility - “European Centre for Renewable Energy” was founded with the aim of coordinating Güssing's renewable energy transformation and to promote the research and development of regional concepts for energy conservation and renewable energy use
Kuzumaki, Japan Pop: 8,200
In 2005, town officially decided to strive to produce 100% of its energy needs through local renewable sources
Installed capacity: Currently supplies approx. 180% of its energy needs through local renewable energy Institutional support: Subsidy - 30,000 yen per kW (max of 90,000 yen) is available for solar PV installation with up to 50,000yen available for installation of solar heating systems. To address transportation needs, the town offers 50,000 yen subsidies for the purchase of hybrid or electric vehicles. One half of the installation cost (max of 100,000 yen) is also available for installation of wood biomass heating systems (wood chip, pellet stoves). And 100,000 yen subsidies are possible for other renewables such as small hydro and wind power Indirect institutional support: Education and Outreach - From 2001 to 2005, the city published a monthly newsletter Eco-Net Kuzumaki, which publicized informational seminars and meetings regarding clean energy development and environmental issues in the

31
town; Demonstration program - Model “zero energy” home using solar PV and geothermal was established for educational purposes in 2007
Lloland, Denmark Pop: 49,000
Increase local renewable electricity generation by 50% by 2010, and to convert heat generation to 90% renewables by replacing fossil fuels with vegetable oil boilers by 2015
Installed capacity: Together with neighboring island Falster, Lolland-Falster supplies more than 100% of its electricity needs from renewable energy resources, and 70% of the heat supply in the area derives from renewable energy resources such as biomass and biogas Indirect institutional support: Lolland municipality formally commits to the full scale community sustainable energy demonstration platform called Community Testing Facilities of Lolland
Masdar City, UAE Pop: (city under development)
Initially planned for 100% on-site generation from renewable sources. Financial crisis may compromise this target
Urban Planning: No cars within the city, rather residents and industry use pods, lack of cars will also allow for narrow shaded streets; Buildings to be energy efficient; Water will be recycled, reducing need for desalination; Green spaces with drought resistant plants; and city will be completely walled to keep out the hot desert wind CO2 emissions target: 20 million metric tons of CO2
sequestered and captured by 2020 Institutional support: Plan to attract foreign firms by offering strong protection of intellectual property, efficient administration, and lack of taxes; The government of Abu Dhabi is putting up $15 billion in seed capital; Credit Suisse invested $100m in the Masdar Clean-tech Fund Indirect institutional support: Masdar Institute of Science and Technology (MIST) established with a stated specialization in Renewables; City began testing 41 types of solar panels from 33 manufacturers to see which works best in local conditions; Persuaded IRENA to make Abu Dhabi its headquarters
Samsø, Denmark Pop: 4,300
The Danish island decided to strive to achieve 100% renewable energy supply in electricity, heating and transportation by 2007
Installed capacity: The island is now “carbon negative” and 100% renewable-electricity powered; Eleven land-based wind turbines with one megawatt (MW) capacity each were erected to meet the islanders' complete electricity consumption; District heating systems using non-fossil fuels cover the heating demands for 43% of the island – the rest are covered by individual heating based on renewable energy sources (RES); Ten turbines with a capacity of 2.3 MW each were erected in the Baltic Sea south of Samsø and the electricity produced are fed to the national grid, more than offsetting the vehicle emissions and the remaining fossil fuel fired furnaces
Thisted, Denmark Pop: 46,000
Installed capacity; Electricity is 100% covered by renewable energy (339GWh). 86% of heat demand (219 GWh) is supplied by renewable energy CO2 emissions target: 3% annual reduction until 2025.

32
Institutional support: Some power producers get market prices, while some get feed-in-tariffs Process: Community ownership of all district heating and CHP; Wind, local biomass, and waste are the primary resource – New municipal plan increases wind from 265GWh/year to 445GWh/year
Varese Ligure, Italy Pop: 2,200
Municipality aims to use 100% local renewable energy to cover its energy needs
Installed capacity: Varese Ligure currently produces renewable energy that is equivalent to more than three times the amount of electricity the municipality actually consumes; Since 2000 four wind turbines have been installed. They produce four million kilowatts of electrical power annually. Moreover a hydroelectric dam was built and a number of solar panels were installed on the roofs of the town hall, the middle school and a hotel in Varese
Yusuhara, Japan Pop: 4,600
Aims to supply 100% of the electricity needed for housing, the business and industry sector with local renewable energy by 2050
Installed capacity: By mid 2009, 5% of residences have installed solar PV systems; Two 600kW turbines have been installed CO2 emissions target: Reduce GHG emissions by 50% by 2030 and 70% by 2050 (base levels of 1990); Reduce CO2 emissions by 140% by 2030 and 240% by 2050 (base levels of 1990)

33
Table 10: Towards 100%: Cities and Regions Over 50,000 Population
Renewables Target(s)
Selected Renewable Energy Policies
Copenhagen, Denmark Pop: 1.9 million
Carbon neutral by 2025
Infrastructure initiatives: All the cars bought by the municipality will be electrical or hydrogen-powered after January 1st 2011. By 2015, 85% of the municipality s cars will be electrical or hydrogen-powered, which will be amounts to about 600 new cars. In order to reward early adopters, the municipality offers free parking in the city for the inhabitants and businesses who drive electrical and hydrogen-powered cars
Edinburgh, Scotland Pop: 450,000
In 2003, City Council announced vision to “lead the most successful and sustainable city region in Northern Europe by 2025…”
Building Codes; Major developments over 1,000 square meters will have to provide at least 10% of its power through renewable sources under the Standards for Sustainable Building code
Gothenburg, Sweden Pop: 920,000
Seeks to be entirely fossil free by 2050, approx. 20% from bio-fuels
Installed capacity: Rya heating plant hot water converted from natural gas to wood pellets in 2003; Today, over 80% of the heat in the heating system is based on waste heat, recycled energy that would otherwise be lost Sustainable Development: Municipally-owned Gårdstensbostäder acquired Gårdsten in the late 90 s, redeveloped 500 apartments into solar houses, Gårdstensbostäder apartments are also self-sufficient by wind power Electric Utilities Policies: Consumers have the option of buying eco-labeled district heating
Hamburg, Germany Pop: 4.3 million
Aims to power municipal buildings entirely from renewable sources; Climate protection project Renewable Wilhemsburg and Veddel seeks to gradually increase the proportion of renewable energy to eventually reach “100% renewable”
Electric utilities: HamburgEnergie, a public utility set up in 2009, distributes renewable energy and might take over the power grid when the concession contracts with Sweddish energy company Vattenfall expire at the end of 2014 Retrofitting public buildings: Example: Roof renovation and photovoltaic array at Kampnagel, and installation of photovoltaic array on 14500m2 roofing Institutional support: Examples: City has spent 18m ($22.9m) in recent years to replace more than 600 boiler systems with biomass-friendly alternatives; Extra funding of 25m ( 100m up to 2012) for climate policies in Hamburg – not specifically renewable
Iida City, Japan Pop: 106,000
To supply 30% of all household energy with renewable energy by 2011
CO2 emissions target: Mid-term goal of 40-50% GHG emission reduction from residential sector by 2030 and a long-term goal of 70% from all sectors by 2050 (base levels of 2005) Institutional support: Established solar PV subsidies of ¥70,000 per kW (limited to a maximum of 3 kW); Free installation of 3.5 kW Solar PV systems for a limited time; Subsidies of up to 20% of the cost
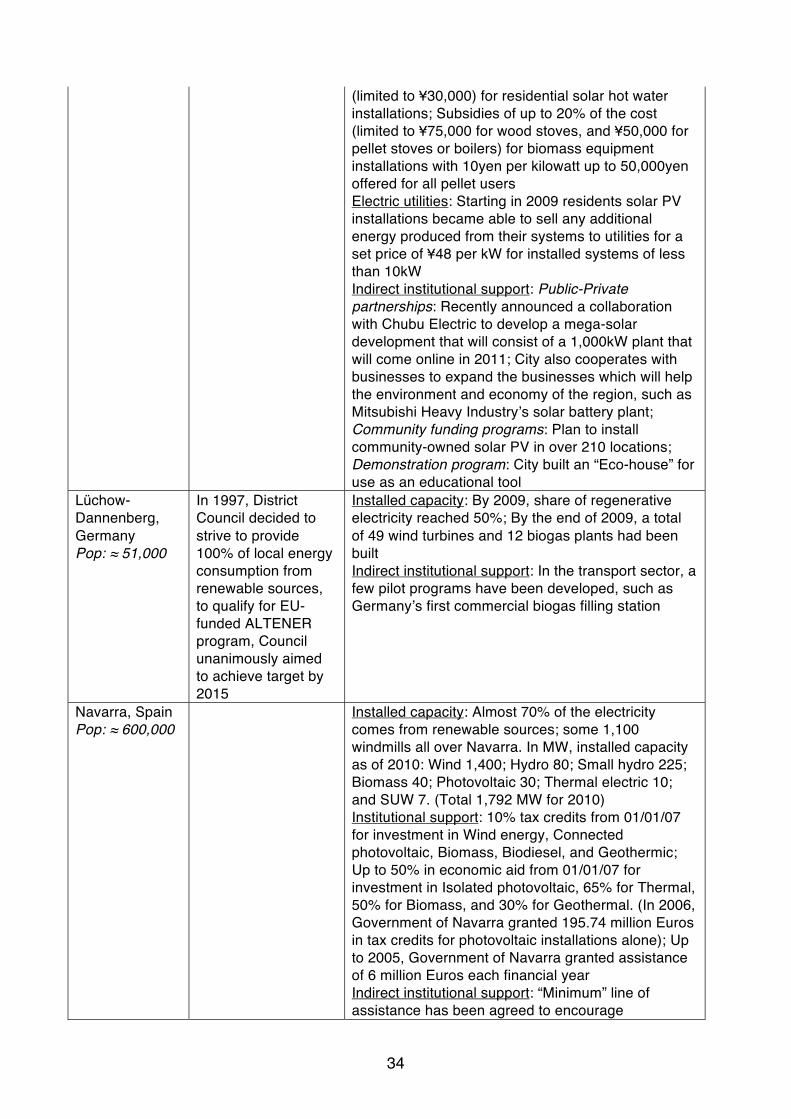
34
(limited to ¥30,000) for residential solar hot water installations; Subsidies of up to 20% of the cost (limited to ¥75,000 for wood stoves, and ¥50,000 for pellet stoves or boilers) for biomass equipment installations with 10yen per kilowatt up to 50,000yen offered for all pellet users Electric utilities: Starting in 2009 residents solar PV installations became able to sell any additional energy produced from their systems to utilities for a set price of ¥48 per kW for installed systems of less than 10kW Indirect institutional support: Public-Private partnerships: Recently announced a collaboration with Chubu Electric to develop a mega-solar development that will consist of a 1,000kW plant that will come online in 2011; City also cooperates with businesses to expand the businesses which will help the environment and economy of the region, such as Mitsubishi Heavy Industry s solar battery plant; Community funding programs: Plan to install community-owned solar PV in over 210 locations; Demonstration program: City built an “Eco-house” for use as an educational tool
Lüchow-Dannenberg, Germany Pop: 51,000
In 1997, District Council decided to strive to provide 100% of local energy consumption from renewable sources, to qualify for EU-funded ALTENER program, Council unanimously aimed to achieve target by 2015
Installed capacity: By 2009, share of regenerative electricity reached 50%; By the end of 2009, a total of 49 wind turbines and 12 biogas plants had been built Indirect institutional support: In the transport sector, a few pilot programs have been developed, such as Germany s first commercial biogas filling station
Navarra, Spain Pop: 600,000
Installed capacity: Almost 70% of the electricity comes from renewable sources; some 1,100 windmills all over Navarra. In MW, installed capacity as of 2010: Wind 1,400; Hydro 80; Small hydro 225; Biomass 40; Photovoltaic 30; Thermal electric 10; and SUW 7. (Total 1,792 MW for 2010) Institutional support: 10% tax credits from 01/01/07 for investment in Wind energy, Connected photovoltaic, Biomass, Biodiesel, and Geothermic; Up to 50% in economic aid from 01/01/07 for investment in Isolated photovoltaic, 65% for Thermal, 50% for Biomass, and 30% for Geothermal. (In 2006, Government of Navarra granted 195.74 million Euros in tax credits for photovoltaic installations alone); Up to 2005, Government of Navarra granted assistance of 6 million Euros each financial year Indirect institutional support: “Minimum” line of assistance has been agreed to encourage
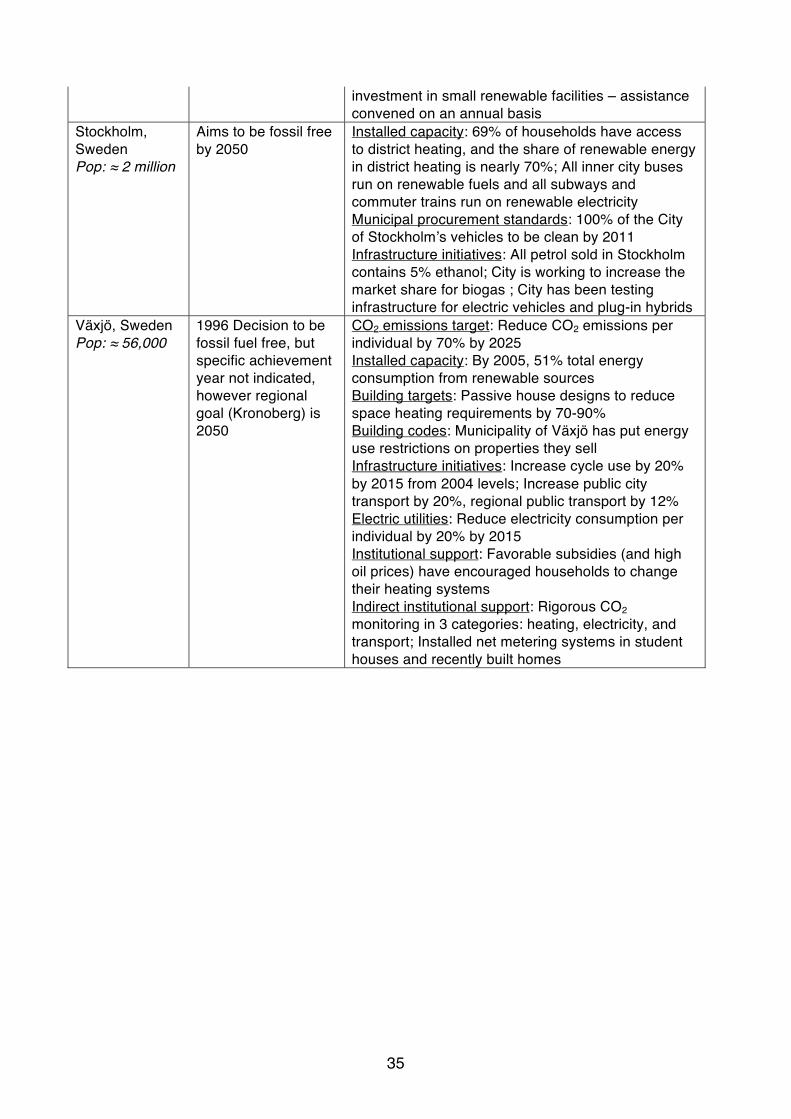
35
investment in small renewable facilities – assistance convened on an annual basis
Stockholm, Sweden Pop: 2 million
Aims to be fossil free by 2050
Installed capacity: 69% of households have access to district heating, and the share of renewable energy in district heating is nearly 70%; All inner city buses run on renewable fuels and all subways and commuter trains run on renewable electricity Municipal procurement standards: 100% of the City of Stockholm s vehicles to be clean by 2011 Infrastructure initiatives: All petrol sold in Stockholm contains 5% ethanol; City is working to increase the market share for biogas ; City has been testing infrastructure for electric vehicles and plug-in hybrids
Växjö, Sweden Pop: 56,000
1996 Decision to be fossil fuel free, but specific achievement year not indicated, however regional goal (Kronoberg) is 2050
CO2 emissions target: Reduce CO2 emissions per individual by 70% by 2025 Installed capacity: By 2005, 51% total energy consumption from renewable sources Building targets: Passive house designs to reduce space heating requirements by 70-90% Building codes: Municipality of Växjö has put energy use restrictions on properties they sell Infrastructure initiatives: Increase cycle use by 20% by 2015 from 2004 levels; Increase public city transport by 20%, regional public transport by 12% Electric utilities: Reduce electricity consumption per individual by 20% by 2015 Institutional support: Favorable subsidies (and high oil prices) have encouraged households to change their heating systems Indirect institutional support: Rigorous CO2 monitoring in 3 categories: heating, electricity, and transport; Installed net metering systems in student houses and recently built homes

36
6. LINKS BETWEEN LOCAL AND NATIONAL POLICY: EXAMPLE OF JAPAN Local renewable policies in Japan have emerged in part in response to Japan s role in the international climate change discourse, dating back to Japan s central role in the 1997 Kyoto Protocol. Japan offers an interesting example of how local policies for renewable energy are linked to national energy and climate policy, and conversely, how national policies have benefited from local initiatives. Such linkage has been enhanced by partnerships of cities, notably the 2008 “MetroCAP” partnership among Tokyo and several other cities. Below, national policies, local policies, and partnerships in Japan are explored to illustrate these linkages. [Note: this section is still provisional, and other approaches to assessing local/national linkages may be tried, along with other country examples, in future editions of this report.] The main Japanese legal framework addressing climate change came in 1998 – a year after the Kyoto Protocol (Kyoto) was adopted in COP-3. The Law Concerning the Promotion of the Measures to Cope with Global Warming (Climate Change Law) legally recognizes the impact of global warming and promotes mitigation and adaptation measures by defining the responsibilities of various stakeholders. However, the law relies on voluntary measures to curb the production of greenhouse gas emissions in their activities. Furthermore, Japan s energy policies have traditionally focused on energy conservation rather than renewable energy production. For example, the 1979 Law Concerning the Rational Use of Energy (Energy Conservation Law) and its subsequent amendments are designed to promote energy conservation and reduce demand for energy. While Japan has adopted a Renewable Portfolio Standard, the 2002 Special Measures Law Concerning the Use of New Energy by Electric Utilities targets only the modest target of 1.35% of national electricity supply by 2010, or 12.2 TWh. Japan s framework laws impart upon local governments a large amount of flexibility and independence to address climate change as they see fit. Besides energy efficient standards for products and buildings, the national government relies on volunteer efforts from prefectural governments, the business sector, as well as private citizens. Even the national carbon market, JVETS, is a volunteer-opt in scheme based only on companies pledged goals. The information collected in this report indicates that local governments have indeed adopted various policy measures, taking into consideration local state of affairs, to address climate change. The two most common policies enacted by local governments in Japan have been target setting and subsidies for solar PV. Most large cities in Japan, such as Tokyo, Kyoto, and Yokohama, have adopted both types of policies. A notable exception is Osaka, which only has a target. Renewable energy targets range from short term goals, such as 6% of total energy consumption by 2010 set by Hachinohe city, to ambitious long-term goals, such as Yusuhara s goal of providing 100% of electricity needs for housing and businesses from local renewable energy sources by 2050. Almost all of the subsidies offered by cities apply to solar PV. Many subsidies are set at around ¥20,000/kW up to a maximum of around ¥100,000. However, some cities offer high subsidies, such as Toyota City, which was providing subsidies of ¥65,000/kW up to a maximum of ¥195,000 in 2009. Toyota City also offered EV and hybrid-vehicle subsidies of 5% of the total price up to a maximum of ¥120,000. The least common policies involve taxation, building codes or mandates, land-use and utility regulation. Only three of the 40 Japanese cities surveyed for this report (Iida, Tokyo, and Yokohama) have some type of land-use policy, and only Omuta city has in place tax-based incentives for renewable energy (real property tax is reduced for businesses that install large scale solar PV). Japanese cities have also generally stayed away from policies related to operation of municipal infrastructure (see Table 1), although there are a few examples in this category, such as Kanagawa and Kawasaki.

37
While prefectures and cities around Japan have been pro-actively adopting, to one level or another, various measures to address climate change and promote the use of renewable energy, the individual nature of these policies meant that a patchwork of different local policies has evolved that lacks national coherence and consistency. Partly for this reason, a local government partnership called “MetroCAP” was established in 2008 to increase city-to-city dialogue and fill iregulatory and policy gaps related to renewables, energy efficiency, transport, and climate change. Two of the goals of MetroCAP were to develop local targets and policies that are consistent across prefectures, and also to influence national policy-making through the example of local initiative. MetroCAP is a collaborative partnership between the governments of the Greater Tokyo Area (Tokyo, Yokohama, Kawasaki, Kanagawa, and Saitama-prefecture and city). Launched in 2008, MetroCAP aims to develop climate policy in Greater Tokyo, while concurrently stimulating similar policy in other local government partners. The partnership has also endeavored to influence the national climate change discourse by promoting the actions taken by participating local governments. The partnership also plans to create a structure to advance public and private sector investment in low-carbon technology. The five MetroCAP partners agreed in 2009 to develop a climate policy framework in three sequential phases: Stage I is the implementation of a greenhouse gas reporting mechanism; Stage II involves accelerating private-sector investment; and Stage III is the development and implementation of a cap-and-trade system. Local initiatives in Japan do have a history of preceding (or anticipating) similar national programs. For example, when authorities in Mie Prefecture found national regulations to be insufficient, they enacted an ordinance specifying total polluted load controls. Two years later, the national government followed suit with its own version of the ordinance. Initiatives taken by the Tokyo Metropolitan Government (Tokyo) have also consistently led to the subsequent adoption of a policy equivalent at the national level. The 2006 National Energy Label program was anticipated by Tokyo s 2002 labeling program. Tokyo s 2003 CO2 Emission Reduction Program was followed in 2005 by the National GHG emission reporting regulation. Furthermore, the 2006 National Public Purchasing Regulation for Environmental Goods and Services was an offshoot of Tokyo s 2004 Green power Purchasing program. Local programs thus serve the dual role of reducing carbon emissions at a grassroots level while acting as pilot programs that demonstrate their broader applicability for national implementation. Lastly, progressive initiatives adopted by one local entity may also provide the necessary policy inertia to influence the policies of other local jurisdictions. For example, Tokyo s independently pursued tax policies encouraged other prefectures, such as Mie and Fukuoka, to similarly introduce local environment taxes. At the core of MetroCAP is the opportunity for climate change staff in each partner city to work together for the first time. For example, Tokyo s solar PV and solar heating subsidy policies have been emulated by the other four MetroCAP partners in varying degrees. All four partners have adopted similar subsidy policies for solar PV, while Yokohama has also adopted policies for solar heating. All five partners have also developed green energy purchasing programs through a joint green-power committee established under MetroCAP. By the end of the first period, the MetroCAP partnership resulted in a number of policies, such as a GHG reporting system among all the participating local governments as well as a renewed focus on the implementation of cap and trade by the Tokyo. The GHG reporting system acts as the base for calculating emission allowances for a potential cap and trade system. Through MetroCAP, prefectural partners have been harmonizing their GHG reporting and developing the three phases in parallel with one another. As of mid-2010, Tokyo was the only MetroCAP partner to implement phase three – a binding cap and trade system – although Kanagawa and Saitama also announced preparations to introduce local cap and trade to harmonize their policies with Tokyo. .

38
MetroCAP s second function is to develop local-to-national climate policy linkages. The Tokyo Emissions Trading System can be seen as an example of local leadership and a statement of political frustration at the ineffective national and global climate change policies (represented by the voluntary-only JVETS trading system). Tokyo began setting emissions limitations for 1,400 large factories and offices starting in April 2010, which could act as a groundbreaking precedent for other prefectures, and eventually the national government, to follow. This had previously occurred when Tokyo s independent initiative encouraged other prefectures, such as Mie and Fukuoka, to introduce local environment taxes. Tokyo s preemptive response can act as a model for a more comprehensive national legislation. There have been two key local-to-national policy developments that have been facilitated by MetroCAP. First, MetroCAP helped bring about the adoption of a new national renewable energy policy. In 2009, eight governors submitted recommendations to the national government for a more aggressive national renewable energy policy. These recommendations were a collaborative effort between Tokyo and MetroCAP. In April that year, a partial feed-in-tariff (solar PV only) was adopted at the national level and came into effect in October 2009. Second, MetroCAP helped shape national climate policy. Between 2003-2008, early action taken by prefectures regarding GHG reporting measures and cap and trade were met with resistance by different governmental constituents. During 2008 and 2009, MetroCAP began facilitating broader dialogue on climate policy between local governments and the national government, especially with the Ministry of Environment and some parliamentarians. Beginning in October 2009, a weekly meeting of parties was organized to discuss cap and trade at the national level. The indirect consequence of these meetings was the development of an initial pilot process of voluntary “capless” trading at the national level.

39
7. CASE SUMMARIES OF LOCAL POLICIES IN 40 CITIES WORLDWIDE Note: the following local policy case summaries are unedited and many are not yet reviewed by local experts or officials. In contrast to the policy lists and examples in Tables 2–8 and P1–P16, these cases are intended to show integrated pictures of local policy and action for individual cities. Case summaries from more countries and regions will be included in future editions. Additional cases and reviews of these existing cases are invited. Adelaide, Australia (population 1.2 million). Adelaide s sustainable development planning dates back to the early 2000s when visionaries engaged the community and the city adopted its “green city program” with many new policies. Adelaide also became one of six cities participating in Australia s national “solar cities” program. The Adelaide City Development Plan promotes green buildings and renewable energy technologies. The plan includes targets to make the entire transport sector carbon-neutral by 2012 and the entire building sector carbon-neutral by 2020. There is also a greenhouse-gas emissions reduction target for municipal own-use operations of 20% by 2010, compared to 1994. Many renewable energy projects are underway. The city offers $1000 subsidies for solar PV systems larger than 1-kilowatt (kW), and subsidies of $1/watt up to $3000 to install solar PV for lighting in common areas of apartment buildings. In transportation, the city plans to operate solar-electric public buses charged with 100% solar power. Adelaide s green-city program takes place within the context of a ten-year sustainability plans at the state level. Austin TX, USA (population 774,000). Austin s 2007 Climate Protection Plan targets 30% of total city energy needs from renewable energy by 2020, including 100 MW of solar power. Municipal facilities are also targeted to become carbon neutral by 2010. Austin Energy, the energy department of the city government, has been very active in renewable energy. Austin Energy has been purchasing private wind power since 2001, receives electricity from several solar installations in the city, and also purchases power from landfill gas in San Antonio. Austin Energy s GreenChoice Program allows residents and businesses to voluntarily purchase green power through 5-year and 10-year subscriptions; by 2009, subscriptions represented 750 GWh in green power sales. Austin Energy also provides rebates of $3.75/watt for solar PV and $1500-2000 per system for solar hot water. Barcelona, Spain (population 1.6 million). Barcelona enacted a city ordinance in 2000 that required solar hot water in all new buildings and major renovations above a size threshold (typically all commercial buildings, and residential buildings of 16 or more households). In 2005, the city eliminated the size requirement so the ordinance now applies to all construction. The ordinance requires 60% of hot water energy to come from solar. This ordinance proved very popular and Barcelona s model was followed by over 70 municipalities and cities throughout Spain enacting similar ordinances. Then, following the local ordinances, Spain enacted a national building code requiring both solar hot water and solar PV in new construction and renovation for larger buildings. Barcelona promotes renewable energy through its 2002–2010 “Plan for Energy Improvement in Barcelona,” which aims to reduce CO2 emissions by 20% by 2010 (compared to 1999), reduce per-capita CO2 emission to 3.15 tonnes/person, and increase renewable energy to 1.1% of total energy consumption. The plan is being implemented and monitored by the Energy Agency of Barcelona. There are also informational and public awareness programs. Beijing, China (population 17 million). Beijing s 11th Five-Year Plan (2006-2010) targets a 4% share of electric power capacity from renewable energy by 2010, up from 1% in 2005, and a 6% share of heating capacity by 2010. To achieve these goals, the city allocated 13 billion RMB ($2 billion) over the five-year period. The city is promoting geothermal heat pumps and provides subsidies of 35 RMB/m2 for water-source pumps and 50 RMB/m2 for ground-source pumps. The

40
city has also been installing renewable energy in municipal infrastructure, including 57,000 solar street lamps. The 2008 Beijing Olympic Games boosted renewable energy development with a number of projects—during the games, one-quarter of all energy consumed at event venues was renewable. And Beijing is also supporting renewable energy development in surrounding rural districts. In 2008, Beijing received 2% of its total energy consumption from renewables, and had 3.8 million m2 of solar water heaters and 1.2 megawatts (MW) of grid-tied solar PV installed. There were also biogas digesters in use by 50,000 households, 113 small hydro power plants, and 10 million m2 of heating capacity from water-source geothermal heat pump facilities. Berlin, Germany (population 3.4 million). Berlin has been active in setting and implementing renewable energy policy for decades. In 1989, the city created an energy planning unit, the Energy Task Force, to coordinate policy and increase the share of renewable energy. In 1994, the Energy Concept Berlin targeted a 25% reduction in CO2 emissions by 2010 (baseline 1990). In practice, actual emissions were reduced by 26% as of 2009, and a new target of 40% by 2020 was set. That reduction achievement was due to a number of action plans, first in 1995, then in 2000, and again in 2005. In 2000, the city launched a “Berlin Solar Campaign” together with four outside agencies to raise public awareness. The campaign created an “International Solar Centre,” a multi-purpose information and promotion center. Following that, the city also developed a “Solar Master Plan” to assess solar energy potential for different types of city buildings and infrastructure, a grant fund, subsidy programs for solar PV and solar hot water, and a program to offer rooftops of public buildings to private developers for solar PV installations. Along with strong national support for solar PV through feed-in tariffs, the number of solar PV installations in Berlin climbed from 400 in 1998 to 2100 in 2008 with capacity of 10 MW. Under the most recent action plan (2006-2010), Berlin will continue to promote renewable energy. Berlin's success can be attributed to the creation of institutions and partnerships within the framework of energy planning, including the Council on Energy (1990), Berlin Energy Agency (1992), Berlin ImpulsE (2000), and Climate Protection Expert Council (2007). Betim, Brazil (population 440,000). Betim is one of Brazil's first "model communities" for renewable energy, as part of a six-cities network that also includes Belo Horizonte, Porto Alegre, Salvadore, São Paulo, and Volta Redonda. Betim has established a number of policies to promote biofuels use in transportation. The city mandates biofuels in public buses and taxis, and also gives preference to flex-fuel vehicles for municipal vehicle fleet purchases. The city is also facilitating the addition of solar hot water systems to a low-income housing project being built under a national program. A number of demonstration projects on municipal buildings have been carried out. Betim has also established a "Renewable Energy Reference Center" that raises public awareness; provides information; brings together diverse stakeholders from local, state, and national levels; conducts training and workshops; and conducts outreach to other local communities in Brazil to share Betim's experience. Boston MA, USA (population 610,000). In 2007, Boston committed to reduce greenhouse gas emissions 7% by 2012 and 80% by 2050 (base 1990). Also in 2007, an executive order required the city to purchase 11% of its own-use electricity from renewables by 2007 and 15% by 2012, also required all new municipal motor vehicle purchases to be alternative fuel vehicles, and committed to reduce the city s own-use transportation fuel use by 5% by 2012. The city also targets 25 MW of solar PV by 2015, and has adopted a number of regulatory measures, including zoning regulations for utility-scale and small-scale wind power projects, and requirements that new housing under its Green Affordable Housing Program be “solar ready.” The city also maintains an online GIS tracking system that features every renewable energy installation in the city, and allows building owners to calculate the available solar irradiance on their rooftop, taking shading into account. From 2007 to mid-2009, renewable energy capacity in Boston grew from 500kW to almost 2MW.

41
Bristol, UK (population 420,000). Bristol has three targets in its carbon reduction strategy: (1) to reduce the city government s own-use energy consumption by 10% by 2010 (base 2003/2004); (2) to purchase 15% of the government s own-use electricity from renewable sources by 2010; and (3) to reduce total CO2 emissions 60% by 2050, starting with 3% reductions per year through 2020. The city purchases 14% of its own-use electricity from renewables, operating 34,000 street lamps and ten public buildings with green power. The city has installed three biomass boilers in a community building, a nursery, and a school, and will install biomass boilers in four new schools. The city will also install solar PV and solar hot water systems in 21 non-residential city-owned buildings such as nursery schools and nursing homes. The city is also allowing construction of wind turbines on city-owned land. Christchurch, New Zealand (population 370,000). Christchurch has committed to a 70% reduction in government own-use CO2 emissions by 2011 and carbon neutrality beyond 2015, and to a 20% reduction in community CO2 emissions by 2020. The city government purchases 100% of its own-use electricity from a certified carbon-neutral electricity supplier and from a small local wind farm. The city has a number of projects supporting renewable energy, including the “Clean Heat” project which provides grants for efficient wood-pellet stoves, use of landfill gas for heating government buildings and a public swimming pool, a biodiesel-fueled bus, and a carbon-neutral demonstration home. Other policies include consideration of passive solar design for new government buildings and reduced permit costs and faster permitting for residential solar water. A city-support agency “Target Sustainability” provides advice on renewable energy to businesses and residents. Daegu, Korea (population 2.5 million). Daegu declared itself a “solar city” in 2004 and pledged to integrate renewable energy into city development and gradually reduce per-capita greenhouse-gas emissions by 2050 “consistent with long-term climate stabilization.” The original plan called for 5% of total energy consumption to come from renewables by 2012. Following that, the city adopted energy-reduction targets for 2015 and 2030. There have also been a number of demonstration projects in public buildings, schools, and universities, and public information campaigns. The city was working on a comprehensive “solar city” ordinance that would establish policy approaches. Edinburgh, UK (population 470,000). Edinburgh aims to achieve a carbon-free economy by 2050 and has launched a Climate Change Fund totaling £18.8 million to develop local carbon-free communities. The city intends to boost community-led activities for CO2 emissions reduction through this fund. The city will also establish a carbon management plan for its own operations. The city already purchase green power for its own-use operations, including 100% green power for large buildings, 75% green power for smaller buildings, and 20% green power for other uses such as street lighting. In the Old Town portion of the city, the project “Renewable Heritage” is improving energy efficiency and integrating several forms of renewables into traditional buildings (which are a designated UNESCO World Heritage Site). Frederikshavn, Denmark (population 25,000). This city plans to be 100% renewable by 2015, including the transportation sector. The target emerged in 2006 with national plans to make Frederikshavn a model demonstration city for Denmark, to showcase a diversity of renewable energy technologies, energy management practices, and distributed energy system models. Currently, the city receives 24% of its energy from renewables. The city established the Energy City Frederikshavn Foundation to be responsible for implementing the 100% target, in partnership with major stakeholders (companies, educational institutions, energy planners, and key industry players like steel mills). The expected investment cost to achieve the target is 1 billion Danish kroner. Funds will come from investors, and the city has established a fund for this target with private sector investment. The city also plans to adjust some taxes.

42
Freiburg (i. BR), Germany (population 220,000). Support for renewable energy and climate protection dates back to the 1970s in Freiburg when opposition to nuclear power emerged as a public issue. In 1986, Freiburg developed a new energy supply concept that incorporated renewables, along with energy saving and efficient technologies. The first climate protection concept was established in 1996, which resulted in a number of initiatives. One example of an early policy was the sale of municipal land to developers with the requirement that housing built on the land incorporate renewable energy and exceed national energy efficiency standards–which led to several renewables-intensive low-energy housing districts. In 2007, a new climate protection action plan was created including energy saving, energy efficiency, and renewables. As part of the new plan, an on-line database has been established listing all building roofs in the city and their size and suitability for solar panels. By 2008, all public trams were running entirely on renewable energy, and there existed five wind turbines, a biomass co-generation plant for one city district, 12.3 MW of solar PV, and 15,000 m2 of SHW. Success with renewable energy has been attributed to a shared vision of sustainable development, a multi-stakeholder network, participation and commitment of citizens, and political consensus across parties. Göteborg, Sweden (population 500,000). The city of Göteborg has established a long-term commitment to sustainable energy, including energy-efficient buildings, renewable energy, energy-efficient urban planning, and local energy storage. The project "Göteborg 2050" is developing long-term visions of a future city and region. The project is a collaborative effort between universities, the city government, and the city's energy utility (Göteborg Energi AB). It includes research, scenario development, support for strategic planning, dialogue with the public, and demonstration projects. Göteborg has also pioneered the design and construction of a number of demonstration homes that use only solar energy for heating and hot water, even in the winter. Hamburg, Germany (population 1.8 million). Hamburg was designated by the European Commission as “European Green Capital” of the year for 2011. Hamburg has committed 25 million for new climate change programs and aspires to become a “model region” for climate action. Hamburg s targets are for 40% reduction in CO2 emissions by 2020 and 80% reduction by 2050 (relative to 1990). Hamburg s policy includes several programs, including a solar PV roof-space exchange program; a public-private solar hot water/heating program; designation of additional locations for wind turbines; repowering of existing wind turbines, funding for use of biofuels; and a new university-level research and training program designated “competence cluster renewables.” The city is also planning to develop a model urban district (Wilhelmsburg) that will be supplied entirely from renewable energy by converting existing infrastructure. Heidelberg, Germany (population 140,000). In 1992, Heidelberg created a climate protection program focusing on the use of locally available renewable energy sources as a key strategy. Over 20 of the 100 specific measures in the program concerned renewable energy, including demonstration projects, subsidy programs, and information campaigns. Many measures are being implemented by Heidelberg s Bureau of the Environment and the municipal utility. In 2001, the city targeted at least 25% (7 GWh) of its own-use electricity from renewables, and purchases green power from the local utility. An energy efficiency regulation for buildings also promotes renewable energy in new and retrofitted buildings. Public awareness and engagement in renewable energy has been facilitated by the Heidelberg Climate Protection and Energy Circle, which evolved from a public forum in 1997. This Circle brings together stakeholders to discuss and develop strategies, projects, and city policy. The city also organizes education and training for craftsmen and architects, encourages youth “energy teams” to promote the issues of energy, environment and climate, and gives advice to citizens on the installation of solar thermal water heaters and helps with the application for federal grants and loans. Heidelberg has cut CO2 emissions by over 15,000 tons per year in municipal buildings, and 225,000 tons per year in households, industry and transportation. In 2004, the city established a 20% CO2 reduction target by 2015.

43
Iida, Japan (population 110,000). Selected as an “Eco Model City” in a national competition, Iida plans to reduce its greenhouse gas emissions in the commercial and residential sectors by 40-50% by 2030 and by 70% by 2050 (base 2005). The city also plans to increase the share of households with solar PV from 2% in 2006 to 30% by 2010, and is providing solar PV subsidies of 70,000 yen/kW (maximum 3 kW) through February 2010. The city also provides residential solar hot water subsidies of 20% (maximum 30,000) and biomass equipment subsidies of 20% (maximum 75,000 yen for a wood stove and maximum 50,000 yen for a pellet stove or pellet boilers). The city s environmental plan was revised in 2007, and the revised plan established a four-year program employing public-private partnerships for biodiesel use in public vehicles, business models of wood pellet operation, use of micro-hydropower in small urban areas and farming districts, and construction of a biomass town as a sustainable recycling community model. Kitakyushi, Japan (population 1.0 million). Kitakyushu has a long history of environmental policy, and was selected #1 among environmentally-advanced cities in Japan for both 2006 and 2007, according to a non-governmental competition. The city has also been selected as an “eco-model” city in Japan. In 2007, the city adopted a “Low-Carbon City Vision” that calls for a 50% reduction in greenhouse-gas emissions by 2050 (base 2005). The vision focuses on urban structure and sustainable energy and transport. Plans are being developed for a low-carbon city district and future development of the energy system, as well as policies to implement the vision. Currently, subsidies are provided for household solar PV. Kunming, China (population 4.7 million). Kunming aspires to be a “solar capital” of China. In 2008, the city adopted a policy framework “advice on renewable energy development and use” which calls for a 50% share of all buildings in the city to have solar hot water and solar PV by 2010. The framework also established a designated development zone within the city to reach a 70% share, and for new construction to reach a 90% share. Further targets for 2015 include 6 million m2 of solar panels city-wide (both hot water and PV), and solar PV capacity of 100 MW. Other policies to promote renewable energy include low-interest loans, tax exemptions, and a special fund to encourage private investment. The city has also incorporated solar investments into its own procurement. And the city is providing support for R&D, industry development, university education, and a solar hot water equipment testing center. Outside the city, construction of the 166-MW Kunming Shilin solar PV power plant began in late 2008 and will become the largest such plant in China, at a cost of almost $1.5 billion. Linz, Austria (population 190,000). The "Linz Solar City Project" is an integrated solar village for 1300 households on the outskirts of Linz. Construction was to be completed in 2005 and was to include other infrastructure, including shops, schools, and a 7-km tram rail line to the city center. The solar village is made of 2-4 storey buildings with south-facing facades, energy-efficient construction, passive solar heating, and solar electricity. The village includes a network of pedestrian and cycle paths, open space, and underground parking to keep cars separate from living areas. The village design has won several awards and was a joint effort between the city and 12 separate building constractors. Energy heating intensities for the residential buildings in the solar village were expected to be 37 kWh/m2/year, below other low-energy construction in Austria (44 kWh/m2/year) and well below the average in Austria (65 kWh/m2/yr). Similarly, heating intensities for the school buildings were expected to be 30 kWh/m2/yr, much less than the 125 kWh/m2/yr average for other schools in Linz. London, UK (population 7.6 million). London s renewable energy objective is to generate at least 665 GWh of electricity and 280 GWh of heat annually from renewables by 2010. This will contribute to the city s greenhouse gas emissions reduction target of 60% by 2050 (base 1990). The city currently purchases green power for public lighting and city buildings. In past years, a number of initiatives have been launched, including the 2004 London Energy Partnership, which created a “London Renewables” program to promote renewables in new buildings and other

44
infrastructure, and a “Mayor s Energy Strategy” which proposed to adopt green electricity tariffs in the municipal administration. Madison WI, USA (population 220,000). Madison launched the Mpowering Madison Campaign in 2008 to reduce city-wide CO2 emissions by 100,000 tons by 2011. The city has undertaken a number of activities toward that goal, such as renewable energy installations on municipal infrastructure, including solar hot water systems on all fire stations and solar PV systems on community facilities. The MadiSUN Solar Energy Program, supported by the U.S. Solar American Cities Program, offers free consultations for installations of solar PV and solar hot water by residences and businesses, and intends to double the number of such systems city-wide by 2011. The electric utility serving Madison, Madison Gas and Electric, has a number of cooperative initiatives with the city, including joint operation of a wind farm, green power purchasing, and solar PV production credits. Madison aims to purchase about 20% of its municipal own-use power from renewables by 2010, including green power purchases of wind, biomass, and hydro from the utility. Melbourne, Australia (population 3.9 million). Melbourne joined International Cities for Climate Protection in 1998 and Australia s Greenhouse Challenge program in 2000. The City has been investing in demonstration projects for solar power, solar hot water, and green buildings. For example, solar panels installed on the Queen Victoria Market in 2003 generate 250 MWh per year, making this project the largest urban grid-connected solar PV project in the Southern Hemisphere. In 2003, the city adopted the goal of carbon neutrality in its “Zero Net Emissions by 2020” strategy. The intermediate goal is a 20% reduction over 1996 levels by 2010. The strategy plans to achieve carbon neutrality through green building design, energy efficiency, renewable energy, and sequestration through tree planting. The strategy calls for halving energy use in residential and commercial buildings, achieving 45% renewable energy, and halving emissions from non-renewable power generation, all by 2020. In the shorter-term, the “Greenhouse Action Plan 2006-2010” calls for 25% renewable energy in the building sector and 50% of public lighting by 2010. The City Council has also set goals for its own operations: 50% emissions reductions over 1996 levels by 2010 and net zero emissions by 2020. As of 2004/2005, the City Council s operations had reduced emissions 26% over 1996 levels, with the bulk of the reductions achieved in the public lighting and buildings sectors. Münster, Germany (population 270,000). Münster established a climate action plan and advisory council in the early 1990s, along with a CO2 reduction target of 25% by 2005. Through various measures, the city achieved a 21% reduction by 2006. Most of the reduction was from various energy efficiency measures in buildings and in heat and power generation (including district heating), with small contributions from renewables (20 MW of wind power, 4 MW of solar PV, and 13,000 m2 of SHW). In 2008, two new targets were introduced: 40% reduction in CO2 by 2020 (relative to 1990), and 20% of total energy consumption from renewables by 2020. The “Department of Green Spaces and Environmental Protection” was given the mandate to establish activities to meet these targets. Nagpur, India (population 2.1 million). Nagpur participated in a local renewables “model communities” program from 2005–2008, paid partly through foreign donor assistance. In 2008, Nagpur was selected as one of the first cities in India s national Solar Cities Program. (Nagpur has also been one of the leading cities implementing the national government s “Jawaharlal Nehru National Urban Renewal Mission.”) Nagpur prepared a city energy report as the baseline for urban energy policy and planning, which analyzed the energy and emissions balance. The city also issued an ordinance mandating solar water heaters for all new residential buildings with more than 1500 m2, with a 10% rebate on property tax as an incentive. Various demonstration projects are underway or planned. And a Renewable Energy Resource Center was established to facilitate dialogue with local stakeholders, to identify and collect various forms of information, and to publish newsletters and brochures. Awareness campaigns include a mobile van, formation of “energy

45
clubs” in schools, and training for students and school teachers. Nagpur is actively seeking political support for policy changes, engaging citizens in awareness activities and consulting diverse stakeholder groups with an interest in local renewables, and aims for further policies to increase the use of renewable energy and energy efficiency. The city is targeting a 20% reduction in conventional energy consumption of municipal buildings and services by 2012. Nelson, New Zealand (population 59,000). Nelson aims to become New Zealand s first “solar city” and is engaged in a range of activities for solar hot water and renewable electricity. The city s overall goal is to reduce greenhouse-gas emissions by 40% by 2020, relative to 2001. Starting with a pilot phase for solar hot water as a collaboration of businesses and non-profits with the city, at least 1400 installations are targeted over four years. The program benefits from national solar hot water subsidies of NZ$1000/system for households and $500/m2 for public buildings. The city plans to involve local banks in end-user financing, and is also hoping to establish a revolving fund for household credit and to engage in bulk purchasing with tenders to lower costs. The city is promoting renewable energy in public buildings and in urban design protocols, and further efforts are planned to develop the local market for distributed solar power. New York City, USA (population 8.3 million). New York City launched its sustainability PlaNYC in 2007 and aims to reduce CO2 emissions by 30% by 2030. The city government currently purchases 6% of its own-use electricity from renewables, and since 2008 has contracted with private developers to purchase power from a 20 MW wind power project. To support solar PV installations, the city established a property tax abatement program, which provides a rebate of 8.75% of installation costs each year for four years, up to $62,500 per year, resulting in a total rebate of 35%. The net-metering capacity limit was also raised from 10kW to 2 MW in late 2008. And the city plans to install 2 MW of solar PV on city-owned buildings through private tendering. The city s first carbon-neutral building, Solar Two, received assistance from the city. New York currently has 1.1 MW of existing solar PV capacity. Oslo, Norway (population 580,000). In 2005, Oslo adopted a 50% CO2 reduction target by 2030. Oslo plans to increase use renewable energy in its transport system and to entirely phase-out fossil-fuels for heating buildings by 2020. It plans to procure vehicles for municipal use that will be low-carbon or electric, and to improve facilities and incentives for electric vehicles, such as free parking and exemption from road tolls. An energy-efficiency fund operated from 1997-2007 and provided up to 20% of capital costs, including replacement of oil-fired heating boilers with renewable energy, and installation of wood-pellet heaters. A new project plans to produce biogas from organic household waste and sewage sludge. (In 2008, 62% of public transport journeys were made by rail using renewable energy.) Oxford, UK (population 150,000). Oxford s Low Carbon Buildings Program (LCBP) was launched in 2006 with two planned phases. During the first phase, the city provides subsidies for solar PV, solar hot water, and small-scale wind power in public, commercial, and residential buildings. Households can receive up to £2,500 per property. The second phase provides grants to community groups and non-governmental organizations for renewable energy in public buildings such as schools and churches, up to 50% of the total installation cost and maximum £200,000. By 2009, the city had allocated £45 million to LCBP including £10 million to phase one and £35 million to phase two. The city jointly operates the Community Sustainable Energy Program (CSEP) with a private research organization called the Building Research Establishment (BRE). This program will provide community-based organizations with £8 million to install renewable energy systems and £1 million to develop renewable energy projects. In 2005, Oxford enacted a Climate Change Action Plan that aims to reduce the city s own-use CO2 emissions by 25% by March 2011. Portland OR, USA (population 580,000). Portland has an extensive history of land-use and transportation planning dating back 30 years. Portland first adopted a local energy policy in 1979,
46
the first in the United States. Portland's first greenhouse gas reduction plan was adopted in 1993 (also a U.S. first), and then updated in 2001 with a goal of reducing greenhouse gas emissions to 10% below 1990 levels by 2010. The plan also calls for 100% of the municipal government's electricity to come from renewable energy by 2010. In 2006, the city adopted the first local renewable fuels standard in the United States, which mandates 5% biodiesel and 10% ethanol blending with all diesel and gasoline sold within the city limits. The city purchases biofuels for municipal fleet vehicles and also established a $450,000 Biofuels Investment Fund that supports various biofuels production and distribution projects, including projects to install or convert fueling equipment. The city also launched a five-year $2.5 million Green Investment Fund with private partners that is investing in renewable energy projects, and the city facilitates business partnerships for renewable energy investment and green power sales. The Bureau of Planning and Sustainability oversees these efforts. Rizhao, China (population 2.8 million). Rizhao, in Shandong Province, has been promoting solar hot water for the past 15 years. Currently, 99% of households in central Rizhao use solar hot water and most traffic signals, street lights, and park lights are solar powered. In the surrounding suburbs, more than 30% of households use solar hot water. The provincial government of Shandong has a policy to support research and development in the solar industry, and this policy helped lower the cost of a solar hot water heater to the level of an ordinary electric heater. The city capitalized on this development with policies to promote solar hot water among the public. All new buildings are required to include solar hot water, and the government oversees construction to ensure that this regulation is enforced and the panels are properly installed. The government has also run educational campaigns to encourage people to install solar in their homes, and some government bodies and businesses have provided solar installations to their employees for free. Partly due to the widespread use of solar energy, Rizhao is consistently among the top 10 cities in China in terms of air quality. Samsø, Denmark (population 4,200). This off-shore island community has already become “carbon-negative” and 100% renewable-electricity powered. Wind turbines provide power, with three-quarters of the generated power sold to mainland Denmark. The exported power more than offsets vehicle emissions and a small number of furnaces burning fossil fuels. The community began the task in 1998 of becoming 100% renewable by 2008, inspired by a national competition by the Danish government. No funding was obtained from outside the community. Rather, local citizens invested in renewable energy projects by buying shares. The investments were marketed as business opportunities, secured by revenue guarantees based on the national feed-in-tariff policy. San Francisco, USA (population 780,000). San Francisco s Climate Action Plan aims to reduce greenhouse gas emissions 20% by 2012 (base 1990). The city has several initiatives supporting renewable energy and strives to be a “Solar San Francisco.” One of the first initiatives was a $100 million Solar Energy Bond in 2001. Soon after, the city s 2002 Electricity Resource Plan targeted 50 MW of renewables by 2012, including 31MW solar PV. The city also requires that all new buildings over 100,000 square feet supply 5% of their energy with onsite solar. And the GoSolar program provides solar PV subsidies of $2,000-4,000 for residential installations ($7000 for low-income residents) and $1500/kW for installations by businesses and non-profit entities (maximum of $10,000). The city is investigating sites for wind power generation within city limits and on city-owned property outside city limits. Singapore, Singapore (population 4.8 million). This city-state began focusing on clean energy in 2006. Since then, Singapore has put much effort in attracting renewable energy companies, and encouraging research in clean energy. For example, in 2007 the Government announced a package worth S$350 million designed to increase research, development and capacity development for the clean energy industry. Furthermore, the Clean Energy Program Office (CEPO)
47
has launched 2 schemes to test the feasibility for clean energy in the city. The first is a S$17 million Clean Energy Research & Testbedding Programme (CERT) program that provides opportunities for government agencies to partner private companies to develop and “testbed” Clean Energy applications and solutions using government facilities in Singapore. The second is the S$20 million Solar Capability Scheme, which helps companies offset part of the capital costs of installing solar technologies in new building projects. However, the city-state has not announced any renewable energy targets and does not subsidize energies. Senior minister S. Jayakumar, as part of the Singaporean delegation to Copenhagen, described Singapore as an alternative energy disadvantaged country. Because of the scarcity of free land in the island, at current levels of technology, even if all easily accessible roof top and reservoir space were covered, solar technology will still not provide a significant proportion of the island s current electricity needs. Furthermore, wind conditions are not ideal for wind farms inland, while the island s location in one of the world s busiest shipping lanes makes off-shore installation impractical. Stockholm, Sweden (population 810,000). Stockholm was designated by the European Commission as “European Green Capital” of the year for 2010. Stockholm has developed a series of climate action plans over time. The first plan, from 1995-2000, achieved a reduction in CO2 emissions per-capita to 4.7 tonnes. The second plan, from 2000-2005, further reduced per-capita emissions to 4.0 tonnes. A third plan is currently under development, with a target, established in 2008, for 3.0 tonnes/capita by 2015. Planning includes a wide range of energy efficiency and energy-related measures, including green electricity purchases, solar hot water, and use of biofuels in public transit buses. In transport, the city plans that 50% of all buses should run on biogas or ethanol by 2011, and 100% of buses by 2025. Metro and commuter trains already run on renewable electricity. Investments in additional biofuels filling stations are planned. The city is also promoting greater use of biomass for district heating and co-generation. And information campaigns are educating households, employees, and school children about their emissions. Tokyo, Japan (population 13 million). Tokyo s main targets are to reduce CO2 emissions by 25% by 2020, and to increase the share of renewable energy to 20% of total energy consumption by 2020. These targets were established in 2006 with the Tokyo Renewable Energy Strategy and a climate change action plan that called for emissions trading and was subsequently merged into the Tokyo Environmental Master Plan (2008). Those plans contained a further target for 1 GW of solar PV within city limits. The city provides subsidies to households for solar PV (JPY 100,000/kW) and solar hot water (up to JPY 33,000/m2), on condition that the resulting green-electricity and “green-heat” certificates become the property of the city government for trading. That trading is due to get a large boost starting in 2010 when a mandatory carbon cap-and-trade system will be imposed on large businesses. Obligated businesses will meet obligations by reducing emissions or by trading green-electricity certificates and green-heat certificates derived from solar hot water. The city is also facilitating a “Green Energy Purchasing Forum” for trading of green-electricity and green-heat certificates by all consumers and buyers that is designed to encourage “demand-pull” for renewable energy. The city also mandates that public and some other facilities must purchase green certificates equal to 5% of electricity use and also purchases biodiesel for public buses. Toronto, Canada (population 2.5 million). Toronto currently has several municipal representatives and a mayor that campaigned to prioritize environmental protection. The city targets greenhouse gas emissions reductions of 6% by 2012, 30% by 2020, and 80% by 2050. The city also targets local pollutant emissions reductions of 20% by 2012. To help achieve these targets, the city plans to obtain 25% of electricity for municipal operations and buildings from renewable energy, by 2012. The city purchases biodiesel for its entire municipal vehicle fleet, and has established a $20 million Sustainable Energy Fund to provide low-interest financing for renewable energy projects. Toronto has installed solar PV on public buildings and is also facilitating “solar neighborhood” initiatives that promote innovative modes of community ownership.
48
Wellington, New Zealand (population 190,000). Wellington adopted a goal of reducing community CO2 emissions by 30% by 2020 and 80% by 2050, and reducing government own-use emissions by 40% by 2020 and 80% by 2050. One of Wellington s main strategies has been to promote wind power within it territorial boundaries by incorporating support for wind into land-use planning and consents. The city supported a major 143-MW wind farm being completed by 2009, including land-use consent, and support for community consultation and traffic management. Other policies and projects for renewable energy include a $300 rebate of consent fees for solar hot water and other renewable energy technologies, consideration of solar hot water in upgrades to city-owned housing, a landfill-gas partnership with a private company, and solar hot water in public facilities. Woking Borough, UK (population 91,000). The borough has installed combined heat-and-power in city council offices, as well as scattered mini-power stations, solar rooftop PV, and district heating. The town centre is energy self-sufficient and exports any surplus power. Diurnal and seasonal differences in solar and combined heat and power (CHP) are managed comprehensively. The borough has mandated that 10% of the energy required by all commercial and residential development must be generated by on-site RE and if this development is large, CHP is required. The borough has developed 20–30 year business/investment plans for renewable energy, requiring minimum internal rate of return (IRR) of 8% and expected revenue from both energy sales and green certificates. Money from energy savings through energy efficiency investments is used for further energy savings and renewable energy infrastructure development. Woking has partnered with the council energy company, Thamesway Energy Limited, and receives income from energy savings derived from the Council s Housing energy conservation, renewable energy, and CHP programs in the residential sector. Future priorities are to expand the number of CHP/renewable energy stations in the borough; to ensure that private power developers are connecting to Woking s local (private wire) distributed generation system, or supplying power for their own uses; and to build external partnerships and encourage private wire distributed generation systems elsewhere. Yokohama, Japan (population 3.6 million). Yokohama adopted a comprehensive urban plan “Yokohama Energy Vision” in 2008 that includes promotion of renewable energy. Central to this plan are targets to reduce greenhouse-gas emissions by 30% by 2025 and by 60% by 2050 (base 2004). Two-thirds of the emissions reduction will come from energy efficiency and one-third from renewable energy, which implies a ten-fold increase in renewable energy use by 2025. To achieve the target, a number of renewable-energy-related measures have been adopted: a requirement that large commercial buildings formulate CO2 reduction plans; installations of solar PV on government buildings and schools; subsidies for household solar PV; promotion of green-power certificate trading and purchases; use of city building rooftops for private renewable energy installations; and implementation of city-owned renewable energy projects that are financed by businesses and citizen-investors. The city is also considering solar hot water requirements for new construction. In the transport sector, the city is promoting a long-term roadmap for electric vehicles and ultimately a zero-emission transport system.

49
8. FURTHER RESEARCH This report is still a work in progress. The ultimate purpose of this report is to
• Give an understanding to the global energy/environment community of the importance of cities for renewables and show how much is being done.
• Inform and inspire people in cities (especially decision-makers and local government staff) to do more and give them basic knowledge to understand opportunities and possibilities.
• Show how communities are influenced by local governments (and vice-versa) in investing in renewable energy.
• Give insight into potentials -- how much renewables are possible at the local level given specific conditions and policies.
There are at least seven basic types of information that can be collected about local renewable energy around the world. This working draft report is only addressing type #1, but future editions should consider the other categories as well. 1. Policies and targets: Which policies exist? What are future targets? 2. Indicators: Which indicators best show the extent to which renewables are used or possible (actual and potentials), and what do those indicators show for cities worldwide? 3. Enabling (framework) conditions: What factors and conditions most influence (enable/inhibit) city action or inaction? For example:
What legal authorities exist that allow city action? Do national or state policies help the city in its goals? Do they hinder? Have city policies keyed off the national or state policies? Who are key stakeholders in regard to renewable energy and how do they participate? Is there a “renewable energy champion” within the city government?
4. Influence on national policies: How are national policies affected by local policies? Are there mechanisms by which local policy initiative eventually translates into national policy? 5. Policy-making processes: What are the historical and ongoing policy-making processes related to renewables? Who has shaped, led, and/or hindered those processes? 6. Results: Have policies been effective? What are the impacts and outcomes? Evidence? 7. Associations: How does the city participate with national or global associations related to renewable energy or climate change? Which associations and what benefits result?

50
POLICY EXAMPLES Table P1: Targets for CO2 Emissions Reductions Austin TX, USA Zero net emissions (“carbon-neutral”) by 2020 Adelaide, Australia Zero net emissions in transport (by 2012) and buildings (by 2020), and
reduce 20% by 2010 for government own-use emissions (base 1994) Ballarat, Australia Reduce 30% by 2010 (base 2000) and zero net emissions by 2020 Barcelona, Spain Reduce 20% by 2010 (base 1999); also reduce per-capita emissions
to 3.15 tonnes equivalent CO2/person by 2010 Berlin, Germany Reduce 25% by 2010 (base 1990) Berkeley CA, USA Reduce 80% in government own-use emissions by 2050 Bologna, Italy Reduce 6.5% by 2012 Boston MA, USA Reduce 7% by 2012 and 80% by 2050 (base 1990) Busan, Korea Reduce 10% by 2015 (base 2005) Calgary AB, Canada Reduce 20% by 2020; 50% by 2050 (base 2005) Chicago IL, USA Reduce 25% by 2020; 80% by 2050 (base 1990) Christchurch, New Zealand
Reduce 20% by 2020 (base 1994) for community; reduce 70% by 2011 for local government council and carbon-neutral beyond 2015.
Copenhagen, Denmark Reduce 20% by 2015; zero net emissions by 2025 Edmonton AB, Canada Reduce 20% by 2020 (base 1990) Freiburg i. BR, Germany Reduce 40% by 2030 (base 1992) Guelph ON, Canada Reduce 6% by 2010; 20% by 2010 for businesses (base 1994) Gwangju, Korea Reduce 20% by 2020 (base 1990) Halifax NS, Canada Reduce 20% by 2012 (base 1997) Hamburg, Germany Reduce 40% by 2020 and 80% by 2050 (base 1990) Hamilton ON, Canada Reduce 20% by 2020 (base 1990); 10% by 2012 and 20% by 2020 for
businesses (base 2005) Hepburn Shire, Australia Reduce 20% by 2010 for government own-use Iida City, Japan Reduce 40-50% by 2030 for households and 70% by 2050 (base
2005) Kawasaki, Japan Reduce 6% by 2010 (base 1990) Kitakyushu, Japan Reduce 150% by 2050 (net negative emissions) Kyoto, Japan Reduce 10% by 2010 London, UK Reduce 20% by 2010 and 60% by 2050 (base 1990) Los Angeles CA, USA Reduce 35% by 2030 (base 1990) Madrid, Spain Reduce 14% by 2012 and 50% by 2050 Malmö, Sweden Reduce 25% by 2012 (base 1990) Melbourne, Australia Reduce 30% by 2010 and zero net emissions by 2020; reduce street
lighting 50% by 2010 (base 1996) Montreal QC, Canada Reduce 20% by 2012 Moreland, Australia Zero net emissions by 2030; zero net emissions by government own-
use by 2020 Münster, Germany Reduce 40% by 2020 (base 1990) Nelson, New Zealand Reduce 40% by 2020 (base 2001) New Castle, Australia Reduce 25% below 2008 BAU scenario; 30% for government own-use
emissions (base 1995) New York City, USA Reduce 7% by 2012 (base 1990) Oakville ON, Canada Reduce 6% by 2014; 20% for businesses (base 2004) Oslo, Norway Reduce 50% by 2030 (base 1991) Ottawa ON, Canada Reduce 20% by 2012 (base 1990) Philadelphia PA, USA Reduce 10% by 2010 (base 1990) Portland OR, USA Reduce 10% by 2010 (base 1990)
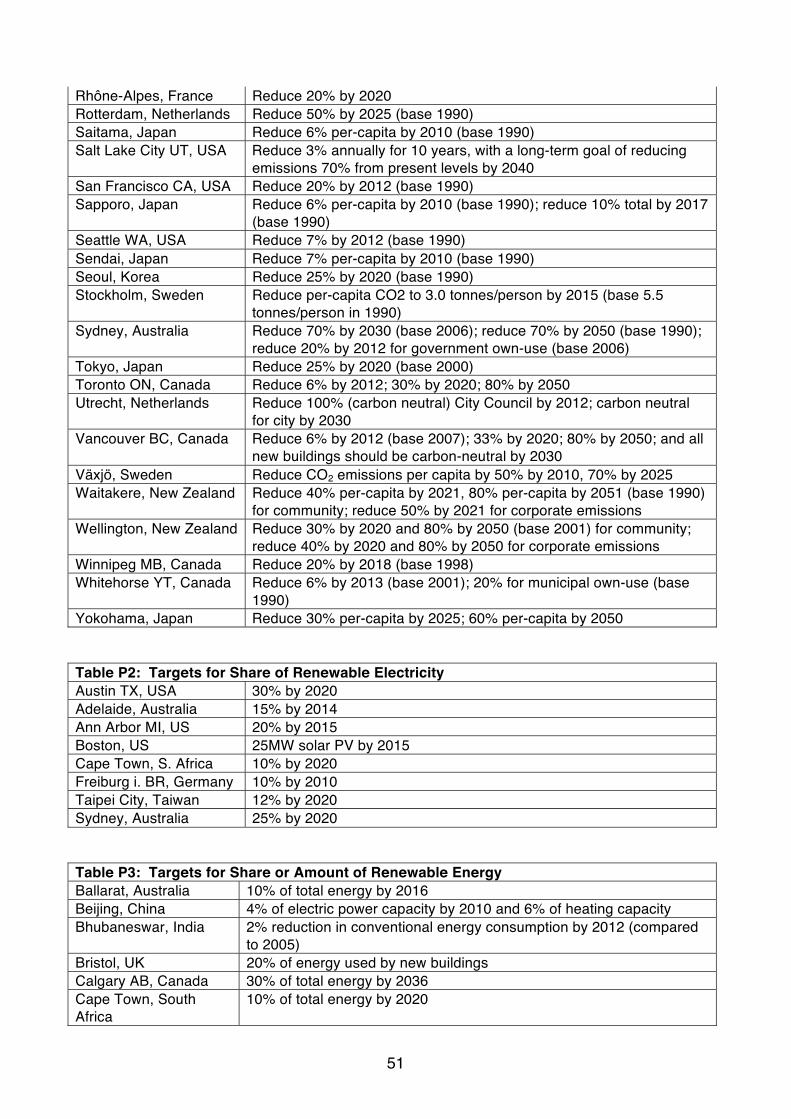
51
Rhône-Alpes, France Reduce 20% by 2020 Rotterdam, Netherlands Reduce 50% by 2025 (base 1990) Saitama, Japan Reduce 6% per-capita by 2010 (base 1990) Salt Lake City UT, USA Reduce 3% annually for 10 years, with a long-term goal of reducing
emissions 70% from present levels by 2040 San Francisco CA, USA Reduce 20% by 2012 (base 1990) Sapporo, Japan Reduce 6% per-capita by 2010 (base 1990); reduce 10% total by 2017
(base 1990) Seattle WA, USA Reduce 7% by 2012 (base 1990) Sendai, Japan Reduce 7% per-capita by 2010 (base 1990) Seoul, Korea Reduce 25% by 2020 (base 1990) Stockholm, Sweden Reduce per-capita CO2 to 3.0 tonnes/person by 2015 (base 5.5
tonnes/person in 1990) Sydney, Australia Reduce 70% by 2030 (base 2006); reduce 70% by 2050 (base 1990);
reduce 20% by 2012 for government own-use (base 2006) Tokyo, Japan Reduce 25% by 2020 (base 2000) Toronto ON, Canada Reduce 6% by 2012; 30% by 2020; 80% by 2050 Utrecht, Netherlands Reduce 100% (carbon neutral) City Council by 2012; carbon neutral
for city by 2030 Vancouver BC, Canada Reduce 6% by 2012 (base 2007); 33% by 2020; 80% by 2050; and all
new buildings should be carbon-neutral by 2030 Växjö, Sweden Reduce CO2 emissions per capita by 50% by 2010, 70% by 2025 Waitakere, New Zealand Reduce 40% per-capita by 2021, 80% per-capita by 2051 (base 1990)
for community; reduce 50% by 2021 for corporate emissions Wellington, New Zealand Reduce 30% by 2020 and 80% by 2050 (base 2001) for community;
reduce 40% by 2020 and 80% by 2050 for corporate emissions Winnipeg MB, Canada Reduce 20% by 2018 (base 1998) Whitehorse YT, Canada Reduce 6% by 2013 (base 2001); 20% for municipal own-use (base
1990) Yokohama, Japan Reduce 30% per-capita by 2025; 60% per-capita by 2050 Table P2: Targets for Share of Renewable Electricity Austin TX, USA 30% by 2020 Adelaide, Australia 15% by 2014 Ann Arbor MI, US 20% by 2015 Boston, US 25MW solar PV by 2015 Cape Town, S. Africa 10% by 2020 Freiburg i. BR, Germany 10% by 2010 Taipei City, Taiwan 12% by 2020 Sydney, Australia 25% by 2020 Table P3: Targets for Share or Amount of Renewable Energy Ballarat, Australia 10% of total energy by 2016 Beijing, China 4% of electric power capacity by 2010 and 6% of heating capacity Bhubaneswar, India 2% reduction in conventional energy consumption by 2012 (compared
to 2005) Bristol, UK 20% of energy used by new buildings Calgary AB, Canada 30% of total energy by 2036 Cape Town, South Africa
10% of total energy by 2020
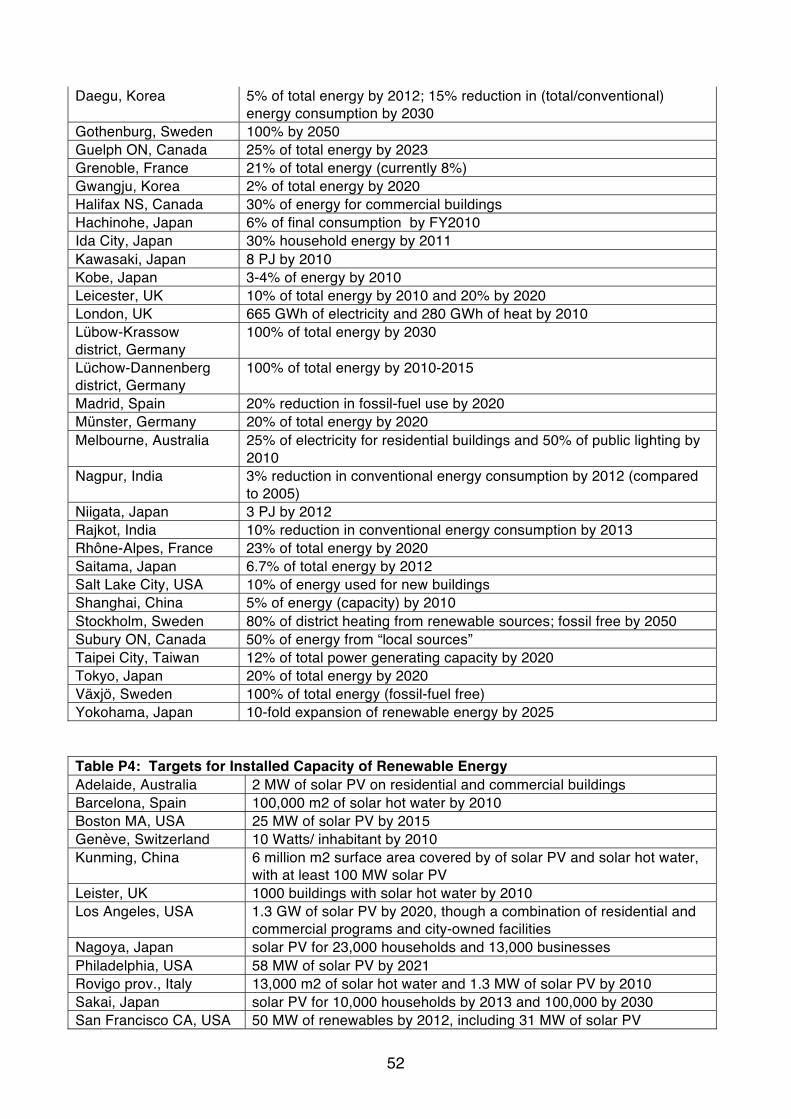
52
Daegu, Korea 5% of total energy by 2012; 15% reduction in (total/conventional) energy consumption by 2030
Gothenburg, Sweden 100% by 2050 Guelph ON, Canada 25% of total energy by 2023 Grenoble, France 21% of total energy (currently 8%) Gwangju, Korea 2% of total energy by 2020 Halifax NS, Canada 30% of energy for commercial buildings Hachinohe, Japan 6% of final consumption by FY2010 Ida City, Japan 30% household energy by 2011 Kawasaki, Japan 8 PJ by 2010 Kobe, Japan 3-4% of energy by 2010 Leicester, UK 10% of total energy by 2010 and 20% by 2020 London, UK 665 GWh of electricity and 280 GWh of heat by 2010 Lübow-Krassow district, Germany
100% of total energy by 2030
Lüchow-Dannenberg district, Germany
100% of total energy by 2010-2015
Madrid, Spain 20% reduction in fossil-fuel use by 2020 Münster, Germany 20% of total energy by 2020 Melbourne, Australia 25% of electricity for residential buildings and 50% of public lighting by
2010 Nagpur, India 3% reduction in conventional energy consumption by 2012 (compared
to 2005) Niigata, Japan 3 PJ by 2012 Rajkot, India 10% reduction in conventional energy consumption by 2013 Rhône-Alpes, France 23% of total energy by 2020 Saitama, Japan 6.7% of total energy by 2012 Salt Lake City, USA 10% of energy used for new buildings Shanghai, China 5% of energy (capacity) by 2010 Stockholm, Sweden 80% of district heating from renewable sources; fossil free by 2050 Subury ON, Canada 50% of energy from “local sources” Taipei City, Taiwan 12% of total power generating capacity by 2020 Tokyo, Japan 20% of total energy by 2020 Växjö, Sweden 100% of total energy (fossil-fuel free) Yokohama, Japan 10-fold expansion of renewable energy by 2025 Table P4: Targets for Installed Capacity of Renewable Energy Adelaide, Australia 2 MW of solar PV on residential and commercial buildings Barcelona, Spain 100,000 m2 of solar hot water by 2010 Boston MA, USA 25 MW of solar PV by 2015 Genève, Switzerland 10 Watts/ inhabitant by 2010 Kunming, China 6 million m2 surface area covered by of solar PV and solar hot water,
with at least 100 MW solar PV Leister, UK 1000 buildings with solar hot water by 2010 Los Angeles, USA 1.3 GW of solar PV by 2020, though a combination of residential and
commercial programs and city-owned facilities Nagoya, Japan solar PV for 23,000 households and 13,000 businesses Philadelphia, USA 58 MW of solar PV by 2021 Rovigo prov., Italy 13,000 m2 of solar hot water and 1.3 MW of solar PV by 2010 Sakai, Japan solar PV for 10,000 households by 2013 and 100,000 by 2030 San Francisco CA, USA 50 MW of renewables by 2012, including 31 MW of solar PV

53
Shanghai, China 200-300 MW of wind and 10 MW of solar PV by 2010 Sudbury ON, Canada 150 MW of wind and 10 MW small-hydro Tokyo, Japan 1 GW of added solar PV by 2010 Walloon region, Belgium 200,000 m2 of solar hot water/heating collectors by 2010 Table P5: Targets for Local Government Own-Use Purchases of Renewable Energy Austin TX, USA 100% of own-use electricity by 2012 Boston, USA 11% of own-use electricity (currently), 15% by 2012 Bhubaneswar, India reduce by 15% own-use conventional energy by 2012 Bristol, UK 15% of own-use electricity (14% currently) Calgary AB, Canada 100% of own-use electricity by 2012 Chicago, USA 20% of own-use electricity by 2006 Christchurch, New Zealand 100% of own-use electricity from carbon-neutral supplier
(currently) Hepburn Shire, Australia 100% for own-use in buildings, 8% for public lighting Houston TX, USA 50% of own-use electricity (currently) Kawasaki, Japan 5% of own-use electricity (currently) Madison WI, USA 20% of own-use electricity by 2010 Mississauga ON, Canada 100% of own-use electricity for city center (currently) Nagpur, India reduce by 20% own-use conventional energy by 2012 New York City, USA 20 MW of wind power for own-use by 2008 Okotoks AB, Canada 80% of own-use electricity (currently) Philadelphia PA, USA 15% of electricity for city buildings by 2015 Portland OR USA 100% of own-use electricity by 2010 Santa Monica CA, USA 100% of own-use electricity (currently) Sydney, Australia 100% of own-use energy Woking Borough, UK 20% of own-use electricity by 2011 Tokyo, Japan 5% of electricity by 2020 for public facilities Toronto ON, Canada 25% of own-use electricity by 2012 Sydney, Australia 100% of own-use electricity for buildings; 20% for street lighting Waitakere, New Zealand 15% of own-use energy by 2015 and 20% by 2020 Table P6: Targets for Share of Buildings with Renewable Energy Cape Town, S. Africa 10% of homes with solar hot water by 2010 Dezhou, China 50% of buildings with solar hot water by 2010 Iida City, Japan 30% of homes with solar PV by 2010 Kunming, China 50% of buildings with solar hot water and/or solar PV by 2010; 90% of
new construction Oxford, UK 10% of homes with solar hot water and/or solar PV by 2010 Table P7: Urban Planning Adelaide, Australia “Adelaide City Development Plan” calls for green buildings and
renewable energy technologies Barcelona, Spain “Plan for Energy Improvement in Barcelona (2002-2010)” includes
increasing the share of renewable energy used Berlin, Germany “Berlin Energy Action Plan” Chicago IL, USA “Chicago Climate Action Plan” Dubai, UAE Sustainable Development Policy Guelph ON, Canada “Community Energy Plan”

54
Göteborg, Sweden “Göteborg 2050” envisions being fossil-fuel-free by 2050 Halifax NS, Canada “Community Energy Plan” Hamburg, Germany Developing Wilhelmsburg model urban district supplied entirely from
renewables Hokuto, Japan “Hokuto New Energy Vision” Kawasaki, Japan “Kawasaki City New Energy Vision” Kobe, Japan “Kobe City New Energy Vision” London, UK “London Energy Strategy” calls for “sustainable energy system” by 2050 Melbourne, Australia “Zero Net Emissions by 2020” calls for green building design, energy
efficiency, renewable energy, and tree planting. Mexico City, Mexico “Proaire 2002-2010” targets reduced reduced air pollution and
greenhouse gas emissions. Projects include energy efficiency and solar hot water in the residential sector.
New York City, USA “PlaNYC 2030” encourages solar and distributed generation, pilot projects
Ottawa ON, Canada “Ottawa 2020” and “Air Quality and Climate Change Management Plan” Porto Alegre, Brazil “Program to Encourage the Use of Solar Energy in Buildings” Saitama, Japan “Saitama City New Energy Vision” Salt Lake City, USA "Salt Lake City Green" environmental plan includes wind power
purchases Shanghai, China “Regulations of Renewable Energy Development in Shanghai” Taipei City, Taiwan “Renewable Energy Promotion Plan” Tokyo, Japan “Tokyo Renewable Energy Strategy” (2006); “Tokyo Environment
Master Plan” (2008); “Tokyo Climate Change Action Plan” (2007) Toronto ON, Canada “Sustainable Energy Action Plan” Tsuru, Japan “Tsuru Regional New Energy Vision” Växjö, Sweden “Fossil Fuel Free Växjö” to reduce per-capita CO2 emissions Wellington, New Zealand
District planning encourages renewable energy, particularly wind power
Yokohama, Japan "Yokohama Energy Vision" targets commercial and public buildings, electric vehicles, solar PV subsidies, green power certificates, and solar hot water mandates
Table P8: Building Codes and Mandates Barcelona, Spain Mandates 60% of hot water heating energy from solar in all new
buildings and major renovations; was subsequently copied by 70 other municipalities throughout Spain
Berkeley CA, USA Mandated design review for solar PV installations in industrial, commercial, and some residential buildings
Berlin, Germany Mandates for solar hot water on some new buildings Boston, USA All new construction and renovation of city facilities are required to
meet LEED silver standards. All new building projects are required to exceed energy performance basic standard by a minimum of 14% and all renovated buildings to exceed a minimum of 7%; First major city to require new private building and construction meet the US Green Building Council s LEED standards; In 2007, zoning regulations mandated local private sector buildings over 50,000 square feet to meet LEED certifiable standards
Boulder CO, USA No-shade building ordinance entitles all structures to sunshine Cape Town, South Africa
Requires solar hot water in new houses for middle- and high-income groups
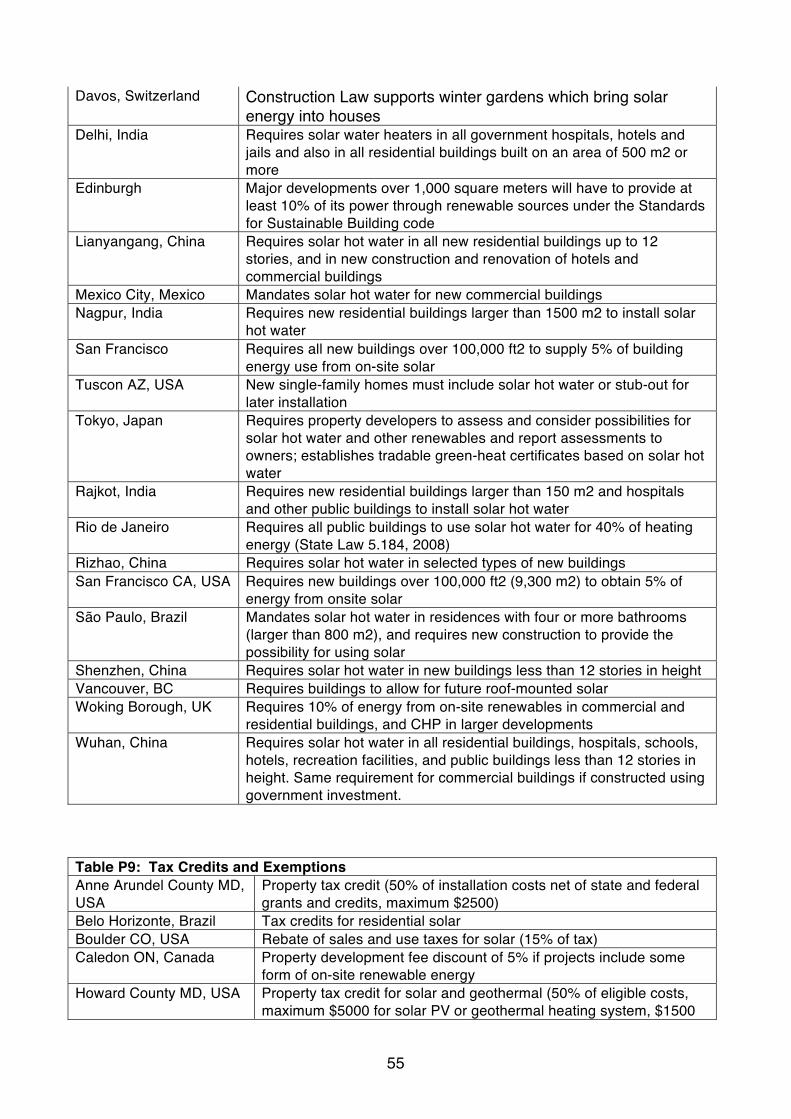
55
Davos, Switzerland Construction Law supports winter gardens which bring solar energy into houses
Delhi, India Requires solar water heaters in all government hospitals, hotels and jails and also in all residential buildings built on an area of 500 m2 or more
Edinburgh Major developments over 1,000 square meters will have to provide at least 10% of its power through renewable sources under the Standards for Sustainable Building code
Lianyangang, China Requires solar hot water in all new residential buildings up to 12 stories, and in new construction and renovation of hotels and commercial buildings
Mexico City, Mexico Mandates solar hot water for new commercial buildings Nagpur, India Requires new residential buildings larger than 1500 m2 to install solar
hot water San Francisco Requires all new buildings over 100,000 ft2 to supply 5% of building
energy use from on-site solar Tuscon AZ, USA New single-family homes must include solar hot water or stub-out for
later installation Tokyo, Japan Requires property developers to assess and consider possibilities for
solar hot water and other renewables and report assessments to owners; establishes tradable green-heat certificates based on solar hot water
Rajkot, India Requires new residential buildings larger than 150 m2 and hospitals and other public buildings to install solar hot water
Rio de Janeiro Requires all public buildings to use solar hot water for 40% of heating energy (State Law 5.184, 2008)
Rizhao, China Requires solar hot water in selected types of new buildings San Francisco CA, USA Requires new buildings over 100,000 ft2 (9,300 m2) to obtain 5% of
energy from onsite solar São Paulo, Brazil Mandates solar hot water in residences with four or more bathrooms
(larger than 800 m2), and requires new construction to provide the possibility for using solar
Shenzhen, China Requires solar hot water in new buildings less than 12 stories in height Vancouver, BC Requires buildings to allow for future roof-mounted solar Woking Borough, UK Requires 10% of energy from on-site renewables in commercial and
residential buildings, and CHP in larger developments Wuhan, China Requires solar hot water in all residential buildings, hospitals, schools,
hotels, recreation facilities, and public buildings less than 12 stories in height. Same requirement for commercial buildings if constructed using government investment.
Table P9: Tax Credits and Exemptions Anne Arundel County MD, USA
Property tax credit (50% of installation costs net of state and federal grants and credits, maximum $2500)
Belo Horizonte, Brazil Tax credits for residential solar Boulder CO, USA Rebate of sales and use taxes for solar (15% of tax) Caledon ON, Canada Property development fee discount of 5% if projects include some
form of on-site renewable energy Howard County MD, USA Property tax credit for solar and geothermal (50% of eligible costs,
maximum $5000 for solar PV or geothermal heating system, $1500
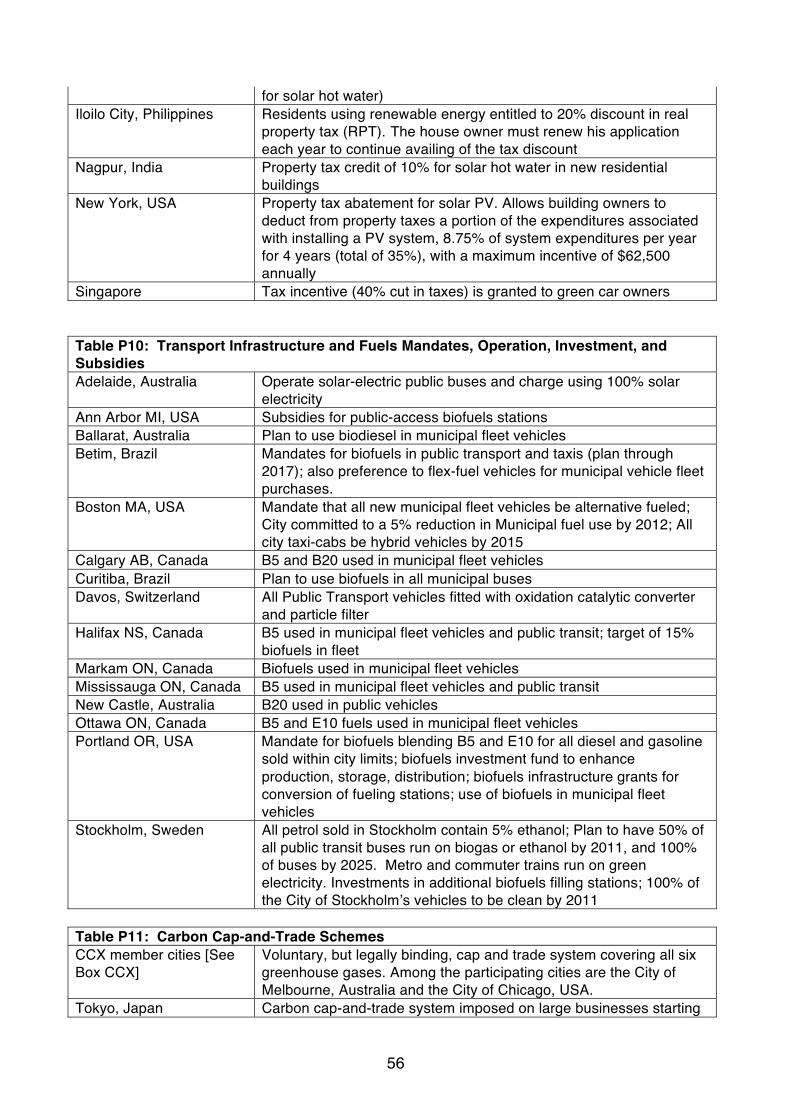
56
for solar hot water) Iloilo City, Philippines Residents using renewable energy entitled to 20% discount in real
property tax (RPT). The house owner must renew his application each year to continue availing of the tax discount
Nagpur, India Property tax credit of 10% for solar hot water in new residential buildings
New York, USA Property tax abatement for solar PV. Allows building owners to deduct from property taxes a portion of the expenditures associated with installing a PV system, 8.75% of system expenditures per year for 4 years (total of 35%), with a maximum incentive of $62,500 annually
Singapore Tax incentive (40% cut in taxes) is granted to green car owners Table P10: Transport Infrastructure and Fuels Mandates, Operation, Investment, and Subsidies Adelaide, Australia Operate solar-electric public buses and charge using 100% solar
electricity Ann Arbor MI, USA Subsidies for public-access biofuels stations Ballarat, Australia Plan to use biodiesel in municipal fleet vehicles Betim, Brazil Mandates for biofuels in public transport and taxis (plan through
2017); also preference to flex-fuel vehicles for municipal vehicle fleet purchases.
Boston MA, USA Mandate that all new municipal fleet vehicles be alternative fueled; City committed to a 5% reduction in Municipal fuel use by 2012; All city taxi-cabs be hybrid vehicles by 2015
Calgary AB, Canada B5 and B20 used in municipal fleet vehicles Curitiba, Brazil Plan to use biofuels in all municipal buses Davos, Switzerland All Public Transport vehicles fitted with oxidation catalytic converter
and particle filter Halifax NS, Canada B5 used in municipal fleet vehicles and public transit; target of 15%
biofuels in fleet Markam ON, Canada Biofuels used in municipal fleet vehicles Mississauga ON, Canada B5 used in municipal fleet vehicles and public transit New Castle, Australia B20 used in public vehicles Ottawa ON, Canada B5 and E10 fuels used in municipal fleet vehicles Portland OR, USA Mandate for biofuels blending B5 and E10 for all diesel and gasoline
sold within city limits; biofuels investment fund to enhance production, storage, distribution; biofuels infrastructure grants for conversion of fueling stations; use of biofuels in municipal fleet vehicles
Stockholm, Sweden All petrol sold in Stockholm contain 5% ethanol; Plan to have 50% of all public transit buses run on biogas or ethanol by 2011, and 100% of buses by 2025. Metro and commuter trains run on green electricity. Investments in additional biofuels filling stations; 100% of the City of Stockholm s vehicles to be clean by 2011
Table P11: Carbon Cap-and-Trade Schemes CCX member cities [See Box CCX]
Voluntary, but legally binding, cap and trade system covering all six greenhouse gases. Among the participating cities are the City of Melbourne, Australia and the City of Chicago, USA.
Tokyo, Japan Carbon cap-and-trade system imposed on large businesses starting
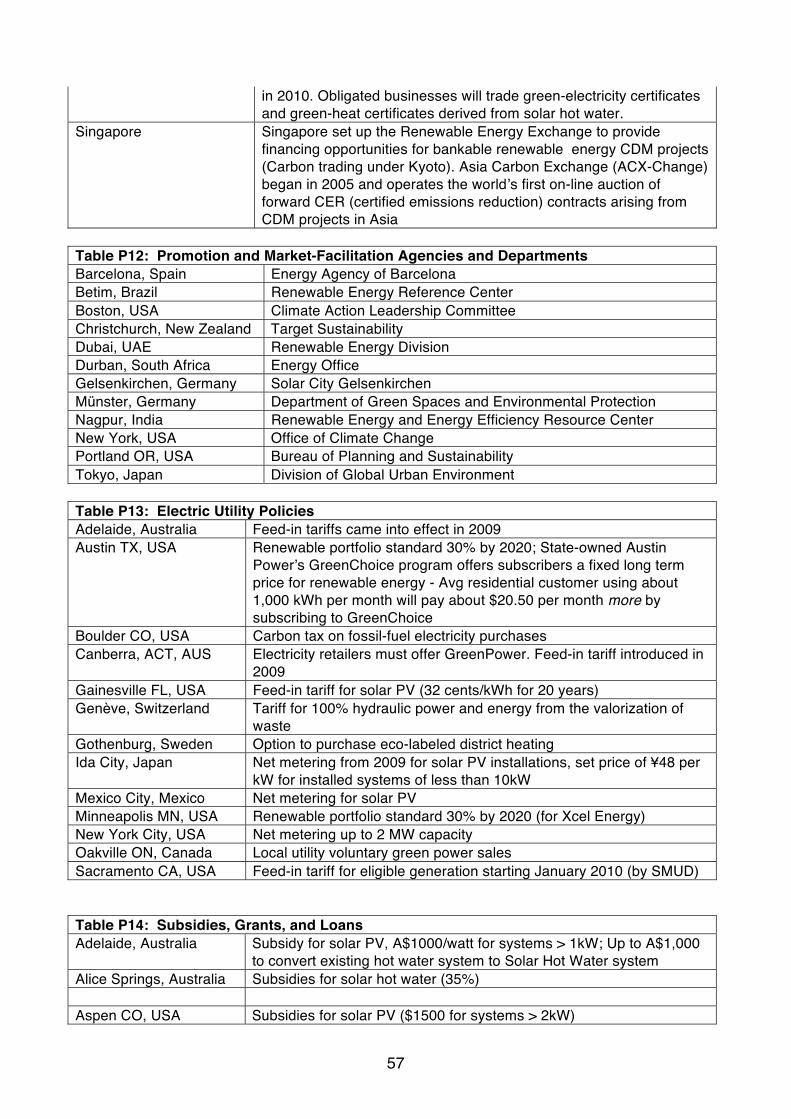
57
in 2010. Obligated businesses will trade green-electricity certificates and green-heat certificates derived from solar hot water.
Singapore Singapore set up the Renewable Energy Exchange to provide financing opportunities for bankable renewable energy CDM projects (Carbon trading under Kyoto). Asia Carbon Exchange (ACX-Change) began in 2005 and operates the world s first on-line auction of forward CER (certified emissions reduction) contracts arising from CDM projects in Asia
Table P12: Promotion and Market-Facilitation Agencies and Departments Barcelona, Spain Energy Agency of Barcelona Betim, Brazil Renewable Energy Reference Center Boston, USA Climate Action Leadership Committee Christchurch, New Zealand Target Sustainability Dubai, UAE Renewable Energy Division Durban, South Africa Energy Office Gelsenkirchen, Germany Solar City Gelsenkirchen Münster, Germany Department of Green Spaces and Environmental Protection Nagpur, India Renewable Energy and Energy Efficiency Resource Center New York, USA Office of Climate Change Portland OR, USA Bureau of Planning and Sustainability Tokyo, Japan Division of Global Urban Environment Table P13: Electric Utility Policies Adelaide, Australia Feed-in tariffs came into effect in 2009 Austin TX, USA Renewable portfolio standard 30% by 2020; State-owned Austin
Power s GreenChoice program offers subscribers a fixed long term price for renewable energy - Avg residential customer using about 1,000 kWh per month will pay about $20.50 per month more by subscribing to GreenChoice
Boulder CO, USA Carbon tax on fossil-fuel electricity purchases Canberra, ACT, AUS Electricity retailers must offer GreenPower. Feed-in tariff introduced in
2009 Gainesville FL, USA Feed-in tariff for solar PV (32 cents/kWh for 20 years) Genève, Switzerland Tariff for 100% hydraulic power and energy from the valorization of
waste Gothenburg, Sweden Option to purchase eco-labeled district heating Ida City, Japan Net metering from 2009 for solar PV installations, set price of ¥48 per
kW for installed systems of less than 10kW Mexico City, Mexico Net metering for solar PV Minneapolis MN, USA Renewable portfolio standard 30% by 2020 (for Xcel Energy) New York City, USA Net metering up to 2 MW capacity Oakville ON, Canada Local utility voluntary green power sales Sacramento CA, USA Feed-in tariff for eligible generation starting January 2010 (by SMUD) Table P14: Subsidies, Grants, and Loans Adelaide, Australia Subsidy for solar PV, A$1000/watt for systems > 1kW; Up to A$1,000
to convert existing hot water system to Solar Hot Water system Alice Springs, Australia Subsidies for solar hot water (35%) Aspen CO, USA Subsidies for solar PV ($1500 for systems > 2kW)

58
Austin TX, USA Subsidies for solar PV and solar hot water in homes and businesses, and low-interest loans for solar PV
Beijing, China Subsidies for ground-source heat pumps (50 RMB/m2) and water-source heat pumps (35 RMB/m2)
Berkeley CA, USA Loans to households for solar PV, repaid through property tax bills (up to $37,500 per installation)
Berlin, Germany Subsidies for solar PV (40%) and solar hot water (30%) on apartment buildings
Boulder CO, USA Small loan program ($3000-5000 loans) Christchurch, New Zealand
Lower permit costs for solar hot water
Delhi, India Subsidies to non-commercial institutions for solar hot water on buildings of system size 100–6000 liters hot water per day (6,000–60,000 rupees/system)
Dunedin, New Zealand Waives consent fee for residential solar hot water installations Kanagawa, Japan Loans to households for solar PV, solar hot water, and wind Kawasaki, Japan Subsidies for solar PV for households (JPY 70,000/kW up to 3.5 kW) Kyoto, Japan Subsidies for solar PV for households (JPY 50,000/kW up to 4 kW) Hachinohe, Japan Subsidies for solar PV (JPY 20,000/kW up to JPY70,000) Honolulu HI, USA Solar Roofs Loan Program provides 7-year low-interest loans (0-2%)
and installation in partnership with local electric utility, for low-income residents
Ida City, Japan Subsidies for solar PV ( ¥70,000 per kW, limited to a maximum of 3 kW); Free installation of 3.5 kW Solar PV systems for a limited time; Subsidies of up to 20% of the cost (limited to ¥30,000) for residential solar hot water installations; Subsidies of up to 20% of the cost (limited to ¥75,000 for wood stoves, and ¥50,000 for pellet stoves or boilers) for biomass equipment installations with ¥10pkW up to 50,000yen offered for all pellet users
Marin County CA, USA Subsidies for solar ($500 for solar PV, $300 for solar hot water) Matsuyama, Japan 12.5% of solar PV cost for systems less than 10 kW; JPY 1 million for
systems larger than 10 kW Maui County HI, USA Subsidy for solar PV ($1000) Montgomery County MD, USA
Electricity price rebate for clean energy ($0.005/kWh)
Ototoks AB, Canada Revolving fund provides finance for solar Orange County FL, USA Subsidy for solar hot water ($200) Orlando FL, USA Subsidy for solar PV in commercial buildings Palm Desert CA, USA Loans repaid through property tax assessments ($5000 minimum) Porto Alegre, Brazil Grants for installation of solar hot water in buildings (fixed grant per
installation) Rome, Italy Subsidies for solar hot water (up to 30%) and solar PV (up to 60%) Sapporo, Japan Subsidies for solar PV for households (10%) San Francisco CA, USA Subsidies for solar PV ($2000-4000 for households, $7000 for low-
income households, $1500/kW for businesses and non-profit entities up to $10,000)
Sonoma County CA, USA
Loans repaid through property tax assessments ($2500 minimum)
Southampton NY, USA Subsidies for solar PV ($2500) Taipei City, Taiwan Subsidies for solar hot water Tianjin, China Subsidies, discounted loans, and tax rebates Tokyo, Japan Subsidies for solar PV in 2009 and 2010 (JPY 100,000/kW) and solar
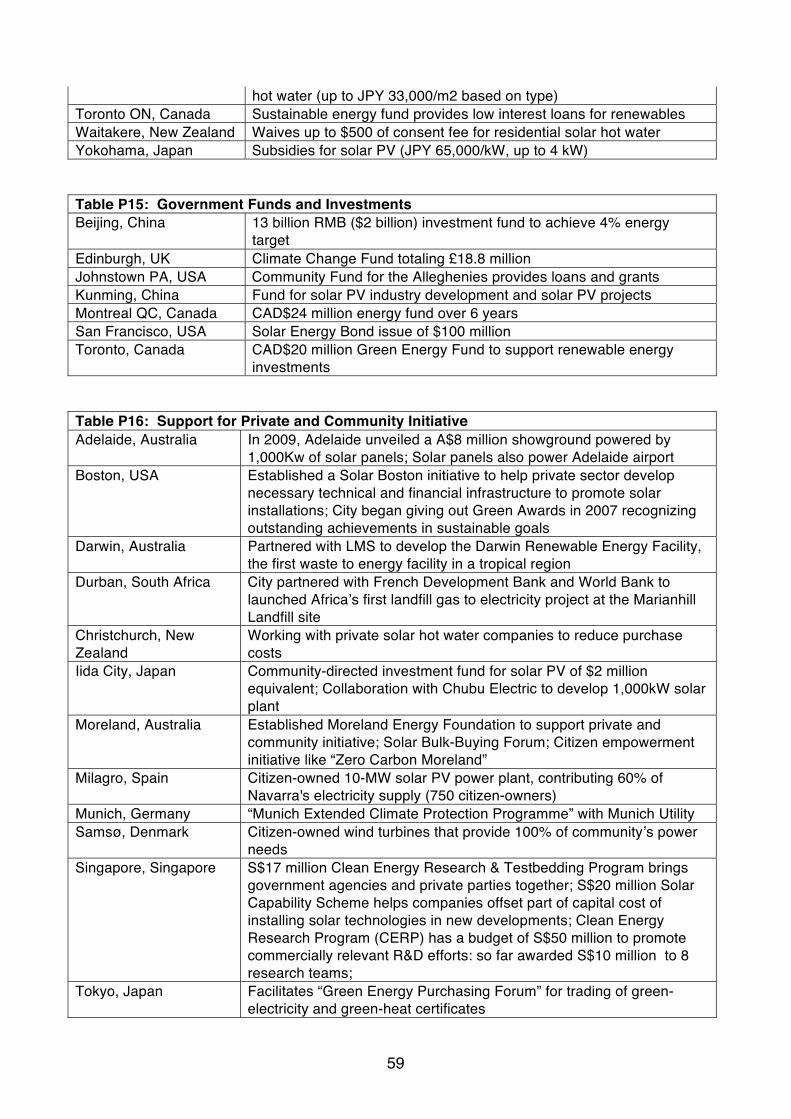
59
hot water (up to JPY 33,000/m2 based on type) Toronto ON, Canada Sustainable energy fund provides low interest loans for renewables Waitakere, New Zealand Waives up to $500 of consent fee for residential solar hot water Yokohama, Japan Subsidies for solar PV (JPY 65,000/kW, up to 4 kW) Table P15: Government Funds and Investments Beijing, China 13 billion RMB ($2 billion) investment fund to achieve 4% energy
target Edinburgh, UK Climate Change Fund totaling £18.8 million Johnstown PA, USA Community Fund for the Alleghenies provides loans and grants Kunming, China Fund for solar PV industry development and solar PV projects Montreal QC, Canada CAD$24 million energy fund over 6 years San Francisco, USA Solar Energy Bond issue of $100 million Toronto, Canada CAD$20 million Green Energy Fund to support renewable energy
investments Table P16: Support for Private and Community Initiative Adelaide, Australia In 2009, Adelaide unveiled a A$8 million showground powered by
1,000Kw of solar panels; Solar panels also power Adelaide airport Boston, USA Established a Solar Boston initiative to help private sector develop
necessary technical and financial infrastructure to promote solar installations; City began giving out Green Awards in 2007 recognizing outstanding achievements in sustainable goals
Darwin, Australia Partnered with LMS to develop the Darwin Renewable Energy Facility, the first waste to energy facility in a tropical region
Durban, South Africa City partnered with French Development Bank and World Bank to launched Africa s first landfill gas to electricity project at the Marianhill Landfill site
Christchurch, New Zealand
Working with private solar hot water companies to reduce purchase costs
Iida City, Japan Community-directed investment fund for solar PV of $2 million equivalent; Collaboration with Chubu Electric to develop 1,000kW solar plant
Moreland, Australia Established Moreland Energy Foundation to support private and community initiative; Solar Bulk-Buying Forum; Citizen empowerment initiative like “Zero Carbon Moreland”
Milagro, Spain Citizen-owned 10-MW solar PV power plant, contributing 60% of Navarra's electricity supply (750 citizen-owners)
Munich, Germany “Munich Extended Climate Protection Programme” with Munich Utility Samsø, Denmark Citizen-owned wind turbines that provide 100% of community s power
needs Singapore, Singapore S$17 million Clean Energy Research & Testbedding Program brings
government agencies and private parties together; S$20 million Solar Capability Scheme helps companies offset part of capital cost of installing solar technologies in new developments; Clean Energy Research Program (CERP) has a budget of S$50 million to promote commercially relevant R&D efforts: so far awarded S$10 million to 8 research teams;
Tokyo, Japan Facilitates “Green Energy Purchasing Forum” for trading of green-electricity and green-heat certificates