REMUNERATION REPORT -...
16
WorleyParsons Annual Report 2015 51 REMUNERATION REPORT The Company’s directors present the Remuneration Report prepared in accordance with section 300A of the Corporations Act 2001 (Act) for the Company and the consolidated entity for financial year 2015 (FY2015). The information provided in this Remuneration Report has been audited as required by section 308(3C) of the Act. This Remuneration Report forms part of the Directors’ Report. The Remuneration Report is presented in four sections: SECTION WHAT IT COVERS PAGE 1. Letter from the Chairman of the Remuneration Committee How Company performance was reflected in Executive remuneration during FY2015. Key changes in remuneration during FY2016. 52 52 2. Remuneration Governance Framework The guiding principles adopted by the Board which underpin all remuneration decisions and actions. How the Board, Nominations Committee and Remuneration Committee make remuneration decisions. 53 54 3. Executive Remuneration in Detail The names and positions of the Executive Director and Group Executives (Executives) whose remuneration details are disclosed. A breakdown of the Executive remuneration structure, and summary of the key terms and performance conditions for the “at risk” components (short and long term incentives) including a description of the Combined Incentive Plan. It also includes details of the Clawback (Malus) provision. How the Company’s performance over a five year period has impacted on remuneration outcomes. The remuneration outcomes for Executives in accordance with the Australian Accounting Standards (accounting standards), including total remuneration, vesting of at risk components and movements in equity holdings. It also includes details of actual remuneration awarded during the year and actual remuneration received. The key contract terms governing the employment arrangements of Executives. Details of termination arrangements of exiting Key Management Personnel (KMP) and the equity allocation for Mr Abba. 55 55 58 60 64 4. Non‑Executive Director Remuneration The names and positions of the Non‑Executive Directors (NEDs) whose remuneration details are disclosed. The guiding principles which govern the process and basis for setting NED remuneration. An outline of the remuneration structure for NEDs, including current Board and Committee fees. Details of NEDs’ total remuneration in FY2015 and FY2014. 65 65 65 65 GLOSSARY Clawback (Malus) – provides the Board with discretion on the treatment of equity awards where an employee has acted fraudulently or dishonestly, is in breach of that employee’s obligations to the Company, or has received awards based on financial accounts which are later restated. Combined Incentive Plan – a variable component of total remuneration. Delivers an incentive based on Company achievement against budget Group Net Profit After Tax (NPAT) and Executive achievement against agreed Key Performance Indicators (KPIs). Two thirds of the incentive value is paid as cash and one third is deferred as an equity award subject to a three year service and performance requirement. Earnings Per Share (EPS) – determined by dividing the Group NPAT by the weighted average number of the Company’s ordinary shares on issue during the financial year. Executive – as detailed on page 55, Executives include both Executive Directors and Group Executives and have authority and responsibility for planning, directing and controlling the activities of the entity, directly or indirectly. Group Net Profit After Tax (NPAT) – is the net profit earned by the Group after deducting all expenses including interest, depreciation and tax. From time to time, in determining outcomes under the incentive plans, the Board may use its discretion to apply the underlying NPAT which in the Board’s opinion reflects the Company’s operating results. Key Management Personnel (KMP) – those persons having authority and responsibility for planning, directing and controlling the activities of the entity, directly or indirectly, including any director (whether executive or otherwise) of that entity. KMP comprise Executives and Non‑Executive Directors and are detailed on pages 55 and 65. Key Performance Indicators (KPIs) – performance targets agreed at the start of each financial year under the Combined Incentive Plan. KPIs include both financial and non‑financial metrics, examples of which are detailed on page 56. Long Term Incentive (LTI) Plan – a variable component of total remuneration. Performance rights are granted to Executives under the LTI Plan and will vest and become available for exercise after four years, subject to Company achievement against prescribed long term performance requirements. Non‑Executive Director (NED) – as detailed on page 65, directors of the entity have authority and responsibility for planning, directing and controlling the activities of the entity, directly or indirectly. Total Shareholder Return (TSR) – provides a measure of the change in the value of the Company’s share price over a period, including reinvested dividends, expressed as a percentage of the opening value of the shares.
Transcript of REMUNERATION REPORT -...
WorleyParsons Annual Report 2015 51
REMUNERATION REPORTThe Company’s directors present the Remuneration Report prepared in accordance with section 300A of the Corporations Act 2001 (Act) for the Company and the consolidated entity for financial year 2015 (FY2015). The information provided in this Remuneration Report has been audited as required by section 308(3C) of the Act. This Remuneration Report forms part of the Directors’ Report.
The Remuneration Report is presented in four sections:
SECTION WHAT IT COVERS PAGE
1. Letter from the Chairman of the Remuneration Committee
HowCompanyperformancewasreflectedinExecutiveremunerationduringFY2015.KeychangesinremunerationduringFY2016.
5252
2. Remuneration Governance Framework
The guiding principles adopted by the Board which underpin all remuneration decisions and actions.How the Board, Nominations Committee and Remuneration Committee make remuneration decisions.
5354
3. Executive Remuneration in Detail
The names and positions of the Executive Director and Group Executives (Executives) whose remuneration details are disclosed.A breakdown of the Executive remuneration structure, and summary of the key terms and performance conditions for the “at risk” components (short and long term incentives) including a description of the Combined Incentive Plan. It also includes details of the Clawback (Malus) provision.How the Company’s performance over a five year period has impacted on remuneration outcomes.The remuneration outcomes for Executives in accordance with the Australian Accounting Standards (accounting standards), including total remuneration, vesting of at risk components and movements in equity holdings. It also includes details of actual remuneration awarded during the year and actual remuneration received.The key contract terms governing the employment arrangements of Executives. Details of termination arrangements of exiting Key Management Personnel (KMP) and the equity allocation for Mr Abba.
55
55
5860
64
4. Non‑Executive Director Remuneration
The names and positions of the Non‑Executive Directors (NEDs) whose remuneration details are disclosed.The guiding principles which govern the process and basis for setting NED remuneration.An outline of the remuneration structure for NEDs, including current Board and Committee fees.Details of NEDs’ total remunerationinFY2015andFY2014.
65656565
GLOSSARYClawback (Malus) – provides the Board with discretion on the treatment of equity awards where an employee has acted fraudulently or dishonestly, is in breach of that employee’s obligations to the Company, or has received awards based on financial accounts which are later restated.Combined Incentive Plan – a variable component of total remuneration. Delivers an incentive based on Company achievement against budget Group Net Profit After Tax (NPAT) and Executive achievement against agreed Key Performance Indicators (KPIs). Two thirds of the incentive value is paid as cash and one third is deferred as an equity award subject to a three year service and performance requirement.Earnings Per Share (EPS) – determined by dividing the Group NPAT by the weighted average number of the Company’s ordinary shares on issue during the financial year.Executive – as detailed on page 55, Executives include both Executive Directors and Group Executives and have authority and responsibility for planning, directing and controlling the activities of the entity, directly or indirectly.Group Net Profit After Tax (NPAT) – is the net profit earned by the Group after deducting all expenses including interest, depreciation and tax. From time to time, in determining outcomes under the incentive plans, the Board may use its discretion to apply the underlying NPAT which in the Board’s opinion reflects the Company’s operating results.Key Management Personnel (KMP) – those persons having authority and responsibility for planning, directing and controlling the activities of the entity, directly or indirectly, including any director (whether executive or otherwise) of that entity. KMP comprise Executives and Non‑Executive Directors and are detailed on pages 55 and 65.Key Performance Indicators (KPIs) – performance targets agreed at the start of each financial year under the Combined Incentive Plan. KPIs include both financial and non‑financial metrics, examples of which are detailed on page 56.Long Term Incentive (LTI) Plan – a variable component of total remuneration. Performance rights are granted to Executives under the LTI Plan and will vest and become available for exercise after four years, subject to Company achievement against prescribed long term performance requirements.Non‑Executive Director (NED) – as detailed on page 65, directors of the entity have authority and responsibility for planning, directing and controlling the activities of the entity, directly or indirectly.Total Shareholder Return (TSR) – provides a measure of the change in the value of the Company’s share price over a period, including reinvested dividends, expressed as a percentage of the opening value of the shares.
52 WorleyParsons Annual Report 2015
Directors’ report CONTINUED
1. LETTER FROM THE CHAIRMAN OF THE REMUNERATION COMMITTEEDear Shareholders,CHANGES TO KEY MANAGEMENT PERSONNELThis year we welcomed two new Executives, Dennis Finn and Filippo Abba. Dennis commenced as Group Managing Director/Chief Executive Officer (CEO) of our Advisory business (Advisian) on 1 September 2014 and has become Key Management Personnel (KMP) effective 1 July 2015 with the launch of Advisian as a separate business line. Filippo commenced as Group Managing Director, Improve on 1 April 2015, succeeding Randy Karren who retired on 31 March 2015.PAY FOR PERFORMANCE IN FY2015This year’s financial results fell below the Group NPAT gate opener threshold to trigger a payment, resulting in Executives receiving no short term incentive payments.Also, the benchmarks for shareholder return and earnings per share in our long term incentive scheme have not been met, resulting in equity grants not vesting for the third year in a row.CHANGES TO REMUNERATION FOR FY2016 AND BEYONDThese outcomes are consistent with our philosophy that our Executives’ incentives should reflect shareholder outcomes. However, the Remuneration Committee has been considering the impact our remuneration outcomes are having on the motivation and retention of our key people, especially during periods of great volatility in the markets for our services.We concluded that while Company performance must remain the driving force in determining short term incentives, it is also important to appropriately reward our people for significant achievements in delivering on our strategy.Withthisinmind,theBoardisrevisingtheExecutives’remunerationstructureforFY2016.FIXED PAY AND PAY MIXWe have noted that many of our competitors give more weight to the incentive components in their remunerations structures. In this context, the Company’s future remuneration reviews will have a bias to increasing the incentive components.WehavethusmadenoadjustmentstoourExecutives’FixedPayforFY2016,excepttoreflecttheCEO’srequestthathisownFixedPaybereducedby10% from 1 July 2015.WehavealsomadenochangestoNon‑ExecutiveDirectors’feesforFY2016.LONG TERM INCENTIVESNoadjustmentswillbemadetotheLongTermIncentive(LTI)PlanforFY2016.COMBINED INCENTIVE PLANA key aspect of aligning our Executives’ interests with shareholders, to ensure they have sufficient “skin in the game”, is our minimum shareholding requirementoftwotimesFixedPay(fourtimesfortheCEO).TheFY2016CombinedIncentivePlan(CIPlan)willbeamendedtoprovidemorecertainty of growth in Executive shareholdings, while retaining the overall target pay mix of short term cash and medium term deferred equity.CASH PORTION OF THE CI PLANThecashcomponentoftheCIPlanretainsafocusonbothfinancialandnon‑financialKeyPerformanceIndicators(KPIs).ForFY2016andbeyond,theoverall Group NPAT gate opener will be replaced by individual thresholds for each KPI to improve an Executive’s line of sight over achieving their targets. The Board retains rigorous oversight of the KPIs set, and will continue to ensure they retain sufficient stretch, and appropriate thresholds. Group NPAT remains one of the key financial KPIs, along with business line EBIT targets relevant to each business line leader, as well as cash collection targets. The non‑financial KPIs are focused on our strategic imperatives.FromFY2016amoreleveragedmodelwillapplytofinancialKPIs.Wehaveextendedthescalefrom90%backto80%inrecognitionthatweareatavery volatile point of our economic cycle and that notwithstanding the efforts of our Executives, the variability of outcomes has increased. At or below 80% of target (e.g. Group NPAT budget) no payment will be made.A sliding scale will then apply with 5% of the target incentive awarded for each 1% achieved above 80% of budget up to a cap of 200% of target incentive if 120% or more of budget is achieved. Non‑financial KPIs will have a 100% maximum score. As the minimum weighting for financials is 50%, the combined effect restricts the overall incentive to 150% of target.The current scale provides, for example, 91% vesting at 91% performance. The new sliding scale provides for significantly reduced payouts for performance above the threshold, but below the target. The Board considers this approach should give Executives greater incentive to overachieve.EQUITY PORTION OF THE CI PLANThe CI Plan will retain the deferred equity component, including a forfeiture provision if results are subsequently restated or any impropriety occurs. The equity portion will continue to be granted annually as performance rights. The vesting period for this equity will be reduced from three to two years. (The LTI remains a four year plan with no ability for re‑testing.)The rights under the CI Plan will convert into a number of shares that depends on changes in the share price over a two year performance period. If the share price doubles (or more than doubles) over that performance period, the rights convert into twice the number of shares. If the share price halves (or more than halves), the rights do not convert into any shares and they lapse. In between double and half the share price, the rights vest on a proportionate basis. However, given the variation in the share price, the value of the shares into which the rights convert will rise or fall more than proportionately.In the US these kinds of performance rights are sometimes known as Market Stock Units (MSUs) but for greater clarity we call them Share Price Performance Rights (SPPRs).
WorleyParsons Annual Report 2015 53
We provide the following four examples to help your understanding of how the SPPRs will work. Two examples are where the share price rises, and two where it falls. The four examples are based on a notional grant of 1,000 SPPRs with a notional WorleyParsons share price of $8.00 at the time the SPPRs are issued, i.e. a notional value to the executive of $8,000. In two years’ time:Scenario 1: The opening share price rises to $20.00 (i.e. more than doubles). The 1,000 SPPRs convert to 2,000 shares and their total value = $40,000. The executive’s incentive has delivered a $40,000 reward (in shares), i.e. $32,000 above the notional $8,000 value at the time of issue.Scenario 2: The opening share price rises to $12.00. The 1,000 SPPRs convert to 1,000 x ($12/$8) = 1,500 shares and their total value = $18,000. The executive’s incentive has delivered an $18,000 reward (in shares), i.e. $10,000 above the notional $8,000 value at the time of issue.Scenario 3: The opening share price falls to $6.00. The 1,000 SPPRs convert to 1,000 x ($6/$8) = 750 shares and their total value = $4,500. The executive’s incentive has delivered a $4,500 reward (in shares), i.e. $3,500 below the notional $8,000 value at the time of issue.Scenario 4: The opening share price halves or more, then the SPPRs lapse and no shares are issued.The Board has introduced SPPRs because they bring the Company closer to the remuneration practices of our global peers with higher weightings to performance‑related pay. They:• provideourExecutiveswithacleargoal–theincreaseintheCompany’sshareprice–morecloselyaligningtheirinterestswiththoseof
shareholders;• havethepotentialtobeastrongerexecutiveincentivethanthedeferredequitycomponentofprioryears;• replacethepreviousGroupNPATthreshold(or“gate‑opener”)withathresholdrelatingtoshareprice,givingExecutivesstrongershareholder
alignment, while at the same time protecting shareholders on the downside by the reward cutting out if the share price halves. This cut out is not typically a feature of this type of award in other companies, but we believe it strikes a better balance between rewarding effort and requiring minimum short term outcomes which is more appropriate to current circumstances. Such a balance is important given the changes that the Company iscurrentlymakingtoseektobetterpositionitselfforfuturegrowthandtheneedtoensureexecutivemotivationandretentionduringthistime;and
• havethepotentialtoincreaseexecutiveshareholding“skininthegame”andshareholderalignmentbecause,asSPPRsconvertintosharesintheCompany, executives will be required to hold the shares to comply with the Company’s minimum shareholding requirement.
I wish to reaffirm to shareholders that the Board is resolute in its focus on appropriate remuneration for our people and ensuring we strike the right balances between short term performance and attracting and retaining the caliber of people we need to execute our strategy to “Realize our future”.Kind regards
JOHN M GREENChairman, Remuneration Committee
2. REMUNERATION GOVERNANCE FRAMEWORKGUIDING REMUNERATION PRINCIPLESThe guiding principles that underpin the Company’s remuneration arrangements for Executives are driven from the Company beliefs. These beliefs guide our actions, making it clear what we are accountable for and how we achieve success:
DELIVER WHAT WE PROMISE ZERO HARM
PRUDENTLY CONTAIN COST AND ELIMINATE WASTE
BUILD ENDURING CUSTOMER RELATIONSHIPS
DEVELOP AND REWARD TEAMS WHO DELIVER ON CUSTOMER EXPECTATIONS
The Executive remuneration principles drive the behaviors and results to help us achieve our strategy and vision:
• provideafairlevelofrewardinordertoretainandattracthighcaliberemployees;• buildacultureofachievementbyprovidingatransparentlinkbetweenrewardandperformance;• buildlongtermemployeecommitmentthroughcontinuedWorleyParsonsshareownership;• promotemutuallybeneficialoutcomesbyaligningemployee,customerandshareholderinterests;and• supporttheexpectationsoftheDiversityandInclusionPolicy.
Putting the remuneration principles into practice, we:
• benchmarkourrolesagainstrolesinthemarket.Webenchmarkfixedpay,variablepayandpaymix.Individualremunerationreflectstheindividual’srole,responsibilities,performance,qualificationsandexperience;
• ensuretheBoardsetsKPIsforExecutives;• rewardsubjecttoCompanyperformanceandindividualperformance;• providetheopportunitytoearnequitythroughtheLTIPlanandtheCombinedIncentivePlan;• haveaminimumshareholdingrequirement;and• ensureperformancemetricsaregearedatfocusingExecutivesonstrongfinancialperformance,whilebalancinglongterminterestsoftheCompany.
54 WorleyParsons Annual Report 2015
Directors’ report CONTINUED
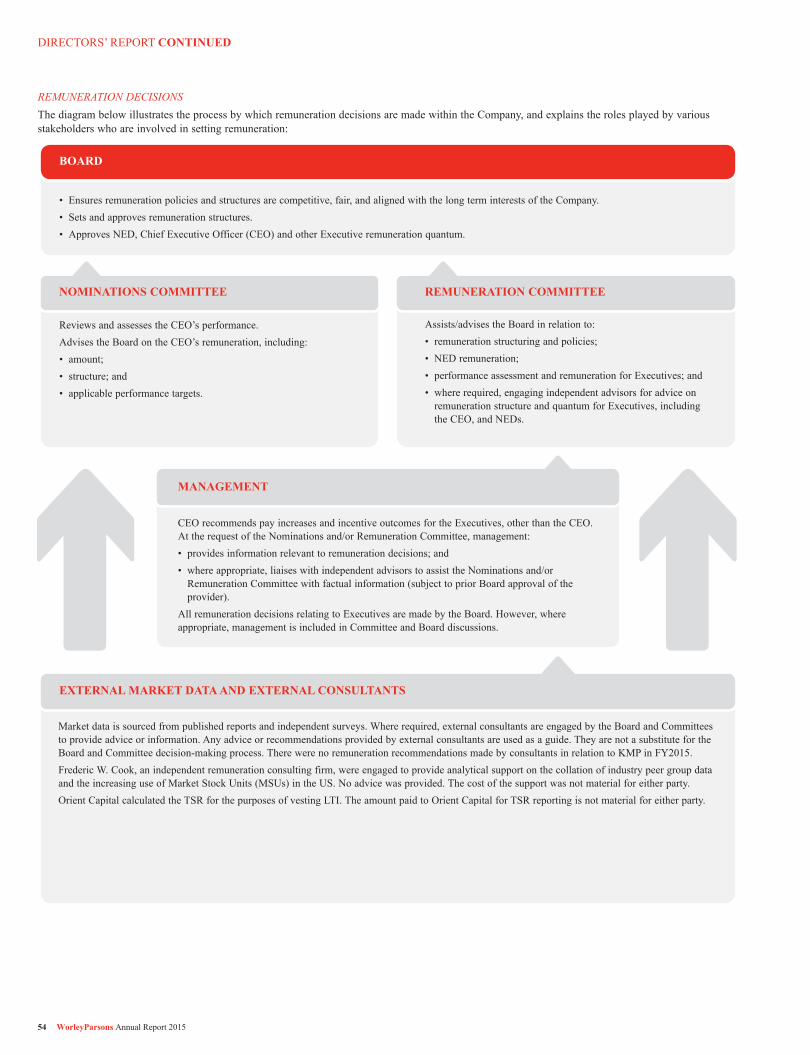
REMUNERATION DECISIONSThe diagram below illustrates the process by which remuneration decisions are made within the Company, and explains the roles played by various stakeholders who are involved in setting remuneration:
BOARD
EXTERNAL MARKET DATA AND EXTERNAL CONSULTANTS
MANAGEMENT
• Ensuresremunerationpoliciesandstructuresarecompetitive,fair,andalignedwiththelongterminterestsoftheCompany.• Setsandapprovesremunerationstructures.• ApprovesNED,ChiefExecutiveOfficer(CEO)andotherExecutiveremunerationquantum.
Reviews and assesses the CEO’s performance.Advises the Board on the CEO’s remuneration, including:• amount;• structure;and• applicableperformancetargets.
Assists/advises the Board in relation to:• remunerationstructuringandpolicies;• NEDremuneration;• performanceassessmentandremunerationforExecutives;and• whererequired,engagingindependentadvisorsforadviceon
remuneration structure and quantum for Executives, including the CEO, and NEDs.
CEO recommends pay increases and incentive outcomes for the Executives, other than the CEO. At the request of the Nominations and/or Remuneration Committee, management:• providesinformationrelevanttoremunerationdecisions;and• whereappropriate,liaiseswithindependentadvisorstoassisttheNominationsand/or
Remuneration Committee with factual information (subject to prior Board approval of the provider).
All remuneration decisions relating to Executives are made by the Board. However, where appropriate, management is included in Committee and Board discussions.
NOMINATIONS COMMITTEE
Market data is sourced from published reports and independent surveys. Where required, external consultants are engaged by the Board and Committees to provide advice or information. Any advice or recommendations provided by external consultants are used as a guide. They are not a substitute for the BoardandCommitteedecision‑makingprocess.TherewerenoremunerationrecommendationsmadebyconsultantsinrelationtoKMPinFY2015.Frederic W. Cook, an independent remuneration consulting firm, were engaged to provide analytical support on the collation of industry peer group data and the increasing use of Market Stock Units (MSUs) in the US. No advice was provided. The cost of the support was not material for either party.Orient Capital calculated the TSR for the purposes of vesting LTI. The amount paid to Orient Capital for TSR reporting is not material for either party.
REMUNERATION COMMITTEE
WorleyParsons Annual Report 2015 55
3. EXECUTIVE REMUNERATION IN DETAILEXECUTIVESSet out below is a list of the Executives of the Company whose remuneration details are outlined in this Remuneration Report. Except where noted, theseExecutiveswereemployedforallofFY2015inthepositionsnotedbelow.Theuseoftheterm“Executives”throughoutthisreportreferstotheExecutiveslisted.TheseExecutives,inadditiontotheNEDslistedonpage65oftheAnnualReport,comprisedtheKMPoftheCompanyforFY2015,as defined under the accounting standards.NAME POSITION COUNTRY OF RESIDENCE KMP DURATION
Andrew Wood Chief Executive Officer AustraliaFilippo Abba Group Managing Director – Improve United Kingdom 1 April 2015 (commenced)Simon Holt Chief Financial Officer AustraliaChristopher Parker Group Managing Director – Major Projects United States 30 June 2015 (ceased)David Steele Group Managing Director – Services AustraliaRandy Karren1 Group Managing Director – Improve Canada 31 March 2015 (ceased)Ian Wilkinson Group Managing Director – Services Australia 6 February 2015 (ceased)
1 Mr Karren retired effective 31 March 2015 and ceased to be an Executive on that date.
With the creation of Advisian Mr Finn becomes a KMP from 1 July 2015. Mr Parker ceased to be an Executive effective 30 June 2015. Mr Abba is Group Managing Director – Major Projects and Improve from 1 July 2015.
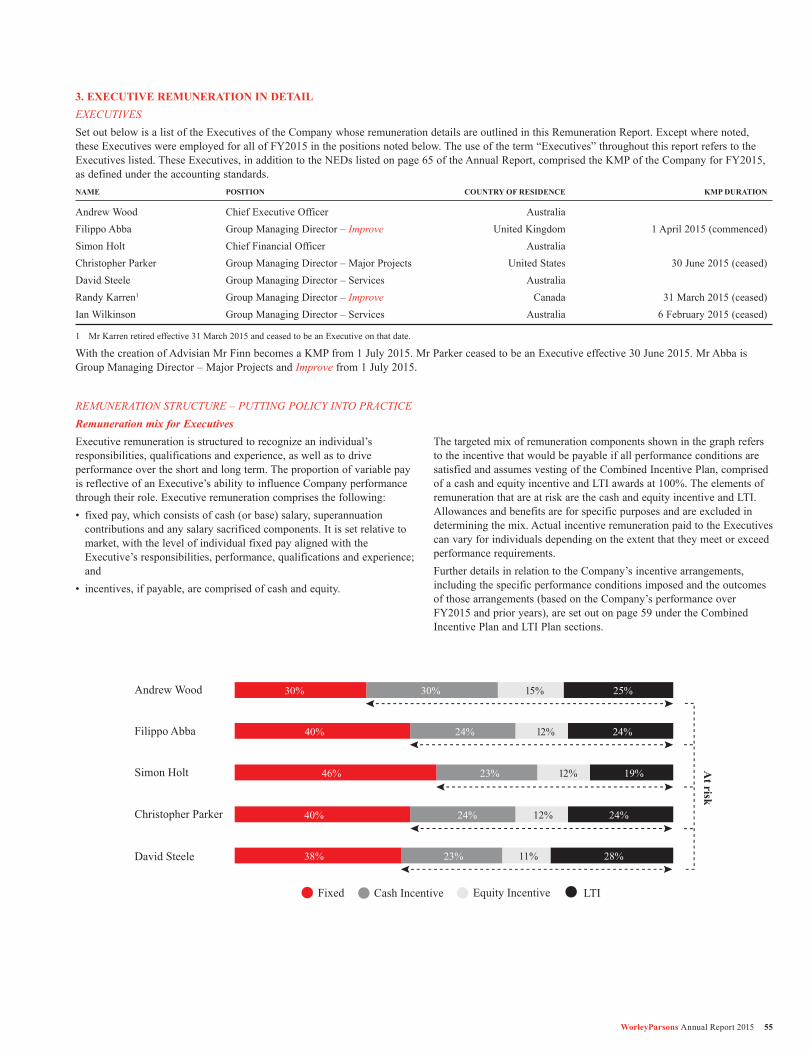
REMUNERATION STRUCTURE – PUTTING POLICY INTO PRACTICERemuneration mix for ExecutivesExecutive remuneration is structured to recognize an individual’s responsibilities, qualifications and experience, as well as to drive performance over the short and long term. The proportion of variable pay is reflective of an Executive’s ability to influence Company performance through their role. Executive remuneration comprises the following:• fixedpay,whichconsistsofcash(orbase)salary,superannuation
contributions and any salary sacrificed components. It is set relative to market, with the level of individual fixed pay aligned with the Executive’sresponsibilities,performance,qualificationsandexperience;and
• incentives,ifpayable,arecomprisedofcashandequity.
The targeted mix of remuneration components shown in the graph refers to the incentive that would be payable if all performance conditions are satisfied and assumes vesting of the Combined Incentive Plan, comprised of a cash and equity incentive and LTI awards at 100%. The elements of remuneration that are at risk are the cash and equity incentive and LTI. Allowances and benefits are for specific purposes and are excluded in determining the mix. Actual incentive remuneration paid to the Executives can vary for individuals depending on the extent that they meet or exceed performance requirements.Further details in relation to the Company’s incentive arrangements, including the specific performance conditions imposed and the outcomes of those arrangements (based on the Company’s performance over FY2015andprioryears),aresetoutonpage59undertheCombinedIncentive Plan and LTI Plan sections.
Fixed
At risk
Cash Incentive Equity Incentive LTI
David Steele 38% 23% 11% 28%
Christopher Parker 40% 24% 12% 24%
Simon Holt 46% 23% 12% 19%
Filippo Abba 40% 24% 12% 24%
Andrew Wood 30% 30% 15% 25%
56 WorleyParsons Annual Report 2015
Directors’ report CONTINUED
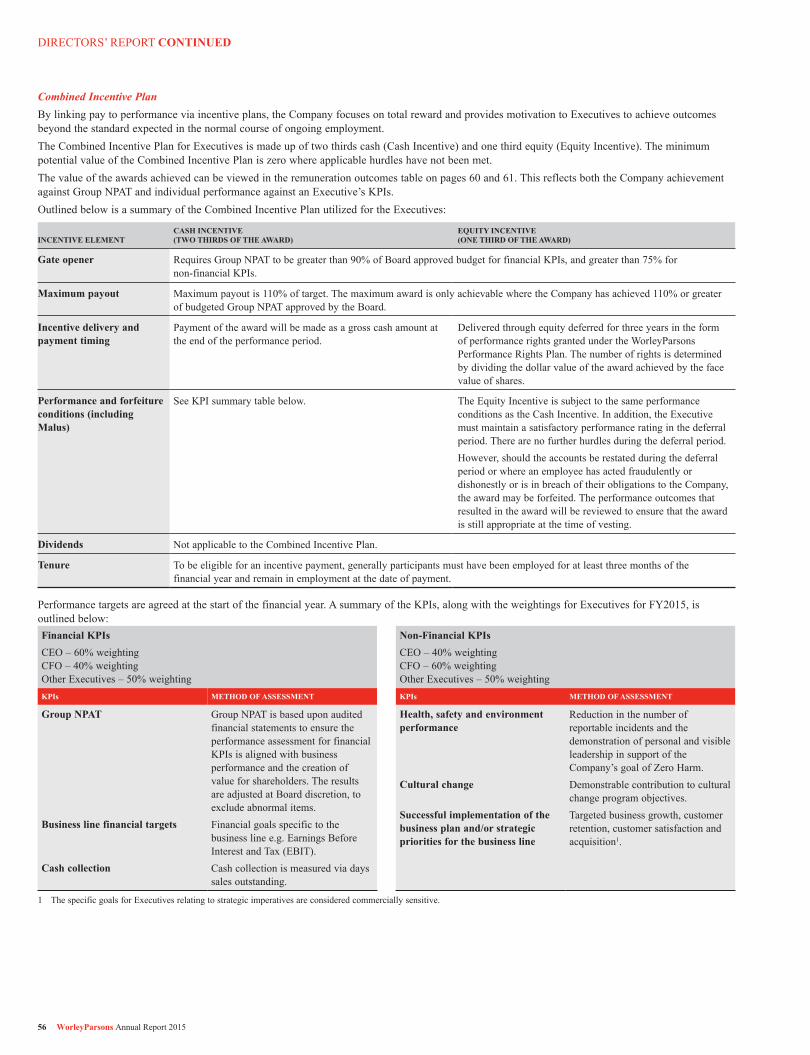
Combined Incentive PlanBy linking pay to performance via incentive plans, the Company focuses on total reward and provides motivation to Executives to achieve outcomes beyond the standard expected in the normal course of ongoing employment.The Combined Incentive Plan for Executives is made up of two thirds cash (Cash Incentive) and one third equity (Equity Incentive). The minimum potential value of the Combined Incentive Plan is zero where applicable hurdles have not been met.The value of the awards achieved can be viewed in the remuneration outcomes table on pages 60 and 61. This reflects both the Company achievement against Group NPAT and individual performance against an Executive’s KPIs.Outlined below is a summary of the Combined Incentive Plan utilized for the Executives:
INCENTIVE ELEMENTCASH INCENTIVE (TWO THIRDS OF THE AWARD)
EQUITY INCENTIVE (ONE THIRD OF THE AWARD)
Gate opener Requires Group NPAT to be greater than 90% of Board approved budget for financial KPIs, and greater than 75% for non‑financial KPIs.
Maximum payout Maximum payout is 110% of target. The maximum award is only achievable where the Company has achieved 110% or greater of budgeted Group NPAT approved by the Board.
Incentive delivery and payment timing
Payment of the award will be made as a gross cash amount at the end of the performance period.
Delivered through equity deferred for three years in the form of performance rights granted under the WorleyParsons Performance Rights Plan. The number of rights is determined by dividing the dollar value of the award achieved by the face value of shares.
Performance and forfeiture conditions (including Malus)
See KPI summary table below. The Equity Incentive is subject to the same performance conditions as the Cash Incentive. In addition, the Executive must maintain a satisfactory performance rating in the deferral period. There are no further hurdles during the deferral period.However, should the accounts be restated during the deferral period or where an employee has acted fraudulently or dishonestly or is in breach of their obligations to the Company, the award may be forfeited. The performance outcomes that resulted in the award will be reviewed to ensure that the award is still appropriate at the time of vesting.
Dividends Not applicable to the Combined Incentive Plan.
Tenure To be eligible for an incentive payment, generally participants must have been employed for at least three months of the financial year and remain in employment at the date of payment.
Performancetargetsareagreedatthestartofthefinancialyear.AsummaryoftheKPIs,alongwiththeweightingsforExecutivesforFY2015,isoutlined below:Financial KPIsCEO – 60% weighting CFO – 40% weighting Other Executives – 50% weighting
Non‑Financial KPIsCEO – 40% weighting CFO – 60% weighting Other Executives – 50% weighting
KPIs METHOD OF ASSESSMENT KPIs METHOD OF ASSESSMENT
Group NPAT
Business line financial targets
Cash collection
Group NPAT is based upon audited financial statements to ensure the performance assessment for financial KPIs is aligned with business performance and the creation of value for shareholders. The results are adjusted at Board discretion, to exclude abnormal items.Financial goals specific to the business line e.g. Earnings Before Interest and Tax (EBIT).Cash collection is measured via days sales outstanding.
Health, safety and environment performance
Cultural change
Successful implementation of the business plan and/or strategic priorities for the business line
Reduction in the number of reportable incidents and the demonstration of personal and visible leadership in support of the Company’s goal of Zero Harm.Demonstrable contribution to cultural change program objectives.Targeted business growth, customer retention, customer satisfaction and acquisition1.
1 The specific goals for Executives relating to strategic imperatives are considered commercially sensitive.
WorleyParsons Annual Report 2015 57
Long Term Incentive (LTI) PlanThe provision of LTI is assessed through two independent performance targets that align an Executive’s interests with shareholder returns while driving long term Company performance.The Board has determined that the number of securities issued to Executives and all other participants under the Company’s equity plans should be capped at 5% of the issued share capital of the Company over a five year time horizon. Currently, the number of securities issued and held pursuant to the equity plans represents 1.71% of the Company’s issued sharecapital(FY2014:1.97%).LTI grants for FY2015
LTI grants are delivered to Executives as rights that are issued under the WorleyParsons Performance Rights Plan. After vesting, each right entitles the holder to one fully paid ordinary share in the Company at a nil exercise price (i.e. a zero exercise price option). The number of rights issued is based on the Executive’s target LTI with reference to the underlying share price when the rights are issued. Rights vest and are automatically exercised (unless an Executive elects otherwise) after a four year period, subject to defined performance hurdles being satisfied.Where rights cannot be readily issued in certain overseas jurisdictions due to differing securities laws and taxation treatments, the LTI Plan rules ensure a participant can still be rewarded for their contribution, while catering for the local restrictions on the issue of securities. All current Executives are able to receive rights.Rights granted under the LTI Plan carry no voting or dividend entitlements. In addition, other than in relation to bonus issues and capital reorganizations (when the number of rights may be adjusted by the Board in accordance with the ASX Listing Rules, so as to ensure no advantage or disadvantage to the Executive), the rights carry no entitlement to participate in new share issues made by the Company.Details of the rights granted to Executives as the LTI component of their remunerationinFY2015areoutlinedonpages62and63.The target measures are as follows:• TSRrelativetopeergroup(whichappliesto50%ofpotentialLTIforFY2015);and
• EPSgrowth(whichappliesto50%ofpotentialLTIforFY2015).Relative Total Shareholder Return (TSR) performance hurdleThe TSR measure represents the change in the value of the Company’s share price over a period, including reinvested dividends, expressed as a percentage of the opening value of the shares.Relative TSR has been chosen as a performance hurdle because, in the opinion of the Board, it provides the most direct measure of shareholder return and reflects an investor’s choice to invest in this company or direct competitors.Executives will only derive value from the TSR component of the LTI Plan if the Company’s TSR performance is at least at the median of the companies in the peer comparison group over a four year period. Executives are no longer provided an opportunity to retest under the TSR measure.The vesting schedule of the rights subject to the relative TSR hurdle is as follows: PERCENTAGE OF RIGHTS THAT MAY BE EXERCISED IF THE RELATIVE TSR RELATIVE TSR PERCENTILE RANKING HURDLE IS MET
Less than 50th percentile 0%
At 50th percentile 25%
Greater than the 50th percentile Pro‑rated vesting between 25% but less than the 75th percentile and 50%
At 75th percentile or greater 50% (i.e. maximum available under the plan)
The peer comparison group comprises companies with similar business profiles, with which the Company competes for capital and executive talent.ForLTIgrantsmadesinceFY2013,thepeercomparisongroupcomprisesthe companies shown as follows:
AUSTRALIA AND ASIAUNITED STATES AND CANADA
EUROPE AND UNITED KINGDOM
CardnoCIMIC1
Downer EDIJGC CorporationMonadelphous GroupUGL
AECOM2
ChicagoBridge&IronCompanyFluor CorporationJacobs Engineering GroupKBRMcDermott InternationalSNC‑LavalinStantecTetra Tech
Aker SolutionsAMEC Foster Wheeler3
ArcadisAtkinsBalfour BeattyFugroSaipemSerco GroupTechnipTecnicas ReunidasWood Group
1 Formerly known as Leighton Holdings.2 Due to the merger of AECOM and URS Corporation on 17 October 2014, URS
Corporation is no longer listed in the above table.3 Due to the merger of AMEC and Foster Wheeler on 13 November 2014, Foster
Wheeler is no longer listed separately in the above table.
The Board has discretion to adjust the peer comparison group to take into account events including, but not limited to, takeovers or mergers that might occur during the performance period.Earnings Per Share (EPS) performance hurdleBasic EPS is determined by dividing the Group NPAT by the weighted average number of the Company’s ordinary shares on issue during the financial year. Growth in EPS will be measured by comparing the EPS in the financial year immediately preceding the issue and the EPS in the measurement year. EPS has been chosen as a performance hurdle because it provides a clear line of sight between Executive performance and Company performance. It is also a well‑recognized and understood measure of performance both within and outside the organization. The Group NPAT may be adjusted by the Board, where appropriate, to better reflect operating performance.Executives will only derive value from the EPS component of the grants madeinFY2015iftheCompanyachievesaveragecompoundgrowthinEPS of at least 4% per annum above the increase in the Consumer Price Index (CPI) over the four year performance period.The vesting schedule of the rights subject to the EPS hurdle is as follows:AVERAGE COMPOUND GROWTH IN EPS PERCENTAGE OF RIGHTS THAT MAY BE OVER THE PERFORMANCE PERIOD EXERCISED IF THE EPS HURDLE IS MET
Less than 4% p.a. above the 0% increase in CPI
4% p.a. above the increase in CPI 25%
More than 4% p.a. above the Pro‑rated vesting between 25% increase in CPI but less than and 50% 8% p.a. above the increase in CPI
8% p.a. or greater above the 50% (i.e. maximum available under increase in CPI the plan)
Exercise of rights and allocation of shares
To the extent that the performance hurdles have been satisfied, rights are automatically exercised (unless an Executive elects otherwise) and participants acquire shares in the Company at a nil exercise price.Shares allocated to participants upon exercise of rights rank equally with all other ordinary shares on issue. Participants will have unencumbered ownership of the shares, subject to compliance with the Company’s Securities Dealing Policy and minimum shareholding requirement.
58 WorleyParsons Annual Report 2015
Directors’ report CONTINUED
Executive minimum shareholding requirementThe Executive minimum shareholding requirement applies to Executives to reinforce the Company’s objective of aligning their interests with the interests of shareholders, and to foster an increased focus on building long term shareholder value.To satisfy the requirement, Executives must retain equity delivered via incentive plans until they hold shares equivalent in value to two times fixed pay (four times fixed pay for the CEO) and must subsequently maintain that multiple.Compliance with the requirement is assessed as at 30 June each year. The table below provides a summary of the position of each Executive against the requirement as at 30 June 2015: WEIGHTED VALUE OF PERCENTAGE NUMBER OF SHARES ANNUAL OF MINIMUM SHARES HELD AT FIXED PAY AT SHAREHOLDING HELD AT 30 JUNE 20152 30 JUNE 20153 REQUIREMENT 30 JUNE 20151 $ $ ACHIEVED
EXECUTIVE DIRECTORAndrew Wood 962,178 11,147,948 1,600,000 >100%GROUP EXECUTIVESFilippo Abba4 45,628 533,766 661,335 40%Simon Holt 21,362 361,736 550,000 33%Christopher Parker 17,793 304,316 607,471 25%David Steele 181,362 2,494,240 900,000 >100%
1 Includes shares held in the Company plus a 50% weighting of unvested performance rights provided on page 62.
2 Calculated as the weighted number of shares held at 30 June 2015 multiplied by the volume weighted average price of the Company’s shares for the five trading days up to and including 30 June 2015 ($10.414) or the price at which performance rights were allocated.
3 The Australian dollar equivalent of annual fixed pay as at 30 June 2015.4 Mr Abba commenced in the role as an Executive effective 1 April 2015.
In addition, under the Company’s Securities Dealing Policy, directors and Executives are not permitted to hedge unvested performance rights or shares that count towards an Executive’s minimum holding requirement. This ensures that Executives cannot “limit the risk” associated with these instruments and are subject to the same impacts from fluctuations in the share price as all other shareholders.Clawback (Malus) provisionThe Company maintains a Clawback provision within the Combined Incentive Plan and the LTI Plan.If in the Board’s opinion, an employee:• actsfraudulentlyordishonestly;• isinbreachoftheirobligationstotheCompanyoranotherGroupcompany;or
• receivedawardsbasedonfinancialaccountswhicharelaterrestated,theBoardmaydeterminethatunvestedperformancerightslapse;thisisalso known as a Malus provision. The Board may also deem any vested but unexercised performance rights to have lapsed. Additionally, the Board may seek to recover shares received from exercised rights.Cessation of employment and change of control
Where an Executive leaves the Group, the Board may exercise its discretion and allow a portion of any unvested rights to remain in the plan. Rights will subsequently vest and be exercised in the ordinary course, having regard to such factors as the Board determines relevant. Such factors would include performance against applicable performance hurdles, as well as the performance and contribution that the relevant Executive has made. Generally, the Board only exercise discretion in special circumstances, such as retirement.In the event of a change of control of the Company (e.g. where a third party unconditionally acquires more than 50% of the issued share capital of the Company), the Board will exercise its discretion to determine whether any or all unvested rights vest, having regard to pro‑rata performance against applicable performance hurdles up to the date of the change of control.
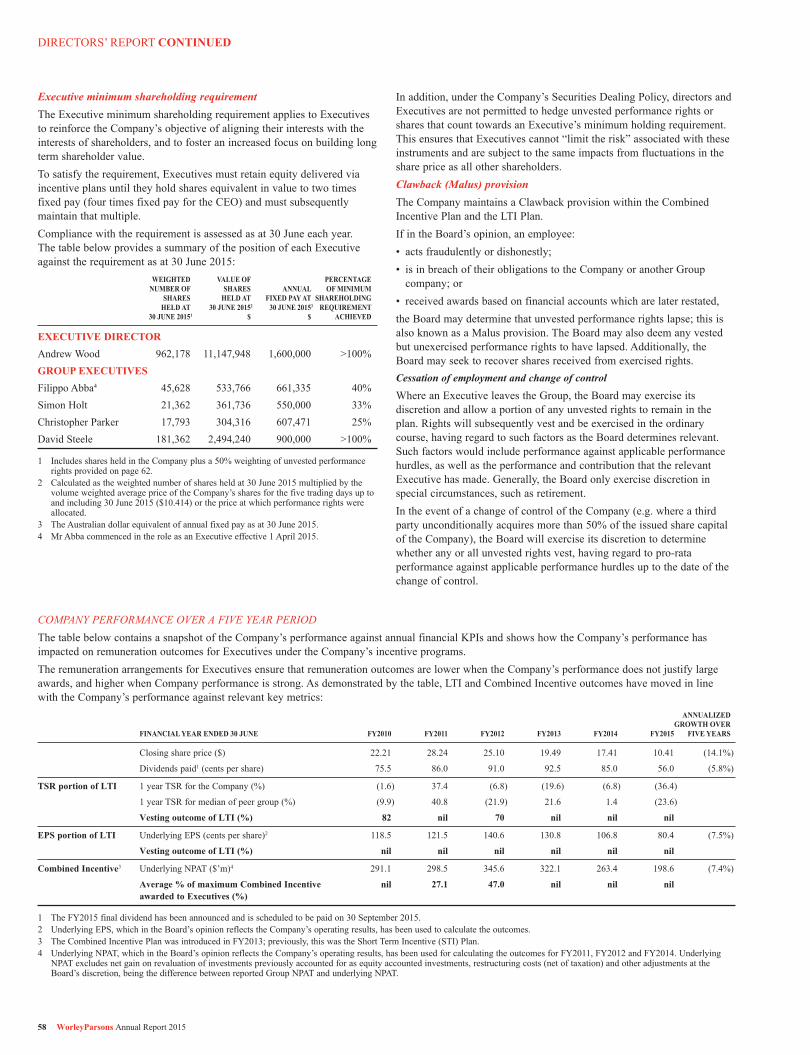
COMPANY PERFORMANCE OVER A FIVE YEAR PERIODThe table below contains a snapshot of the Company’s performance against annual financial KPIs and shows how the Company’s performance has impacted on remuneration outcomes for Executives under the Company’s incentive programs.The remuneration arrangements for Executives ensure that remuneration outcomes are lower when the Company’s performance does not justify large awards, and higher when Company performance is strong. As demonstrated by the table, LTI and Combined Incentive outcomes have moved in line with the Company’s performance against relevant key metrics: ANNUALIZED GROWTH OVER FINANCIAL YEAR ENDED 30 JUNE FY2010 FY2011 FY2012 FY2013 FY2014 FY2015 FIVE YEARS
Closing share price ($) 22.21 28.24 25.10 19.49 17.41 10.41 (14.1%)
Dividends paid1 (cents per share) 75.5 86.0 91.0 92.5 85.0 56.0 (5.8%)
TSR portion of LTI 1 year TSR for the Company (%) (1.6) 37.4 (6.8) (19.6) (6.8) (36.4)
1 year TSR for median of peer group (%) (9.9) 40.8 (21.9) 21.6 1.4 (23.6)
Vesting outcome of LTI (%) 82 nil 70 nil nil nil
EPS portion of LTI Underlying EPS (cents per share)2 118.5 121.5 140.6 130.8 106.8 80.4 (7.5%)
Vesting outcome of LTI (%) nil nil nil nil nil nil
Combined Incentive3 Underlying NPAT ($’m)4 291.1 298.5 345.6 322.1 263.4 198.6 (7.4%)
Average % of maximum Combined Incentive nil 27.1 47.0 nil nil nil awarded to Executives (%)
1 TheFY2015finaldividendhasbeenannouncedandisscheduledtobepaidon30September2015.2 Underlying EPS, which in the Board’s opinion reflects the Company’s operating results, has been used to calculate the outcomes.3 TheCombinedIncentivePlanwasintroducedinFY2013;previously,thiswastheShortTermIncentive(STI)Plan.4 UnderlyingNPAT,whichintheBoard’sopinionreflectstheCompany’soperatingresults,hasbeenusedforcalculatingtheoutcomesforFY2011,FY2012andFY2014.Underlying
NPAT excludes net gain on revaluation of investments previously accounted for as equity accounted investments, restructuring costs (net of taxation) and other adjustments at the Board’s discretion, being the difference between reported Group NPAT and underlying NPAT.
WorleyParsons Annual Report 2015 59
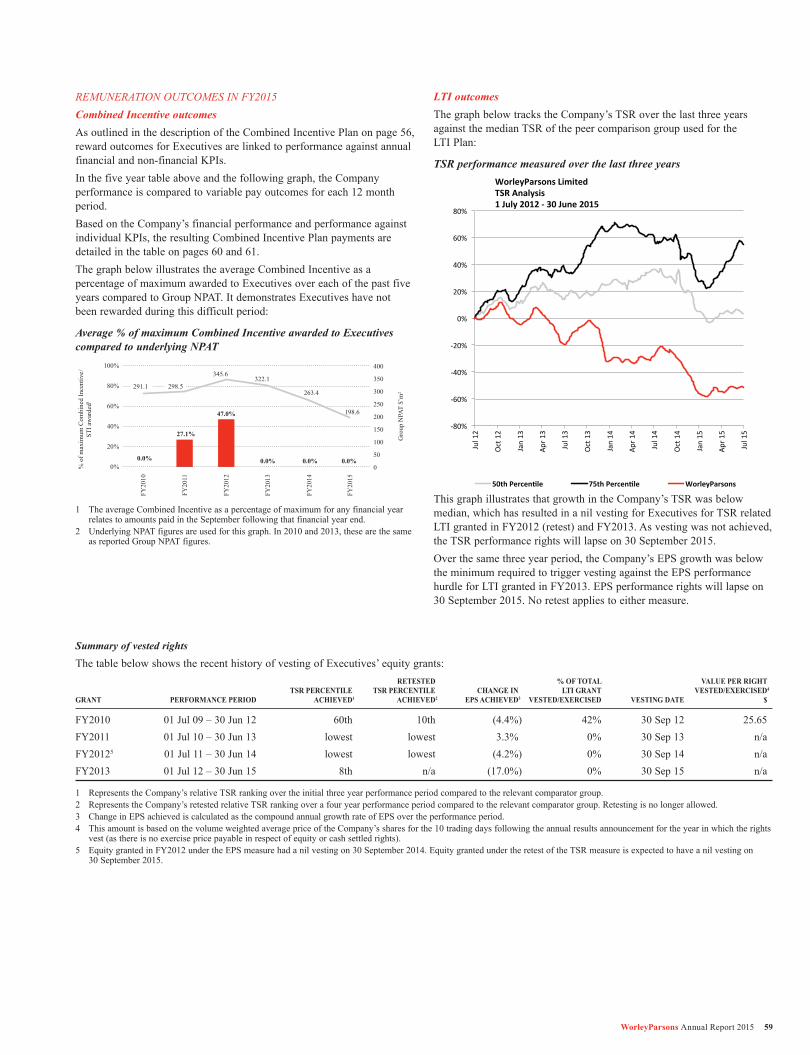
REMUNERATION OUTCOMES IN FY2015Combined Incentive outcomesAs outlined in the description of the Combined Incentive Plan on page 56, reward outcomes for Executives are linked to performance against annual financial and non‑financial KPIs.In the five year table above and the following graph, the Company performance is compared to variable pay outcomes for each 12 month period.Based on the Company’s financial performance and performance against individual KPIs, the resulting Combined Incentive Plan payments are detailed in the table on pages 60 and 61.The graph below illustrates the average Combined Incentive as a percentage of maximum awarded to Executives over each of the past five years compared to Group NPAT. It demonstrates Executives have not been rewarded during this difficult period:
Average % of maximum Combined Incentive awarded to Executives compared to underlying NPAT
Gro
up N
PAT
$’m
2
345.6 322.1
263.4
198.6
0.0%
27.1%
47.0%
0.0% 0.0% 0.0% 0
50
100
150
200
250
300
350
400
0%
20%
40%
60%
80%
100%
FY20
10
FY20
11
FY20
12
FY20
13
FY20
14
FY20
15
% o
f max
imum
Com
bine
d In
cent
ive/
STI a
war
ded1
298.5 291.1
1 The average Combined Incentive as a percentage of maximum for any financial year relates to amounts paid in the September following that financial year end.
2 Underlying NPAT figures are used for this graph. In 2010 and 2013, these are the same as reported Group NPAT figures.
LTI outcomesThe graph below tracks the Company’s TSR over the last three years against the median TSR of the peer comparison group used for the LTI Plan:
TSR performance measured over the last three years
-‐80%
-‐60%
-‐40%
-‐20%
0%
20%
40%
60%
80%
Jul 12
Oct 12
Jan 13
Apr 1
3
Jul 13
Oct 13
Jan 14
Apr 1
4
Jul 14
Oct 14
Jan 15
Apr 1
5
Jul 15
WorleyParsons Limited TSR Analysis 1 July 2012 -‐ 30 June 2015
50th Percen?le 75th Percen?le WorleyParsons
This graph illustrates that growth in the Company’s TSR was below median, which has resulted in a nil vesting for Executives for TSR related LTIgrantedinFY2012(retest)andFY2013.Asvestingwasnotachieved,the TSR performance rights will lapse on 30 September 2015.Over the same three year period, the Company’s EPS growth was below the minimum required to trigger vesting against the EPS performance hurdleforLTIgrantedinFY2013.EPSperformancerightswilllapseon30 September 2015. No retest applies to either measure.
Summary of vested rights
The table below shows the recent history of vesting of Executives’ equity grants: RETESTED % OF TOTAL VALUE PER RIGHT TSR PERCENTILE TSR PERCENTILE CHANGE IN LTI GRANT VESTED/EXERCISED4 GRANT PERFORMANCE PERIOD ACHIEVED1 ACHIEVED2 EPS ACHIEVED3 VESTED/EXERCISED VESTING DATE $
FY2010 01Jul09–30Jun12 60th 10th (4.4%) 42% 30Sep12 25.65FY2011 01Jul10–30Jun13 lowest lowest 3.3% 0% 30Sep13 n/aFY20125 01 Jul 11 – 30 Jun 14 lowest lowest (4.2%) 0% 30 Sep 14 n/aFY2013 01Jul12–30Jun15 8th n/a (17.0%) 0% 30Sep15 n/a
1 Represents the Company’s relative TSR ranking over the initial three year performance period compared to the relevant comparator group.2 Represents the Company’s retested relative TSR ranking over a four year performance period compared to the relevant comparator group. Retesting is no longer allowed.3 Change in EPS achieved is calculated as the compound annual growth rate of EPS over the performance period.4 This amount is based on the volume weighted average price of the Company’s shares for the 10 trading days following the annual results announcement for the year in which the rights
vest (as there is no exercise price payable in respect of equity or cash settled rights).5 EquitygrantedinFY2012undertheEPSmeasurehadanilvestingon30September2014.EquitygrantedundertheretestoftheTSRmeasureisexpectedtohaveanilvestingon
30 September 2015.
60 WorleyParsons Annual Report 2015
Directors’ report CONTINUED
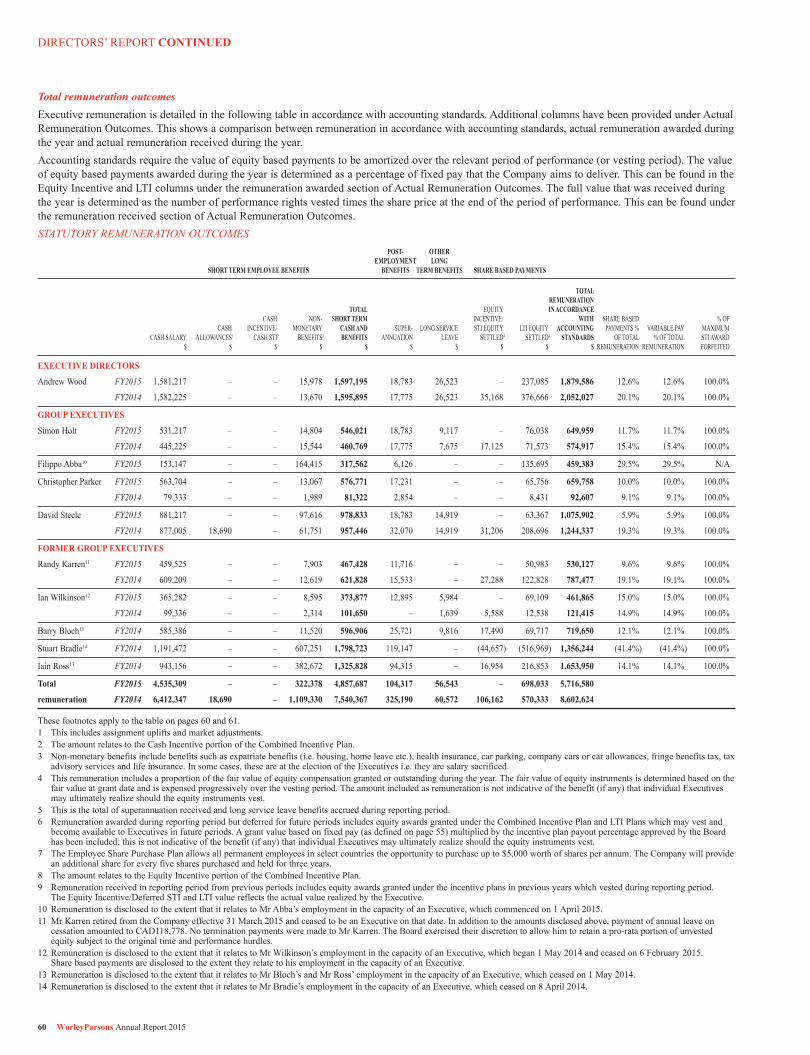
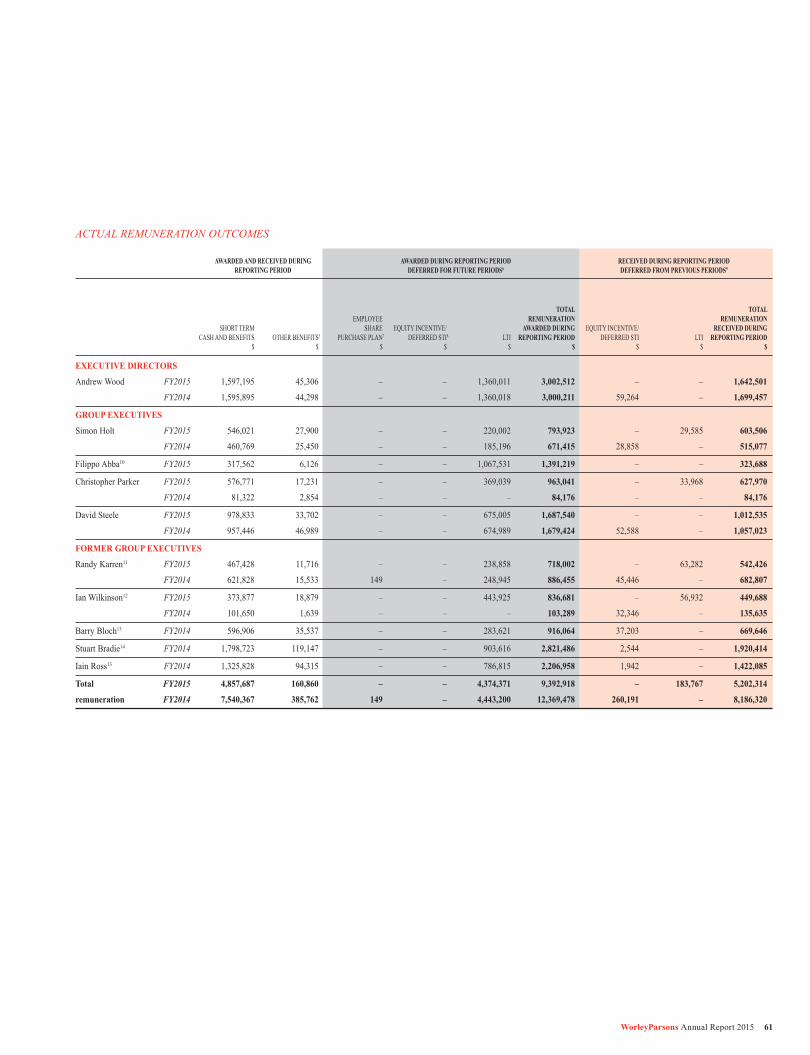
Total remuneration outcomesExecutive remuneration is detailed in the following table in accordance with accounting standards. Additional columns have been provided under Actual Remuneration Outcomes. This shows a comparison between remuneration in accordance with accounting standards, actual remuneration awarded during the year and actual remuneration received during the year.Accounting standards require the value of equity based payments to be amortized over the relevant period of performance (or vesting period). The value of equity based payments awarded during the year is determined as a percentage of fixed pay that the Company aims to deliver. This can be found in the Equity Incentive and LTI columns under the remuneration awarded section of Actual Remuneration Outcomes. The full value that was received during the year is determined as the number of performance rights vested times the share price at the end of the period of performance. This can be found under the remuneration received section of Actual Remuneration Outcomes.STATUTORY REMUNERATION OUTCOMES POST‑ OTHER EMPLOYMENT LONG SHORT TERM EMPLOYEE BENEFITS BENEFITS TERM BENEFITS SHARE BASED PAYMENTS
TOTAL REMUNERATION TOTAL EQUITY IN ACCORDANCE CASH NON‑ SHORT TERM INCENTIVE/ WITH SHARE BASED % OF CASH INCENTIVE/ MONETARY CASH AND SUPER‑ LONGSERVICE STIEQUITY LTIEQUITY ACCOUNTING PAYMENTS% VARIABLEPAY MAXIMUM CASHSALARY ALLOWANCES1 CASH STI2 BENEFITS3 BENEFITS ANNUATION LEAVE SETTLED4 SETTLED4 STANDARDS OF TOTAL % OF TOTAL STI AWARD $ $ $ $ $ $ $ $ $ $ REMUNERATION REMUNERATION FORFEITED
EXECUTIVE DIRECTORS
Andrew Wood FY2015 1,581,217 – – 15,978 1,597,195 18,783 26,523 – 237,085 1,879,586 12.6% 12.6% 100.0%
FY2014 1,582,225 – – 13,670 1,595,895 17,775 26,523 35,168 376,666 2,052,027 20.1% 20.1% 100.0%
GROUP EXECUTIVES
Simon Holt FY2015 531,217 – – 14,804 546,021 18,783 9,117 – 76,038 649,959 11.7% 11.7% 100.0%
FY2014 445,225 – – 15,544 460,769 17,775 7,675 17,125 71,573 574,917 15.4% 15.4% 100.0%
Filippo Abba10 FY2015 153,147 – – 164,415 317,562 6,126 – – 135,695 459,383 29.5% 29.5% N/A
Christopher Parker FY2015 563,704 – – 13,067 576,771 17,231 – – 65,756 659,758 10.0% 10.0% 100.0%
FY2014 79,333 – – 1,989 81,322 2,854 – – 8,431 92,607 9.1% 9.1% 100.0%
David Steele FY2015 881,217 – – 97,616 978,833 18,783 14,919 – 63,367 1,075,902 5.9% 5.9% 100.0%
FY2014 877,005 18,690 – 61,751 957,446 32,070 14,919 31,206 208,696 1,244,337 19.3% 19.3% 100.0%
FORMER GROUP EXECUTIVES
Randy Karren11 FY2015 459,525 – – 7,903 467,428 11,716 – – 50,983 530,127 9.6% 9.6% 100.0%
FY2014 609,209 – – 12,619 621,828 15,533 – 27,288 122,828 787,477 19.1% 19.1% 100.0%
Ian Wilkinson12 FY2015 365,282 – – 8,595 373,877 12,895 5,984 – 69,109 461,865 15.0% 15.0% 100.0%
FY2014 99,336 – – 2,314 101,650 – 1,639 5,588 12,538 121,415 14.9% 14.9% 100.0%
Barry Bloch13 FY2014 585,386 – – 11,520 596,906 25,721 9,816 17,490 69,717 719,650 12.1% 12.1% 100.0%
Stuart Bradie14 FY2014 1,191,472 – – 607,251 1,798,723 119,147 – (44,657) (516,969) 1,356,244 (41.4%) (41.4%) 100.0%
Iain Ross13 FY2014 943,156 – – 382,672 1,325,828 94,315 – 16,954 216,853 1,653,950 14.1% 14.1% 100.0%
Total FY2015 4,535,309 – – 322,378 4,857,687 104,317 56,543 – 698,033 5,716,580
remuneration FY2014 6,412,347 18,690 – 1,109,330 7,540,367 325,190 60,572 106,162 570,333 8,602,624
These footnotes apply to the table on pages 60 and 61.1 This includes assignment uplifts and market adjustments.2 The amount relates to the Cash Incentive portion of the Combined Incentive Plan.3 Non‑monetary benefits include benefits such as expatriate benefits (i.e. housing, home leave etc.), health insurance, car parking, company cars or car allowances, fringe benefits tax, tax
advisory services and life insurance. In some cases, these are at the election of the Executives i.e. they are salary sacrificed.4 This remuneration includes a proportion of the fair value of equity compensation granted or outstanding during the year. The fair value of equity instruments is determined based on the
fair value at grant date and is expensed progressively over the vesting period. The amount included as remuneration is not indicative of the benefit (if any) that individual Executives may ultimately realize should the equity instruments vest.
5 This is the total of superannuation received and long service leave benefits accrued during reporting period.6 Remuneration awarded during reporting period but deferred for future periods includes equity awards granted under the Combined Incentive Plan and LTI Plans which may vest and
become available to Executives in future periods. A grant value based on fixed pay (as defined on page 55) multiplied by the incentive plan payout percentage approved by the Board hasbeenincluded;thisisnotindicativeofthebenefit(ifany)thatindividualExecutivesmayultimatelyrealizeshouldtheequityinstrumentsvest.
7 The Employee Share Purchase Plan allows all permanent employees in select countries the opportunity to purchase up to $5,000 worth of shares per annum. The Company will provide an additional share for every five shares purchased and held for three years.
8 The amount relates to the Equity Incentive portion of the Combined Incentive Plan.9 Remuneration received in reporting period from previous periods includes equity awards granted under the incentive plans in previous years which vested during reporting period.
The Equity Incentive/Deferred STI and LTI value reflects the actual value realized by the Executive.10 Remuneration is disclosed to the extent that it relates to Mr Abba’s employment in the capacity of an Executive, which commenced on 1 April 2015.11 Mr Karren retired from the Company effective 31 March 2015 and ceased to be an Executive on that date. In addition to the amounts disclosed above, payment of annual leave on
cessation amounted to CAD118,778. No termination payments were made to Mr Karren. The Board exercised their discretion to allow him to retain a pro‑rata portion of unvested equity subject to the original time and performance hurdles.
12 Remuneration is disclosed to the extent that it relates to Mr Wilkinson’s employment in the capacity of an Executive, which began 1 May 2014 and ceased on 6 February 2015. Share based payments are disclosed to the extent they relate to his employment in the capacity of an Executive.
13 Remuneration is disclosed to the extent that it relates to Mr Bloch’s and Mr Ross’ employment in the capacity of an Executive, which ceased on 1 May 2014.14 Remuneration is disclosed to the extent that it relates to Mr Bradie’s employment in the capacity of an Executive, which ceased on 8 April 2014.
WorleyParsons Annual Report 2015 61
ACTUAL REMUNERATION OUTCOMES AWARDED AND RECEIVED DURING AWARDED DURING REPORTING PERIOD RECEIVED DURING REPORTING PERIOD REPORTING PERIOD DEFERRED FOR FUTURE PERIODS6 DEFERRED FROM PREVIOUS PERIODS9
TOTAL TOTAL EMPLOYEE REMUNERATION REMUNERATION SHORT TERM SHARE EQUITYINCENTIVE/ AWARDED DURING EQUITYINCENTIVE/ RECEIVED DURING CASH AND BENEFITS OTHER BENEFITS5 PURCHASE PLAN7 DEFERRED STI8 LTI REPORTING PERIOD DEFERRED STI LTI REPORTING PERIOD $ $ $ $ $ $ $ $ $
EXECUTIVE DIRECTORS
Andrew Wood FY2015 1,597,195 45,306 – – 1,360,011 3,002,512 – – 1,642,501
FY2014 1,595,895 44,298 – – 1,360,018 3,000,211 59,264 – 1,699,457
GROUP EXECUTIVES
Simon Holt FY2015 546,021 27,900 – – 220,002 793,923 – 29,585 603,506
FY2014 460,769 25,450 – – 185,196 671,415 28,858 – 515,077
Filippo Abba10 FY2015 317,562 6,126 – – 1,067,531 1,391,219 – – 323,688
Christopher Parker FY2015 576,771 17,231 – – 369,039 963,041 – 33,968 627,970
FY2014 81,322 2,854 – – – 84,176 – – 84,176
David Steele FY2015 978,833 33,702 – – 675,005 1,687,540 – – 1,012,535
FY2014 957,446 46,989 – – 674,989 1,679,424 52,588 – 1,057,023
FORMER GROUP EXECUTIVES
Randy Karren11 FY2015 467,428 11,716 – – 238,858 718,002 – 63,282 542,426
FY2014 621,828 15,533 149 – 248,945 886,455 45,446 – 682,807
Ian Wilkinson12 FY2015 373,877 18,879 – – 443,925 836,681 – 56,932 449,688
FY2014 101,650 1,639 – – – 103,289 32,346 – 135,635
Barry Bloch13 FY2014 596,906 35,537 – – 283,621 916,064 37,203 – 669,646
Stuart Bradie14 FY2014 1,798,723 119,147 – – 903,616 2,821,486 2,544 – 1,920,414
Iain Ross13 FY2014 1,325,828 94,315 – – 786,815 2,206,958 1,942 – 1,422,085
Total FY2015 4,857,687 160,860 – – 4,374,371 9,392,918 – 183,767 5,202,314
remuneration FY2014 7,540,367 385,762 149 – 4,443,200 12,369,478 260,191 – 8,186,320
62 WorleyParsons Annual Report 2015
Directors’ report CONTINUED
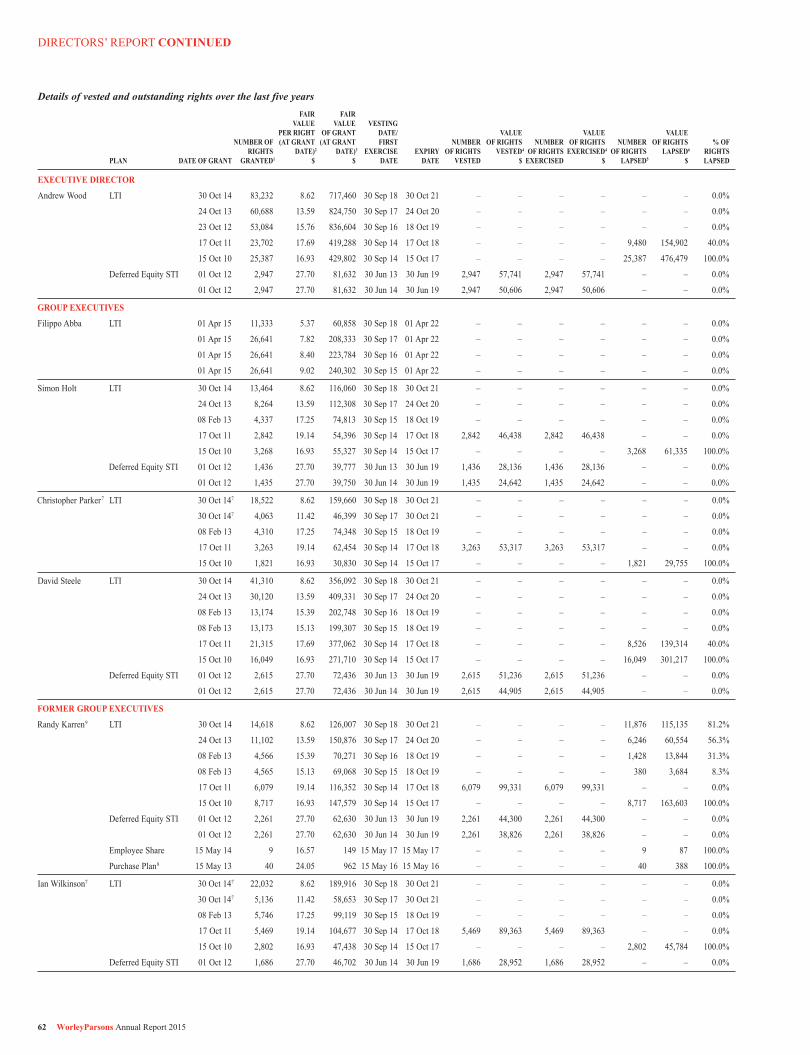
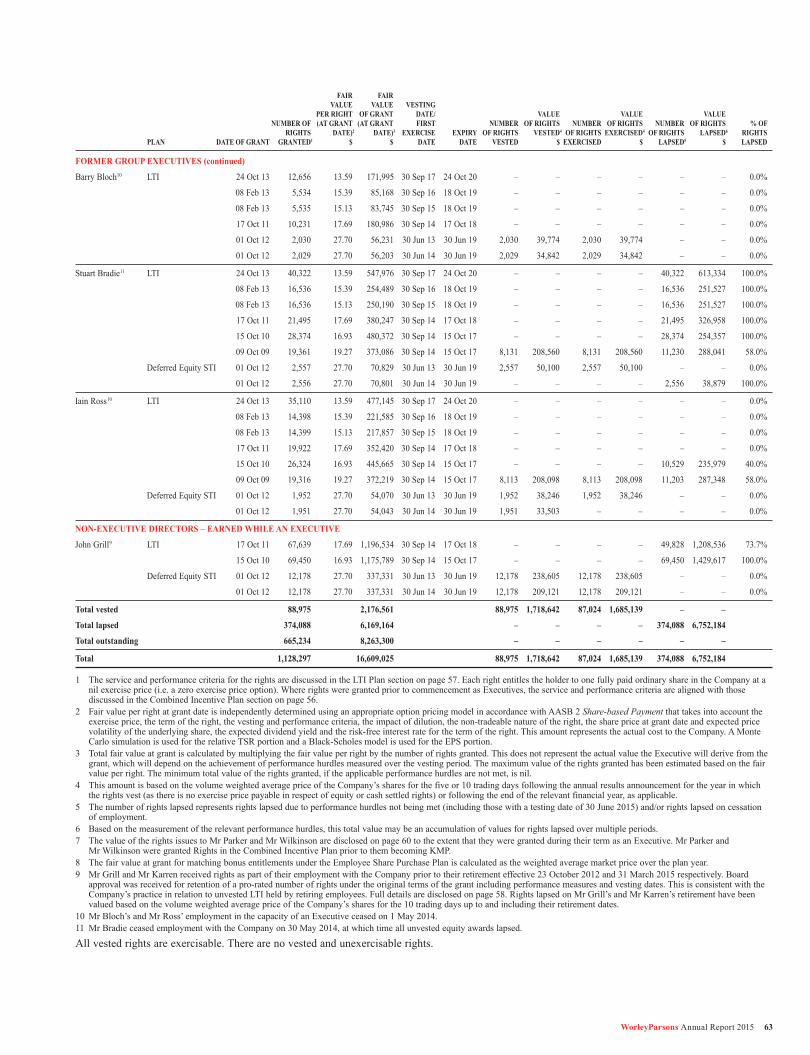
Details of vested and outstanding rights over the last five years FAIR FAIR VALUE VALUE VESTING PER RIGHT OF GRANT DATE/ VALUE VALUE VALUE NUMBER OF (AT GRANT (AT GRANT FIRST NUMBER OF RIGHTS NUMBER OF RIGHTS NUMBER OF RIGHTS % OF RIGHTS DATE)2 DATE)3 EXERCISE EXPIRY OF RIGHTS VESTED4 OF RIGHTS EXERCISED4 OF RIGHTS LAPSED6 RIGHTS PLAN DATE OF GRANT GRANTED1 $ $ DATE DATE VESTED $ EXERCISED $ LAPSED5 $ LAPSED
EXECUTIVE DIRECTOR
Andrew Wood LTI 30 Oct 14 83,232 8.62 717,460 30 Sep 18 30 Oct 21 – – – – – – 0.0%
24 Oct 13 60,688 13.59 824,750 30 Sep 17 24 Oct 20 – – – – – – 0.0%
23 Oct 12 53,084 15.76 836,604 30 Sep 16 18 Oct 19 – – – – – – 0.0%
17 Oct 11 23,702 17.69 419,288 30 Sep 14 17 Oct 18 – – – – 9,480 154,902 40.0%
15 Oct 10 25,387 16.93 429,802 30 Sep 14 15 Oct 17 – – – – 25,387 476,479 100.0%
Deferred Equity STI 01 Oct 12 2,947 27.70 81,632 30 Jun 13 30 Jun 19 2,947 57,741 2,947 57,741 – – 0.0%
01 Oct 12 2,947 27.70 81,632 30 Jun 14 30 Jun 19 2,947 50,606 2,947 50,606 – – 0.0%
GROUP EXECUTIVES
Filippo Abba LTI 01 Apr 15 11,333 5.37 60,858 30 Sep 18 01 Apr 22 – – – – – – 0.0%
01 Apr 15 26,641 7.82 208,333 30 Sep 17 01 Apr 22 – – – – – – 0.0%
01 Apr 15 26,641 8.40 223,784 30 Sep 16 01 Apr 22 – – – – – – 0.0%
01 Apr 15 26,641 9.02 240,302 30 Sep 15 01 Apr 22 – – – – – – 0.0%
Simon Holt LTI 30 Oct 14 13,464 8.62 116,060 30 Sep 18 30 Oct 21 – – – – – – 0.0%
24 Oct 13 8,264 13.59 112,308 30 Sep 17 24 Oct 20 – – – – – – 0.0%
08 Feb 13 4,337 17.25 74,813 30 Sep 15 18 Oct 19 – – – – – – 0.0%
17 Oct 11 2,842 19.14 54,396 30 Sep 14 17 Oct 18 2,842 46,438 2,842 46,438 – – 0.0%
15 Oct 10 3,268 16.93 55,327 30 Sep 14 15 Oct 17 – – – – 3,268 61,335 100.0%
Deferred Equity STI 01 Oct 12 1,436 27.70 39,777 30 Jun 13 30 Jun 19 1,436 28,136 1,436 28,136 – – 0.0%
01 Oct 12 1,435 27.70 39,750 30 Jun 14 30 Jun 19 1,435 24,642 1,435 24,642 – – 0.0%
Christopher Parker7 LTI 30 Oct 147 18,522 8.62 159,660 30 Sep 18 30 Oct 21 – – – – – – 0.0%
30 Oct 147 4,063 11.42 46,399 30 Sep 17 30 Oct 21 – – – – – – 0.0%
08 Feb 13 4,310 17.25 74,348 30 Sep 15 18 Oct 19 – – – – – – 0.0%
17 Oct 11 3,263 19.14 62,454 30 Sep 14 17 Oct 18 3,263 53,317 3,263 53,317 – – 0.0%
15 Oct 10 1,821 16.93 30,830 30 Sep 14 15 Oct 17 – – – – 1,821 29,755 100.0%
David Steele LTI 30 Oct 14 41,310 8.62 356,092 30 Sep 18 30 Oct 21 – – – – – – 0.0%
24 Oct 13 30,120 13.59 409,331 30 Sep 17 24 Oct 20 – – – – – – 0.0%
08 Feb 13 13,174 15.39 202,748 30 Sep 16 18 Oct 19 – – – – – – 0.0%
08 Feb 13 13,173 15.13 199,307 30 Sep 15 18 Oct 19 – – – – – – 0.0%
17 Oct 11 21,315 17.69 377,062 30 Sep 14 17 Oct 18 – – – – 8,526 139,314 40.0%
15 Oct 10 16,049 16.93 271,710 30 Sep 14 15 Oct 17 – – – – 16,049 301,217 100.0%
Deferred Equity STI 01 Oct 12 2,615 27.70 72,436 30 Jun 13 30 Jun 19 2,615 51,236 2,615 51,236 – – 0.0%
01 Oct 12 2,615 27.70 72,436 30 Jun 14 30 Jun 19 2,615 44,905 2,615 44,905 – – 0.0%
FORMER GROUP EXECUTIVES
Randy Karren9 LTI 30 Oct 14 14,618 8.62 126,007 30 Sep 18 30 Oct 21 – – – – 11,876 115,135 81.2%
24 Oct 13 11,102 13.59 150,876 30 Sep 17 24 Oct 20 – – – – 6,246 60,554 56.3%
08 Feb 13 4,566 15.39 70,271 30 Sep 16 18 Oct 19 – – – – 1,428 13,844 31.3%
08 Feb 13 4,565 15.13 69,068 30 Sep 15 18 Oct 19 – – – – 380 3,684 8.3%
17 Oct 11 6,079 19.14 116,352 30 Sep 14 17 Oct 18 6,079 99,331 6,079 99,331 – – 0.0%
15 Oct 10 8,717 16.93 147,579 30 Sep 14 15 Oct 17 – – – – 8,717 163,603 100.0%
Deferred Equity STI 01 Oct 12 2,261 27.70 62,630 30 Jun 13 30 Jun 19 2,261 44,300 2,261 44,300 – – 0.0%
01 Oct 12 2,261 27.70 62,630 30 Jun 14 30 Jun 19 2,261 38,826 2,261 38,826 – – 0.0%
Employee Share 15 May 14 9 16.57 149 15 May 17 15 May 17 – – – – 9 87 100.0%
Purchase Plan8 15 May 13 40 24.05 962 15 May 16 15 May 16 – – – – 40 388 100.0%
Ian Wilkinson7 LTI 30 Oct 147 22,032 8.62 189,916 30 Sep 18 30 Oct 21 – – – – – – 0.0%
30 Oct 147 5,136 11.42 58,653 30 Sep 17 30 Oct 21 – – – – – – 0.0%
08 Feb 13 5,746 17.25 99,119 30 Sep 15 18 Oct 19 – – – – – – 0.0%
17 Oct 11 5,469 19.14 104,677 30 Sep 14 17 Oct 18 5,469 89,363 5,469 89,363 – – 0.0%
15 Oct 10 2,802 16.93 47,438 30 Sep 14 15 Oct 17 – – – – 2,802 45,784 100.0%
Deferred Equity STI 01 Oct 12 1,686 27.70 46,702 30 Jun 14 30 Jun 19 1,686 28,952 1,686 28,952 – – 0.0%
WorleyParsons Annual Report 2015 63
FAIR FAIR VALUE VALUE VESTING PER RIGHT OF GRANT DATE/ VALUE VALUE VALUE NUMBER OF (AT GRANT (AT GRANT FIRST NUMBER OF RIGHTS NUMBER OF RIGHTS NUMBER OF RIGHTS % OF RIGHTS DATE)2 DATE)3 EXERCISE EXPIRY OF RIGHTS VESTED4 OF RIGHTS EXERCISED4 OF RIGHTS LAPSED6 RIGHTS PLAN DATE OF GRANT GRANTED1 $ $ DATE DATE VESTED $ EXERCISED $ LAPSED5 $ LAPSED
FORMER GROUP EXECUTIVES (continued)
Barry Bloch10 LTI 24 Oct 13 12,656 13.59 171,995 30 Sep 17 24 Oct 20 – – – – – – 0.0%
08 Feb 13 5,534 15.39 85,168 30 Sep 16 18 Oct 19 – – – – – – 0.0%
08 Feb 13 5,535 15.13 83,745 30 Sep 15 18 Oct 19 – – – – – – 0.0%
17 Oct 11 10,231 17.69 180,986 30 Sep 14 17 Oct 18 – – – – – – 0.0%
01 Oct 12 2,030 27.70 56,231 30 Jun 13 30 Jun 19 2,030 39,774 2,030 39,774 – – 0.0%
01 Oct 12 2,029 27.70 56,203 30 Jun 14 30 Jun 19 2,029 34,842 2,029 34,842 – – 0.0%
Stuart Bradie11 LTI 24 Oct 13 40,322 13.59 547,976 30 Sep 17 24 Oct 20 – – – – 40,322 613,334 100.0%
08 Feb 13 16,536 15.39 254,489 30 Sep 16 18 Oct 19 – – – – 16,536 251,527 100.0%
08 Feb 13 16,536 15.13 250,190 30 Sep 15 18 Oct 19 – – – – 16,536 251,527 100.0%
17 Oct 11 21,495 17.69 380,247 30 Sep 14 17 Oct 18 – – – – 21,495 326,958 100.0%
15 Oct 10 28,374 16.93 480,372 30 Sep 14 15 Oct 17 – – – – 28,374 254,357 100.0%
09 Oct 09 19,361 19.27 373,086 30 Sep 14 15 Oct 17 8,131 208,560 8,131 208,560 11,230 288,041 58.0%
Deferred Equity STI 01 Oct 12 2,557 27.70 70,829 30 Jun 13 30 Jun 19 2,557 50,100 2,557 50,100 – – 0.0%
01 Oct 12 2,556 27.70 70,801 30 Jun 14 30 Jun 19 – – – – 2,556 38,879 100.0%
Iain Ross10 LTI 24 Oct 13 35,110 13.59 477,145 30 Sep 17 24 Oct 20 – – – – – – 0.0%
08 Feb 13 14,398 15.39 221,585 30 Sep 16 18 Oct 19 – – – – – – 0.0%
08 Feb 13 14,399 15.13 217,857 30 Sep 15 18 Oct 19 – – – – – – 0.0%
17 Oct 11 19,922 17.69 352,420 30 Sep 14 17 Oct 18 – – – – – – 0.0%
15 Oct 10 26,324 16.93 445,665 30 Sep 14 15 Oct 17 – – – – 10,529 235,979 40.0%
09 Oct 09 19,316 19.27 372,219 30 Sep 14 15 Oct 17 8,113 208,098 8,113 208,098 11,203 287,348 58.0%
Deferred Equity STI 01 Oct 12 1,952 27.70 54,070 30 Jun 13 30 Jun 19 1,952 38,246 1,952 38,246 – – 0.0%
01 Oct 12 1,951 27.70 54,043 30 Jun 14 30 Jun 19 1,951 33,503 – – – – 0.0%
NON‑EXECUTIVE DIRECTORS – EARNED WHILE AN EXECUTIVE
John Grill9 LTI 17 Oct 11 67,639 17.69 1,196,534 30 Sep 14 17 Oct 18 – – – – 49,828 1,208,536 73.7%
15 Oct 10 69,450 16.93 1,175,789 30 Sep 14 15 Oct 17 – – – – 69,450 1,429,617 100.0%
Deferred Equity STI 01 Oct 12 12,178 27.70 337,331 30 Jun 13 30 Jun 19 12,178 238,605 12,178 238,605 – – 0.0%
01 Oct 12 12,178 27.70 337,331 30 Jun 14 30 Jun 19 12,178 209,121 12,178 209,121 – – 0.0%
Total vested 88,975 2,176,561 88,975 1,718,642 87,024 1,685,139 – –
Total lapsed 374,088 6,169,164 – – – – 374,088 6,752,184
Total outstanding 665,234 8,263,300 – – – – – –
Total 1,128,297 16,609,025 88,975 1,718,642 87,024 1,685,139 374,088 6,752,184
1 The service and performance criteria for the rights are discussed in the LTI Plan section on page 57. Each right entitles the holder to one fully paid ordinary share in the Company at a nil exercise price (i.e. a zero exercise price option). Where rights were granted prior to commencement as Executives, the service and performance criteria are aligned with those discussed in the Combined Incentive Plan section on page 56.
2 Fair value per right at grant date is independently determined using an appropriate option pricing model in accordance with AASB 2 Share‑based Payment that takes into account the exercise price, the term of the right, the vesting and performance criteria, the impact of dilution, the non‑tradeable nature of the right, the share price at grant date and expected price volatility of the underlying share, the expected dividend yield and the risk‑free interest rate for the term of the right. This amount represents the actual cost to the Company. A Monte Carlo simulation is used for the relative TSR portion and a Black‑Scholes model is used for the EPS portion.
3 Total fair value at grant is calculated by multiplying the fair value per right by the number of rights granted. This does not represent the actual value the Executive will derive from the grant, which will depend on the achievement of performance hurdles measured over the vesting period. The maximum value of the rights granted has been estimated based on the fair value per right. The minimum total value of the rights granted, if the applicable performance hurdles are not met, is nil.
4 This amount is based on the volume weighted average price of the Company’s shares for the five or 10 trading days following the annual results announcement for the year in which the rights vest (as there is no exercise price payable in respect of equity or cash settled rights) or following the end of the relevant financial year, as applicable.
5 The number of rights lapsed represents rights lapsed due to performance hurdles not being met (including those with a testing date of 30 June 2015) and/or rights lapsed on cessation of employment.
6 Based on the measurement of the relevant performance hurdles, this total value may be an accumulation of values for rights lapsed over multiple periods.7 The value of the rights issues to Mr Parker and Mr Wilkinson are disclosed on page 60 to the extent that they were granted during their term as an Executive. Mr Parker and
Mr Wilkinson were granted Rights in the Combined Incentive Plan prior to them becoming KMP.8 The fair value at grant for matching bonus entitlements under the Employee Share Purchase Plan is calculated as the weighted average market price over the plan year.9 Mr Grill and Mr Karren received rights as part of their employment with the Company prior to their retirement effective 23 October 2012 and 31 March 2015 respectively. Board
approval was received for retention of a pro‑rated number of rights under the original terms of the grant including performance measures and vesting dates. This is consistent with the Company’s practice in relation to unvested LTI held by retiring employees. Full details are disclosed on page 58. Rights lapsed on Mr Grill’s and Mr Karren’s retirement have been valued based on the volume weighted average price of the Company’s shares for the 10 trading days up to and including their retirement dates.
10 Mr Bloch’s and Mr Ross’ employment in the capacity of an Executive ceased on 1 May 2014.11 Mr Bradie ceased employment with the Company on 30 May 2014, at which time all unvested equity awards lapsed.
All vested rights are exercisable. There are no vested and unexercisable rights.
64 WorleyParsons Annual Report 2015
Directors’ report CONTINUED
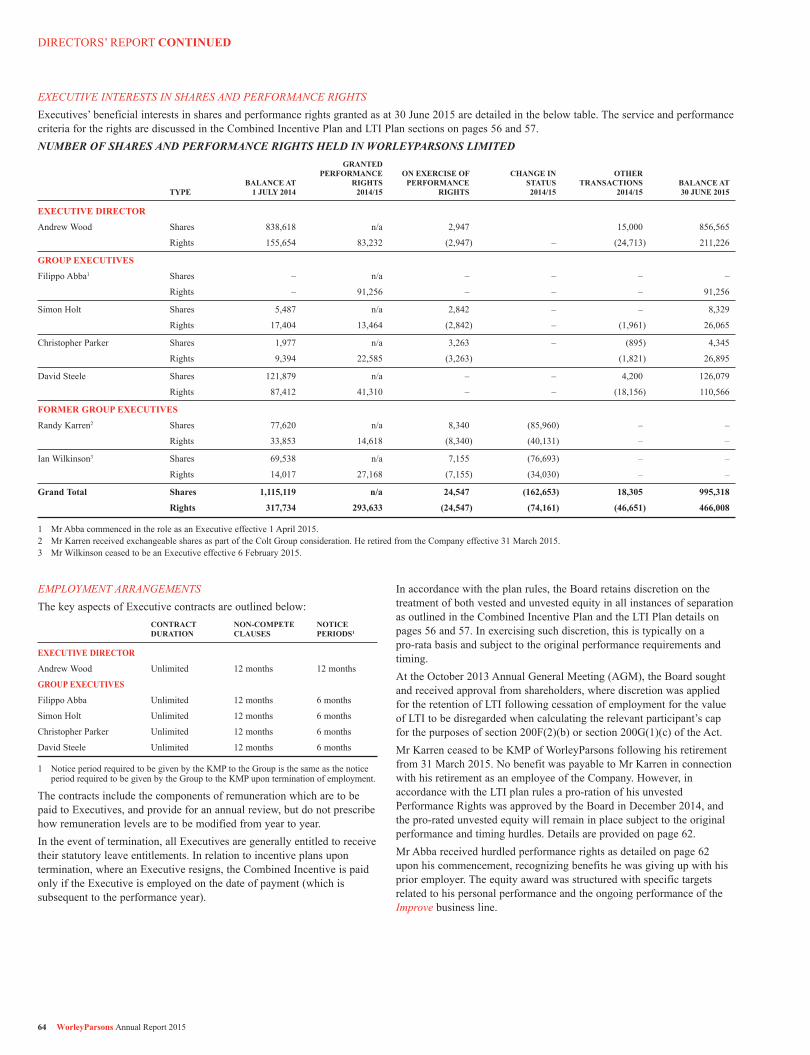
EXECUTIVE INTERESTS IN SHARES AND PERFORMANCE RIGHTSExecutives’ beneficial interests in shares and performance rights granted as at 30 June 2015 are detailed in the below table. The service and performance criteria for the rights are discussed in the Combined Incentive Plan and LTI Plan sections on pages 56 and 57.NUMBER OF SHARES AND PERFORMANCE RIGHTS HELD IN WORLEYPARSONS LIMITED GRANTED PERFORMANCE ON EXERCISE OF CHANGE IN OTHER BALANCE AT RIGHTS PERFORMANCE STATUS TRANSACTIONS BALANCE AT TYPE 1 JULY 2014 2014/15 RIGHTS 2014/15 2014/15 30 JUNE 2015
EXECUTIVE DIRECTOR
Andrew Wood Shares 838,618 n/a 2,947 15,000 856,565
Rights 155,654 83,232 (2,947) – (24,713) 211,226
GROUP EXECUTIVES
Filippo Abba1 Shares – n/a – – – –
Rights – 91,256 – – – 91,256
Simon Holt Shares 5,487 n/a 2,842 – – 8,329
Rights 17,404 13,464 (2,842) – (1,961) 26,065
Christopher Parker Shares 1,977 n/a 3,263 – (895) 4,345
Rights 9,394 22,585 (3,263) (1,821) 26,895
David Steele Shares 121,879 n/a – – 4,200 126,079
Rights 87,412 41,310 – – (18,156) 110,566
FORMER GROUP EXECUTIVES
Randy Karren2 Shares 77,620 n/a 8,340 (85,960) – –
Rights 33,853 14,618 (8,340) (40,131) – –
Ian Wilkinson3 Shares 69,538 n/a 7,155 (76,693) – –
Rights 14,017 27,168 (7,155) (34,030) – –
Grand Total Shares 1,115,119 n/a 24,547 (162,653) 18,305 995,318
Rights 317,734 293,633 (24,547) (74,161) (46,651) 466,008
1 Mr Abba commenced in the role as an Executive effective 1 April 2015.2 Mr Karren received exchangeable shares as part of the Colt Group consideration. He retired from the Company effective 31 March 2015.3 Mr Wilkinson ceased to be an Executive effective 6 February 2015.
EMPLOYMENT ARRANGEMENTSThe key aspects of Executive contracts are outlined below: CONTRACT NON‑COMPETE NOTICE DURATION CLAUSES PERIODS1
EXECUTIVE DIRECTOR
Andrew Wood Unlimited 12 months 12 months
GROUP EXECUTIVES
Filippo Abba Unlimited 12 months 6 months
Simon Holt Unlimited 12 months 6 months
Christopher Parker Unlimited 12 months 6 months
David Steele Unlimited 12 months 6 months
1 Notice period required to be given by the KMP to the Group is the same as the notice period required to be given by the Group to the KMP upon termination of employment.
The contracts include the components of remuneration which are to be paid to Executives, and provide for an annual review, but do not prescribe how remuneration levels are to be modified from year to year.In the event of termination, all Executives are generally entitled to receive their statutory leave entitlements. In relation to incentive plans upon termination, where an Executive resigns, the Combined Incentive is paid only if the Executive is employed on the date of payment (which is subsequent to the performance year).
In accordance with the plan rules, the Board retains discretion on the treatment of both vested and unvested equity in all instances of separation as outlined in the Combined Incentive Plan and the LTI Plan details on pages 56 and 57. In exercising such discretion, this is typically on a pro‑rata basis and subject to the original performance requirements and timing.At the October 2013 Annual General Meeting (AGM), the Board sought and received approval from shareholders, where discretion was applied for the retention of LTI following cessation of employment for the value of LTI to be disregarded when calculating the relevant participant’s cap for the purposes of section 200F(2)(b) or section 200G(1)(c) of the Act.Mr Karren ceased to be KMP of WorleyParsons following his retirement from 31 March 2015. No benefit was payable to Mr Karren in connection with his retirement as an employee of the Company. However, in accordance with the LTI plan rules a pro‑ration of his unvested Performance Rights was approved by the Board in December 2014, and the pro‑rated unvested equity will remain in place subject to the original performance and timing hurdles. Details are provided on page 62.Mr Abba received hurdled performance rights as detailed on page 62 upon his commencement, recognizing benefits he was giving up with his prior employer. The equity award was structured with specific targets related to his personal performance and the ongoing performance of the Improve business line.
WorleyParsons Annual Report 2015 65
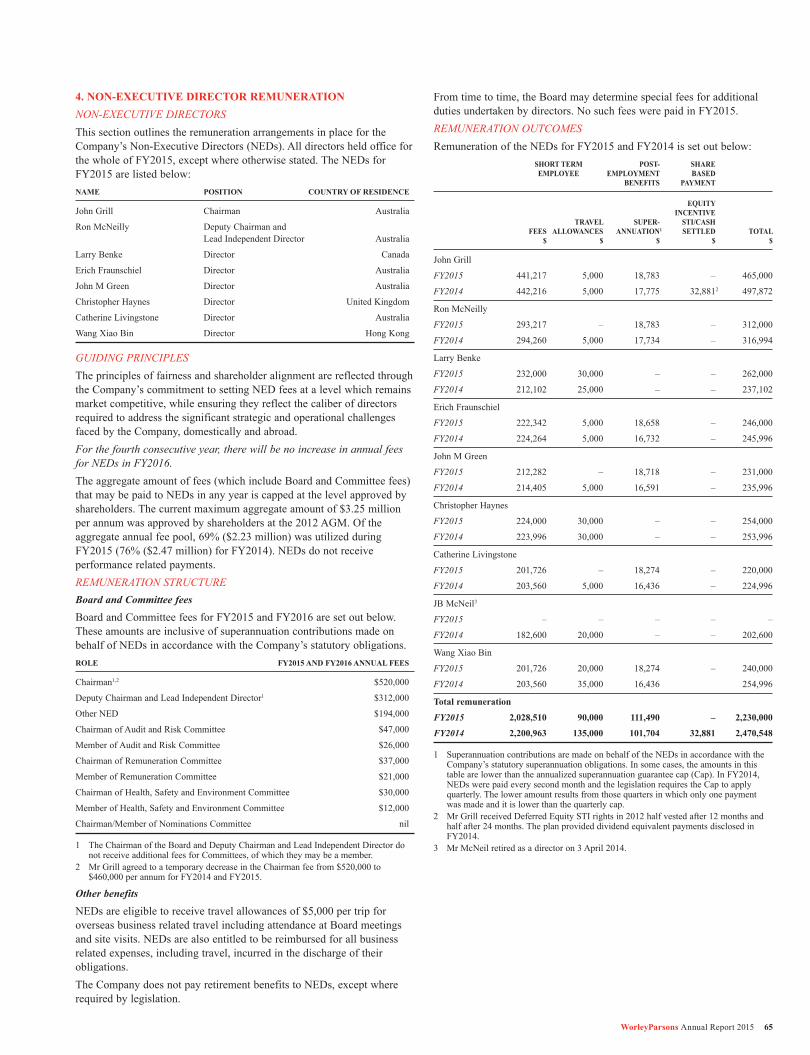
4. NON‑EXECUTIVE DIRECTOR REMUNERATIONNON‑EXECUTIVE DIRECTORSThis section outlines the remuneration arrangements in place for the Company’s Non‑Executive Directors (NEDs). All directors held office for thewholeofFY2015,exceptwhereotherwisestated.TheNEDsforFY2015arelistedbelow:NAME POSITION COUNTRY OF RESIDENCE
John Grill Chairman Australia
Ron McNeilly Deputy Chairman and Lead Independent Director Australia
Larry Benke Director Canada
Erich Fraunschiel Director Australia
John M Green Director Australia
Christopher Haynes Director United Kingdom
Catherine Livingstone Director Australia
Wang Xiao Bin Director Hong Kong
GUIDING PRINCIPLESThe principles of fairness and shareholder alignment are reflected through the Company’s commitment to setting NED fees at a level which remains market competitive, while ensuring they reflect the caliber of directors required to address the significant strategic and operational challenges faced by the Company, domestically and abroad.For the fourth consecutive year, there will be no increase in annual fees for NEDs in FY2016.The aggregate amount of fees (which include Board and Committee fees) that may be paid to NEDs in any year is capped at the level approved by shareholders. The current maximum aggregate amount of $3.25 million per annum was approved by shareholders at the 2012 AGM. Of the aggregate annual fee pool, 69% ($2.23 million) was utilized during FY2015(76%($2.47million)forFY2014).NEDsdonotreceiveperformance related payments.REMUNERATION STRUCTUREBoard and Committee fees
BoardandCommitteefeesforFY2015andFY2016aresetoutbelow.These amounts are inclusive of superannuation contributions made on behalf of NEDs in accordance with the Company’s statutory obligations.ROLE FY2015 AND FY2016 ANNUAL FEES
Chairman1,2 $520,000
Deputy Chairman and Lead Independent Director1 $312,000
Other NED $194,000
Chairman of Audit and Risk Committee $47,000
Member of Audit and Risk Committee $26,000
Chairman of Remuneration Committee $37,000
Member of Remuneration Committee $21,000
Chairman of Health, Safety and Environment Committee $30,000
Member of Health, Safety and Environment Committee $12,000
Chairman/Member of Nominations Committee nil
1 The Chairman of the Board and Deputy Chairman and Lead Independent Director do not receive additional fees for Committees, of which they may be a member.
2 Mr Grill agreed to a temporary decrease in the Chairman fee from $520,000 to $460,000perannumforFY2014andFY2015.
Other benefits
NEDs are eligible to receive travel allowances of $5,000 per trip for overseas business related travel including attendance at Board meetings and site visits. NEDs are also entitled to be reimbursed for all business related expenses, including travel, incurred in the discharge of their obligations.The Company does not pay retirement benefits to NEDs, except where required by legislation.
From time to time, the Board may determine special fees for additional dutiesundertakenbydirectors.NosuchfeeswerepaidinFY2015.REMUNERATION OUTCOMESRemunerationoftheNEDsforFY2015andFY2014issetoutbelow: SHORT TERM POST‑ SHARE EMPLOYEE EMPLOYMENT BASED BENEFITS PAYMENT
EQUITY INCENTIVE TRAVEL SUPER‑ STI/CASH FEES ALLOWANCES ANNUATION1 SETTLED TOTAL $ $ $ $ $
John Grill
FY2015 441,217 5,000 18,783 – 465,000
FY2014 442,216 5,000 17,775 32,8812 497,872
Ron McNeilly
FY2015 293,217 – 18,783 – 312,000
FY2014 294,260 5,000 17,734 – 316,994
Larry Benke
FY2015 232,000 30,000 – – 262,000
FY2014 212,102 25,000 – – 237,102
Erich Fraunschiel
FY2015 222,342 5,000 18,658 – 246,000
FY2014 224,264 5,000 16,732 – 245,996
John M Green
FY2015 212,282 – 18,718 – 231,000
FY2014 214,405 5,000 16,591 – 235,996
Christopher Haynes
FY2015 224,000 30,000 – – 254,000
FY2014 223,996 30,000 – – 253,996
Catherine Livingstone
FY2015 201,726 – 18,274 – 220,000
FY2014 203,560 5,000 16,436 – 224,996
JB McNeil3
FY2015 – – – – –
FY2014 182,600 20,000 – – 202,600
Wang Xiao Bin
FY2015 201,726 20,000 18,274 – 240,000
FY2014 203,560 35,000 16,436 254,996
Total remuneration
FY2015 2,028,510 90,000 111,490 – 2,230,000
FY2014 2,200,963 135,000 101,704 32,881 2,470,548
1 Superannuation contributions are made on behalf of the NEDs in accordance with the Company’s statutory superannuation obligations. In some cases, the amounts in this tablearelowerthantheannualizedsuperannuationguaranteecap(Cap).InFY2014,NEDs were paid every second month and the legislation requires the Cap to apply quarterly. The lower amount results from those quarters in which only one payment was made and it is lower than the quarterly cap.
2 Mr Grill received Deferred Equity STI rights in 2012 half vested after 12 months and half after 24 months. The plan provided dividend equivalent payments disclosed in FY2014.
3 Mr McNeil retired as a director on 3 April 2014.
66 WorleyParsons Annual Report 2015
Directors’ report CONTINUED
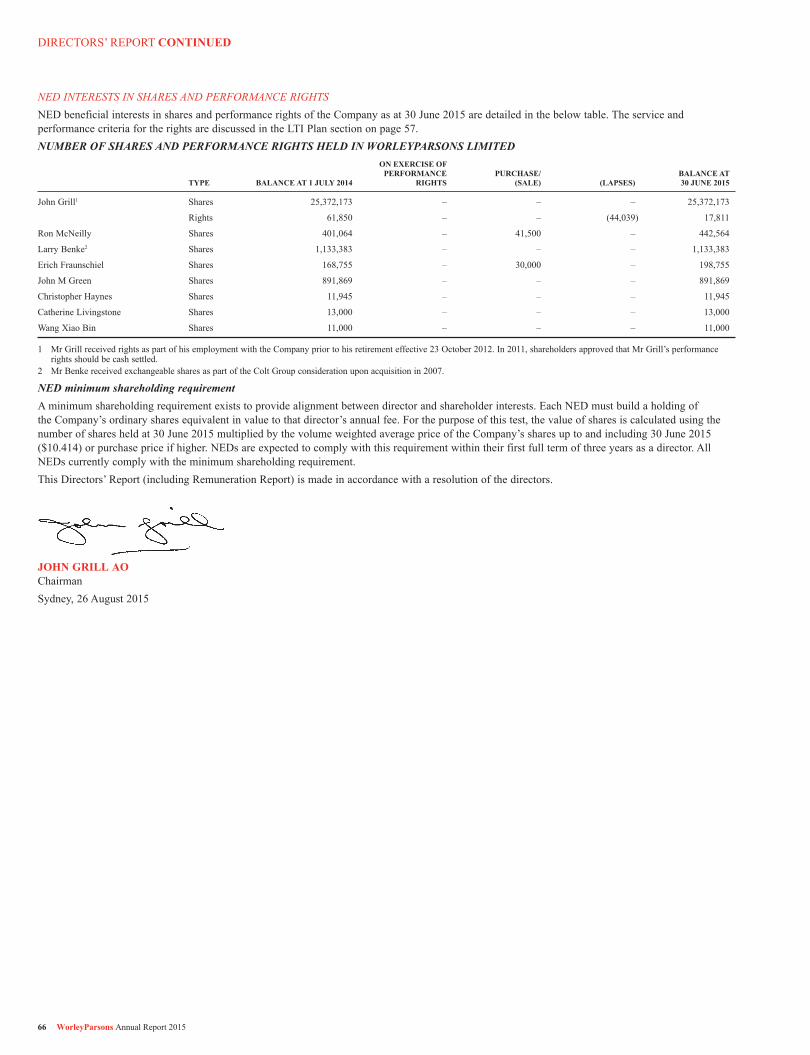
NED INTERESTS IN SHARES AND PERFORMANCE RIGHTSNED beneficial interests in shares and performance rights of the Company as at 30 June 2015 are detailed in the below table. The service and performance criteria for the rights are discussed in the LTI Plan section on page 57.NUMBER OF SHARES AND PERFORMANCE RIGHTS HELD IN WORLEYPARSONS LIMITED ON EXERCISE OF PERFORMANCE PURCHASE/ BALANCE AT TYPE BALANCE AT 1 JULY 2014 RIGHTS (SALE) (LAPSES) 30 JUNE 2015
John Grill1 Shares 25,372,173 – – – 25,372,173
Rights 61,850 – – (44,039) 17,811
Ron McNeilly Shares 401,064 – 41,500 – 442,564
Larry Benke2 Shares 1,133,383 – – – 1,133,383
Erich Fraunschiel Shares 168,755 – 30,000 – 198,755
John M Green Shares 891,869 – – – 891,869
Christopher Haynes Shares 11,945 – – – 11,945
Catherine Livingstone Shares 13,000 – – – 13,000
Wang Xiao Bin Shares 11,000 – – – 11,000
1 Mr Grill received rights as part of his employment with the Company prior to his retirement effective 23 October 2012. In 2011, shareholders approved that Mr Grill’s performance rights should be cash settled.
2 Mr Benke received exchangeable shares as part of the Colt Group consideration upon acquisition in 2007.
NED minimum shareholding requirementA minimum shareholding requirement exists to provide alignment between director and shareholder interests. Each NED must build a holding of the Company’s ordinary shares equivalent in value to that director’s annual fee. For the purpose of this test, the value of shares is calculated using the number of shares held at 30 June 2015 multiplied by the volume weighted average price of the Company’s shares up to and including 30 June 2015 ($10.414) or purchase price if higher. NEDs are expected to comply with this requirement within their first full term of three years as a director. All NEDs currently comply with the minimum shareholding requirement.This Directors’ Report (including Remuneration Report) is made in accordance with a resolution of the directors.
JOHN GRILL AO ChairmanSydney, 26 August 2015