Remuneration report 2020
18
Ørsted Remuneration report 2020
Transcript of Remuneration report 2020

Ørsted Remuneration report 2020

A sustainable build-out of green energy
Sustainability report 2020
Ørsted ESG performance report 2020
Ørsted Annual report 2020
Chairman’s statement 3Summary of remuneration policy 4Remuneration of the Executive Board 6Remuneration of the Board of Directors 11Statement by the Board of Directors 12Independent auditor’s report on remuneration report 13Appendix – the Executive Board 14Appendix – selected Ørsted metrics 15Appendix – the Board of Directors 16Appendix – share programme dates and periods 17
ContentsRemuneration report 2020
The Ørsted vision is a world that runs entirely on green energy. Ørsted develops, constructs, and operates offshore and onshore wind farms, solar farms, energy storage facilities, and bioenergy plants, and provides energy products to its customers. In 2021, we were ranked the most sustainable energy company in the world in the Corporate Knights Global 100 index, and we are recognised on the CDP Climate Change A List as a global leader on climate action.
Other reports 2020Annual reportESG performanceSustainability
Ørsted Remuneration report 2020
2 / 18
Contents

Dear shareholder
On behalf of the Board of Directors, I present the remuneration report for 2020.
The remuneration policy was updated at the annual general meeting in 2020 to reflect the implementation of the Shareholders Rights Directive II into Danish legislation.
The overall objective of the remuneration policy is to attract and retain qualified mem-bers of the Board of Directors and the Executive Board. The policy includes remuneration elements that support our strategy, long-term
interests, and sustainability. Similar objectives are implemented in our remuneration policy for management and employees to ensure a fully aligned effort in all parts of the organisation.
The remuneration report has been prepared to meet the requirements of the section 139 b of the Danish Companies Act. The report is further prepared in accordance with the European Commission Guidelines’ (draft) on the standardised presentation of the remuner-ation report as regards the encouragement of long-term shareholder engagement. The report will be presented for an advisory vote at the annual general meeting in March 2021.
Chairman’s statement
Thomas Thune AndersenChairman of the Nomination & Remuneration Committee
Our objective in this report is to give a trans-parent and comprehensive overview of the remuneration of our Executive Board and our Board of Directors.
Henrik Poulsen stepped down as CEO at the end of 2020 and has been replaced by Mads Nipper as of 1 January 2021. However, in this report, Henrik Poulsen is referred to as the CEO.
During 2020, we had stable operations despite the pandemic. We commissioned several new offshore and onshore wind farms, progressed on our strategic objectives, and had very satisfactory financials. In total, the cash-based incentive scheme for the CEO and CFO amounted to 94 % and 92 % of the maximum bonus, respectively.
In the Executive Board’s long-term share-based incentive scheme (LTI), Ørsted was ranked number one when benchmarked on total shareholder return (TSR) against ten comparable energy companies. Therefore, the maximum number of shares vesting was granted. The combination of a TSR of 192 % during the grant to settlement period driven
“On behalf of the Board of Directors, I present the remuneration report for 2020.
by the very positive development in the share price since the grant and the ranking among peers resulted in a value of the LTI programme equalling 117 % of the Executive Board’s base salary at the time of the grant in 2017. Hereby, the remuneration of our Executive Board in 2020 reflects yet a strong year for Ørsted.
Ørsted Remuneration report 2020 Contents
3 / 18

Summary of remuneration policy
Remuneration structure1
Element Objective Remuneration level Performance measure
Fixed base salary Align with market to attract and retain qualified executives.
Competitive, but not market leading, compared to the levels in other major listed Danish companies with international activities.
None
Cash-based incentive scheme (STI) Support the strategy of Ørsted. Target of 15 % of the fixed base salary. The maximum bonus amounts to 30 % and will be paid out in case of full achievement of all performance targets.
The performance reward agreement consists of three targets: – individual business and leadership target which includes
environmental, social, and governance (ESG) targets (60 %)– financial target (30 %) – safety target (10 %).
Share-based incentive scheme (LTI) Support the strategy, long-term interests, and sustainability of Ørsted.
Target of 20 % of the annual fixed base salary at the time of grant. After three years, shares will be allocated at 0-200 % of the number of performance share units (PSUs) granted, depending on Ørsted’s total shareholder return compared to peers.
The final number of shares will be determined on the basis of Ørsted’s total shareholder return, benchmarked against peers in the energy industry.
Pension, incl. social security and benefits
Align with market to attract and retain qualified executives.
Pension contributions are considered included in the fixed base salary. The Executive Board is covered by Ørsted’s insurance schemes. Benefits include a company car.
None
Severance pay Align with market to attract and retain qualified executives.
If a member of the Executive Board is terminated by the company, the person is entitled to 24 months’ salary, composed of full remuneration during the 12 months notice period and 12 months of severance pay (fixed base salary only).
n.a.
1 The Executive Board does not receive any remuneration (e.g. board fees or similar) from associated companies in the Group.
Remuneration policy (extract)The overall objective of our remuneration policy is to support the Ørsted Group’s strategy, long-term interests, and sustainability. To attain this objective, the policy is designed to attract and retain qualified members of the Board of Directors and the Executive Board and to guide the priorities of the Executive Board.
The policy was updated in 2020 to further highlight the link to Ørsted’s strategy.
Furthermore, a section was added to describe the already existing clawback terms. The updates did not change any compensation elements in use.
The remuneration of the Executive Board includes short-term cash-based and long-term share-based incentive remuneration which is designed to support the strategy, long-term interests, and sustainability of Ørsted.
The short-term cash-based scheme includes, among other things, environmental, social, and governance (ESG) targets. The long-term share-based incentive scheme is based on Ørsted’s total shareholder return (TSR) relative to peers to ensure a transparent link between Ørsted’s performance and the value of the scheme.
The remuneration level should be competitive, but not market-leading, compared to the remuneration levels in other major listed Danish companies with international activities.
The Board of Directors receives a fixed annual fee.
The full remuneration policy is available at orsted.com/remuneration2020.
Remuneration structureThe remuneration structure for the Executive Board is shown in the table below. The two incentive schemes are described in moredetail on the following pages.
Ørsted Remuneration report 2020 Contents
4 / 18

Minimum Target Maximum TSR -50 % TSR +50 % TSR +100 %
Cash-based incentive scheme (STI)The short-term incentive scheme (STI) is a variable cash-based incentive scheme with a term of 12 months. The target bonus amounts to 15 % of the fixed base salary and may not exceed 30 %. The Nomination & Remuneration Committee of the Board of Directors will make proposals for remuneration of the Executive Board, which will be subject to approval by the entire Board of Directors. These include settlements of short-term incentive schemes for the preceding year and new targets for the coming year.
The Executive Board’s individual business targets are tied directly to Ørsted’s green growth strategy to build out renewable energy in a sustainable and safe way. The individual business targets comprise a number of items (including ESG) which are defined at the beginning of the year and updated during the year, if new targets become relevant, to ensure continuous alignment with sharehold-er interests. See page 7 for a more detailed description of the targets.
Share-based incentive scheme (LTI)The Executive Board is covered by a share programme. It is a condition for being granted performance share units (PSUs) that the participant holds a number of Ørsted shares, representing a value equal to a share of each participant’s fixed base salary. For the CEO, this share is 75 % of the fixed base salary, and for the CFO, it is 50 %.
If the participants fulfil the shareholding requirement at the time of the annual grant, they will receive a number of PSUs,
representing a value equal to 20 % of their fixed base salary at the time of granting.The PSUs granted have a vesting period of three years, after which each PSU entitles the holder to receive a number of shares free of charge, corresponding to 0-200 % of the num-ber of PSUs granted. The number of shares are capped at 200 % of the PSUs, however, the value of the shares is unlimited, as there is no cap on share price increases. Assuming no share price development since the grant, the value would correspond to 0-40 % of the fixed base salary at the time of the grant. The final number of shares for each participant will be determined on the basis of the TSR delivered by Ørsted, benchmarked against ten peers in the industry, i.e. 200 % if Ørsted ranks first, 100 % if sixth, and no shares if we rank last.
The minimum, target, and maximum remu-neration scenarios are shown in the bottom chart, based on an unchanged share price from the time of the grant to vesting. The chart further illustrates three scenarios, assuming the maximum performance and vesting of 200 %, combined with different share price developments.
If a member of the Executive Board leaves Ørsted as a result of his or her own resignation or due to breach of his or her employment, the entitlement to shares vesting after the notice period is lost.
STI and LTI payout scenarios at min., target, and max. performance and max. scenarios at various TSR levels, %
Fixed base salary STI LTI
Remuneration structure and timing
Scenarios illustrating remuneration structure at grant share price.
Assuming max. STI and vesting factors, the scenarios illustrate remuneration at different TSR levels for the vesting period.
Time of grant
Time of grant Vesting period
Year 1 Year 3
Time of vesting
100 100100 100100 100
30 30 3030
4080
1520
2060
The table illustrates the components and timing of the Executive Board remuneration. In year 1, a fixed base salary and a potential STI are awarded.
Furthermore, a fixed number of PSUs are granted in year 1 with a three-year vesting period.
Fixed base salary and benefits
STI = 0-30 % of fixed base salary
20 % of fixed base salary = # of PSUs granted based on share price at grant
Share price when vesting in year 3
Value of shares vesting
TSR performance compared to peers:
200 % – rank #1– 100 % – rank #6– 0 % – rank #11
x x =
Ørsted Remuneration report 2020 Contents
5 / 18

DKK 9.5 m
DKK 16.8 m
Remuneration in 2020The remuneration awarded to our CEO and CFO in 2020 was in line with our remuneration policy. Despite a year of global uncertainty, we maintained strong operational, strategic, and financial results, the latter resulting in upwards adjusted financial guidances in March, which was even exceeded. These circumstances have resulted in high achieve-ments of targets for variable remuneration.
The remuneration from the share-based in-centive programme stated in the table below reflects the market value of the scheme in the year in which it was granted. CEO Henrik Poulsen handed in his resignation in June 2020.
As a consequence hereof, all granted, but unvested PSUs from the 2018, 2019, and 2020 long-term incentive programme are discontinued.
The remuneration awarded to our CEO totalled DKK 16.8 million in 2020, in line with 2019 on a like-for-like basis as if Henrik Poulsen had not resigned. The cash bonus (STI) made up DKK 3.1 million, corresponding to 94 % of the maximum bonus. With a TRIR of 3.6, the safety meassure was better than the target and reached a score of 94 %. The financial target EBITDA reached a 100 % score. EBITDA exceeded our expectations at the beginning of the year as a result of increased earnings
from our offshore and onshore wind farms, strong results from trading related to hedging of our power exposures, and lower expected costs throughout our business. The individual business and leadership targets (see page 7) reached 92 %, reflecting a year where the majority of the milestones were achieved. The total remuneration for the CEO, including the effects of his resignation, amounted to DKK 8.9 million. The reversal of discontinued LTIs from 2018-2020 reduced the awarded remuneration by DKK 7.9 million.
The remuneration awarded to our CFO totalled DKK 9.5 million, representing an increase of 2 % compared to 2019.
Remuneration of the Executive Board
Awarded remuneration of the Executive Board, DKK ’000 Henrik Poulsen, CEO Marianne Wiinholt, CFO
Element 2020 % 2019 % 2020 % 2019 %
Fixed remuneration
Fixed based salary 11,032 66 10,762 64 6,199 65 6,047 65
Benefits, incl. social security 211 1 306 2 258 3 258 3
Variable remuneration
Cash-based incentive scheme (STI) 3,123 19 3,007 18 1,708 18 1,554 17
Share-based incentive scheme (LTI) 2,408 14 2,690 16 1,353 14 1,511 15
Total remuneration 16,774 100 16,765 100 9,518 100 9,370 100
Reversal of LTI due to resignation (7,881)
Total remuneration, incl. resignation reversal 8,893
STI in % of maximum bonus 94 % 93 % 92 % 86 %
Composition of fixed and variable remuneration, awarded 2020, %
Fixed remuneration Variable remuneration
Henrik Poulsen
Marianne Wiinholt
33 %
32 %
67 %
68 %
Ørsted Remuneration report 2020 Contents
6 / 18

Performance of the Executive Board Henrik Poulsen, CEO Marianne Wiinholt, CFO
Performance criteriaand applicable remuneration
Relative weighting Objectives Score Objectives Score
Safety target 10 % – TRIR1 compared to target 94 % – TRIR1 compared to target 94 %
Financial target 30 % – EBITDA compared to target 100 % – EBITDA compared to target 100 %
Specific individual business and leadership targets
60 % – First-class safety culture and standards – First-class safety culture and standards
– ROCE in line with plan – ROCE in line with plan
– Deliver major construction projects on budget and on time
– Proactively manage risks related to currencies, interest rates, inflation, and tax (in particular transfer pricing)
– Maintain on-budget availability on operating assets across the business
– Win auctions and/or secure key access rights/permits in Offshore’s existing and new strategic markets with a sustained focus on value-creation
– Develop financial and IT platforms in new markets and further integrate Onshore into Group systems
– Complete farm-downs of Greater Changhua 1 and Ocean Wind
– Deliver value creation from digital transformation and realise synergies across the business without compromising quality
– Mature pipeline of offshore and onshore projects towards value-creating FID cases
– Deliver on redesigned cybersecurity programme
– Advance development of renewable hydrogen pilot projects
– Maintain sustainability transparency and top rankings in ESG/sustainability ratings
– Continue to reinforce talent development and diversity and inclusion in Ørsted
– Continue to reinforce talent development and diversity and inclusion in Ørsted
– Complete or progress divestments of non-core businesses, i.e. our Danish power distribution, residential customer, and city light businesses, our LNG activities, and our B2B businesses
– Complete or progress divestments of non-core businesses, i.e. our Danish power distribution, residential customer, and city light businesses, our LNG activities, and our B2B businesses
– Deliver on path towards 99 % green share of generation by 2025, reduce scope 1 and 2 greenhouse gas (GHG) emissions by 98 % by 2025 and scope 3 GHG emissions with 50 % by 2032
– Deliver on path towards 99 % green share of generation by 2025, reduce scope 1 and 2 greenhouse gas (GHG) emissions by 98 % by 2025 and scope 3 GHG emissions with 50 % by 2032
92 % 88 %
Total STI, % 94 % 92 %
Total STI award, DKK ’000 3,123 1,708
1 Total recordable injury rate (TRIR).
The table is a non-exhaustive summary of the individual business targets for our CEO and CFO as well as shared Group targets. They must deliver fully on all their individual targets in order to achieve the maximum cash bonus (STI).
The other members of the Executive Committee have their own individual business targets and are remunerated according to the same model as described to the right.
The cash bonus (STI) made up DKK 1.7 million, corresponding to 92 % of the maximum bonus. The safety target reached 94 % and the finan-cial target reached 100 %. The CFO’s individual business and leadership targets reached a 88 % score, also reflecting a year with several important milestones achieved.
The composition of awarded fixed and variable remuneration is seen in the chart on page 6.The cash-based remuneration is described on page 9.
See appendix for further information regarding remuneration of the Executive Board.
Ørsted Remuneration report 2020 Contents
7 / 18
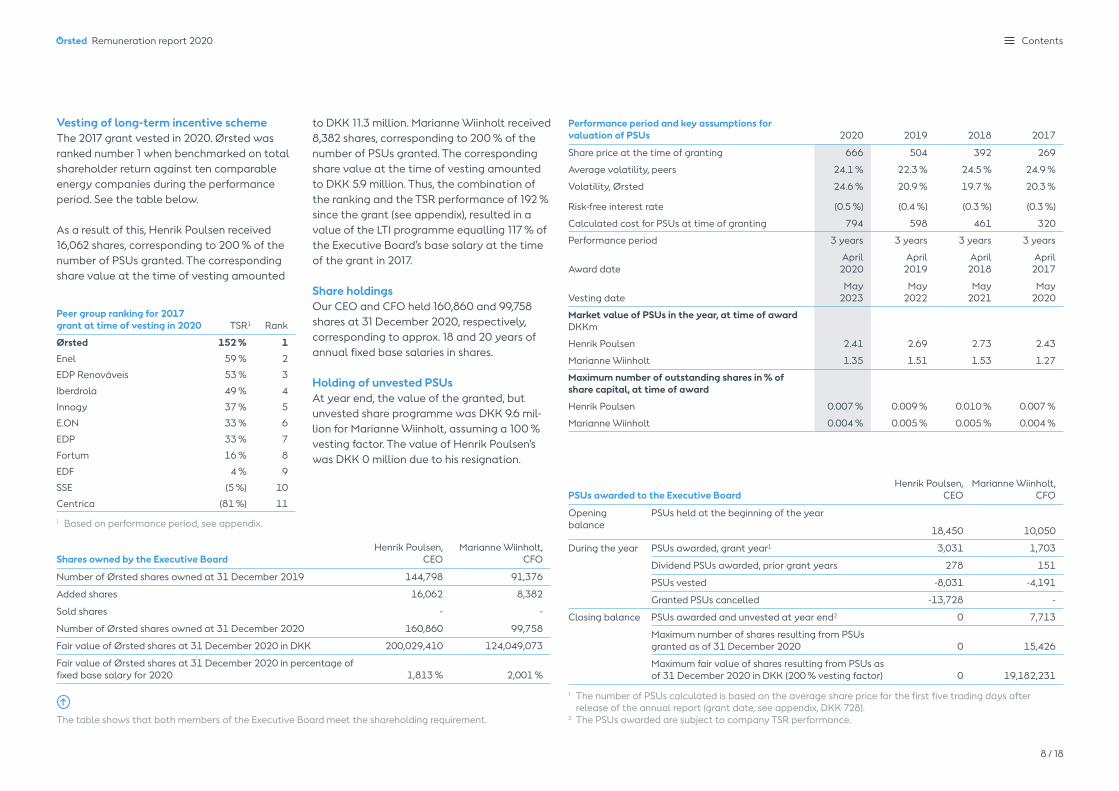
Shares owned by the Executive Board Henrik Poulsen,
CEOMarianne Wiinholt,
CFO
Number of Ørsted shares owned at 31 December 2019 144,798 91,376
Added shares 16,062 8,382
Sold shares - -
Number of Ørsted shares owned at 31 December 2020 160,860 99,758
Fair value of Ørsted shares at 31 December 2020 in DKK 200,029,410 124,049,073
Fair value of Ørsted shares at 31 December 2020 in percentage of fixed base salary for 2020 1,813 % 2,001 %
Vesting of long-term incentive schemeThe 2017 grant vested in 2020. Ørsted was ranked number 1 when benchmarked on total shareholder return against ten comparable energy companies during the performance period. See the table below.
As a result of this, Henrik Poulsen received 16,062 shares, corresponding to 200 % of the number of PSUs granted. The corresponding share value at the time of vesting amounted
Peer group ranking for 2017 grant at time of vesting in 2020 TSR1 Rank
Ørsted 152 % 1
Enel 59 % 2
EDP Renováveis 53 % 3
Iberdrola 49 % 4
Innogy 37 % 5
E.ON 33 % 6
EDP 33 % 7
Fortum 16 % 8
EDF 4 % 9
SSE (5 %) 10
Centrica (81 %) 11
1 Based on performance period, see appendix.
Performance period and key assumptions for valuation of PSUs 2020 2019 2018 2017
Share price at the time of granting 666 504 392 269
Average volatility, peers 24.1 % 22.3 % 24.5 % 24.9 %
Volatility, Ørsted 24.6 % 20.9 % 19.7 % 20.3 %
Risk-free interest rate (0.5 %) (0.4 %) (0.3 %) (0.3 %)
Calculated cost for PSUs at time of granting 794 598 461 320
Performance period 3 years 3 years 3 years 3 years
Award dateApril
2020April
2019April
2018April
2017
Vesting dateMay
2023May
2022May
2021May
2020
Market value of PSUs in the year, at time of awardDKKm
Henrik Poulsen 2.41 2.69 2.73 2.43
Marianne Wiinholt 1.35 1.51 1.53 1.27
Maximum number of outstanding shares in % of share capital, at time of award
Henrik Poulsen 0.007 % 0.009 % 0.010 % 0.007 %
Marianne Wiinholt 0.004 % 0.005 % 0.005 % 0.004 %
PSUs awarded to the Executive BoardHenrik Poulsen,
CEOMarianne Wiinholt,
CFO
Opening balance
PSUs held at the beginning of the year
18,450 10,050
During the year PSUs awarded, grant year1 3,031 1,703
Dividend PSUs awarded, prior grant years 278 151
PSUs vested -8,031 -4,191
Granted PSUs cancelled -13,728 -
Closing balance PSUs awarded and unvested at year end2 0 7,713
Maximum number of shares resulting from PSUs granted as of 31 December 2020 0 15,426
Maximum fair value of shares resulting from PSUs as of 31 December 2020 in DKK (200 % vesting factor) 0 19,182,231
1 The number of PSUs calculated is based on the average share price for the first five trading days after release of the annual report (grant date, see appendix, DKK 728).
2 The PSUs awarded are subject to company TSR performance.
to DKK 11.3 million. Marianne Wiinholt received 8,382 shares, corresponding to 200 % of the number of PSUs granted. The corresponding share value at the time of vesting amounted to DKK 5.9 million. Thus, the combination of the ranking and the TSR performance of 192 % since the grant (see appendix), resulted in a value of the LTI programme equalling 117 % of the Executive Board’s base salary at the time of the grant in 2017.
Share holdingsOur CEO and CFO held 160,860 and 99,758 shares at 31 December 2020, respectively, corresponding to approx. 18 and 20 years of annual fixed base salaries in shares.
Holding of unvested PSUsAt year end, the value of the granted, but unvested share programme was DKK 9.6 mil-lion for Marianne Wiinholt, assuming a 100 % vesting factor. The value of Henrik Poulsen’s was DKK 0 million due to his resignation.
The table shows that both members of the Executive Board meet the shareholding requirement.
Ørsted Remuneration report 2020 Contents
8 / 18

2020 2019 2018
2020 2019 2018DKK 14.1 m
DKK 25.7 m
Cash-based remuneration 2020Whereas the remuneration awarded consists of the market value of the LTI scheme at the time of which is was awarded, the cash-based remuneration shows the actual cash value of the scheme at the time of vesting.
The 2017 grant vested in May 2020. The TSR (share price including dividend payments in the grant to settlement period) had increased by 192 %, leading to a higher market value of the shares at the time of vesting.
Therefore, the remuneration on a cash basis paid to our CEO and CFO was higher than the total remuneration awarded. The difference is illustrated in the table below.
The cash-based remuneration realised for Henrik Poulsen and Marianne Wiinholt is further illustrated in the two charts. The variable share constitutes a high proportion of the total remuneration for 2020, reflecting the close coherence between the performance of Ørsted, the individual performance, and the remunera-tion of the Executive Board in 2020.
Cash-based remuneration of the Executive Board, DKK ’000 Henrik Poulsen, CEO Marianne Wiinholt, CFO
Element 2020 2019 2020 2019
Total remuneration, awarded (excl. resignation reversal for Henrik Poulsen) 16,774 16,765 9,518 9,370
Share-based remuneration, add-back (2,408) (2,690) (1,353) (1,511)
Cash value of vested shares (see specification below) 11,327 7,355 5,911 3,837
Total remuneration including market value increase of shares, cash basis 25,693 21,430 14,076 11,696
Specification of cash value of vested shares
Value of grant per grant date1 1,940 1,848 1,012 964
Grant value of peer group performance vesting multiplier 1,940 1,848 1,012 964
Share price increase and dividend PSUs during vesting period 7,447 3,659 3,886 1,909
Total value of vested shares 11,327 7,355 5,911 3,837
1 Calculated as number of awarded PSUs * share price based on average share price for the first five trading days after release of the annual report which serves as the basis for the determination of the number of granted PSUs.
Composition of fixed and variable cash-based remuneration in 2020, %
Fixed remuneration Variable remuneration
Cash-based remuneration, DKKm
Fixed base salary, incl. benefits STI LTI 1
56 %
54 %
44 %
46 %
Henrik PoulsenHenrik Poulsen
Marianne WiinholtMarianne Wiinholt
1 In 2018, the LTI represents the IPO Executive Retention Bonus. The cash-based remuneration includes the actual vesting value of the LTI in the year of vesting.
3.1
1.7
11.2
6.5
11.3
5.9
25.7
14.1
3.0
1.6
10.8
6.1
1.8
1.0
15.7
8.7
3.0
1.6
11.1
6.3
7.4
3.8
21.4
11.6
Ørsted Remuneration report 2020 Contents
9 / 18

100
150
200
250
300
350
400
450
500
550
2015 2016 2017 2018 2019 2020
Index
Year of IPO
Cash-based remuneration and company performance development 2015-2020, %
Annual change 2020 2019 2018 2017 2016 2015
Realised remuneration, cash basis, Executive BoardHenrik Poulsen 20.1 36.9 7.7 (50.5) 162.8 7.2 Marianne Wiinholt 20.5 33.8 15.5 (57.0) 189.9 3.2 Ørsted performanceEBITDA (excl. new partnerships) 3.7 16.8 17.6 (10.0) 61.9 50.4 TSR 82 61.0 32.0 29.0 14.0 n.a.Installed green capacity, offshore and onshore 17.9 21.9 64.1 8.3 20.0 20.0
Base salary increaseHenrik Poulsen 2.5 2.5 8.2 5.0 4.0 5.0 Marianne Wiinholt 2.5 2.5 16.6 5.0 4.0 3.0 Global average salary review 2.3 3.0 2.9 2.6 2.4 1.9 DK average salary review 2.3 2.8 2.7 2.4 2.3 1.8
Ørsted’s performanceThe overall performance of Ørsted is measured by three metrics:
– Business performance EBITDA (excl. new partnerships).
– Total shareholder return (TSR).– Installed green capacity, offshore and
onshore.
As a high-growth and capital intensive company, EBITDA (excl. new partnerships) is a good measure of the financial outcome of our operating activities. Partnership earnings from farm-downs are excluded in order to show the underlying business performance, as these items vary significantly across years.
The TSR represents the value Ørsted creates to shareholders.
Lastly, the installed green capacity of our off-shore and onshore assets is a direct measure of our green growth strategy.
EBITDA has increased steadily the last five years, except between 2016 and 2017, as 2016 was positively effected by one-off compensa-tions in Markets & Bioenergy of DKK 4.3 billion. TSR is measured from the IPO in 2016. The TSR and installed green capacity have increased in all reported years.
As seen in the figure, the performance of Ørsted measured by these metrics is correlated with the cash-based remuneration of our CEO and CFO. The TSR is illustrated through the market capitalisation of Ørsted. The increase in cash-based remuneration in 2020 is due to the vesting of the 2017 grant.
Comparison to development in the Group’s average salary and CEO pay ratioIn 2020, the fixed base salary increased by 2.5 % for both the CEO and CFO.
The average fixed base salary increase in the Group amounted to 2.3 % in 2020. In Denmark, the average fixed base salary increase also amounted to 2.3 %.
In 2020, The CEO pay ratio based on expensed remuneration was 21 times the average wage per FTE.
Clawback clauseThe Executive Board’s incentive-based remuneration is subject to clawback if the remuneration was based on erroneous data, and the Executive Board member knew or should have known about this.
Notwithstanding the foregoing, shares in Ørsted (or cash) received due to vesting of PSUs are subject to clawback during the first six months after vesting of the PSUs, irrespec-tive of whether the Executive Board member knew or should have known about this.
Furthermore, shares in Ørsted (or cash) received due to vesting of PSUs may, under certain circumstances set out in the detailed terms of the share programme, be subject to clawback after the first six months following vesting of the PSUs.
Development in Executive Board total cash-based remuneration, EBITDA, installed green capacity, and market cap 2015-2020, %
Henrik Poulsen cash-based remuneration Marianne Wiinholt cash-based remuneration EBITDA development (excl. new partnerships)
Installed green capacity, offshore and onshore Market capitalisation (proxy for TSR)
Baseline for market cap figures is 9 June 2016 (IPO). Other figures are calculated using 2015 as a baseline of 100 %.
The significant increase in total cash-based remunera-tion for both Henrik Poulsen and Marianne Wiinholt in 2016 was due to the vesting of the share programme
at the time of the IPO. The LTI share of the remunera-tion fluctuates throughout the years.
Ørsted Remuneration report 2020 Contents
10 / 18
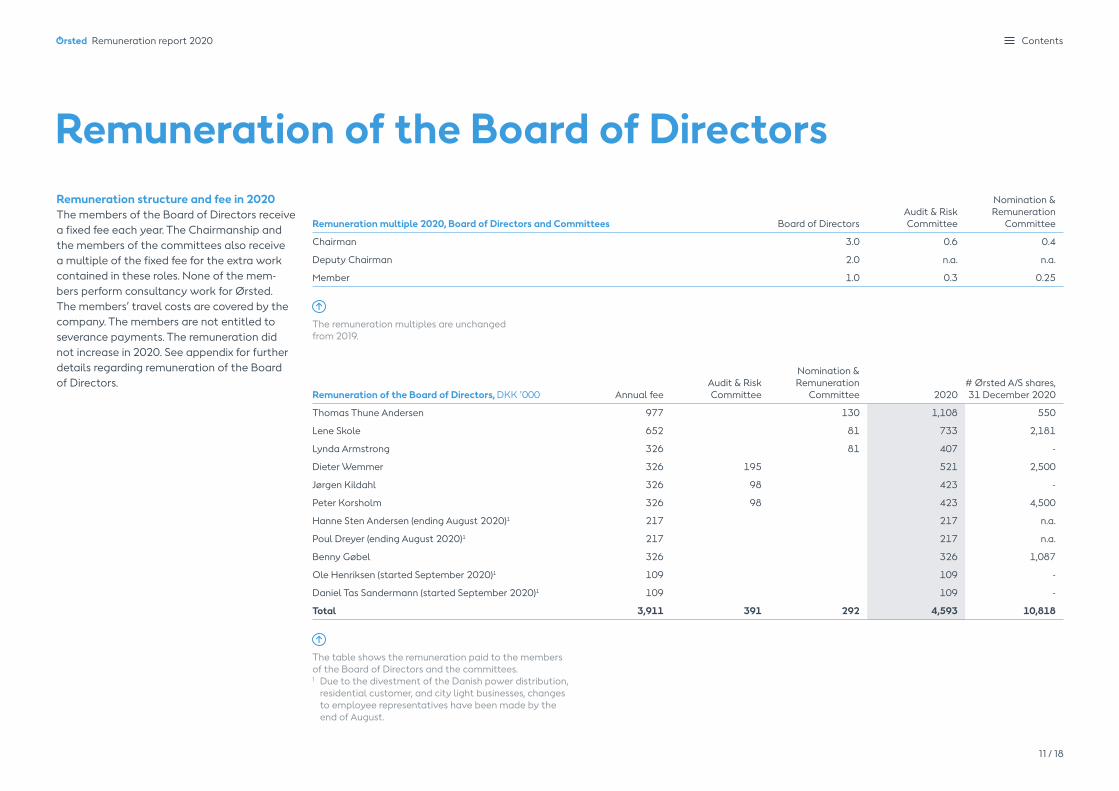
Remuneration multiple 2020, Board of Directors and Committees Board of DirectorsAudit & Risk Committee
Nomination & Remuneration
Committee
Chairman 3.0 0.6 0.4
Deputy Chairman 2.0 n.a. n.a.
Member 1.0 0.3 0.25
Remuneration of the Board of Directors, DKK ’000 Annual feeAudit & Risk Committee
Nomination & Remuneration
Committee 2020# Ørsted A/S shares, 31 December 2020
Thomas Thune Andersen 977 130 1,108 550
Lene Skole 652 81 733 2,181
Lynda Armstrong 326 81 407 -
Dieter Wemmer 326 195 521 2,500
Jørgen Kildahl 326 98 423 -
Peter Korsholm 326 98 423 4,500
Hanne Sten Andersen (ending August 2020)1 217 217 n.a.
Poul Dreyer (ending August 2020)1 217 217 n.a.
Benny Gøbel 326 326 1,087
Ole Henriksen (started September 2020)1 109 109 -
Daniel Tas Sandermann (started September 2020)1 109 109 -
Total 3,911 391 292 4,593 10,818
Remuneration structure and fee in 2020The members of the Board of Directors receive a fixed fee each year. The Chairmanship and the members of the committees also receive a multiple of the fixed fee for the extra work contained in these roles. None of the mem-bers perform consultancy work for Ørsted. The members’ travel costs are covered by the company. The members are not entitled to severance payments. The remuneration did not increase in 2020. See appendix for further details regarding remuneration of the Board of Directors.
Remuneration of the Board of Directors
The table shows the remuneration paid to the members of the Board of Directors and the committees. 1 Due to the divestment of the Danish power distribution,
residential customer, and city light businesses, changes to employee representatives have been made by the end of August.
The remuneration multiples are unchanged from 2019.
Ørsted Remuneration report 2020 Contents
11 / 18

The Board of Directors have today considered and approved the remuneration report of Ørsted A/S for the financial year 1 January - 31 December 2020.
The report has been prepared to meet the requirements of the section 139 b of the Danish Companies Act.
In our opinion, the remuneration report pro-vides a fair presentation of the development in the remuneration of our Executive Board and the remuneration of the Board of Directors as well as a fair presentation of the selected Group’s and parent company’s financial and non-financial figures for the financial year 1 January - 31 December 2020.
We recommend that the remuneration report be adopted at the annual general meeting where the report will be presented for an advisory vote.
Statement by the Board of Directors
Board of Directors:
Thomas Thune Andersen Chairman
Jørgen Kildahl
Benny Gøbel*
Lene SkoleDeputy Chairman
Peter Korsholm
Ole Henriksen*
Lynda Armstrong
Dieter Wemmer
Daniel Tas Sandermann*
Skærbæk, 3 February 2021
* Employee representative
Ørsted Remuneration report 2020 Contents
12 / 18

To the Shareholders of Ørsted A/SWe have examined whether the remuneration report for Ørsted A/S for the financial year 1 January - 31 December 2020 contains the information required under section 139 b, subsection 3, of the Danish Companies Act.
We express reasonable assurance in our conclusion.
The Board of Directors’ responsibility for the remuneration report The Board of Directors is responsible for the preparation of the remuneration report in accordance with section 139 b, subsection 3 of the Danish Companies Act. The Board of Directors is also responsible for the internal control that the Board of Directors deems necessary to prepare the remuneration report without material misstatement, regardless of whether this is due to fraud or error.
Auditor’s independence and quality management We are independent of the company in accord-ance with the International Ethics Standards Board for Accountants’ Code of Ethics for Professional Accountants (IESBA Code) and
the additional ethical requirements applicable in Denmark. We have fulfilled our other ethical responsibilities in accordance with the IESBA Code, which is based on the fundamental principles of integrity, objectivity, professional competence and due care, confidentiality, and professional behavior.
PricewaterhouseCoopers are subject to the International Standard on Quality Control, ISQC 1, and thus apply a comprehensive quality control system, including documented policies and procedures concerning compli-ance with ethical requirements, professional standards and current statutory requirements and other regulation.
Auditor’s responsibility Our responsibility is to express a conclusion on the remuneration report based on our examinations. We conducted our examinations in accordance with ISAE 3000 Assurance Engagements Other than Audits or Reviews of Historical Financial Information and additional requirements under Danish auditor regulation to obtain reasonable assurance in respect of our conclusion.
As part of our examination, we checked whether the remuneration report contains the information required under section 139 b, subsection 3 of the Companies Act, number 1 - 6, on the remuneration of each individual member of the Executive Board and the Board of Directors.
We believe that the procedures performed provide a sufficient basis for our conclusion. Our examinations have not included proce-dures to verify the accuracy and completeness of the information provided in the remunera-tion report, and therefore we do not express any conclusion in this regard.
ConclusionIn our opinion the remuneration report, in all material respects, contains the information required under the Companies Act, section 139 b, subsection 3.
Hellerup, 3 February 2021
PricewaterhouseCoopersStatsautoriseret RevisionspartnerselskabCVR-no. 33 77 12 31
Lars BaungaardState Authorised Public Accountantmne23331
Rasmus Friis JørgensenState Authorised Public Accountant mne28705
Independent auditor’s report on remuneration report
Ørsted Remuneration report 2020 Contents
13 / 18
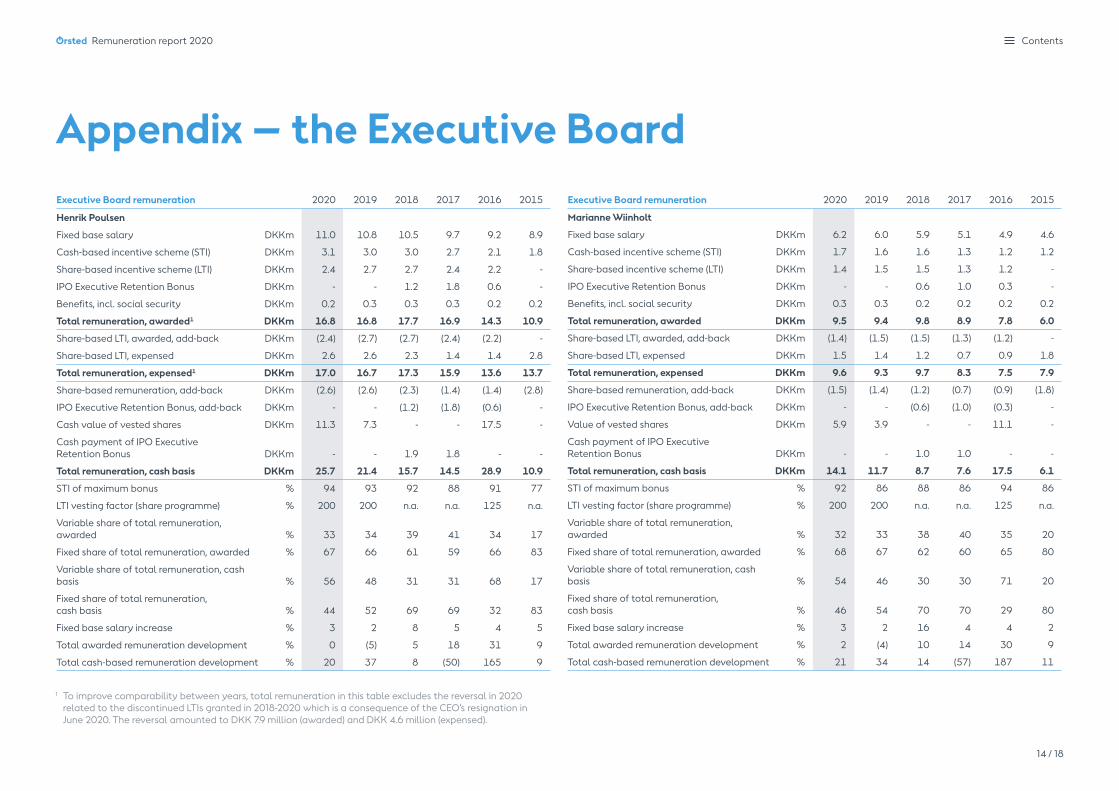
Appendix – the Executive BoardExecutive Board remuneration 2020 2019 2018 2017 2016 2015
Henrik Poulsen
Fixed base salary DKKm 11.0 10.8 10.5 9.7 9.2 8.9
Cash-based incentive scheme (STI) DKKm 3.1 3.0 3.0 2.7 2.1 1.8
Share-based incentive scheme (LTI) DKKm 2.4 2.7 2.7 2.4 2.2 -
IPO Executive Retention Bonus DKKm - - 1.2 1.8 0.6 -
Benefits, incl. social security DKKm 0.2 0.3 0.3 0.3 0.2 0.2
Total remuneration, awarded1 DKKm 16.8 16.8 17.7 16.9 14.3 10.9
Share-based LTI, awarded, add-back DKKm (2.4) (2.7) (2.7) (2.4) (2.2) -
Share-based LTI, expensed DKKm 2.6 2.6 2.3 1.4 1.4 2.8
Total remuneration, expensed1 DKKm 17.0 16.7 17.3 15.9 13.6 13.7
Share-based remuneration, add-back DKKm (2.6) (2.6) (2.3) (1.4) (1.4) (2.8)
IPO Executive Retention Bonus, add-back DKKm - - (1.2) (1.8) (0.6) -
Cash value of vested shares DKKm 11.3 7.3 - - 17.5 -
Cash payment of IPO Executive Retention Bonus DKKm - - 1.9 1.8 - -
Total remuneration, cash basis DKKm 25.7 21.4 15.7 14.5 28.9 10.9
STI of maximum bonus % 94 93 92 88 91 77
LTI vesting factor (share programme) % 200 200 n.a. n.a. 125 n.a.
Variable share of total remuneration, awarded % 33 34 39 41 34 17
Fixed share of total remuneration, awarded % 67 66 61 59 66 83
Variable share of total remuneration, cash basis % 56 48 31 31 68 17
Fixed share of total remuneration, cash basis % 44 52 69 69 32 83
Fixed base salary increase % 3 2 8 5 4 5
Total awarded remuneration development % 0 (5) 5 18 31 9
Total cash-based remuneration development % 20 37 8 (50) 165 9
Executive Board remuneration 2020 2019 2018 2017 2016 2015
Marianne Wiinholt
Fixed base salary DKKm 6.2 6.0 5.9 5.1 4.9 4.6
Cash-based incentive scheme (STI) DKKm 1.7 1.6 1.6 1.3 1.2 1.2
Share-based incentive scheme (LTI) DKKm 1.4 1.5 1.5 1.3 1.2 -
IPO Executive Retention Bonus DKKm - - 0.6 1.0 0.3 -
Benefits, incl. social security DKKm 0.3 0.3 0.2 0.2 0.2 0.2
Total remuneration, awarded DKKm 9.5 9.4 9.8 8.9 7.8 6.0
Share-based LTI, awarded, add-back DKKm (1.4) (1.5) (1.5) (1.3) (1.2) -
Share-based LTI, expensed DKKm 1.5 1.4 1.2 0.7 0.9 1.8
Total remuneration, expensed DKKm 9.6 9.3 9.7 8.3 7.5 7.9
Share-based remuneration, add-back DKKm (1.5) (1.4) (1.2) (0.7) (0.9) (1.8)
IPO Executive Retention Bonus, add-back DKKm - - (0.6) (1.0) (0.3) -
Value of vested shares DKKm 5.9 3.9 - - 11.1 -
Cash payment of IPO Executive Retention Bonus DKKm - - 1.0 1.0 - -
Total remuneration, cash basis DKKm 14.1 11.7 8.7 7.6 17.5 6.1
STI of maximum bonus % 92 86 88 86 94 86
LTI vesting factor (share programme) % 200 200 n.a. n.a. 125 n.a.
Variable share of total remuneration, awarded % 32 33 38 40 35 20
Fixed share of total remuneration, awarded % 68 67 62 60 65 80
Variable share of total remuneration, cash basis % 54 46 30 30 71 20
Fixed share of total remuneration, cash basis % 46 54 70 70 29 80
Fixed base salary increase % 3 2 16 4 4 2
Total awarded remuneration development % 2 (4) 10 14 30 9
Total cash-based remuneration development % 21 34 14 (57) 187 11
1 To improve comparability between years, total remuneration in this table excludes the reversal in 2020 related to the discontinued LTIs granted in 2018-2020 which is a consequence of the CEO’s resignation in June 2020. The reversal amounted to DKK 7.9 million (awarded) and DKK 4.6 million (expensed).
Ørsted Remuneration report 2020 Contents
14 / 18
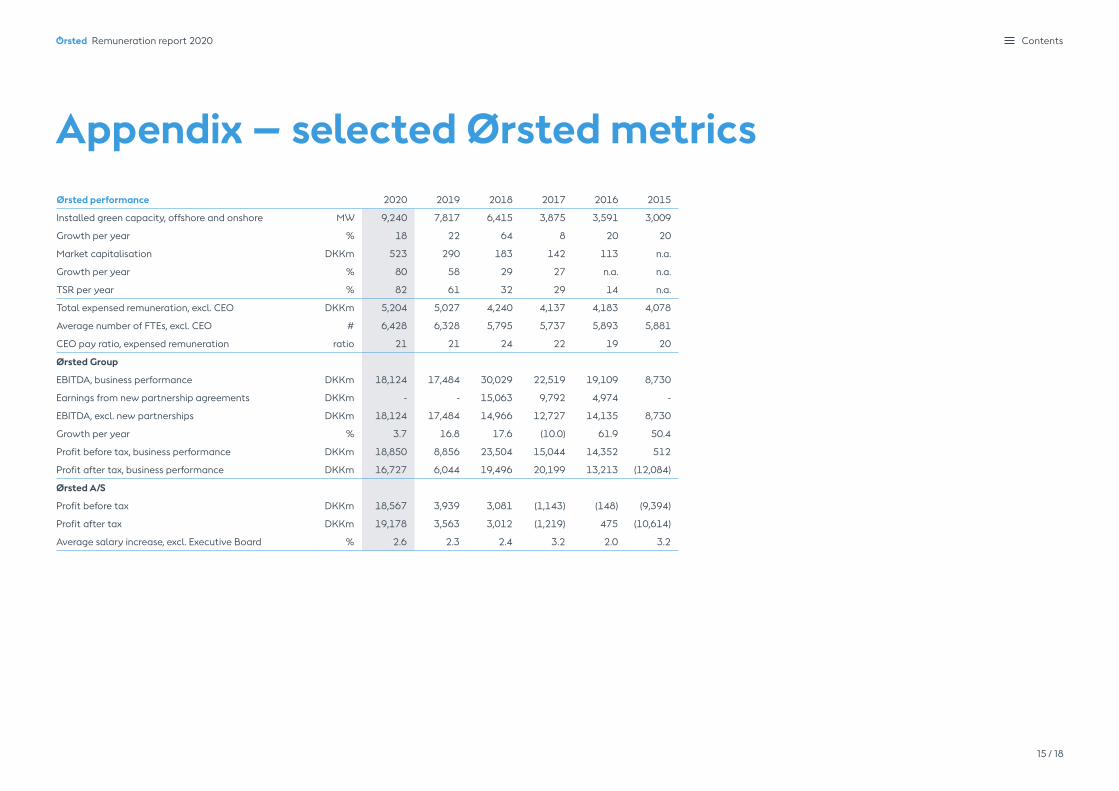
Ørsted performance 2020 2019 2018 2017 2016 2015
Installed green capacity, offshore and onshore MW 9,240 7,817 6,415 3,875 3,591 3,009
Growth per year % 18 22 64 8 20 20
Market capitalisation DKKm 523 290 183 142 113 n.a.
Growth per year % 80 58 29 27 n.a. n.a.
TSR per year % 82 61 32 29 14 n.a.
Total expensed remuneration, excl. CEO DKKm 5,204 5,027 4,240 4,137 4,183 4,078
Average number of FTEs, excl. CEO # 6,428 6,328 5,795 5,737 5,893 5,881
CEO pay ratio, expensed remuneration ratio 21 21 24 22 19 20
Ørsted Group
EBITDA, business performance DKKm 18,124 17,484 30,029 22,519 19,109 8,730
Earnings from new partnership agreements DKKm - - 15,063 9,792 4,974 -
EBITDA, excl. new partnerships DKKm 18,124 17,484 14,966 12,727 14,135 8,730
Growth per year % 3.7 16.8 17.6 (10.0) 61.9 50.4
Profit before tax, business performance DKKm 18,850 8,856 23,504 15,044 14,352 512
Profit after tax, business performance DKKm 16,727 6,044 19,496 20,199 13,213 (12,084)
Ørsted A/S
Profit before tax DKKm 18,567 3,939 3,081 (1,143) (148) (9,394)
Profit after tax DKKm 19,178 3,563 3,012 (1,219) 475 (10,614)
Average salary increase, excl. Executive Board % 2.6 2.3 2.4 3.2 2.0 3.2
Appendix – selected Ørsted metrics
Ørsted Remuneration report 2020 Contents
15 / 18

Appendix – the Board of DirectorsRemuneration of the Board of Directors, DKK ’000
2020 2019 2018 2017 2016 2015
Annual fee
ARC and NRC2 fees Total
Annual fee
ARC and NRC2 fees Total
Annual fee
ARC and NRC2 fees Total
Annual fee
ARC and NRC2 fees Total
Annual fee
ARC and NRC2 fees Total
Annual fee
ARC and NRC2 fees Total
Thomas Thune Andersen 977 130 1,108 977 130 1,108 960 128 1,088 960 128 1,088 960 128 1,088 500 50 550
Lene Skole 652 81 733 652 81 733 640 104 744 640 163 803 640 48 688 250 - 250
Lynda Armstrong 326 81 407 326 68 394 320 - 320 320 - 320 320 - 320 146 - 146
Dieter Wemmer 326 195 521 326 179 505 267 80 347 - - - - - - - - -
Jørgen Kildahl 326 98 423 326 81 407 267 - 267 - - - - - - - - -
Peter Korsholm 326 98 423 326 98 423 320 96 416 267 80 347 - - - - - -
Hanne Sten Andersen (resigned in August 2020) 217 - 217 326 - 326 320 - 320 320 - 320 320 - 320 175 - 175
Benny Gøbel 326 - 326 326 - 326 320 - 320 320 - 320 320 - 320 175 - 175
Ole Henriksen 109 - 109 - - - - - - - - - - - - - - -
Dainel Tas Sandermann 109 - 109 - - - - - - - - - - - - - - -
Poul Dreyer (resigned in August 2020) 217 - 217 326 - 326 320 - 320 320 - 320 320 - 320 175 - 175
Pia Gjellerup (resigned in March 2019) - - - 81 21 102 320 80 400 320 80 400 320 80 400 175 25 200
Benny D. Loft (resigned in March 2019) - - - 81 49 130 320 192 512 320 192 512 512 - 512 175 100 275
Jens Nybo Stilling (resigned in March 2018) - - - - - - 80 - 80 320 - 320 12 192 320 175 - 175
Martin Hintze1 (resigned in March 2017) - - - - - - - - - - - - - - - - - -
Poul Arne Nielsen (resigned in March 2017) - - - - - - - - - 80 - 80 320 - 320 175 - 175
Claus Wiinblad (resigned in March 2017) - - - - - - - - - 80 24 104 320 96 416 175 50 225
Jørgen P. Jensen (resigned in March 2015) - - - - - - - - - - - - - - - 75 - 75
Total 3,911 683 4,593 4,073 707 4,780 4,454 680 5,134 4,267 667 4,934 4,480 544 5,024 2,371 225 2,596
Increase in board remuneration (4 %) (7 %) 4 % (2 %) 94 % 5 %
Ordinary board fee 326 326 320 320 320 175
Increase in ordinary board fee 0 % 2 % 0 % 0 % 83 % 0 %
Ørsted, global avg. base salary increase 2.3 % 3.0 % 2.9 % 2.6 % 2.4 % 1.9 %
1 Martin Hintze waived his right to receive board remuneration.2 ARC stands for Audit & Risk Committee, and NRC stands for Nomination & Remuneration Committee.
Ørsted Remuneration report 2020 Contents
16 / 18

Appendix – share programme dates and periods
Performance periodTSR 152 %
TSR 192 % (of which, share price 175 %)
Vesting periodGrant to settlement period
February year 1 April year 1 April year 3
Grant date
Share price calculated based on the first five trading days after publication of the annual report
End of performance period
Share price calculated based on the first five trading days in April three years after grant
Start of performance period
Share price calculated based on the first five trading days in April in year of grant
Award date
1 April in year of grant
Vesting date
Date of the interim financial report for the first quarter three years after year of grant
Ørsted Remuneration report 2020 Contents
17 / 18

Ørsted A/SKraftværksvej 53DK-7000 Fredericia Tel.: +45 99 55 11 11CVR no. 36213728
orsted.com
Media RelationsMartin BarleboTel.: +45 99 55 95 52
Design and layoute-Types with Ørsted Global Design
Publication3 February 2021