REMOVING LIMITS. - DeufolANNUAL REPORT #2016 Packaging. Next level. Figures in € million 2016 2015...
104
REMOVING LIMITS. AROUND THE WORLD. EVERY DAY. ANNUAL REPORT #2016 Packaging. Next level.
Transcript of REMOVING LIMITS. - DeufolANNUAL REPORT #2016 Packaging. Next level. Figures in € million 2016 2015...

REMOVING LIMITS.AROUND THE WORLD. EVERY DAY.
ANNUAL REPORT #2016
Packaging. Next level.

Figures in € million 2016 2015 ± (%)
Results of operations
Total sales 341.0 324.8 5.0
Germany 175.7 170.9 2.8
Rest of the World 165.2 153.9 7.3
Ratio of foreign sales (%) 48.5 47.4 2.3
EBITDA 19.2 15.6 23.1
EBIT(A) 9.4 8.2 14.6
EBT 5.7 5.5 3.6
Income tax income (expenses) (1.1) (1.9) (42.1)
Result for the period 4.63 3.59 29.0
thereof noncontrolling interests (0.43) 0.30 (243.3)
thereof shareholders of the parent company 5.06 3.30 53.3
Earnings per share (EPS), (€) 0.118 0.075 57.3
Assets structure
Noncurrent assets 151.9 137.1 10.8
Current assets 86.6 87.5 (1.0)
Balance sheet total 238.5 224.6 6.2
Equity 108.1 102.4 5.6
Liabilities 130.4 122.2 6.7
Equity ratio (%) 45.3 45.6 (0.7)
Net financial liabilities 46.9 39.4 19.0
Cash flow/investments
Cash flow from operating activities 12.0 5.5 118.2
Cash flow from investing activities (5.9) (2.9) 103.5
Cash flow from financing activities (4.9) (4.3) 14.0
Investments in property, plant and equipment 9.1 5.2 75
Employees
Employees (average) 2,899 2,641 9.8
Personnel costs 111.7 103.2 8.2
Overview of the Deufol Group

091 FACTS & FIGURES
092 Information on Deufol SE
092 Income Statement of Deufol SE
093 Balance Sheet of Deufol SE
094 Significant Equity Investments of Deufol SE
095 Glossary
096 Consolidated Key Figures – Five-Year Overview
098 Operational Investments of Deufol SE
100 Imprint
039 CONSOLIDATED FINANCIAL STATEMENTS
040 Consolidated Income Statement
040 Consolidated Statement of Comprehensive Income
041 Consolidated Balance Sheet
042 Consolidated Cash Flow Statement
043 Consolidated Statement of Changes in Equity
044 NOTES TO THE CONSOLIDATED FINANCIAL STATEMENTS
044 General Information
044 Basis of Preparation
054 Scope of Consolidation
059 Consolidated Income Statement Disclosures
064 Consolidated Balance Sheet Disclosures
075 Consolidated Cash Flow Statement Disclosures
076 Other Disclosures
083 Segment Information by Region and Services
086 Supplementary Disclosures
089 Auditors’ Report
003 TO OUR SHAREHOLDERS
004 Foreword by the Managing Directors
006 Report of the Administrative Board
011 SUMMARIZED MANAGEMENT REPORT
012 Operational Principles of the Group
017 Report on the Economic Environment
028 Single-Entity Financial Statements of Deufol SE
030 Risk Report
035 Report on Dependence, Report on Opportunities and Expected Developments
Table of Contents
001

93 LOCATIONS IN 11 COUNTRIESON 3 CONTINENTS.
To enable our customers to continue to grow, we too have grown. Through our merger with RIEDER® in Austria, we have further expand-ed our global network for IT-based packag-ing and logistics solutions. The strategically important port of Antwerp also represents a signifi cant expansion of our network of lo-cations. We have achieved this through our acquisition of Novaedes, the Belgian market leader for export packaging. To meet the re-quirements of the digital networking which is necessary for Industry 4.0 as well as fl ex-ible but nonetheless highly automated series production, in 2016 we laid the foundation stone for our new production plant in Cheb (Czech Republic). As the market leader, we are now even better placed to meet our cus-tomers’ individual requirements, even more rapidly and even more effectively.
MOVING FORWARD. TOGETHER.
ANTWERP

93 OPERATIONS
11 COUNTRIES
003 TO OUR SHAREHOLDERS
004 Foreword by the Managing Directors
006 Report of the Administrative Board

Foreword by the Managing Directors
Fiscal Year 2016
Dear shareholders and business partners,
Dear colleagues,
It was not just investors who were kept spellbound by the Brexit vote, Donald Trump’s
election as the president of the United States of America and the refugee crisis in 2016.
However, the associated risk of a weak economic trend has not materialized. In Germany
in particular, the economy has proved to be highly robust and has even gained ground.
Moreover, the Eurozone – which is of critical importance for the DEUFOL Group – contin-
ued its modest recovery in 2016.
In 2016, the DEUFOL Group registered sales growth of 5.4 % and EBIT growth of 15 %.
We expect that the economic environment will remain favorable for DEUFOL in 2017.
In 2016, the flourishing German economy enjoyed its strongest level of growth in the
past five years. To ensure that our customers can likewise achieve further growth, we have
further expanded our global network for IT-based packaging and logistics solutions in the
field of industrial packaging. For in 2016, we continued to uphold our motto: WE FOCUS
ON PACKAGING + SUPPLY CHAIN LIMITS AND REMOVE THEM. While the DEUFOL Group
mainly achieved organic growth in 2015, 2016 was also shaped by external growth. Acquisi-
tions of new locations enabled us to strengthen our network, our market presence and our
know-how in a targeted fashion.
On the one hand, through the merger of our subsidiary DEUFOL Austria with the RIEDER
Group, the leading all-round provider in the packaging services segment in Austria. Here,
as the market leader through our IT solutions together with our international network we
are now able to offer even better and more goal-oriented and customer-specific solutions in
the packaging market, including upstream and downstream stages of the value chain.
Our acquisition of the Belgian market leader for export packaging, Novaedes, and the as-
sociated locations marked another important and far-sighted step in strengthening our busi-
ness. The reinforcement of our physical presence close to our central European customers
and the expansion of DEUFOL’s HUB network thanks to the strategically important port of
Antwerp – the largest handling facility for break bulk in Europe – represent decisive and far-
sighted steps in order to expand our range of services. This will enable us to serve all of our
customers’ locations even more rapidly and even more effectively. Together with our innova-
tive, digital real-time solutions in the field of export packaging and logistics, this acquisition
marks a landmark step for further optimization of the transparency and reliability of our
global value chain for our customers.
Through these acquisitions, Deufol is continuing to focus on its core competences, which
we see as lying in the field of industrial packaging and related services. In this respect, in
2016 we let go of some business divisions with low value added or a strongly divergent stra-
tegic focus and plan to implement further such steps in future.
004 To Our Shareholders Foreword by the Managing Directors

A further DEUFOL location in a geographically central location was added to the DEUFOL
network in 2016. Our new production plan in Cheb, Czech Republic, offers the digital
networking which is necessary for Industry 4.0 as well as flexible and standardized series
production. The shortening of the “time-to-market” packaging process necessitated the
decision to invest in a new location.
Accordingly, the DEUFOL Group now comprises 93 locations in 11 countries and on
3 continents, thus supporting our customers’ competitiveness in global markets through
a comprehensive range of packaging and other services. We appreciate our customers’
diversity as much as we appreciate the diversity of our own employees. Underpinned by
strong foundations, in 2016 the DEUFOL Group developed and rolled out its DEUFOL
EXPERT PROGRAM, or “DEXPRO” for short. DEXPRO supports, encourages and moti-
vates our employees worldwide. It develops management and employee skills, improves
communication channels and brings to life the vision of the DEUFOL Group. We thus
ensure continuous optimization of our internal processes and services. The performance
capacity of the DEUFOL Group is based on that of its employees.
Through this continuous improvement of our services and thanks to healthy organic
growth, we increased sales in Germany by 3 % in 2016; we also achieved significant im-
provements in our EBIT and our EBIT margin. In the Rest of Europe, sales rose by 20 %
due to our acquisitions. The EBIT figure fell slightly short of the previous year’s result. In
the USA, our sales and EBIT figures were slightly lower than the previous year’s figures
but remained at a high level. On the other hand, in China at € 4.5 million sales tripled and
our EBIT figure almost doubled.
The fact that a stock market listing entails not insignificant costs prompted our deci-
sion in 2015 to delist. Since this time, DEUFOL shares can be traded through SCHNIGGE
Wertpapierhandelsbank SE.
For our company’s future development, we will continue to rely on the continuous im-
provement of our services as well as optimized fulfillment of the requirements of our custom-
ers. Thanks to our open and cooperative business culture and our focus on digital processes,
we consider that we are well placed for the future. We remain true to our motto: WE FOCUS
ON PACKAGING + SUPPLY CHAIN LIMITS AND REMOVE THEM.
As you can see, an eventful and successful year lies behind us, in which we repositioned
ourselves as a corporate group in many respects. We would like to thank our business part-
ners, our shareholders and our dedicated employees for a consistently constructive and
trusting working relationship.
Yours sincerely,
The Managing Directors
Klaus Duttiné, Dennis Hübner, Detlef W. Hübner, Jürgen Schmid
005To Our ShareholdersForeword by the Managing Directors

Report of the Administrative Board
In the following report the Administrative Board provides notice of its key activities in fiscal
year 2016. Deufol SE is managed by its Administrative Board (“one-tier system”), which de-
termines the basic profile of its activities and monitors their implementation by the manag-
ing directors. The key areas of the Administrative Board’s management, supervisory and ad-
visory activities, the audit of the annual and consolidated financial statements, relationships
with associates and changes to the executive bodies are commented on below.
The Administrative Board has performed the duties assigned to it by law as well as the
Articles of Association and the by-laws. It has managed the Company, determined the ba-
sic profile of its activities and monitored their implementation by the managing directors.
The Administrative Board was directly involved in all decisions of fundamental importance
for the Company. This is based in particular on a detailed catalog of transactions requir-
ing the prior approval of the Administrative Board, which is contained in the by-laws for
the managing directors.
During the reporting period, the managing directors informed the Administrative Board,
both verbally and in writing, of all relevant issues concerning the Company’s position and
material business transactions. The Administrative Board received a monthly report consist-
ing of a current income statement, balance sheet and cash flow statement for the Group as
well as overviews of the development of sales, operating results and other indicators for the
individual subsidiaries together with target / actual comparisons and corresponding prior-pe-
riod figures. The Administrative Board regularly submitted questions to the managing direc-
tors on the basis of these data, which the managing directors then answered accordingly.
The Administrative Board regularly and promptly received the minutes of the meetings
of the managing directors as well as up-to-date reports on trends not documented in special
minutes. There was frequently a comprehensive exchange of opinions between the Adminis-
trative Board and the managing directors on these issues. In addition, the members of the Ad-
ministrative Board maintain regular verbal and written contact with the managing directors.
006 To Our Shareholders Report of the Administrative Board

Meetings of the Administrative Board
The Administrative Board considered the reports of the managing directors and other
decision papers in a total of five meetings and also in frequent electronic and telephone
conversations and discussed them in detail with the managing directors.
In six cases, resolutions were adopted outside meetings. These urgent decisions, that
could not be delayed until a regular Administrative Board meeting, were preceded by an
in-depth exchange of information by e-mail and telephone. At three out of the five meetings
held, two Administrative Board members excused themselves from attending in each case.
Otherwise, all of the members of the Administrative Board attended all of its meetings; none
of its members attended less than half of them.
Key Topics of Discussion
In the period under review, Deufol’s current sales and results of operations in its individual
business segments – with a particular focus on its business activities in Germany, Belgium,
Austria and the USA as well as its future business development in these fields – were a stra-
tegic priority for the Administrative Board’s discussions with the managing directors. Deufol
continued to focus on further optimization of its production locations in the Industrial Packag-
ing segment in Germany and the Czech Republic in 2016. The goals here are optimized use
of resources and the improvement of software-based business processes, which will then
improve performance through synergy-based cost savings.
As in previous years, the Administrative Board also intensively discussed the action for
damages against the Company’s former Executive Board members Andreas Bargende and
Tammo Fey as well as other former executives.
Finally, the expansion of the Deufol network through external acquisitions in Austria
and Belgium and the integration of these acquisitions in the existing Group were a further
core aspect of the Administrative Board’s work.
007To Our ShareholdersReport of the Administrative Board

Audit of the Single-Entity and Consolidated Financial Statements
In accordance with the resolution passed by the Annual General Meeting on June 30, 2016
and the subsequent audit engagement issued by the Administrative Board, the annual
financial statements for the fiscal year from January 1 to December 31, 2016 prepared by the
managing directors in accordance with the German Commercial Code and the management
report of Deufol SE were audited by Votum AG, Wirtschaftsprüfungsgesellschaft, Frankfurt
am Main, and issued with an unqualified audit opinion.
The consolidated financial statements of Deufol SE were prepared in accordance with
the International Financial Reporting Standards as stipulated by section 315 a of the Ger-
man Commercial Code. The auditors issued the consolidated financial statements and the
Group management report with an unqualified audit opinion.
All documents relating to the annual financial statements, including the management re-
port and Group management report, the managing directors’ proposal for the appropriation
of net profit and the audit reports issued by the auditors, were presented to the Administra-
tive Board. The Administrative Board examined these documents and discussed them in the
presence of the auditors. The Administrative Board concurred with the results of the audit
and, based on the results of its own examination, did not raise any objections. On April 26,
2017, the Administrative Board endorsed the annual financial statements of Deufol SE for
2016 and the consolidated financial statements. The annual financial statements have thus
been approved. The Administrative Board also approved the managing directors’ proposal
for the appropriation of net profit.
008 To Our Shareholders Report of the Administrative Board

Report on Dependence
The managing directors have also compiled a report regarding the Company’s relationships
with associates and presented this to the Administrative Board together with the audit report
produced by the auditors. The auditors have issued the following audit opinion for the report:
“In accordance with our due audit and assessment, we confirm that
1. the factual information in the report is correct,
2. for the legal transactions stated in the report the Company’s performance was not in-
appropriately high or disadvantages were balanced out,
3. in respect of the measures stated in the report, there are no factors suggesting an assess-
ment significantly different from that of the managing directors.”
Within the framework of its own audits of the report regarding the Company’s relationship
with associates, the Administrative Board has determined that no objections are applicable
and agrees with the auditors’ findings.
Administrative Board
Pursuant to the resolution passed by the Annual General Meeting held on July 1, 2015, the
existing members of the Administrative Board were reappointed for a new two-year term.
The members of the Administrative Board subsequently elected Mr. Detlef W. Hübner as the
chairman and Mr. Helmut Olivier as the deputy chairman of the Administrative Board. The
by-laws of the Administrative Board remain applicable as before.
Hofheim, April 28, 2017
For the Administrative Board
Detlef W. Hübner
Chairman
009To Our ShareholdersReport of the Administrative Board

IF IT IS POSSIBLE TO MAKE THINGS BETTER, WE WILL DO SO.
Improvements throughout the supply chain – holistically and effectively – that is the ob-jective of our Deufol Data Connect System. Deufol developed this to meet our customers’ requirements. We adapt our services in line with prevailing challenges and permanently develop further new and intelligent IT solu-tions. For instance, these include the CPC Tracker (Connected Pack Control), which re-cords and transmits in real time information such as temperature, humidity, pressure, vi-bration, movement, inclination and light inten-sity data. It thus ensures the necessary level of transparency for fl ows of goods, enabling you to keep track of every detail. At any time.
ALWAYS IN TOUCH WITH YOUR BUSINESS.

011 SUMMARIZED MANAGEMENT REPORT
012 Operational Principles of the Group
017 Report on the Economic Environment
028 Single-Entity Financial Statements of Deufol SE
030 Risk Report
035 Report on Dependence, Report on Opportunities and Expected Developments
Operational Principles of the GroupOrganizational Structure and Business Fields
Structure of the Deufol Group
The Deufol Group (together with its key subsidiaries and investments) is a global premium
service provider in the field of packaging and related services. Deufol SE is the Group’s
parent company and is seated in Hofheim am Taunus. It has direct or indirect interests in
key Group companies which handle operating business in the individual countries. Overall,
on the balance sheet date 42 direct and indirect subsidiaries were included in the consoli-
dated group of Deufol SE. Of these companies, 18 were German companies while 25 were
domiciled in other countries. Please see the chapter “Facts & Figures” on page 91 for a
summary of our operationally active investments and their corporate structure.
Organization and Management
Deufol SE operates as a European company (Societas Europaea, SE). Deufol SE has a one-
tier management system and its Administrative Board acts as a uniform management body.
The Company’s managing directors handle its business in accordance with prevailing law,
the Articles of Association, the by-laws for the managing directors and the guidance of the
Administrative Board, by fulfilling the basic tasks and instructions specified by the Admin-
istrative Board.
As a management holding company Deufol SE does not have any client business and in-
stead mainly handles management and control tasks. These include defining and developing
strategic business fields, acquiring strategic customers and partners, appointments to man-
agement positions and control of the flow of capital within the Group.
The managing directors and site managers are responsible for on-site management of
operational processes, with due consideration of regional specifics. Management is in the
form of annual budget planning, individual target agreements in line with the Company’s
strategic orientation as well as regular meetings and monthly reviews. In addition, internal
corporate governance guidelines specify consent requirements for specific types of transac-
tions, e. g. investment schemes exceeding a specific volume.
As a global premium service provider, in general we offer our services at all of our loca-
tions and benefit from extensive international experience. We have divided up our exper-
tise into the following three service areas:
Export & Industrial Packaging
Automated Packaging and Promotional & Display Packaging
Supplementary Services
012 Management Report Operational Principles of the Group
Organizational Structure and Business Fields

Export & Industrial Packaging
The Export & Industrial Packaging service group mainly comprises packaging activities for
manufacturers in the mechanical and plant engineering sector. This includes computer-
based construction of packaging, individual and serial crate production, export packaging
logistics, sea freight, air freight and hazardous goods packaging as well as the management
of major industrial projects. Our proprietary IT solutions, our high-quality CAD crate design
and our software support system for management of separate parts within the scope of the
packaging process are key factors in our success. In our Export & Industrial Packaging seg-
ment, we also provide further industrial services such as disassembly and assembly services,
on-site management and spare parts warehousing, including the necessary IT solutions.
Automated Packaging and Promotional & Display Packaging
Our Automated Packaging and Promotional & Display Packaging services comprise con-
sumer goods packaging services. They include the entire spectrum from fully automated
packaging of bulk commodities using high-tech machinery to manual stocking of excep-
tionally eye-catching displays. We ensure the continuous development of our range of ser-
vices as integrated services and provide support services for the packaging process such
as labeling, repackaging, distribution logistics and transport and document management.
Supplementary Services
This comprises services such as warehouse planning and management, handling small volumes
and samples, commissioning, contract and spare parts logistics and value-added services.
Business Development and Operational Responsibility
Business Development comprises all activities associated with the development of our exist-
ing business operations globally and at all of our locations. Besides operational responsibility
for ensuring the smooth handling of day-to-day business, the site managers are responsible
for maintaining and developing local customer relationships as well as developing new ones.
Each site manager works hand in hand with Business Development. Interdisciplinary teams
of experts are thus able to handle, in particular, major and even international tenders – in a
targeted manner which focuses on the benefits for the customer.
013Management ReportOperational Principles of the Group
Organizational Structure and Business Fields

Assets by region
Figures in € million
78.5 Germany
110.1 Rest of Europe
53.5
USA /
Rest of the World
Employees by region
Deufol Group
1,625 Germany
776 Rest of Europe
498
USA /
Rest of the World
Locations of the Deufol Group
Globally Positioned with Locations in Eleven Countries
In connection with the business activities of the Deufol Group, the terms “location” and
“sales market” are more or less synonymous. As a service provider we mainly provide our
services on a customer- and project-specific basis; as a rule, sales occur where the service
is provided.
In Germany, as of December 31, 2016 we had around 54 locations which account for a
total of 51.4 % of Group sales. The Rest of Europe – which accounts for around 24.5 % of the
Group’s business – comprises 32 operational facilities in Belgium, the Netherlands, France,
Italy, Austria, the Czech Republic and Slovakia.
ChinaUSA
Sales by region
Figures in € million
175.1 Germany
83.5 Rest of Europe
81.8
USA /
Rest of the World
014 Management Report Operational Principles of the Group
Locations of the Deufol Group

We have 6 locations in the USA / Rest of the World, which contribute approx. 24.0 % of
sales. Our business in the USA is handled through our two main locations in Charlotte and
Sunman. We have four locations in Asia. Overall, we have 3 locations in the People’s Re-
public of China. As well as our existing location in Suzhou, in Yantai and Taicang we have
2 locations which we operate together with joint venture partners. We also have a plant in
Singapore. The Deufol Group’s geographical presence is shown in the following diagram.
Number of locations
Germany 54
Rest of Europe 32
USA / Rest of the World 6
Europe
015Management ReportOperational Principles of the Group
Locations of the Deufol Group

Region-Oriented Segment Structure
The management and reporting structure of Deufol SE is based on the following geo-
graphical regions which are summarized for management purposes:
Germany
Rest of Europe
USA / Rest of the World
Competition Environment
High Level of Customer Loyalty, Varying Levels of Competition
The Deufol Group provides its services in a range of different competitive scenarios through
its presence in various regions. In 2016 Export & Industrial Packaging maintained its strong
market position in Germany. This is a fragmented market, and as one of the key players
Deufol is able to exploit economies of scale.
The orientation of the Automated Packaging segment is mainly product-specific and in
accordance with customer relationships. Due to the frequently strong level of integration
with customers, this sector is only subject to limited competition. Competition is stronger
in Promotional & Display Packaging due to the high volume of manual work.
For our Supplementary Services – particularly warehouse logistics – the intensity of com-
petition varies since in-house outsourcing divisions are generally subject to a lower degree
of competition due to their close relationship with customers. Where warehouse logistics is
provided in so-called “multi-user structures”, i. e. with multiple customers at a single ware-
house, the Deufol Group does business in a highly competitive environment. Successful
future performance here hinges on providing customer-specific additional services.
Research and Development
No Conventional Research Expenditure
A service provider such as the Deufol Group does not have any conventional R & D expen-
diture. Instead, we constantly develop new products, innovative services and IT solutions
for increased process efficiency, while preparing new projects or through close coopera-
tion with our customers.
Notes 40, 41
016 Management Report Operational Principles of the Group
Locations of the Deufol Group
Competition Environment
Research and Development

Report on the Economic EnvironmentEconomic Outline Conditions
World Economy: Upwards Trend Despite Risks in 2016
According to the Kiel Institute for the World Economy, the global economy strengthened in
2016 despite an increased level of political uncertainty. The change of government in the
USA evidently stirred hopes of strong economic policy-based momentum there, while in
Europe the euro’s devaluation against the dollar had a supportive effect. However, in view
of various structural obstacles which remain in place a strong global upturn is not in pros-
pect. In the second half of 2016, global gross domestic product increased by 1.8 % and
thus almost exactly matched the average rate of growth since the end of the global finan-
cial crisis in 2009. The trend for global trade remains weak. In 2016, growth amounted to
just 1.8 %. This growth is very low by comparison with the global gross domestic product
figure (weighted in line with purchasing-power parities), which at 3.1 % in the fourth quar-
ter of 2016 was higher than in the previous year.
Momentum has picked up in the advanced economies. The outcome of the US presi-
dential election buoyed stock markets worldwide. At the same time, the measured level of
economic uncertainty has increased, particularly outside of the United States. Due to the
size of the US economy, the USA’s economic policy decisions are highly significant for the
entire world economy. Announcements to date point to a clearly expansionary fiscal pol-
icy. However, a protectionist trade policy would represent a risk for the global economy.
Continuing Moderate Growth in the Eurozone
The Eurozone’s economic recovery continued at a moderate pace. In the second half of 2016,
overall economic output increased by 0.8 % and has thus been continuously buoyant for al-
most four years now. Of the major countries, Italy’s upward trend remained weak. At 12 %,
unemployment in the Eurozone excluding Germany is still significantly higher than before the
financial crisis, when it amounted to a good 7 %.
However, all in all the positive factors in the Eurozone remain intact. Unemployment is
continuing to fall, many leading indicators are clearly on an upward trajectory and the econ-
omy will remain buoyed by very low interest rates as well as the euro’s low external value. In
the EU countries outside of the Eurozone, the economic trend gathered pace in the second
half of 2016 in particular and remains highly robust. To date, nor has the United Kingdom’s
decision to withdraw from the EU had any impact on this.
In 2016 as a whole, the moderate level of output growth was disproportionately limited
to the private services sector. In particular, trade and transport and the information and
communications sector contributed to growth in this sector. However, the structural con-
solidation of public budgets ground to a halt in 2016. While the budget deficit decreased
due to one-off factors which ceased to apply in 2016, the structural deficit increased, above
all due to the expansionary policy adopted in countries such as Spain and France. A risk
thus continues to apply in terms of the future economic development of the EU.
017Management ReportReport on the Economic Environment
Economic Outline Conditions

Sales
Figures in € million 2016 2015 2014 2013 2012
Rest of the World
Germany
Consolidated sales by segment
Figures in € million 2016 2015
51.4 % Germany 175.1 170.2
24.5 % Rest of Europe 83.5 70.7
24.0 % USA / Rest of the World 81.8 83.2
0.1 % Holding company 0.6 0.7
100.0 % Total 341.0 324.8
Germany: the Upturn Continues
According to the Kiel Institute for the World Economy, in 2016 Germany’s gross domes-
tic product increased by 1.9 %, compared to 1.7 % in 2015. Investments are thus slowly
picking up again. However, investments in equipment generally remained weak in 2016,
but should gradually pick up steam in 2017 due to the robust global economy. In the past
two years, the level of investment in equipment was very low due to various uncertainties
in the international environment. Moreover, exports are increasingly significant as the
world economy recovers and should buoy the upturn in Germany from 2017 onwards at
the latest.
The upswing in Germany has thus now completed its fourth consecutive year. Various
leading indicators are also providing further growth signals for 2017. German industry’s
order books are well filled. According to the ifo Institute’s business climate survey, the
assessment of the business situation recently reached a five-year high. In line with this
trend, the labor market remains highly robust.
Exports increased by 2.6 % in 2016. This figure is clearly lower than in the previous year.
While exports are benefiting from the continuing recovery in the Eurozone as well as the
more stable economic situation in China, other key sales markets such as the USA and the
United Kingdom registered negative momentum. Consumption significantly increased. In
particular, this relates to public consumption, which in 2016 reached its highest level since
1992 due to the refugee situation. On the other hand, investments in equipment increased by
just 1.0 % but should pick up again in 2017, since the overall outline conditions are highly
positive with a generally rising level of capacity utilization.
Results of Operations
Sales
In an uncertain overall economic environment, as outlined above, in the period under re-
view sales amounted to € 341.0 million and rose by 5.0 % (previous year: € 324.8 million).
We have thus exceeded our planning targets, which had envisaged sales in a range of
between € 320 million and € 335 million. Adjusted for changes to the consolidated group
through which sales of € 14.8 million were added for the first time, the change in Group sales
amounts to + 0.4 %. Given the virtually unchanged intrayear dollar exchange rate, exchange
rate fluctuations did not play any role. Our overall operating performance amounted to
€ 353.4 million (previous year: € 333.5 million).
Anhang 01, 41
319325341
299
48 %
52 %
333
018 Management Report Report on the Economic Environment
Economic Outline Conditions
Results of Operations
Sales

German Business Registers Slight Sales Growth
In the past year, Germany did not consolidate any further its role as the Deufol Group’s most
important sales market. With a sales volume of € 175.1 million (previous year: € 170.2 mil-
lion) in the past fiscal year, it contributed 51.4 % (previous year: 52.4 %) to Group sales.
The Rest of Europe segment provided 24.5 % (previous year: 21.8 %) of Group sales,
with a sales volume of € 83.5 million (previous year: € 70.7 million). € 14.8 million of this
sales growth was due to companies included in the scope of consolidation for the first time.
In the USA / Rest of the World segment, sales fell slightly to € 81.8 million (previous year:
€ 83.2 million). This means that this segment now represents around 24.0 % (previous year:
25.6 %) of Group activities.
Export & Industrial Packaging Increases Share of Sales
With a share of sales of approx. 56.3 % (previous year: 52.0 %), Export & Industrial Pack-
aging is the Group’s most important business segment. Sales realized in Consumer Pack-
aging decreased slightly, from 37.8 % to 34.5 %. The contribution provided by Supplemen-
tary Services declined from 10.0 % to 9.1 %.
Operating Costs Ratio Slightly Lower on Balance
At 45.1 % (previous year: 47.3 %), the ratio of the cost of materials to Deufol’s overall
operating performance significantly declined. The share accounted for by raw materials,
consumables and supplies and purchased merchandise has increased slightly to 24.7 %
(previous year: 24.5 %), while the share of purchased services has decreased signifi-
cantly to 20.4 % (previous year: 22.8 %).
At € 111.7 million (previous year: € 103.2 million), in absolute and relative terms per-
sonnel costs were higher and amounted to 31.6 % (previous year: 30.9 %) of Deufol’s
overall operating performance. The absolute increase in personnel costs is attributable to
the sales-related growth in the average number of employees, in connection with our ef-
forts to cover key areas of expertise in-house. In the past fiscal year, the Deufol Group
had 2,899 employees (previous year: 2,641).
At € 9.8 million, depreciation is € 2.4 million higher than in the previous year. This
includes extraordinary depreciation in the amount of € 2.0 million.
Total other operating expenses have increased significantly (+ € 6.1 million to € 63.1 mil-
lion); the expense ratio has risen from 17.1 % to 17.8 %.
Overall, the costs ratio has decreased slightly to 97.3 % (previous year: 97.5 %) of
Deufol’s overall operating performance. This corresponds to an increase in the EBITA
margin from 2.5 % to 2.7 %.
Note 41
Note 42
Notes 02 – 05
Consolidated sales by services
Figures in € million 2016 2015
Export & Industrial Packaging 191.9 168.9
Share (%) 56.3 52.0
Consumer & Data Packaging 117.5 122.6
Share (%) 34.5 37.8
Supplementary Services 30.9 32.6
Share (%) 9.1 10.0
Holding company 0.6 0.7
Share (%) 0.1 0.2
Total 340.9 324.8
Cost development
Figures in € million 2016 2015
Cost of materials 159.4 157.7
as % of overall operating performance 45.1 47.3
Personnel costs 111.7 103.2
as % of overall operating performance 31.6 30.9
Depreciation, amortization
and impairment 9.8 7.4
as % of overall operating performance 2.8 2.2
Other operating expenses 63.1 57.0
as % of overall operating performance 17.8 17.1
Total 344.0 325.3
as % of overall operating performance 97.3 97.5
019Management ReportReport on the Economic Environment
Results of Operations
Costs

Income Development
Figures in € million 2016 2015
EBITDA
EBITA
EBT
Net Income
Operating Result
Earnings before interest, taxes, depreciation and amortization (EBITDA) were € 19.2 million,
compared to € 15.6 million in the previous year. The EBITDA margin was 5.4 % (previous
year: 4.8 %). Depreciation of property, plant and equipment was at € 8.5 million significantly
higher than in the previous year (€ 6.5 million). However, of this amount € 2.0 million is
extraordinary depreciation. Amortization of other intangible assets likewise increased, to
€ 1.4 million (previous year: € 0.9 million).
The operating result before goodwill amortization (EBITA) amounted to € 9.4 million in
the reporting period (previous year: € 8.2 million). The EBITA margin amounted to 2.7 %
in 2016 (previous year: 2.5 %).
Financial Result
The negative financial result increased from – € 2.7 million to – € 3.7 million. Financial ex-
penses rose from € 3.3 million to € 4.3 million. The higher volume of expenses is attribut-
able to a valuation adjustment on loans and a loss on the sale of an investment accounted
for using the equity method. Financial income increased by € 0.1 million to € 0.6 million.
The profit from investments included in this amount was € 0.1 million (previous year:
€ 0.1 million).
Net Income
Earnings before taxes (EBT) in the past year were € 5.7 million (previous year: € 5.5 mil-
lion). Overall tax expenditure in the past fiscal year amounted to € 1.1 million, compared to
€ 1.9 million in the previous year. Current tax expenditure for taxes on income decreased
due to increased use of tax loss carryforwards and amounted to approx. € 1.8 million (pre-
vious year: € 2.4 million). The Company recognized income in the amount of € 0.7 million
(previous year: € 0.5 million) for deferred taxes.
This means a result for the period of € 4.64 million (previous year: € 3.59 million). The
share for noncontrolling interests is – € 0.43 million (previous year: + € 0.29 million).
Earnings attributable to the shareholders of Deufol SE amounted to € 5.06 million in the
period under review, compared to € 3.30 million in the same period in the previous year.
Earnings per share were € 0.118 in 2016 (previous year: € 0.075).
Note 06
Notes 07– 09Margin development
fi gures as % of sales 2016 2015
EBITDA margin 5.4 4.8
EBIT(A) margin 2.7 2.5
EBT margin 1.6 1.7
Net income margin 1.4 1.1
9.48.2
19.2
15.6
5.7 5.55.1
3.3
020 Management Report Report on the Economic Environment
Results of Operations
Income

Financial Position
Financing of the Deufol Group
Various financing groups exist within the Deufol Group. In Germany and Europe, as of late
2016 Deufol has a variable-interest syndicated financing arrangement with a volume of
€ 48 million and a term ending in October 2019. This financing arrangement was extended
by a period of three years in the past fiscal year, since the original agreement would have ex-
pired in October 2016. In this respect, improvements were realized in the financial covenants
specified in the loan agreement. The Group also expanded its existing financial leeway.
Further significant financing groups exist in the USA (amortizing loan for real estate and
plant and equipment and an operating credit line), Belgium (amortizing loan for real estate
and an operating credit line) and Italy (mainly operating credit line).
Credit lines of € 56.3 million are available to the Group at various banks (previous year:
€ 47.1 million). As of December 31, 2016 € 24.3 million (previous year: € 26.4 million) of this
had been utilized, subject to variable interest rates. The variable-interest loans shown in
the balance sheet are subject to standard market interest rate risks. In fiscal year 2016, the
average weighted interest rate for short-term loans was 2.32 % (previous year: 3.45 %). The
payable credit margins are partially dependent on achieving certain financial ratios (cov-
enants).
In the opinion of the managing directors, the Deufol Group’s financial resources are suf-
ficient to meet payment obligations at any time.
Development of Financial Indebtedness
Due to the Deufol Group’s acquisitions, its financial liabilities increased significantly in
the past fiscal year. They amounted to € 65.8 million (previous year: € 58.2 million) as of
the reporting date.
Net financial liabilities – defined as total financial liabilities less financial receivables and
cash – increased by € 7.5 million, from € 39.4 million on December 31, 2015 to € 46.9 million
at the end of the period under review. This was despite the increase in cash held (+ € 1.1 mil-
lion) and lower financial receivables (– € 1.1 million). The balance of liabilities to banks
and call deposits at banks is – € 36.8 million (previous year: – € 37.0 million) and was thus
unchanged.
Significantly Higher Volume of Investment due to Acquisitions
Due to the acquisitions made in the period under review and the new production locations
in Cheb (Czech Republic) and Mülheim an der Ruhr, at € 31.2 million investments includ-
ing leased assets were significantly higher than in 2015 (€ 6.3 million). Of this amount,
€ 21.0 million related to additions in connection with companies included in the scope
of consolidation for the first time.
In the past fiscal year, investments in plant, property and equipment excluding purchases
were € 9.1 million (previous year: € 5.2 million). The investment ratio – i. e. the ratio of capital
expenditure to sales – was 2.7 % in 2016 (previous year: 1.6 %).
Notes 23, 39
Notes 17, 23
Notes 10, 11
Financial liabilities
Figures in € million 2016 2015
Amounts due to banks 52.23 51.29
thereof current 12.47 11.06
thereof noncurrent 39.76 40.23
Finance leasing 13.60 6.88
Other 0.00 0.06
Total 65.83 58.22
021Management ReportReport on the Economic Environment
Financial Position
Financing
Investments

Land and buildings (€ 4.9 million) is the largest capital expenditure item. This is followed
by advance payments made and assets under construction (€ 1.8 million) as well as invest-
ments in operating and office equipment (€ 1.2 million).
Increased Depreciation
Due to the high volume of investment, depreciation of property, plant and equipment and
amortization of intangible assets were significantly higher than in the previous year (€ 9.8 mil-
lion, compared to € 7.4 million). Depreciation of property, plant and equipment was € 8.5 mil-
lion (previous year: € 6.6 million), amortization of other intangible assets € 1.3 million (previ-
ous year: € 0.8 million).
Notes 10, 11
Depreciation, amortization and impairment
Figures in € million 2016 2015
86.4 % Property, plant and equipment 8.47 6.60
13.6 % Intangible assets 1.33 0.80
100.0 % Total 9.80 7.40
Investments
Figures in € million 2016 2015
77.4 % Property, plant and equipment 24.15 5.20
22.6 % Intangible assets 7.05 1.10
100.0 % Total 31.20 6.30
Investments by segment
Figures in € million 2016 2015
Germany 3.03 4.44
Rest of Europe 26.41 0.95
USA / Rest of the World 0.36 0.09
Holding company 1.40 0.94
Total 31.20 6.30
Depreciation, amortization and impairment by segment
Figures in € million 2016 2015
Germany 2.90 3.28
Rest of Europe 3.22 1.81
USA / Rest of the World 2.78 1.62
Holding company 0.90 0.72
Total 9.80 7.44
022 Management Report Report on the Economic Environment
Financial Position
Investments
Depreciation, amortization and impairment

Change in liquid funds
Figures in € thousand
Liquid fundsDec. 31, 2015
Cash fl ow from operating
activities
Cash fl ow from investing
activities
Cash fl ow from fi nancing
activities
Changes in the scope
of consolidation
Liquid fundsDec. 31, 2016
Cash fl ow from operating activities
Figures in € million 2016 2015 2014 2013 2012
Cash Flow
The operating cash flow amounted to € 12.0 million in the period under review and was thus
significantly higher than in the previous year (€ 5.6 million). In the previous year, the op-
erating cash flow was adversely affected by the one-off effect of revised payment terms for a
major customer, in the amount of € 10.8 million. In addition, the decrease in receivables from
suppliers (€ 6.9 million) and the decrease in other receivables (€ 3.7 million) contributed par-
ticularly strongly to the cash flow improvement in the year under review.
The cash flow from investing activities was – € 5.9 million (previous year: – € 2.9 million).
Cash-based fixed assets investments were € 9.8 million. On the other hand, inflows have
resulted from the disposal of intangible assets, property, plant and equipment and financial
assets (€ 3.6 million) as well as the settlement of financial receivables (€ 1.1 million). Further
proceeds resulted from interest received (€ 0.5 million).
Accordingly, the free cash flow – which is made up of the cash flow from operating
activities and the cash flow from investing activities – amounted to € 6.1 million (previous
year: € 2.7 million).
The cash flow from financing activities was – € 4.9 million (previous year: – € 4.3 million).
Financial liabilities decreased in cash terms by a net amount of € 1.3 million.
Notes 28 – 32
Further outflows of funds resulted from interest paid.
Cash and cash equivalents increased by € 1.1 million to € 15.5 million as of Decem-
ber 31, 2016.
Free cash fl ow: 6,073
15,476
12,001
– 4,930
0
– 5,928
14,333
17.2
5.6
12.0
22.2
16.0
023Management ReportReport on the Economic Environment
Financial Position
Cash Flow / Liquidity

Net fi nancial indebtedness and equity ratio
Figures in € million 12 / 16 12 / 15 12 / 14
Equity ratio
Net fi nancial indebtedness
Balance sheet structure
Share as % 2016 2015 2016 2015
Assets Position
Slight Increase in Balance Sheet Total
In 2016, the balance sheet total of the Deufol Group increased by 6.2 % to € 238.5 million.
On the assets side of the balance sheet, the noncurrent assets increased by 10.9 %, from
€ 137.1 million as of the period-end in the previous year to € 152.0 million as of the reporting
date. This rise resulted from the increase in property, plant and equipment due to acquisi-
tions (+ € 14.9 million to € 60.4 million). The asset depreciation ratio (ratio of accumulated
depreciation to historical cost) thus decreased by 7.5 percentage points on the previous year
to 59.6 %, while the property, plant and equipment ratio (i. e. the ratio of property, plant and
equipment to the balance sheet total) increased significantly, from 20 % to 25 %. Due to the
acquisitions, goodwill also increased, by € 2.4 million. An investment accounted for using the
equity method was sold in the year under review. Investments in associates thus decreased
by € 3.1 million. There were no significant changes in the other noncurrent assets.
Current assets decreased slightly, from € 87.5 million to € 86.6 million. This is mainly due
to the lower volume of other assets (– € 5.2 million to € 8.7 million). On the other hand, trade
receivables (+ € 1.1 million to € 45.7 million) and cash and cash equivalents (+ € 1.1 million to
€ 15.5 million) have increased. Other current assets changed only slightly. Working capital –
the difference between current assets and current non-interest-yielding liabilities – decreased
from € 30.5 million to € 28.7 million.
Increased Equity
At the end of fiscal year 2016, the equity of the Deufol Group amounted to € 108.1 million
(previous year: € 102.4 million). The balance sheet total increased significantly, while the
equity ratio fell slightly, from 45.6 % to 45.3 %. Equity mainly increased due to the result for
the period (€ 4.6 million) and other comprehensive income (+ € 0.7 million).
Noncurrent liabilities increased by € 2.7 million to € 53.9 million. This reflects the in-
crease in noncurrent financial liabilities (+ € 3.0 million to € 47.2 million). Moreover, de-
ferred tax liabilities increased by € 1.8 million while other noncurrent liabilities decreased
by € 1.3 million.
Current liabilities increased by € 5.5 million to € 76.5 million. Current financial liabilities
increased by € 4.6 million to € 18.6 million, while trade payables rose by € 3.1 million to
€ 40.3 million. On the other hand, other liabilities decreased (– € 2.7 million to € 13.1 mil-
lion). There was no significant change in other current liabilities.
Notes 10 – 17
Notes 18 – 27
45.3 % 45.6 % 44.6 %
39.446.9 37.0
Aktiva Passiva
39 %
61 %noncurrent
liabilities
equity
current assets
noncurrent assets
36 %
64 %
32 %32 %
23 %
23 %
45 %
46 %
current liabilities
024 Management Report Report on the Economic Environment
Assets Position

Personnel expense ratio
Figures in % 2016 2015 2014
Employees
Increase in Number of Employees
The Deufol Group had 2,899 employees on average over the course of the year. This repre-
sents an increase of 258 employees or 9.7 % on the previous year. On average, the Group
had 1,625 employees in Germany (56.1 %) and 1,274 employees (43.9 %) elsewhere.
On average in the past year, the Group had 57 more employees in Germany. This increase
resulted from the replacement of temporary workers and sub-contractors with its own staff
at many of its German locations. In the Rest of Europe, the average number of employees in-
creased by 220; in particular, this reflected the acquisition of the Rieder Group in Austria at the
start of the year. In the USA / Rest of the World, the average workforce over the year as a whole
decreased by 21. The holding’s workforce increased by 2 employees to an average of 68.
Personnel costs increased in the reporting period by 8.2 % to € 111.7 million. The per-
sonnel cost ratio as a ratio of personnel costs to Deufol’s overall operating performance
increased slightly, from 30.9 % to 31.6 %.
Thanks for Commitment
The managing directors would like to thank all the Company’s employees for the dedication
and flexibility which they displayed in fiscal year 2016.
Note 04
Employees by segment
Deufol Group 2016 2015
53.7 % Germany 1,557 1,500
26.8 % Rest of Europe 776 556
17.2 % USA / Rest of the World 498 519
2.3 % Holding company 68 66
100.0 % Total 2,899 2,641
Overview of employees
Deufol Group 2016 2015
Germany 1,625 1,566
Rest of the World 1,274 1,075
Female 665 646
Male 2,234 1,995
Total 2,899 2,641
As of Dec. 31, 2016 2,637 2,657
30.930.931.6
025Management ReportReport on the Economic Environment
Employees

Development in the Segments
Germany
At € 175.1 million, consolidated sales in Germany in 2016 exceeded sales in the previous
year which amounted to € 170.2 million. This sales improvement is attributable to organic
growth; there were no changes in the consolidated group. This growth resulted from new
customers and from the expansion of business relationships with existing customers, in
western Germany especially.
In the reporting period, the EBIT for this division amounted to € 6.7 million (previous
year: € 4.5 million). The EBITA margin declined from 2.7 % in the previous year to 3.8 %.
The higher results by comparison with the previous year chiefly resulted from the restruc-
turing measures initiated and implemented over the past few years.
Rest of Europe
In the Rest of Europe, we realized consolidated sales of € 83.5 million, which is clearly higher
than in the previous year (€ 70.7 million). This increase in sales is attributable to the first-time
inclusion in the scope of consolidation of the acquired Rieder Group, Austria (+ € 14.8 mil-
lion). Otherwise, our business in Belgium with two major customers declined slightly.
In the past year, this segment achieved a balanced operating result (EBITA), following
a positive EBIT figure of € 2.5 million in the previous year. Much of this decline is attribut-
able to one-off factors in the past year under review. For instance, due to current develop-
ments in Belgium a valuation adjustment was implemented for a debt claim associated
with a lawsuit. Extraordinary valuation adjustments were also implemented on fixed as-
sets in Belgium, in connection with a decline in sales.
USA / Rest of the World
In the USA / Rest of the World segment, at € 81.8 million consolidated sales roughly matched
the previous year’s level (€ 83.2 million). There were no significant exchange rate effects.
Sales realized from the Company’s operations in Charlotte and Suzhou have also once again
increased, but remain in the low single-digit million range.
EBIT in this segment amounted to € 4.2 million, compared to € 4.8 million in the previ-
ous year. In the USA, we have been reaping the rewards of our restructuring program for
some time now.
Our Chinese subsidiary (Deufol Packaging (Suzhou) Co., Ltd.) has likewise reported earn-
ings which have once again improved significantly by comparison with the previous year.
Holding company
The EBIT figure in the Holding segment amounted to – € 1.0 million in the past fiscal year,
compared to – € 2.3 million in the previous year. The improved operating result has resulted
from the sale and deconsolidation of two subsidiaries as well as costs reimbursed in connec-
tion with the transfer of business to a customer.
Notes 40 – 42
Notes 40 – 42
Notes 40 – 42
Notes 40 – 42
USA / Rest of the World
Figures in € million 2016 2015
Sales 81.9 83.2
Consolidated sales 81.8 83.2
EBITA = EBIT 4.2 4.8
EBITA margin (%) 5.1 5.8
EBT 2.9 2.5
Germany
Figures in € million 2016 2015
Sales 201.1 195.6
Consolidated sales 175.1 170.2
EBITA = EBIT 6.7 4.5
EBITA margin (%) 3.8 2.7
EBT 4.5 3.1
Rest of Europe
Figures in € million 2016 2015
Sales 99.6 84.3
Consolidated sales 83.5 70.7
EBITA = EBIT 0.0 2.5
EBITA margin (%) 0.0 3.6
EBT (0.1) 2.5
026 Management Report Report on the Economic Environment
Development in the Segments

Overall Summary of Business Performance
Planned Targets Clearly Achieved
With an annual sales volume of approx. € 341 million, we exceeded our sales target and sur-
passed our envisaged range of between € 320 million and € 335 million.
Our operating result (EBITDA) reached € 19.2 million and was thus significantly higher
than the upper end of the forecast range of between € 14.5 million and € 16.5 million. As well
as the positive business trend in Germany, the planning targets were significantly exceeded
due to one-off factors relating to the sale of two subsidiaries as well as costs reimbursed in
connection with the transfer of business to a customer.
At the time of preparing these consolidated financial statements, the Deufol Group’s
economic position is stable.
The business trend in our key region “Germany” is improving, in line with our planning.
In the “Rest of Europe” segment, following the one-off factors in the past reporting year and
integration of our acquisitions, we envisage an increasing level of profitability. In the USA, we
expect that our results will remain positive but will be lower due to the predicted decline in
sales realized with a major customer. We expect to achieve positive results in China / Asia, but
at a low level.
Our financial and assets position remains extremely solid.
Goal achievement 2016
Figures in € million Sales EBITDA
Planning 320 – 335 14.5 – 16.5
Actual fi gures 341.0 19.2
Group fi gures
Figures in € million 2016
Sales 341.0
EBITDA 19.2
EBITA 9.4
Net fi nancial liabilities 46.9
027Management ReportReport on the Economic Environment
Overall Summary of Business Performance

Single-Entity Financial Statements of Deufol SE
Sales and Results of Operations
In fiscal year 2016 Deufol SE realized sales of € 12,974 thousand (previous year: € 12,757 thou-
sand) and other operating income of € 8,420 thousand (previous year: € 6,988 thousand).
Deufol SE’s sales have increased due to the redefinition of sales in the German Act
Transposing the Accounting Directive (Bilanzrichtlinie-Umsetzungsgesetz, BilRUG).
Amounts previously reported under other operating income are now reported under sales.
In the previous year, before BilRUG came into effect, sales amounted to € 9,664 thousand
and other operating income to € 10,082 thousand.
These sales mainly resulted from amounts billed to affiliated companies for purchasing
services provided, other services, license income from brand name rights and from rents.
Outside Germany, sales amounted to € 3,391 thousand (previous year: € 3,030 thousand).
Other operating income mainly consists of income from passed-on expenses in the
amount of € 3,040 thousand (previous year: € 2,861 thousand), bonuses associated with
central material purchasing in the amount of € 582 thousand (previous year: € 679 thousand),
income from exchange-rate differences in the amount of € 357 thousand (previous year:
€ 1,303 thousand), and costs reimbursed in connection with the sale of operating divisions
in the amount of € 3,300 thousand (previous year: € 0 thousand).
The cost of materials in the amount of € 3,915 thousand (previous year: € 3,902 thousand)
is due to central goods purchasing and is passed on in the same amount.
Other operating expenses (€ 11,525 thousand, compared to € 10,524 thousand in the
previous year) mainly comprise legal fees and consulting expenses in the amount of
€ 2,221 thousand (previous year: € 1,399 thousand), bad debt charges / closing-out of re-
ceivables in the amount of € 184 thousand (previous year: € 1,866 thousand), exchange
losses in the amount of € 123 thousand (previous year: € 220 thousand), external services
in the amount of € 903 thousand (previous year: € 854 thousand), travel and vehicle ex-
penses in the amount of € 649 thousand (previous year: € 667 thousand), space costs in
the amount of € 227 thousand (previous year: € 143 thousand), advertising costs in the
amount of € 244 thousand (previous year: € 166 thousand) and passed-on expenses in
the amount of € 3,010 thousand (previous year: € 2,899 thousand). Expenses unrelated to
the accounting period amounted to € 1,942 thousand (previous year: € 65 thousand) and
mainly relate to legal disputes.
The financial result decreased from € 3,956 thousand to € 1,050 thousand in the past
year. Net interest income decreased from + € 1,190 thousand to + € 678 thousand, while
income from profit transfer agreements improved from € 3,224 thousand to € 5,232 thou-
sand. Extraordinary amortization recognized on financial assets in fiscal year 2016 totaled
€ 4,860 thousand (previous year: € 458 thousand).
Taxes amounted to € 276 thousand (previous year: € 589 thousand). The net loss for the
year under review amounted to € 1,519 thousand (previous year: net profit for the year of
€ 1,810 thousand).
Assets and Financial Position
In the year under review, the balance sheet total of Deufol SE decreased slightly to
€ 155.0 million (previous year: € 160.4 million). Fixed assets amount to € 109.5 million,
compared to € 114.0 million in the previous year. At € 45.5 million, current assets including
accrued and deferred items almost match the previous year’s figure (€ 46.4 million). Depre-
ciation of property, plant and equipment and amortization of intangible assets amounted to
Income Statement of Deufol SE
Figures in € thousand 2016 2015
Sales 12,974 12,758
Other operating income 8,420 6,988
Cost of materials (3,915) (3,902)
Personnel costs (6,781) (5,982)
Depreciation, amortization
and impairment (1,466) (895)
Other operating expenses (11,525) (10,524)
Financial result 1,050 3,956
Taxes (276) (589)
Annual net profi t (1,519) 1,810
028 Management Report Single-Entity Financial Statements of Deufol SE
Sales and Results of Operations

€ 1,466 thousand (previous year: € 895 thousand), amortization of financial assets to € 4,860
thousand (previous year: € 458 thousand). Investments in property, plant and equipment
and intangible assets amounted to € 1,410 thousand (previous year: € 1,085 thousand). In-
vestments in financial assets amounted to € 636 thousand (previous year: € 183 thousand).
On the liabilities side of the balance sheet, equity was reduced by the net loss for the year
(– € 1,519 thousand) as well as the treasury stock acquired in 2016 (– € 537 thousand). Equity
thus decreased from € 96.7 million to € 94.7 million. Due to the lower balance sheet total, on
December 31, 2016 the equity ratio had increased slightly to 61.1 % (previous year: 60.3 %).
Provisions increased to € 4.3 million (previous year: € 2.2 million). Liabilities declined from
€ 61.5 million to € 56.0 million – mainly due to decreased liabilities to banks and reduced li-
abilities to affiliated companies.
The following cash flow statement shows the financial position of Deufol SE:
Cash Flow Statement of Deufol SE
Figures in € thousand 2016 2015
Annual net profi t – 1,519 1,810
Depreciation/(appreciation) 1,466 895
Increase (decrease) in provisions 2,178 702
Other non-cash expenses/(revenue) 0 (93)
Non-cash valuation adjustments on fi nancial assets 4,860 458
Net changes in working capital assets (3,512) 888
Net changes in working capital liabilities (3,372) 570
(Gain) loss from disposal of property, plant and equipment 0 (20)
Interest income / interest expense (678) (1,190)
Other investment income (5,292) (3,224)
Non-cash income tax expense 276 589
Income tax payments (302) (699)
Cash fl ow from operating activities (5,835) 686
Payments made for investments in intangible assets (995) (671)
Proceeds from the sale of property, plant and equipment 32 134
Payments made for investments in property, plant and equipment (415) (414)
Payments made for investments in fi nancial assets (636) (183)
Repayment of long-term loans 82 0
Interest received 2,034 3,115
Dividends received 5,232 3,224
Cash fl ow from investing activities 5,970 5,212
Repayment of borrowings (2,181) (3,082)
Payments made for the purchase of treasury stock (537) 0
Interest paid (1,356) (1,925)
Cash fl ow from fi nancing activities (4,074) (5,007)
Change in cash (3,939) 891
Cash at the beginning of the period 9,350 8,459
Cash at the end of the period 5,411 9,350
Balance Sheet of Deufol SE
Figures in € thousand 2016 2015
Fixed assets 109,535 114,022
thereof fi nancial assets 100,467 104,868
Current assets and accrued
and deferred items 45,441 46,411
Balance sheet total 154,976 160,433
Equity 94,688 96,744
Provisions 4,306 2,154
Liabilities 55,982 61,535
thereof amounts due to banks 31,095 33,276
Balance sheet total 154,976 160,433
029Management ReportSingle-Entity Financial Statements of Deufol SE
Assets and Financial Position

Risk ReportRisk Policy
The role of Deufol SE is to act as a management holding company for subsidiaries which
provide services in Germany and elsewhere, focusing on packaging. As part of its hold-
ing tasks, Deufol SE provides the resources required for risk management and monitors
implementation of risk-policy and risk-management procedures on an ongoing basis. Cor-
porate management and control, corporate governance, the by-laws and the risk policy
are coordinated within the Deufol Group.
Exposure to risks is unavoidable in our efforts to achieve long-term success by taking
advantage of opportunities in our services divisions and regions in an environment of con-
stantly changing requirements and challenges. These are carefully examined and assessed
on the basis of a risk / opportunity calculation. Our corporate and business strategy is to con-
centrate operational activities and the risks associated with them within separate legal enti-
ties in order to insulate the rest of the Group from possible negative influences.
The core risks are monitored on an ongoing basis and suitable measures are implemented
to reduce them. The core risks comprise, in particular, risks associated with the Company’s
current and future business situation. Risks include potential losses of customers due to the
relocation of packaging-related production locations or insufficiently rigorous development
of market leadership in core business fields. Noncore and residual risks are accepted pro-
vided they can be specifically identified and mapped. Noncore risks are externalized (force
majeure, liability to third parties for loss or damage, etc.). In particular, corporate gover-
nance guidelines (incl. the Deufol SE by-laws) and the active monitoring of subsidiaries as
the parent company ensure that the deliberate acceptance of risks proceeds in a transparent
and controlled fashion.
The managing directors of Deufol SE consider a highly-developed awareness of risk in all
business divisions to be indispensable for the success of its risk policy. Awareness of existing
and potential risks is an important element of business management. Due to the various risk
areas and the different ways in which risks are applicable within the individual subsidiaries,
this increased awareness is vital for successful implementation of risk policy.
All activities of subsidiary companies are supported by an integrated risk management
system without exception. The purpose of risk management activities is firstly to ensure
that statutory requirements are complied with, and secondly to promote value-oriented
management of individual subsidiaries and thus of the Deufol Group as a whole.
030 Management Report Risk Report
Risk Policy

Risk Controlling
Risks are identified by division managers or managing directors on the basis of the fol-
lowing ten risk categories: strategy / planning / corporate management, market / sales / cus-
tomers, procurement / suppliers, service provision, finance, personnel, IT, contracts / legal
and other.
The responsible managers document the risks identified in “risk maps” on a semi-
annual basis. Aggregation is subsequently implemented at Group level and the managing
directors receive a report.
Risk measurement is standardized throughout the Group. Risks identified in risk maps
are assessed by the companies’ local or site managers in terms of probability of occurrence
and amount of potential loss, in the context of the gross risk level. Individual risks are as-
signed quantitative values requiring response upon reaching specific thresholds. The net
risk level is subsequently evaluated following implementation of the measures.
Measures taken to control identified risks are subject to regular on-site monitoring as to
their effectiveness. The managing directors and regional managers also perform risk monitor-
ing functions in the course of regular visits to the individual subsidiaries.
Specific Risks
Environment Risks
For 2017, we continue to expect a moderately positive economic trend. According to the
Institute for the World Economy, on the whole the global economic trend has recently
picked up. However, the world economic outlook for 2017 is characterized by uncertainty,
particularly political uncertainty. The reasons for this include the change of economic
policy which has been announced in the USA but has yet to be outlined in sufficiently con-
crete terms, the United Kingdom’s decision to leave the EU, the declining growth momen-
tum in China as well as monetary policy which remains extremely expansionary.
The world economy will thus remain prone to disruptions. The political risks have
increased. Important and defining elections will take place in several countries in Europe
in 2017, with a risk of nationalist and isolationist tendencies gaining further momentum.
Moreover, it is increasingly open to question how much longer the central banks in the
advanced economies will be able to continue to prioritize economic stimulus measures
since, unlike the situation a year ago, in view of rising commodities prices and declining
unemployment there is no longer any fear of slipping into deflation. In the context of the
southern European economies which are only slowly recovering, we see a challenging
economic environment in the Italian market especially.
In the event of these risks being realized, negative demand effects may result in key mar-
kets for our Group such as our export-oriented mechanical and plant engineering business,
which might then affect our business further down the line.
031Management ReportRisk Report
Risk Controlling
Specifi c Risks

Acquisition and Investment Risks
Acquisition and investment decisions intrinsically involve complex risks, since they tie up
substantial capital on a long-term basis. Such decisions can only be made on the basis of
specific, predefined terms governing responsibilities and approval requirements.
Performance-Related Risks
Sales and earnings of the subsidiaries are largely dependent on a relatively small number
of business relationships with larger customers. Customers come from different industries
(e. g. Duracell represents the consumer goods sector, MAN the automotive industry and
Siemens plant engineering), creating a certain risk-reducing effect in addition to the fact
that different, unrelated services are performed for one and the same customer.
A primary objective of the Deufol Group is to promote customer loyalty, for example,
through joint process and efficiency improvement projects etc. with our customers as well
as a strong customer focus and a high level of flexibility. The acquisition of smaller custom-
ers is also important in order to broaden our customer base.
The structuring of contracts with customers also poses certain risks, e. g. if contracts re-
strict our ability to react to quantitative or qualitative changes affecting our business. At the
same time, price adjustment clauses are not always adequate for promptly passing on un-
expected procurement price increases for raw materials (e. g. wood) to customers. Regular
reviews are implemented to ensure early recognition of negative trends for the Company or
for individual subsidiaries, for prompt identification of impending declines in sales and cost
trends and to enable an appropriate response.
Personnel Risks
A major part of the business success of the Deufol Group rests upon the skills and qualifi-
cations of its employees and the motivation of the managerial staff of our corporate sub-
sidiaries. For this reason, employees undergo regular training in order to ensure that the
quality of the services provided meets customer requirements. Employees at all levels of
the Company are being progressively sensitized to risk issues to ensure compliance with
risk policy. Senior management remuneration packages have been systematically restruc-
tured to emphasize variable, performance-related components such as bonuses as an in-
centive for reaching targets.
External contractors are utilized in some cases. This allows the Company to manage
phases of increased or reduced business activity without the need for any layoffs affecting
its trained workforce.
Our subsidiaries are now run by managers with close ties to Deufol and an entrepreneur-
ial attitude. The risk of loss of know-how through the departure of key personnel is limited
through documentation of relevant know-how and its possession by multiple persons by
virtue of the decision-making process structure.
032 Management Report Risk Report
Specifi c Risks

IT Risks
In principle, possible IT risks may result from the failure of networks or the falsification
or destruction of data through operating or programming errors. However, some of the
IT infrastructure of the Deufol Group reflects the Group’s decentralized structure. There
are therefore only isolated IT risks in the individual units in this area, and there are no
Group-wide risks. Other elements of the Group’s IT infrastructure have been centralized
or outsourced. The individual companies and divisions have extensive protection mea-
sures such as virus-protection concepts, firewalls and emergency and recovery plans as
well as additional external back-up solutions in accordance with specific requirements.
A redundant server system has been established, thus significantly reducing the prob-
ability of data losses due to outages.
Financial Risks
Various financing groups exist within the Deufol Group which are largely independent of one
another. In Europe, in the previous year the Group’s syndicated financing arrangement was
optimized and extended until October 2019. In this respect, improvements were realized in
the financial covenants specified in the loan agreement. The Group also expanded its existing
financial leeway and improved its financing terms. The Group’s other significant financing
group is in the USA, where it also has an independent bank financing arrangement.
Within the Group, credit agreements are mainly tied to compliance with financial ratios
(“covenants”). A violation of the covenants provides the banks with a right to terminate
an agreement but does not automatically trigger a repayment obligation. In addition, the
agreed credit margin and thus the Group’s financing costs may be increased in case of a
deterioration in the ratios.
Interest-rate fluctuation risks apply due to the fact that the Group has arranged almost all
of its financing on the basis of variable interest rates.
The risks resulting from exchange-rate fluctuations only apply within the scope of consoli-
dation as a result of the conversion of the annual financial statements of companies outside
the euro currency zone. Exchange rates have only a marginal effect on operating business. In
the single-entity financial statements, currency risks exclusively apply for transactions with
subsidiaries outside the euro currency zone. In the context of the growing significance of our
business activities in the Czech Republic, we have hedged ourselves against exchange rate
risks there.
033Management ReportRisk Report
Specifi c Risks

Please see the “Financial Risk Management” section (Note 39 on pages 077 ff.) for further
information on financial risks.
The Group has recognized goodwill in consequence of its expansion strategy. Impair-
ment testing pursuant to IAS 36 may necessitate goodwill amortization / impairment. The
impairment testing implemented in 2016 did not identify any amortization / impairment
requirement.
Legal Risks
The Deufol Group is exposed to general legal risks resulting from its business activities
and from tax affairs. It is not possible to state with any certainty the outcome of currently
pending or future proceedings, so that expenses may result due to judicial or official rul-
ings or settlements such as are not covered or are not fully covered by insurance benefits
and which may significantly affect our business operations and earnings.
Please see the “Contingencies and Contingent Liabilities” section (Note 33 on page 076)
for further information on legal risks.
Overall Group Risk Position
In summary, as in the previous year no operational or financial risks are currently identi-
fiable which potentially jeopardize the continued existence of the Group as a going con-
cern. The Group structure entailing a wide range of services offered in a variety of sec-
tors and regions under a management holding company has proven effective from a risk
standpoint. Operating risks for individual subsidiaries are covered through appropriate
insurance protection as far as possible. The risk management system is being continually
upgraded and enhanced to allow risks to be identified at an early stage and appropriate
countermeasures to be taken.
034 Management Report Risk Report
Specifi c Risks
Overall Group Risk Position

Report on DependenceSince there is no control agreement with the majority shareholder, pursuant to section 312
of the German Stock Corporation Act the managing directors of Deufol SE were obliged to
prepare a report on Deufol SE’s relationships with associates. This report covers the rela-
tionships with Lion’s Place GmbH and its majority shareholders, the Hübner family, as well
as the companies of the Deufol Group. The managing directors declare pursuant to section
312 (3) of the German Stock Corporation Act: “With regard to the legal transactions listed
in the report on Deufol SE’s relationships with associates, for each such transaction our
Company has received an appropriate consideration in accordance with the known circum-
stances at the time of its execution. No disadvantageous events for the Company occurred
during the fiscal year such as are subject to a reporting obligation.”
Report on Opportunities and Expected Developments
Planned Orientation and Strategic Opportunities for the Group
The Deufol Group will maintain its structure as a management holding company for risk limi-
tation purposes. In this way we will also preserve our on-site flexibility and will be able to bet-
ter satisfy the different requirements of various markets and regions.
Over the past few years, we have successfully implemented further steps to improve
Deufol’s operational effectiveness and to strengthen its corporate culture. For example,
this includes improved integration of our locations, with targeted tools and an increased
exchange of information. At the same time, we pursue the ongoing development of our
innovative Deufol applications. These applications offer our customers transparency as
well as added value throughout their value chains. This enables us to differentiate ourselves
from competitors in the export and industrial packaging sector.
In particular, among the strategic opportunities which this offers for a corporate group
is that we are able to exploit the advantages of our size as a significant market player. As a
globally-oriented premium service provider in the field of packaging and related services,
we offer our clients who operate worldwide holistic solutions that support their strategies.
We are constantly expanding our business divisions to include additional services to com-
plement packaging, as well as proprietary software solutions which embed the packaging
process within an intelligent package of services. We offer our customers sustainable, inno-
vative and comprehensive services, with a top level of quality, thus meeting their ever more
stringent requirements. At the same time, we are consolidating our position as our custom-
ers increasingly focus on just a few core service providers.
Our outstanding qualities as a packaging services provider include our international
presence. Many of our clients have a “global footprint”, which means that it is essential
for us to develop and provide our services with our customary standard of quality, at an
international level.
035Report on Dependence, Report on Opportunities and Expected Developments Management Report
Planned Orientation and Strategic Opportunities for the Group

Economic Outline Conditions
World Economy Gaining Momentum
According to the Institute for the World Economy, global output growth in 2017 will at
3.5 % be slightly stronger than in the previous year (2016: 3.1 %). For 2018, it predicts
growth of 3.6 %.
In the view of the Institute for the World Economy, momentum will gradually pick up in
the advanced economies (albeit at a moderate level) due to the change of government in
the USA and the devaluation of the euro and the yen against the US dollar.
The situation stabilized in the emerging markets in 2016, and this trend is likely to
continue in 2017. However, in view of various structural obstacles which remain in place
a strong upturn is not in prospect.
Upswing in the Eurozone, Despite Many Uncertainties
In overall terms, the Eurozone achieved a moderate recovery in 2016. Various sentiment
indicators improved over the past few months and suggest that the basic economic trend
has picked up momentum. On the other hand, many political risks apply in the forecast
period. These uncertainties include the negotiations relating to the United Kingdom’s
withdrawal from the EU as well as the elections in Germany and France. The positive fac-
tors nonetheless remain intact. For instance, consumer price inflation has recently picked
up considerably, and the labor market has continued to improve. The economy will remain
buoyed by low interest rates as well as the euro’s external value which remains relatively
low. Moreover, financial policy will likely be marginally expansionary, following the decline
in consolidation efforts in several countries.
All in all, according to the Institute for the World Economy’s forecast the Eurozone econ-
omy is gradually gaining impetus. The Institute expects that the Eurozone’s gross domestic
product growth will amount to 1.8 % in 2017. Next year, the volume of economic activity
will grow by 1.7 %.
Germany: the Upturn Enters its Fifth Year with Momentum
The German economy continues to prove highly robust in a difficult international environ-
ment. Overall, the upturn is increasingly broad-based. To be sure, private consumption is
likely to grow at a significantly slower pace, since purchasing power in terms of disposable
income will be clearly reduced due to the oil price-related rise in inflation to almost 2 %.
Nor will public consumption increase quite so strongly as previously, since no additional ex-
penditure is expected to arise in connection with the influx of refugees. But the investment
upturn is clearly gathering pace. Exports will increasingly support the upswing.
Overall in 2017, the Institute for the World Economy predicts gross domestic product
growth of 1.7 %, compared to 1.9 % in 2016. The slightly lower growth rate in 2017 is ex-
clusively attributable to the lower number of working days.
In 2018 the pace of the upswing will once again increase. As well as exports, due to the
improving global economy and clearly rising investments a monetary environment which
will remain stimulating will also boost this upward trend. Over the course of the year, on
average Germany’s gross domestic product should be 2.0 % higher than in 2017.
036 Management Report Report on Opportunities and Expected Developments
Economic Outline Conditions

Company-Specific Outlook
Predicted Sales and Results of Operations
For fiscal year 2017, the Deufol Group plans sales of between € 305 million and € 320 mil-
lion. Its operating result (EBITDA) will be between € 15.0 and 17.0 million.
Sales should fall slightly short of the level realized in the previous year in all three
regions: Germany, the Rest of Europe and the USA / Rest of the World. This slight decline
reflects sales of Group units and the relinquishment of business fields which do not form
part of Deufol’s core business.
With regard to our results forecast, we expect slightly improved results for our core busi-
ness in Germany. As well as the above-mentioned sales of unprofitable Group units, this is
mainly due to the measures implemented to improve profitability. For the Rest of Europe,
we envisage an increase in earnings. In particular, the integration of the Novaedes Group
which we acquired at the end of the past year will be necessary in 2017. In the USA / Rest
of the World segment, we expect results similar to those in the previous reporting period.
Expected Financial Position
At present, current business activities do not on balance require additional external financ-
ing. Our financial resources secure our existing liquidity requirements. In the context of
the syndicated financing arrangement which is due to expire in the autumn of 2016, in Jan-
uary 2016 we already successfully extended and optimized our syndicated loan agreement.
The new agreement expands our line of credit while offering improved terms. Nonetheless,
if our business performance matches our forecasts we expect to see a decrease in our net
financial indebtedness in the current fiscal year.
In the current year, investments in property, plant and equipment are planned with a
volume of € 7.3 million; this corresponds to an investment ratio (investments in relation to
sales) of approx. 2.3 %. The planned investments are thus roughly at the same level as in
2015 (€ 6.4 million).
In case of acquisitions and in the event of operating growth beyond our budgeted level,
it may be necessary to borrow additional external funds.
Managing Directors’ Overall Summary of the Group’s Expected Development
In the next few years, the Deufol Group will continue to develop its profile as a packaging
services provider. This is also compatible with our clear brand profile among new and ex-
isting customers. Our broad customer base and many years of business relationships, our
specific know-how and our financial resources enable us to maintain a confident outlook
regarding the Group’s further development. This means that we expect a positive trend for
the Group over the next few years.
037Management ReportReport on Opportunities and Expected Developments
Company-Specifi c Outlook

DEUFOL’S HUB CONCEPT – A SIMPLE AND INTELLIGENT SOLUTION FOR A COMPLEX CHALLENGE.
A HUB is a central node where transport routes converge from every direction. The goal is to optimize utilization of means of transport. This makes it possible to avoid underutiliza-tion or even empty trips. Our HUB locations at the strategically vital industrial ports of Ham-burg, Antwerp and Rotterdam provide the ideal framework for this. Deufol’s HUB concept of-fers our customers reduced costs as well as time savings and productivity gains. Safe, fl ex-ible and effi cient. It’s quite simple.
COMPLEXITY REQUIRES SIMPLICITY.
HUBHAMBURG

HUBANTWERP
039 CONSOLIDATED FINANCIAL STATEMENTS
040 Consolidated Income Statement
040 Consolidated Statement of Comprehensive Income
041 Consolidated Balance Sheet
042 Consolidated Cash Flow Statement
043 Consolidated Statement of Changes in Equity

Figures in € thousand 2016 2015 Note / Page
Sales 340,958 324,835 01 / 059
Other own work capitalized 1,364 982
Inventory changes (123) 137
Other operating income 11,170 7,545 02 / 059
Overall operating performance 353,369 333,499
Cost of materials (159,369) (157,743) 03 / 060
Personnel costs (111,669) (103,189) 04 / 060
Depreciation, amortization and impairment (9,801) (7,435) 10 / 064
Other operating expenses (63,094) (56,966) 05 / 060
Profit (loss) from operations (EBIT) 9,436 8,166
Financial income 521 494 06 / 061
Finance costs (2,913) (3,302) 06 / 061
Income (loss) from investments accounted for using the equity method 88 136 06 / 061
Other financial result (1,396) 0
Profit (loss) before taxes (EBT) 5,736 5,494
Income taxes (1,101) (1,902) 07 / 061
Result for the period 4,635 3,592
thereof share of profits held by noncontrolling interests (429) 293 08 / 063
thereof share of profits held by shareholders in the parent company 5,064 3,299
Earnings per share
Figures in €
Basic and diluted earnings per share, based on the income (loss) attributable to common shareholders of Deufol SE
0.118 0.075
09 / 063
Figures in € thousand 2016 2015 Note / Page
Result for the period 4,635 3,592
Other comprehensive income 952 1,503
Items which may be reclassified to the income statement in future
Income (loss) from currency translation, after taxes 959 1,484
Income (loss) from cash flow hedges, after taxes 0 0
Items which will not be reclassified to the income statement in future
Actuarial income / loss (–) from pensions, after taxes (7) 19 22 / 070
Comprehensive income after taxes 5,587 5,095
thereof noncontrolling interests (429) 293
thereof shareholders in the parent company 6,016 4,802
Consolidated Income
Statement
Consolidated Statement of Comprehensive Income
Consolidated income statement
as of December, 31, 2016
Consolidated Financial Statements Consolidated Income Statement040
Consolidated Statement of Comprehensive Income

Assets
Figures in € thousand Dec. 31, 2016 Dec. 31, 2015 Note / Page
Noncurrent assets 151,957 137,072
Property, plant and equipment 60,400 45,471 10 / 064
Investment property 0 161 10 / 064
Goodwill 71,120 68,677 11 / 064
Other intangible assets 7,485 4,371 11 / 064
Financial assets accounted for using the equity method 866 3,939 12 / 065
Financial receivables 1,617 3,084 13 / 068
Other financial assets 56 59
Other receivables and other assets 2,417 2,405 14 / 068
Deferred tax assets 7,996 8,905 07 / 061
Current assets 86,575 87,537
Inventories 14,385 12,573 15 / 069
Trade receivables 45,669 44,537 16 / 069
Other receivables and other assets 8,679 13,920 14 / 068
Tax receivables 538 729
Financial receivables 1,828 1,445 13 / 068
Cash and cash equivalents 15,476 14,333 17 / 070
Total assets 238,532 224,609
Equity and liabilities
Figures in € thousand Dec. 31, 2016 Dec. 31, 2015 Note / Page
Equity 108,110 102,394
Equity attributable to the shareholders of Deufol SE 107,340 101,860
Subscribed capital 43,774 43,774 18 / 070
Capital reserves 107,240 107,240 19 / 070
Retained earnings 10,000 0
Profit brought forward (55,347) (50,404)
Other comprehensive income 2,209 1,250
Treasury stock at cost (536) 0
Noncontrolling equity interests 770 534 20 / 068
Noncurrent liabilities 53,930 51,179
Financial liabilities 47,229 44,182 23 / 071
Provisions for pensions 3,861 4,763 24 / 072
Other provisions 87 0
Other liabilities 85 1,413 26 / 074
Deferred tax liabilities 2,667 821 07 / 061
Current liabilities 76,493 71,036
Trade payables 40,320 37,178 27 / 074
Financial liabilities 18,601 14,042 23 / 071
Other liabilities 13,100 15,775 26 / 074
Tax liabilities 1,673 1,853
Other provisions 2,799 2,188 25 / 073
Total equity and liabilities 238,532 224,609
Consolidated Balance Sheet
041Consolidated Financial StatementsConsolidated Balance Sheet

Figures in € thousand 2016 2015 Note / Page
Income (loss) from operations (EBIT) from continuing operations 9,436 8,166
Adjustments to reconcile net income (loss) to cash flow from operating activities
Depreciation, amortization and impairment 9,801 7,435 10, 11 / 064
(Gain) loss from disposal of fixed assets 82 (12) 02, 05 / 059, 060
(Gain) loss from disposal of investments 662 0
Taxes paid (1,785) (1,073)
Other non-cash expenses / revenue 88 0
Changes in assets and liabilities from operating activities
Decrease (increase) in trade accounts receivable 6,856 (10,756)
Decrease (increase) in inventories 863 (222)
Decrease (increase) in other receivables and other assets 3,664 603
Increase (decrease) in trade accounts payable (4,108) 862
Increase (decrease) in other liabilities (13,144) 32
Increase (decrease) in provisions (787) 677
Decrease (increase) in other operating assets / liabilities 373 (171)
Cash flow from operating activities 12,001 5,541 28 / 075
Payments made for investments in intangible assets and property, plant and equipment (9,831) (4,793)
Proceeds from the sale of intangible assets and property, plant and equipment 1,214 265
Payments made for the acquisition of noncontrolling interests 0 (175)
Proceeds from the sale of investments 2,420 0 29 / 075
Acquisitions of business units less acquired cash (501) 0
Disposal of business units less cash disposed of (835) 0
Net change in financial receivables 1,084 1,341
Interest received 521 494
Cash flow from investing activities (5,928) (2,868) 30 / 075
Addition (extinction) of amounts due to banks (1,273) (444)
Addition (extinction) of other financial liabilities (881) (473)
Interest paid (2,905) (3,378)
Change in noncontrolling interests 738 0
Purchase / sale of treasury stock (536) 0
Dividend paid to noncontrolling interests (73) (49)
Cash flow from financing activities (4,930) (4,344) 31 / 075
Exchange rate- and scope of consolidation-related changes in financial resources 0 1
Change in cash and cash equivalents 1,143 (1,670) 32 / 075
Cash and cash equivalents at the beginning of the period 14,333 16,003
Cash and cash equivalents at the end of the period 15,476 14,333
Consolidated
Cash Flow Statement
042 Consolidated Financial Statements Consolidated Cash Flow Statement

Sub
scri
bed
capi
tal
Cap
ital
res
erve
s
Ret
aine
d ea
rnin
gs
Pro
fit
brou
ght
forw
ard
Trea
sury
sto
ck a
t co
st
Accumulated other comprehensive income
Equ
ity
attr
ibut
able
to
the
shar
ehol
ders
of
Deu
fol S
E
Non
cont
rolli
ng
equi
ty in
tere
sts
Tota
l eq
uity
Figures in € thousand Cum
ulat
ive
tran
slat
ion
adju
stm
ent
Res
erve
for
ca
sh f
low
hed
ges
Balance at Jan. 1, 2015 43,774 107,240 0 (53,722) 0 (234) 0 97,058 290 97,348
Result for the period — — — 3,299 — — — 3,299 293 3,592
Other comprehensive income — — — 18 — 1,484 0 1,502 — 1,502
Deferred taxes for valuation changes recognized directly in equity — — — 1 — — — 1 — 1
Comprehensive income — — — 3,318 0 1,484 0 4,802 293 5,095
Dividends — — — — — — — — (49) (49)
Changes to scope of consolidation — — — — — — — — — —
Balance at Dec. 31, 2015 43,774 107,240 0 (50,404) 0 1,250 0 101,860 534 102,394
Result for the period — — — 5,064 — — — 5,064 (429) 4,635
Other comprehensive income — — — (7) — 959 — 952 — 952
Deferred taxes for valuation changes recognized directly in equity — — — — — — — — — —
Comprehensive income — — — 5,057 — 959 — 6,016 (429) 5,587
Allocation to retained earnings — — 10,000 (10,000) — — — — — —
Repurchase of treasury stock (536) (536) (536)
Dividends — — — — — — — — (73) (73)
Changes to scope of consolidation — — — — — — — — 738 738
Balance at Dec. 31, 2016 43,774 107,240 10,000 (55,347) (536) 2,209 0 107,340 770 108,110
* cf. Notes (18) to (20)
Consolidated Statement
of Changes in Equity*
043Consolidated Financial StatementsConsolidated Statement of Changes in Equity

Notes to the Consolidated Financial Statements
For the Fiscal Year from January 1, 2016 to December 31, 2016
Deufol SE is domiciled in Hofheim am Taunus and has been entered in the Frankfurt am Main commer-
cial register under the number HRB 95470.
Deufol is a global premium service provider in the field of packaging and supplementary services.
Please see the disclosures in the segment reporting for further details.
The address of the Company’s registered office is Johannes-Gutenberg-Strasse 3–5, 65719 Hofheim
am Taunus, Germany. Since late November 2015, the Company’s shares have no longer been traded on
the Frankfurt Stock Exchange (delisting). Lion’s Place GmbH is the parent company which prepares the
consolidated balance sheet for the largest group of companies.
The Company’s managing directors approved the IFRS consolidated financial statements on April 26,
2017 so that they could then be forwarded to the Administrative Board.
Deufol SE prepares its consolidated financial statements in accordance with the International Financial
Reporting Standards (IFRS) as mandatorily applicable in the European Union. In addition, the provisions of
section 315 a (3) of the German Commercial Code (HGB) are complied with and applied in the preparation
of the consolidated financial statements. All IFRS (IFRS, IASs, IFRICs, SICs) as adopted by the European
Union and mandatorily applicable as of the balance sheet date were applied. In principle, the consolidated
financial statements are prepared using the historical-cost concept. This excludes derivative financial in-
struments and financial assets available for sale, which are measured at fair value.
All subsidiaries over which Deufol SE has legal or practical control are included in the consolidated
financial statements. In addition to Deufol SE, the consolidated financial statements include 18 (previous
year: 19) fully consolidated subsidiaries in Germany and 24 (previous year: 15) in other countries (here-
inafter referred to as the “Deufol Group” or the “Group”).
Joint ventures are included in the consolidated financial statements using the equity method in ac-
cordance with IFRS 11 in combination with IAS 28. Other significant equity investments are accounted
for using the equity method if the Deufol Group does not hold a controlling interest, but is able to exert
a significant influence on the operating and financial policies of the investee. This is always the case if it
holds between 20 % and 50 % of the voting rights (“associates”).
On acquisition of an equity investment accounted for using the equity method, the difference be-
tween cost and proportionate equity is initially allocated to the assets and liabilities of this investment
by making certain adjustments to the fair values. Any remaining excess of cost of acquisition over net
assets acquired is recognized as goodwill, and is not amortized.
If the recoverable amount of an investment in an associate (the higher of its value in use and its
fair value less costs to sell) falls below the carrying amount this will lead to a corresponding impair-
ment. The impairment loss will be recognized in the income statement.
The annual financial statements of consolidated companies are prepared as of the reporting date of
the consolidated financial statements.
Acquisition accounting is performed in accordance with the purchase method, whereby the cost
of the acquired interests is eliminated against the parent’s share of the revalued equity at the date
of acquisition. Any resulting difference is allocated to the corresponding assets and liabilities of the
subsidiary insofar as it is due to hidden reserves or hidden liabilities. Any remaining excess of cost of
acquisition over net assets acquired is recognized as goodwill. In accordance with IFRS 3 (Business
Combinations) in combination with IAS 36 (Impairment of Assets), goodwill is not amortized over the
expected useful life, but instead tested at least annually to establish whether there is any need to rec-
ognize impairment losses.
General Information
Basis of Preparation
Consolidation
044 Consolidated Financial Statements Notes to the Consolidated Financial Statements
Basis of Preparation
General Information

Noncontrolling interests represent the share of net profit / loss and net assets that is not attributable to
the Group. They are reported separately in the consolidated income statement and the consolidated bal-
ance sheet. They are reported on the face of the consolidated balance sheet as a separate component of
equity from the equity attributable to the shareholders of the parent company.
Intercompany receivables and liabilities, revenue, expenses, income and profits are eliminated as part
of consolidation.
The consolidated financial statements are prepared in euros, the functional and presentation currency of
the Deufol Group. Unless indicated otherwise, all amounts are given in thousands of euros.
Each company within the Deufol Group determines its own functional currency. The annual financial
statements of the foreign subsidiaries included in the consolidated financial statements whose functional
currency is not the euro were converted into the Group currency (euro) on the balance sheet cut-off date
pursuant to IAS 21 in accordance with the functional-currency concept. Financial statements are trans-
lated using the modified-closing-rate method, i. e. balance sheets are translated from the functional cur-
rency to the reporting currency at the middle rate on the balance sheet date, while income statements
are translated at the average rates for the year. Equity is translated at historical rates.
Differences resulting from the translation of assets and liabilities compared with the translation of the
previous year and translation differences between the income statement and the balance sheet are taken
directly to equity and are reported under “Other recognized income and expense”. When a foreign opera-
tion is disposed of, the cumulative amount recognized in equity for this foreign operation is reversed to the
income statement.
Foreign-currency transactions are translated at the spot rate of the foreign currency to the functional
currency prevailing at the transaction date. Foreign-currency monetary assets and liabilities are trans-
lated at the rate on the balance sheet date. The resulting foreign exchange differences are recognized in
profit or loss for the period, with the exception of foreign exchange differences resulting from foreign-
currency loans insofar as the loans are used to hedge a net investment in a foreign operation. These are
recognized directly in equity until the net investment is disposed of and only recognized in profit or loss
on the date of disposal.
The exchange rates for the translation of key currencies that are not part of the European Monetary Union
changed as follows:
Foreign currency Middle rate as of the balance sheet date
Average rate for the year
per € 2016 2015 2016 2015
US dollar 1.0541 1.0887 1.1066 1.1096
Renminbi 7.3202 7.0608 7.3496 6.9730
Singapore dollar 1.5234 1.5417 1.5278 1.5251
Czech crown 27.021 27.023 27.0343 27.285
Sales are primarily generated from services, products and rental agreements. Sales resulting from the
provision of services and from third-party use of assets of the Company will only be recognized where it
is sufficiently probable that the economic benefits associated with the transaction will flow to Deufol and
the amount of income can be measured reliably. Sales resulting from selling of goods will be recognized
where the key risks and opportunities associated with ownership of the sold merchandise and products
have been transferred to the purchaser, Deufol does not retain any right or power of disposal for the sold
merchandise and products, the amount of sales can be measured reliably, it is sufficiently probable that
the economic benefits associated with the transaction will flow to Deufol and the costs resulting in con-
nection with the sale can be measured reliably. Sales are recognized net of purchase price reductions
such as cash and sales discounts and rebates.
Currency Translation
Sales Recognition
045Consolidated Financial StatementsNotes to the Consolidated Financial Statements
Basis of Preparation

Earnings per share (EPS) are calculated in accordance with IAS 33. Basic earnings per share are calcu-
lated by dividing the net profit / loss for the period attributable to the holders of common shares of the
parent company by the weighted average number of common shares in circulation. Shares newly issued
or repurchased during a period are included pro rata for the time they are in circulation. Diluted earnings
per share are calculated by dividing the adjusted net profit / loss for the period attributable to the holders
of common shares of the parent company by the weighted average number of common shares in circula-
tion and the weighted average number of common shares that would be issued following the conversion
of all potential common shares with a dilutive effect into common shares.
Purchased intangible assets with finite useful lives are recognized at cost and amortized on a straight-line
basis over their economic lives. Proprietary software is capitalized at cost and undergoes straight-line
amortization over its economic life. Capitalized software licenses are amortized over their expected useful
life of three to eight years or over the term of the relevant agreement. The amortization recognized is al-
located to the relevant functions in the income statement based on the asset’s use. If there are indications
of impairment and the recoverable amount is less than amortized cost, impairment losses are recognized
on the intangible assets. If the reasons for impairment cease to apply, the impairment losses are reversed
accordingly, up to the amortized cost. This does not apply to capitalized goodwill.
Goodwill is recognized in accordance with IFRS 3 (Business Combinations) in conjunction with IAS 36
(Impairment of Assets). These standards require goodwill to be tested annually for impairment rather than
amortized.
The accounting principles for intangible assets are as follows:
Customer
relationshipsLicenses and
software
Amortization method used Straight-line Straight-line
Useful life 5 – 6 years 3 – 8 years
Remaining useful life up to 6 years up to 8 years
Property, plant and equipment are carried at cost less straight-line depreciation recognized over the
economic life of the respective item.
Assets are removed from the balance sheet on disposal or scrapping; any disposal gains or losses are
recognized in income.
The following useful lives are used for depreciation:
Useful lives of property, plant and equipment
Factory and office buildings 10 – 50 years
Operating and office equipment 3 – 10 years
Machinery and equipment 6 – 20 years
Vehicle fleet 5 – 7 years
Earnings per Share
Intangible Assets and
Goodwill
Property, Plant and Equipment
046 Consolidated Financial Statements Notes to the Consolidated Financial Statements
Basis of Preparation

If there are indications of impairment and the recoverable amount is less than amortized cost, impairment
losses are recognized on the items of property, plant and equipment. If the reasons for impairment cease to
apply, the impairment losses are reversed accordingly, up to the amortized cost. More complex items of
property, plant and equipment consisting of clearly separable components with different useful lives are
split into these components for the purposes of calculating depreciation. Depreciation is calculated using
the useful lives of the individual components.
Investment property as defined by IAS 40 is carried at depreciated cost and, if applicable, depreciated
on a straight-line basis over the same useful lives used for items of property, plant and equipment of the
same type. The fair value of investment property is determined using recognized valuation techniques or
on the basis of the current market price of comparable properties and disclosed in the Notes.
The process of determining whether an arrangement contains a lease is performed on the basis of the
substance of the arrangement at the date on which it is entered into, and requires a judgment on whether
meeting the respective contractual obligations is dependent on the use of one or more specific assets and
whether the arrangement transfers the right to use those assets.
Group as Lessee
Finance leases that transfer substantially all the risks and rewards incident to ownership of an asset to the
Group result in the leased asset and the corresponding liability being recognized at the inception of the
lease at the lower of the fair value of the asset or the present value of the minimum lease payments.
If there is no reasonable certainty that the Deufol Group will obtain ownership at the end of the lease
term, recognized leased assets are depreciated on a straight-line basis over the shorter of the lease term
or the useful life of the asset.
Lease payments are apportioned between the finance costs and the repayment of the outstanding li-
ability so as to produce a constant rate of interest on the remaining balance of the liability. Finance costs
are recognized immediately as expenses in the financial results.
Leases that do not transfer substantially all the risks and rewards associated with the leased item to
the Group are classified as operating leases. Lease payments under operating leases are expensed on a
straight-line basis over the term of the lease.
Group as Lessor
Leases that do not transfer substantially all the risks and rewards incident to ownership of an asset from
the Group to the lessee are classified as operating leases. Initial direct costs incurred in negotiating and
arranging an operating lease are added to the carrying amount of the leased asset and expensed over the
lease term in proportion to the recognition of rental income. Contingent rent is recognized in the period
in which it is generated.
Leases that transfer substantially all the risks and rewards incident to ownership of an asset from the
Group to the lessee are classified as finance leases with the Group as lessor. Lease payments are divided
up into finance income and repayment of lease receivables.
Sale and Lease-Back Transactions
Leases resulting from sale and lease-back transactions are classified in accordance with the general
leasing criteria and are treated either as finance or operating leases. In the case of a finance lease, the
carrying amount of the capital good is continues to be amortized as before. Any disposal gain is recog-
nized and reversed in the income statement against the applicable finance expenditure over the term
of the agreement.
Investment Property
Leases
047Consolidated Financial StatementsNotes to the Consolidated Financial Statements
Basis of Preparation

Investments in joint ventures and associates are accounted for using the equity method. The cost of invest-
ments accounted for using the equity method is increased or decreased annually by changes in equity inso-
far as these are attributable to the Deufol Group.
Under the provisions of IAS 39, these financial instruments are classified as “financial assets at fair
value through profit or loss”, “loans and receivables”, “held-to-maturity investments” or “available-for-
sale financial assets”.
Financial assets are recognized for the first time at fair value plus any transaction costs (excluding
financial instruments held for trading and financial assets at fair value through profit or loss).
Financial assets at fair value through profit or loss are carried at fair value, with fair value changes
recognized in the income statement. This includes financial assets held for trading.
Loans and receivables are measured at amortized cost with application of the effective-interest method
and less impairments. Income / losses are recorded in the income (loss) for the period.
Held-to-maturity investments are carried at amortized cost using the effective-interest method.
Available-for-sale financial assets are carried at fair value, with fair-value changes less income tax
expense recognized as gains or losses from the fair-value measurement of financial instruments and
presented as a portion of the accumulated changes recognized directly in equity.
The Company’s management classifies financial assets on acquisition and checks their classification
at each balance sheet date.
All standard market purchases and sales of financial assets are recorded in the balance sheet on the
transaction date, i. e. the date on which the Company entered into the obligation to purchase the asset.
In case of objective indications of an impairment of assets accounted for at amortized cost, the im-
pairment loss is the difference between the carrying amount of the asset and the present value of the
expected future cash flows (with the exception of expected future loan losses which have yet to occur),
discounted at the original effective interest rate for the financial asset, i. e. the effective interest rate
determined at the initial valuation. The carrying amount for the asset is reduced with use of a valuation
account. The impairment loss is recognized in the income statement.
In case of a decrease in the valuation adjustment in the following reporting periods, where this
decrease is objectively attributable to circumstances occurring after recording of the valuation ad-
justment, the previously recorded valuation adjustment will be canceled. However, the new carrying
amount of the asset may not exceed the amortized cost at the reinstatement of the original value. The
reinstatement of the original value will be recognized in income.
In case of objective indications for trade receivables that amounts due will not all be received in ac-
cordance with the originally agreed invoice terms (e. g. the probability of an insolvency or significant
financial difficulties for the debtor), an impairment will occur with use of a valuation account. Receiv-
ables are closed out once they are classified as uncollectible.
Joint Ventures and Associates
Nonderivative Financial Assets
048 Consolidated Financial Statements Notes to the Consolidated Financial Statements
Basis of Preparation

A financial asset (or a portion of a financial asset or a portion of a group of similar financial assets) will
be closed out subject to one of the three following conditions:
The contractual rights to receive cash flows resulting from a financial asset have expired.
The Group will retain the rights to receive cash flows resulting from financial assets but assumes a
contractual obligation of immediate payment of the cash flows to a third party under an agreement
fulfilling the conditions laid down in IAS 39.19 (“pass-through-arrangement”).
The Group has transferred its contractual rights to receive cash flows resulting from a financial asset,
thereby either (a) substantially transferring all risks and opportunities associated with ownership of the
financial asset or (b) not having substantially transferred or retained all risks and opportunities associ-
ated with ownership of the financial asset, but having transferred the power of control over the asset.
As a rule, derivative financial instruments are exclusively used by the Group to hedge interest-rate fluc-
tuation risks. The Group applies the hedge accounting rules pursuant to IAS 39 in the course of its ac-
counting. The effective portion of the profit or loss resulting from a cash flow hedge is recorded directly in
equity as a portion of the accumulated changes recognized directly in equity, including deferred taxes,
while the ineffective portion is immediately recognized in income. Derivatives are measured according to
recognized methods and in consideration of current market parameters. The “critical-term-match” method
is used to determine effectiveness. The financial instruments in their entirety are explained in Note (39).
Where a fixed obligation not shown in the balance sheet is classified as an underlying transaction, the
following accumulated change in the fair value of the fixed obligation attributable to the hedged risk will
be recognized in the result for the period as an asset or liability with a corresponding profit or loss. The
changes in the fair value of the hedging tool will also be recognized in the period result.
Cash Flow Hedges
The amounts recognized in equity will be reclassified in the income statement in the period in which the
hedged transaction affects the period result, e. g. if hedged financial income or expenses are recognized
or if an expected sale is executed. Where a hedge leads to the reporting of a non-financial asset or a non-
financial liability, the amounts recognized in equity will form part of the costs of acquisition at the time of
the addition of the non-financial asset or non-financial liability.
Where the stipulated transaction or fixed obligation is no longer expected to be realized, the amounts
previously recognized in equity will be reclassified to the income statement. In case of the expiry or sale,
termination or exercise of the hedging tool without a replacement or the rollover of the hedging tool into
another hedging tool, the amounts previously recognized in equity will remain a separate equity item until
the envisaged transaction or fixed obligation has been realized.
Cash and cash equivalents on the face of the balance sheet comprise cash on hand, checks, bank balances
and short-term deposits with an original maturity of up to three months.
Inventories are carried at the lower of cost and net realizable value. As a rule, carrying amounts are cal-
culated using the weighted-average-cost method; for certain inventories, the FIFO method is used. Cost
comprises all production-related costs, calculated on the basis of normal employment. As well as direct
costs (such as direct material and manufacturing costs), it also includes fixed and variable material and
manufacturing overheads relating to the production process and appropriate portions of depreciation of
manufacturing equipment.
Derivative
Financial Instruments
Cash and Cash Equivalents
Inventories
049Consolidated Financial StatementsNotes to the Consolidated Financial Statements
Basis of Preparation

Deferred taxes are calculated using the balance sheet liability method in accordance with IAS 12. This
standard requires deferred taxes to be recognized for all temporary differences between the tax bases
of the individual companies and the carrying amounts according to IFRS, and on consolidation adjust-
ments. Deferred tax assets are also recognized for future benefits expected to arise from tax loss carry-
forwards. However, deferred tax assets have only been recognized for accounting differences and for tax
loss carryforwards to the extent that it is probable that the asset will be realized. Deferred tax assets are
measured at the applicable national rates of income tax. In Germany, deferred tax assets were calculated
using a tax rate of 28.39 % (previous year: 29.72 %). This includes corporation tax at 15 %, the solidar-
ity surcharge of 5.5 % on the corporation tax and the average rate of trade tax within the Group.
Deferred tax assets and liabilities are measured at the tax rates that are expected to apply to the pe-
riod when an asset is realized or a liability is settled. Deferred taxes for items recognized directly in eq-
uity will also be recognized directly in equity. Deferred tax liabilities are not recognized in case of taxable
temporary differences associated with investments in subsidiaries and associates where the timeframe for
the reversal of the temporary differences may be controlled and a reversal of the temporary differences is
not probable in the foreseeable future.
Items taken directly to equity are reported under this item, unless they result from capital transactions with
shareholders, such as capital increases or dividend payments. This item includes the cumulative transla-
tion adjustment and unrealized gains or losses from the fair-value measurement of financial instruments,
and derivatives used in cash flow hedges as well as actuarial gains and losses in connection with pension
commitments. They are recognized including deferred taxes, where applicable.
The actuarial valuation of pension provisions for defined benefit plans is based on the “projected-unit-
credit method” prescribed in IAS 19. The interest element of pension expenses is shown as a finance cost.
Actuarial gains and losses are recognized directly in other comprehensive income.
In the case of defined contribution pension plans (e. g. direct insurance schemes), the contributions
payable are recognized immediately as an expense. Provisions are not recognized for defined-contribu-
tion plans, as in these cases, the Group has no other obligation above and beyond its obligation to pay
premiums.
Other provisions are recognized where a present obligation exists to third parties as a result of a past
event, an outflow of resources is expected and the amount can be reliably measured. They are uncertain
obligations that are recognized in the amount of the best estimate. Provisions with a remaining maturity
of more than one year are discounted at market interest rates reflecting the risk specific to the liability and
the period of time until the settlement date.
Deferred Taxes
Other Recognized Income
and Expense
Provisions for Pensions
and Similar Obligations
Other Provisions
050 Consolidated Financial Statements Notes to the Consolidated Financial Statements
Basis of Preparation

Financial liabilities are carried at amortized cost. Differences between historical cost and the repayment
amount and transaction costs are accounted for using the effective-interest method. Other liabilities are
carried at their nominal value or the repayment amount. Noncurrent other liabilities bearing no interest
are accounted for at their present value.
A financial liability will be closed out in case of the fulfillment, cancellation or expiry of the underlying
obligation for this liability.
Where an existing financial liability is replaced by another financial liability of the same lender sub-
ject to substantially different contract terms or where the terms of an existing liability are subject to sub-
stantial change, this replacement or change will be treated as a closing-out of the original liability and a
valuation for a new liability. The difference between the respective carrying amounts will be recognized
in income.
Where the Group acquires treasury stock, this is recognized at cost on acquisition and deducted from eq-
uity. The purchase, sale, issue or withdrawal of treasury stock is not recognized in income. Differences
between the net carrying amount and the counterperformance are recorded in the capital reserves.
The cash flow statement is prepared in accordance with the provisions of IAS 7 and shows the changes in
the Group’s cash and cash equivalents in the course of the year under review as a result of cash inflows
and outflows. A distinction is made between cash flows from operating activities, investing activities and
financing activities. Cash flows from operating activities are presented using the indirect method.
Segment reporting is performed in accordance with IFRS 8 (“Operating Segments”). The segments corre-
spond to those of the internal reporting structure. Segmentation aims to make transparent the assets and
financial position and results of operations of the Group’s individual activities and its various regions.
All borrowing costs are expensed in the period in which they are incurred. The Group does not have any
qualified assets requiring mandatory inclusion of borrowing costs in their historical costs.
Deufol has received government grants relating to its investment projects. Pursuant to IAS 20, these
are deducted when determining the carrying amount of the respective asset and recognized as income
over the asset’s useful life by means of a reduction in depreciation or, in case of performance-related
grants, deducted from the corresponding expenses in the income statement. Government grants are
recognized if there is reasonable assurance that the grants will be received and the Company meets the
conditions attached to the grants.
Non-Derivative Financial
Liabilities and Other Liabilities
Treasury Stock
Cash Flow Statement
Segment Reporting
Borrowing Costs
Government Grants
051Consolidated Financial StatementsNotes to the Consolidated Financial Statements
Basis of Preparation

The preparation of the consolidated financial statements in accordance with IFRS sometimes requires
the managing directors to make estimates or assumptions that can affect the reported amounts of as-
sets, liabilities and financial liabilities as of the balance sheet date, and the income and expenses for
the reporting period. Actual amounts and changes may differ from these estimates and assumptions.
The significant judgments and estimates applied are described in the following section:
A significant portion of the valuation adjustment for doubtful accounts receivable relates to assessments
and judgments regarding individual receivables which are based on the credit worthiness of the relevant
customer, current economic trends and an analysis of historical losses of receivables outstanding on a
portfolio basis.
Recognition and valuation of other provisions are based on an estimate of the probability of the fu-
ture outflow of benefits, supplemented by past experience and the circumstances known at the balance
sheet date. As such, the actual outflow of benefits may differ from the amount recognized under other
provisions. Please see Note (23) for further disclosures.
Deferred tax assets from tax loss carryforwards are recognized on the basis of an estimate of the
future recoverability of the corresponding tax benefits, i. e. if there is expected to be sufficient taxable
income or reduced tax expense in future. The next five years is assumed as the assessment timeframe
for this. The actual taxable income situation in future periods, and hence the extent to which tax loss
carryforwards can actually be utilized, may differ from the estimate performed at the date on which the
deferred taxes are recognized. Please see Note (7) for further disclosures.
Significant forward-looking estimates and assumptions are made in the context of the impairment
tests performed on goodwill, because the discounted-cash-flow method used for these tests requires the
calculation of future cash flows, an appropriate rate of interest and long-term future growth rates. Any
change in these factors may affect the results of such impairment tests. Please see Note (11) for further
disclosures.
Valuation of property, plant and equipment and intangible assets with a limited useful life requires
the use of estimates for calculation of the fair value at the time of acquisition, particularly for assets ac-
quired in connection with a business combination. In addition, these assets’ expected useful life is to be
determined. Calculation of the fair values of the assets and their useful life and the impairment testing in
case of indications of impairment are based on judgments made by the management. Please see Notes
(10) and (11) for further disclosures.
Where an agreement regarding a business combination stipulates an adjustment of the costs of acqui-
sition for the combination such as is dependent on future events, the amount of this adjustment will be
incorporated in the costs of acquisition for the combination at the time of acquisition if the adjustment is
probable and can be reliably measured.
Further judgments may be required for the classification of leases.
In principle, the balancing and valuation methods used are the same as those used in the previous year,
with the exception of the following IFRS standards and interpretations (“new accounting standards”)
used for the first time in the fiscal year.
Management Judgments and
Key Sources of Estimation
Uncertainty
Changed Accounting and
Valuation Methods
052 Consolidated Financial Statements Notes to the Consolidated Financial Statements
Basis of Preparation

Adopted IFRS
The accounting and valuation methods applied in the consolidated financial statements correspond to
the IFRS whose adoption is mandatory in the EU from December 31, 2016.
Published IFRS Endorsed by the EU and Adopted for the First Time in the Fiscal Year
The standards whose first-time adoption was mandatory in the EU as of January 1, 2016 have not had any
significant effect on the consolidated financial statements.
Published IFRS Endorsed by the EU and Not Yet Adopted
In May 2014, the IASB published the standard IFRS 15 “Revenue from Contracts with Customers”. It re-
places existing guidelines for the recognition of revenue, including IAS 18, IAS 11 and IFRIC 13. The new
standard provides a comprehensive framework for clarifying in what amount and when revenues are rec-
ognized. IFRS 15 envisages a uniform, five-step revenue realization model. It also expands the disclosure
requirements.
IFRS 15 is mandatorily applicable, at the latest, for fiscal years beginning on or after January 1, 2018.
Early adoption is permitted. Deufol will adopt IFRS 15 for the first time for the fiscal year beginning on
January 1, 2018. Deufol is currently reviewing what effects the adoption of IFRS 15 will have on the Com-
pany’s consolidated financial statements.
In July 2014, the IASB published the standard IFRS 9 “Financial Instruments” which is intended to
replace IAS 39. IFRS 9 includes a standard model classifying and defining the valuation method (includ-
ing impairment) for financial instruments. IFRS 9 also includes hedge accounting rules. IFRS 9 neces-
sitates additional notes.
The effects of adoption of IFRS 9 on the consolidated financial statements are currently being re-
viewed. Deufol will adopt IFRS 9 for the first time for the fiscal year beginning on January 1, 2018.
At the present time, Deufol does not expect the transition to IFRS 9 to have any significant effect on
its net assets, financial position and results of operations.
Published IFRS Not Yet Endorsed by the EU and Not Yet Adopted
In January 2016, the IASB published the standard IFRS 16 “Leases” which is intended to replace IAS 17
and IFRIC 4, inter alia. For lessees, IFRS 16 abolishes the previous classification of leases as operating and
finance leases. IFRS 16 replaces this with a uniform valuation model obliging lessees to report assets for
the right of use and leasing liabilities for leases with a term of more than twelve months. This means that
leases not previously reported in the balance sheet must be shown in the balance sheet in future, in a for-
mat largely analogous with current balance-sheet reporting for finance leases. The balance-sheet reporting
requirements for the lessor set out in IAS 17 have been incorporated in IFRS 16 virtually unchanged.
Adoption of IFRS 16 is compulsory for fiscal years beginning on or after January 1, 2019; early adop-
tion is permitted if IFRS 15 has already been adopted. Deufol will likely adopt IFRS 16 for the first time
for the fiscal year beginning on January 1, 2019.
The effects of adoption of IFRS 16 on the consolidated financial statements are currently being reviewed.
The other published standards and interpretations which have not yet been transposed by the EU
are not expected to have any significant effect on the Group’s net assets, financial position and results
of operations.
New Accounting Standards
053Consolidated Financial StatementsNotes to the Consolidated Financial Statements
Basis of Preparation

In addition to Deufol SE, the group of fully consolidated companies includes all major subsidiaries and
subgroups over which Deufol SE has legal or practical control.
Dec. 31, 2015 Additions Disposals Dec. 31, 2016
Consolidated subsidiaries 34 10 2 42
thereof in Germany 19 1 2 18
thereof abroad 15 9 0 24
Companies valued using the equity method 8 1 1 8
thereof in Germany 5 0 1 4
thereof abroad 3 1 0 4
Total 42 11 3 50
The following table shows the companies fully consolidated as of December 31, 2016:
Companies fully consolidated as of Dec. 31, 2016
Land Equityinterest (%)*
Deufol Services & IT GmbH, Hofheim am Taunus Germany 100.0
Deufol Airport Services GmbH, Hofheim am Taunus Germany 88.0
Deufol time solutions GmbH, Hofheim am Taunus Germany 100.0
DRELU Holzverarbeitung GmbH, Remscheid Germany 55.1
Deufol Nürnberg GmbH, Nuremberg, (incl. subsidiaries) Germany 100.0
Deufol Hamburg GmbH, Hamburg Germany 100.0
Deufol Frankfurt GmbH, Frankfurt am Main Germany 100.0
Deufol West GmbH, Mülheim an der Ruhr Germany 100.0
Deufol Nord GmbH, Peine Germany 100.0
Deufol Bochum GmbH, Bochum Germany 100.0
Deufol Süd GmbH, Neutraubling Germany 100.0
DTG Verpackungslogistik GmbH, Fellbach Germany 51.0
Deufol Remscheid GmbH, Remscheid Germany 100.0
IAD Industrieanlagen-Dienst GmbH, Munich Germany 100.0
Deufol München GmbH, Garching-Hochbrück Germany 100.0
Deufol Berlin GmbH, Berlin Germany 100.0
Deufol Südwest GmbH, Frankenthal Germany 100.0
Rieder Verpackungs- und Logistik GmbH, Kleinzell nr. Hainfeld (incl. its subsidiaries) Austria 60.0
Packing Center Terminal Graz Süd GesmbH, Werndorf Austria 60.0
Rieder Kistenproduktiongesellschaft m. b. H.. Ramsau nr. Hainfeld Austria 60.0
Deufol Austria GmbH, Bruck a. d. Leitha Czech Republic 60.0
Deufol Česká republika a. s., Ivančice Slovak Republic 100.0
Deufol Slovensko s. r. o., Krušovce China 100.0
Deufol (Suzhou) Packaging Co. LTD, Suzhou USA 100.0
Deufol North America Inc., Sunman, Indiana (including subsidiaries) USA 100.0
Deufol Sunman Inc., Sunman, Indiana USA 100.0
Deufol Charlotte LLC., Charlotte, North Carolina USA 100.0
* attributable to the relevant parent
Scope of Consolidation
Consolidated Companies
054 Consolidated Financial Statements Notes to the Consolidated Financial Statements
Scope of Consolidation

Companies fully consolidated as of Dec. 31, 2016
Country Equityinterest (%)*
Deufol Packaging Tienen N. V., Tienen Belgium 100.0
Deufol Logistics Tienen N. V., Tienen Belgium 100.0
Deufol België N. V., Tienen (incl. subsidiaries) Belgium 100.0
Arcus Installation B. V. B. A., Houthalen Belgium 100.0
Deufol Technics N. V., Houthalen Belgium 100.0
Deufol Waremme S. A., Waremme Belgium 98.8
Manamer NV, Antwerp Belgium 100.0
Novaedes International NV, Antwerp (incl. its subsidiaries) Belgium 100.0
Novaedes HP NV, Lier Belgium 100.0
Novaedes Port of Antwerp NV, Antwerp Belgium 100.0
Novaedes Brussels NV, Machelen Belgium 100.0
Novaedes Germany GmbH, Butzbach Germany 100.0
Novaedes France SAS, Mitry Mory France 100.0
Deufol Immobilien CZ s. r. o., Brno Czech Republic 100.0
Deufol Italia S. p. A., Fagnano Olona Italy 100.0
* attributable to the relevant parent
The following companies were included in consolidation using the equity method:
Companies accounted for using the equity method as of Dec. 31, 2016
Country Equityinterest (%)*
SIV Siegerländer Industrieverpackungs GmbH, Kreuztal Germany 50.0
Deutsche Tailleur Bielefeld GmbH & Co. KG, Bielefeld Germany 30.0
Mantel Industrieverpackung GmbH, Stockstadt Germany 50.0
Deufol-Meilink GmbH, Troisdorf Germany 50.0
Deufol Meilink Asia Pacific PTE. LTD., Singapore Singapore 50.0
Deufol Meilink (Yantai) Packaging Co. LTD, Yantai China 50.0
Seaworthy Packaging Solutions Co. Ltd., Taichang China 30.0
Deufol St. Nabord SAS, Saint Nabord France 24.0
* attributable to the relevant parent
Deufol SE holds at least 20 % of the shares in the following companies:
Company’s name and registered office
Country Equity interest (%)
Equity in € thousand
Result for the fi scal year in
€ thousand
Deufol Securitas Int. GmbH i. L., Hamburg* Germany 50.00 44 (3)
GGZ Gefahrgutzentrum Frankenthal GmbH i. I., Frankenthal** Germany 100.00 (177) (189)
Deutsche Tailleur BielefeldBeteiligungs GmbH, Bielefeld Germany 30.00 71 3
Securitas Int. B. V., Antwerp Belgium 50.00 — —
* as of December 31, 2015 ** as of December 31, 2011
Financial assets accounted for
using the equity method
Information in Accordance
with Section 313 (2) No. 4 of
the German Commercial Code
055Consolidated Financial StatementsNotes to the Consolidated Financial Statements
Scope of Consolidation

In fiscal year 2016, Deufol Nürnberg GmbH contributed its share in Deufol Austria GmbH, Austria, to
Rieder Verpackungs- und Logistik GmbH, Austria, in return for the issuance of new shares in Rieder
Verpackungs- und Logistik GmbH. Following this contribution, Deufol Nürnberg GmbH holds 60 % of
the shares in Rieder Verpackungs- und Logistik GmbH (corresponding to nominal capital in the amount
of € 117 thousand). This contribution was made with economic effect as of January 1, 2016. Control was
transferred to the Deufol Group as of this date.
Through the business combination with Rieder Verpackungs- und Logistik GmbH, as well as Rieder
Verpackungs- und Logistik GmbH since January 1, 2016 Rieder Kistenproduktiongesellschaft m. b. H.,
Austria, and Packing Center Terminal Graz Süd GesmbH, Austria – each of which is wholly owned by
Rieder Verpackungs- und Logistik GmbH – have been included in the consolidated financial statements
of Deufol SE for the first time, by way of full consolidation. Rieder Verpackungs- und Logistik GmbH also
holds 50 % of the shares in Seaworthy Packaging Solutions Co. Ltd., China. This company has been con-
solidated at equity since January 1, 2016.
The Rieder corporate group is active in the field of packaging services in Austria. Through this acqui-
sition, the Deufol Group will supplement and expand its market position in Austria.
The following summary shows the fair values of the assets and liabilities of the above-mentioned compa-
nies consolidated for the first time, as of the date of consolidation:
Figures in € thousand
Fair values as of date of
c onsolidation
Intangible assets 638
Property, plant and equipment 2,713
Inventories 1,834
Receivables 2,864
Cash and cash equivalents 17
Total assets 8,065
Provisions 242
Financial liabilities 2,216
Other liabilities 6,138
Total liabilities 8,596
Acquired (negative) net assets (530)
Goodwill from company acquisitions 1,271
Share held by noncontrolling interests 296
Purchase price (non-cash transaction, since purchase price settled through contribution) 741
Acquired cash and cash equivalents 17
Inflow from acquisition of the Rieder Group 17
The allocation of the purchase price as of the date of acquisition resulted in intangible assets in the
amount of € 418 thousand, property, plant and equipment in the amount of € 528 thousand and deferred
tax liabilities in the amount of € 237 thousand. These intangible assets comprise customer relationships,
while property, plant and equipment include the release of hidden reserves for real estate. Goodwill in the
amount of € 1,271 thousand comprises non-separable intangible assets such as Deufol’s employees’ tech-
nical expertise as well as expected synergies.
Noncontrolling interests are valued at the fair value of the subsidiaries’ net assets (purchased good-
will method).
For Deufol, including the earnings effects resulting from the purchase price allocation due to the write-
down of the released hidden reserves (€ 230 thousand) and sales in the amount of € 14.8 million, the busi-
ness combination with the Rieder Group has contributed to net income in the amount of – € 0.7 million.
Acquisitions and Sales
056 Consolidated Financial Statements Notes to the Consolidated Financial Statements
Scope of Consolidation

In fiscal year 2016, Deufol Belgie N. V., Belgium, a wholly owned subsidiary of Deufol SE, acquired
100 % of the shares in Novaedes International N. V., Belgium, and Manamer N. V., Belgium. The pur-
chase price for the shares in these two companies is € 9 million. Of this amount, € 1.5 million was paid
in December 2016. A further € 4.75 million is due in January 2017. The residual purchase price of
€ 2.75 million is payable on December 31, 2019. The residual purchase price payment was reported in
the balance sheet as of December 31, 2016 at a fair value of € 2.5 million. As well as the fixed purchase
price, there is also a variable purchase price. This is dependent on fulfillment of specific earnings tar-
gets over the next three years and may amount to up to € 1.5 million. The variable purchase price com-
ponent was reported in the balance sheet as of December 31, 2016 at a fair value of € 1.36 million.
The date of acquisition was December 29, 2016. On grounds of simplification, the carrying amounts
as of December 31, 2016 are shown.
Novaedes International N. V. in turn holds 100 % of the shares in Novaedes HP N. V., Belgium, in No-
vaedes Port of Antwerp N. V., Belgium, in Novaedes Brussels N. V., Belgium, in Novades France S. a. r. l.,
France, and in Novaedes Germany GmbH, Butzbach. Since December 31, 2016, these companies have
been included in the consolidated financial statements by way of full consolidation. Manamer N. V. does
not hold any shares in other companies.
The Novaedes corporate group is active in the field of packaging services in Belgium. Through this
acquisition, the Deufol Group will supplement and expand its market position in Belgium and also gain
access to the port of Antwerp.
The following summary shows the fair values of the assets and liabilities of the above-mentioned compa-
nies consolidated for the first time, as of the date of consolidation:
Figures in € thousand
Fair values as of date of
consolidation
Intangible assets 2,737
Property, plant and equipment 12,011
Other noncurrent assets 2,067
Inventories 841
Receivables 6,660
Cash and cash equivalents 982
Total assets 25,299
Provisions 141
Financial liabilities 9,942
Other liabilities 6,456
Total liabilities 16,539
Acquired net assets 8,760
Discounted purchase price 10,100
Goodwill from company acquisitions 1,340
Discounted purchase price 10,100
Less portion of purchase price not due (8,600)
plus acquired cash and cash equivalents 982
Cash outflow due to acquisition of the Novaedes Group 518
The allocation of the purchase price as of the date of acquisition resulted in intangible assets in the amount
of € 1,930 thousand, property, plant and equipment in the amount of € 6,057 thousand and deferred tax
liabilities in the amount of € 2,692 thousand. These intangible assets comprise customer relationships.
Property, plant and equipment include the release of hidden reserves for real estate. Goodwill in the amount
of € 1,340 thousand comprises non-separable intangible assets such as Deufol’s employees’ technical exper-
tise as well as expected synergies.
057Consolidated Financial StatementsNotes to the Consolidated Financial Statements
Scope of Consolidation

If the Novaedes Group had been included in the consolidated financial statements since January 1, 2016,
sales would have amounted to € 20.4 million and the loss after taxes in the past fiscal year to € 0.2 million.
Deufol SE sold its shares in Activatis GmbH, Hofheim, and D Services Immobilien GmbH & Co. KG
with economic effect as of December 31, 2016. Control was transferred to the purchaser as of this date.
Both companies were removed from the consolidated group on December 31, 2016. Under the same con-
tract, Deufol SE sold to the purchaser of the shares debt claims against the companies sold, with a nomi-
nal value of € 4.0 million. The purchaser did not pay any separate purchase price for these debt claims.
Overall, this disposal and deconsolidation resulted in a disposal profit in the amount of € 3.1 million.
The assets and liabilities removed from the consolidated group for these sales are shown below in the
following table:
Figures in € thousand Dec. 31, 2016
Noncurrent assets 1,536
Current assets 2,399
Total assets 3,935
Noncurrent liabilities 7,698
Current liabilities 3,336
Total liabilities 11,034 11,034
Net assets (7,099)
noncontrolling interests (24)
Disposal profit on shares 7,123
Selling price for shares 0
Disposal of receivables 4,000
Disposal loss on receivables (4,000)
Selling price for receivables 0
Total disposal profit 3,123
Total selling price 0
less disposal of cash and cash equivalents (835)
Cash outflow (835)
058 Consolidated Financial Statements Notes to the Consolidated Financial Statements
Scope of Consolidation

Sales mainly resulted from the provision of services and, to a lesser extent, from rents. Sales include
rental income from the investment properties in the amount of € 139 thousand (previous year: € 180
thousand). In respect of further comments on sales, we refer to the segment reporting on pages 083 ff.
The following table shows the breakdown of other operating income:
Figures in € thousand 2016 2015
Release of provisions and liabilities 729 402
Release of valuation adjustments on receivables 0 0
Assumption of costs 3,785 2,159
Insurance compensation and other indemnification 1,237 1,877
Reimbursements of ancillary costs 205 238
Income from disposal of fixed assets 159 545
Income from deconsolidation 3,123 0
Exchange rate gains 287 704
Amounts reimbursed by suppliers 582 681
Other 1,063 939
Total 11,170 7,545
Consolidated Income
Statement Disclosures
01 Sales
02 Other Operating Income
059Consolidated Financial StatementsNotes to the Consolidated Financial Statements
Consolidated Income Statement Disclosures

The cost of materials includes the following expenses:
Figures in € thousand 2016 2015
Expenses for raw materials, consumables and supplies 87,286 81,564
Cost of purchased services 72,083 76,179
Total 159,369 157,743
The personnel costs include the following expenses:
Figures in € thousand 2016 2015
Wages and salaries 88,004 81,498
Social security contributions and employee benefits 23,665 21,691
Total 111,669 103,189
The average number of employees in 2016 was 2,899 (previous year: 2,641), of which Germany accounted
for 1,557 employees (previous year: 1,501), the Rest of Europe for 776 employees (previous year: 556)
and USA / the Rest of the World for 498 employees (previous year: 519). The holding had 68 employees on
average (previous year: 66). As of the reporting date December 31, 2016 the Group had 2,637 employees
(previous year: 2,657).
The following table shows the breakdown of other operating expenses:
Figures in € thousand 2016 2015
Rental and lease expenses 22,087 20,267
Space costs 5,670 5,926
Maintenance costs 4,052 4,394
Legal and consulting costs 4,684 2,892
Litigation risks 1,800 0
Insurance premiums 2,966 2,394
IT and communications costs 2,541 2,347
Vehicle fleet costs 2,151 2,494
Expenses for loss or damage incurred 2,605 2,262
Expenses for tools and fuel 408 532
Personnel expenses 812 540
Travel expenses 1,667 1,314
Losses on disposal of fixed assets 155 533
Currency losses 98 147
Valuation adjustments and losses on receivables 1,687 797
Restructuring expenses 263 1,618
Other 9,448 8,509
Total 63,094 56,966
The Group auditors’ overall fees for the fiscal year amounted to € 191 thousand (previous year: € 203 thou-
sand) for audits of financial statements, € 60 thousand (previous year: € 48 thousand) for tax consulting
services and € 21 thousand (previous year: € 16 thousand) for other services.
03 Cost of Materials
04 Personnel Costs
05 Other Operating Expenses
060 Consolidated Financial Statements Notes to the Consolidated Financial Statements
Consolidated Income Statement Disclosures

The financial result can be broken down as follows:
Figures in € thousand 2016 2015
Financial income 521 494
Other interest and similar income 283 99
from finance leases 228 395
Related parties 10 0
Finance costs (2,913) (3,302)
from financial liabilities (2,249) (2,524)
from finance leases (383) (490)
Accumulation of liabilities and provisions (281) (288)
Other financial result (1,396) 0
Shares of profits of companies accounted for using the equity method 88 136
Total (3,700) (2,673)
The other financial result has resulted from the disposal of an associate (€ 662 thousand) and the valu-
ation adjustment on loan receivables (€ 733 thousand).
The Group’s income taxes can be broken down as follows:
Figures in € thousand 2016 2015
Effective income tax expense 1,841 2,396
Germany 518 1,242
Rest of the World 1,323 1,154
Deferred income taxes due to the occurrence or reversal of temporary differences (740) (494)
Germany (323) (260)
Rest of the World (417) (234)
Total 1,101 1,902
Deferred tax expenses / proceeds are as follows:
Figures in € thousand 2016 2015
(Recognition of)/write-down on loss carryforwards 325 (793)
Supplementary capital for tax purposes 18 386
Valuation of property, plant and equipment (374) (49)
Valuation of clientele (49) (3)
Valuation of current assets 11 (29)
Finance leasing (133) (107)
Other (538) 101
Total (740) (494)
As of December 31, 2016, deferred taxes were calculated for German companies with an overall tax rate
of 28.39 % (previous year: 29.72 %). The relevant national tax rate applies for the deferred taxes of com-
panies outside Germany.
06 Financial Result
07 Tax Proceeds / Expenses
061Consolidated Financial StatementsNotes to the Consolidated Financial Statements
Consolidated Income Statement Disclosures

The following table shows the reconciliation between the expected and reported income tax expense
for the Group, subject to the 28.39 % (previous year: 29.72 %) income tax rate for Deufol SE:
Figures in € thousand 2016 2015
Earnings before taxes 5,736 5,494
Income tax rate of the Deufol Group as % 28.39 29.72
Expected tax expense 1,628 1,633
Effect of different tax rates (4) 104
Unrecognized deferred tax assets on loss carryforwards 882 (405)
Use of previously unconsidered tax losses (684) (476)
Origination / reversal of temporary differences (409) 0
Write-down on loss carryforwards recognized to date 4 6
Effect of tax-exempt income (193) (716)
Effect of expenses not deductible for tax purposes 528 459
Prior-period tax effects 59 506
Other (710) 791
Income taxes 1,101 1,902
Effective tax rate (%) 19.19 34.62
Deferred tax assets can be broken down as follows:
Figures in € thousand 2016 2015
Tax loss carryforwards 7,579 7,881
Supplementary capital for tax purposes 58 76
Finance leases 871 1,231
Provisions for pensions 10 131
Other 343 249
Deferred tax assets 8,861 9,568
Offset against deferred tax liabilities (865) (663)
Total 7,996 8,905
Of the deferred tax assets, € 6,140 thousand (previous year: € 5,721 thousand) relates to domestic Group
companies. Domestic tax loss carryforwards may be carried forward for an unlimited duration, but domes-
tic earnings are subject to a minimum level of taxation. As of December 31, 2016, corporate income tax
loss carryforwards amounted to € 59.1 million (previous year: € 76.8 million). Of this amount, € 55.1 million
(previous year: € 66.5 million) may be carried forward for an unlimited duration. The trade tax loss carry-
forwards of German Group companies amount to € 47.7 million (previous year: € 57.6 million). Temporary
differences relating to shares in subsidiaries for which no deferred taxes have been shown in the balance
sheet total € 25.6 million (previous year: € 22.6 million).
062 Consolidated Financial Statements Notes to the Consolidated Financial Statements
Consolidated Income Statement Disclosures

Deferred tax liabilities can be broken down as follows:
Figures in € thousand 2016 2015
Property, plant and equipment 2,091 406
Finance leases 344 385
Clientele 720 32
Other receivables and other assets 0 409
Other 377 252
Deferred tax liabilities 3,532 1,484
Offset against deferred tax assets (865) (663)
Total 2,667 821
The consolidated net profit attributable to noncontrolling interests primarily consists of profit shares
attributable to companies in the Deufol Nürnberg Group.
Income
Figures in € thousand 2016 2015
Result attributable to the holders of Deufol SE common stock 5,064 3,299
Shares in circulation
in units
Weighted average number of shares 43,367,278 43,773,665
Earnings per share
Figures in €
Basic and diluted earnings per share, based on the income (loss) attributable to common shareholders of Deufol SE 0.118 0.075
Due to the purchase of treasury stock, the number of shares issued has fallen to 42,960,880 as of Decem-
ber 31, 2016, a decline of 812,775 by comparison with the previous year (43,773,665).
08 Profit / Loss Attributable to
Noncontrolling Interests
09 Earnings per Share
063Consolidated Financial StatementsNotes to the Consolidated Financial Statements
Consolidated Income Statement Disclosures

Property, plant and equipment also includes leased buildings and technical equipment and machinery
where the Group as lessee is considered to be the economic owner because all substantial risks and
rewards incident to the use of the leased assets are transferred.
Within leased assets, the following amounts are attributable to the “Operating and office equipment”
and “Technical equipment and machinery” asset classes:
Figures in € thousand 2016 2015
Cost 5,918 9,444
Accumulated depreciation and amortization (4,361) (8,096)
Carrying amount 1,557 1,348
The following amounts are attributable to “Buildings”:
Figures in € thousand 2016 2015
Cost 686 4,588
Accumulated depreciation and amortization (650) (3,848)
Carrying amount 36 740
Deufol disposed of its investment property in the past fiscal year.
Intangible assets primarily consist of the goodwill recognized on consolidating acquirees.
The following table shows the breakdown of goodwill by segment:
Figures in € thousandGermany Rest of Europe USA/
Rest of the WorldTotal
Carrying amount as of Jan. 1, 2016 52,739 15,938 0 68,677
Additions 0 2,611 0 2,611
Disposals 168 0 0 168
Impairments 0 0 0 0
Currency translation adjustments 0 0 0 0
Carrying amount as of Dec. 31, 2016 52,571 18,549 0 71,120
In accordance with IAS 36 “Impairment of Assets”, goodwill should be tested for impairment at least
once a year. In the course of impairment testing, the carrying amount of a cash-generating unit (CGU) is
compared with its recoverable amount. The recoverable amount of a CGU is the higher of its fair value
less costs to sell and its value in use.
Consolidated Balance
Sheet Disclosures
11 Intangible Assets
064 Consolidated Financial Statements Notes to the Consolidated Financial Statements
Consolidated Balance Sheet Disclosures
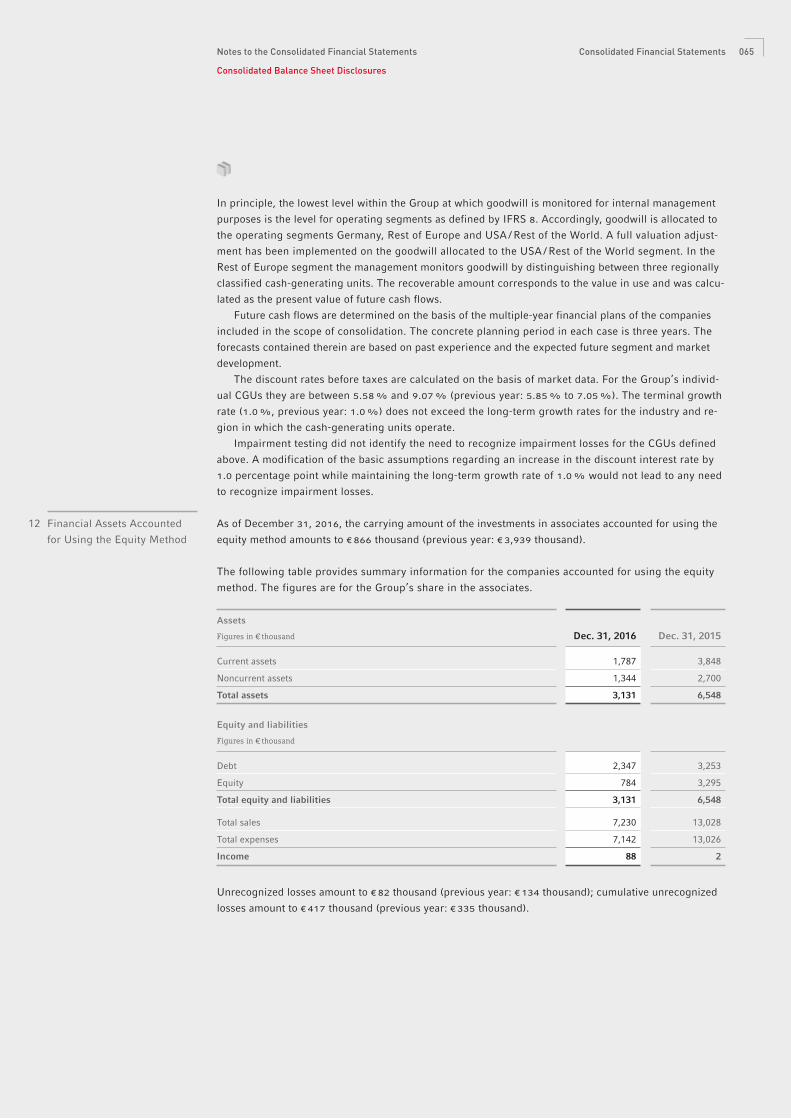
In principle, the lowest level within the Group at which goodwill is monitored for internal management
purposes is the level for operating segments as defined by IFRS 8. Accordingly, goodwill is allocated to
the operating segments Germany, Rest of Europe and USA / Rest of the World. A full valuation adjust-
ment has been implemented on the goodwill allocated to the USA / Rest of the World segment. In the
Rest of Europe segment the management monitors goodwill by distinguishing between three regionally
classified cash-generating units. The recoverable amount corresponds to the value in use and was calcu-
lated as the present value of future cash flows.
Future cash flows are determined on the basis of the multiple-year financial plans of the companies
included in the scope of consolidation. The concrete planning period in each case is three years. The
forecasts contained therein are based on past experience and the expected future segment and market
development.
The discount rates before taxes are calculated on the basis of market data. For the Group’s individ-
ual CGUs they are between 5.58 % and 9.07 % (previous year: 5.85 % to 7.05 %). The terminal growth
rate (1.0 %, previous year: 1.0 %) does not exceed the long-term growth rates for the industry and re-
gion in which the cash-generating units operate.
Impairment testing did not identify the need to recognize impairment losses for the CGUs defined
above. A modification of the basic assumptions regarding an increase in the discount interest rate by
1.0 percentage point while maintaining the long-term growth rate of 1.0 % would not lead to any need
to recognize impairment losses.
As of December 31, 2016, the carrying amount of the investments in associates accounted for using the
equity method amounts to € 866 thousand (previous year: € 3,939 thousand).
The following table provides summary information for the companies accounted for using the equity
method. The figures are for the Group’s share in the associates.
Assets
Figures in € thousand Dec. 31, 2016 Dec. 31, 2015
Current assets 1,787 3,848
Noncurrent assets 1,344 2,700
Total assets 3,131 6,548
Equity and liabilities
Figures in € thousand
Debt 2,347 3,253
Equity 784 3,295
Total equity and liabilities 3,131 6,548
Total sales 7,230 13,028
Total expenses 7,142 13,026
Income 88 2
Unrecognized losses amount to € 82 thousand (previous year: € 134 thousand); cumulative unrecognized
losses amount to € 417 thousand (previous year: € 335 thousand).
12 Financial Assets Accounted
for Using the Equity Method
065Consolidated Financial StatementsNotes to the Consolidated Financial Statements
Consolidated Balance Sheet Disclosures

Procurement and production costs
Figures in € thousand
Jan. 1, 2016 Currency differences
Additions Additions through
business combinations
Disposals Reclassi-fi cations
Dec. 31, 2016
Property, plant and equipment
Land, land rights and buildings 43,600 460 4,870 12,850 (56) 37 61,761
Technical equipment and machinery 45,441 671 1,052 480 (1,048) 15 46,611
Operating and office equipment 32,462 78 1,152 988 (2,055) 58 32,683
Assets under construction 284 14 1,778 0 (20) (179) 1,877
Leased assets 13,742 18 250 725 (8,200) (69) 6,604
Investment property 983 0 0 0 (983) 0 0
Total 136,512 1,241 9,102 15,043 (12,362) 0 149,536
Intangible assets
Patents, licenses, trademarks and similar rights and assets 11,843 87 136 3,392 (1,391) 0 14,067
Internally generated intangible assets 2,301 0 916 0 0 0 3,217
Goodwill 71,288 (1) 0 2,611 (168) 0 73,730
Total 85,432 86 1,052 6,003 (1,559) 0 91,014
Sum total 221,944 1,327 10,154 21,046 (13,921) 0 240,550
Figures in € thousand Jan. 1, 2015 Dec. 31, 2015
Property, plant and equipment
Land, land rights and buildings 42,041 1,441 756 0 (638) 0 43,600
Technical equipment and machinery 42,976 2,116 1,768 (1,384) (35) 45,441
Operating and office equipment 31,631 262 1,881 (1,878) 566 32,462
Assets under construction 573 8 521 (447) (371) 284
Leased assets 14,059 67 301 (526) (159) 13,742
Investment property 983 0 0 0 0 983
Total 132,263 3,894 5,227 (4,873) 1 136,512
Intangible assets
Patents, licenses, trademarks and similar rights and assets 10,736 275 475 (90) 447 11,843
Internally generated intangible assets 2,067 1 681 0 (448) 2,301
Goodwill 71,284 4 0 0 0 71,288
Total 84,087 280 1,156 (90) (1) 85,432
Sum total 216,350 4,174 6,383 (4,963) 0 221,944
Consolidated Statement
of Changes in Assets
in 2015 and 2016
066 Consolidated Financial Statements Notes to the Consolidated Financial Statements
Consolidated Balance Sheet Disclosures

Depreciation, amortization and impairment Net amounts
Jan. 1, 2016 Currency differences
Additions Disposals Reclassi-fi cations
Dec. 31, 2016 Dec. 31, 2015 Dec. 31, 2016
18,655 226 1,496 (56) 0 20,321 24,945 41,441
35,753 577 3,094 (850) 74 38,648 9,687 7,962
23,995 70 2,804 (1,726) 12 25,155 8,467 7,527
0 0 0 0 0 0 284 1,877
11,654 8 1,077 (7,642) (86) 5,012 2,088 1,593
822 0 0 (822) 0 161 0
90,880 881 8,471 (11,096) 0 89,136 45,632 60,400
9,478 87 965 (1,391) 0 9,139 2,365 4,928
295 0 365 0 0 660 2,006 2,557
2,611 (1) 0 0 0 2,610 68,677 71,120
12,384 86 1,330 (1,391) 0 12,409 73,048 78,605
103,264 967 9,801 (12,487) 0 101,545 118,680 139,005
Jan. 1, 2015 Dec. 31, 2015 Dec. 31, 2014 Dec. 31, 2015
16,848 611 1,285 (89) 0 18,655 25,193 24,945
32,651 1,424 2,987 (1,371) 62 35,753 10,325 9,687
23,200 208 2,018 (1,518) 87 23,995 8,432 8,467
0 0 0 0 0 0 573 284
12,001 21 204 (423) (149) 11,654 2,058 2,088
766 0 56 0 0 822 217 161
85,465 2,264 6,550 (3,401) 0 90,880 46,798 45,632
8,631 227 626 (19) 13 9,478 2,105 2,365
49 0 259 0 (13) 295 2,018 2,006
2,611 0 0 0 0 2,611 68,673 68,677
11,291 227 885 (19) 0 12,384 72,796 73,048
96,756 2,491 7,435 (1,403) 0 103,264 119,594 118,680
067Consolidated Financial StatementsNotes to the Consolidated Financial Statements
Consolidated Balance Sheet Disclosures

The Deufol Group has rental and lease agreements under which Deufol is the lessor and essentially all
risks and opportunities are transferred to the lessee. These are classified as finance leases with Deufol
as the lessor. They relate primarily to buildings, technical equipment and machinery that are used ex-
clusively on a customer-specific basis. Financial receivables have been capitalized in the amount of the
net investment volume, on the basis of the future lease installments to be paid by the customer.
The total future payments from leasing contracts can be broken down as follows as of December 31, 2016:
Figures in € thousand 2016 2015
Total future payments 3,453 5,269
thereof due within one year 1,757 1,816
thereof due between one and five years 1,696 3,453
thereof due in more than five years 0 0
Present value of future payments 3,141 4,529
thereof due within one year 1,524 1,445
thereof due between one and five years 1,617 3,084
thereof due in more than five years 0 0
Interest element 312 740
These amounts differ from the amounts reported under financial receivables in the balance sheet by
€ 304 thousand (previous year: € 0 thousand), since they include expected repayments for current loan
receivables as well as the minimum lease payments.
The following table shows the breakdown of the “Other receivables and other assets” item:
2016 2015
Figures in € thousand Total Current Total Current
Value-added tax and other taxes receivable 2,029 2,029 1,562 1,562
Deferred expenses 1,344 1,335 1,030 1,030
Guarantees 451 171 627 349
Receivables from assumption of costs 1,250 1,250 2,717 2,717
Receivables from related parties 625 625 475 475
Compensation 845 845 1,307 1,307
Receivables from reimbursements of ancillary costs 852 852 1,627 1,627
Amount reimbursed by suppliers 697 697 970 970
Receivables from employees 106 106 107 107
Other 2,897 769 5,903 3,776
Total 11,096 8,679 16,325 13,920
13 Financial Receivables
14 Other Receivables
and Other Assets
068 Consolidated Financial Statements Notes to the Consolidated Financial Statements
Consolidated Balance Sheet Disclosures

The following table shows the breakdown of inventories:
Figures in € thousand 2016 2015
Raw materials, consumables and supplies 10,204 9,715
Work in progress 2,443 1,722
Finished products and merchandise 1,738 1,136
Total 14,385 12,573
Trade receivables are as follows:
Figures in € thousand 2016 2015
Trade receivables 47,542 45,899
Valuation adjustments (1,873) (1,362)
Trade receivables, net 45,669 44,537
Trade receivables from related parties amount to € 205 thousand (previous year: € 158 thousand).
As of December 31, 2016, the age structure of the trade receivables was as follows:
Overdue, but not value-impaired
Figures in € thousand
Total Neither overdue nor
value-impaired
< 30 days
30 – 60 days
61 – 90 days
91– 180 days
> 180 days
2016 45,669 29,978 6,319 1,660 1,153 1,384 5,175
2015 44,537 25,785 3,282 8,446 1,089 549 5,385
In respect of the receivables which are neither value-impaired nor overdue, as of the reporting date there
are no indications that the debtors will be unable to meet their payment obligations.
15 Inventories
16 Trade Receivables
069Consolidated Financial StatementsNotes to the Consolidated Financial Statements
Consolidated Balance Sheet Disclosures
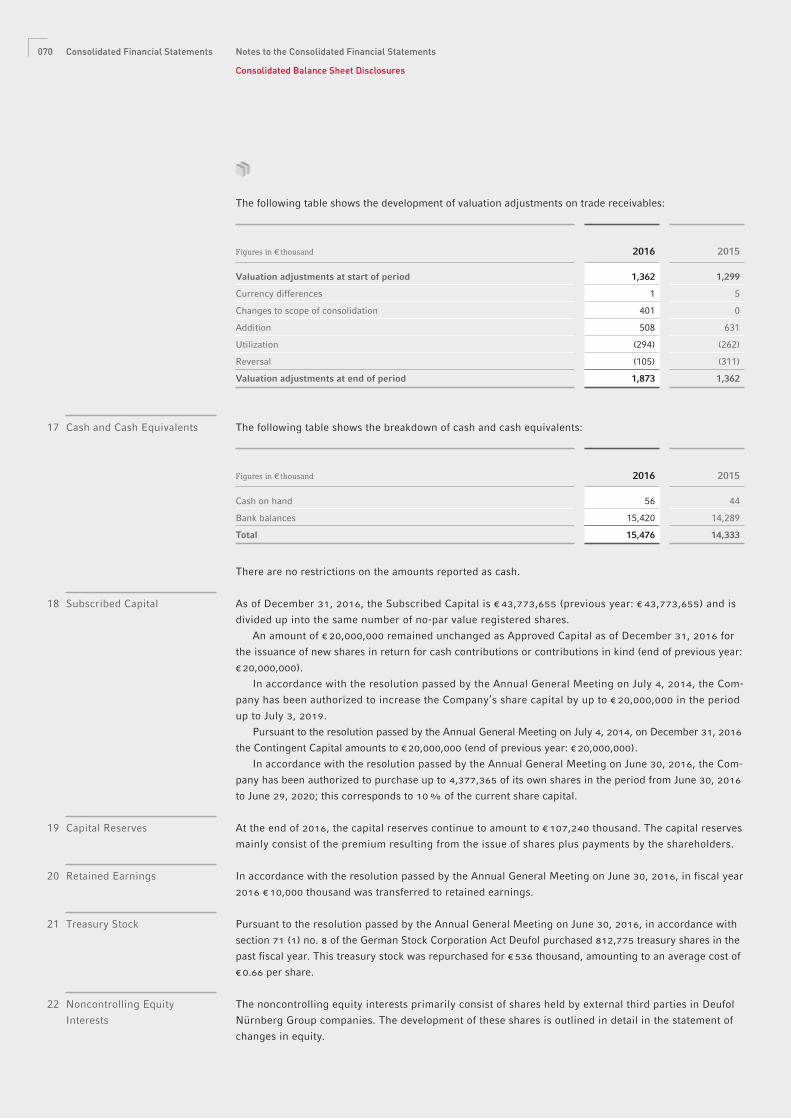
The following table shows the development of valuation adjustments on trade receivables:
Figures in € thousand 2016 2015
Valuation adjustments at start of period 1,362 1,299
Currency differences 1 5
Changes to scope of consolidation 401 0
Addition 508 631
Utilization (294) (262)
Reversal (105) (311)
Valuation adjustments at end of period 1,873 1,362
The following table shows the breakdown of cash and cash equivalents:
Figures in € thousand 2016 2015
Cash on hand 56 44
Bank balances 15,420 14,289
Total 15,476 14,333
There are no restrictions on the amounts reported as cash.
As of December 31, 2016, the Subscribed Capital is € 43,773,655 (previous year: € 43,773,655) and is
divided up into the same number of no-par value registered shares.
An amount of € 20,000,000 remained unchanged as Approved Capital as of December 31, 2016 for
the issuance of new shares in return for cash contributions or contributions in kind (end of previous year:
€ 20,000,000).
In accordance with the resolution passed by the Annual General Meeting on July 4, 2014, the Com-
pany has been authorized to increase the Company’s share capital by up to € 20,000,000 in the period
up to July 3, 2019.
Pursuant to the resolution passed by the Annual General Meeting on July 4, 2014, on December 31, 2016
the Contingent Capital amounts to € 20,000,000 (end of previous year: € 20,000,000).
In accordance with the resolution passed by the Annual General Meeting on June 30, 2016, the Com-
pany has been authorized to purchase up to 4,377,365 of its own shares in the period from June 30, 2016
to June 29, 2020; this corresponds to 10 % of the current share capital.
At the end of 2016, the capital reserves continue to amount to € 107,240 thousand. The capital reserves
mainly consist of the premium resulting from the issue of shares plus payments by the shareholders.
In accordance with the resolution passed by the Annual General Meeting on June 30, 2016, in fiscal year
2016 € 10,000 thousand was transferred to retained earnings.
Pursuant to the resolution passed by the Annual General Meeting on June 30, 2016, in accordance with
section 71 (1) no. 8 of the German Stock Corporation Act Deufol purchased 812,775 treasury shares in the
past fiscal year. This treasury stock was repurchased for € 536 thousand, amounting to an average cost of
€ 0.66 per share.
The noncontrolling equity interests primarily consist of shares held by external third parties in Deufol
Nürnberg Group companies. The development of these shares is outlined in detail in the statement of
changes in equity.
17 Cash and Cash Equivalents
18 Subscribed Capital
19 Capital Reserves
20 Retained Earnings
21 Treasury Stock
22 Noncontrolling Equity
Interests
070 Consolidated Financial Statements Notes to the Consolidated Financial Statements
Consolidated Balance Sheet Disclosures

In the invitation to the Annual General Meeting, the Administrative Board will propose that the net
income of Deufol SE for fiscal year 2016 in the amount of € 13,220 thousand (calculated in accordance
with the principles of the German Commercial Code) be carried forward to new account.
The following table summarizes the financial liabilities of the Deufol Group:
2016 2015
thereof with a remaining maturity of
thereof with a remaining maturity of
Figures in € thousandTotal up to
1 year1 to 5 years
over 5 years
Total up to 1 year
1 to 5 years
over 5 years
Amounts due to banks 52,231 12,473 33,962 5,796 51,289 11,060 38,145 2,084
Liabilities under financial leases 4,603 1,258 3,319 26 6,882 1,768 4,874 240
Other financial liabilities 8,996 4,870 4,126 0 54 3 51 0
Financial liabilities 65,830 18,601 41,407 5,822 58,225 12,831 43,070 2,324
Property, plant and equipment in the amount of € 44.0 million (previous year: € 28.1 million), trade receiv-
ables in the amount of € 9.0 million (previous year: € 14.5 million) and inventories in the amount of € 4.0 mil-
lion (previous year: € 5.3 million) have been pledged as collateral to secure liabilities to banks and other
financial liabilities.
Short-term and medium-term credit lines of € 56.4 million are available to the Group at various banks
(previous year: € 47.1 million). As of December 31, 2016, € 24.3 million (previous year: € 26.4 million) of
this had been utilized, subject to variable interest rates. The financial liabilities carried in the balance
sheet are subject to standard market interest rate risks. In fiscal year 2015, the average weighted inter-
est rate for short-term loans was 2.32 % (previous year: 3.45 %).
The following table shows the Group’s material noncurrent liabilities to banks:
2016 2015
Currency Net carrying amount (€ thou-
sand)
Remain-ing
maturity (years)
Effective interest
rate (%)
Currency Net carrying amount (€ thou-
sand)
Remain-ing
maturity (years)
Effective interest
rate (%)
Loans € 1,774 2 6.05 € 3,130 3 6.05
Loans € 9,500 3 variable * € 11,500 4 variable*
Loans € 1,595 8 3.05 € 1,776 9 3.05
Loans € 1,167 7 3.95 € 1,333 8 3.95
Loans € 612 9 variable ** 759 10 variable **
Loans € 658 8 3.60 € 740 9 3.60
Loans € 4,875 10 variable ***
Loans € 3,115 12 1.95
Loans EUR 884 15 3.25
* 3-month EURIBOR + 2.5 %** 3-month EURIBOR + 1.5 % *** 3-month EURIBOR + 1.3 %
There are also further noncurrent amounts due to banks for financing of property, plant and equip-
ment, particularly technical equipment and machinery, in the amount of € 4.4 million (previous year:
€ 5.0 million).
Proposal for the
Appropriation of Net Profit
23 Financial Liabilities
Liabilities to Banks
071Consolidated Financial StatementsNotes to the Consolidated Financial Statements
Consolidated Balance Sheet Disclosures

The total future minimum payments from financial leasing contracts can be broken down as follows as of
December 31, 2016:
Figures in € thousand 2016 2015
Total future minimum lease payments 4,755 6,994
thereof due within one year 1,320 1,795
thereof due between one and five years 3,409 4,953
thereof due in more than five years 26 246
Present value of future minimum lease payments 4,603 6,882
thereof due within one year 1,258 1,768
thereof due between one and five years 3,319 4,874
thereof due in more than five years 26 240
Interest element 152 112
In several cases extension or purchase options plus price-adjustment clauses apply which are based on
standard indexes.
The Deufol Group has both defined-contribution and defined-benefit pension schemes in place. The
defined-benefit pension plans include pension obligations (funded and unfunded) and noncurrent-benefit
entitlements (provisions for similar post-employment benefits). Noncurrent-benefit entitlements are
recognized in the balance sheet at the Group’s Italian subsidiary. The recognized provisions can be broken
down as follows:
Figures in € thousand 2016 2015
Provisions for pensions 0 1,030
Provisions for other post-employment benefits 491 351
Liabilities to pension fund 3,369 3,382
Total 3,860 4,763
The pension obligations (actuarial present value of benefit entitlements or defined benefit obligation) were
calculated using actuarial methods. The calculations were based on the following parameters:
Germany Italy
Figures in % 2016 2015 2016 2015
Discount rate — 2.3 0.4 1.0
Turnover rate* — 0.0 0.0 0.0
Index-linked salary increase — 1.0 1.5 1.5
Index-linked pension increase — 1.0 2.6 2.6
* No assumptions are made with regard to turnover, as all benefi ts are vested
Pension obligations are measured in accordance with the provisions of IAS 19 R.
Liabilities under
Financial Leases
24 Provisions for Pensions
072 Consolidated Financial Statements Notes to the Consolidated Financial Statements
Consolidated Balance Sheet Disclosures

The following table indicates the changes in the present value of the total obligation and the net pension
commitment shown in the balance sheet:
Figures in € thousand 2016 2015
Present value of the obligation at January 1 1,380 1,398
Current service cost 5 5
Interest cost 27 27
Pension payments (25) (31)
Actuarial losses 7 (19)
Business combinations, disposals and other items (903) 0
Present value of the obligation / net pension commitment on December 31 491 1,380
The present value of the total obligation was € 1,258 thousand on December 31, 2012, € 1,244 thousand on
December 31, 2013 and € 1,398 thousand on December 31, 2014. The actuarial gains and losses amounted
to € 175 thousand on December 31, 2012, € 20 thousand on December 31, 2013 and € 186 thousand on
December 31, 2014 and have been recognized in other comprehensive income.
Pension expense in the fiscal year can be broken down as follows:
Figures in € thousand 2016 2015
Current service cost 5 5
Interest cost 27 27
Total pension expense 32 32
The expected pension expense for 2017 is € 11 thousand.
In the case of defined-contribution plans, the Deufol Group does not enter into any obligations above
and beyond its obligation to pay contributions. In 2016, pension expenses relating to defined-contribu-
tion plans totaled € 12 thousand (previous year: € 9 thousand). In addition, contributions were paid to
state pension insurance agencies in the amount of € 4,529 thousand (previous year: € 4,204 thousand).
The company has carried as a liability in relation to a pension fund an amount of € 3,369 thousand
(previous year: € 3,382 thousand) in connection with the closure of its carton business in the USA. No
calculations in accordance with IAS 19 are required for this obligation, but it requires repayment over a
period of 20 years.
The following table shows the changes in other provisions:
Figures in € thousand
Jan. 1, 2016
Utiliza-tion
Reversal Addition Changes in scope
of con-solidation
Dec. 31, 2016
Guarantee and liability risks 8 0 0 60 0 68
Litigation risk 376 (104) (38) 2,159 0 2,393
Dismantling obligations 14 (13) (1) 23 0 23
Other risks 1,790 (1,658) 0 42 228 402
Total 2,188 (1,775) (39) 2,284 228 2,886
25 Other Provisions
073Consolidated Financial StatementsNotes to the Consolidated Financial Statements
Consolidated Balance Sheet Disclosures

Provisions for guarantees and liability risks mainly comprise claims due to damage and other warran-
ties. These provisions were recognized on the basis of figures in previous years. The provisions for
legal disputes were made for anticipated claims due to ongoing legal disputes.
The provisions recognized by the Deufol Group are current provisions. More specifically, the outflows
are structured as follows based on when they are expected to be settled:
Current Noncurrent Total
Figures in € thousand 2016 2015 2016 2015 2016 2015
Guarantee and liability risks 68 8 0 0 68 8
Litigation risk 2,393 376 0 0 2,393 376
Dismantling obligations 23 14 0 0 23 14
Other risks 315 1,790 87 0 402 1,790
Total 2,799 2,188 87 0 2,886 2,188
Other liabilities can be broken down as follows:
2016 2015
Figures in € thousand Total Current Total Current
Value-added tax and other taxes payable 2,072 2,072 1,354 1,354
Social security liabilities 1,972 1,972 1,966 1,966
Liabilities to employees relating to wages and salaries 7,902 7,902 6,933 6,933
Other liabilities to employees (annual leave, overtime, etc.) 387 342 3,255 3,035
Deferred income 248 248 1,934 813
Liabilities to related parties 0 0 0 0
Other 604 564 1,745 1,674
Total 13,185 13,100 17,187 15,775
Trade payables amount to € 40,320 thousand (previous year: € 37,178 thousand) and all have a remaining
term of less than one year. This includes liabilities for trade payables that have not yet been invoiced in
the amount of € 4,675 thousand (previous year: € 4,204 thousand).
26 Other Liabilities
27 Trade Payables
074 Consolidated Financial Statements Notes to the Consolidated Financial Statements
Consolidated Balance Sheet Disclosures

The consolidated cash flow statement is prepared in accordance with IAS 7. It shows the origin and ap-
propriation of the money flows in fiscal years 2016 and 2015. It is of key significance for an assessment
of the financial position of the Deufol Group. The cash flow statement distinguishes between cash flows
from operating activities, investing activities and financing activities.
The cash and cash equivalents reported in the cash flow statement correspond to the “Cash and cash
equivalents” item in the balance sheet and comprise cash on hand, checks and immediately available
bank balances with an original maturity of up to three months. Please see Note (17) for the breakdown
of cash and cash equivalents.
The cash flow from investing activities and the cash flow from financing activities are both calculated
directly. In contrast, the cash flow from operating activities is derived using the indirect method.
In fiscal year 2016, operating activities provided net cash of € 12.0 million (previous year: € 5.5 million). It
should be noted that adjustments were made for the effects of changes in the scope of consolidation.
Please see page 056 for details of acquisitions and companies newly established.
In the past fiscal year a € 5.9 million (previous year: € 2.9 million) outflow of funds from investing activities
resulted. Investments in intangible assets and property, plant and equipment amounted to € 9.8 million,
while an inflow of funds in the amount of € 3.6 million resulted from the disposal of intangible assets and
property, plant and equipment as well as financial assets. The net change in financial receivables in the
amount of € 1.1 million and interest received in the amount of € 0.5 million were also significant.
The cash outflows due to acquisitions of business units less acquired cash include, in particular,
payments totaling € 0.5 million in connection with the acquisition of the Rieder Group.
The cash outflows due to the disposal of business units less cash disposed of in the total amount of
€ 0.8 million are mainly associated with the sale of Activatis GmbH.
In the past fiscal year a € 4.9 million (previous year: € 4.3 million) outflow of funds from financing activities
resulted. This was mainly due to the reduction of financial liabilities on balance in the amount of € 2.2 mil-
lion, and paid interest of € 2.9 million.
Deufol SE did not distribute any dividend in 2016.
The cash and cash equivalents balance increased by € 1.1 million from € 14.3 million to € 15.4 million.
Net financial indebtedness – defined as financial liabilities less the Group’s financial receivables and
cash and cash equivalents – increased by € 7.5 million.
Consolidated Cash Flow
Statement Disclosures
28 Cash Flow From
Operating Activities
29 Acquisitions and Sales
30 Cash Flow From
Investing Activities
31 Cash Flow From
Financing Activities
32 Change in Cash and
Cash Equivalents
075Consolidated Financial StatementsNotes to the Consolidated Financial Statements
Consolidated Cash Flow Statement Disclosures

Within the Group, guarantees have only been granted to third parties for obligations reported in the bal-
ance sheet or for reciprocal rental payment guarantees. As in previous years, the Group has not issued
any guarantees in relation to associates.
Expenses amounting to € 22,087 thousand (previous year: € 20,267 thousand) were recognized in
the consolidated income statement due to rental agreements and leases that do not qualify as finance
leases under IFRS (operating leases). The share of contingent lease payments included in this amount
is of lesser significance.
We examine legal disputes and administrative procedures on an individual basis. We evaluate the pos-
sible outcomes of such legal disputes on the basis of the information we have received and in consultation
with our lawyers and tax advisers. Where we are of the opinion that an obligation will probably lead to fu-
ture fund outflows, we carry as a liability the present value of the expected fund outflows where these are
deemed to be reliably measurable. Legal disputes and tax affairs present complex issues and are associ-
ated with a large number of imponderabilities and difficulties, including the facts and circumstances of the
individual case and the authority involved.
The future (non-discounted) minimum lease payments under such non-cancelable leases are as follows:
Figures in € thousand Dec. 31, 2016 Dec. 31, 2015
Not later than one year 14,078 10,971
Later than one year and not later than five years 19,798 18,131
Later than five years 5,529 2,522
Total minimum lease payments 39,405 31,624
These standard market obligations result primarily from leases for warehouse or office space, vehicles,
and IT and office equipment. The leases have terms of between one and six years and in some cases
include a renewal option.
The Deufol Group has concluded leases for the commercial leasing of its investment property. These
leases have remaining, non-cancelable terms of between two and four years. All leases include a clause
under which the rent can be adjusted annually on the basis of prevailing market conditions.
In accordance with IAS 17, further contracts have been classified as operating leases with the
Group as lessor. These contracts have remaining, non-cancelable terms of between one and five years.
Other Disclosures
33 Contingencies and
Contingent Liabilities
34 Obligations under Operating
Leases – Group as Lessee
35 Receivables under Operating
Leases – Group as Lessor
076 Consolidated Financial Statements Notes to the Consolidated Financial Statements
Other Disclosures

As of December 31, 2016, receivables in the form of future minimum lease payments under non-cancel-
able operating leases are as follows:
Figures in € thousand Dec. 31, 2016 Dec. 31, 2015
Not later than one year 467 467
Later than one year and not later than five years 78 545
Later than five years 0 0
Total minimum lease payments 545 1,012
As in the previous year, as of the balance sheet date there were no contingent assets that could have a
significant financial impact on the Deufol Group.
As in 2015, the Deufol Group did not receive any government grants in 2016.
In principle, Deufol’s goal is to secure its equity capital base on a long-term basis. A Group equity ratio
in excess of 40 % is aimed for. As of December 31, 2016, the Group’s equity ratio was 45.3 % (previous
year: 45.6 %). The equity ratio thereby functions merely as a passive management criterion, with sales
and the operating result (EBIT) being used as active management variables.
In some cases within the Group, credit agreements are tied to compliance with financial ratios. In these
cases, the development of the relevant financial ratios forms a fixed component of the reporting of the
affected companies, for early recognition and rectification of undesirable trends and negotiations with
the relevant lenders.
The Deufol Group is exposed to various financial risks in its normal business activities. These include,
in particular, market risks (currency risk, interest risk and goods price risk), the risk of nonpayment and
the liquidity risk. The Deufol Group uses a standardized, Group-wide risk management system to man-
age these risks. The aim is to establish an operating routine based on actions, and therefore on constant
risk minimization. Within the Deufol Group, derivatives are used exclusively for risk reduction purposes.
36 Contingent Assets
37 Government Grants
38 Capital Management
Disclosures
39 Financial Risk Management
077Consolidated Financial StatementsNotes to the Consolidated Financial Statements
Other Disclosures

Currency risk
The currency risk is the risk of the fair value or future cash flows of a financial instrument being subject
to change due to exchange-rate fluctuations. Overall, the risks resulting from the change in exchange rates
are of minor significance for the operating activities of the Deufol Group. The main effect on the Group’s
assets position resulted from the translation of the American companies’ US-dollar-denominated financial
statements into the reporting currency euro. Further currency risks result from the consolidation of the
Czech company. If the euro were 10 % stronger (weaker) against the US dollar, the earnings of the Group
would have been € 152 thousand lower (higher) and in the previous year € 189 thousand lower (higher).
The balancing item in equity would have been € 409 thousand lower (higher) and in the previous year
€ 465 thousand lower (higher).
The Deufol Group has not currently used any forward exchange transactions to hedge currency risks.
Interest rate risk
The interest rate risk is the risk of the fair value or future cash flows of a financial instrument being
subject to fluctuation due to changes in the market interest rate. Businesses may be exposed to this
risk through variable-interest and fixed-interest financial instruments.
The Deufol Group holds both fixed-interest and variable-interest financial instruments. If the interest
rate level as of December 31, 2016 for variable-interest liabilities had been an average of 100 basis points
higher (lower), this would have had an effect on the Group’s interest expense in the approx. amount of
€ 392 thousand (previous year: € 396 thousand).
078 Consolidated Financial Statements Notes to the Consolidated Financial Statements
Other Disclosures

Goods price risk
The Group’s key requirements include packaging materials such as wood, foils, screws and cardboard.
The purchasing prices for these products may fluctuate, depending on the market situation. It is not
always possible to directly pass on fluctuating prices to customers. A goods price risk therefore applies
which may influence the Group’s earnings, equity and cash flow situation. To minimize risks outline de-
livery agreements have been concluded with various suppliers. In addition, some agreements include a
stipulation that the cost of materials will be passed on directly, so that no goods price risk applies in the
case of these agreements.
Credit risk (nonpayment risk)
The Group only enters into business with creditworthy third parties. In almost all cases, customers of the
Deufol Group are major industrial companies with good or very good credit standing. In addition, the
Group’s receivables are continuously monitored so that the Group is not exposed to any significant de-
fault risk. The maximum default risk for trade receivables is limited to their carrying amount. Please see
Note (16) for further disclosures.
In case of other financial assets of the Group such as cash and cash equivalents, receivables under
finance leases and other assets, the maximum credit risk in the event of the counterparty’s default is the
carrying amount of these instruments.
Liquidity risks
The liquidity risk is the risk of a company experiencing difficulties in meeting its payment obligations
for its financial instruments.
The Deufol Group is financed through various regional financing groups. Most financing is provided
by means of syndicated borrowing facilities and bilateral bank loans. Local management continuously
monitors the liquidity status of consolidated foreign Group companies and regularly notifies the Group’s
management of this; the Group’s management handles daily liquidity monitoring and control centrally
for the German companies.
The following table shows all the contractually agreed payments for interest and repayment for financial
liabilities shown in the balance sheet:
Figures in € thousand 2017 2018 to 2021 after 2021
At December 31, 2016
Amounts due to banks 12,762 36,664 6,356
Liabilities under financial leases 1,320 3,409 26
Other financial liabilities 4,870 4,126 0
Trade payables 40,320 0 0
Other liabilities (excluding tax liabilities) 11,028 85 0
Figures in € thousand 2016 2017 to 2020 after 2020
At December 31, 2015
Amounts due to banks 14,215 39,742 2,544
Liabilities under financial leases 1,795 4,953 247
Other financial liabilities 3 51 0
Trade payables 37,178 0 0
Other liabilities (excluding tax liabilities) 12,765 292 0
079Consolidated Financial StatementsNotes to the Consolidated Financial Statements
Other Disclosures

The net result for the financial instruments in terms of valuation categories is as follows:
From subsequent valuation
Figures in € thousand
From interest
At fair value
Currency Trans-lation
Valuation adjust-
ment
From disposal
2016 2015
Loans and receivables 294 — — (404) — (110) (219)
Financial assets available for sale — — — — — — —
Financial assets held for trading — — — — — — —
Financial liabilities mea-sured at amortized cost (2,530) — — — — (2,530) (2,812)
Financial liabilities held for trading — — — — — — —
Valuation of financial instruments
Cash and cash equivalents and trade receivables normally have short residual maturities. Accordingly,
on the reporting date their carrying amounts approximately correspond to the fair value.
Trade payables and other liabilities generally have short residual maturities. The figures shown in
the balance sheet therefore approximately correspond to the fair values.
The fair values of interest-bearing loans and borrowings and lease liabilities are calculated as the
present value of the payments associated with the liabilities, with use of market interest rates.
The fair value hierarchy levels in accordance with IFRS 7 in combination with IFRS 13 are as follows:
Level 1: quoted market prices for identical assets and liabilities in active markets,
Level 2: information other than quoted market prices which is observable directly (e. g. prices) or indi-
rectly (e. g. derived from prices) and
Level 3: information for assets and liabilities which is not based on observable market data.
Further Financial
Instruments Disclosures
080 Consolidated Financial Statements Notes to the Consolidated Financial Statements
Other Disclosures

The carrying amounts for the financial instruments in terms of valuation categories are as follows:
Balance sheet valuation (IAS 39)
Figures in € thousandCat-
egory
Car-rying
amount Dec. 31,
2016
Amor-tized cost
Fair value
not recog-
nized in income
Fair value
recog-nized in income
Valu-ation acc.
IAS 17
Fair value Dec.
31, 2016
Assets
Cash and cash equivalents 1) 15,476 15,476 — — — 15,476
Trade receivables 1) 45,669 45,669 — — — 45,669
Other receivables 1) 8,027 8,027 — — — 7,865
Receivables from the finance lease n / a 3,141 — — — 3,141 3,353
Financial assets 2) 56 56 — — — 56
Equity and liabilities
Amounts due to banks 4) 52,231 52,231 — — — 52,221
Trade payables 4) 40,320 40,320 — — — 40,320
Liabilities under financial leases n / a 4,603 — — — 4,603 4,387
Other liabilities 4) 19,862 19,862 — — — 19,439
Derivatives with hedge relationships n / a — — — — —
Aggregated by valuation category acc. IAS 39
1) Loans and receivables 69,172 69,172 — — — 69,010
2) Financial assets available for sale 56 56 — — — 56
3) Financial assets held for trading — — — — — —
4) Financial liabilities measured at amortized cost 112,413 112,413 — — — 111,980
5) Financial liabilities held for trading — — — — — —
081Consolidated Financial StatementsNotes to the Consolidated Financial Statements
Other Disclosures
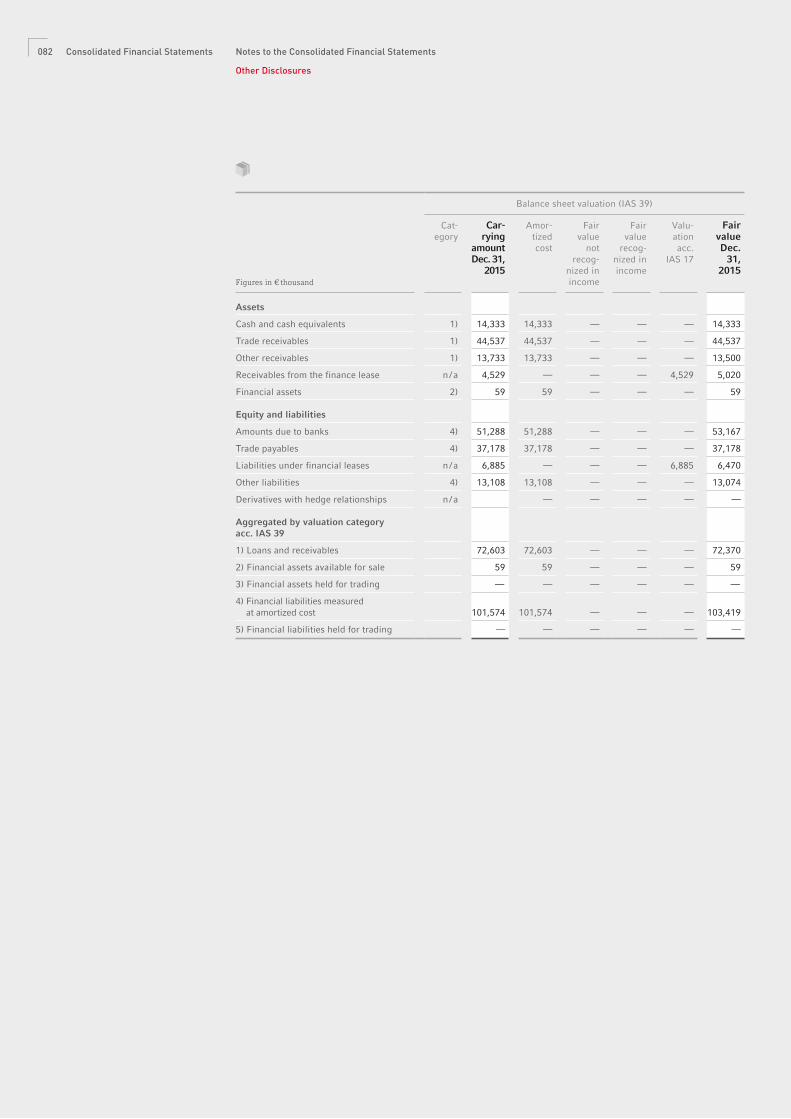
Balance sheet valuation (IAS 39)
Figures in € thousand
Cat-egory
Car-rying
amount Dec. 31,
2015
Amor-tized cost
Fair value
not recog-
nized in income
Fair value
recog-nized in income
Valu-ation acc.
IAS 17
Fair value Dec.
31, 2015
Assets
Cash and cash equivalents 1) 14,333 14,333 — — — 14,333
Trade receivables 1) 44,537 44,537 — — — 44,537
Other receivables 1) 13,733 13,733 — — — 13,500
Receivables from the finance lease n / a 4,529 — — — 4,529 5,020
Financial assets 2) 59 59 — — — 59
Equity and liabilities
Amounts due to banks 4) 51,288 51,288 — — — 53,167
Trade payables 4) 37,178 37,178 — — — 37,178
Liabilities under financial leases n / a 6,885 — — — 6,885 6,470
Other liabilities 4) 13,108 13,108 — — — 13,074
Derivatives with hedge relationships n / a — — — — —
Aggregated by valuation category acc. IAS 39
1) Loans and receivables 72,603 72,603 — — — 72,370
2) Financial assets available for sale 59 59 — — — 59
3) Financial assets held for trading — — — — — —
4) Financial liabilities measured at amortized cost 101,574 101,574 — — — 103,419
5) Financial liabilities held for trading — — — — — —
082 Consolidated Financial Statements Notes to the Consolidated Financial Statements
Other Disclosures

The segment reporting is prepared in accordance with the provisions of IFRS 8 (Operating Segments).
Its primary reporting format is based on geographical regions which have been grouped for the purpose
of corporate management. As the segment result – used for assessment of the business success of the
respective segments – the management has calculated the result for the period before taxes, financial
income, financial expenses, shares of profits of companies accounted for using the equity method and
amortization / impairment of goodwill (EBITA).
The Deufol Group has the following segments for which reporting requirements apply:
Germany
Rest of Europe
USA / Rest of the World
The holding company covers the Group’s administrative activities and, in addition to Group management
functions, includes support functions such as key account management and corporate communications.
The operating result (EBITA) for the business units is separately monitored by the management in
order to make decisions on the allocation of resources and to determine the units’ performance. The seg-
ments’ development is mainly measured with reference to the operating result. As the Deufol Group has a
decentralized organizational structure, financial expenses and income and income taxes can be allocated
to the individual business segments.
The prices charged between the business segments are determined on the basis of the arm’s length
principle.
Segment Information by
Region and Services
40 Segment Reporting
083Consolidated Financial StatementsNotes to the Consolidated Financial Statements
Segment Information by Region and Services

Figures in € thousand
Germany Rest of Europe
USA / Rest of the World
Holding company
Elimina-tion Group
2016
External sales 175,119 83,494 81,773 572 0 340,958
Internal sales 25,956 16,083 163 15,566 (57,768) 0
Total sales 201,075 99,577 81,936 16,138 (57,768) 340,958
EBIT 6,688 30 4,192 (1,012) (462) 9,436
Financial income 510 274 48 2,034 (2,345) 521
Finance costs (2,158) (443) (1,301) (1,356) 2,345 (2,913)
Income (loss) from associates and other equity investments 150 38 (29) (71) 0 88Other financial result (734) 0 0 (662) 0 (1,396)
EBT 4,456 (101) 2,910 (1,067) (462) 5,736
Taxes (1,101)
Result for the period 4,635
Assets 78,495 110,058 53,452 253,042 (265,049) 229,998
thereof financial assets accounted for using the equity method 712 91 14 49 0 866
Non-allocated assets 8,534
Total assets 238,532
Financial liabilities 22,220 31,453 46,259 31,483 (65,585) 65,830
Other debt 37,939 31,581 14,617 28,598 (52,483) 60,252
Non-allocated debt 4,341
Total liabilities 130,423
Depreciation, amortization and impairment 2,901 3,218 2,778 904 0 9,801
Investments 3,031 26,409 359 1,401 31,200
2015
External sales 170,219 70,668 83,212 736 0 324,835
Internal sales 25,371 13,621 2 14,973 (53,967) 0
Total sales 195,590 84,289 83,214 15,709 (53,967) 324,835
EBIT 4,509 2,548 4,845 (2,259) (1,477) 8,166
Financial income 392 467 131 3,115 (3,611) 494
Finance costs (1,938) (485) (2,565) (1,925) 3,611 (3,302)
Income (loss) from associates and other equity investments 144 0 43 (51) 0 136
EBT 3,107 2,530 2,454 (1,120) (1,477) 5,494
Taxes (1,902)
Result for the period 3,592
Assets 85,467 62,243 55,615 257,378 (245,728) 214,975
thereof financial assets accounted for using the equity method 3,843 53 43 0 0 3,939
Non-allocated assets 9,634
Total assets 224,609
Financial liabilities 31,400 11,008 50,581 33,500 (68,535) 58,224
Other debt 44,922 25,458 14,990 31,004 (55,057) 61,317
Non-allocated debt 2,674
Total liabilities 122,215
Depreciation, amortization and impairment 3,278 1,815 1,622 720 0 7435
Investments 4,505 951 85 842 0 6,383
41 Segment Information by
Region and Services
084 Consolidated Financial Statements Notes to the Consolidated Financial Statements
Segment Information by Region and Services

The Deufol Group has various customers which are themselves subsidiaries of a corporate group. In the past
financial year, the Deufol Group realized € 94.8 million (previous year: € 104.1 million) or approx. 27.8 %
(previous year: 32.0 %) of its total sales with these customers. This relates to the segments Rest of Europe
and USA / Rest of the World.
The following table shows the sales trend by service:
Figures in € thousand
Export & Industrial
Packaging
Consumer &Data
Packaging
Supple-mentary Services
Holding company
Elimination Group
2016
External sales 191,931 117,547 30,908 572 0 340,958
Internal sales 36,755 1,839 3,608 15,566 (57,768) 0
Total sales 228,686 119,386 34,516 16,138 (57,768) 340,958
2015
External sales 168,916 122,592 32,590 737 0 324,835
Internal sales 34,335 1,241 3,418 14,973 (53,967) 0
Total sales 203,251 123,833 36,008 15,710 (53,967) 324,835
No material events occurred after the balance sheet date for which a reporting obligation is applicable
pursuant to IAS 10.
42 Information on Services
43 Events after the
Balance Sheet Date
085Consolidated Financial StatementsNotes to the Consolidated Financial Statements
Segment Information by Region and Services

The Administrative Board – which comprised seven non-executive directors and two managing direc-
tors as of the end of 2016 – had the following membership in the reporting period:
Name and position
Detlef W. Hübner (Chairman)Appointed until the 2017 AGM
Managing Director of Deufol SE
Helmut Olivier (Deputy Chairman)Appointed until the 2017 AGM
Executive Board member of Lehman Brothers AG i. Ins.
Dr. Helmut Görling(until May 31, 2016)
Partner of AGS Acker Görling Schmalz Rechtsanwälte Partnerschaftsgesellschaft mbH, Frankfurt am Main
Dennis HübnerAppointed until the 2017 AGM
Managing Director of Deufol SE
Marc Hübner(since July 1, 2016)Appointed until the 2017 AGM
Head of Business Development
Holger Bürskens(since July 1, 2016) Appointed until the 2017 AGM
Partner of ARNECKE SIBETH Rechtsanwälte Partnergesellschaft mbB, Frankfurt am Main
Prof. Dr. Wolfgang KönigAppointed until the 2017 AGM
Managing Director at House of Finance, Goethe University Frankfurt
Wulf MatthiasAppointed until the 2017 AGM
Director of M. M. Warburg & CO, Frankfurt am Main
Peter ObereggerAppointed until the 2017 AGM
Managing Director at Peer Swan Group GmbH, Oberhaching
Axel WöltjenAppointed until the 2017 AGM
Managing Director of A. Wöltjen Consulting GmbH, Wendelstein
No loans or advances were granted to the members of the Administrative Board. Nor were any contingent
liabilities assumed in favor of the members of the Administrative Board.
In 2016, Administrative Board compensation totaled € 160 thousand (previous year: € 165 thousand).
Supplementary Disclosures
Disclosures Concerning
the Executive Bodies
086 Consolidated Financial Statements Notes to the Consolidated Financial Statements
Supplementary Disclosures

The Company had the following managing directors in the reporting period:
Name Departments
Klaus Duttiné Finance, Legal & Compliance, Investor Relations & Com-munications , Human Resources, Property & Administration, Purchasing
Dennis Hübner Production, IT Services, Box Engineering, Project Manage-ment, Operational Excellence, Compliance & Quality, Opera-tions: Rest of the World
Detlef W. Hübner Strategy
Jürgen Schmid Business Development, Operations: South Germany & Eastern Europe
The total remuneration of the managing directors can be broken down as follows:
Figures in € thousand 2016 2015
Fixed remuneration 1,450 1,532
Variable remuneration 600 495
Other remuneration 33 93
Total 2,083 2,120
The compensation of the managing directors for fiscal year 2016 totaled € 2,083 thousand (previous year:
€ 2,120 thousand). This relates to short-term benefits.
The consolidated financial statements of Deufol SE have a discharging effect for the preparation and
disclosure of the annual financial statements of the consolidated corporations pursuant to section 264
(3) HGB once the preconditions laid down in these provisions have been fulfilled. The following con-
solidated companies will in this case make use of the exemption provisions:
Deufol Nürnberg GmbH, Nuremberg
Deufol Frankfurt GmbH, Frankfurt am Main
Deufol West GmbH, Mülheim an der Ruhr
Deufol Süd GmbH, Neutraubling
Deufol Remscheid GmbH, Remscheid
IAD Industrieanlagen-Dienst GmbH, Munich
Deufol Berlin GmbH, Berlin
Information in Accordance
with Section 264 (3) of the
German Commercial Code
087Consolidated Financial StatementsNotes to the Consolidated Financial Statements
Supplementary Disclosures
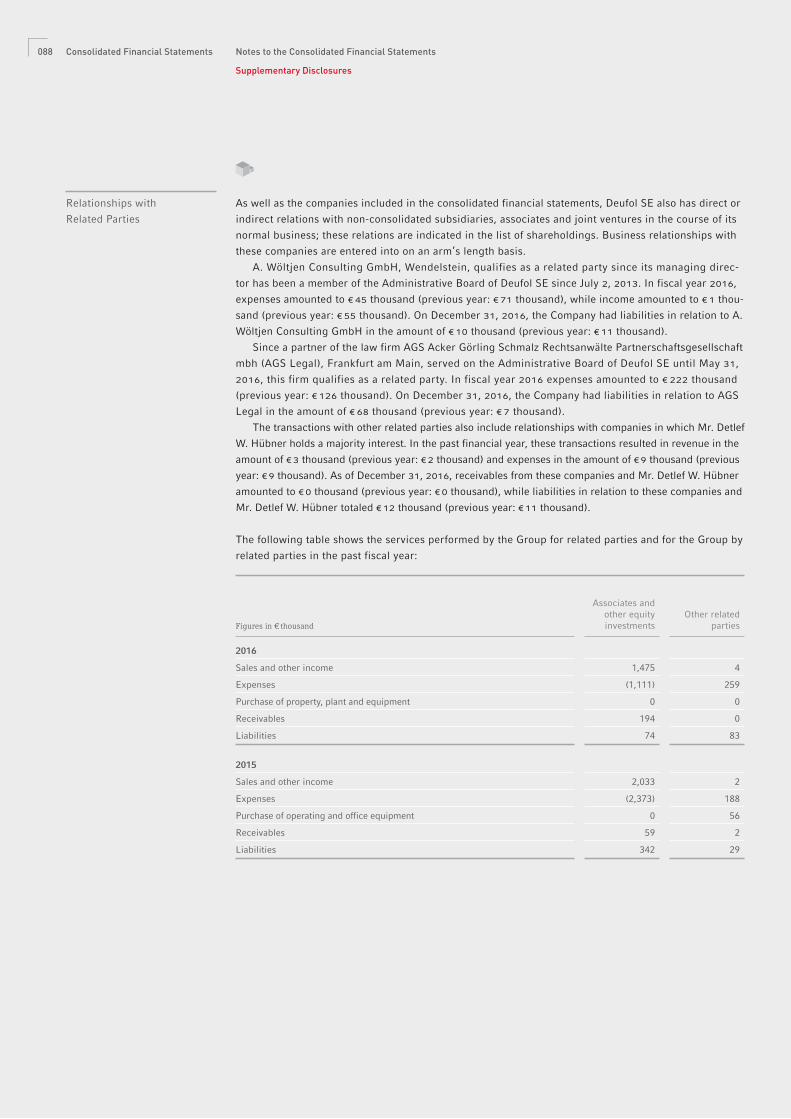
As well as the companies included in the consolidated financial statements, Deufol SE also has direct or
indirect relations with non-consolidated subsidiaries, associates and joint ventures in the course of its
normal business; these relations are indicated in the list of shareholdings. Business relationships with
these companies are entered into on an arm’s length basis.
A. Wöltjen Consulting GmbH, Wendelstein, qualifies as a related party since its managing direc-
tor has been a member of the Administrative Board of Deufol SE since July 2, 2013. In fiscal year 2016,
expenses amounted to € 45 thousand (previous year: € 71 thousand), while income amounted to € 1 thou-
sand (previous year: € 55 thousand). On December 31, 2016, the Company had liabilities in relation to A.
Wöltjen Consulting GmbH in the amount of € 10 thousand (previous year: € 11 thousand).
Since a partner of the law firm AGS Acker Görling Schmalz Rechtsanwälte Partnerschaftsgesellschaft
mbh (AGS Legal), Frankfurt am Main, served on the Administrative Board of Deufol SE until May 31,
2016, this firm qualifies as a related party. In fiscal year 2016 expenses amounted to € 222 thousand
(previous year: € 126 thousand). On December 31, 2016, the Company had liabilities in relation to AGS
Legal in the amount of € 68 thousand (previous year: € 7 thousand).
The transactions with other related parties also include relationships with companies in which Mr. Detlef
W. Hübner holds a majority interest. In the past financial year, these transactions resulted in revenue in the
amount of € 3 thousand (previous year: € 2 thousand) and expenses in the amount of € 9 thousand (previous
year: € 9 thousand). As of December 31, 2016, receivables from these companies and Mr. Detlef W. Hübner
amounted to € 0 thousand (previous year: € 0 thousand), while liabilities in relation to these companies and
Mr. Detlef W. Hübner totaled € 12 thousand (previous year: € 11 thousand).
The following table shows the services performed by the Group for related parties and for the Group by
related parties in the past fiscal year:
Figures in € thousand
Associates and other equity investments
Other related parties
2016
Sales and other income 1,475 4
Expenses (1,111) 259
Purchase of property, plant and equipment 0 0
Receivables 194 0
Liabilities 74 83
2015
Sales and other income 2,033 2
Expenses (2,373) 188
Purchase of operating and office equipment 0 56
Receivables 59 2
Liabilities 342 29
Relationships with
Related Parties
088 Consolidated Financial Statements Notes to the Consolidated Financial Statements
Supplementary Disclosures

Auditors’ ReportWe have audited the consolidated financial statements – comprising the income statement, statement of
comprehensive income, balance sheet, cash flow statement, statement of changes in equity and notes
– and the Company and Group management report prepared by Deufol SE, Hofheim am Taunus, for the
fiscal year from January 1 to December 31, 2016. The Company’s management is responsible for prepara-
tion of the consolidated financial statements and the summarized management and Group management
report in accordance with the International Financial Reporting Standards (IFRS) as adopted by the EU
and the supplementary provisions of German commercial law required to be applied under section 315
a (3) HGB. Our responsibility is to express an opinion on the consolidated financial statements and the
summarized management report and Group management report based on our audit.
We conducted our audit of the consolidated financial statements in accordance with section 317 HGB
and the German generally accepted standards for the audit of financial statements promulgated by
the Institut der Wirtschaftsprüfer (IDW). Those standards require that we plan and perform the audit
such that misstatements materially affecting the presentation of the net assets, financial position and
results of operations in the consolidated financial statements in accordance with the applicable finan-
cial reporting standards and in the Company and Group management report are detected with reason-
able assurance. Knowledge of the business activities and the economic and legal environment of the
Group and expectations as to possible misstatements are taken into account in the determination of
audit procedures. The effectiveness of the accounting-related internal control system and the evidence
supporting the disclosures in the consolidated financial statements and the Company and Group man-
agement report are examined primarily on a test basis within the framework of the audit. The audit
includes assessing the annual financial statements of the companies included in the consolidated
financial statements, the determination of the companies to be included in the consolidated financial
statements, the accounting and consolidation principles used and significant estimates made by the
management, as well as evaluating the overall presentation of the consolidated financial statements
and the Company and Group management report. We believe that our audit provides a reasonable basis
for our opinion.
Our audit has not led to any reservations.
In our opinion, based on the findings of our audit, the consolidated financial statements of Deufol SE, Hof-
heim, comply with IFRS as adopted by the EU and the supplementary provisions of German commercial law
required to be applied under section 315 a (3) HGB and give a true and fair view of the net assets, financial
position and results of operations of the Group in accordance with these requirements. The summarized
management report and Group management report is consistent with the consolidated financial statements,
complies with applicable statutory provisions, as a whole provides a suitable understanding of the Group’s
position and suitably presents the opportunities and risks of future development.
Frankfurt am Main, April 28, 2017
VOTUM AG
Wirtschaftsprüfungsgesellschaft
Steuerberatungsgesellschaft
Lothar Stache Alexander Leoff
Certified auditor Certified auditor
Consolidated Financial StatementsAuditors’ Report 089

TEAMWORK MAKES THE DREAM WORK.
A good team needs good trainers. That is why in 2016 we developed Deufol’s EXPERT PROGRAM, or “DEXPRO” for short. This en-ables us to bring to life, worldwide, the es-sence of the Deufol Group and its vision for the future. The DEXPRO program supports and motivates our employees and fosters their development. We develop competenc-es and shorten communication channels. DEXPRO is supported by WE-Q, our inter-nal knowledge database which provides all of our employees with rapid access to key information. We thus guarantee continuous optimization of our internal processes, which in turn benefi ts our customers.
WE WORK SMARTER. NOT HARDER.
090

091 FACTS & FIGURES
092 Information on Deufol SE
092 Income Statement of Deufol SE
093 Balance Sheet of Deufol SE
094 Significant Equity Investments of Deufol SE
095 Glossary
096 Consolidated Key Figures – Five-Year Overview
098 Operational Investments of Deufol SE
100 Imprint
091

Information on Deufol SE
Income Statement of Deufol SE Figures in € thousand 2016 2015
1. Sales 12,974 12,757
2. Other operating incomethereof income from currency translation: € 357 thousand(previous year: € 1,303 thousand) 8,420 6,988
3. Cost of materials a) Expenses for raw materials, consumables
and supplies and for purchased merchandise (3,915) (3,902)
4. Personnel costs a) Wages and salaries b) Social security contributions
(6,198)(583)
(5,447)(535)
5. Amortization of intangible assets and depreciation of property,plant and equipment (1,466) (895)
6. Other operating expenses thereof expenses for currency translation: € 123 thousand
(previous year: € 220 thousand) (11,525) (10,525)
7. Income due to profit transfer agreementsthereof from affiliated companies: € 5,232 thousand(previous year: € 3,224 thousand) 5,232 3,224
8. Other interest and similar incomethereof from affiliated companies: € 1,921 thousand(previous year: € 3,098 thousand) 2,034 3,115
9. Write-downs of financial assets (4,860) (458)
10. thereof for affiliated companies:€ 291 thousand (previous year: € 397 thousand) (1,356) (1,925)
11. Income taxes (192) (567)
12. Earnings after taxes (1,435) 1,832
13. Other taxes (84) (22)
14. Net loss / profit for the year (1,520) 1,810
15. Retained profits brought forward 24,740 22,929
16. Allocations to other revenue reserves (10,000) 0
17. Net income for the year 13,220 24,740
092 Facts & Figures

Balance Sheet of Deufol SE
Assets
Figures in € thousand Dec. 31, 2016 Dec. 31, 2015
A. Fixed assets 109,535 114,022
I. Intangible assets 1. Purchased licenses, trademarks and similar rights and
assets as well as licenses for such rights and assets 2. Advance payments made
2,810
2,188622
2,947
2,290657
II. Property, plant and equipment 1. Land, land rights and buildings including buildings on third-party land 2. Other equipment, operating and office equipment 3. Advance payments made and assets under construction
6,2565,291
846119
6,2075,434
72946
III. Financial assets 1. Shares in affiliated companies 2. Loans to affiliated companies 3. Investments 4. Loans to companies in which a participating interest is held
100,46995,6424,638
1890
104,86899,846
4,720302
0
B. Current assets 45,157 46,240
I. Receivables and other assets 1. Trade receivables 2. Receivables from affiliated companies 3. Receivables from companies in which a participating interest is held 4. Other assets
39,746157
37,43235
2,122
36,890136
35,29523
1,436
II. Cash in hand, bank balances 5,411 9,350
C. Deferred expenses and accrued income 284 170
Total assets 154,976 160,432
Equity and liabilitiesFigures in € thousand Dec. 31, 2016 Dec. 31, 2015
A. Equity 94,688 96,744
I. Subscribed capital less nominal amount of treasury stock
Contingent capital: € 20,000 thousand (previous year: € 20,000 thousand)
43,774 (813)
42,961
43,774
II. Capital reserves 28,184 28,184
III. Retained earnings 1. Legal reserve 2. Other revenue reserves
10,323 46
10,277 46
IV. Net income for the year thereof retained profits brought forward:
€ 14,740 thousand (previous year: € 22,929 13,220 24,740
B. Provisions 4,306 2,154
1. Tax provisions 206 233
2. Other provisions 4,100 1,921
C. Liabilities 55,982 61,534
1. Liabilities to banks 31,095 33,276
2. Trade payables 1,522 1,207
3. Liabilities to affiliated companies 21,623 25,232
4. Liabilities to companies in which a participating interest is held 60 29
5. Other liabilities thereof taxes: € 1,261 thousand
(previous year: € 1,465 thousand) thereof social security liabilities:
€ 0 thousand (previous year: € 0 thousand) 1,682 1,790
D. Deferred income and accrued expenses 0 0
Total equity and liabilities 154,976 160,432
093Facts & Figures
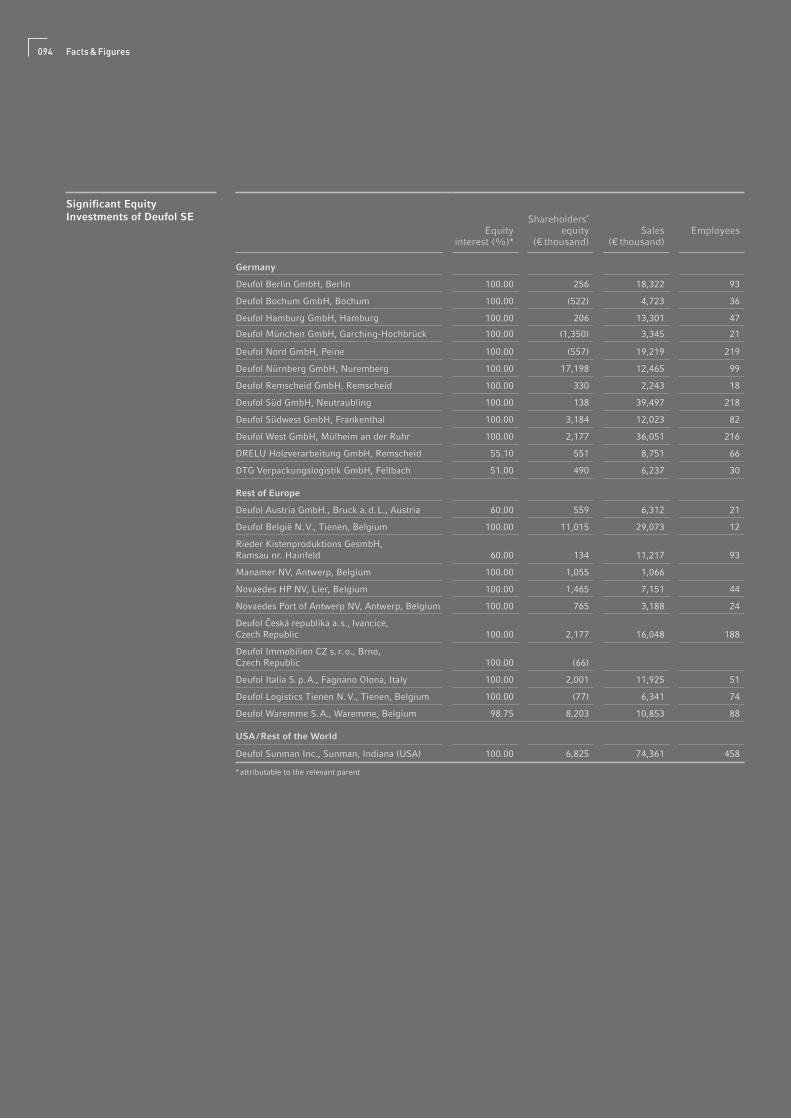
Equity interest (%)*
Shareholders’ equity
(€ thousand)Sales
(€ thousand)Employees
Germany
Deufol Berlin GmbH, Berlin 100.00 256 18,322 93
Deufol Bochum GmbH, Bochum 100.00 (522) 4,723 36
Deufol Hamburg GmbH, Hamburg 100.00 206 13,301 47
Deufol München GmbH, Garching-Hochbrück 100.00 (1,350) 3,345 21
Deufol Nord GmbH, Peine 100.00 (557) 19,219 219
Deufol Nürnberg GmbH, Nuremberg 100.00 17,198 12,465 99
Deufol Remscheid GmbH, Remscheid 100.00 330 2,243 18
Deufol Süd GmbH, Neutraubling 100.00 138 39,497 218
Deufol Südwest GmbH, Frankenthal 100.00 3,184 12,023 82
Deufol West GmbH, Mülheim an der Ruhr 100.00 2,177 36,051 216
DRELU Holzverarbeitung GmbH, Remscheid 55.10 551 8,751 66
DTG Verpackungslogistik GmbH, Fellbach 51.00 490 6,237 30
Rest of Europe
Deufol Austria GmbH., Bruck a. d. L., Austria 60.00 559 6,312 21
Deufol België N. V., Tienen, Belgium 100.00 11,015 29,073 12
Rieder Kistenproduktions GesmbH, Ramsau nr. Hainfeld 60.00 134 11,217 93
Manamer NV, Antwerp, Belgium 100.00 1,055 1,066
Novaedes HP NV, Lier, Belgium 100.00 1,465 7,151 44
Novaedes Port of Antwerp NV, Antwerp, Belgium 100.00 765 3,188 24
Deufol Česká republika a. s., Ivancice, Czech Republic 100.00 2,177 16,048 188
Deufol Immobilien CZ s. r. o., Brno, Czech Republic 100.00 (66)
Deufol Italia S. p. A., Fagnano Olona, Italy 100.00 2,001 11,925 51
Deufol Logistics Tienen N. V., Tienen, Belgium 100.00 (77) 6,341 74
Deufol Waremme S. A., Waremme, Belgium 98.75 8,203 10,853 88
USA / Rest of the World
Deufol Sunman Inc., Sunman, Indiana (USA) 100.00 6,825 74,361 458
* attributable to the relevant parent
Significant Equity Investments of Deufol SE
094 Facts & Figures

Asset depreciation ratio
Ratio of the accumulated depreciation of property,
plant and equipment to the historical cost
Asset cover ratio I
Ratio of equity to noncurrent assets
Asset cover ratio II
Ratio of equity plus noncurrent liabilities
to noncurrent assets
Days sales outstanding
Ratio of trade accounts receivable to revenue
Net carrying amount per share
Ratio of equity adjusted for deferred tax assets to
the number of shares in circulation
Capital employed
Operating capital that is tied up in the operation of
a company. It is the total of working capital, the net
carrying amount of property, plant and equipment
and other noncurrent assets (offset against other
noncurrent, non-interest-bearing liabilities)
Dividend yield (%)
Dividend paid for the fiscal year as a ratio of the
year-end stock exchange price
EBIT
Earnings before interest and taxes
EBITA
Earnings before interest, taxes and amortization /
impairment of goodwill
EBITDA
Earnings before interest, taxes, depreciation and
amortization / impairment of goodwill
EBT
Earnings before taxes
EBTA
Earnings before taxes and amortization / impairment
of goodwill
Enterprise value
The enterprise value is the value (price) of a com-
pany if it were to be purchased and subsequently
freed of debt (including the sale of non-operating
assets such as fi nancial assets). It is calculated as
the sum of the company‘s market capitalization and
net liabilities
Free cash fl ow
The net amount of cash fl ow from ordinary operating
activities and cash fl ow from investing activities
Investment ratio
Ratio of capital expenditure to sales
Days payables outstanding
Ratio of trade payables to revenue
Price earnings ratio
Ratio of share price to earnings per share
Cash ratio (%)
Ratio of cash and cash equivalents to current
liabilities
Acid test (%)
Ratio of cash and cash equivalents plus current
receivables and inventories to current liabilities
Current ratio (%)
Ratio of cash and cash equivalents plus current
receivables to current liabilities
Net fi nancial liabilities
Financial liabilities less fi nancial receivables and
cash and cash equivalents
Operating cash fl ow
Cash fl ow from operating activities
Personnel expense ratio
Ratio of personnel expenses to revenue
Property, plant and equipment ratio
Ratio of property, plant and equipment to total assets
Receivables turnover
Ratio of revenue to trade accounts receivable
Working capital
Working capital is the difference between current
assets and current non-interest-bearing liabilities.
Interest cover
The total of EBITA and interest income divided by
interest expense
Glossary
095Facts & Figures

Results of Operations
2016 2015 2014 2013 2012
Sales (€ thousand) 340,958 324,835 298,871 318,698 333,014
Change on previous year (%) 5.0 8.7 (6.2) (4.3) 5.7
EBITDA (€ thousand) 19,237 15,601 13,453 14,765 14,976
Margin (%) 5.6 4.8 4.5 4.6 4.5
EBITA (€ thousand) 9,436 8,166 6,228 6,045 6,207
Margin (%) 2.8 2.5 2.1 1.9 1.9
EBT (€ thousand) 5,736 5,494 3,500 2,725 2,808
Margin (%) 1.7 1.7 1.2 0.9 0.8
Income (loss) from continuing operations (€ thousand) 4,635 3,592 468 478 406
Margin (%) 1.4 1.1 0.2 0.2 0.1
Net income (€ thousand) 5,064 3,299 228 294 (279)
Margin (%) 1.5 1.0 0.1 0.1 (0.1)
Operating cash flow (€ thousand) 12,001 5,541 22,243 17,188 16,007
Margin (%) 3.5 1.7 7.4 5.4 4.8
Free cash flow (€ thousand) 6,073 2,673 19,905 12,010 13,612
Margin (%) 1.8 0.8 6.7 3.8 4.1
Consolidated Key Figures – Five-Year Overview
Assets Position
2016 2015 2014 2013 2012
Current assets (€ thousand) 86,575 87,537 79,434 70,798 76,124
as % of total assets 36.3 39.0 36.4 33.2 34.5
Noncurrent assets (€ thousand) 151,957 137,072 138,917 142,159 144,816
as % of total assets 63.7 61.0 63.6 66.8 65.5
Balance sheet total (€ thousand) 238,532 224,609 218,351 212,957 220,940
Change on previous year (%) 6.2 2.9 2.5 (3.6) (5.3)
Liabilities (€ thousand) 130,423 122,215 121,003 117,419 124,282
as % of total assets 54.7 54.4 55.4 55.1 56.3
Shareholders’ equity (€ thousand) 108,109 102,394 97,348 95,538 96,658
as % of total assets 45.3 45.6 44.6 44.7 43.8
Working capital (€ thousand) 28,683 30,543 24,294 23,534 31,772
as % of total assets 12.0 13.6 11.1 11.1 14.4
Capital employed (€ thousand) 176,878 161,383 156,983 159,079 168,373
as % of total assets 74.2 71.9 71.9 74.7 76.2
Noncurrent / current assets 1.76 1.57 1.75 2.0 1.90
Shareholders’ equity / liabilities 0.83 0.84 0.80 0.81 0.78
Property, plant and equipment ratio 0.25 0.20 0.21 0.22 0.22
Asset depreciation ratio (%) 59.6 66.6 65.1 62.6 62.9
Inventories / sales (%) 4.2 3.9 4.1 3.8 3.7
Receivables turnover 7.5 7.3 8.8 8.6 7.6
Days sales outstanding 48.9 50.0 41.3 42.4 48.1
Days payables outstanding 43.2 41.8 44.4 35.9 33.4
096 Facts & Figures

Productivity ratios
2016 2015 2014 2013 2012
Sales per employee (€) 117,612 122,974 118,459 117,862 120,483
EBITDA per employee (€) 6,636 5,906 5,332 5,460 5,418
EBITA per employee (€) 3,255 3,091 2,468 2,236 2,246
Operating cash flow per employee (€) 4,140 2,098 8,816 6,357 5,791
Personnel costs per employee (€) 38,520 39,065 37,688 35,549 35,492
Personnel cost ratio (%) 32.8 31.8 31.8 30.2 29.5
Per-share ratios
2016 2015 2014 2013 2012
Earnings per share from continuing operations (€) 0.118 0.075 0.005 0.007 0.001
Earnings per share (EPS), (€) 0.118 0.075 0.005 0.007 (0.006)
Price earnings ratio (PER) 7.3 7.1 151.5 142.9 n / m
Dividend per share (€) 0.00 0.00 0 (e) 0.00 0.00
Dividend yield (%) — — — — —
Book value per share (€) 2.39 2.06 1.98 2.01
Price / book value 0.36 2.15 0.38 0.48 0.51
Book value per share less goodwill (€) 0.74 0.25 0.49 0.41 0.45
Price / book value less goodwill 1.2 0.59 1.6 2.3 2.3
Investment ratios
2016 2015 2014 2013 2012
Market capitalization / sales 0.11 0.07 0.12 0.13 0.13
Enterprise value / sales 0.26 0.21 0.26 0.32 0.33
Enterprise value / EBITDA 4.7 4.4 5.8 6.8 7.3
Enterprise value / EBIT 9.5 8.3 12.5 16.6 17.6
Enterprise value / operating cash flow 7.5 12.3 3.5 5.9 6.8
Enterprise value / free cash flow 14.8 25.4 3.9 8.4 8.0
Financial and liquidity ratios
2016 2015 2014 2013 2012
Capital employed / sales (%) 51.9 49.7 52.5 49.9 50.6
Investment ratio (%) 7.1 1.6 1.9 2.8 2.6
Operating cash flow / investments (%) 42.0 86.8 330.6 171.0 167.5
Asset cover ratio I (%) 77.3 83.5 78.9 77.8 78.3
Asset cover ratio II (%) 115.8 125.2 122.7 95.2 127.6
Interest cover 3.4 2.6 1.7 1.3 1.4
Cash ratio (%) 20.2 20.2 23.9 5.2 11.5
Acid test (%) 94.4 105.5 100.2 61.0 100.5
Current ratio (%) 113.2 123.2 118.7 73.6 120.1
Financial liabilities / equity (%) 64.0 61.7 65.4 72.4 80.5
Financial liabilities / capital employed (%) 37.2 36.1 37.5 39.5 42.1
Net financial liabilities / EBITDA 2.4 2.5 2.7 3.4 3.7
Net financial liabilities / market capitalization (%) 128.5 169.3 107.0 119.8 123.3
097Facts & Figures

Deufol Remscheid GmbH
* As at December 31, 2016; in %
Tier 1 investment
Tier 2 investment
Tier 3 / 4 investment
1) Consolidated at equity 2) Unconsolidated 3) This company is wholly owned by Novaedes International NV 4) Rieder Verpackungs- und Logistik GmbH (AT) holds a 50 % interest in this company
Operational Investments of Deufol SE*
Germany
Deufol SE
Deufol Süd GmbH
Deufol Frankfurt GmbH
Deufol München GmbH
Deufol Berlin GmbH
Deufol Hamburg GmbH
Mantel Industrieverpackung GmbH 1)
DRELU Holzverarbeitung GmbH
Deufol Bochum GmbH
Deufol Nord GmbH
IAD Industrieanlagen-Dienst GmbH
Deufol West GmbH
Deufol Südwest GmbH
DTG Verpackungslogistik GmbH
SIV Siegerländer Industrieverpackung GmbH 1)
Deutsche Tailleur Bielefeld GmbH & Co. KG 1)
Novaedes Germany GmbH 3)
Deutsche Tailleur Bielefeld Beteiligungs-GmbH 2)
Deufol Nürnberg GmbH
100.0
100.0
50.0
30.0
30.0
100.0 100.0
100.0 100.0
100.0 100.0
100.0 100.0
51.02
100.0100.0
50.0
55.1
100.0
100.0
88.0
50.0
Deufol time solutions GmbH
Deufol Services & IT GmbH
Deufol Airport Services GmbH
Deufol Meilink GmbH 1)
098 Facts & Figures

Europe
Rest of the World
Deufol SE
Deufol SE
Seaworthy Packaging Solutions Co. Ltd. 1) 4) (CN)
Deufol Logistics Tienen N. V. (BE)
Deufol Packaging Tienen N. V. (BE)
Deufol Italia S. p. A. (IT)
Rieder Verpackungs- und Logistik GmbH (AT)
Deufol Austria GmbH (AT)
Rieder Kistenproduktion (AT)gesellschaft m. b. H.
Packing Center Terminal Graz Süd GmbH (AT)
Deufol Česká republika a. s. (CZ)
Deufol Slovensko s. r. o. (SK)
Deufol Immobilien CZ s. r. o. (CZ)
Deufol Nürnberg GmbH (in Germany)
Deufol België N. V. (BE)
Novaedes International NV (BE)
Arcus Installation B. V. B. A. (BE)
Novaedes Brussels NV (BE)
Novaedes France SAS (FR)
Novaedes HP NV (BE)
Novaedes Port of Antwerp NV (BE)
Deufol Technics N. V. (BE)
Deufol Waremme S. A. (BE)
Manamer NV (BE)
Deufol St. Nabord SAS 1) (FR)
SCI Immo DLS2) (FR)
Deufol North America Inc. (US)
Deufol Sunman Inc. (US)
Deufol Charlotte LLC. (US)
Deufol Meilink Asia PTE. LTD.1) (SG)
100.0100.0
100.0 100,0
100.0
100.0
0.5
0.25
0.08
100.0
100.0
100.0
100,0
50.0
100.0
100.0
99.5
100.0
99.75
99.92
100.0
98.8
24.0
0.57
100.0
98.86
100.0
100.0
60.0
100.0
100.0
100.0
100.0
Deufol (Suzhou) Packaging Co., Ltd. (CN)
Deufol Meilink Yantai 1) (CN)
100.0
100.0
Deufol Nürnberg GmbH (in Germany)
099Facts & Figures

This report is available in German and English. Both versions are available on the Internet at www.deufol.com.
Financial Calendar
June 28, 2017 Annual General Meeting 2017
August 18, 2017 Half-Year Financial Report 2017
April 30, 2018 Annual Financial Report 2017
Imprint
Publisher:
Deufol SE
Johannes-Gutenberg-Strasse 3 – 5
65719 Hofheim am Taunus
Telephone: + 49 (61 22) 50 - 00
Fax: + 49 (61 22) 50 - 13 00
E-mail: info @ deufol.com
Concept:
FIRST RABBIT GmbH, Cologne
PrePress:
FIRST RABBIT GmbH, Cologne
Contact:
Deufol SE
Claudia Ludwig
Johannes-Gutenberg-Strasse 3 – 5
65719 Hofheim am Taunus
Telephone: + 49 (61 22) 50 - 12 28
E-mail: [email protected]
Key to Symbols
100 Imprint
Basis of Preparation
Scope of Consolidation
Consolidated Income Statement Disclosures
Consolidated Balance Sheet Disclosures
Consolidated Cash Flow Statement Disclosures
Other Disclosures
Segment Information
Supplementary Disclosures


DEUFOL SEJOHANNES-GUTENBERG-STR. 3 – 565719 HOFHEIM (WALLAU), GERMANYTELEPHONE: + 49 (061 22) 50 - 00FAX: + 49 (061 22) 50 - 13 [email protected]