Removal of Carmoisine edible dye by Fenton and photo ... · and photo Fenton processes using...
9
ORIGINAL ARTICLE Removal of Carmoisine edible dye by Fenton and photo Fenton processes using Taguchi orthogonal array design Mahmood R. Sohrabi a , Afrooz Khavaran a, * , Shahab Shariati b , Shayan Shariati c a Department of Chemistry, North Tehran Branch, Islamic Azad University, Tehran, Iran b Department of Chemistry, Science and Research Branch, Islamic Azad University, Guilan, Iran c Young Researchers and Elite Club, Rasht Branch, Islamic Azad University, Rasht, Iran Received 10 July 2013; accepted 26 February 2014 KEYWORDS Fenton; Photo Fenton; Fractional factorial design; Carmoisine; Removal Abstract This research was designed to investigate the removal of Carmoisine from aqueous solu- tions by advanced oxidation processes including Fenton and photo Fenton systems. The progress of oxidation of Carmoisine dye was monitored by UV–Vis spectrophotometer. The effect of operating parameters affecting removal efficiency such as H 2 O 2 , Fe 2+ and dye concentrations as well as pH was studied and optimized using Taguchi fractional factorial design during removal of Carmoisine from 50 mL of solutions. Optimal conditions were achieved as 0.015 mmol Fe 2+ , 0.15 mmol H 2 O 2 , 20 mg/L initial dye concentration and pH = 3.5, for the Fenton process and 0.0125 mmol Fe 2+ , 0.3 mmol H 2 O 2 , 20 mg/L initial dye concentration and pH = 3.5 for the photo Fenton process. Also, removal yields were achieved as 92.7% for the Fenton and 95.1% for the photo Fenton pro- cesses in optimal conditions. The result of this study showed high efficient removal of Carmoisine by advanced oxidation processes that introduced it as a cheap, versatile and efficient method for removal of this pollutant. ª 2014 King Saud University. Production and hosting by Elsevier B.V. All rights reserved. 1. Introduction Dyes are an important class of pollutants that are consisted of two main components: chromophores and auxochromes (Cuiping et al., 2012). The first is responsible for producing color, and the second supplements the chromophore and also renders the molecule soluble in water. Dyes show notable structural variety and are classified in several ways. Among them azo dyes, are the largest category of synthetic dyes, and are characterized by the presence of azo bonds (AN‚NA) with one or more aromatic systems, which may also have sul- fonic acid groups (Gupta and Susah, 2009; Behnajady et al., 2007). These dyes are widely used in a variety of industries like textile, rubber, plastic, leather, cosmetics and food industries. In recent years the use of edible dyes in the food industry has significantly increased because one of the most important qualities of food is color. Natural or synthetic food colorants are often added to foodstuffs and soft drinks in order to keep * Corresponding author. Tel.: +98 9113330687. E-mail address: [email protected] (A. Khavaran). Peer review under responsibility of King Saud University. Production and hosting by Elsevier Arabian Journal of Chemistry (2014) xxx, xxx–xxx King Saud University Arabian Journal of Chemistry www.ksu.edu.sa www.sciencedirect.com 1878-5352 ª 2014 King Saud University. Production and hosting by Elsevier B.V. All rights reserved. http://dx.doi.org/10.1016/j.arabjc.2014.02.019 Please cite this article in press as: Sohrabi, M.R. et al., Removal of Carmoisine edible dye by Fenton and photo Fenton processes using Taguchi orthogonal array design. Arabian Journal of Chemistry (2014), http://dx.doi.org/10.1016/j.arabjc.2014.02.019
Transcript of Removal of Carmoisine edible dye by Fenton and photo ... · and photo Fenton processes using...
Arabian Journal of Chemistry (2014) xxx, xxx–xxx
King Saud University
Arabian Journal of Chemistry
www.ksu.edu.sawww.sciencedirect.com
ORIGINAL ARTICLE
Removal of Carmoisine edible dye by Fenton
and photo Fenton processes using Taguchi orthogonal
array design
Mahmood R. Sohrabia, Afrooz Khavaran
a,*, Shahab Shariatib, Shayan Shariati
c
a Department of Chemistry, North Tehran Branch, Islamic Azad University, Tehran, Iranb Department of Chemistry, Science and Research Branch, Islamic Azad University, Guilan, Iranc Young Researchers and Elite Club, Rasht Branch, Islamic Azad University, Rasht, Iran
Received 10 July 2013; accepted 26 February 2014
*
E
Pe
18
ht
Po
KEYWORDS
Fenton;
Photo Fenton;
Fractional factorial design;
Carmoisine;
Removal
Corresponding author. Tel.
-mail address: afrooz_5252@
er review under responsibilit
Production an
78-5352 ª 2014 King Saud U
tp://dx.doi.org/10.1016/j.arab
lease cite this article in pressrthogonal array design. Arab
: +98 91
yahoo.c
y of King
d hostin
niversity
jc.2014.0
as: Sohraian Journ
Abstract This research was designed to investigate the removal of Carmoisine from aqueous solu-
tions by advanced oxidation processes including Fenton and photo Fenton systems. The progress of
oxidation of Carmoisine dye was monitored by UV–Vis spectrophotometer. The effect of operating
parameters affecting removal efficiency such as H2O2, Fe2+ and dye concentrations as well as pH
was studied and optimized using Taguchi fractional factorial design during removal of Carmoisine
from 50 mL of solutions. Optimal conditions were achieved as 0.015 mmol Fe2+, 0.15 mmol H2O2,
20 mg/L initial dye concentration and pH = 3.5, for the Fenton process and 0.0125 mmol Fe2+,
0.3 mmol H2O2, 20 mg/L initial dye concentration and pH = 3.5 for the photo Fenton process.
Also, removal yields were achieved as 92.7% for the Fenton and 95.1% for the photo Fenton pro-
cesses in optimal conditions. The result of this study showed high efficient removal of Carmoisine
by advanced oxidation processes that introduced it as a cheap, versatile and efficient method for
removal of this pollutant.ª 2014 King Saud University. Production and hosting by Elsevier B.V. All rights reserved.
1. Introduction
Dyes are an important class of pollutants that are consisted oftwo main components: chromophores and auxochromes(Cuiping et al., 2012). The first is responsible for producing
13330687.
om (A. Khavaran).
Saud University.
g by Elsevier
. Production and hosting by Elsev
2.019
bi, M.R. et al., Removal of Carmoal of Chemistry (2014), http://dx.d
color, and the second supplements the chromophore and also
renders the molecule soluble in water. Dyes show notablestructural variety and are classified in several ways. Amongthem azo dyes, are the largest category of synthetic dyes, andare characterized by the presence of azo bonds (AN‚NA)
with one or more aromatic systems, which may also have sul-fonic acid groups (Gupta and Susah, 2009; Behnajady et al.,2007). These dyes are widely used in a variety of industries like
textile, rubber, plastic, leather, cosmetics and food industries.In recent years the use of edible dyes in the food industry
has significantly increased because one of the most important
qualities of food is color. Natural or synthetic food colorantsare often added to foodstuffs and soft drinks in order to keep
ier B.V. All rights reserved.
isine edible dye by Fenton and photo Fenton processes using Taguchioi.org/10.1016/j.arabjc.2014.02.019

Figure 1 Chemical structure of Carmoisine.
2 M.R. Sohrabi et al.
the natural color during process or storage and to create thedesired colored appearance, also for recovering the color lossdue to exposure to light, air, temperature extremes and humid-
ity (Vachirapatama et al., 2008).Nowadays in many developed countries only about 10 dyes
are permitted for use as edible color, and many others have
been prohibited in the last two decades due to their toxicityand carcinogenicity (Ozdemir and Akkan, 1999).
Carmoisine is a synthetic azo class of dyes that produces
red color to foods. The presence of sulfonic groups in dyemakes it polar and soluble in water (Gupta et al., 2009). Thisdye is used in edibles like jelly, jams, sweets and preservatives.The use of Carmoisine is banned in many developed countries
due to the presence of b-naphthylamine, a known carcinogenin it that is created from reduction of azo groups (Tuormaa,1994; Biswas et al., 2007). This dye can cause drug sensitivity
or asthma and allergy to many people. It enhances behavioralcomplications like hyperactivity, and sleeplessness in childrenand high doses of the dye also result in coma and even death.
Thus, it is necessary; to focus the research in removing the Car-moisine from effluents using an applicable method without anyby product (Gupta et al., 2009).
To overcome the problems of traditional treatment meth-ods, different chemical oxidation processes have appeared inthe last decades. Chemical oxidation processes can be dividedinto two categories: (a) classical chemical treatments (b) ad-
vanced oxidation processes (AOPs).Classical chemical treatments usually include the addition
of an oxidizing agent (chlorine, potassium permanganate, oxy-
gen, hydrogen peroxide and ozone) to the water containing thepollutant (Ricciardi, 2006).
The concept of advanced oxidation processes was defined
by Glaze and co-workers in 1987 as near ambient tempera-ture and pressure water treatment processes. These treatmentmethods were investigated for decolorization and mineraliza-
tion of a large range of dyes to stable inorganic compoundsor, at least, their change into biodegradable or harmlessproducts (Trapido, 2007). The AOPs methods are basedon the generation of hydroxyl radicals (�OH) in solution that
is a very reactive, non-selective and powerful oxidizing agentwhich has a strong oxidative potential (E0 = 2.80 V) (Houet al., 2011). Hydroxyl radicals (�OH) can destruct organic
compounds via hydroxylation by addition of hydroxylgroups to the non-saturated bonds or by dehydrogenationwith the loss of hydrogen atoms (Soon and Hameed, 2013;
Ghoneim et al., 2011; Fenton, 1894; Muruganandham andSwaminathan, 2004). Fenton and photo-Fenton processesare the most important advanced oxidation treatments basedon the use of H2O2. The superiority of these processes is the
complete destruction of pollutants to harmless compounds,such as carbon dioxide and water (Gomathi Devi et al.,2011).
1.1. Taguchi orthogonal array experimental design
In recent years, in order to optimize and design experiments,
the Taguchi method has been used widely. The Taguchi meth-od uses the systematic orthogonal arrays (OA) in designingexperiment. The OA is a type of experiment where the columns
for the independent variables are ‘‘orthogonal’’ to one another.The result of designed experiment can be analyzed using both
Please cite this article in press as: Sohrabi, M.R. et al., Removal of Carmoorthogonal array design. Arabian Journal of Chemistry (2014), http://dx.
the analysis of variance (ANOVA) and signal-to-noise ratio(S/N). So, the important parameter that contributes to the pro-cess can be identified (Andrew Liou et al., 1993).
This study investigates the removal of Carmoisine as a non-biodegradable edible azo dye using Fenton and photo Fentonprocesses. Carmoisine has low level of beta naphthylamine
which is a well known carcinogen. The main purpose of thepresent work is to find the optimum conditions to maximizedye removal efficiency with minimum number of experiments.
Hence, the orthogonal arrays of the Taguchi method wereused. The signal-to-noise ratio and the analysis of variancewere employed to find the optimal levels and to analyze theeffect of process parameters on Carmoisine removal efficacy.
Finally, a confirmation test with the optimal levels of parame-ters was done in order to demonstrate the performance ofTaguchi’s optimization method.
2. Experimental
2.1. Materials and reagents
Carmoisine dye (di-sodium salt of 2-(4-sulpho-1-naphthylazo)-
1-naphthol-4-sulfonic acid, C20H12N2Na2O7S2, MW= 502.42g/mol, kmax = 515 nm) was purchased from Merck (Darms-tadt, Germany). The chemical structure of Carmoisine is
shown in Fig. 1. Hydrogen peroxide (30% w/w) and theFe2+ ions were supplied from ferrous sulfate heptahydrate(FeSO4Æ7H2O) as a source for Fe2+ ions. NaOH and H2SO4
were obtained from Merck. All chemicals were of analyticalreagent grade and were used without any subsequentpurification. Also, all of solutions were prepared using distilledwater.
2.2. Apparatus
UV–Vis spectra were recorded using UV–Vis spectrophotom-
eter from Scinco (Korea) equipped with a quartz cell. ThepH of solutions was measured using Bante 901 digital pH me-ter. A yellow line (MSH Basic) magnetic stirrer was applied for
stirring the dye solution and the analytical scale Sartorius(cp153) was used for weighting the standards.
2.3. Photo reactor
Photo reactions were carried out in a home-made MDF cubi-cal photo reactor (60 · 40 · 40 cm3) comprised of a fan for airconditioning and two low pressure mercury vapor UV lamps
(45 cm in length and 15 w, Osram).
isine edible dye by Fenton and photo Fenton processes using Taguchidoi.org/10.1016/j.arabjc.2014.02.019
Removal of Carmoisine edible dye by Fenton and photo Fenton processes 3
3. Experimental procedure
Carmoisine removal was performed in batch method by add-ing ferrous sulfate heptahydrate as a source of Fe2+ and the
H2O2 as an oxidant to the dye solution. Briefly, the pH of50 mL dye sample was adjusted to the desired value and afterthat Fenton reagents (H2O2 and Fe2+) were added to the stir-
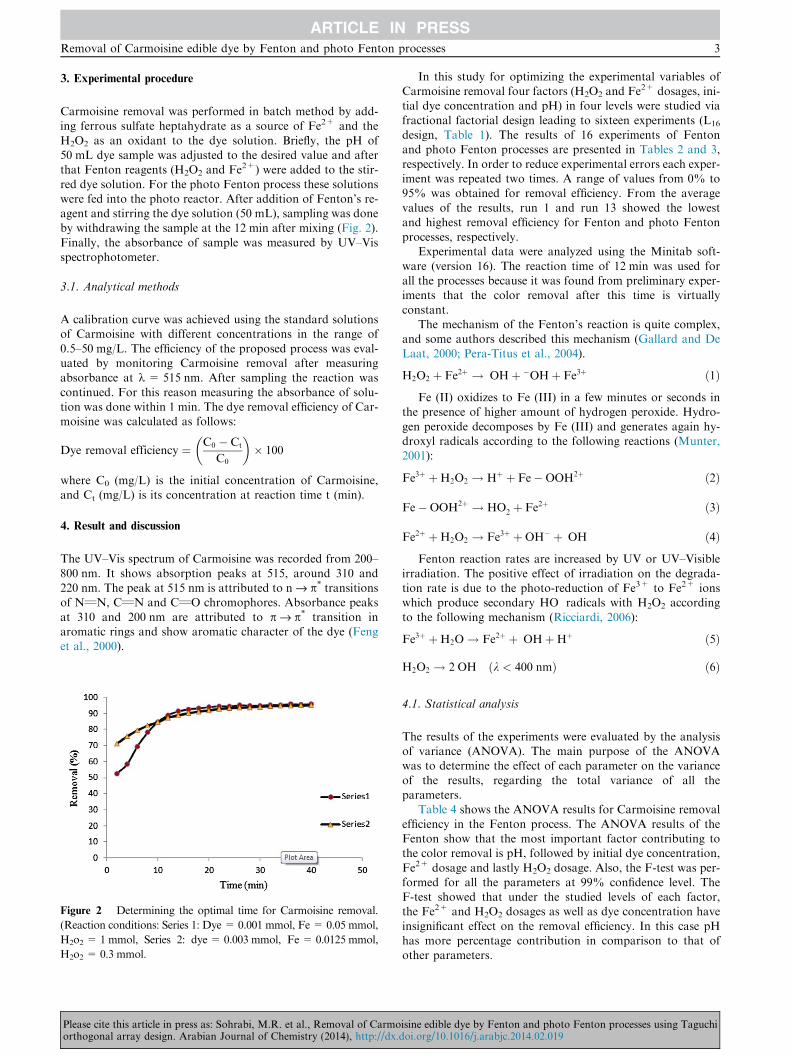
red dye solution. For the photo Fenton process these solutionswere fed into the photo reactor. After addition of Fenton’s re-agent and stirring the dye solution (50 mL), sampling was doneby withdrawing the sample at the 12 min after mixing (Fig. 2).
Finally, the absorbance of sample was measured by UV–Visspectrophotometer.
3.1. Analytical methods
A calibration curve was achieved using the standard solutionsof Carmoisine with different concentrations in the range of
0.5–50 mg/L. The efficiency of the proposed process was eval-uated by monitoring Carmoisine removal after measuringabsorbance at k = 515 nm. After sampling the reaction was
continued. For this reason measuring the absorbance of solu-tion was done within 1 min. The dye removal efficiency of Car-moisine was calculated as follows:
Dye removal efficiency ¼ C0 � Ct
C0
� �� 100
where C0 (mg/L) is the initial concentration of Carmoisine,and Ct (mg/L) is its concentration at reaction time t (min).
4. Result and discussion
The UV–Vis spectrum of Carmoisine was recorded from 200–
800 nm. It shows absorption peaks at 515, around 310 and220 nm. The peak at 515 nm is attributed to n fi p* transitionsof N‚N, C‚N and C‚O chromophores. Absorbance peaks
at 310 and 200 nm are attributed to p fi p* transition inaromatic rings and show aromatic character of the dye (Fenget al., 2000).
Figure 2 Determining the optimal time for Carmoisine removal.
(Reaction conditions: Series 1: Dye = 0.001 mmol, Fe = 0.05 mmol,
H2o2 = 1 mmol, Series 2: dye = 0.003 mmol, Fe = 0.0125 mmol,
H2o2 = 0.3 mmol.
Please cite this article in press as: Sohrabi, M.R. et al., Removal of Carmoorthogonal array design. Arabian Journal of Chemistry (2014), http://dx.d
In this study for optimizing the experimental variables ofCarmoisine removal four factors (H2O2 and Fe2+ dosages, ini-tial dye concentration and pH) in four levels were studied via
fractional factorial design leading to sixteen experiments (L16
design, Table 1). The results of 16 experiments of Fentonand photo Fenton processes are presented in Tables 2 and 3,
respectively. In order to reduce experimental errors each exper-iment was repeated two times. A range of values from 0% to95% was obtained for removal efficiency. From the average
values of the results, run 1 and run 13 showed the lowestand highest removal efficiency for Fenton and photo Fentonprocesses, respectively.
Experimental data were analyzed using the Minitab soft-
ware (version 16). The reaction time of 12 min was used forall the processes because it was found from preliminary exper-iments that the color removal after this time is virtually
constant.The mechanism of the Fenton’s reaction is quite complex,
and some authors described this mechanism (Gallard and De
Laat, 2000; Pera-Titus et al., 2004).
H2O2 þ Fe2þ ! �OHþ �OHþ Fe3þ ð1Þ
Fe (II) oxidizes to Fe (III) in a few minutes or seconds inthe presence of higher amount of hydrogen peroxide. Hydro-
gen peroxide decomposes by Fe (III) and generates again hy-droxyl radicals according to the following reactions (Munter,2001):
Fe3þ þH2O2 ! Hþ þ Fe�OOH2þ ð2Þ
Fe�OOH2þ ! HO�2 þ Fe2þ ð3Þ
Fe2þ þH2O2 ! Fe3þ þOH� þ �OH ð4Þ
Fenton reaction rates are increased by UV or UV–Visible
irradiation. The positive effect of irradiation on the degrada-tion rate is due to the photo-reduction of Fe3+ to Fe2+ ionswhich produce secondary HO� radicals with H2O2 according
to the following mechanism (Ricciardi, 2006):
Fe3þ þH2O! Fe2þ þ �OHþHþ ð5Þ
H2O2 ! 2�OH ðk < 400 nmÞ ð6Þ
4.1. Statistical analysis
The results of the experiments were evaluated by the analysisof variance (ANOVA). The main purpose of the ANOVAwas to determine the effect of each parameter on the variance
of the results, regarding the total variance of all theparameters.
Table 4 shows the ANOVA results for Carmoisine removal
efficiency in the Fenton process. The ANOVA results of theFenton show that the most important factor contributing tothe color removal is pH, followed by initial dye concentration,
Fe2+ dosage and lastly H2O2 dosage. Also, the F-test was per-formed for all the parameters at 99% confidence level. TheF-test showed that under the studied levels of each factor,the Fe2+ and H2O2 dosages as well as dye concentration have
insignificant effect on the removal efficiency. In this case pHhas more percentage contribution in comparison to that ofother parameters.
isine edible dye by Fenton and photo Fenton processes using Taguchioi.org/10.1016/j.arabjc.2014.02.019

Table 1 Factors and level of an orthogonal array.
Levels Factors
A (pH) B (Hydrogen
peroxide (mmol))
C (Ferrous
(mmol))
D (Initial concentration
(mg/L))
1 2 0.1 0.005 10
2 3.5 0.15 0.0075 15
3 5 0.25 0.0125 20
4 6 0.3 0.015 30
Table 2 The OA16 for optimization of Fenton process.
Exp. no. Factor A Factor B Factor C Factor D Response (%)
1 1 1 1 1 40.7
2 2 2 2 1 91.9
3 3 3 3 1 79.4
4 4 4 4 1 77.8
5 3 2 1 2 74.8
6 4 1 2 2 68.9
7 1 4 3 2 53.9
8 2 3 4 2 92.8
9 4 3 1 3 80.4
10 3 4 2 3 84
11 2 1 3 3 93.7
12 1 2 4 3 65.2
13 2 4 1 4 95.7
14 1 3 2 4 45.4
15 4 2 3 4 89.2
16 3 1 4 4 89.5
Table 3 The OA16 for optimization of photo Fenton process.
Exp. no. Factor A Factor B Factor C Factor D Response (%)
1 1 1 1 1 55.7
2 2 2 2 1 95.1
3 3 3 3 1 82.8
4 4 4 4 1 82.7
5 3 2 1 2 82.3
6 4 1 2 2 89.2
7 1 4 3 2 83.7
8 2 3 4 2 89.8
9 4 3 1 3 88.9
10 3 4 2 3 89.4
11 2 1 3 3 89.9
12 1 2 4 3 74.8
13 2 4 1 4 95.7
14 1 3 2 4 45.4
15 4 2 3 4 89.2
16 3 1 4 4 90.8
Table 4 ANOVA results for experimental responses in Fenton process.
Factors d.f. SS Mean Sq. Fa PC (%)
pH (A) 3 3481.40 1280.47 49.57 84.90
Hydrogen peroxide dose (B) 3 122.39 40.80 1.58 2.70
Ferrous dose (C) 3 233.94 77.98 3.02 5.17
Initial dye concentration (D) 3 249.04 83.01 3.21 5.50
Error 3 49.77 25.83 1.73
SS = Sum of squares; d.f. = degrees of freedom; MS= mean squares; PC = percentage contribution.a F, critical value is 29.46 (P < 0.01).
4 M.R. Sohrabi et al.
Please cite this article in press as: Sohrabi, M.R. et al., Removal of Carmoisine edible dye by Fenton and photo Fenton processes using Taguchiorthogonal array design. Arabian Journal of Chemistry (2014), http://dx.doi.org/10.1016/j.arabjc.2014.02.019

Removal of Carmoisine edible dye by Fenton and photo Fenton processes 5
Table 5 shows the ANOVA results of thephoto Fenton pro-cess. According to ANOVA table, the most important factorscontributing to color removal in the photo Fenton process are
pH followed by hydrogen peroxide dosage, initial dye concen-tration and lastly iron dosage.
The comparison between Fcalc and Fcri in Table 5 shows
that pH factor has significant effect on Carmoisine removalby the photo Fenton process (Ganesh Narayanan and Nara-simhan, 0000; Singh, 2012).
4.2. Signal-to-noise ratio
The S/N was used to measure both the mean value (named
‘‘signal’’ represents the desirable effect) and the standard devi-ation (named ‘‘noise’’ represents the undesirable effect) of a setof data. Higher S/N ratios are desirable in dye removal. The S/N ratio used for this type of response is defined as follows
(Singh, 2012; Srinu naik and Pydi Setty, 2011):
S=N ¼ �10 log10 1=nX
1=Yi2h i
The results of S/N ratio for various designed experiments
after ANOVA calculations are shown in Figs. 3 and 4 in Fen-ton and photo Fenton processes, respectively.
4.3. Effect of pH
According to theFig. 3 the best S/Nwas foundat pHof 3.5.Thereis a general agreement in the literature that confirms the optimalpH is close to 3 (Feng et al., 2006). When the pH was decreased
from 3.5 to 2, the S/N ratio decreased significantly. This could
Figure 3 Effect of process parame
Table 5 ANOVA results for experimental responses in photo Fent
Factors d.f. SS
pH (A) 3 1387.44
Hydrogen peroxide dose (B) 3 163.22
Ferrous dose (C) 3 59.54
Initial dye concentration (D) 3 128.39
Error 3 311.86
Please cite this article in press as: Sohrabi, M.R. et al., Removal of Carmoorthogonal array design. Arabian Journal of Chemistry (2014), http://dx.d
be described by the formation of oxonium ion (i.e. H3O2+). This
ion increased the stability of H2O2 and limited the generation of�OHby extreme of H+. At pH values higher than 3.5, the S/N ra-
tio was decreased. The decline in S/N at higher pH values may bedue to the precipitation of ferric ions as hydroxide. In this case,iron decomposes H2O2 into water and oxygen (Szpyrkowicz
et al., 2001), and the oxidation rate decreases because less hydro-xyl radical is available (Hameed and Lee, 2009).
4.4. Effect of Fe2+ concentration
In subsequent steps of Fenton’s reaction, hydroxyl radical canreact with Fe2+ and oxidize it to Fe3+ ions. Fe2+ is another
main parameter in the Fenton process. The results achievedfor the role of Fe2+ in the Fenton process are presented inFig. 3. The S/N ratio increased as a consequence of increasingFe2+ dosage from 0.005 to 0.015 mmol but in the photo Fen-
ton process the S/N ratio is decreased over than 0.0125 mmol(Fig. 4). Many researchers have reported that the use of amuch higher concentration of Fe2+ could lead to the self-scav-
enging of �OH radical by converting it to hydroxyl ions duringoxidation of Fe2+ (Eq. (7)) (Hameed and Lee, 2009).
�OHþ Fe2þ ! Fe3þ þOH� ð7Þ
4.5. Effect of H2O2 concentration
In next steps of the Fenton reaction hydroxyl radicals can alsoreact with hydrogen peroxide to generate hydroperoxyl radi-
cals (HO2� ), and may also react with another hydroxyl radical
ters on S/N in Fenton process.
on process.
Mean sq F PC (%)
462.48 4.45 67.66
54.51 0.52 7.96
19.85 0.19 2.90
42.80 0.41 6.26
15.22
isine edible dye by Fenton and photo Fenton processes using Taguchioi.org/10.1016/j.arabjc.2014.02.019

Figure 4 Effect of process parameters on S/N in Photo Fenton process.
Figure 5 Interaction between the pH and the Fe2+ dosage in
Fenton process.
6 M.R. Sohrabi et al.
to produce hydrogen peroxide, or react with hydroperoxyl rad-ical to generate hydroxyl radicals which are shown in belowequations (Ghoneim et al., 2011; Modirshahla et al., 2007).
H2O2 þOH� ! HO�2 þH2O ð8Þ
H2O2 þOH�2 ! OH� þO2 þH2O ð9Þ
OH�2 þ �OH! H2O2 ð10Þ
According to the Figs. 3 and 4, the effect of H2O2 on the re-moval efficiency of Carmoisine was studied in the range of
0.1–0.3 mmol in Fenton and photo Fenton processes. The in-crease in H2O2 dosage enhanced the S/N at the start of thereaction due to the effect of produced OH� radicals. But at a
high dosage of H2O2, it acts as a powerful OH� scavenger.Thus, the addition of higher values of H2O2 in the presenceof additional hydroxyl radicals can produce hydroperoxyl rad-
icals (HO2� ) that are much less reactive and do not contribute
to the oxidative degradation of organic compounds (Hameedand Lee, 2009; Najjar et al., 2007).
4.6. Effect of initial dye concentration
The pollutant concentration is one of the most important fac-tors in Fenton and photo Fenton processes. Figs. 3 and 4
clearly show that the increase in dye concentration decreasesthe S/N ratio until a certain amount. Increase of dye concen-tration from 20 to 30 mg/L decreases the S/N for Fenton
and photo Fenton processes. The assumed reason is that whenthe dye concentration is increased, most of the UV irradiationwill be absorbed by the dye molecules instead of H2O2. So, the
generation of �OH radicals is decreased in the photodegrada-tion of Carmoisine.
4.7. Interactions in the Fenton process
The possible interactions between variables were studied usinginteraction plots. Each plot displays the interaction betweentwo factors. Fig. 5 shows the interaction between pH and
Please cite this article in press as: Sohrabi, M.R. et al., Removal of Carmoorthogonal array design. Arabian Journal of Chemistry (2014), http://dx.
Fe2+ dosage in the Fenton process. From the figure, it canbe seen that there is little interaction between these two factorsin pH 5 and 6.
The interaction between H2O2 and Fe2+ dosage in the Fen-ton process is shown in Fig. 6. When Fe2+ dosage is0.005 mmol, the response increases as H2O2 dosage increases
whereas when Fe2+ dosage is about 0.0125 mmol the responsedecreases as H2O2 dosage increases. So, there is a severe inter-action between these factors.
4.8. Interactions in the photo Fenton process
Fig. 7 displays a matrix plot for three factors. This graphshows a full interactions plot matrix. Each pair of factors pro-
vides two panels as summarized below:Rows 1 and 2 indicate the interaction of Fe2+ and H2O2
dosages. Rows 1 and 3 show the interaction between pH and
Fe2+ dosage and finally rows 2 and 3 display the interactionbetween pH and H2O2 dosage.
From Fig. 7, it can be concluded that the interaction be-
tween pH factor with H2O2 and Fe2+ dosages does not seemas strong as it does for H2O2 and Fe2+ dosage in the photoFenton process.
isine edible dye by Fenton and photo Fenton processes using Taguchidoi.org/10.1016/j.arabjc.2014.02.019
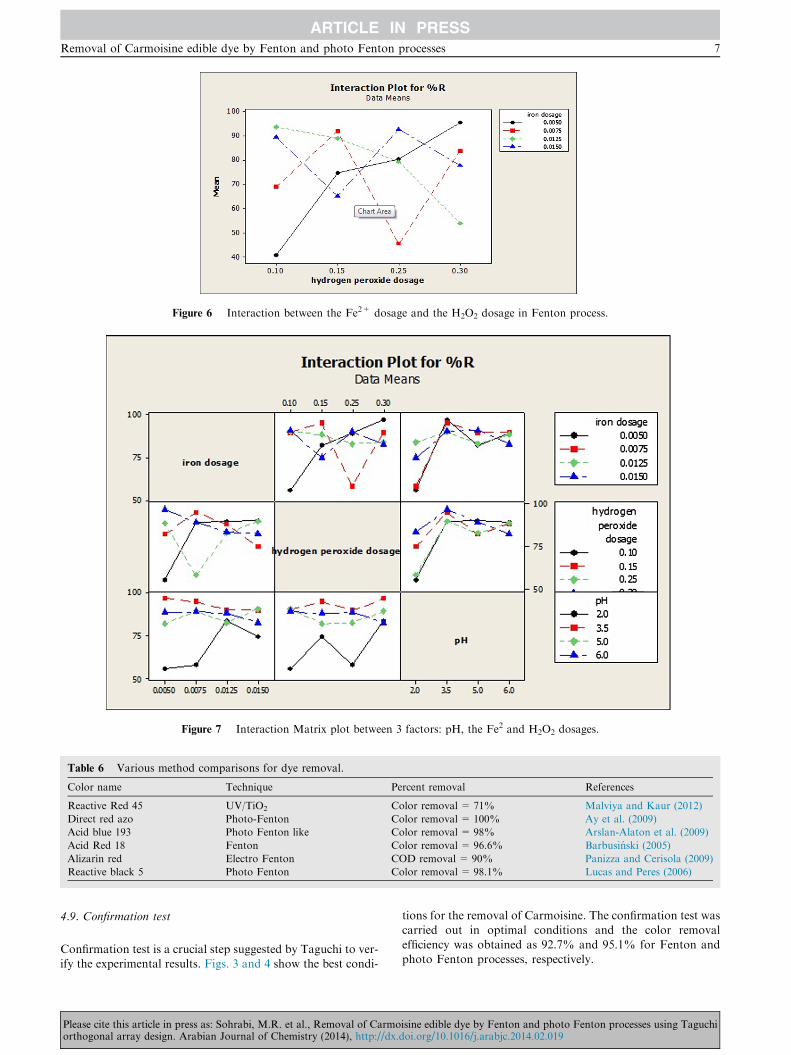
Figure 6 Interaction between the Fe2+ dosage and the H2O2 dosage in Fenton process.
Figure 7 Interaction Matrix plot between 3 factors: pH, the Fe2 and H2O2 dosages.
Table 6 Various method comparisons for dye removal.
Color name Technique Percent removal References
Reactive Red 45 UV/TiO2 Color removal = 71% Malviya and Kaur (2012)
Direct red azo Photo-Fenton Color removal = 100% Ay et al. (2009)
Acid blue 193 Photo Fenton like Color removal = 98% Arslan-Alaton et al. (2009)
Acid Red 18 Fenton Color removal = 96.6% Barbusinski (2005)
Alizarin red Electro Fenton COD removal = 90% Panizza and Cerisola (2009)
Reactive black 5 Photo Fenton Color removal = 98.1% Lucas and Peres (2006)
Removal of Carmoisine edible dye by Fenton and photo Fenton processes 7
4.9. Confirmation test
Confirmation test is a crucial step suggested by Taguchi to ver-ify the experimental results. Figs. 3 and 4 show the best condi-
Please cite this article in press as: Sohrabi, M.R. et al., Removal of Carmoorthogonal array design. Arabian Journal of Chemistry (2014), http://dx.d
tions for the removal of Carmoisine. The confirmation test wascarried out in optimal conditions and the color removal
efficiency was obtained as 92.7% and 95.1% for Fenton andphoto Fenton processes, respectively.
isine edible dye by Fenton and photo Fenton processes using Taguchioi.org/10.1016/j.arabjc.2014.02.019

8 M.R. Sohrabi et al.
Previous studies have reported different methods such asadsorption and potassium ferrioxalate complex for Carmoisineremoval (Gupta et al., 2009; Salem et al., 2009). Table 6 com-
pares the removal efficiency of proposed method for Carmoi-sine dye with the reported removal efficiency of this methodfor other studied dyes.
5. Conclusion
This study demonstrated the application of fractional factorial
design based on Taguchi’s method for screening of the signif-icant factors in removing the Carmoisine from aqueous solu-tions. An OA16 (44) was used to investigate the effect of four
factors (Fe2+ and H2O2 dosage, initial dye concentrationand pH) on Carmoisine removal efficiency. The effect of eachparameter was evaluated using ANOVA. The results of ANO-
VA showed that the pH has significant effect on the Carmoi-sine removal efficiency in both Fenton and photo Fentonprocesses. Also, removal yields were achieved in optimal con-dition as 92.7% for Fenton and 95.1% for photo Fenton pro-
cesses after about 12 min of oxidation. If the volume of theaqueous solution changes, the dosages of the Fenton reagentwill change too. According to the new condition, Taguchi
can design a new table based on orthogonal array.Fenton and photo Fenton techniques are environmentally
friendly so they do not involve the use of detrimental chemical
reagent, in addition they are easy to use and the reactor used issimple.
The experimental results show that both Fenton and photoFenton processes are powerful methods for the removal of
Carmoisine dye from aqueous solutions. A comparison be-tween dye removal efficiency of these two methods indicatesthat the photo Fenton process is a little more efficient but this
difference is not economical. So, based on these results it isconcluded that the Fenton method is more appropriate thanthe photo Fenton method for Carmoisine removal.
References
Andrew Liou, Y.H., Lin, P.P., Lindeke, R.R., Chiang, H.D., 1993.
Tolerance specification of robat kinematic parameters using an
experimental design technique the Taguchi method. Robot Comp.
Intgr. Manuf. 10, 199–207.
Arslan-Alaton, I., Tureli, G., Olmez-Hanci, T., 2009. Treatment of azo
dye production wastewaters using Photo-Fenton-like advanced
oxidation processes: optimization by response surface methodol-
ogy. J. Photochem. Photobiol. A. 202, 142–153.
Ay, F., Catalkaya, E.C., Kargi, F., 2009. A statistical experiment
design approach for advanced oxidation of Direct Red azo-dye by
photo-Fenton treatment. J. Hazard. Mater. 162, 230–236.
Barbusinski, K., 2005. The modified fenton process for decolorization
of dye wastewater. Pol. J. Environ. Stud. 14, 281–285.
Behnajady, M.A., Modirshahla, N., Ghanbary, F., 2007. A kinetic
model for the decolorization of C.I. acid yellow 23 by Fenton
process. J. Hazard. Mater. 148, 98–102.
Biswas, M.M., Taylor, K.E., Bewtra, J.K., Biswas, N., 2007.
Enzymatic treatment of sulfonated aromatic amines generated
from reductive degradation of reactive azo dyes. Water Environ.
Res. 79, 351–356.
Cuiping, B., Wenqi, G., Dexin, F., Mo, X., Qi, Z., Shaohua, C.,
Zhongxue, G., Yanshui, Z., 2012. Natural graphite tailings as
heterogeneous Fenton catalyst for the decolorization of rhodamine
B. Chem. Eng. J. 197, 306–313.
Please cite this article in press as: Sohrabi, M.R. et al., Removal of Carmoorthogonal array design. Arabian Journal of Chemistry (2014), http://dx.
Feng, W., Nansheng, D., Helin, H., 2000. Degradation mechanism of
azo dye C.I. reactive red 2 dye iron powder reduction and
photooxidation in aqueous solution. Chemosphere 41, 1233–
1238.
Feng, J., Hu, X., Yue, p.L., 2006. Effect of initial solution pH on the
degradation of orange II using clay-based nanocomposites as
heterogeneous photo Fenton catalyst. Water Res. 40, 641–646.
Fenton, H.J.H., 1894. Oxidation of tartaric acid in presence of iron. J.
Chem. Soc. Trans. 65, 899–910.
Gallard, H., De Laat, J., 2000. Kinetic modelling of Fe(III)/H2O2
oxidation reactions in dilute aqueous solution using atrazine as a
model organic compound. Water Res. 34, 3107–3116.
Ganesh Narayanan, R., Narasimhan, K., Relative effect of material
and geometric parameters on the forming behavior of Tailor
Welded Blanks (TWB).
Ghoneim, M.M., El-Desoky, H.S., Zidan, N.M., 2011. Electro-fenton
oxidation of sunset yellow FCF azo-dye in aqueous solutions.
Desalination 274, 22–30.
Gomathi Devi, L., Eraiah Rajashekhar, K., Anantha Raju, K.S.,
Girish Kumar, S., 2011. Influence of various aromatic derivatives
on the advanced photo Fenton degradation of Amaranth dye.
Desalination 270, 31–39.
Gupta, V.K., Susah, 2009. Application of low cost adsorbents for dye
removal. J. Environ. Manage. 90, 2313–2342.
Gupta, V.K., Mittal, A., Malviya, A., Mittal, J., 2009. Adsorption of
Carmoisine A from wastewater using waste materials-bottom ash
and deoiled soya. J. Colloid. Interf. Sci. 335, 24–33.
Hameed, B.H., Lee, T.W., 2009. Degradation of malachite green in
aqueous solution by Fenton process. J. Hazard. Mater. 164, 468–
472.
Hou, M.F., Liao, L., Zhang, W.D., Tang, X.Y., Wan, H.F., Yin, G.C.,
2011. Degradation of rhodamine B by Fe(0)-based Fenton process
with H2O2. Chemosphere 83, 1279–1283.
Lucas, M.S., Peres, J.A., 2006. Decolorization of the azo dye Reactive
Black 5 by Fenton and photo-Fenton oxidation. Dyes Pigm 71,
236–244.
Malviya, A., Kaur, D., 2012. Removal of toxic azo dyes from
wastewater using bottom ash-equilibrium isothermal modeling.
Orient. J. Chem. 28, 955–961.
Modirshahla, N., Behnajady, M.A., Ghanbary, F., 2007. Decoloriza-
tion and mineralization of C.I. Acid Yellow 23 by Fenton and
photo-Fenton processes. Dyes Pigm. 73, 305–310.
Munter, R., 2001. Advanced oxidation process- current status and
prospects. Proc. Estonian Acad. Sci. Chem. 50, 59–80.
Muruganandham, M., Swaminathan, M., 2004. Decolourisation of
Reactive Orange 4 by Fenton and photo-Fenton oxidation tech-
nology. Dyes Pigm. 63, 315–321.
Najjar, W., Azabou, S., Sayadi, S., Ghorbel, A., 2007. Catalytic wet
peroxide photo-oxidation of phenolic olive oil mill wastewater
contaminants: Part I. Reactivity of tyrosol over (Al–Fe) PILC.
Appl. Catal. B Environ. 74, 11–18.
Ozdemir, Y., Akkan, A.A., 1999. Determination of Patent Blue V and
Carmoisine in gelatine desserts by derivative spectrophotometry.
Turk. J. Chem. 23, 221–229.
Panizza, M., Cerisola, G., 2009. Electro-Fenton degradation of
synthetic dyes. Water Res. 43, 339–344.
Pera-Titus, M., Garcıa-Molina, V., Banos, M.A., Gimenez, J.,
Espulgas, S., 2004. Degradation of chlorophenols by means of
advanced oxidation process. Appl. Catal. B Environ. 47, 219–
256.
Ricciardi, M., 2006. Waste water treatment by high efficiency
heterogeneous photo Fenton process. Ph.D. course in Chemical
Engineering, Department of Food and Chemical Engineering.
Salem, M.A., Abdel-Halim, S.T., El-Sawy, A.H.M., Zaki, A.B., 2009.
Kinetics of degradation of allura red, ponceau 4R and carmosine
dyes. Chemosphere 76, 1088–1093.
Singh, H., 2012. Taguchi optimization of process parameters: a review
and case study. IJAEST 1, 39–41.
isine edible dye by Fenton and photo Fenton processes using Taguchidoi.org/10.1016/j.arabjc.2014.02.019

Removal of Carmoisine edible dye by Fenton and photo Fenton processes 9
Soon, A.N., Hameed, B.H., 2013. Degradation of acid blue 29
in visible light radiation using iron. Appl. Catal. A 450, 96–
105.
Srinu naik, S., Pydi Setty, Y., 2011. Optimization for Denitrification of
wastewater using fluidized bed bioreactor by Taguchi method.
IJBA 3, 97–101.
Szpyrkowicz, L., Juzzolino, C., Kaul, S.N., 2001. A comparative study
on oxidation of disperses dyes by electrochemical process, ozone,
hypochlorite and Fenton reagent. Water Res. 35, 2129–2136.
Please cite this article in press as: Sohrabi, M.R. et al., Removal of Carmoorthogonal array design. Arabian Journal of Chemistry (2014), http://dx.d
Trapido, M., 2007. Ozone based advanced oxidation process. In:
Munter, R., Cockfield, A.J. (Eds.), Ozone Science and Technology.
E-Publishing Inc., Eolss..
Tuormaa, T.E., 1994. The adverse effects of food additive on health. J.
Orthomol. Med. 9, 225–243.
Vachirapatama, N., mahaiaroensiri, J., Visessanguan, W., 2008.
Identification and determination of seven synthetic dyes in food
stuffs and soft drinks on monolithic C18 column by high
performance chromatography. J. Food. Drug. Anal. 16, 77–82.
isine edible dye by Fenton and photo Fenton processes using Taguchioi.org/10.1016/j.arabjc.2014.02.019