Remotely Identification and Differentiation of Ficus ...alexexch.org/File/2018003904/En/2574.pdf ·...
13
Remotely Identification and Differentiation of Ficus Species in Alexandria City Using Spectral Reflectance Measurements Nashwa H. Mohamed 1 , Nader A. El-Shanhorey 2 and Salah E. Elsayed 3 1 Timber Trees Research Department, Horticulture Research Institute, Agriculture Research Center, Alexandria, Egypt. 2 Botanical Gardens Research Department, Horticultural Research Institute, Agriculture Research Center, Alexandria, Egypt. 3 Evaluation of Natural Resources Department, Environmental Studies and Research Institute, Sadat City University, Egypt Received OCTOBR 23, 2018, Accepted November 21, 2018 ABSTRACT This study was carried out in Alexandria city on eighteen Ficus species (Family Moraceae), to examine how far the remote sensing is considered as an applicable technique and as vegetation indices can differentiate between vegetation cover species depending on spectral reflectance characteristics for each tree species leaves. Results showed that absorption and reflectance spectral characteristics of leaves of each tree species were significantly differentiated by spectral signature curve and average of digital number (DN), that gives the highest value for species with large, thick and dark green leaves such as Ficus platyphylla , Ficus lyrata and Ficus altissima, comparing to species with small, white green colored leaves like Ficus microcarpa Hawai, which showed the lowest value. The same trend was shown by, Normalized difference Vegetation index (NDVI) and rationally, the chlorophyll content. On the other hand results of Simple ratio (SR) index were not significantly differed among studied species. It is noticeable of that reflectance of (near- infrared (NIR) region) by leaves varied to its color, size, thickness and internal structure, so this electro-magnetic radiation (EMR) region can be used successfully for species classification. There were a highly correlation between chlorophyll content and NDVI and SR, while results showed no significant correlation between chlorophyll content and DN. Key words: Ficus, remote sensing, vegetation indices, NDVI, SR index, spectral curve, chlorophyll. INTRODUCTION The genus Ficus, (Family Moraceae) is one of the largest and most diverse genera of woody plants (Berg and Wiebes, 1992), comprising approximately of 750 species distributed in tropical and subtropical zones. Most Ficus species are diploid with the basic chromosome number x = 13 (Condit, 1969). Among cultivated species, Ficus afzelii, F. altissima, F. aspera, F. benghalensis, F. benjamina, F. elastica decora, F. elastica golden, F. elastica varegata, F. lutea, F. lyrata, F. macrophylla, F. microcarpa Hawaii, F. microcarpa nitida, F. rubiginosa, F. petiolaris, F. platyphylla, F. pyriformis and F. sycomorus which are grown for their ornamental value either as landscape plants in the tropics and subtropics (Dehgan, 1998) or foliage plants used for interiorscaping (Chen, et al., 2005). In addition, Ficus spp. products are among the most important examples of natural ones, which have been widely used both as a food and as a medicine (Ghadam et al., 2011). Ficus species have wide distribution and uses worldwide traditionally as medicine, vegetable, food, fodder, and fuel wood etc. Ficus often grown is an attractive ornamental tree found mostly outdoors and is frequently encountered along city streets lining parkways, medians and sidewalks. It is planted in parks and other large, open spaces but is, perhaps, most familiar as a street tree and some species of Ficus are commonly used as interior ornamentals. Under Egyptian conditions, Ficus trees have special importance in parks and in the newly established cities to reduce the harsh impact of the desert environment. But, from the point of view of architecture and urbanism, planting Ficus trees on metropolitan areas is absolutely inadequate, since it causes severe damage to city structures. Its roots are aggressive, superficial, thick, very strong, and grow up to a hundred meters long (Toscan et al., 2010), which enables them to fracture concrete (Starr et al., 2003), affecting foundations and walls on houses and buildings, as well as civil works like bridges and street posts, roads and streets. Also, in addition, roots from Ficus trees break and/or obstruct underground pipes from water and sewage systems (Alanís Flores, 2005; Martelli & Barbosa, 2010; Vargas-Garzón and Molina-Prieto, 2010). Remote sensing is an important source of qualitative and quantitative information for estimation of the vegetation cover activity and land use specially in large areas. Estimation of canopy biophysical variables are very important in different studies such as meteorology, agriculture and ecology (Susan et al., 2011). It is known that the spectral properties of plant species are depended on plant physiology, morphology or anatomy (Kycko et al. 2014; Jarocinska et al. 2016). Such spectral profiles of leaves in regions from visible- infrared (VNIR) to shortwave infrared (SWIR), are differ by dry matter contents , pigments, e.g.
Transcript of Remotely Identification and Differentiation of Ficus ...alexexch.org/File/2018003904/En/2574.pdf ·...

Remotely Identification and Differentiation of Ficus Species in Alexandria
City Using Spectral Reflectance Measurements
Nashwa H. Mohamed 1, Nader A. El-Shanhorey2 and Salah E. Elsayed3
1 Timber Trees Research Department, Horticulture Research Institute,
Agriculture Research Center, Alexandria, Egypt. 2Botanical Gardens Research Department, Horticultural Research Institute,
Agriculture Research Center, Alexandria, Egypt. 3Evaluation of Natural Resources Department, Environmental Studies and
Research Institute, Sadat City University, Egypt
Received OCTOBR 23, 2018, Accepted November 21, 2018
ABSTRACT
This study was carried out in Alexandria city on
eighteen Ficus species (Family Moraceae), to examine how
far the remote sensing is considered as an applicable
technique and as vegetation indices can differentiate
between vegetation cover species depending on spectral
reflectance characteristics for each tree species leaves.
Results showed that absorption and reflectance spectral
characteristics of leaves of each tree species were
significantly differentiated by spectral signature curve and
average of digital number (DN), that gives the highest
value for species with large, thick and dark green leaves
such as Ficus platyphylla , Ficus lyrata and Ficus altissima,
comparing to species with small, white green colored
leaves like Ficus microcarpa Hawai, which showed the
lowest value. The same trend was shown by, Normalized
difference Vegetation index (NDVI) and rationally, the
chlorophyll content. On the other hand results of Simple
ratio (SR) index were not significantly differed among
studied species. It is noticeable of that reflectance of (near-
infrared (NIR) region) by leaves varied to its color, size,
thickness and internal structure, so this electro-magnetic
radiation (EMR) region can be used successfully for species
classification. There were a highly correlation between
chlorophyll content and NDVI and SR, while results
showed no significant correlation between chlorophyll
content and DN.
Key words: Ficus, remote sensing, vegetation indices,
NDVI, SR index, spectral curve, chlorophyll.
INTRODUCTION
The genus Ficus, (Family Moraceae) is one of the
largest and most diverse genera of woody plants (Berg
and Wiebes, 1992), comprising approximately of 750
species distributed in tropical and subtropical zones.
Most Ficus species are diploid with the basic
chromosome number x = 13 (Condit, 1969). Among
cultivated species, Ficus afzelii, F. altissima, F. aspera,
F. benghalensis, F. benjamina, F. elastica decora, F.
elastica golden, F. elastica varegata, F. lutea, F. lyrata,
F. macrophylla, F. microcarpa Hawaii, F. microcarpa
nitida, F. rubiginosa, F. petiolaris, F. platyphylla, F.
pyriformis and F. sycomorus which are grown for their
ornamental value either as landscape plants in the
tropics and subtropics (Dehgan, 1998) or foliage plants
used for interiorscaping (Chen, et al., 2005). In addition,
Ficus spp. products are among the most important
examples of natural ones, which have been widely used
both as a food and as a medicine (Ghadam et al., 2011).
Ficus species have wide distribution and uses
worldwide traditionally as medicine, vegetable, food,
fodder, and fuel wood etc. Ficus often grown is an
attractive ornamental tree found mostly outdoors and is
frequently encountered along city streets lining
parkways, medians and sidewalks. It is planted in parks
and other large, open spaces but is, perhaps, most
familiar as a street tree and some species of Ficus are
commonly used as interior ornamentals. Under Egyptian
conditions, Ficus trees have special importance in parks
and in the newly established cities to reduce the harsh
impact of the desert environment. But, from the point of
view of architecture and urbanism, planting Ficus trees
on metropolitan areas is absolutely inadequate, since it
causes severe damage to city structures. Its roots are
aggressive, superficial, thick, very strong, and grow up
to a hundred meters long (Toscan et al., 2010), which
enables them to fracture concrete (Starr et al., 2003),
affecting foundations and walls on houses and buildings,
as well as civil works like bridges and street posts, roads
and streets. Also, in addition, roots from Ficus trees
break and/or obstruct underground pipes from water and
sewage systems (Alanís Flores, 2005; Martelli &
Barbosa, 2010; Vargas-Garzón and Molina-Prieto,
2010).
Remote sensing is an important source of qualitative
and quantitative information for estimation of the
vegetation cover activity and land use specially in large
areas. Estimation of canopy biophysical variables are
very important in different studies such as meteorology,
agriculture and ecology (Susan et al., 2011).
It is known that the spectral properties of plant
species are depended on plant physiology, morphology
or anatomy (Kycko et al. 2014; Jarocinska et al. 2016).
Such spectral profiles of leaves in regions from visible-
infrared (VNIR) to shortwave infrared (SWIR), are
differ by dry matter contents , pigments, e.g.

ALEXANDRIA SCIENCE EXCHANGE JOURNAL, VOL. 39, No 4 OCTOBR- DECEMBER 2018
630
chlorophyll, carotenoid, and water content (Jean-
Baptiste et al, 2008). Variations in plant canopy and leaf
structure , pigment and water content lead to change in
vegetation reflectance properties, even between closely
related species. So, species identification is possible
from these unique spectral properties (Thenkabail et al.,
2000). Where, absorption, transmission or reflection of
the electromagnetic spectrum by plants can play a
significant role in the monitoring of ecosystem changes.
Vegetation indices were designed to evaluate
vegetation condition, land cover classification and
phenology, climate and land use detection and drought
monitoring (Padilla et al., 2011). Remote sensing
method has several vegetation indices. Normalized
difference Vegetation index (NDVI) is an important ,
common and widely used index in research on global
environmental and climatic change (Bhandari and
Kumar, 2012). NDVI is calculated as a ratio difference
between measured canopy reflectance in the red and
near infrared bands respectively (Nageswara et al.,
2005).
Little is known about leaf optical properties of
tropical trees and for identifying tropical tree species
using remote sensing. So, Lee et al. (1990), have studied
leaf optical properties of tropical sun and shade species,
as well as Avalos et al. (1999), who worked on leaf
optical properties of tropical dry forest trees and lianas.
Cochrane, (2000) has estimated the reflectance of leaf or
branch samples to differentiate species of tropical trees.
Moreover, Clark et al. (2005) have made success to
determine seven tropical tree species at the leaf, pixel,
and crown levels. No doubt, that the species
classification has several applications, such as
monitoring endangered or commercial tree species,
characterizing biodiversity, monitoring changes in
species composition over time and changes in tree
demography associated with global environmental
changes.
Urban vegetation cover has a lot of tree species to be
defined, monitored and surveyed. For instance, Ficus
considered one of the most used trees in Egypt as an
urban and garden tree. So, the aim of this study to
examine how far the remote sensing can aid in
classifying and defying the differences among tree
species, especially these belong to the same genus not
only for canopy level, but also at leaf level. So, we used
some tree species belongs to Ficus genus to discriminate
among them using leaf spectral reflectance.
MATERIALS AND METHODS
1- Studied area and tree species:
This study was carried out in August, 2016 in
Alexandria city, Egypt, at Research Department ,
Antoniades Garden. Leaves samples of eighteen tree
species belongs to Ficus genus, Family Moraceae were
collected from a big and mature trees. Three species
(Ficus aspera G. Forst., Ficus elastica var Golden and
Ficus elastica var varigata) were collected from Faculty
of agriculture garden , El shatby. While, leaves samples
of the rest fifteen species were collected from mature
trees planted in Antoniades garden Table (1)
summarized studied species.
Sampling
Leaves sample of each tree species was collected
from mature trees to be accurately representative for
their species. One tree was selected from each species.
A sample of four leaves was collected randomly from
the crown of each tree, at the four crown direction one
leave was selected from every orient. Samples of fully
exposed to sunlight leaves from crown upper part were
selected randomly, then were washed and prepared to
spectral reflectance measurements.
Equipments and measurements
- Spectral reflectance was measured using the passive
reflectance sensor (tec5, Oberursel, Germany). This
passive sensor contains two units; one unit to detect the
solar radiation as a reference signal, while the second
unit measures the reflectance of leaves with an angle of
view of 12°. Leaf spectral reflectance was taken from
0.25 m distance and field of view is 0.05m2.The spectral
range of the passive sensor is 302−1148 nm, with a
spectral bandwidth of 2 nm (figure1), (Elsayed et al.,
2015).
- A hand-held chlorophyll meter for leaf chlorophyll
content was used.

Nashwa H. Mohamed et al: Remotely Identification and Differentiate of Ficus Species in Alexandria City Using Spectral…… 631
Table 1.List and phonological properties of the studied Ficus species
No Species
Tree
height
average(m)
leaves Fruit
Type Shape Length
(cm) Texture color veins Type Shape
Diameter
(cm) color
1 Ficus sycamores L. 20 Simple Elliptical 8 - 12 Distichous Dark Green Eminent Fig Globose 4.0 – 10.0 Orange- Red
2 Ficus aspera G.Forst. 6 Simple Ovate-
Elliptic 19 - 22 Distichous
Green -
White Eminent Fig Small 2.0 – 3.0 Pink-Purple
3 Ficus elastica var. Golden 20 Simple Elliptical 12 - 30 Coriaceous Green -
Yellow Prominent Fig Small 1.5 – 2.0 Green-Yellow
4 Ficus petiolaris Kunth 15 Simple Deltoid 6 - 15 Coriaceous Green -
Yellow Eminent Fig Globose 3.0 – 5.0 Light green
5 Ficus microcarpa Hawaii 5 Simple Ovate-
Elliptic 4 - 7 Coriaceous
Green -
White Prominent Fig Small 1.0 - 1.5 Orange- Red
6 Ficus benghalensis L. 30 Simple Elliptical 10 - 15 Coriaceous Dark Green Yellow Fig Globose 2.0 – 3.0 Red
7 Ficus platyphylla Delile 25 Simple Ovate -
elliptic 30 - 45 Coriaceous Glossy Green Marbled Fig Globose 4.0 – 6.0 Orange- Red
8 Ficus lyrata Warb. 12 Simple Fiddle-
shaped 30 - 45 Coriaceous Glossy Green Eminent Fig Globose 2.0 – 4.0 Green - White
9 Ficus afzelii G.Don ex
Loud 20 Simple Obovate 30 - 45 Distichous Dark Green Eminent Fig Big 1.5 – 2.5 Green
10 Ficus microcarpa nitida
L.f. 20 Simple
Ovate-
Elliptic 4 - 7 Coriaceous Dark Green Prominent Fig Small 1.0 - 1.5 Pink-Purple
11 Ficus elastica var.
varigata 20 Simple Elliptical 12 - 30 Coriaceous
Green -
White Prominent Fig Small 1.5 – 2.0 Green-Yellow
12 Ficus benjamina L. 20 Simple Ovate-
Elliptic 4 - 6 Coriaceous Dark Green Prominent Fig Small 1.0 – 2.0 Green-Yellow
13 Ficus elastica var. decora 60 Simple Elliptical 12 - 30 Coriaceous Glossy Green Prominent Fig Small 1.5 – 2.0 Green-Yellow
14 Ficus macrophylla Desf
ex Pers. 45 Simple Elliptical 15 - 30 Coriaceous
Green -/
Brassy Prominent Fig Small 2.0 – 2.5
Purple -
Yellow
15 Ficus altissima Blume 30 Simple Ovate-
Elliptic 10 - 20 Coriaceous Dark Green Marbled Fig Globose 2.0 – 2.5 Orange
16 Ficus lutea Vahl 25 Simple Ovate-
Elliptic 13 - 43 Coriaceous Glossy Green Yellow Fig Globose 1.5 – 3.0
Yellow
reddish
17 Ficus rubiginosa Desf 30 Simple Ovate 4 - 20 Coriaceous Glossy Green Eminent Fig Small 1.0 – 1.5 Yellow - Red
18 Ficus pyriformis
Hook.&arn. 20 Simple Lanceolate 10 - 14 Coriaceous Glossy Green Prominent Fig Small 1.0 - 1.5 Light green
Badr M.D. (2003). Encyclopedia trees and environment. Monshaat Al-Maarif – Alexandria, Egypt, pp.747-824.
Heneidy S.Z. (2010). Plant atlas the botanic garden – Faculty of Science, Alexandria University. Monshaat Al-Maarif – Alexandria, Egypt, pp.429-443.

ALEXANDRIA SCIENCE EXCHANGE JOURNAL, VOL. 39, No 4 OCTOBR- DECEMBER 2018 632
Figure 1. Eighteen Ficus species used to study the morphological diversity through using spectral reflectance
measurements
Measurements and calculations:
- Spectral reflectance curve.
The digital numbers (DN) of each different tree
species were extracted from 302 -1148 nm wave length
range, and plotted to show the leaves behavior of each
tree species in different wavelengths of the spectrum.
- Digital number (DN)
The average of digital numbers (DN) of each
different tree species was extracted from visible bands,
and plotted to show the behavior of leaves of each tree
species in different wavelengths of the spectrum.
Vegetation indices:
Normalized difference Vegetation index (NDVI)
)()( RNIRRNIRNDVI +−=
Where: NIR is Near-infrared wave band
R is red wave band
NDVI related to changes in amount of green
biomass, pigment content and concentration and leaf
water stress etc. (Tucker and Sellers, 1986; Fassnacht et
al., 1997). Value of NDVI is ranges between -1 to 1
while, NDVI value close to 1 indicates very dense
vegetation, while value near 0 indicates bare soil or very
sparse vegetation.
Simple Ratio (SR)
RNIRSR = …………
Near-infrared / Red reflectance ratio Related to
changes in amount of green biomass, pigment content
and concentration and leaf water stress etc. (Tucker,
1979 ;Baret and Guyot, 1991).
- Total chlorophyll content
- Total chlorophyll content was determined as a
SPAD unites from the fresh leaves of plants for the
different treatments under the experiment at the end of
the season using Minolta (chlorophyll meter) SPAD 502
according to Yadava (1986).
Statistical analysis
The layout of the experiment was complete
randomize design (CRD) with 4 replicates; Means were
compared by L.S.D. test at 5% level of probability
according to (Snedecor and Cochran, 1989).
The correlation between leaves chlorophyll content
and vegetation indices were calculated according to
Federer (1955).

Nashwa H. Mohamed et al: Remotely Identification and Differentiate of Ficus Species in Alexandria City Using Spectral…… 633
Figure 2. The Field Spectral radiometer Hand-Held instrument
RERSULTS
• Spectral reflectance curve
Spectral amount reflected from leaf surface of
each wave length band within 302-1148nm range, with a
spectral bandwidth of 2 nm was measured and plotted in
curve to show the behavior of different wavelengths
reflect from each tree species leaves. Spectral signature
curves resulted from measurement of each tree species
were distinctly difference.
Spectral curve formed of bottoms and peaks,
bottoms refers to absorption region at 320-500 nm
(violet-blue band) and 670 nm (the red edge), while
peaks express the reflectance regions at green (520-
580nm) and red (701-760nm) bands. Spectral curves of
Ficus platyphylla , Ficus lyrata and Ficus altissima had
greater reflectance at wavelengths of 701 nm and above
(near-infrared (NIR) region) followed by the rest species
(Figure 3). Results showed that curves are clearly
separated for all species at near-infrared (NIR) region,
so this light region can be used successfully for species
classification.
• Digital number (DN)
The average of reflected range of 302-1148 nm
spectral wave length for each tree species was calculated
and statistically analyzed, which showed highly
significant differences among species in digital numbers
(DN) obtained from both upper and lower leaf surface of
each tree species (Table 2). Ficus platyphylla , Ficus
lyrata and Ficus altissima showed the highest values,
41.94, 40.99 and 32.39 respectively, while the lowest
values were recorded in Ficus microcarpa Hawai (6.06)
and Ficus benghalensis (7.95) (Figure 4).
Vegetation indices:
Vegetation indices are a mathematical combination
of visible, near-infrared and red-edge bands allow us to
delineate the vegetation cover and soil according to the
reflectance characteristics of green vegetation. So, they
consider an important method for monitoring land use
and green cover.
Normalized difference Vegetation index (NDVI)
Vegetation indices are important methods for
monitoring land use and green cover. The most used
index is normalized difference vegetation index (NDVI)
that reflect the level of changes in amount of green
biomass, pigment content and concentration and leaf
water stress. Analysis of variance in Table (2) showed a
highly significant differences among studied species in
NDVI values. Generally, most studied species recorded
high NDVI value with maximize value 0.80 for Ficus
benjamina , whilst Ficus microcarpa Hawai recorded
the lowest NDVI value (0.29) as presented and showed
at Figure (5).

ALEXANDRIA SCIENCE EXCHANGE JOURNAL, VOL. 39, No.2. APRIL- JUNE 2018
634
Figure 3. Spectral signature curve of the studied species
Table 2. Analysis of variance of vegetation indices and chlorophyll content among studied species
variables d.f. S.S. M.S. F value P
DN 17 6607.07 388.65 10.62 .0000 **
NDVI 17 0.937 0.055 5.48 0.000**
SR 17 275.686 16.22 1.77 0.057ns
chlorophyll 17 11902.88 700.17 34.69 0000 **
Total 71 ** high significant at 0.01
ns: not significant

Nashwa H. Mohamed et al: Remotely Identification and Differentiate of Ficus Species in Alexandria City Using Spectral…… 635
Figure 4. Digital number (DN) of different Ficus species
Figure 5. Normalized difference Vegetation index. (NDVI) of studied species
ALEXANDRIA SCIENCE EXCHANGE JOURNAL, VOL. 39, No.2. APRIL- JUNE 2018
636
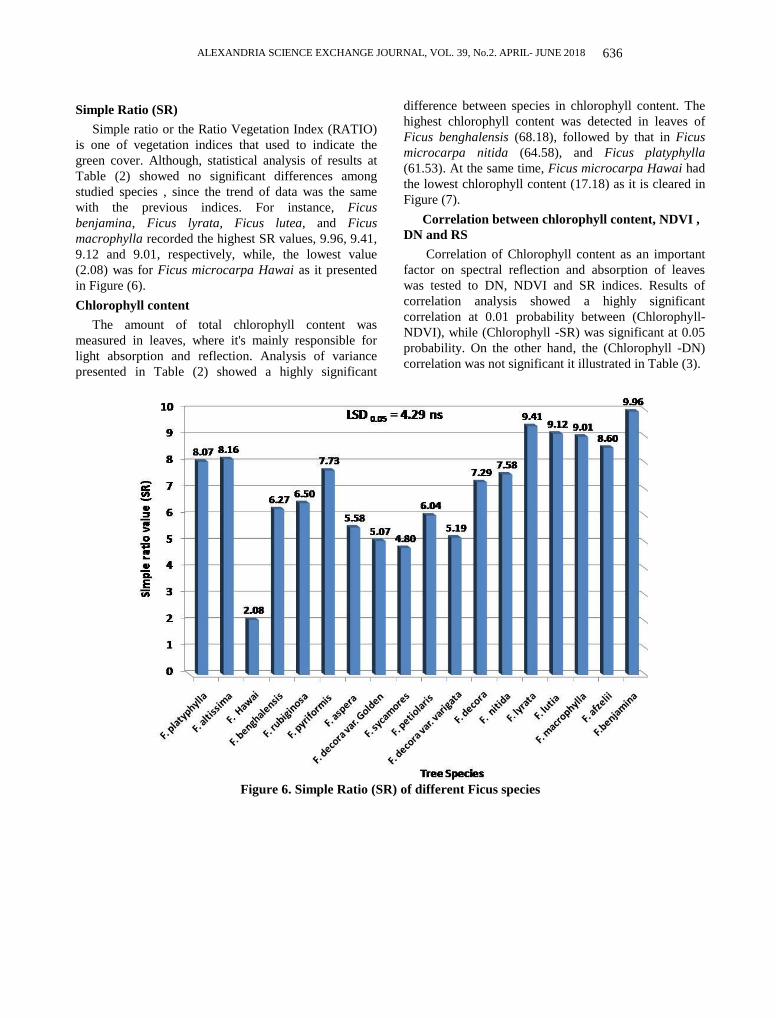
Simple Ratio (SR)
Simple ratio or the Ratio Vegetation Index (RATIO)
is one of vegetation indices that used to indicate the
green cover. Although, statistical analysis of results at
Table (2) showed no significant differences among
studied species , since the trend of data was the same
with the previous indices. For instance, Ficus
benjamina, Ficus lyrata, Ficus lutea, and Ficus
macrophylla recorded the highest SR values, 9.96, 9.41,
9.12 and 9.01, respectively, while, the lowest value
(2.08) was for Ficus microcarpa Hawai as it presented
in Figure (6).
Chlorophyll content
The amount of total chlorophyll content was
measured in leaves, where it's mainly responsible for
light absorption and reflection. Analysis of variance
presented in Table (2) showed a highly significant
difference between species in chlorophyll content. The
highest chlorophyll content was detected in leaves of
Ficus benghalensis (68.18), followed by that in Ficus
microcarpa nitida (64.58), and Ficus platyphylla
(61.53). At the same time, Ficus microcarpa Hawai had
the lowest chlorophyll content (17.18) as it is cleared in
Figure (7).
Correlation between chlorophyll content, NDVI ,
DN and RS
Correlation of Chlorophyll content as an important
factor on spectral reflection and absorption of leaves
was tested to DN, NDVI and SR indices. Results of
correlation analysis showed a highly significant
correlation at 0.01 probability between (Chlorophyll-
NDVI), while (Chlorophyll -SR) was significant at 0.05
probability. On the other hand, the (Chlorophyll -DN)
correlation was not significant it illustrated in Table (3).
Figure 6. Simple Ratio (SR) of different Ficus species

Nashwa H. Mohamed et al: Remotely Identification and Differentiate of Ficus Species in Alexandria City Using Spectral…… 637
Figure 7. Chlorophyll content of different Ficus species
Table 3. Correlation analysis of Chlorophyll content from one side and NDVI, DN and SR from the other side
Variables n Correlation (r) S.E. P(r=0)
Chlorophyll- NDVI 72 0.53 0.101 0.0000 **
Chlorophyll -DN 72 0.16 0.118 0.1780 ns
Chlorophyll -SR 72 0.29 0.115 0.0147 * ** high significant at 0.01 ns: not significant * significant at 0.05
DISCUSSION
Spectral curves were different among the studied
species according to regions of light absorption and
reflection formed in curve bottoms and peaks,
respectively. Additionally, the amount of absorption and
reflection light according to each leaf species structure
and properties. This result was explained by Gates,
1970; Gausman et al., 1977; Williams, 1991; Marek and
Sobieraj, 2004 and Baltzer and Thomas, 2005) as
generally vegetation has low reflectance and low
transmittance in the visible part of the spectrum. This,
because of the plant pigments such as, chlorophyll
which absorbs violet-blue and red light for storing
photosynthetic energy. Green light is not absorbed for
photosynthesis and therefore most plants appear green.
At the same time, plants reflect radiation highly in the
near infrared region because of to the high air cell
interface area within leaves. The reflectance of near-
infrared wave band also varies according to the shape
and orientation of plant leaves. Therefore, near-infrared
reflectance values are often more useful than visible
reflectance values in distinguishing forest types.
According to Gregory (1998) the variation of tissue
optical properties depending on wavelength. For stance,
the lowest variation was in the visible spectral region,
while the highest was in near infrared region in green
foliage. Furthermore, they reported that the standing
litter material, showed minimum variation in the visible-
near infrared region, while the largest differences were
occurred in the shortwave- infrared .
It is known that the spectral properties of plant
species depend on plant physiology, morphology and
anatomy (Kycko et al , 2014 and Jarocinska et al.
2016).

ALEXANDRIA SCIENCE EXCHANGE JOURNAL, VOL. 39, No.2. APRIL- JUNE 2018
638
Species with Large size ,dark color and thick leaves
showed a high value of DN, NDVI and chlorophyll
content . Also, their spectral curves were highly
separated compared to those of other species that being
separated, but close to each other. This result was
matched with Jacquemoud and Baret, (1990); Apan, et
al. (2003) and Uto and Kosugi, 2012) who explained
that all vegetation properties containing chlorophyll and
other light-absorbing pigments, proteins, water, waxes
have a major effect on reflectance of the spectra of
vegetation while , Pigments with strong absorption
peaks at corresponding narrow spectral bands are
estimated by the comparison between absorption peak
bands and pigment-independent reference bands.
Therefore, vegetation with large quantity of biomass and
high chlorophyll concentration showed high value in
NDVI, because reflectance at the red band indicates
chlorophyll concentration level, where chlorophyll
contains narrow peaks at 662nm (chlorophyll a) and
642nm (chlorophyll b).
NDVI and SR results were matched to those of
Tucker (1979), who mentioned that SR and NDVI were
built in the observation that green leaves strongly absorb
light in red band by chlorophyll, with maximum
absorption at about 690 nm, while the cell walls strongly
reflect and transmit light in the NIR region (about 850
nm). These results obtained by the NDVI and related
visible spectral, which are functional variants of the SR.
Also, he found that NDVI was strongly correlated with
chlorophyll content and crop characteristics that were
directly related to chlorophyll content. Also, Myneni et
al. (1995) showed that NDVI was near-linearly related
to the chlorophyll content of single soybean leaves and
curvilinearly related to the chlorophyll content of
soybean canopies (that for surface leaves intercept more
light than leaves deeper in the canopy). On the other
hand, Quan et al. (2011) mentioned that The ratio
vegetation index (RVI) is widely used for green biomass
estimations and monitoring, specifically, at high density
vegetation coverage, because, this index is very sensitive
to vegetation and has a good correlation with plant
biomass.
Richmond and Sussman (2003) mentioned that leaf
reflectance spectra variability is affect by epidermis
thickness, density of prickle hairs on the adaxial leaf
surface. Also, the impact of the leaf structure on the
reflectance spectra can be significantly altered in the
presence of epiphyton at the leaf surface (Brandt and
Koch 2003; Klancnik et al., 2015).
Distinctly, vegetation in the NIR region has a high
reflectance, with a very rapid transition to low levels
between red and NIR regions at 750 nm. This unique
character of the vegetation spectrum achieved the
possibility to separate vegetation from background
material with remotely sensed multispectral data that at
least includes NIR and red region reflectance. In
general, plant reflectance in Red band depends on
chlorophyll content, and reflectance in near infrared one
depending on internal structure of the plant cell.
Reflectance in these spectra are uncorrelated with each
other and they show high spectral contrast for vegetation
(Marek and Sobieraj , 2004).
CONCLUSION
In this research some of Ficus species vary in their
leaf shapes, thickness, textures and colors were selected
to examine how much spectral waves properties and
vegetation indices can differ among such species.
Inasmuch as, remote sensing is an important and useful
tool to use in plant classification according to
differences in tree species leaves shape, chlorophyll
content and structure that translated into different
amount of spectral reflectance. Distinctly, Ficus species
with large, thick and dark green color leaves had the
highest value of DN, NDVI, Chlorophyll content and a
highly separated spectral curve such as Ficus
platyphylla , Ficus lyrata and Ficus altissima , in
opposite to species that have small leaves or have light
green color like Ficus microcarpa Hawai which
recorded the lowest value of all measured indices and
formed a low spectral curve. Vegetation in red and NIR
spectral Region has high reflectance characteristics that
achieve the possibility to separate vegetation types and
species. Even small changes in reflectance can be
measured, recorded and assigned to a specific species
according to leaf spectral properties on three visible
bands (near infrared, visible red and visible green) that
used in feature extraction. Noticeable that chlorophyll
content as a mainly factor of light absorption and
reflectance had a high correlation to NDVI and SR
indices.
ACKNOWLEDGEMENT
The authors are gratefully for Miss Therese Labib,
(Consultant of Botanic Gardens and gene Bank) for
helping in identify and botanically naming Ficus species
used in this research.
REFERENCES
Alanís Flores G.J. 2005. El arbolado urbano en el area
metropolitana de Monterrey. Ciencia UANL 8 (1):
20-32.
Apan A., A. Held, A. Phinn, and J.Markley. 2003.
Formulation and Assessment of Narrow-Band
Vegetation Indices from EO-1 Hyperion Imagery for
Discriminating Sugarcane Disease. Proc. Spatial Sci.
Conf.

Nashwa H. Mohamed et al: Remotely Identification and Differentiate of Ficus Species in Alexandria City Using Spectral…… 639
Avalos G., S. S. Mulkey and K. Kitajma. 1999. Leaf
optical properties of trees and lianas in the outer
canopy of a tropical dry forest. Biotropica, 31: 517–
520.
Badr M.D. 2003. Encyclopedia Trees and Environment.
Monshaat Al-Maarif – Alexandria, Egypt, pp:747-
824.
Baltzer J.L. and S.C. Thomas 2005. Leaf optical
responses to light and soil nutrient availability in
temperate deciduous trees. Am J Bot, 92:241–23.
Baret F., and G. Guyot, 1991. Potentials and limits of
vegetation indices for LAI and APAR assessment.
Remote Sensing of Environment, 35: 161-173.
Berg C. C. and J. T. Wiebes 1992. African fig trees and
fig wasps. Koninklijke Nederlandse Akademie van
Wetenschappen. North-Holland, Amsterdam, pp. 1-
298.
Bhandari A.K. and A. Kumar 2012. Feature extraction
using normalized difference vegetation index
(NDVI): A Case Study of Jabalpur City, Proceedings
of Communication, Computing & Security. Procedia
Technology , 6:. 612– 621.
Brandt L.A. and Koch E.W. 2003. Periphyton as a UV-
B filter on seagrass leaves: a result of different
transmittance in the UV-B and PAR ranges. Aquatic
Bot, 76:317–27.
Chen J., D. B. McConnell, D. J. Norman and R. J.
Henny 2005. The foliage plant industry. Hort. Rev.
Amer. Soc. Hort. Sci. 31:47-112.
Clark M. L., D. A. Roberts and D. B. Clark. 2005.
Hyperspectral discrimination of tropical rain forest
tree species at leaf to crown scales. Remote Sensing
of Environment 96: 375–398.
Cochrane M. A. 2000. Using vegetation reflectance
variability for species level classification of
hyperspectral data. International Journal of Remote
Sensing 21: 2075–2087.
Condit I. J. 1969. Ficus: The Exotic Species. Division of
Agricultural Science, University of California,
Riverside, CA, pp. 265-301.
Dehgan B. 1998. Landscape Plants for Subtropical
Climates. University Press of Florida, Gainesville.
FL. 638 p.
Elsayed, S., P. Rischbeck and U. Schmidhalter 2015.
Comparing the performance of active and passive
reflectance sensors to assess the normalized relative
canopy temperature and grain yield of drought
stressed barley cultivars. Field Crop Research, 177:
148-160.
Fassnacht K. S., S. T. Gower , M. D. MacKenzie, E. V.
Nordheim and T. M. Lillesand. 1997. Estimating the
leaf area index of north central Wisconsin forests
using the Landsat Thematic Mapper, Remote Sens.
Environ., 61: 229–245.
Federer W.T. 1955. Experimental Design. MacMillan,
NY.
Gates D.M., 1970. Physical and Physiological
Properties of Plants, in Remote Sensing: Nat!' Acd.
Sci., Washington, D.C., p: 224-252.
Gausman H. W., D. E. Escobar, and E. B. Knipling,
1977. Anomalous leaf reflectance and leaf anatomy
of Pe-peromia obtusifolia. PhotogrammetTic
Engineering and Re-mote Sensing 43:1183--1185.
Ghadam A. K., G. Nasrollah, H. Farshid and S. Marzieh
2011. Cytotoxic effects of different extracts and
latex of Ficus carica L. on HeLa cell line. Ir. J.
Pharma. Res., 10:273-277.
Gregory P. A. 1998. Biophysical and Biochemical
Sources of Variability in Canopy Reflectance.
Remote Sensing of Environment, 64: (3) : 234-253.
Heneidy S.Z. 2010. Plant Atlas of the Botanic Garden –
Faculty of Science, Alexandria University.
Monshaat Al-Maarif – Alexandria, Egypt, pp.429-
443.
Jacquemoud S. and F. Baret, 1990. PROSPECT: a
model of leaf optical properties spectra. Remote
Sens. Environ. 34:75–91.
Jarocinska A.M., M. Kacprzyk, A. Marcinkowska-
Ochtyra, A. Ochtyra, B. Zagajewski and K.
Meuleman 2016. The application of APEX images in
the assessment of the state of non-forest vegetation
in the Karkonosze Mountains. Misc. Geogr. 20: 21–
27.
Jean-Baptiste F., C. Francois, G. Asner, A. Gitelson, R.
Martin, L. Bidel, S. Ustin, G. Lemaire and S.
Jacquemoud 2008. Prospect-4 and 5: Advances in
the leaf optical properties model separating
photosynthetic pigments, Remote Sensing of
Environment.112−6 :3030–3043.
Klancnik K, D. Gradinjan, A. Gaberscik 2015.
Epiphyton alters the quantity and quality of radiation
captured by leaves in submerged macrophytes. Aquat
Bot 120:229–35.
Kycko M., B. Zagajewski and A. Kozlowska 2014.
Variability in spectral characteristics of trampled
high-mountain grasslands. Misc. Geogr. 18:10–14.
Lee D. W., R. A. Bone, S. L. Tarsis and D. Storch.
1990. Correlates of leaf optical-properties in tropical
forest sun and extreme-shade plants.American
Journal of Botany. 77: 370–380.

ALEXANDRIA SCIENCE EXCHANGE JOURNAL, VOL. 39, No.2. APRIL- JUNE 2018
640
Marek M. and A. Sobieraj. 2004. Comparison of several
vegetation indices calculated on the basis of a
seasonal spotxs time series, and their suitability for
land cover and agricultural crop identification .
Techn. Sc. No 7. Y.
Martelli A. and J. Barbosa 2010. Analysis of the
incidence of tree suppression and its main causes in
the urban perimeter of the town of Itapira-SP.
REVSBAU 5 (4): 96-109.
Myneni R.B., F. G. Hall, P. J. Seller and A. L.
Marshak. 1995. The interpretation of spectral
vegetation indexes. IEEE Transactions on
Geoscience and Remote Sensing 33: 481- 486.
Nageswara P.P.R., S.V. Shobha, K.S. Ramesh and R.K.
Somashekhar. 2005. Satellite -based assessment of
Agricultural drought in Karnataka State, Journal of
the Indian society of remote sensing . 33 (3). Pp:
429-434.
Padilla F. L. M., M. P. González-Dugo, P .Gavilán and
J. Domínguez. 2011. Integration of vegetation
indices into a water balance model to estimate
evapotranspiration of wheat and corn. Hydrology
and Earth System Sciences.15: 1213–1225
http://dx.doi.org/10.5194/hess-15-1213-2011
Quan Z., Z. Xianfeng and J. Miao. 2011. “Eco-
environment variable estimation from remote sensed
data and eco-environment assessment: models and
system,” Acta Botanica Sinica. vol. 47,pp: 1073–
1080.
Richmond K.E. and M. Sussman. 2003. Got silicon?
The non-essentialbeneficial plant nutrient. Curr Opin
Plant Biol 6:268–72.
Snedecor G.W. and W.G. Cochran. 1989. Statistical
Methods. Sixth Edition. Iowa State University Press.
Ames. Iowa. USA. PP: 245-250.
Starr F., K. Starr, and L.L. Loope. 2003. Ficus
benjamina. United States Geological Survey-
Biological Resources Division. Haleakala Field
Station. Maui. Hawaii.
Susan B., B. Rayegani, M. Saati , A. Sharifi , and M.
Nasri. 2011. Comparison the accuracies of different
spectral indices for estimation of vegetation cover
fraction in sparse vegetated areas, The Egyptian
Journal of Remote Sensing and Space Sciences 14
:49–56.
Thenkabail P.S., R.B . Smith , E. De Pauw. 2000.
Hyperspectral vegetation indices and their
relationships with agricultural crop characteristics.
Remote Sens. Environ. 71:158–182.
Toscan M.A.G., H.C. Rickli, D. Bartinick, D. Dos
Santos, and D. Rossa. 2010. Inventory and analysis
of the urban street trees of Vila Yolanda, Foz do
Iguazu – State of Parana (Brazil). REVSBAU 5 (3):
165-184.
Tucker C.J. 1979. Red and photographic infrared linear
combinations for monitoring vegetation. Remote
Sensing of Environment, 8: 127–150.
Tucker, C. J. and P. J. Sellers. 1986. Satellite remote
sensing of primary production. International Journal
of Remote Sensing, 7: 1395-1416.
Uto K. and Y. Kosugi. 2012. Hyperspectral
manipulation for the water stress evaluation of
plants ,Contemporary Materials, III (1) Pp: 18 – 25.
Vargas-Garzón B.P. and L.F. Molina-Prieto. 2010. Five
urban trees causing severe damage to cities. Revista
Nodo 5 (9): 115-126.
Williams D.L., 1991. A comparison of spectral
reflectance properties at the needle, branch, and
canopy level for selected conifer species. Remote
Sens. Environ. 35:79–93.
Yadava U. 1986. A rapid and nondestructive method to
determine chlorophyll in intact leaves. Hort. Sci.,
21(6): 1449-1450.

Nashwa H. Mohamed et al: Remotely Identification and Differentiate of Ficus Species in Alexandria City Using Spectral…… 641
الملخص العربي
األنعكاس الموجودة فى مدينة اإلسكندرية بأستخدام قياسات التعريف والتفريق األستشعارى ألنواع الفيكس الطيفى
مامإ ديسلا صالح و نادر أحمد الشنهورى, نشوى حسن محمد
وع من ن 18التجربة تمت فى مدينة االسكندرية على تلك ة( الختبار كيف يمكن لالستشعار عن ينيالتالفيكس ) العائلة
كاداة تكنولوجية تطبيقية وكذلك الدالئل الخضرية ان تفرق دبعبين نوع الغطاء النباتى الموجود وهذا بناء على اختالف الخواص الطيفية الوراق كل نوع نباتى. اظهرت النتائج اختالف معنوى فى خواص االمتصاص واالنعكاس الطيفى
وكان هذا االختالف واضح فى اختالف تى نبالكل نوع لكل نوع نباتى وكذلك (spectral curve) نحنيات الطيفيةالم
على أ سجلتلكل نوع حيث (Dn)قيمة متوسط الرقم الطيفى الفيكس بالتيفيال, الفيكس ليراتا و الفيكس لالنواعالقيم
التيسيما وهى انواع ذات اوراق كبيرة الحجم , سميكة , لها االوراق ون اخضر داكن , على عكس الفيكس هاواى ذو ل
ش مع االبيض والذى سجل قصغيرة الحجم ولون اخضر مبر اقل متوسط للرقم الطيفى والمنحنى الطيفى . هذا وقد سجل
وكذلك المحتوى (NDVI)تالف الخضرى الطبيعى دليل االخالكلوروفيلى لالوراق نفس االتجاه فى النتائج . من ناحية
ان (simple ratio)دليل النسبة البسيطة لم يستطع ى اخر يفرق بشكل معنوى بين االنواع النباتية تحت الدراسة. جدير
قة االشعة تحت الحمراء القريبة هى المنط منطقة ان بالذكراالمثل من االنعكاس الطيفى والتى تظهر االختالفات بين
اهرية اوراق انواع النباتات المختلفة حسب صفاتها الظتائج التحليل والتشريحية. من ناحية اخرى اظهرت ن
بين محتوى االوراق من كبير االحصائى ارتباط معنوىالكلوروفيل وبين كال من دليل االختالف الخضرى الطبيعى )
(NDVI ودليل النسبة البسيطة(simple ratio) بينما لم يكن ,وبين متوسط هناك ارتباط بين المحتوى الكلوروفيللى لالوراق
.(Dn)الرقم الطيفى


![[eBook - Ita - Bonsai] Ficus](https://static.fdocuments.in/doc/165x107/577cc1ec1a28aba711940644/ebook-ita-bonsai-ficus.jpg)