Remote Usability Testing - A New Approach Facilitated By ...
127
Clemson University TigerPrints All eses eses 8-2010 Remote Usability Testing - A New Approach Facilitated By Virtual Worlds Kapil Chalil madathil Clemson University, [email protected] Follow this and additional works at: hps://tigerprints.clemson.edu/all_theses Part of the Industrial Engineering Commons is esis is brought to you for free and open access by the eses at TigerPrints. It has been accepted for inclusion in All eses by an authorized administrator of TigerPrints. For more information, please contact [email protected]. Recommended Citation Chalil madathil, Kapil, "Remote Usability Testing - A New Approach Facilitated By Virtual Worlds" (2010). All eses. 931. hps://tigerprints.clemson.edu/all_theses/931
Transcript of Remote Usability Testing - A New Approach Facilitated By ...

Clemson UniversityTigerPrints
All Theses Theses
8-2010
Remote Usability Testing - A New ApproachFacilitated By Virtual WorldsKapil Chalil madathilClemson University, [email protected]
Follow this and additional works at: https://tigerprints.clemson.edu/all_theses
Part of the Industrial Engineering Commons
This Thesis is brought to you for free and open access by the Theses at TigerPrints. It has been accepted for inclusion in All Theses by an authorizedadministrator of TigerPrints. For more information, please contact [email protected].
Recommended CitationChalil madathil, Kapil, "Remote Usability Testing - A New Approach Facilitated By Virtual Worlds" (2010). All Theses. 931.https://tigerprints.clemson.edu/all_theses/931
REMOTE USABILITY TESTING - A NEW APPROACH FACILITATED BY
VIRTUAL WORLDS
A Thesis
Presented to
the Graduate School of
Clemson University
In Partial Fulfillment
of the Requirements for the Degree
Master of Science
Industrial Engineering
by
Kapil Chalil Madathil
August 2010
Accepted by:
Dr. Joel S. Greenstein, Committee Chair
Dr. Anand K. Gramopadhye
Dr. Byung Rae Cho
ii
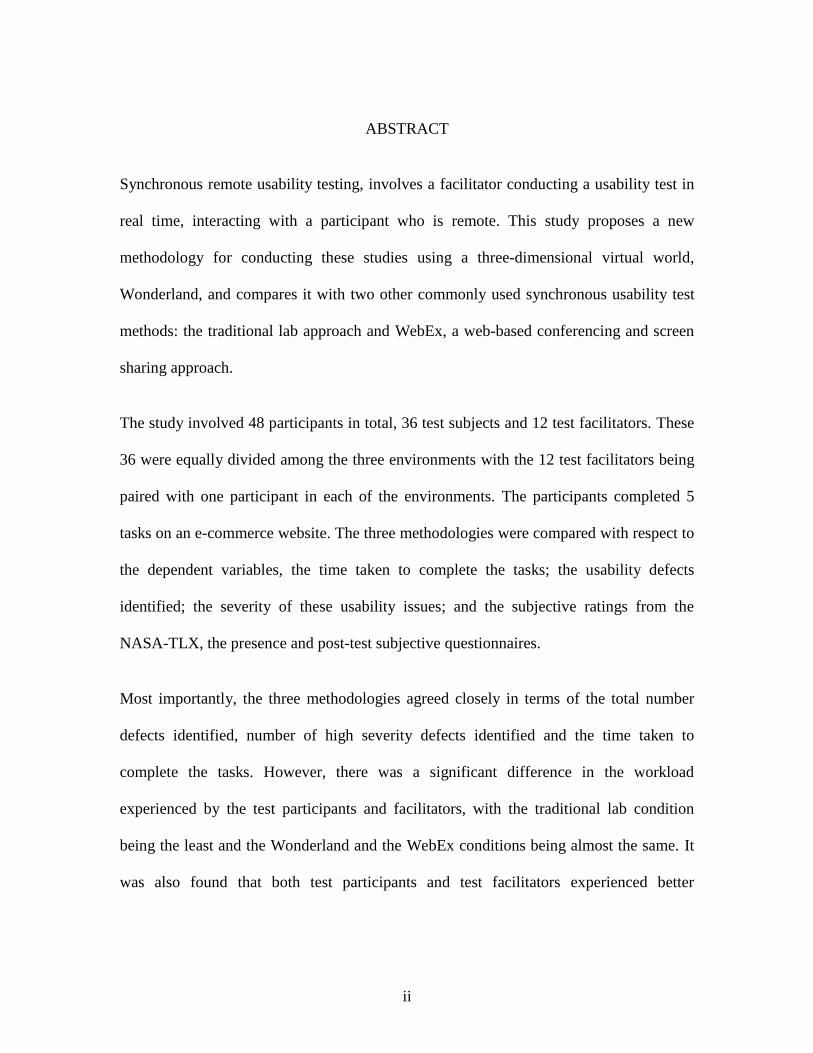
ABSTRACT
Synchronous remote usability testing, involves a facilitator conducting a usability test in
real time, interacting with a participant who is remote. This study proposes a new
methodology for conducting these studies using a three-dimensional virtual world,
Wonderland, and compares it with two other commonly used synchronous usability test
methods: the traditional lab approach and WebEx, a web-based conferencing and screen
sharing approach.
The study involved 48 participants in total, 36 test subjects and 12 test facilitators. These
36 were equally divided among the three environments with the 12 test facilitators being
paired with one participant in each of the environments. The participants completed 5
tasks on an e-commerce website. The three methodologies were compared with respect to
the dependent variables, the time taken to complete the tasks; the usability defects
identified; the severity of these usability issues; and the subjective ratings from the
NASA-TLX, the presence and post-test subjective questionnaires.
Most importantly, the three methodologies agreed closely in terms of the total number
defects identified, number of high severity defects identified and the time taken to
complete the tasks. However, there was a significant difference in the workload
experienced by the test participants and facilitators, with the traditional lab condition
being the least and the Wonderland and the WebEx conditions being almost the same. It
was also found that both test participants and test facilitators experienced better
iii
involvement and immersive experiences in the Wonderland condition, than the WebEx
condition and almost the same for traditional lab condition.
The results of this study suggest that participants were productive and enjoyed the
Wonderland condition, indicating the potential of a virtual world based approach as an
alternative to the conventional approaches.
iv
DEDICATION
The thesis is dedicated to my beloved parents, Haridasan Chenicheri Veettil and
Ramani Chalil Madathil; my brothers Arekh R. Nambiar, Sreenath Chalil Madathil,
Anoop R. Nambiar; my sister-in-law Preethi Dhanvi; my uncle Narayanan Chalil
Madathil and God Almighty.
v
ACKNOWLEDGMENTS
It is difficult to overstate my gratitude to my advisor, Dr. Joel S. Greenstein. His
enthusiasm, inspiration, and efforts in explaining ideas clearly and simply helped make
this research interesting. Moreover, he provided continuous encouragement, sound advice
and many good ideas. I would have been lost without him. I am also very thankful to Dr.
Anand K. Gramopadhye for helping me during the various stages of the experimental
design and providing input at different phases of this research. I would like to thank Dr.
Byung Rae Cho, for his advice on Statistics and Dr. DeWayne Moore, who advised me
during the various stages of data analysis. Finally, I am extremely grateful to Ms. Barbara
Ramirez for her valuable input in correcting this thesis and for teaching me how to write
for the right audience.
My colleagues, Rachana Ranade and Vikas Vadlapatla and my friends Aby Abraham
Thyparambil, Balakrishnan Sivaraman and Githin F. Alapatt deserve special mention for
helping me during the various stages of data collection. I am also thankful to Martin
Clark, for helping me with the various infrastructure-related issues.
I wish to thank my entire family for providing an emotional support and encouraging
environment for me, most especially my brothers, my cousins and my sister-in-law
Lastly, and most importantly, I wish to thank my parents, all the teachers who have
taught me at different stages of my education and God Almighty.
vi
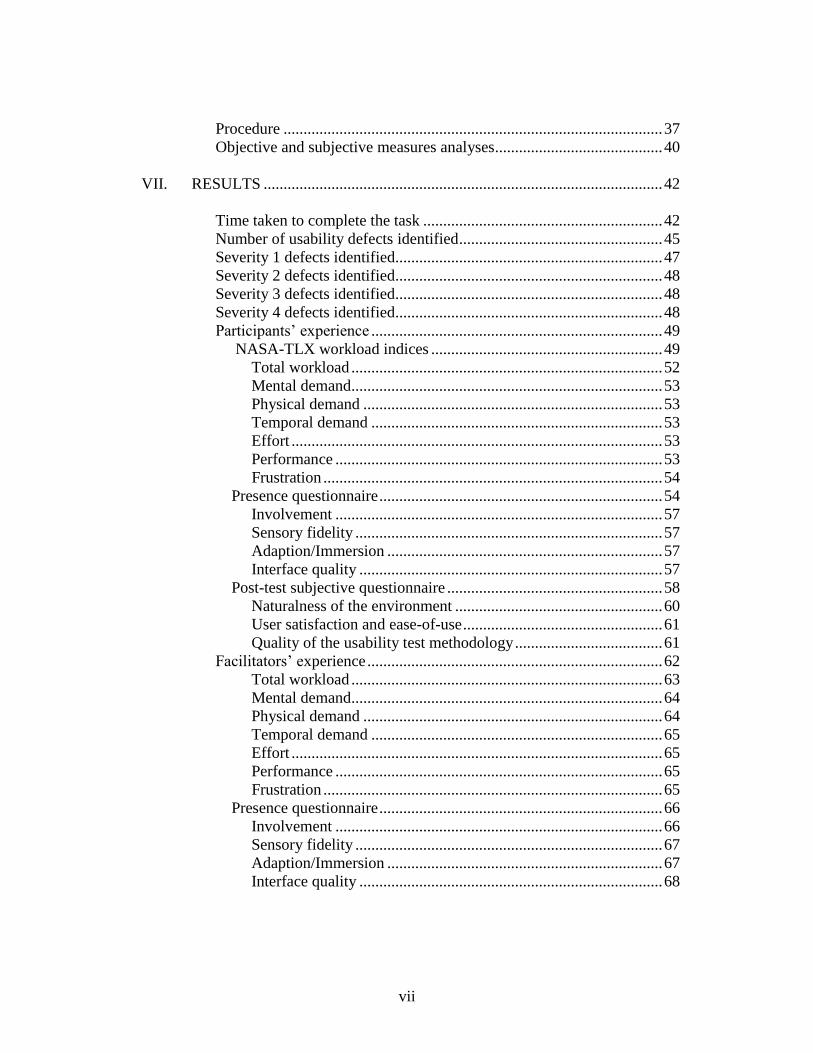
TABLE OF CONTENTS
Page
TITLE PAGE .................................................................................................................... i
ABSTRACT ..................................................................................................................... ii
DEDICATION ................................................................................................................ iv
ACKNOWLEDGMENTS ............................................................................................... v
LIST OF TABLES .......................................................................................................... ix
LIST OF FIGURES ......................................................................................................... x
CHAPTER
I. INTRODUCTION ......................................................................................... 1
II. USABILITY TESTING ................................................................................. 4
Usability test methods .............................................................................. 5
Usability inspection methods ................................................................... 6
Usability measures ................................................................................... 7
Traditional lab usability testing methodology ......................................... 8
III. REMOTE USABILITY TESTING ............................................................. 11
Types of remote evaluation .................................................................... 12
Remote usability testing tools ................................................................ 16
IV. COLLABORATIVE VIRTUAL ENVIRONMENTS ................................. 22
V. RESEARCH QUESTIONS AND HYPOTHESES ..................................... 25
VI. METHODOLOGY ...................................................................................... 28
Participants ............................................................................................. 28
Testing environments ............................................................................. 29
Tasks ...................................................................................................... 34
Experimental design............................................................................... 36
vii
Procedure ............................................................................................... 37
Objective and subjective measures analyses.......................................... 40
VII. RESULTS .................................................................................................... 42
Time taken to complete the task ............................................................ 42
Number of usability defects identified ................................................... 45
Severity 1 defects identified................................................................... 47
Severity 2 defects identified................................................................... 48
Severity 3 defects identified................................................................... 48
Severity 4 defects identified................................................................... 48
Participants’ experience ......................................................................... 49
NASA-TLX workload indices .......................................................... 49
Total workload .............................................................................. 52
Mental demand.............................................................................. 53
Physical demand ........................................................................... 53
Temporal demand ......................................................................... 53
Effort ............................................................................................. 53
Performance .................................................................................. 53
Frustration ..................................................................................... 54
Presence questionnaire ....................................................................... 54
Involvement .................................................................................. 57
Sensory fidelity ............................................................................. 57
Adaption/Immersion ..................................................................... 57
Interface quality ............................................................................ 57
Post-test subjective questionnaire ...................................................... 58
Naturalness of the environment .................................................... 60
User satisfaction and ease-of-use .................................................. 61
Quality of the usability test methodology ..................................... 61
Facilitators’ experience .......................................................................... 62
Total workload .............................................................................. 63
Mental demand.............................................................................. 64
Physical demand ........................................................................... 64
Temporal demand ......................................................................... 65
Effort ............................................................................................. 65
Performance .................................................................................. 65
Frustration ..................................................................................... 65
Presence questionnaire ....................................................................... 66
Involvement .................................................................................. 66
Sensory fidelity ............................................................................. 67
Adaption/Immersion ..................................................................... 67
Interface quality ............................................................................ 68

viii
Page
Post-test subjective questionnaire .......................................................... 68
Ease-of-use .................................................................................... 70
Seamless communication with the test participant ....................... 71
Sense of presence with the test participant ................................... 71
Confidence .................................................................................... 71
Efficiency ...................................................................................... 71
Ability to analyze user interaction ................................................ 71
Comfort level ................................................................................ 71
Likeability ..................................................................................... 72
VIII. DISCUSSION .............................................................................................. 73
IX. CONCLUSION ............................................................................................ 80
APPENDICES ............................................................................................................... 82
A: Consent form for test facilitators ............................................................ 82
B: Pre-test questionnaire for test facilitators ................................................ 84
C: Consent form for test participants ........................................................... 86
D: Pre-test questionnaire for test participants .............................................. 88
E: Presence questionnaire ............................................................................ 90
F: Subjective questionnaire for test participant ........................................... 95
G: Subjective questionnaire for test facilitator .......................................... 100
REFERENCES ............................................................................................................ 108
ix
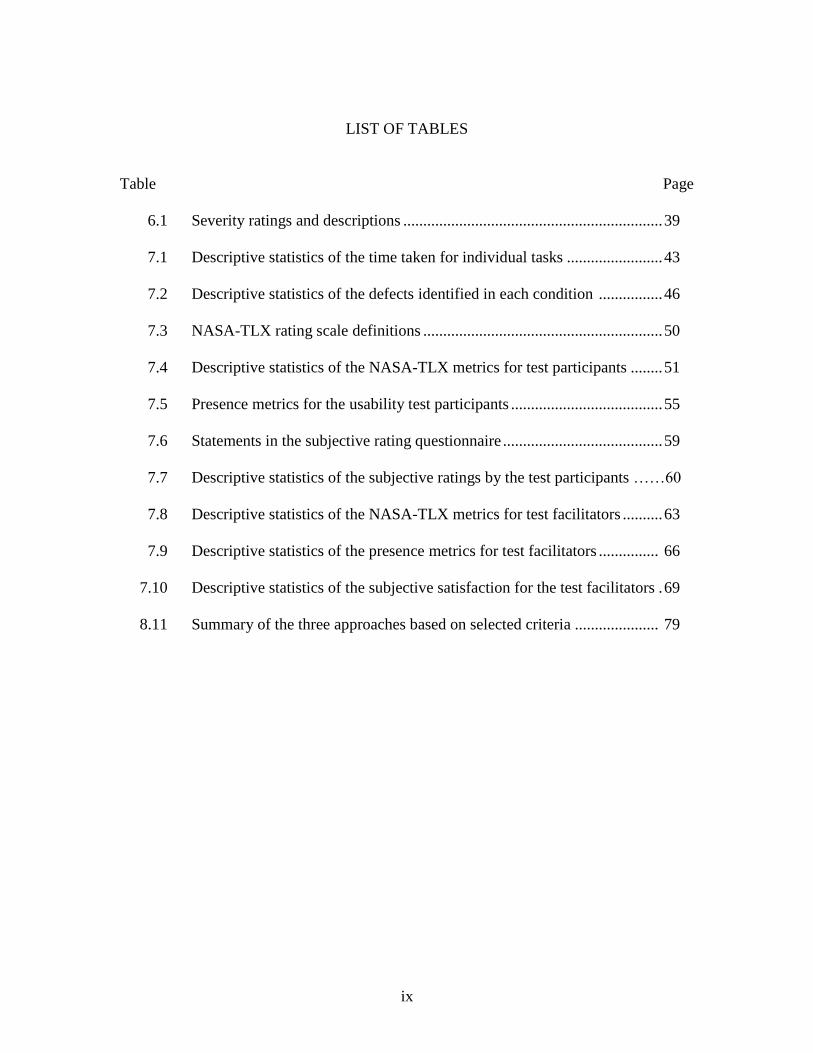
LIST OF TABLES
Table Page
6.1 Severity ratings and descriptions ................................................................. 39
7.1 Descriptive statistics of the time taken for individual tasks ........................ 43
7.2 Descriptive statistics of the defects identified in each condition ................ 46
7.3 NASA-TLX rating scale definitions ............................................................ 50
7.4 Descriptive statistics of the NASA-TLX metrics for test participants ........ 51
7.5 Presence metrics for the usability test participants ...................................... 55
7.6 Statements in the subjective rating questionnaire ........................................ 59
7.7 Descriptive statistics of the subjective ratings by the test participants ……60
7.8 Descriptive statistics of the NASA-TLX metrics for test facilitators .......... 63
7.9 Descriptive statistics of the presence metrics for test facilitators ............... 66
7.10 Descriptive statistics of the subjective satisfaction for the test facilitators . 69
8.11 Summary of the three approaches based on selected criteria ..................... 79
x
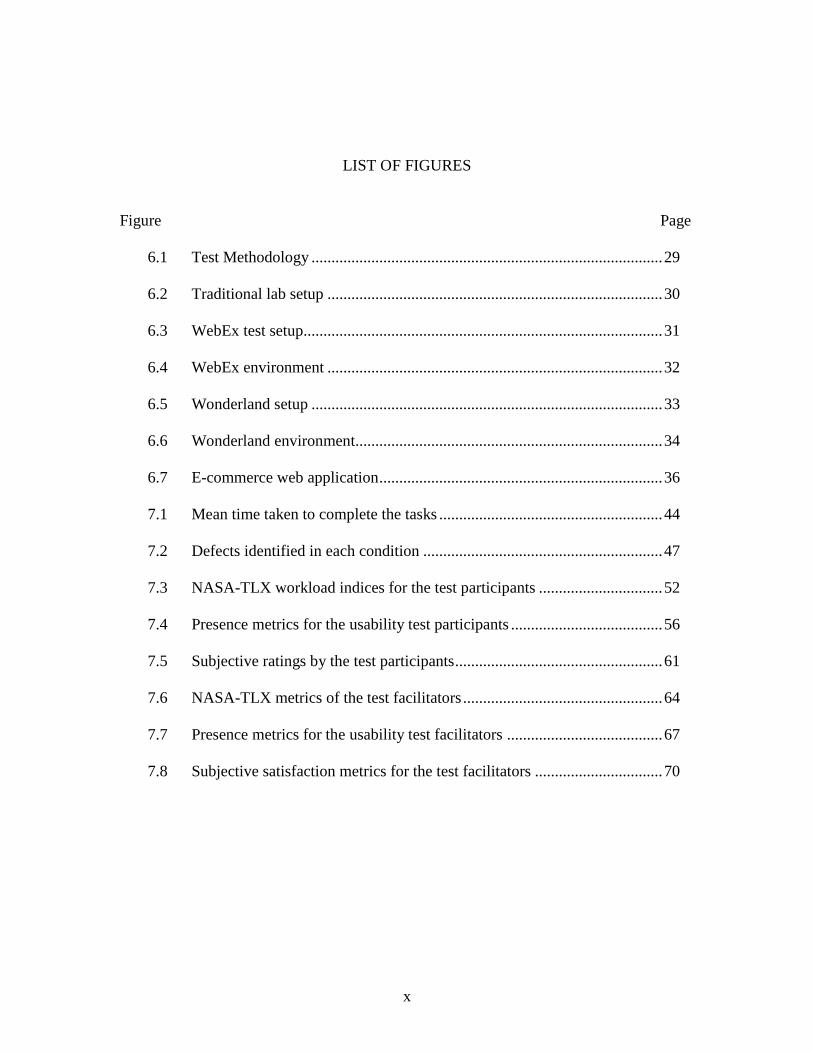
LIST OF FIGURES
Figure Page
6.1 Test Methodology ........................................................................................ 29
6.2 Traditional lab setup .................................................................................... 30
6.3 WebEx test setup.......................................................................................... 31
6.4 WebEx environment .................................................................................... 32
6.5 Wonderland setup ........................................................................................ 33
6.6 Wonderland environment............................................................................. 34
6.7 E-commerce web application ....................................................................... 36
7.1 Mean time taken to complete the tasks ........................................................ 44
7.2 Defects identified in each condition ............................................................ 47
7.3 NASA-TLX workload indices for the test participants ............................... 52
7.4 Presence metrics for the usability test participants ...................................... 56
7.5 Subjective ratings by the test participants .................................................... 61
7.6 NASA-TLX metrics of the test facilitators .................................................. 64
7.7 Presence metrics for the usability test facilitators ....................................... 67
7.8 Subjective satisfaction metrics for the test facilitators ................................ 70
CHAPTER ONE
INTRODUCTION
Usability studies on software interfaces analyzing how users interact with
computer applications began in the early 1980’s (Shneiderman, 1980), (Card, Moran, &
Newell, 1986). At this time, several usability evaluation methodologies (UEM) evolved,
the most common one being laboratory-based testing. This methodology, usually
conducted in a lab equipped with audio and video recording capabilities, involves a test
facilitator and participant in front of a one-way mirror with the application developers
watching and recording the participant’s completion of the tasks assigned. User
performance is then evaluated based on parameters such as speed, accuracy and types of
errors. These quantitative data are combined with subjective information obtained
through verbal protocols (Ericsson & Simon, 1985), critical incident reporting (del Galdo,
Williges, Williges, & Wixon, 1986), and user satisfaction surveys (Chin, Diehl, &
Norman, 1988). Traditionally, usability evaluation has been conducted during the final
stage of the design process, the cost and time requirements associated with it being
significant. To address this issue, the early 1990’s witnessed research developing
alternative cost-effective UE methods and the inclusion of usability as a product attribute
early in the design process. These results led to the development of such methodologies
as heuristic evaluation (Nielsen & Molich, 1990), cognitive walk-throughs (Lewis,
Polson, Wharton, & Rieman, 1990), usability walk-throughs (Bias, 1991), formal
usability inspection (Nielsen, 1994) and heuristic walk-throughs (Sears & Jacko, 1997).
2
The emergence of high speed internet technologies has resulted in the concept of the
global village and next generation products addressing its needs. In such a scenario where
usability evaluators, developers and prospective users are wide-spread, across different
countries and time zones, conducting a traditional lab usability evaluation creates
challenges both from the cost and logistical perspective. These concerns led to research
on remote usability evaluation with the user and the evaluators separated over space and
time. The development of the internet technology which forms the basis for remote UEM
has enabled usability testing to be conducted remotely, resulting in significant cost
savings (Hartson, Castillo, Kelso, & Neale, 1996). Remote testing, which facilitates
evaluations being done in the context of the user’s other tasks and technology can be
either synchronous or asynchronous (Scholtz, 2001). The former provides real time one-
on-one communication between the evaluator and the user, and the latter involves the
evaluator and user working separately (Castillo, 1997). Numerous tools are available to
address the needs of both these approaches. For example Microsoft NetMeeting, WebEx,
WebQuilt and IBM Lotus Sametime support online screen sharing and collaborative
capabilities for synchronous remote UE. Some of the remote asynchronous usability
testing tools include auto logging (Millen, 1999), questionnaires (Ericsson & Anders,
1998), user-reported critical incidents (Bruun, Gull, Hofmeister, & Stage, 2009),
(Castillo, 1997) unstructured problem reporting, forums and diaries (Bruun et al., 2009).
However, remote testing may lack the immediacy and sense of “presence” desired to
support a collaborative testing process. Moreover, managing inter-personal dynamics
across cultural and linguistic barriers may require approaches sensitive to the cultures
3
involved (Dray & Siegel, 2004). Other disadvantages include having reduced control
over the testing environment and the distractions and interruptions experienced by the
participants’ in their native environment.
The use of three-dimensional (3D) virtual world applications may address some of these
concerns. Collaborative engineering was redefined when these worlds integrated high
fidelity voice-based communication, immersive audio and data-sharing tools (Erbe &
Müller, 2006). In addition, such 3D virtual worlds mirror the collaboration among
participants and experts when all are physically present, potentially enabling usability
tests to be conducted more effectively when they are located in different places. Virtual
world applications are relatively new and as a result have been the focus of limited
research. To address this need, this study compared the effectiveness of synchronous
usability testing in a 3D virtual meeting room built using Sun Microsystems’ Wonderland
with traditional lab usability testing and an online meeting tool WebEx. The results of
usability tests employing the three methodologies were compared based on qualitative
and quantitative measurement of the work performed and the feedback from the
participants forming each team to determine which of the three is most effective.
4
CHAPTER TWO
USABILITY TESTING
Usability testing, developed to learn how prospective customers handle specific products,
is a “systematic way of observing actual users trying out a product and collecting
information about the specific ways in which the product is easy for them” (Dumas &
Redish, 1999). One of the widespread uses of it today is in the design and development of
products and services involving human-computer interfaces. According to Nielsen
(Nielsen, 1993a; Nielsen, 1994), such interface evaluation can be classified into four
categories:
Formal evaluation
Informal evaluation
Empirical evaluation
Automatic evaluation
Formal evaluation deals with the usage of formulae and models to calculate the
usability measures while informal evaluation deals with the general rules of thumb
and the general skill and experience of the usability evaluators. Empirical evaluation
involves assessing the usability by testing the interface with the real users whereas
automatic evaluation involves identifying the usability measures by running a user
interface specification through a software program. These evaluation methods can be
further grouped into the following categories.
5
Usability test methods (UTM) (Nielsen, 1993a)
o Observation
o Focus groups
o Interviews
o Questionnaires
o User testing
Usability inspection methods (UIM) (Nielsen, 1994).
o Heuristic evaluation
o Cognitive walk-through
o Formal usability inspection
o Pluralistic walk through
o Feature inspection
o Consistency inspection
o Standards inspection
The difference between these two categories is that the former includes real users while
the latter does not.
Usability test methods
Usability test methods involve testing a product with the prospective users. Observation,
one of the simplest usability methods, involves observing and taking notes unobtrusively
while users interact with an interface. Questionnaires, interviews and focus groups
provide insight into how users use the interface, including their likes and dislikes. One of

6
the disadvantages of these methodologies is that they do not study the interface itself;
rather they elicit the user’s opinion of it. The final method, user testing integrates the
advantages of such techniques as observation, questionnaires and interviews.
Usability inspection methods
In contrast, usability inspection methods do not involve end users. Heuristic evaluation,
one of the most frequently used techniques, involves experienced evaluators inspecting a
system and evaluating it against a set of recognized usability principles (Nielsen & Mack
L., 1994). These heuristics include using simple and natural dialogue; speaking the user’s
language; minimizing memory load and providing consistency, feedback, shortcuts, help,
documentation, good error messages and error prevention (Nielsen, 1993a; Nielsen &
Mack L., 1994). Usually, the heuristic evaluators assess the interface twice, the first
iteration focusing on the general scope and navigation structure of the product and the
second focusing on the screen layout and interaction structure in relation to pre-defined
heuristics. The severity of each usability error is then analyzed individually by the
evaluators, and a final report comparing the evaluations of the various evaluators is
prepared. In a cognitive walk-through, the interface developers evaluate the interface in
the context of core tasks typical users need to accomplish (Lewis et al., 1990; Nielsen,
1994). According to Polson et al. (1990), this methodology is best applied early in the
design stage as it examines the relationship between the task to be performed and the
feedback provided by the interface. Pluralistic walk-throughs include users, developers
and human factors experts analyzing the interface step-by-step and providing feedback on

7
each of the dialogues. Feature inspection, which involves identifying the sequence of
operations required to perform a task, is most appropriate in identifying long and
cumbersome sequences (Nielsen, 1994). A consistency inspection involves designers of
the different modules in a project analyzing the interface to ensure that it performs the
same set of actions as defined in their existing systems. A standards inspection is
conducted by a system expert who evaluates the compliance of the interface with a
standard set of requirements.
Usability Measures
The multidimensional nature of usability has resulted in the development of several
metrics to measure usability when conducting a usability test (Nielsen & Levy, 1994).
These measures assess how actual users use the product in the actual context of use and
fall under the broad categories of objective performance measures and subjective user
satisfaction measures. The former measures the capability of the user to use the system
and the latter, the user experience with the system. The most common factors measured
in a usability test include effectiveness, efficiency and satisfaction (U.S. Department of
Health & Human Services, 2002). Effectiveness deals with the ability of the users to use
a web site successfully to find information and complete the task while efficiency deals
with the user’s ability to accomplish the task quickly with ease and without frustration
and satisfaction measures how much the user enjoys using the interface. Objective
performance measures include successful task completion rates, time on a task, number
of pages viewed and analysis of the click stream. Satisfaction questionnaires, user
8
comments and preference ratings are used to capture subjective user satisfaction.
Rigorous usability tests tend to rely more on objective performance measures than on
subjective satisfaction measures (U.S. Department of Health & Human Services, 2002) .
Traditional lab usability testing methodology
Traditional lab usability testing, a type of formal evaluation where the evaluator and the
test participant are in the same place at the same time, is driven by quantitative usability
specifications using a predefined set of tasks (Whiteside, Bennett, & Holtzblatt, 1988).
This approach involves identifying individual participants representative of the product
user base and observing them as they work through tasks designed to demonstrate
product functionality. Much research has focused on determining the number of subjects
required to find the majority of the usability defects. Virzi’s (1992) three studies relating
the proportion of the usability defects identified in relation to the number of participants
found that the majority of the usability problems were identified using four to five
subjects. According to these results, most severe usability problems are identified with
the first few subjects, with the additional ones being less likely to identify new usability
defects. His findings were supported by studies conducted by Neilsen et al. (Nielsen,
2000) (Nielsen & Landauer, 1993) who suggested that the first five users will uncover
almost all of the major usability problems and the next few will find almost all of the
remaining problems. Spool et al. (2001) assert that a large number of users are required
with different backgrounds and experiences.
9
During in-lab usability testing, participants are encouraged to think-aloud during the
evaluation. Nielsen (1993b) suggests that this technique “may be the single most valuable
usability engineering method.” It asks the participants to verbalize their thoughts while
interacting with the interface, thereby facilitating identification of their common
misconceptions. Since most people will refrain from continuously verbalizing their
thoughts (Nielsen, 1992), frequently the facilitator needs to prompt the user with
questions like “What are you thinking now?” or “How do you interpret this error
message” during the test. A study conducted by Ebling et al. (2000) revealed that more
than one third of the most severe problems and more than two-thirds of the less severe
were identified using a think-aloud protocol. The advantages of this protocol include
obtaining an accurate idea of the users’ problems including doubts, irritations and other
feelings experienced by the participant while interacting with the interface. One of the
primary disadvantages of the think-aloud protocol is that time measurements for the task
will not be the same as experienced in the real usage environment since the need to
communicate reduces the efficiency of the user. To address this, the think-aloud protocol
can also be used retrospectively with the user reflecting on the task after completing it.
The traditional lab usability evaluation obtains both qualitative and quantitative data. The
quantitative data usually include the time taken to complete a task and the number of
usability defects identified. The qualitative data is collected using subjective satisfaction
questionnaires (Nielsen & Levy, 1994), as well as through verbal communication both
during and after the testing process. Since this mode of testing is considered a de facto
standard, it is used as a benchmark to compare the efficacies of various usability

10
evaluation methodologies (Landauer, 1996). Though traditional lab usability testing can
generate high quality usability problem sets, it possesses inherent drawbacks such as the
cost incurred in setting up and bringing people to the lab, lack of availability of
prospective users, and the difficulty in building a working environment similar to that of
the user (Hartson, Andre, & Williges, 2003).
11
CHAPTER THREE
REMOTE USABILITY TESTING
Because of the current impact of globalization, companies have begun developing
software products and applications for an international market. In a scenario where the
prospective users, the usability professionals and product developers are geographically
distributed, performing traditional lab usability testing is more difficult due to time, cost
and logistical constraints. To address this situation, remote usability testing, with
evaluators and users being separated in space and/or time (Castillo, Hartson, & Hix,
1998), has been proposed as a potential solution.
The research conducted by Hammontree et al. (1994) on interactive prototypes at Sun
Microsystems and Hewlett Packard is one of earliest studies to analyze the potential of
remote usability testing. They used window/application sharing, an electronic white
board, a computer-based video conferencing tool and a telephone to support the remote
usability test. The window/application sharing tool enabled real time sharing of
applications between multiple work stations, while the shared white board allowed
multiple participants to use a common drawing/writing surface simultaneously. It was
also used to provide instructions to the users on the tasks to be performed. Computer-
based video conferencing tools provided live video of the user, allowing for the
observation of visual cues like gestures and facial expressions. The shared windowing
tools and telephone supported the remote think-aloud evaluations. The shared window
facilitated the observation of the user interactions remotely. Hammontree et al. (1994)
12
suggest that the video link helped to establish a level of rapport between the participants
and observers. Computer supported collaboration technology was in the development
phase during their study. The researchers anticipated an improvement in the quality of
tools designed to support remote collaborative work.
Remote usability evaluation can either be synchronous or asynchronous (Hartson, 1996).
In synchronous remote usability testing, the test facilitator interacts in real time with the
participant at a remote location while in asynchronous remote testing, the facilitator and
observers do not have access to the data in real-time and do not interact with the
participant. Synchronous usability testing methodologies involve video conferencing or
employ remote application sharing tools like WebEx. Asynchronous methodologies
include automatic collection of user’s click streams, user logs of critical incidents that
occur while interacting with the application and subjective feedback on the interface by
users.
Types of remote evaluation
The different types to remote evaluation (H. R. Hartson et al., 1996; Krauss, 2003;
Selvaraj, 2004) are listed below:
Local evaluation at remote sites
Remote questionnaires and surveys
Remote control evaluation
Video conferencing
Instrumented remote evaluation
13
Semi-instrumented remote evaluation
Real time design walk-throughs
Local evaluation at remote sites
In general, this mode of evaluation involves contracting out the usability evaluation to a
third-party service provider. The network is used only for communication and test
material exchange, not for connecting to the remote user. This type of approach, which is
used by firms which either lack evaluation expertise or cannot afford appropriate
facilities, is remote to the developers but local to the contractor. One of the primary
disadvantages of this approach is the impact on quality due to the use of ad-hoc methods.
More specifically, remote laboratory testing methodology involves a third-party service
provider collecting quantitative and qualitative data as well as recommendations from the
users. The data along with the evaluation session video tapes are provided to the
development team for further review. Remote inspection involves developers sending the
interface design to a third-party contractor who conducts a local evaluation using ad-hoc
methods. One of the primary disadvantages of this approach is the absence of direct
observation of the user, meaning the results of the analysis are solely dependent on the
knowledge and skill of the evaluator.
Remote questionnaires and surveys
This methodology incorporates the use of software applications to collect subjective
information from the user about the interface. The software prompts for feedback when
the user triggers an event or completes a task. One of the primary advantages of this
approach is that it enables capturing the user reaction immediately. Since the subjective

14
data are dependent on the questions written by the evaluator, a holistic perspective is not
obtained by this approach, resulting in the loss of specific data for identifying usability
problems.
Remote control evaluation
In this method the evaluators have control over the remote user’s computer through web
conferencing software. An audio link is established through the computer or a separate
phone line, while the user’s interactions are captured through a screen capture program.
An advantage of this approach is that the users can participate from their work
environment, and it also has the benefit of being synchronous. On the other hand, data
capture can alternatively be either a continuous ongoing process or triggered by a
particular application. This asynchronous approach allows the evaluators the flexibility of
conducting the evaluation at their convenience.
Video Conferencing
Video conferencing allows for increased immediacy through the real-time capture of
video and audio information during a remote session. This technology enables
collaboration with geographically distributed participants and evaluators using the
network and established audio and video links. Though this approach closely resembles
traditional lab testing, its inherent disadvantages include limited bandwidth,
communication delays and low video frame rates.

15
Instrumented remote evaluation
Instrumented remote evaluation, an automated usability evaluation, monitors user actions
during the task such as click events, program usage, and task times. The application to be
evaluated is instrumented by embedding code to capture data related to user interaction
for storage as journals or logs. Evaluators employ pattern recognition techniques to
analyze these data logs to determine the location and the nature of the usability problems.
The primary advantage of this method is its automatic and accurate problem detection
capability. In addition, it does not interfere with the user’s routine work. Instrumented
remote evaluation requires human resources to review and analyze the large quantities of
collected data. As a result, it is difficult to evaluate certain usability problems effectively
using this technique.
Semi-instrumented remote evaluation/user reported critical incident method
In this asynchronous method, the users and evaluators do not interact in real time.
Hartson et al. (1998) developed and evaluated this remote usability evaluation approach
using a user reported critical incident technique, which involves the self-reporting of
critical incidents encountered while performing tasks in native working environments. In
the study conducted, participants were given training on identifying and reporting critical
events. They were asked to perform six search tasks on a web interface and to file the
critical events in an online remote evaluation report. The researchers found that the users
were in a position to recognize and report critical incidents effectively with minimal
training and the users could even rank the severity of the critical incidents and did not
16
find self-reporting to interfere with getting real work done. Castillo et al. (1998)
conducted a study analyzing the pros and cons and the effectiveness of the user reported
critical incident method to mitigate such issues as reducing the cost of the data capture
and collecting real-time fresh data. One of the primary disadvantages of this approach is
that the results rely completely on the user’s ability to accomplish the task with minimal
training.
Real-time design walk-through
This methodology defines a task for the test participant, walks the user through it, and
then collects live feedback on the interface. Usually the interface is presented using a
presentation tool, and audio communication is established through teleconferencing.
Remote usability testing tools
Though several methods have been developed for conducting a remote usability study,
each has disadvantages such as time-consuming data capture, costly data analysis,
inapplicability to users in their native work environments and the need to interact
effectively with the user during a usability evaluation. In an effort to mitigate these
issues, Winckler et al. (2000) developed an asynchronous remote usability testing method
combining the features of remote questionnaires and automatic gathering of user
interactions. This method involved obtaining real-time data from the users while they
performed specific tasks remotely. In this proposed method, the evaluator selects a task to
evaluate and launches it, inviting users to take part in the test. Data are then collected
17
using log files with the subsequent analysis using visualization tools. The typical process
involves assigning a task to the user through a questionnaire and monitoring the
navigation performed to accomplish the task. To support the methodology, these
researchers developed three tools, a monitor to describe the task to the users and capture
their inputs, a test manager to coordinate the parallel run monitors, and a visualization
tool to organize the data for further analysis. Though this method did not prove to be as
efficient as traditional lab usability testing, the log analysis method provided insight on
the process the participants adopted to complete the task assigned.
To widen the range of compatible operating systems and web browsers, Hong et al.(Hong
& Landay, 2001) built WebQuilt, a tool for enabling easy and fast capture, analysis and
visualization of web usage. This tool involves a web designer setting up the tasks and
recruiting participants to carry them out through email. The architecture of the tool
consists of a proxy logger which logs the communication between the client browser and
web server; an action inferencer which takes the log file for the session and converts it
into the actions performed by the user; and a graph merger which combines multiple lists
of actions, aggregating what multiple people did on a web site into a directed graph
where the nodes represent web pages and the edges represent page requests. The graph
layout component takes the combined graph of actions and assigns a location to each
node while the visualization component takes the results from the graph layout
component to provide an interactive display.
18
To improve the efficiency of the analysis of browser logs, Paganelli et al. (Paganelli &
Fabio, 2002), developed WebRemUSINE, a tool using the information contained in the
task model of the application. If the users perform a task that the model indicates should
follow rather precede an action, then the system logs it as a usability error. To use this
tool, first a task model of the web interface is created. Then the logged data is collected,
and the association between the logged actions and the basic tasks is defined. The second
stage is an automatic analysis in which the system examines the logged data with the
support of the task model, providing results concerning the performed tasks, the errors
and the loading time; finally, the information generated is analyzed to identify usability
problems in and improvements required by the interface design.
The majority of these early remote usability testing tools were asynchronous in nature
and did not emulate the traditional lab approach. Bartek et al. (2003) suggested that the
important features for a synchronous remote evaluation tool are the application sharing
facility, white board for sketching ideas and online chat capability. They conducted a
remote test using Lotus Sametime, a tool providing these features, with encouraging
results. Vasnaik et al. (2006) expanded this research by developing more tools using
more detailed criteria. Specifically, the criteria included features such as cost, the client
installation required, the ability of a user to access the application remotely, the colors
supported, two-way control, operating system support, session recording features and
accessibility through the firewall.

19
Effectiveness of the different synchronous remote approaches
Numerous studies have been conducted comparing the effectiveness of remote usability
testing methodologies. In an early such study, Hartson et al. (1996) compared traditional
lab usability testing to desktop video conferencing using the Kodak server pages as the
interface to be tested. In the remote approach, a telephone connection was used to
facilitate voice communication and subjective questionnaires were emailed to the remote
users. The results of their study suggest that remote evaluation using video conferencing
is feasible, producing similar results to the traditional lab approach.
A similar study was conducted by Tullis et al. (2002) in which remote tests were
conducted at the participant’s work location without real-time observation. The
traditional approach involved 8 users and the remote approach 29. In the remote
approach, an email was sent, including a link to the website explaining the purpose of
study. The participants used two windows, the first one representing the task to be
performed and the second the prototype application to be tested. User actions were
automatically recorded and analyzed. They were also provided with a subjective
questionnaire to rate the difficulty of each task. The data analyzed included successful
task completion rates, task completion times, subjective ratings and identified usability
issues. The results of the study indicated that the task completion time and task
completion rate from the two approaches were similar.
To identify the differences in the qualitative experience from the participant’s and
facilitator’s perspective, Brush et al. (2004) compared synchronous remote usability
20
testing with conventional in-lab testing using a plug-in for the integrated software
development environment Eclipse as the interface to be tested. Among the 20
participants, eight were asked to perform the task in both scenarios to facilitate a within-
group comparison. The remote method was facilitated using a Virtual Network
Computing (VNC) based screen sharing program with the audio communication being
established through a phone connection. The study revealed that there were no significant
differences in the number of usability issues identified, their types and their severities.
The participants felt that their contributions to the redesign of the interface were
approximately the same in both conditions. The facilitators thought that the effort
required to prepare for the remote studies was greater, though the methodology made
recruiting subjects easy. During the study, the facilitators indicated that it was easy to
observe the issues in the remote condition through screen sharing, while they depended
on the change in the tone of the participant’s voice to sense frustration.
Thompson et al. (2004) compared a traditional and remote approach to identify
appropriate tools and methodologies for efficient and effective remote testing
environments. In the remote approach, Microsoft NetMeeting and Snag-it were used,
with the former providing the screen sharing capability and the latter the screen capture
capability. A speaker phone was used to communicate with the remote participants. Both
the remote and the traditional lab participants were asked to perform the same five search
and shopping functions. The results suggest that there were no significant differences for
time on task and number of errors.
21
Although the results for the two approaches were similar, the disadvantages of the remote
studies include loss of control over the participant’s test environment, limited visual
feedback, session security issues, ease-of-use issues and connection and system
performance issues (Bartek & Cheatham, 2003). Dray et al. (2004), suggest that
“building trust with remote evaluations can be a real challenge”, especially in
international remote testing, where the interpersonal dynamics of the evaluation must be
managed across cultural and linguistic barriers.
22
CHAPTER FOUR
COLLABORATIVE VIRTUAL ENVIRONMENTS
Technological advances in communication and collaboration technologies have resulted
in the development of interactive virtual environments supporting different types of
collaboration for a wide range of users. These virtual worlds are three-dimensional
simulated environments in which people interact in real-time. Users access these virtual
worlds through their avatars, graphical three-dimensional self-incarnations. They are able
to engage in rich interactions with one another through text messages and immersive
audio, supported by a headset and a microphone.
According to Benford et al. (2000), the current research on technology-assisted
collaboration focuses on two areas: the work activity, seeking ways to distribute and
coordinate it across geographically distributed individuals and the work environment,
developing physical settings and computational workspaces to support collaborative
work. Research on the capabilities of virtual three dimensional environments has thus far
primarily focused on educational applications. In a recent study, De Lucia et al. (2008)
conducted lectures in a virtual classroom built in Second Life (SL) with students
participating through their avatars. They then evaluated the experience in terms of design
and context, preparation and material, and execution using the responses to
questionnaires on presence, communication, awareness and social awareness, perceived
sociability, and comfort. The results of this study indicated that the virtual environment
23
successfully supported synchronous communication and social interaction; in addition,
teachers who lectured in SL found their students to be motivated.
Greenstein et al. (2007) conducted another study investigating whether virtual
environments can be used as a supplement to text-based educational materials. A team of
students studied either tsunamis or schizophrenia through an experience in Second Life
and then with a handout. The second topic was then taught using the handout alone.
Following the learning process, the participants were given an examination on the two
topics. The results suggested that the students who were exposed to the SL experience
achieved higher exam scores and indicated that the learning experience was more
engaging than the students that were exposed to the handout alone. The authors
concluded that “virtual worlds are a useful instructional supplement to academic
readings.”
Similar studies on the effectiveness of virtual worlds for team building and training,
suggest that participants found virtual world productive, and enjoyed the virtual world
experience (Ranade & Greenstein, 2010). The studies conducted by Ozkan et al. (2009)
on identifying the potential advantages of using 3D virtual worlds for engineering design
teams relative to conventional online meeting tools and traditional meetings, too suggests
that virtual worlds could be a medium to communicate and collaborate effectively.
Studies conducted by Traum et al. (2007) focusing specifically on the potential use of SL
in engineering suggest that the engineers believed SL to be an efficient tool for design.
More recently, Kohler et al. (2009) proposed a methodology for integrating virtual world
24
residents into an interactive product development process. Their work demonstrates the
advantages of product developers working with their prospective customers to create new
products by allowing companies to find an audience to test, use, and provide feedback on
products they create.
One of the most recent developments in virtual 3D environments is the open-source
toolkit for creating virtual worlds from Sun Microsystems called Wonderland. This
application offers capabilities like high-fidelity audio communication between avatars,
shared applications and support for the conduct of virtual collaborative meetings. Sun’s
Wonderland is a multi-user environment, robust in security, scalability, reliability and
functionality that organizations can rely on as a place to conduct business (Sun
Microsystems, 2008). This tool kit is relatively new and limited research has been
conducted on it. Its integration of office tools, applications and collaborative browsers
appear to make it particularly suitable for the conduct of remote usability tests.

25
CHAPTER FIVE
RESEARCH QUESTIONS AND HYPOTHESES
Two usability test methodologies were compared to a usability test methodology using
Wonderland (WL):
1) Traditional lab usability testing (TL)
2) Remote usability testing using WebEx
WebEx, one of the most popular online meeting tools supporting collaboration, is
marketed by Cisco Systems for collaboration in business. It supports audio and
text-based communication. Using WebEx, people can meet together online and
share their desktop and software applications.
To compare the effectiveness of the online usability testing technologies WebEx and
Wonderland with traditional lab usability testing, the following research hypotheses were
tested.
Hypothesis 1:
To address the question of whether the number and severity of usability defects identified
vary in the three environments, the following null hypothesis was tested:
There will be no significant differences in the number and severity of usability defects
identified in the three environments.
26
Hypothesis 2:
To address the question of whether the time taken to complete a usability test varies in
the three environments, the following null hypothesis was tested:
There will be no significant differences in the time taken to complete usability test tasks
in the three environments.
Hypothesis 3:
To address the question of whether the experience of the usability test participant varies
among the three environments, the following null hypothesis was tested:
There will be no significant differences in the participants’ comfort level for collecting
usability test data using the three usability test methodologies.
Hypothesis 4:
To address the research question of whether the experience of the usability test facilitator
varies among the three environments, the following null hypothesis was tested:
There will be no significant differences in the preference of facilitators for the three
usability test methodologies.
The synchronous usability testing process involves extensive interaction between the test
facilitator and the test participant, as the participant performs the tasks and thinks aloud.
In Wonderland, the facilitator and participant can see one another’s avatars as they
27
interact with the in-world applications, perhaps enhancing their sense of interpersonal
interaction. Moreover, the need to upload and download documents is minimal, thus
enabling the participant to focus on his/her task, perhaps thereby increasing their
satisfaction. De Lucia et al. (2008) found that participants who are comfortable in a 3D
virtual world are motivated to perform well.

28
CHAPTER SIX
METHOD
Participants
Forty-eight students from Clemson University familiar with Internet applications were
recruited. They were screened for their academic experience with usability testing and
familiarity with the Internet. The 12 test facilitators, 10 males and 2 females, between the
ages of 24 and 40, were required to have taken courses in usability engineering while the
remaining 36, consisting of 22 males and 14 females, between the ages of 23 and 35,
served as usability test participants. These 36 were equally divided among the three
environments, 12 in a traditional lab usability test, 12 in a remote usability study using
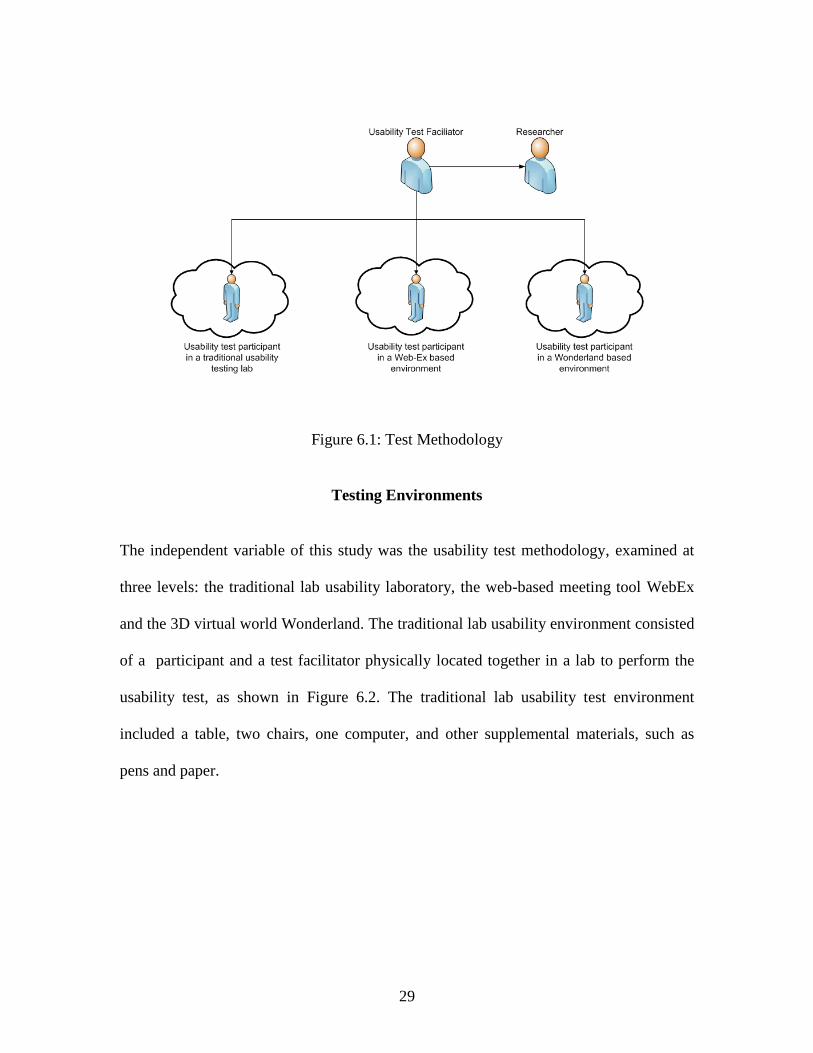
WebEx and the remaining 12 using Wonderland. The 12 test facilitators were paired with
one participant in each of the environments. Thus, each test facilitator monitored three
sessions, one in a traditional lab, one in WebEx and one in Wonderland, as shown in
Figure 6.1:
29
Figure 6.1: Test Methodology
Testing Environments
The independent variable of this study was the usability test methodology, examined at
three levels: the traditional lab usability laboratory, the web-based meeting tool WebEx
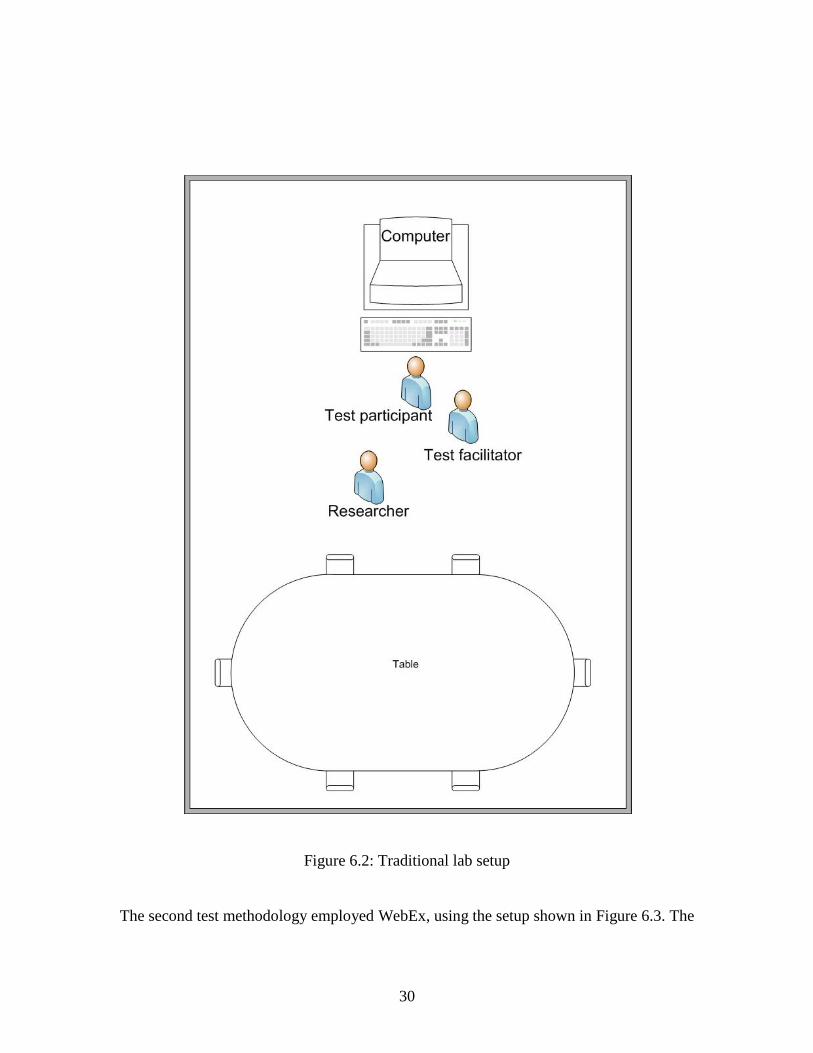
and the 3D virtual world Wonderland. The traditional lab usability environment consisted
of a participant and a test facilitator physically located together in a lab to perform the
usability test, as shown in Figure 6.2. The traditional lab usability test environment
included a table, two chairs, one computer, and other supplemental materials, such as
pens and paper.
30
Figure 6.2: Traditional lab setup
The second test methodology employed WebEx, using the setup shown in Figure 6.3. The

31
Figure 6.3 : WebEx test setup
WebEx environment provides a web browser for the participant and facilitator to share,
as shown in Figure 6.4. Two computers were provided, one for the usability test
participant and the other for the test facilitator. The participant and facilitator were
physically separated in different rooms.

32
Figure 6.4: WebEx environment
33
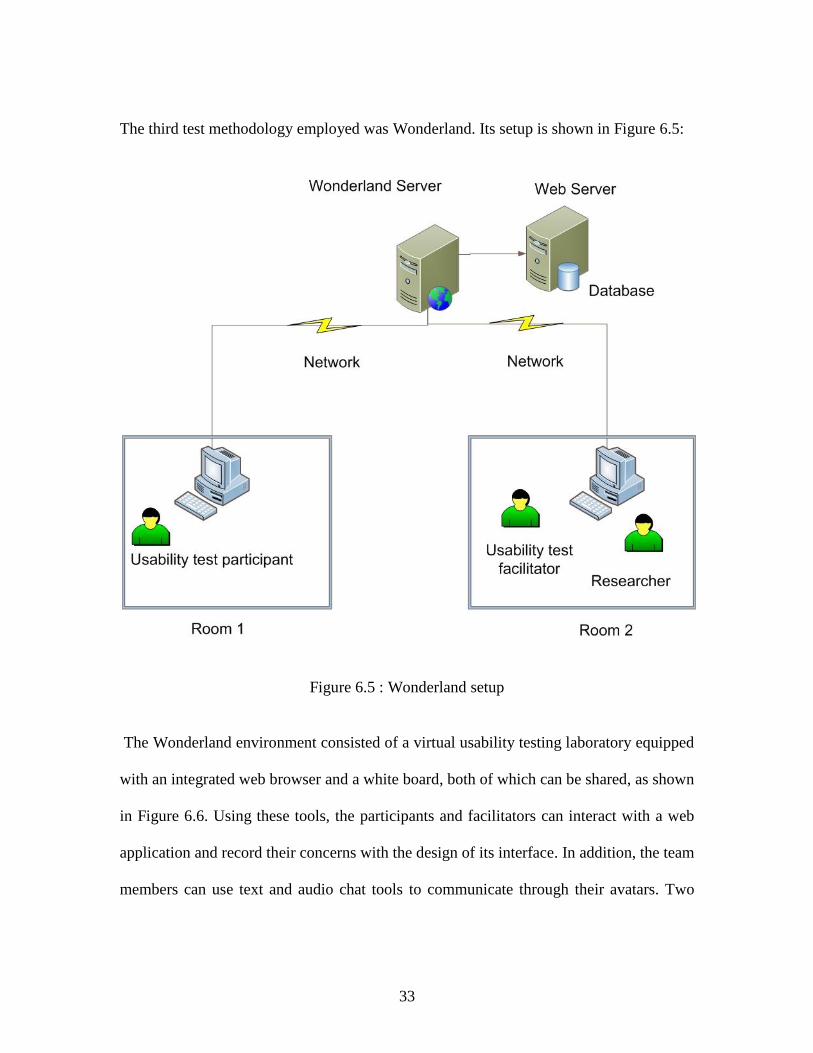
The third test methodology employed was Wonderland. Its setup is shown in Figure 6.5:
Figure 6.5 : Wonderland setup
The Wonderland environment consisted of a virtual usability testing laboratory equipped
with an integrated web browser and a white board, both of which can be shared, as shown
in Figure 6.6. Using these tools, the participants and facilitators can interact with a web
application and record their concerns with the design of its interface. In addition, the team
members can use text and audio chat tools to communicate through their avatars. Two

34
computers were provided, one for the usability test participant and the other for the test
facilitator. The participants and facilitators were physically separated in different rooms.
Figure 6.6: Wonderland environment
Tasks
An E-commerce web application modeled after Amazon was developed with usability
flaws deliberately embedded. A screen shot of the application is presented in Figure 6.7.
This application was developed using php and deployed on an Apache Tomcat web
server running the Windows XP operating system with a MySQL database providing the
35
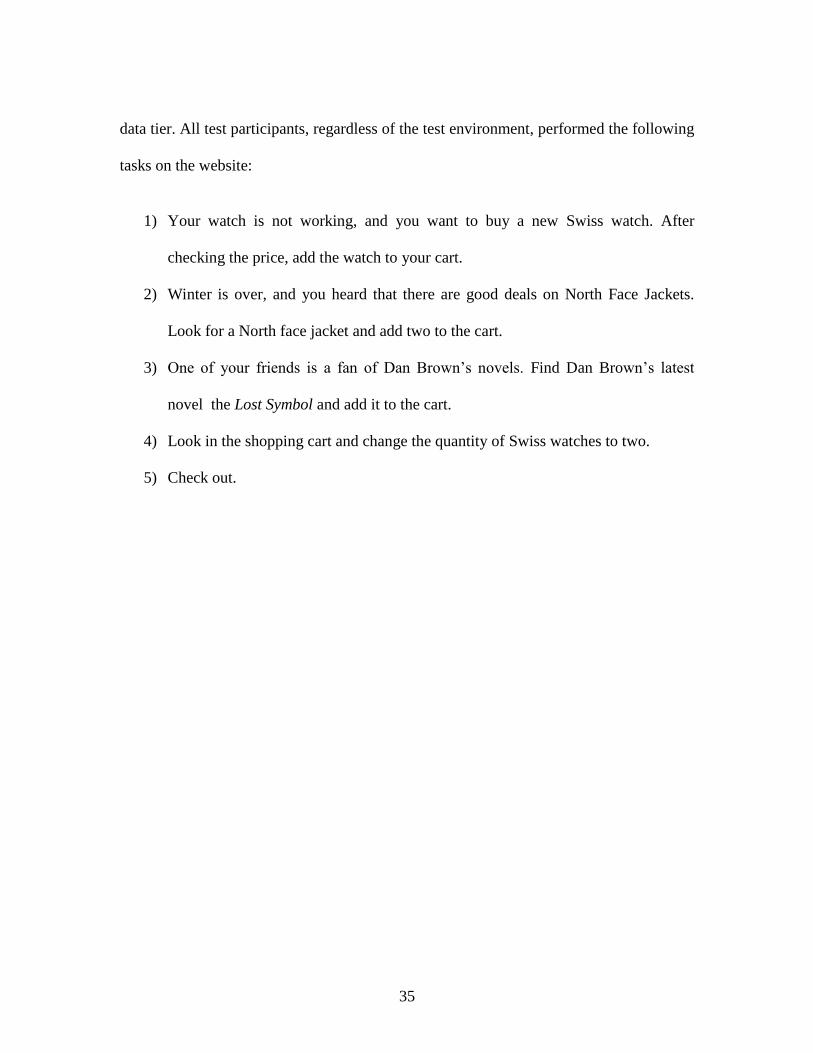
data tier. All test participants, regardless of the test environment, performed the following
tasks on the website:
1) Your watch is not working, and you want to buy a new Swiss watch. After
checking the price, add the watch to your cart.
2) Winter is over, and you heard that there are good deals on North Face Jackets.
Look for a North face jacket and add two to the cart.
3) One of your friends is a fan of Dan Brown’s novels. Find Dan Brown’s latest
novel the Lost Symbol and add it to the cart.
4) Look in the shopping cart and change the quantity of Swiss watches to two.
5) Check out.

36
Figure 6.7: E-commerce web application
After the completion of each task, the participant was asked to return to the e-commerce
site’s home page.
Experimental Design
The study used a mixed experimental design, with the test facilitators observing the test
participants’ interactions with the web interface in a within subjects design and the test
participants experiencing the test environment in a between-subjects design. The within
37
subject experimental design involves collecting data from the test facilitators who
facilitates tests in each of the three environments. The between-subjects experimental
design involves collecting data from test participants in one test environment and
comparing this data with those from the participants in the other environments, with the
constraint that data from an individual participant is collected in only one test
environment. The experiment was counter-balanced using a Latin-square design, such
that two test facilitators conducted the usability test session first with the traditional lab
method, then with WebEx and finally with Wonderland and two test facilitators
conducted the usability test sessions in each of five remaining possible orders.
Procedure
Irrespective of the usability testing environment, the facilitators and test participants
followed the same procedure. Initially all the usability test facilitators were trained on
how to conduct the usability test. Steve Krug’s usability test demonstration video was
used for this purpose as well as to refresh the facilitators’ memories on the material in the
usability engineering class that they had taken (Krug, 2009). At the beginning of each test
session, the researcher greeted the test facilitator and the participant in a classroom and
gave them a brief overview of the study. Then, the test facilitators were asked to read and
sign the consent form found in Appendix A and to complete the pre-test questionnaire,
asking for their basic demographic information, as seen in Appendix B. The test
participant was asked to read and sign the consent form found in Appendix C and to
complete the pre-test questionnaire in Appendix D to obtain their basic demographic

38
information and their experience with relevant Internet technologies. Next, the facilitators
were provided a list of tasks to be performed; including instructions on the scenarios the
participant would experience using the web interface.
The facilitator and participant were then taken to their respective usability testing rooms
and given a brief training session of approximately ten minutes to acquaint them with the
environment. The test facilitator then gave the participant a sample task to familiarize
him/her with the nature of the web application to be used during the test session. Next,
the facilitator interacted with the participant as in a typical usability test session, asking
him/her to complete the individual tasks. The researcher was co-located with the
facilitator and recorded the time taken for each task using a stop watch. After each task,
the test participant was asked to detail his/her concerns while interacting with the
interface in a retrospective think-aloud session. The researcher recorded the concerns
raised and Camtasia, the screen capture software, was used to record all screen and audio
activity during both the task and the think-aloud session.
Upon completing the final task and think-aloud session, the participant and test facilitator
completed the NASA-TLX test and the presence questionnaire (Witmer, 1998), found in
Appendix E. The test participants also completed a post-test subjective questionnaire
comprised of three sections concerning their satisfaction with the usability testing
methodology, as seen in Appendix 7. The section on the effect of the environment
assessed the quality of the test environment. The user satisfaction portion evaluated the
perceived ease-of-use while performing the tasks, including how comfortable and
39
confident participants felt in conducting the usability task and detecting the usability
defects. The section on the quality of the collaborative usability test methodology
assessed the perceived level of presence and co-presence in the test environment. The
participants ranked each metric using a 7-point Likert scale, ranging from 1 (Strongly
Disagree) to 7 (Strongly Agree). Finally, the questionnaire contained a section for written
comments. Then the participants were de-briefed by the researcher. The time taken for
each session was approximately one hour. Once the test facilitators completed the three
sessions in the three environments, they completed a post-test questionnaire assessing
their satisfaction with the three usability testing methodologies shown in Appendix 8 and
they were de-briefed.
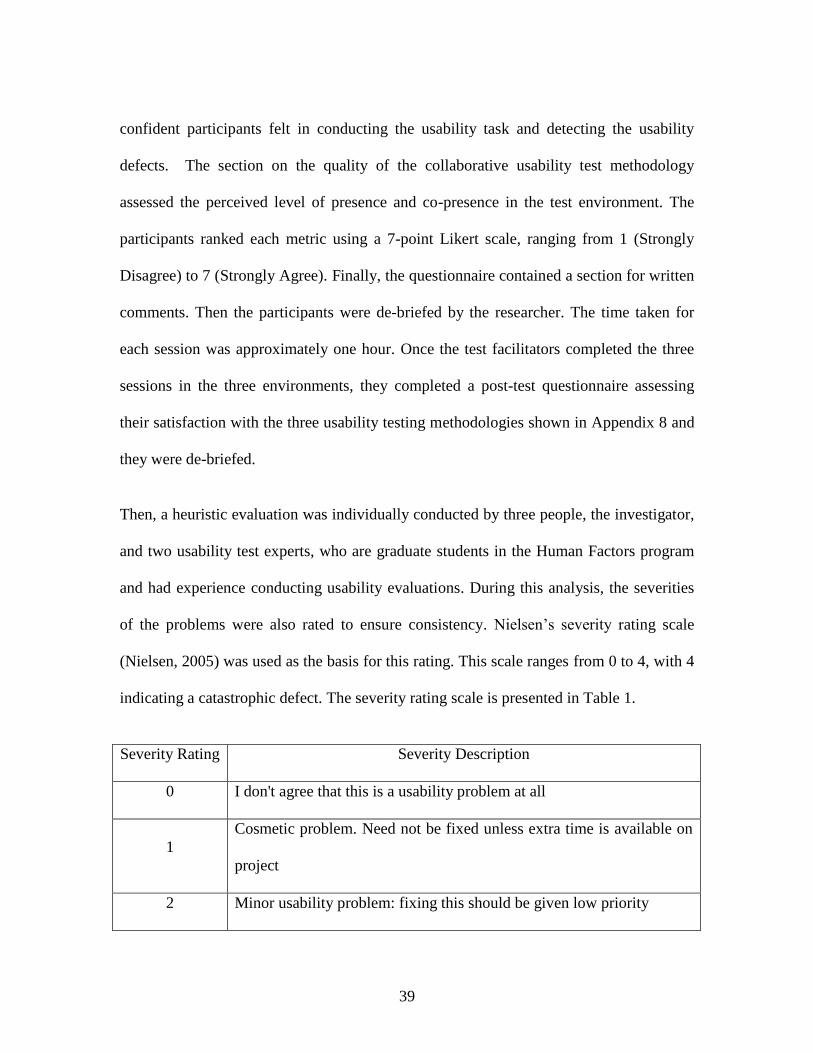
Then, a heuristic evaluation was individually conducted by three people, the investigator,
and two usability test experts, who are graduate students in the Human Factors program
and had experience conducting usability evaluations. During this analysis, the severities
of the problems were also rated to ensure consistency. Nielsen’s severity rating scale
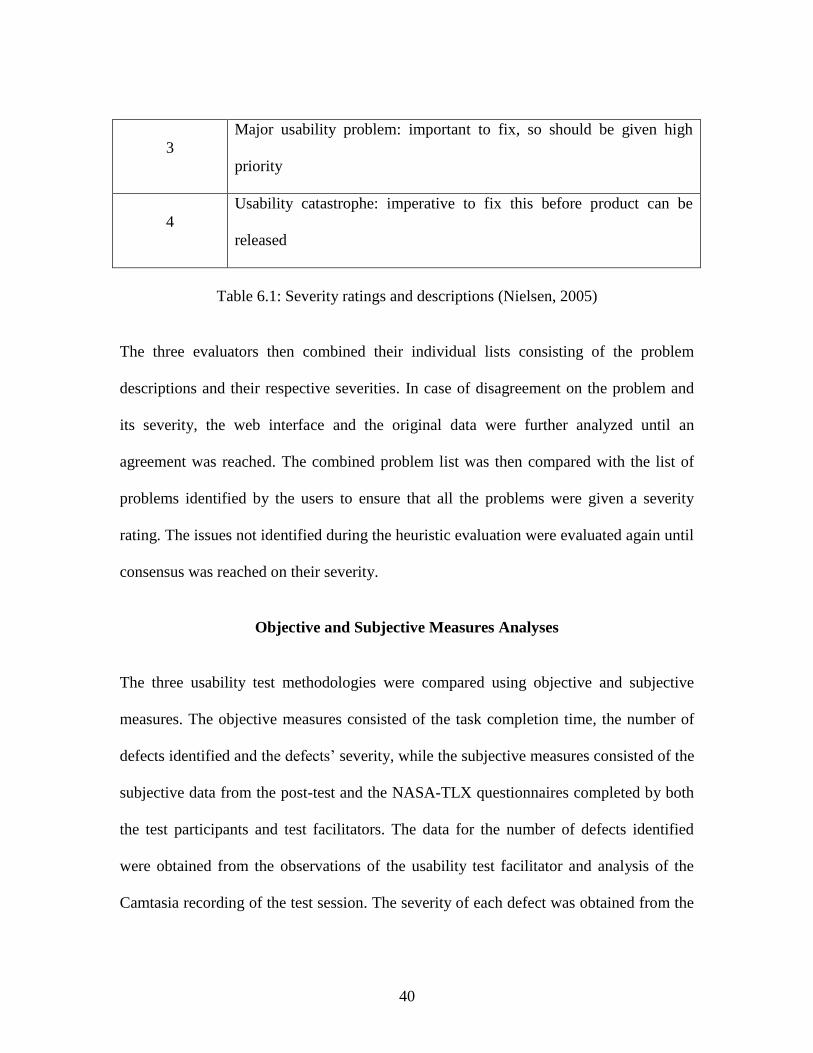
(Nielsen, 2005) was used as the basis for this rating. This scale ranges from 0 to 4, with 4
indicating a catastrophic defect. The severity rating scale is presented in Table 1.
Severity Rating Severity Description
0 I don't agree that this is a usability problem at all
1
Cosmetic problem. Need not be fixed unless extra time is available on
project
2 Minor usability problem: fixing this should be given low priority
40
3
Major usability problem: important to fix, so should be given high
priority
4
Usability catastrophe: imperative to fix this before product can be
released
Table 6.1: Severity ratings and descriptions (Nielsen, 2005)
The three evaluators then combined their individual lists consisting of the problem
descriptions and their respective severities. In case of disagreement on the problem and
its severity, the web interface and the original data were further analyzed until an
agreement was reached. The combined problem list was then compared with the list of
problems identified by the users to ensure that all the problems were given a severity
rating. The issues not identified during the heuristic evaluation were evaluated again until
consensus was reached on their severity.
Objective and Subjective Measures Analyses
The three usability test methodologies were compared using objective and subjective
measures. The objective measures consisted of the task completion time, the number of
defects identified and the defects’ severity, while the subjective measures consisted of the
subjective data from the post-test and the NASA-TLX questionnaires completed by both
the test participants and test facilitators. The data for the number of defects identified
were obtained from the observations of the usability test facilitator and analysis of the
Camtasia recording of the test session. The severity of each defect was obtained from the
41
heuristic evaluation data provided by the usability experts. Task completion time was the
time taken to complete each task.
The data collected were classified into the following two sets:
1. Dataset of test participants, which consisted of 36 datasets, 12 for each condition
2. Dataset of test facilitators, which consisted of 12 datasets.
Each usability test participant dataset was given a unique identifier and evaluated
individually. The evaluation of each dataset was conducted by performing a thorough
walkthrough of the videos and analyzing the pre-test, the NASA-TLX and the post-test
subjective questionnaires. During the video analysis, the problems raised by the users
were carefully evaluated and tabulated. The usability test facilitator datasets, which were
also given unique identifiers, were analyzed based on the data from the pre-test and post-
test questionnaires.
SPSS 17.0 was used to analyze the data. Initially, a normality test was conducted to
determine whether the data followed a normal distribution. The subjective and objective
data more or less followed a normal distribution. Hence, they were analyzed using a one-
way ANOVA with a 95% confidence interval to determine the presence of significant
differences, if any, among the test environments. If the null hypothesis of an ANOVA
was rejected, the results were then subjected to a post-hoc least significance difference
(LSD) test to determine the locus of the significant differences.
42
CHAPTER SEVEN
RESULTS
In this section, the three usability testing environments are compared with respect to the
time taken to complete the tasks; the usability issues identified; the severity of these
usability issues; and the subjective ratings from the NASA-TLX, the presence and post-
test subjective questionnaires.
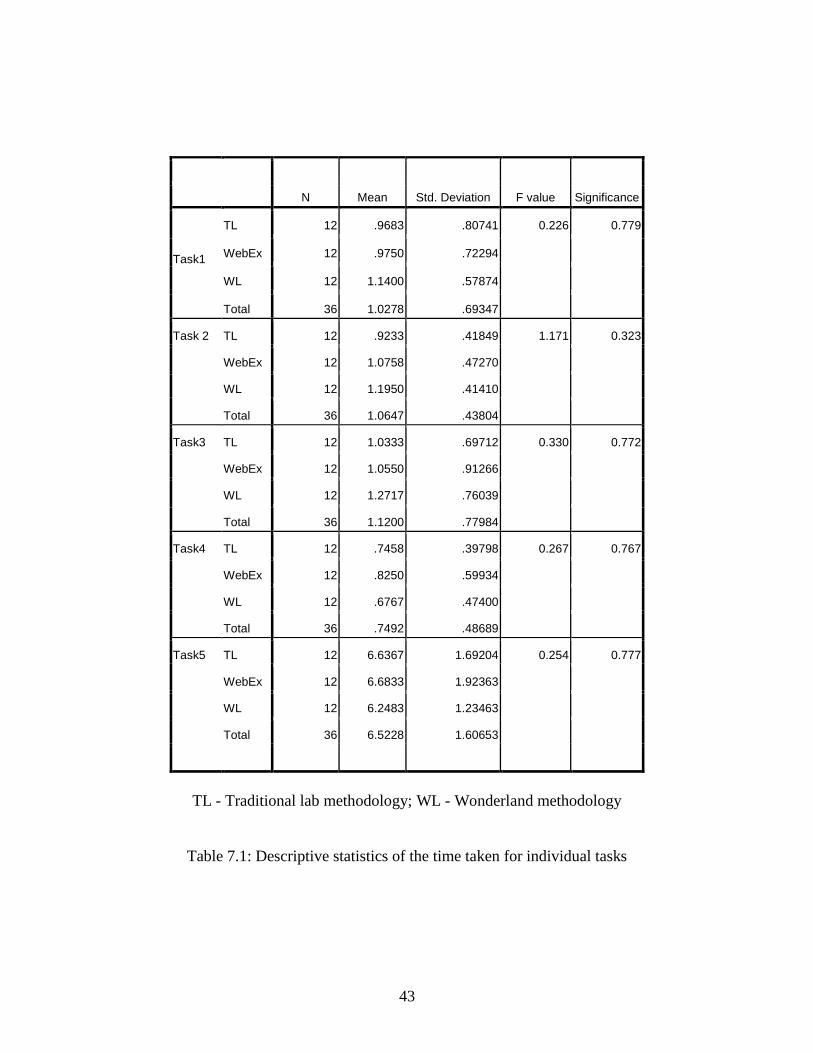
Time taken to complete the task
The time taken to complete the task was measured from the time the task was given to the
participants to the time when they completed it by clicking the appropriate task
completion button. The descriptive statistics for this metric are provided in Table 7.1. The
task completion times are plotted in Figure 7.1.
43
N Mean Std. Deviation F value Significance
Task1
TL 12 .9683 .80741 0.226 0.779
WebEx 12 .9750 .72294
WL 12 1.1400 .57874
Total 36 1.0278 .69347
Task 2 TL 12 .9233 .41849 1.171 0.323
WebEx 12 1.0758 .47270
WL 12 1.1950 .41410
Total 36 1.0647 .43804
Task3 TL 12 1.0333 .69712 0.330 0.772
WebEx 12 1.0550 .91266
WL 12 1.2717 .76039
Total 36 1.1200 .77984
Task4 TL 12 .7458 .39798 0.267 0.767
WebEx 12 .8250 .59934
WL 12 .6767 .47400
Total 36 .7492 .48689
Task5 TL 12 6.6367 1.69204 0.254 0.777
WebEx 12 6.6833 1.92363
WL 12 6.2483 1.23463
Total 36 6.5228 1.60653
TL - Traditional lab methodology; WL - Wonderland methodology
Table 7.1: Descriptive statistics of the time taken for individual tasks
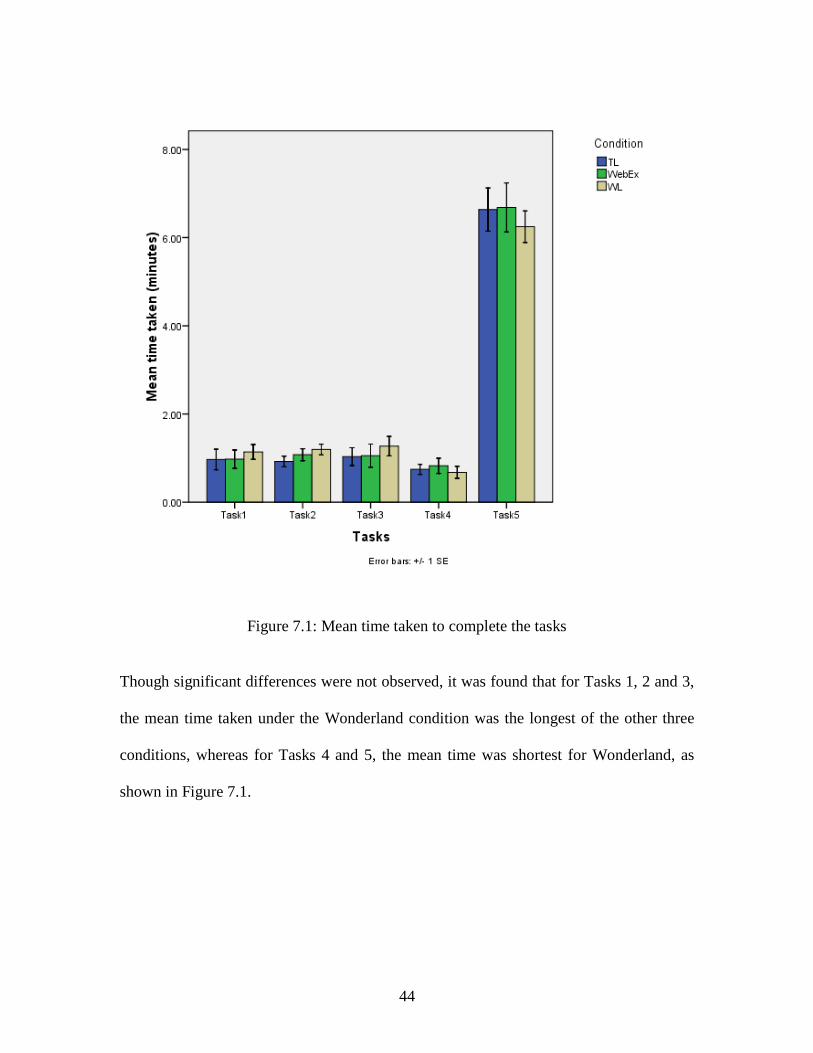
44
Figure 7.1: Mean time taken to complete the tasks
Though significant differences were not observed, it was found that for Tasks 1, 2 and 3,
the mean time taken under the Wonderland condition was the longest of the other three
conditions, whereas for Tasks 4 and 5, the mean time was shortest for Wonderland, as
shown in Figure 7.1.
45
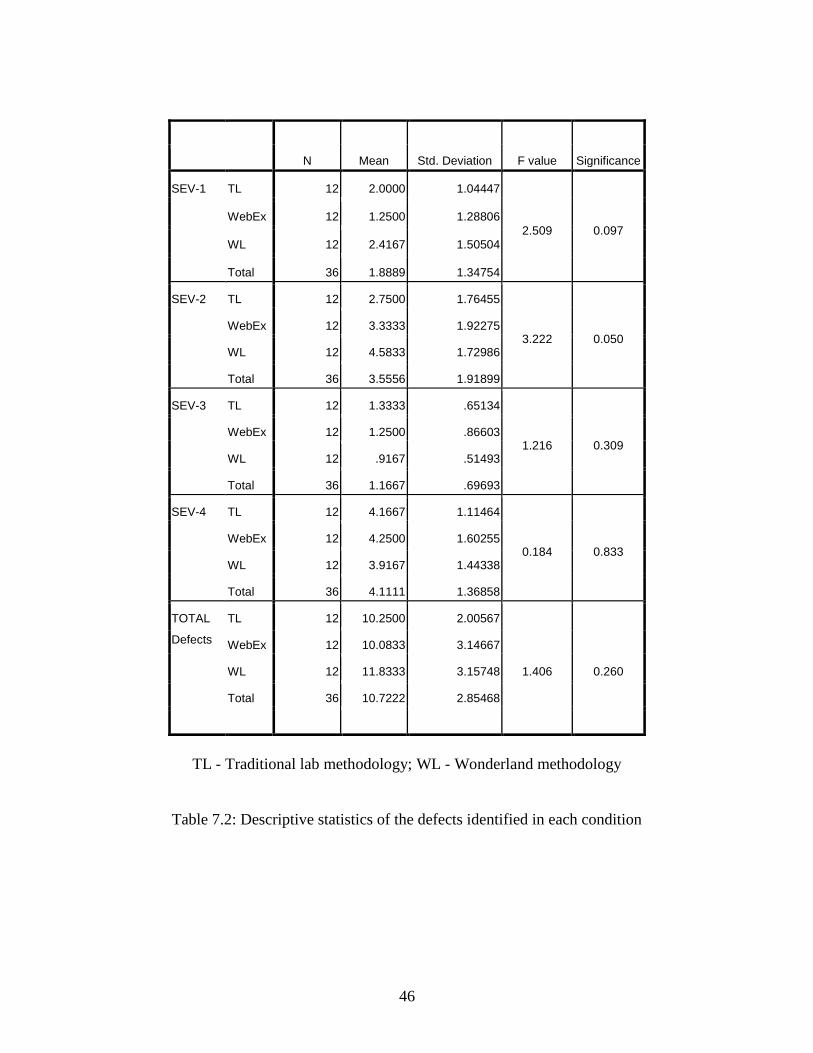
Number of usability problems identified
The effect of usability test environment on the total number of usability defects
identified, was not significant, F (2, 33) = 1.406, p=0.260. The descriptive statistics for
the total number of defects identified, number of Severity 1 defects, number of Severity 2
defects, number of Severity 3 defects and number of Severity 4 defects are provided in
Table 7.2. The mean numbers of defects are plotted in Figure 7.2.
46
N Mean Std. Deviation F value Significance
SEV-1 TL 12 2.0000 1.04447
2.509 0.097
WebEx 12 1.2500 1.28806
WL 12 2.4167 1.50504
Total 36 1.8889 1.34754
SEV-2 TL 12 2.7500 1.76455
3.222 0.050 WebEx 12 3.3333 1.92275
WL 12 4.5833 1.72986
Total 36 3.5556 1.91899
SEV-3 TL 12 1.3333 .65134
1.216 0.309 WebEx 12 1.2500 .86603
WL 12 .9167 .51493
Total 36 1.1667 .69693
SEV-4 TL 12 4.1667 1.11464
0.184 0.833 WebEx 12 4.2500 1.60255
WL 12 3.9167 1.44338
Total 36 4.1111 1.36858
TOTAL
Defects
TL 12 10.2500 2.00567
1.406 0.260
WebEx 12 10.0833 3.14667
WL 12 11.8333 3.15748
Total 36 10.7222 2.85468
TL - Traditional lab methodology; WL - Wonderland methodology
Table 7.2: Descriptive statistics of the defects identified in each condition
47
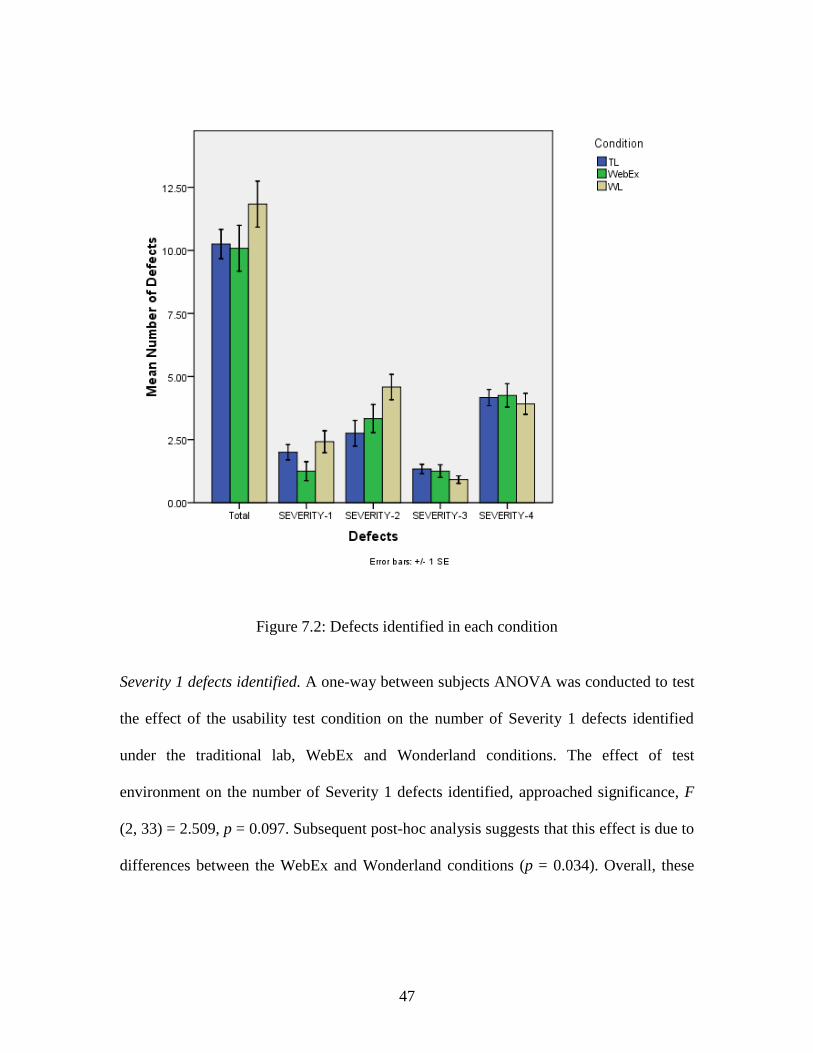
Figure 7.2: Defects identified in each condition
Severity 1 defects identified. A one-way between subjects ANOVA was conducted to test
the effect of the usability test condition on the number of Severity 1 defects identified
under the traditional lab, WebEx and Wonderland conditions. The effect of test
environment on the number of Severity 1 defects identified, approached significance, F
(2, 33) = 2.509, p = 0.097. Subsequent post-hoc analysis suggests that this effect is due to
differences between the WebEx and Wonderland conditions (p = 0.034). Overall, these
48
results suggest that a higher number of Severity 1 defects were identified in the
Wonderland condition than in the WebEx condition.
Severity 2 defects identified. A one-way between subjects ANOVA was conducted to test
the effect of the usability test condition on the number of Severity 2 defects identified
under traditional lab, WebEx and Wonderland conditions. The effect of test environment
on the number of Severity 2 issues identified approached significance, F (2, 33) = 3.222,
p=0.050. Subsequent post-hoc analysis reveals that there is a significant difference in the
number of Severity 2 defects identified for the traditional lab and Wonderland condition
(p = 0.018). A higher number of severity 2 defects were identified in the Wonderland
condition than in the traditional lab condition.
Severity 3 defects identified. A one-way between subjects ANOVA was conducted to test
the effect of the usability test condition on the number of Severity 3 defects identified
under traditional lab, WebEx and Wonderland conditions. The effect was not significant,
F (2, 33) = 1.216, p=0.309.
Severity 4 defects identified. A one-way between subjects ANOVA was conducted to test
the effect of the usability test condition on the number of severity 4 defects identified
under traditional lab, WebEx and Wonderland conditions. The effect was not significant,
F (2, 33) = 1.406, p=0.260.
49
Test participants’ experience
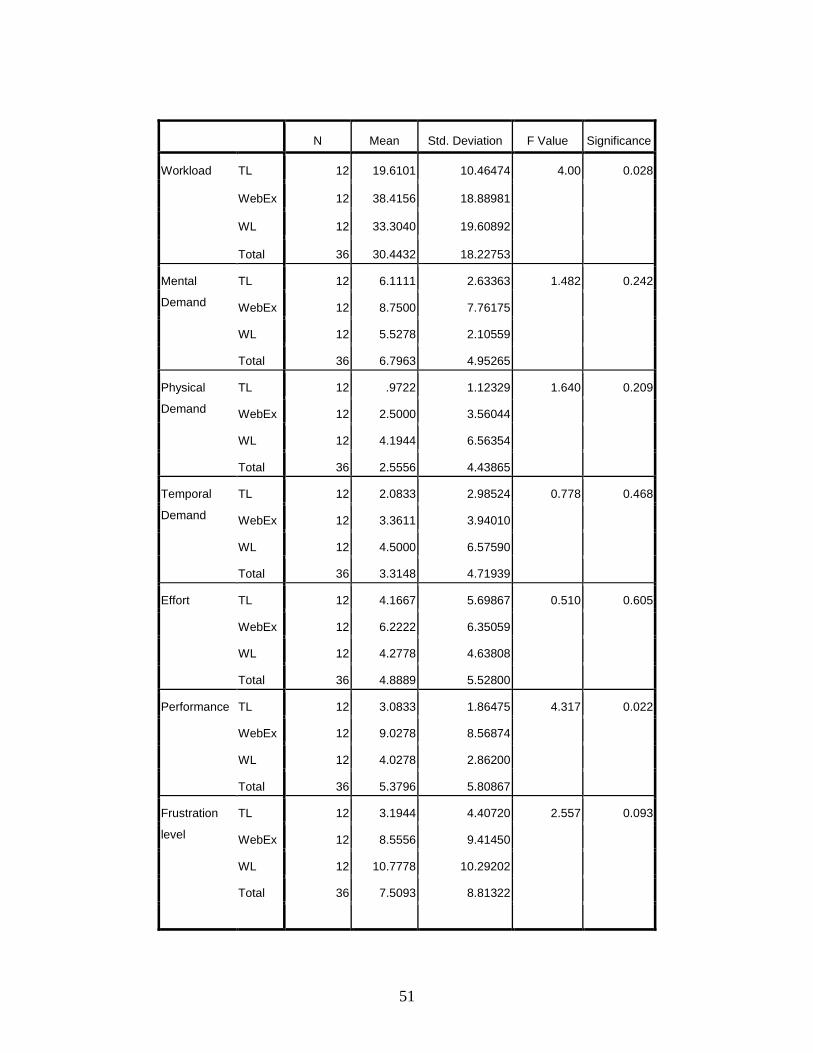
NASA-TLX Workload Indices:
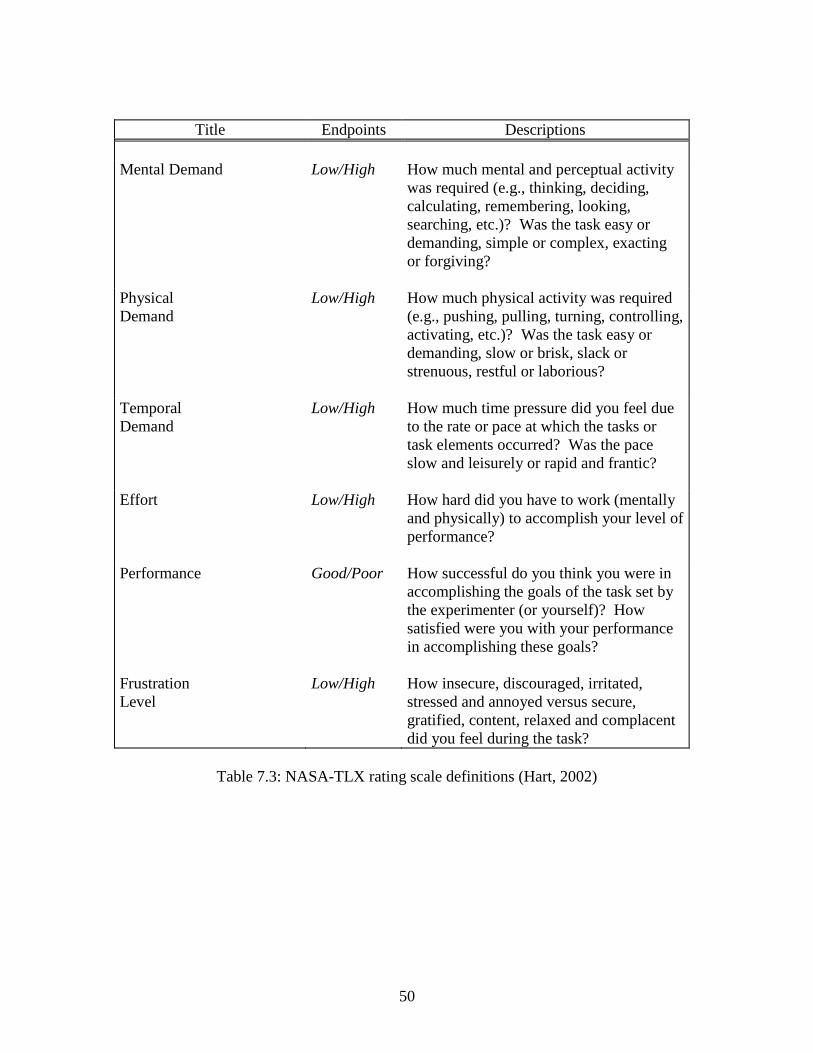
The NASA-TLX is a subjective workload assessment instrument, which derives the total
workload based on the weighted average ratings of the six subscales of mental demand,
physical demand, temporal demand, effort, performance and frustration. The description
of each subscale is provided in Table 7.3. The descriptive statistics for the NASA-TLX
metrics are shown in Table 7.4. The mean values for the workload indices are plotted in
Figure 7.3.
50
Title Endpoints Descriptions
Mental Demand Low/High How much mental and perceptual activity
was required (e.g., thinking, deciding,
calculating, remembering, looking,
searching, etc.)? Was the task easy or
demanding, simple or complex, exacting
or forgiving?
Physical
Demand
Low/High How much physical activity was required
(e.g., pushing, pulling, turning, controlling,
activating, etc.)? Was the task easy or
demanding, slow or brisk, slack or
strenuous, restful or laborious?
Temporal
Demand
Low/High How much time pressure did you feel due
to the rate or pace at which the tasks or
task elements occurred? Was the pace
slow and leisurely or rapid and frantic?
Effort Low/High How hard did you have to work (mentally
and physically) to accomplish your level of
performance?
Performance Good/Poor How successful do you think you were in
accomplishing the goals of the task set by
the experimenter (or yourself)? How
satisfied were you with your performance
in accomplishing these goals?
Frustration
Level
Low/High How insecure, discouraged, irritated,
stressed and annoyed versus secure,
gratified, content, relaxed and complacent
did you feel during the task?
Table 7.3: NASA-TLX rating scale definitions (Hart, 2002)
51
N Mean Std. Deviation F Value Significance
Workload TL 12 19.6101 10.46474 4.00 0.028
WebEx 12 38.4156 18.88981
WL 12 33.3040 19.60892
Total 36 30.4432 18.22753
Mental
Demand
TL 12 6.1111 2.63363 1.482 0.242
WebEx 12 8.7500 7.76175
WL 12 5.5278 2.10559
Total 36 6.7963 4.95265
Physical
Demand
TL 12 .9722 1.12329 1.640 0.209
WebEx 12 2.5000 3.56044
WL 12 4.1944 6.56354
Total 36 2.5556 4.43865
Temporal
Demand
TL 12 2.0833 2.98524 0.778 0.468
WebEx 12 3.3611 3.94010
WL 12 4.5000 6.57590
Total 36 3.3148 4.71939
Effort TL 12 4.1667 5.69867 0.510 0.605
WebEx 12 6.2222 6.35059
WL 12 4.2778 4.63808
Total 36 4.8889 5.52800
Performance TL 12 3.0833 1.86475 4.317 0.022
WebEx 12 9.0278 8.56874
WL 12 4.0278 2.86200
Total 36 5.3796 5.80867
Frustration
level
TL 12 3.1944 4.40720 2.557 0.093
WebEx 12 8.5556 9.41450
WL 12 10.7778 10.29202
Total 36 7.5093 8.81322
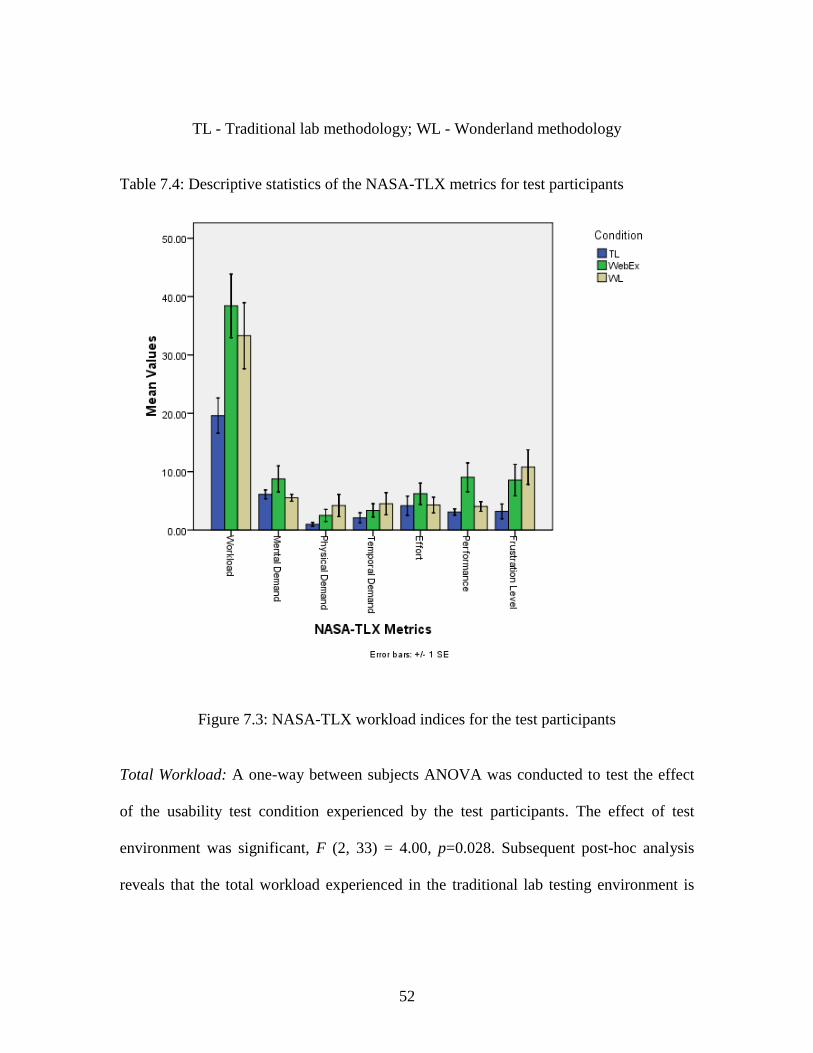
52
TL - Traditional lab methodology; WL - Wonderland methodology
Table 7.4: Descriptive statistics of the NASA-TLX metrics for test participants
Figure 7.3: NASA-TLX workload indices for the test participants
Total Workload: A one-way between subjects ANOVA was conducted to test the effect
of the usability test condition experienced by the test participants. The effect of test
environment was significant, F (2, 33) = 4.00, p=0.028. Subsequent post-hoc analysis
reveals that the total workload experienced in the traditional lab testing environment is

53
lower than that experienced in WebEx (p = 0.010) and Wonderland (p = 0.055)
conditions.
Mental Demand: A one-way between subjects ANOVA was conducted to test the effect
of the usability test condition on the mental demand experienced by the participants. The
effect was not significant, F (2,33) = 1.482, p = 0.242.
Physical Demand: A one-way between subjects ANOVA was conducted to test the effect
of the usability test condition on the physical demand experienced by the participants.
The effect was not significant, F (2, 33) = 1.640, p = 0.209.
Temporal Demand: A one-way between subjects ANOVA was conducted to test the
effect of the usability test condition on the temporal demand experienced by the
participants. The effect was not significant, F (2, 33) = 0.778, p = 0.468.
Effort: A one-way between subjects ANOVA was conducted to test the effect of the
usability test condition on the effort required by the participants. The effect was not
significant, F (2,33) = 0.510, p = 0.605.
Performance: A one-way between subjects ANOVA was conducted to test the effect of
the usability test condition on the performance component of the NASA-TLX workload
index. The effect of test environment on the performance component was significant, F
(2,33) = 4.317, p=0.022. Subsequent post-hoc analysis reveals that the performance
component of workload was higher in the WebEx test environment than in either the
traditional lab (p=0.010) or the Wonderland (p=0.028) test environments.
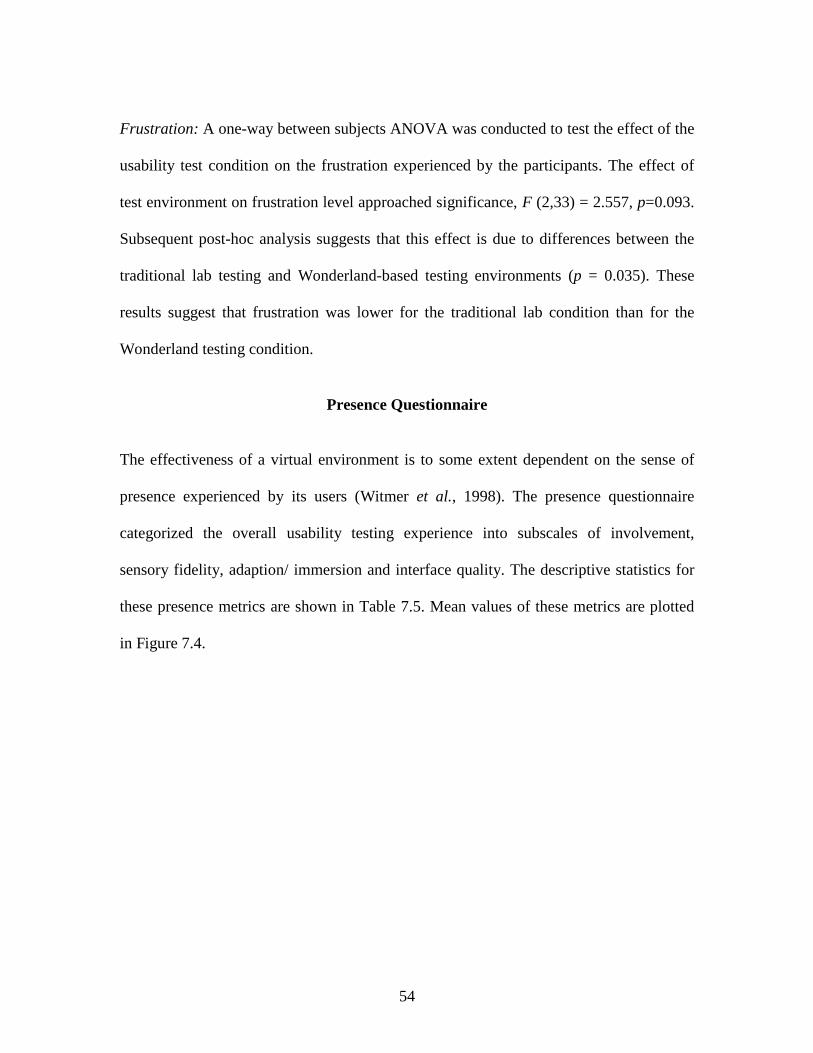
54
Frustration: A one-way between subjects ANOVA was conducted to test the effect of the
usability test condition on the frustration experienced by the participants. The effect of
test environment on frustration level approached significance, F (2,33) = 2.557, p=0.093.
Subsequent post-hoc analysis suggests that this effect is due to differences between the
traditional lab testing and Wonderland-based testing environments (p = 0.035). These
results suggest that frustration was lower for the traditional lab condition than for the
Wonderland testing condition.
Presence Questionnaire
The effectiveness of a virtual environment is to some extent dependent on the sense of
presence experienced by its users (Witmer et al., 1998). The presence questionnaire
categorized the overall usability testing experience into subscales of involvement,
sensory fidelity, adaption/ immersion and interface quality. The descriptive statistics for
these presence metrics are shown in Table 7.5. Mean values of these metrics are plotted
in Figure 7.4.
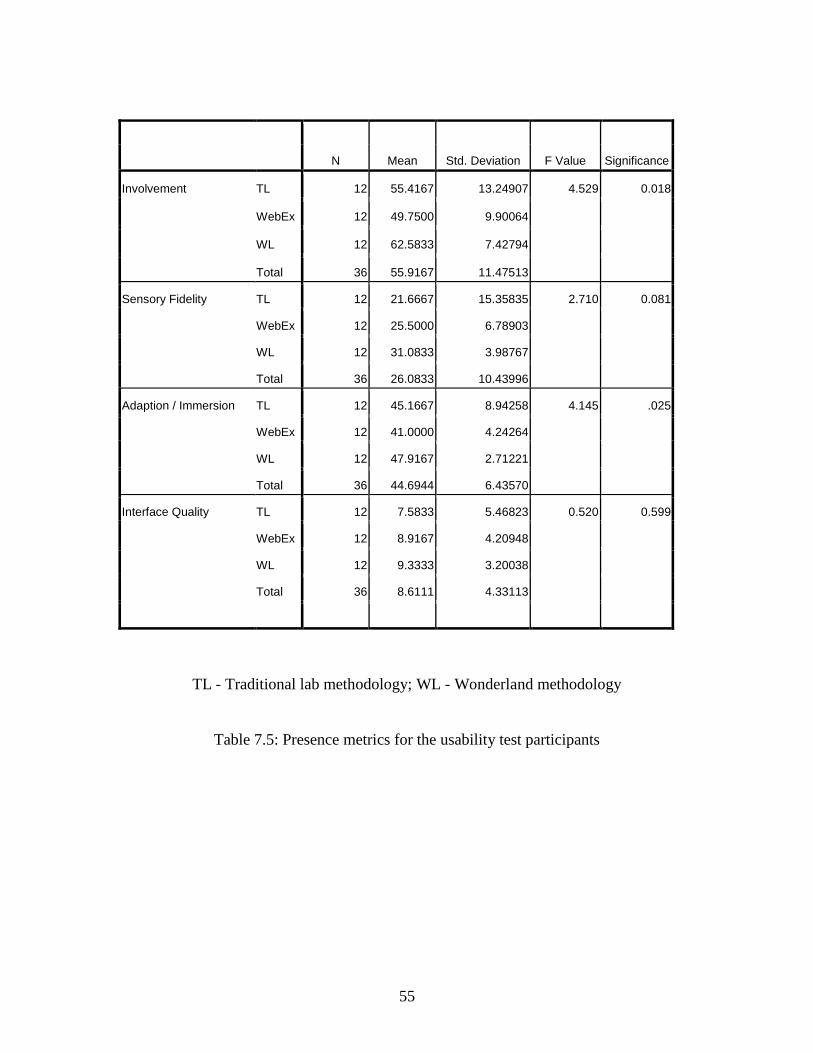
55
N Mean Std. Deviation F Value Significance
Involvement TL 12 55.4167 13.24907 4.529 0.018
WebEx 12 49.7500 9.90064
WL 12 62.5833 7.42794
Total 36 55.9167 11.47513
Sensory Fidelity TL 12 21.6667 15.35835 2.710 0.081
WebEx 12 25.5000 6.78903
WL 12 31.0833 3.98767
Total 36 26.0833 10.43996
Adaption / Immersion TL 12 45.1667 8.94258 4.145 .025
WebEx 12 41.0000 4.24264
WL 12 47.9167 2.71221
Total 36 44.6944 6.43570
Interface Quality TL 12 7.5833 5.46823 0.520 0.599
WebEx 12 8.9167 4.20948
WL 12 9.3333 3.20038
Total 36 8.6111 4.33113
TL - Traditional lab methodology; WL - Wonderland methodology
Table 7.5: Presence metrics for the usability test participants
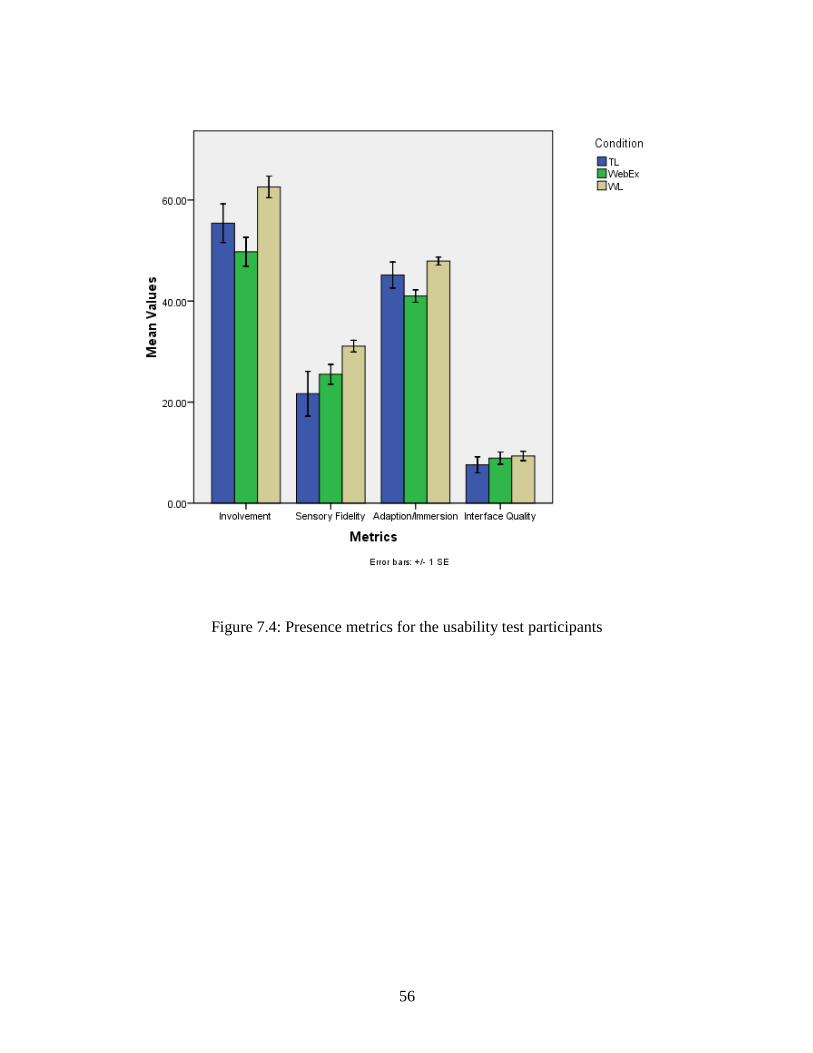
56
Figure 7.4: Presence metrics for the usability test participants
57
Involvement: A one-way between subjects ANOVA was conducted to test the effect of
usability test environment on this metric. The effect of test environment on involvement
was significant, F (2, 33) = 4.529, p = 0.018. Subsequent post-hoc analysis reveals that
there is a significant difference between the WebEx and Wonderland testing conditions (p
= 0.005). Test participants experienced a lower level of involvement in the WebEx
condition than in the Wonderland condition.
Sensory Fidelity: A one-way between subjects ANOVA was conducted to test the effect
of the usability test environment on the sensory fidelity experienced by the usability test
participants. The effect of test environment on sensory fidelity was not significant, F (2,
33) = 2.710, p = 0.081.
Adaption/ Immersion: A one-way between subjects ANOVA was conducted to test the
effect of the usability test environment on this metric. The effect was significant, F (2,33)
= 4.145 p=0.025. Subsequent post-hoc analysis reveals that there is a significant
difference in adaption/immersion for the WebEx and Wonderland (p=0.007) testing
conditions. Participants achieved a higher level of immersion in the Wonderland
environment than in the WebEx environment.
Interface Quality: A one-way between subjects ANOVA was conducted to test the effect
of the usability test environment on the participants’ perception of the quality of the
interface. The effect was not significant, F (2, 33) = 0.520, p=0.599.
58
Post-test subjective questionnaire
The subjective rating questionnaire totalled 15 questions, 4 asking about the naturalness
of the environment, 5 asking about the satisfaction with and ease-of-use of the usability
testing methodology and 6 questions on the quality of the usability test methodology, as
shown in Table 7.6. The mean value was calculated for each of these categories. The
descriptive statistics for each category are shown in Table 7.7. Mean values are plotted in
Figure 7.5.
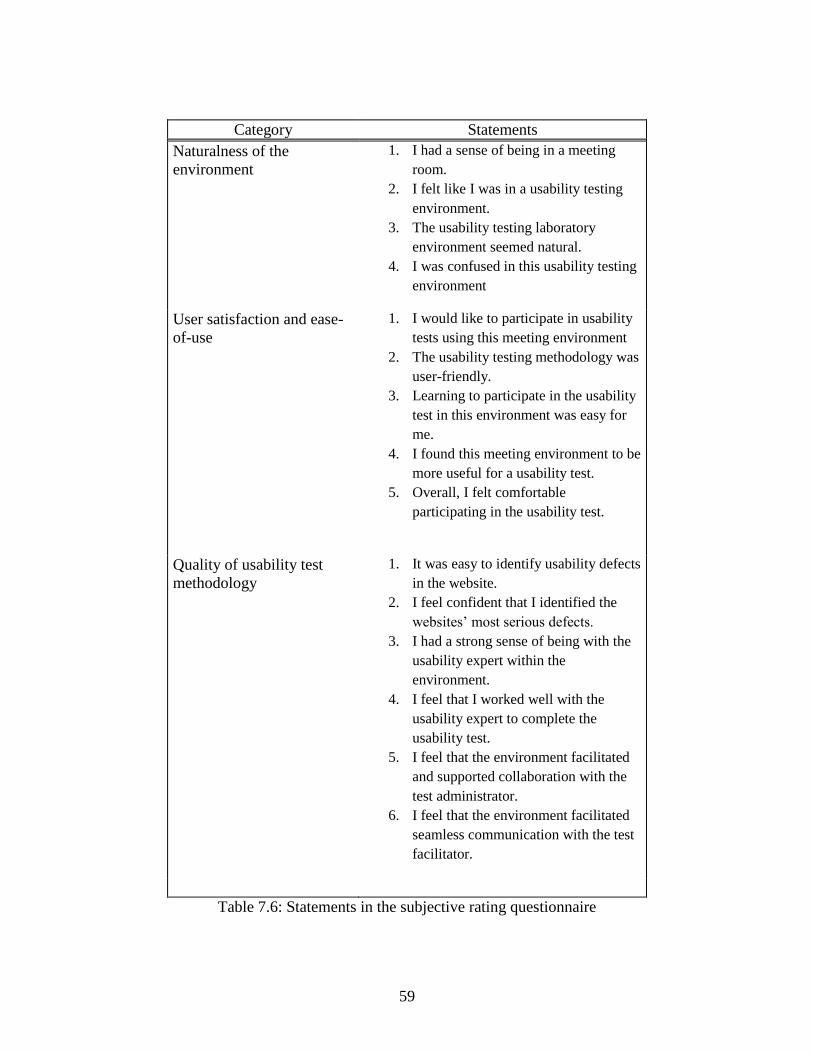
59
Category Statements
Naturalness of the
environment
1. I had a sense of being in a meeting
room.
2. I felt like I was in a usability testing
environment.
3. The usability testing laboratory
environment seemed natural.
4. I was confused in this usability testing
environment
User satisfaction and ease-
of-use
1. I would like to participate in usability
tests using this meeting environment
2. The usability testing methodology was
user-friendly.
3. Learning to participate in the usability
test in this environment was easy for
me.
4. I found this meeting environment to be
more useful for a usability test.
5. Overall, I felt comfortable
participating in the usability test.
Quality of usability test
methodology
1. It was easy to identify usability defects
in the website.
2. I feel confident that I identified the
websites’ most serious defects.
3. I had a strong sense of being with the
usability expert within the
environment.
4. I feel that I worked well with the
usability expert to complete the
usability test.
5. I feel that the environment facilitated
and supported collaboration with the
test administrator.
6. I feel that the environment facilitated
seamless communication with the test
facilitator.
Table 7.6: Statements in the subjective rating questionnaire
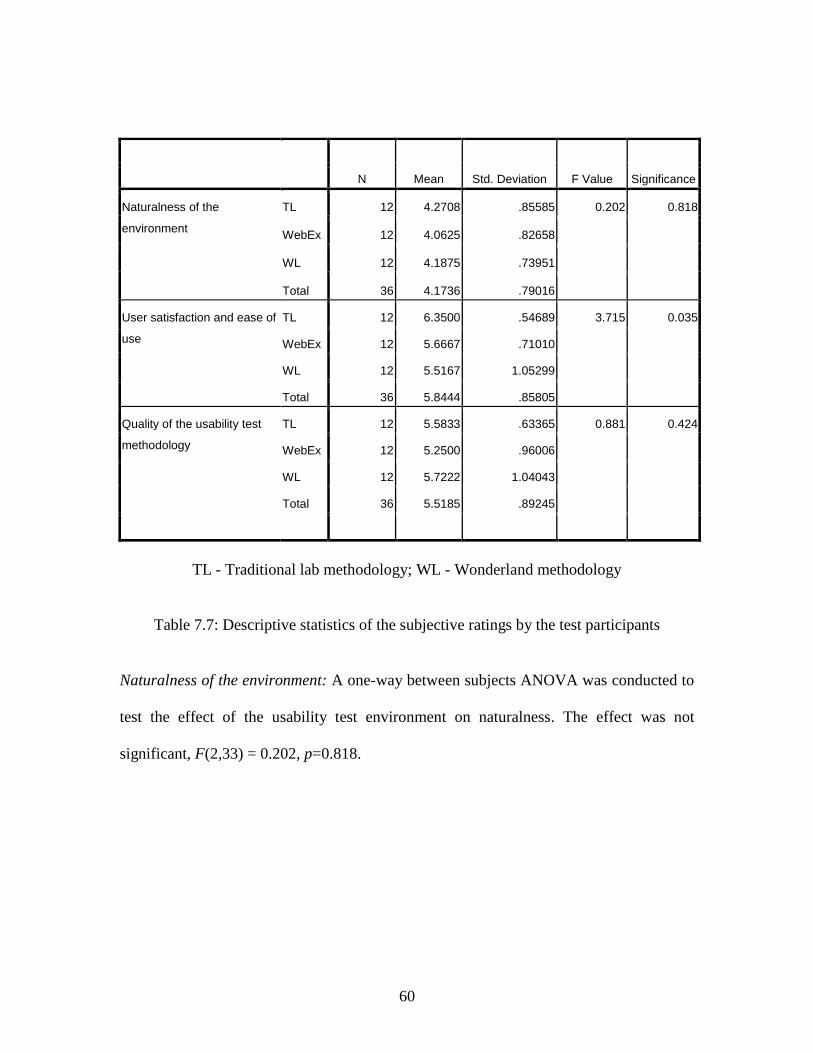
60
N Mean Std. Deviation F Value Significance
Naturalness of the
environment
TL 12 4.2708 .85585 0.202 0.818
WebEx 12 4.0625 .82658
WL 12 4.1875 .73951
Total 36 4.1736 .79016
User satisfaction and ease of
use
TL 12 6.3500 .54689 3.715 0.035
WebEx 12 5.6667 .71010
WL 12 5.5167 1.05299
Total 36 5.8444 .85805
Quality of the usability test
methodology
TL 12 5.5833 .63365 0.881 0.424
WebEx 12 5.2500 .96006
WL 12 5.7222 1.04043
Total 36 5.5185 .89245
TL - Traditional lab methodology; WL - Wonderland methodology
Table 7.7: Descriptive statistics of the subjective ratings by the test participants
Naturalness of the environment: A one-way between subjects ANOVA was conducted to
test the effect of the usability test environment on naturalness. The effect was not
significant, F(2,33) = 0.202, p=0.818.

61
Figure 7.5. Subjective ratings by the test participants
User satisfaction and ease-of-use: A one-way between subjects ANOVA was conducted
to test the effect of the usability test condition on this metric. The effect of test
environment on user satisfaction and ease-of-use was significant, F (2,33) = 3.715
p=0.035. Subsequent post-hoc analysis revealed that the traditional lab test environment
scored higher in user satisfaction and ease-of-use than WebEx (p=0.044) and Wonderland
(p=0.015) test environments.

62
Quality of the usability testing methodology: A one-way between subjects ANOVA was
conducted to test the effect of the usability test environment on this metric. The effect
was not significant, F (2, 33) = 0.881, p=0.424.
Test facilitator’s experience
The following section summarizes the results for the NASA-TLX, presence and post-test
subjective questionnaires answered by the 12 test facilitators who experienced each of the
three conditions. Descriptive statistics for the metrics are shown in Table 7.8. The mean
values for the metrics are plotted in Figure 7.6.
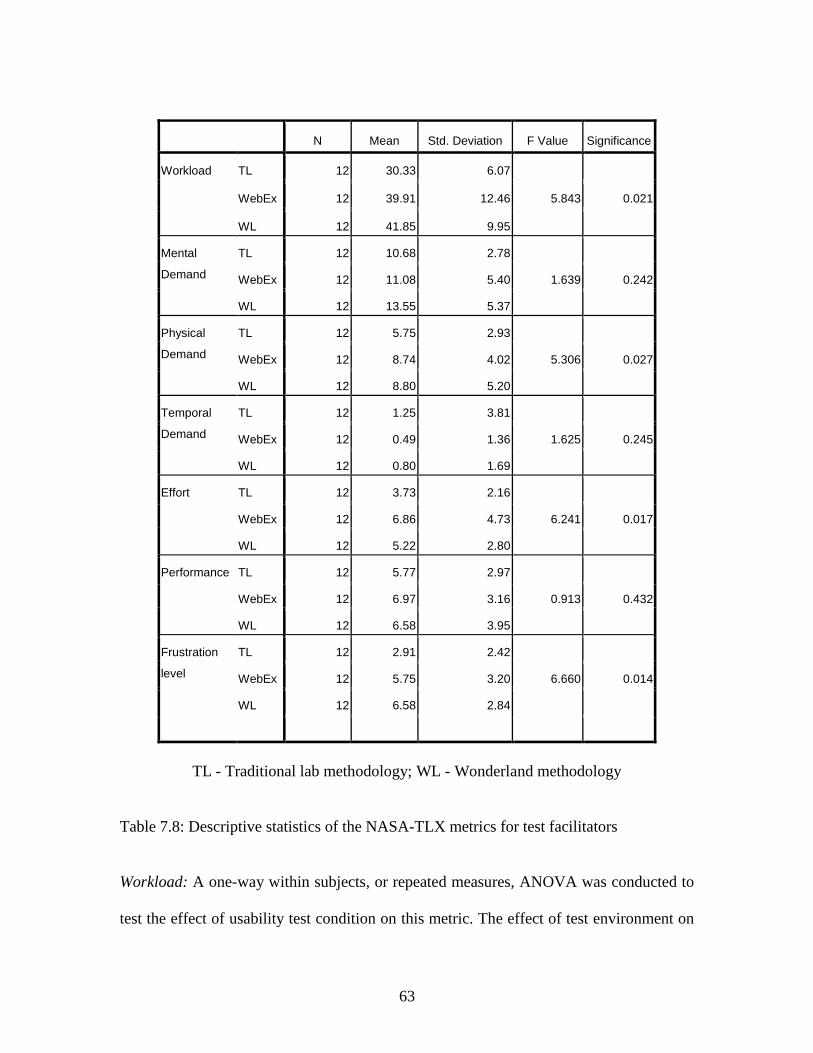
63
N Mean Std. Deviation F Value Significance
Workload TL 12 30.33 6.07
WebEx 12 39.91 12.46 5.843 0.021
WL 12 41.85 9.95
Mental
Demand
TL 12 10.68 2.78
WebEx 12 11.08 5.40 1.639 0.242
WL 12 13.55 5.37
Physical
Demand
TL 12 5.75 2.93
WebEx 12 8.74 4.02 5.306 0.027
WL 12 8.80 5.20
Temporal
Demand
TL 12 1.25 3.81
WebEx 12 0.49 1.36 1.625 0.245
WL 12 0.80 1.69
Effort TL 12 3.73 2.16
WebEx 12 6.86 4.73 6.241 0.017
WL 12 5.22 2.80
Performance TL 12 5.77 2.97
WebEx 12 6.97 3.16 0.913 0.432
WL 12 6.58 3.95
Frustration
level
TL 12 2.91 2.42
WebEx 12 5.75 3.20 6.660 0.014
WL 12 6.58 2.84
TL - Traditional lab methodology; WL - Wonderland methodology
Table 7.8: Descriptive statistics of the NASA-TLX metrics for test facilitators
Workload: A one-way within subjects, or repeated measures, ANOVA was conducted to
test the effect of usability test condition on this metric. The effect of test environment on
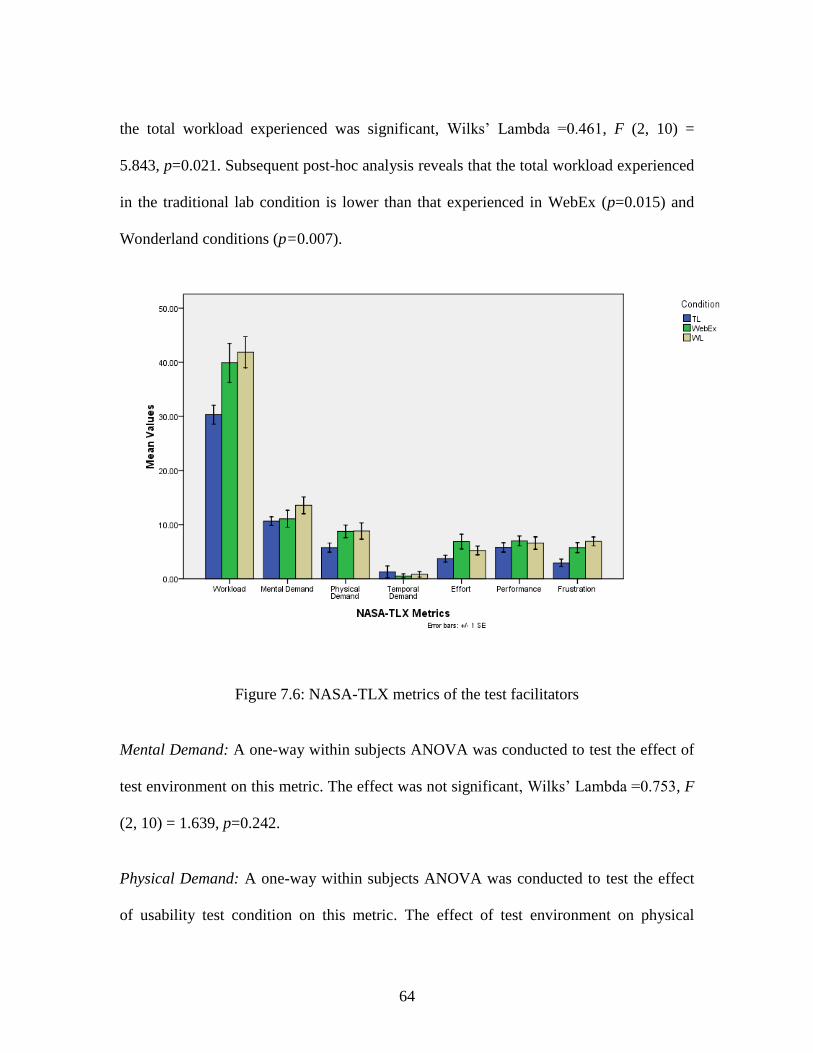
64
the total workload experienced was significant, Wilks’ Lambda =0.461, F (2, 10) =
5.843, p=0.021. Subsequent post-hoc analysis reveals that the total workload experienced
in the traditional lab condition is lower than that experienced in WebEx (p=0.015) and
Wonderland conditions (p=0.007).
Figure 7.6: NASA-TLX metrics of the test facilitators
Mental Demand: A one-way within subjects ANOVA was conducted to test the effect of
test environment on this metric. The effect was not significant, Wilks’ Lambda =0.753, F
(2, 10) = 1.639, p=0.242.
Physical Demand: A one-way within subjects ANOVA was conducted to test the effect
of usability test condition on this metric. The effect of test environment on physical
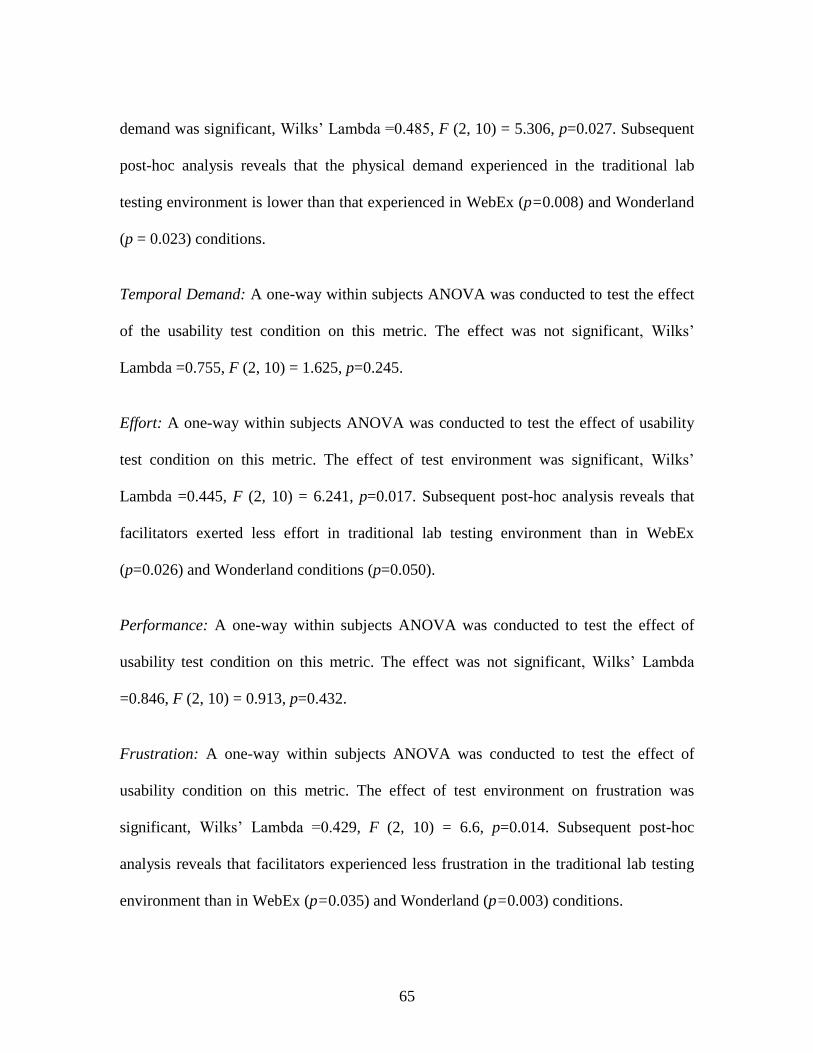
65
demand was significant, Wilks’ Lambda =0.485, F (2, 10) = 5.306, p=0.027. Subsequent
post-hoc analysis reveals that the physical demand experienced in the traditional lab
testing environment is lower than that experienced in WebEx (p=0.008) and Wonderland
(p = 0.023) conditions.
Temporal Demand: A one-way within subjects ANOVA was conducted to test the effect
of the usability test condition on this metric. The effect was not significant, Wilks’
Lambda =0.755, F (2, 10) = 1.625, p=0.245.
Effort: A one-way within subjects ANOVA was conducted to test the effect of usability
test condition on this metric. The effect of test environment was significant, Wilks’
Lambda =0.445, F (2, 10) = 6.241, p=0.017. Subsequent post-hoc analysis reveals that
facilitators exerted less effort in traditional lab testing environment than in WebEx
(p=0.026) and Wonderland conditions (p=0.050).
Performance: A one-way within subjects ANOVA was conducted to test the effect of
usability test condition on this metric. The effect was not significant, Wilks’ Lambda
=0.846, F (2, 10) = 0.913, p=0.432.
Frustration: A one-way within subjects ANOVA was conducted to test the effect of
usability condition on this metric. The effect of test environment on frustration was
significant, Wilks’ Lambda =0.429, F (2, 10) = 6.6, p=0.014. Subsequent post-hoc
analysis reveals that facilitators experienced less frustration in the traditional lab testing
environment than in WebEx (p=0.035) and Wonderland (p=0.003) conditions.
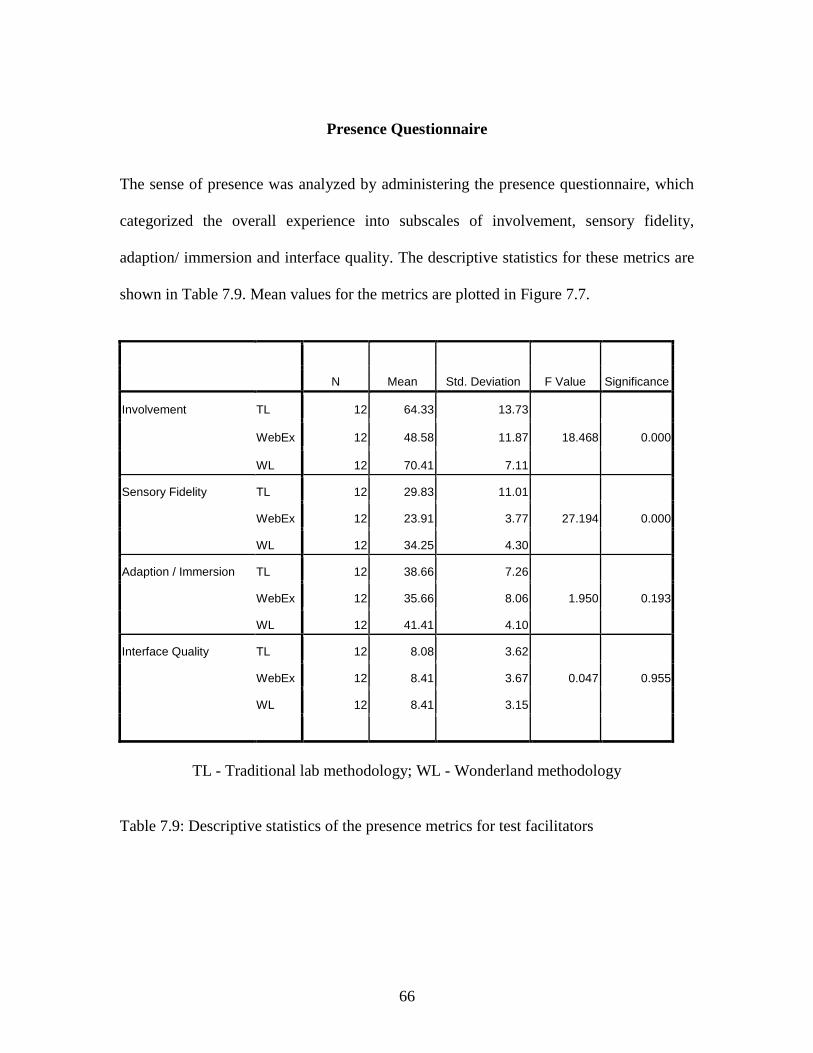
66
Presence Questionnaire
The sense of presence was analyzed by administering the presence questionnaire, which
categorized the overall experience into subscales of involvement, sensory fidelity,
adaption/ immersion and interface quality. The descriptive statistics for these metrics are
shown in Table 7.9. Mean values for the metrics are plotted in Figure 7.7.
N Mean Std. Deviation F Value Significance
Involvement TL 12 64.33 13.73
WebEx 12 48.58 11.87 18.468 0.000
WL 12 70.41 7.11
Sensory Fidelity TL 12 29.83 11.01
WebEx 12 23.91 3.77 27.194 0.000
WL 12 34.25 4.30
Adaption / Immersion TL 12 38.66 7.26
WebEx 12 35.66 8.06 1.950 0.193
WL 12 41.41 4.10
Interface Quality TL 12 8.08 3.62
WebEx 12 8.41 3.67 0.047 0.955
WL 12 8.41 3.15
TL - Traditional lab methodology; WL - Wonderland methodology
Table 7.9: Descriptive statistics of the presence metrics for test facilitators
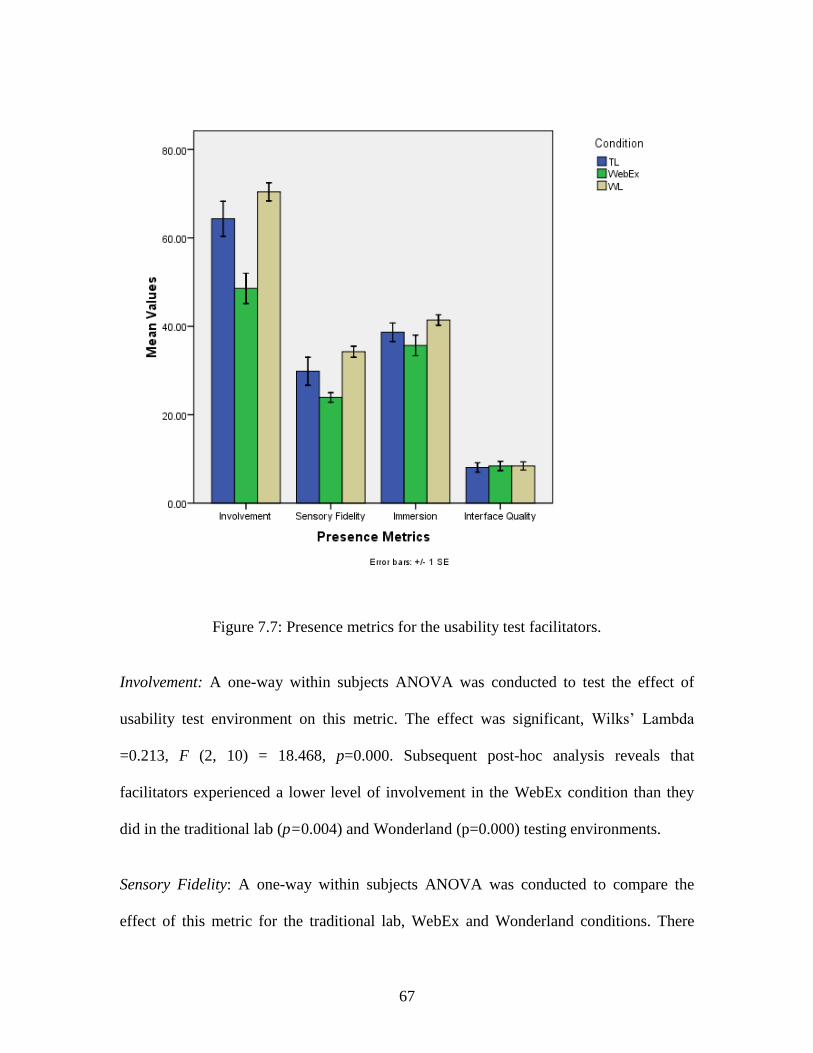
67
Figure 7.7: Presence metrics for the usability test facilitators.
Involvement: A one-way within subjects ANOVA was conducted to test the effect of
usability test environment on this metric. The effect was significant, Wilks’ Lambda
=0.213, F (2, 10) = 18.468, p=0.000. Subsequent post-hoc analysis reveals that
facilitators experienced a lower level of involvement in the WebEx condition than they
did in the traditional lab (p=0.004) and Wonderland (p=0.000) testing environments.
Sensory Fidelity: A one-way within subjects ANOVA was conducted to compare the
effect of this metric for the traditional lab, WebEx and Wonderland conditions. There
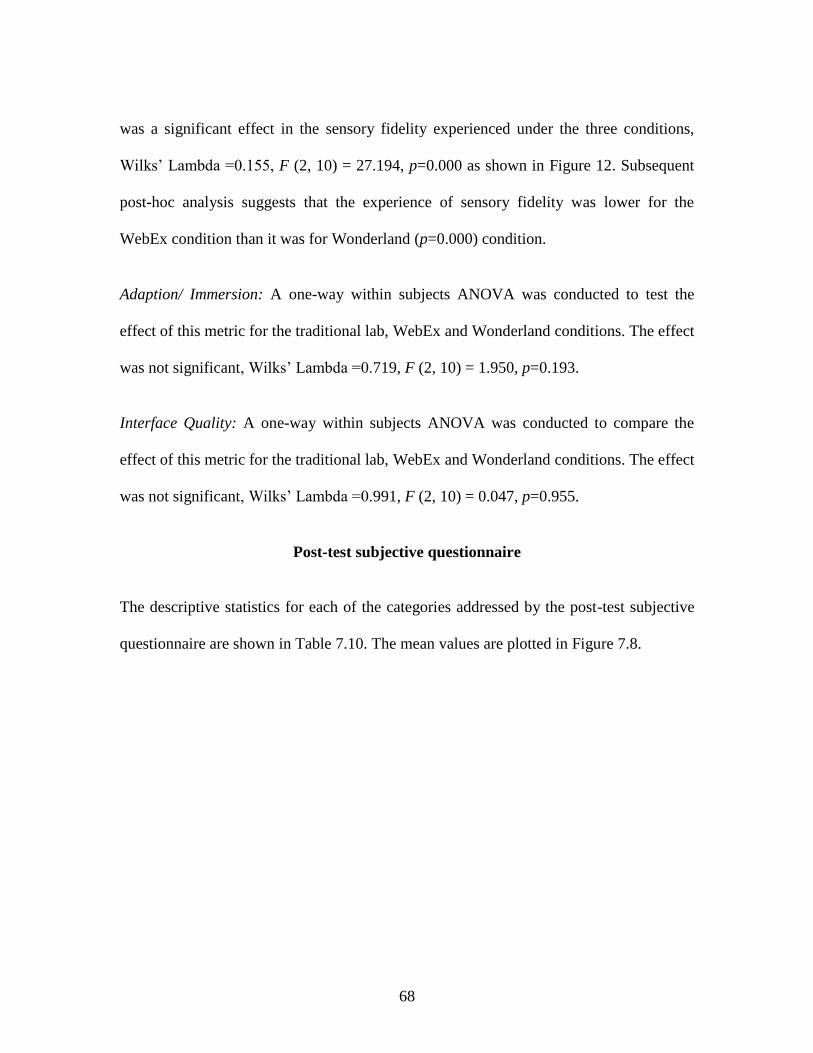
68
was a significant effect in the sensory fidelity experienced under the three conditions,
Wilks’ Lambda =0.155, F (2, 10) = 27.194, p=0.000 as shown in Figure 12. Subsequent
post-hoc analysis suggests that the experience of sensory fidelity was lower for the
WebEx condition than it was for Wonderland (p=0.000) condition.
Adaption/ Immersion: A one-way within subjects ANOVA was conducted to test the
effect of this metric for the traditional lab, WebEx and Wonderland conditions. The effect
was not significant, Wilks’ Lambda =0.719, F (2, 10) = 1.950, p=0.193.
Interface Quality: A one-way within subjects ANOVA was conducted to compare the
effect of this metric for the traditional lab, WebEx and Wonderland conditions. The effect
was not significant, Wilks’ Lambda =0.991, F (2, 10) = 0.047, p=0.955.
Post-test subjective questionnaire
The descriptive statistics for each of the categories addressed by the post-test subjective
questionnaire are shown in Table 7.10. The mean values are plotted in Figure 7.8.

69
N Mean Std. Deviation F Value Significance
Ease-of-use TL 12 6.66 0.651
WebEx 12 5.50 1.08 25.78 0.000
WL 12 5.50 1.00
Seamless
communication
TL 12 6.33 1.49
WebEx 12 5.91 0.90 2.43 0.137
WL 12 6.25 0.75
Sense of
presence
TL 12 6.91 0.28
WebEx 12 4.66 1.30 23.10 0.000
WL 12 5.91 1.16
Confidence TL 12 6.16 1.40
WebEx 12 5.25 1.13 1.93 0.196
WL 12 5.50 0.67
Efficiency TL 12 6.00 1.70
WebEx 12 5.41 1.08 0.58 0.575
WL 12 5.58 0.79
Analyze user
interaction
TL 12 6.75 0.62
WebEx 12 5.75 0.75 17.66 0.001
WL 12 4.66 1.07
Comfort level TL 12 6.08 1.37
WebEx 12 5.58 1.16 3.64 0.065
WL 12 6.08 0.79
Likeability TL 12 6.16 1.02
WebEx 12 6.08 0.66 0.99 0.964
WL 12 6.08 0.66
TL - Traditional lab methodology; WL - Wonderland methodology
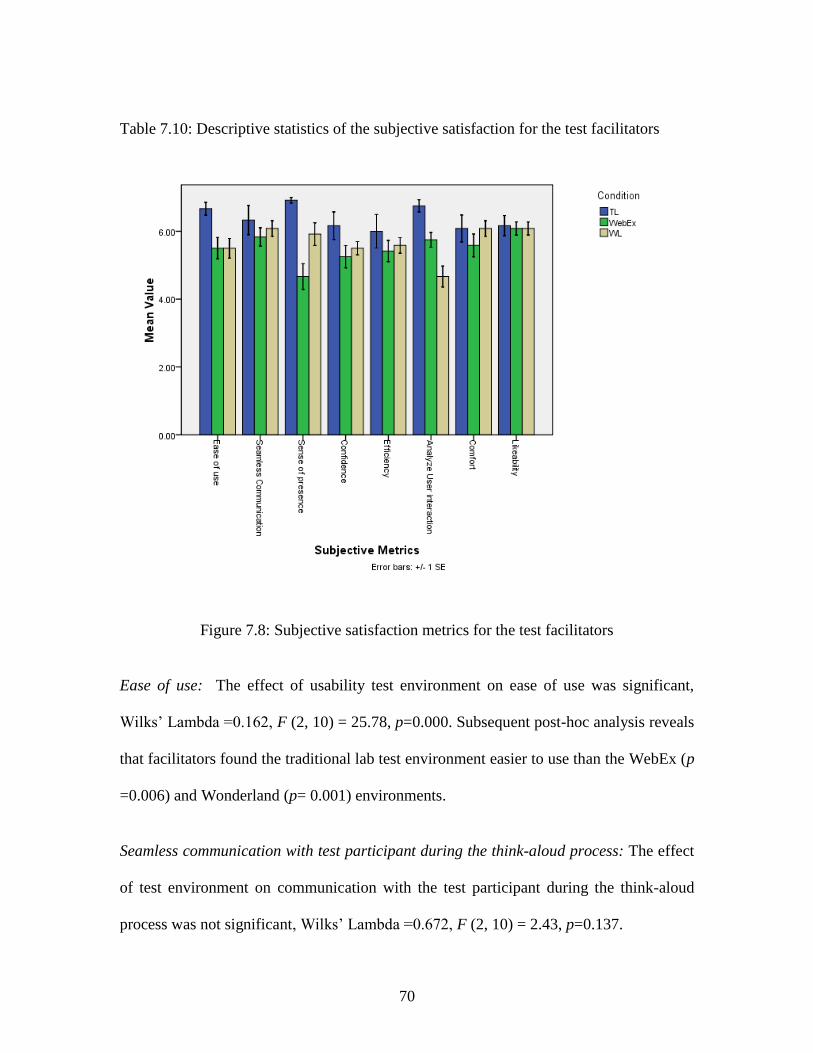
70
Table 7.10: Descriptive statistics of the subjective satisfaction for the test facilitators
Figure 7.8: Subjective satisfaction metrics for the test facilitators
Ease of use: The effect of usability test environment on ease of use was significant,
Wilks’ Lambda =0.162, F (2, 10) = 25.78, p=0.000. Subsequent post-hoc analysis reveals
that facilitators found the traditional lab test environment easier to use than the WebEx (p
=0.006) and Wonderland (p= 0.001) environments.
Seamless communication with test participant during the think-aloud process: The effect
of test environment on communication with the test participant during the think-aloud
process was not significant, Wilks’ Lambda =0.672, F (2, 10) = 2.43, p=0.137.
71
A strong sense of presence with the test participant: The effect of usability test
environment on the facilitators’ sense of presence was significant, Wilks’ Lambda
=0.178, F (2, 10) = 23.10, p=0.000. Subsequent post-hoc analysis reveals that the
facilitators’ sense of presence with the test participant was higher in the traditional lab
than in the WebEx (p=0.000) environment.
Confidence in conducting the usability test. The effect of test environment on the
facilitators’ confidence in conducting the usability test was not significant, Wilks’
Lambda =0.722, F (2, 10) = 1.93, p=0.196.
Efficiency. The effect of test environment on the facilitators’ perception if test efficiency
was not significant, Wilks’ Lambda =0.895, F (2, 10) = 0.58, p=0.575.
Ability to analyze user interaction with the web interface. The effect of usability test
environment on the facilitators’ ability to analyze user interaction with the web interface
was significant, Wilks’ Lambda =0.221, F (2, 10) = 17.66, p=0.001. Subsequent post-hoc
analysis reveals that facilitators felt they were best able to analyze the user interaction
with the new interface in the traditional lab environment. They felt that they were least
able to analyze user interaction with web interface in the Wonderland environment. The
WebEx environment was rated more highly on this metric than the Wonderland
environment, but less highly than the traditional lab environment.
Comfort level: The effect of test environment on the facilitators’ comfort level was not
significant, Wilks’ Lambda =0.578, F (2, 10) = 3.64, p=0.065.
72
Likeability: There were no significant differences among the test environments in terms
of how much the facilitators liked them, Wilks’ Lambda =0.993, F (2, 10) = 0.036,
p=0.964.

73
CHAPTER EIGHT
DISCUSSION
One of the initial research questions was to identify whether there were any differences in
the effectiveness of the three evaluation approaches, the traditional lab approach, the
WebEx approach, and the Wonderland approach, in collecting usability data. Though no
significant differences were identified for the time taken to complete the tasks, the mean
time for the first three tasks in Wonderland was slightly higher, perhaps because of the
learning process the participants experienced while transitioning into a virtual
environment. No differences were identified for the total number of defects identified and
the number of Severity 3 and Severity 4 defects identified for the three environments.
These results are consistent with those found by Hartson et al. (1996) for conducting a
synchronous usability test in different settings. Similarly, in the studies conducted by
Brush et al. (2004) found no significant differences between the traditional lab condition
and the remote synchronous testing condition in terms of the number, types and severities
of usability problems.
In the comparative analysis of objective measures, the effect of test environment on the
number of Severity 1 defects identified approached significance. The effect of test
environment on the number of Severity 2 defects was significant. More Severity 1 defects
were identified in the Wonderland condition than in the WebEx condition. More Severity
2 defects were identified in the Wonderland condition than in the traditional lab
condition. It is not clear why the participants in the Wonderland condition identified more
minor usability defects than the participants in the other conditions. Perhaps the novelty
74
of the Wonderland condition increased the motivation of the participants to detect and
mention even minor usability issues. This difference may be explained by the interface
layout. The Wonderland system had a browser, bordered clearly with a green band,
helping the participants to focus on the website. This conclusion is supported by
participant responses. These factors may have contributed to the identification of a
slightly higher number of Severity 1 and Severity 2 issues in the Wonderland system.
Another explanation for this result could be the inherent variability in the identification of
defects by the participants, since the think-aloud protocol was a new experience for many
of the participants. The studies conducted by Molich et al. (1998) also suggest that
different participant-facilitator groups could yield a different type and number of results,
even though they test the same interface.
Significant qualitative differences were observed for the three conditions. The NASA-
TLX scales, used to determine the total perceived workload indicate that the participants
experienced the least workload in the traditional lab condition. This result could have
been due to the co-location of the test facilitator with the test participant during the
preparatory stages as well as during the test. In the case of the WebEx-based approach,
test participants experienced some difficulty during the preparatory session figuring out
how to operate the system. In addition, there was a time delay while the remote session
loaded. Though this delay was short, participants complained that they did not know what
was happening other than that there was a white screen display explaining that “the
session is loading.” For the Wonderland-based testing, participants clicked on a button to
launch the session and soon were transitioned to the virtual world. For both of the remote
75
testing environments, the participants were required to perform a series of button clicks
on an interface supporting the remote infrastructure to begin the session.
The NASA-TLX subscales of mental demand, physical demand, temporal demand and
effort did not reveal any significant differences. However, significant differences were
found for the performance and frustration subscales. The test participants felt their
performance was poorer in the WebEx environment than in the traditional lab and
Wonderland environments. They experienced more frustration with the Wonderland
environment than with the traditional lab environment. The participants using the
Wonderland environment appeared to be frustrated primarily by its slow response to the
inputs of the test participants and test facilitators. Nonetheless, a number of test
participants using the Wonderland environment commented that they enjoyed moving
around inside the virtual usability testing laboratory and interacting with the shared web
browser using their avatars.
The NASA-TLX workload indices suggest that the total workload experienced by
facilitators was also lower in the traditional lab environment than in the two remote
testing environments. No significant differences were observed for for the test facilitators
on the mental demand, temporal demand, and performance subscales. However,
significant differences were observed for physical demand, effort and frustration
subscales. Test facilitators felt that physical demands, effort, and frustration were higher
for the two remote testing environments than for the traditional lab environment. This
may be due to the lower initial setup required for the traditional lab condition. It took
76
time for the test facilitators to become acquainted with the remote testing environments.
In addition, the high level of physical demand in the WebEx and Wonderland conditions
might also be due to the higher level of interaction with the computer required in these
environments during the study. The relatively slow response times of the web browser to
user inputs in the remote testing environments may also have led to increased levels of
frustration for the test facilitators.
For the test participants, significant differences were observed for involvement and
immersion on the presence questionnaire. Involvement was higher in the Wonderland
environment than in the WebEx environment. For the test facilitators, involvement was
higher in the Wonderland and traditional lab conditions than in the WebEx condition. The
level of immersion experienced by the participants was also higher in the Wonderland
condition than in the WebEx condition. These results may be due to the multisensory
immersive experience produced by the Wonderland virtual world, characterized by
avatars, and simultaneous visual and auditory feedback.
The subjective ratings provided by the test participants in the final subjective rating
questionnaire revealed significant differences in terms of user satisfaction and ease of
use. The user satisfaction and ease of use were higher for the traditional lab methodology
than for the remote testing environments. The test facilitators also rated the ease of use of
the traditional lab environment higher than that of the remote test environments.
Interestingly, however, some of the test participants in the traditional lab environment
commented that they felt some pressure to avoid making mistakes while being observed
77
by a test facilitator. None of the participants in the remote testing environments expressed
this concern.
Test facilitators felt that they were best able to analyze the user interaction with the web
interface in the traditional lab environment. They felt they were least able to analyze the
user interaction in the Wonderland environment. The low rating of the Wonderland
environment on this metric was probably the result of a technical problem with the
display of the web browser in this environment. Mouse movements within a browser
made by the test participant were not visible to the test facilitator in the Wonderland
environment.
The effect of the test environment on the comfort level of the test facilitators approached
significance. The test facilitators appeared to be somewhat more comfortable with the
traditional lab than with the Wonderland and WebEx environments. Test facilitators
were, on average, equally comfortable with the WebEx and Wonderland environments.
One of the challenges of remote usability testing is the recruitment of security-conscious
participants. These participants, or the organizations employing them, may consider
allowing others to access their computers to be a security risk (Vasnaik et al., 2006).
Remote testing using Wonderland requires only that participants interact with their web
browser. The test facilitator cannot view any information on their computers that is not
displayed within the browser. WebEx addresses this concern by allowing its users to
selectively share applications on their computers. Another difficulty encountered in
remote usability testing is the need for installing a client application to enable screen

78
sharing and chat functionalities (Vasnaik et al., 2006). WebEx requires that users install
either an ActiveX control or a Java applet on the computer at each end of the conference
to enable screen sharing. Wonderland relies on Java applets to achieve these
functionalities. Moreover, the applet used by Wonderland employs the Java Web Start
technology. As a result,there is no need for the users to install a program to enable these
functionalities. In addition, remote usability testing with Wonderland and WebEx retains
the inherent advantages of synchronous usability testing, including significant savings in
travel time and cost, reduced turn-around time for user-centered iterative product
development, recruitment of geographically dispersed participants and the ability for
geographically distributed product development teams to participate in a real time study.
Table 8.11 compares the traditional lab, WebEx-based and Wonderland-based
approaches in terms of several technical and financial selection criteria.
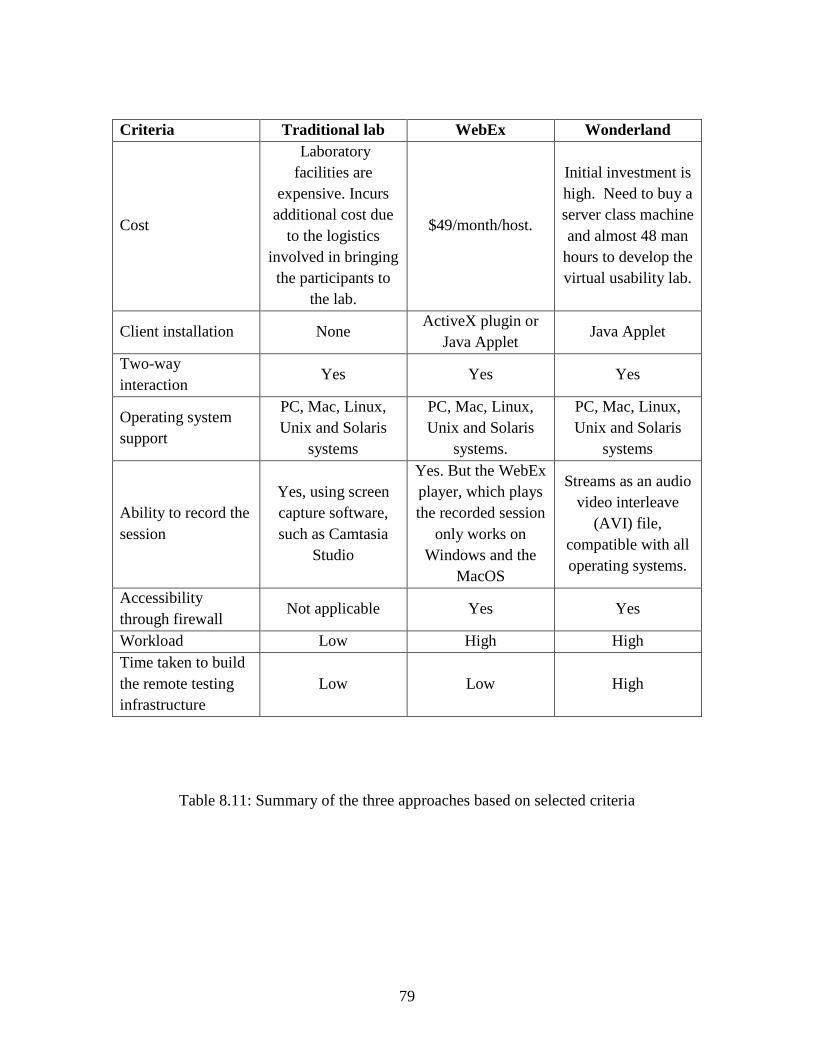
79
Criteria Traditional lab WebEx Wonderland
Cost
Laboratory
facilities are
expensive. Incurs
additional cost due
to the logistics
involved in bringing
the participants to
the lab.
$49/month/host.
Initial investment is
high. Need to buy a
server class machine
and almost 48 man
hours to develop the
virtual usability lab.
Client installation None ActiveX plugin or
Java Applet Java Applet
Two-way
interaction Yes Yes Yes
Operating system
support
PC, Mac, Linux,
Unix and Solaris
systems
PC, Mac, Linux,
Unix and Solaris
systems.
PC, Mac, Linux,
Unix and Solaris
systems
Ability to record the
session
Yes, using screen
capture software,
such as Camtasia
Studio
Yes. But the WebEx
player, which plays
the recorded session
only works on
Windows and the
MacOS
Streams as an audio
video interleave
(AVI) file,
compatible with all
operating systems.
Accessibility
through firewall Not applicable Yes Yes
Workload Low High High
Time taken to build
the remote testing
infrastructure
Low Low High
Table 8.11: Summary of the three approaches based on selected criteria

80
CHAPTER NINE
CONCLUSION
This study proposed a new methodology for conducting a synchronous remote usability
test using a three-dimensional virtual world, Wonderland, and empirically compared it
with WebEx, a web-based two-dimensional screen sharing and conferencing tool, and the
traditional lab method. One of the most important findings of this study is that the
Wonderland is as effective as the traditional lab and WebEx-based methods in terms of
the time taken by the test participants to complete the tasks and the number of higher
severity defects identified. Interestingly, participants appeared to identify a slightly larger
number of lower severity defects in the Wonderland environment than in the traditional
lab and WebEx environments.
Test participants and facilitators alike experienced lower overall workload in the
traditional lab environment than in either of the remote testing environments. The
findings indicate that both the test participants and test facilitators experienced a higher
level of involvement in the Wonderland condition than in WebEx condition. Wonderland
offers a remote testing infrastructure without any software installation required by the
usability test participants and facilitators. It supports recruitment of geographically
distributed, diverse participants who can remain in their native work environments.
Given that it generates usability test results compared to those of traditional lab testing,
remote usability testing in virtual world appears to be a viable alternative to the
conventional lab testing approach. The two primary disadvantages of testing in the
Wonderland environment were the delay the participants experienced while interacting
81
with the interface and the inability of test facilitators to monitor the mouse movements of
test participants as they interacted with the interface prototype being tested.
The study presented here is only an initial step; below are listed suggestions for future
studies.
Studies involving professional test facilitators to address the potential bias of the
university students used here.
Studies involving more participants to ensure the validity and reliability of the
results.
Studies using geographically dispersed participants in a real time environment, to
measure the level of trust between the facilitator and the participants.
Studies using participants and facilitators with less technology experience, to
determine their comfort level with the methodology.

82
APPENDICES
Appendix A
Consent Form for Participation in a Research Study
Clemson University
An investigation of usability testing methodologies
Description of the research and your participation
You are invited to participate in a research study conducted by Dr. Joel S. Greenstein and
Kapil Chalil Madathil. The purpose of this study is to compare different usability testing
methodologies.
The study will compare the effectiveness of three different meeting space environments
for usability testing. The procedure involves a representative user interacting with a web
site and a usability expert monitoring the user's interaction with the site. The first
environment will be a traditional meeting room where the subjects will sit and interact
with a web interface displayed on a computer monitor. The second environment will
employ an online meeting tool (WebEx™) which facilitates data sharing and
communication support. The third environment will be a three-dimensional (3D) virtual
world, in which the user will interact with the web interface. Each meeting will include a
user and a usability expert. As the usability expert, you will monitor a usability test in all
three meeting spaces. Each user will experience only one of the three meeting spaces.
You will be asked to fill out a brief questionnaire about you and your knowledge of
computers and the internet. The experimenter will guide you to the usability-testing
laboratory and you will be asked to monitor three usability sessions with users in three
different environments. While you are in the process of performing these tasks, you will
ask the user to perform tasks on the web page and talk about his reactions to the website.
The think-aloud protocol will be used during each usability session. The test session will
be recorded using a screen capture software application. The video and the audio data of
the session will be used to analyze the difficulties the user experiences with the website.
After you have completed each session, you will be asked to complete two questionnaires
asking about your experience while conducting the usability test. The amount of time
required for your participation will be approximately 60 minutes for each session (3
hours in total). Once you have completed monitoring three usability sessions in three
different environments, you will be asked to fill out a final questionnaire in which you
provide a subjective rating for each of the three environments.
Please understand that we are not testing your personal performance. We are testing the
effectiveness of usability testing in three different types of meeting space.
83
Risks and discomforts
There are no known risks associated with participation in this study.
Potential benefits
There are no known benefits to you that would result from your participation in this
research. This research may help us to understand how to develop more effective
usability tests.
Protection of confidentiality
We will do everything we can do to protect your privacy. The audio and video data
captured will be stored on a password-protected computer in the Human Computer
Systems Laboratory (Freeman Hall 147). The survey questionnaires will be kept in a
locked cabinet. The documents will be accessible only to the principal investigator and
the co-investigator. Your identity will not be revealed in any publication that might result
from this study.
In rare cases, a research study will be evaluated by an oversight agency, such as the
Clemson University Institutional Review Board or the federal Office for Human
Research Protections that would require that we share the information we collect from
you. If this happens, the information would only be used to determine if we conducted
this study properly and adequately protected your rights as a participant.
Voluntary participation
Your participation in this research study is voluntary. You may choose not to participate
and you may withdraw your consent to participate at any time. You will not be penalized
in any way should you decide not to participate or to withdraw from this study.
Contact information
If you have any questions or concerns about this study or if any problems arise, please
contact Dr. Joel S. Greenstein at Clemson University at 864-656-5649. If you have any
questions or concerns about your rights as a research participant, please contact the
Clemson University Institutional Review Board at 864-656-6460.
Consent
I have read this consent form and have been given the opportunity to ask questions.
I give my consent to participate in this study.
Participant’s signature: ________________________________ Date: ______________
A copy of this consent form should be given to you.

84
Appendix B
PRE-TEST QUESTIONNAIRE - USABILITY TEST FACILITATOR
GENERAL
Meeting space: ______________________ (This will be filled out by the test
administrator)
Age: _______________________
Gender: Male Female
EDUCATION
1. Please check your academic level below
Undergraduate student
Graduate student (Masters or Ph.D.)
Other
(Please specify _______________________)
2. List your major area of study: __________________________
EXPERIENCE WITH USABILITY TESTING
3. Have you taken IE 802 or PSYCH 840 or ENGL 834?
Yes No (If No, please contact test administrator)
4. Are you aware of the think-aloud protocol?
Yes No (If No, please contact test administrator)
5. Have you ever participated in an online web meeting?
(Example: A conversation on Skype)
Yes No
85
6. Do you have any experience working in three-dimensional virtual worlds?
(Example: Playing 3D games like World of Warcraft or visiting virtual worlds like
Second Life)
Yes No
7. Have you ever conducted a usability test?
Yes No
6. Do you ever use the internet to buy or sell items online?
(Example: Purchasing items from Amazon.com)
Yes No
7. If YES, how often?
Very Frequently Sometimes Rarely Never
8. Have you ever participated in a usability test as a usability test subject?
Yes No
86
Appendix C
Consent Form for Participation in a Research Study
Clemson University
An investigation of usability testing methodologies
Description of the research and your participation
You are invited to participate in a research study conducted by Dr. Joel S. Greenstein and
Kapil Chalil Madathil. The purpose of this study is to compare different usability testing
methodologies.
You will be asked to fill out a brief questionnaire about you and your knowledge of
computers and the internet. The test facilitator will guide you to the usability-testing
laboratory and you will be asked to complete a set of tasks using a website. While you are
in the process of performing these tasks, you will be asked to think aloud and talk about
your reactions to website. Feel free to tell us about any of the inconveniences you
experience while navigating through the website. The test session will be recorded using
a screen capture software application. The video and the audio data of the session will be
used to analyze the difficulties you experience with the website. Once you have
completed your task, you will be asked to complete three subjective questionnaires
asking about your experience of using the usability test methodology.
The amount of time required for your participation will be approximately 60 minutes.
Please understand that we are not testing your personal performance. We are testing the
effectiveness of usability testing in three different types of usability test methodologies.
Risks and discomforts
There are no known risks associated with participation in this study.
Potential benefits
There are no known benefits to you that would result from your participation in this
research. This research may help us to understand how to develop more effective
usability tests.

87
Protection of confidentiality
We will do everything we can do to protect your privacy. The audio and video data
captured will be stored on a password-protected computer in the Human Computer
Systems Laboratory (Freeman Hall 147). The survey questionnaires will be kept in a
locked cabinet. The documents will be accessible only to the principal investigator and
the co-investigator. Your identity will not be revealed in any publication that might result
from this study.
In rare cases, a research study will be evaluated by an oversight agency, such as the
Clemson University Institutional Review Board or the Federal Office for Human
Research Protections that would require that we share the information we collect from
you. If this happens, the information would only be used to determine if we conducted
this study properly and adequately protected your rights as a participant.
Voluntary participation
Your participation in this research study is voluntary. You may choose not to participate
and you may withdraw your consent to participate at any time. You will not be penalized
in any way should you decide not to participate or to withdraw from this study.
Contact information
If you have any questions or concerns about this study or if any problems arise, please
contact Dr. Joel S. Greenstein at Clemson University at 864-656-5649. If you have any
questions or concerns about your rights as a research participant, please contact the
Clemson University Institutional Review Board at 864-656-6460.
Consent
I have read this consent form and have been given the opportunity to ask questions.
I give my consent to participate in this study.
Participant’s signature: ________________________________ Date: ______________
A copy of this consent form should be given to you.
88
Appendix D
PRE-TEST QUESTIONNAIRE - USABILITY TEST PARTICIPANTS
GENERAL
Meeting space: ______________________ (This will be filled out by the test
administrator)
Age: _______________________
Gender: Male Female
EDUCATION
1. Please check your academic level below
Undergraduate student
Graduate student (Masters or Ph.D.)
Other
(Please specify _______________________)
2. List your major area of study: __________________________
EXPERIENCE WITH INTERNET
3. How long have you been using computers?
Less than a year 1- 3 years 3- 5 years More than 5 years
4. List the Internet browsers you are familiar with.
Internet Explorer
Mozilla Firefox
Safari
Opera
Google Chrome
Other
(Please specify _______________________)
5. How would you rate your experience with Internet browsing?
Very experienced Moderate Minimal None
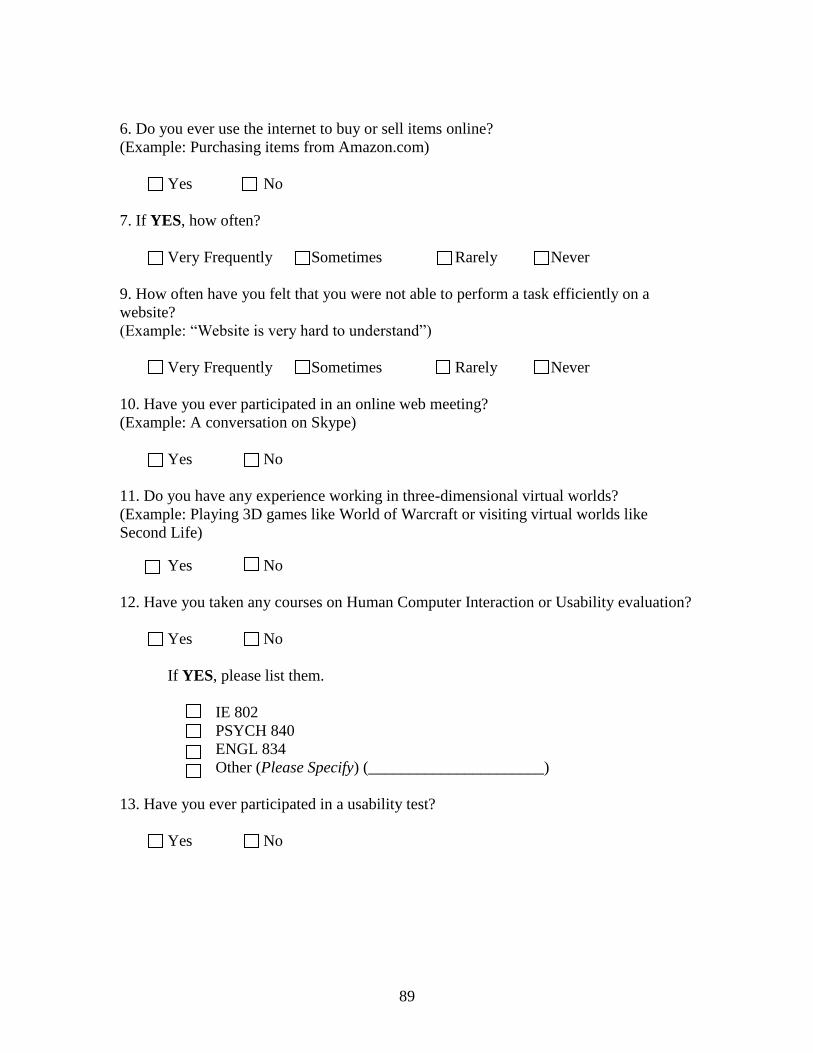
89
6. Do you ever use the internet to buy or sell items online?
(Example: Purchasing items from Amazon.com)
Yes No
7. If YES, how often?
Very Frequently Sometimes Rarely Never
9. How often have you felt that you were not able to perform a task efficiently on a
website?
(Example: “Website is very hard to understand”)
Very Frequently Sometimes Rarely Never
10. Have you ever participated in an online web meeting?
(Example: A conversation on Skype)
Yes No
11. Do you have any experience working in three-dimensional virtual worlds?
(Example: Playing 3D games like World of Warcraft or visiting virtual worlds like
Second Life)
Yes No
12. Have you taken any courses on Human Computer Interaction or Usability evaluation?
Yes No
If YES, please list them.
IE 802
PSYCH 840
ENGL 834
Other (Please Specify) (______________________)
13. Have you ever participated in a usability test?
Yes No
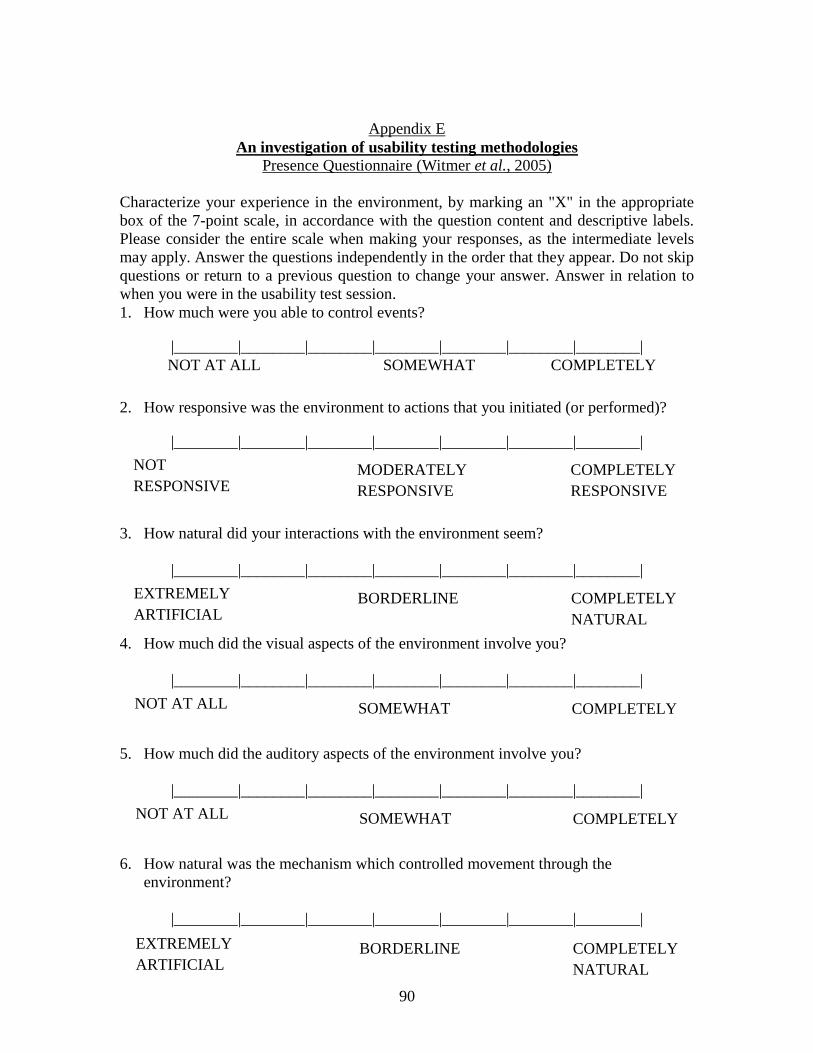
90
Appendix E
An investigation of usability testing methodologies
Presence Questionnaire (Witmer et al., 2005)
Characterize your experience in the environment, by marking an "X" in the appropriate
box of the 7-point scale, in accordance with the question content and descriptive labels.
Please consider the entire scale when making your responses, as the intermediate levels
may apply. Answer the questions independently in the order that they appear. Do not skip
questions or return to a previous question to change your answer. Answer in relation to
when you were in the usability test session.
1. How much were you able to control events?
|________|________|________|________|________|________|________|
NOT AT ALL SOMEWHAT COMPLETELY
2. How responsive was the environment to actions that you initiated (or performed)?
|________|________|________|________|________|________|________|
3. How natural did your interactions with the environment seem?
|________|________|________|________|________|________|________|
4. How much did the visual aspects of the environment involve you?
|________|________|________|________|________|________|________|
5. How much did the auditory aspects of the environment involve you?
|________|________|________|________|________|________|________|
6. How natural was the mechanism which controlled movement through the
environment?
|________|________|________|________|________|________|________|
NOT
RESPONSIVE
MODERATELY
RESPONSIVE
COMPLETELY
RESPONSIVE
EXTREMELY
ARTIFICIAL
BORDERLINE
COMPLETELY
NATURAL
NOT AT ALL
SOMEWHAT
COMPLETELY
NOT AT ALL
SOMEWHAT
COMPLETELY
EXTREMELY
ARTIFICIAL
BORDERLINE
COMPLETELY
NATURAL

91
7. How compelling was your sense of objects moving through space?
|________|________|________|________|________|________|________|
8. How much did your experiences in the test environment seem consistent with your
real world experiences?
|________|________|________|________|________|________|________|
9. Were you able to anticipate what would happen next in response to the actions that
you performed?
|________|________|________|________|________|________|________|
10. How completely were you able to actively survey or search the environment using
vision?
|________|________|________|________|________|________|________|
11. How well could you identify sounds?
|________|________|________|________|________|________|________|
12. How well could you localize sounds?
|________|________|________|________|________|________|________|
13. How well could you actively survey or search the test environment using touch?
NOT AT ALL MODERATELY
COMPELLING
VERY
COMPELLING
NOT
CONSISTENT
MODERATELY
CONSISTENT
VERY
CONSISTENT
NOT AT ALL SOMEWHAT COMPLETELY
NOT AT ALL SOMEWHAT COMPLETELY
NOT AT ALL SOMEWHAT COMPLETELY
NOT AT ALL SOMEWHAT COMPLETELY
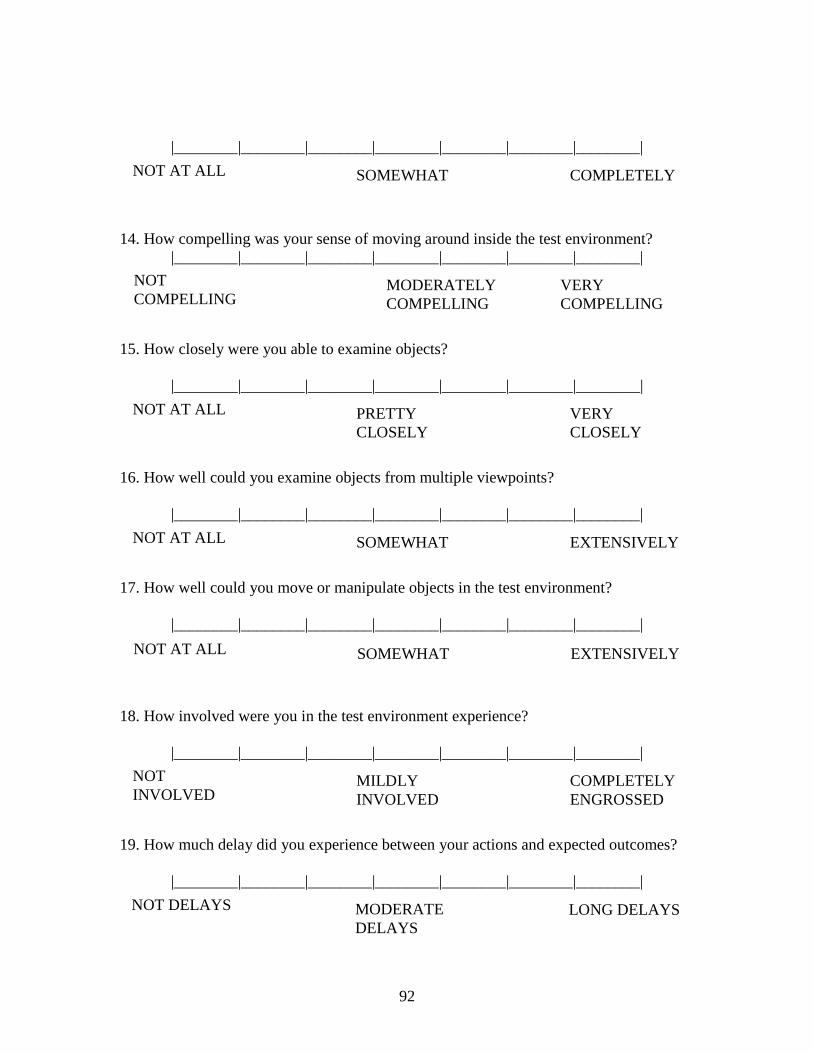
92
|________|________|________|________|________|________|________|
14. How compelling was your sense of moving around inside the test environment?
|________|________|________|________|________|________|________|
15. How closely were you able to examine objects?
|________|________|________|________|________|________|________|
16. How well could you examine objects from multiple viewpoints?
|________|________|________|________|________|________|________|
17. How well could you move or manipulate objects in the test environment?
|________|________|________|________|________|________|________|
18. How involved were you in the test environment experience?
|________|________|________|________|________|________|________|
19. How much delay did you experience between your actions and expected outcomes?
|________|________|________|________|________|________|________|
NOT AT ALL PRETTY
CLOSELY
VERY
CLOSELY
NOT
COMPELLING MODERATELY
COMPELLING
VERY
COMPELLING
NOT AT ALL SOMEWHAT COMPLETELY
NOT AT ALL SOMEWHAT EXTENSIVELY
NOT AT ALL SOMEWHAT EXTENSIVELY
NOT
INVOLVED MILDLY
INVOLVED
COMPLETELY
ENGROSSED
NOT DELAYS MODERATE
DELAYS
LONG DELAYS
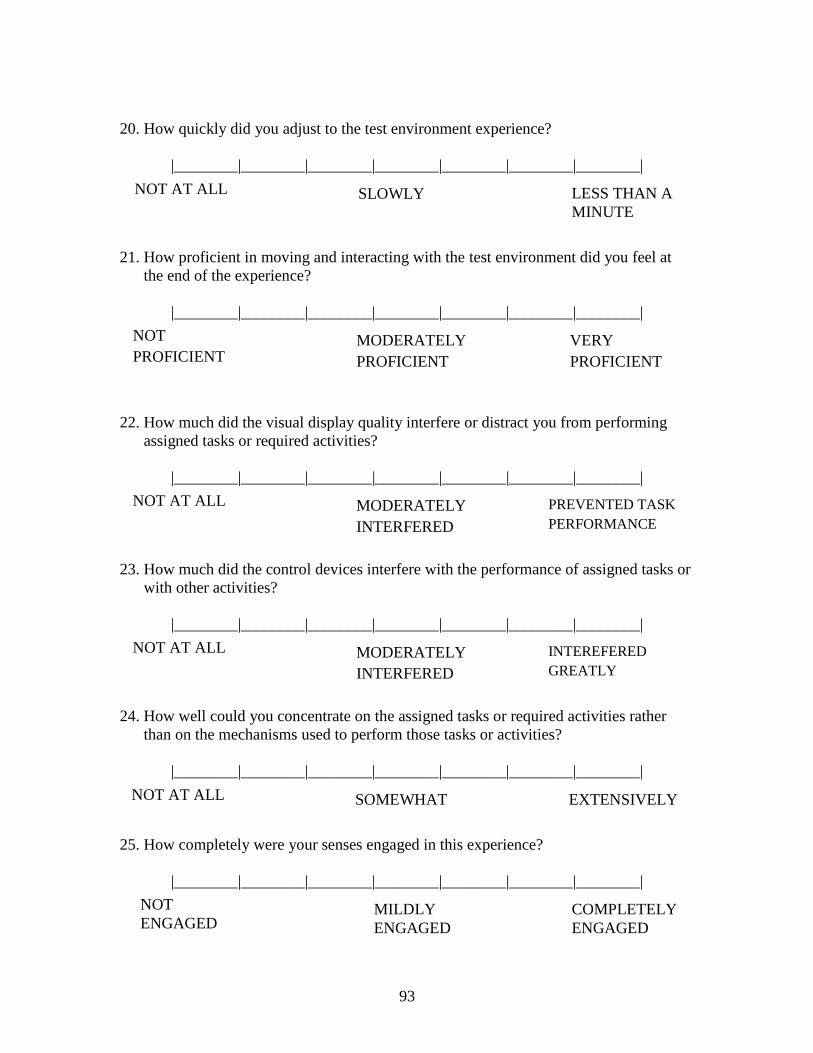
93
20. How quickly did you adjust to the test environment experience?
|________|________|________|________|________|________|________|
21. How proficient in moving and interacting with the test environment did you feel at
the end of the experience?
|________|________|________|________|________|________|________|
22. How much did the visual display quality interfere or distract you from performing
assigned tasks or required activities?
|________|________|________|________|________|________|________|
23. How much did the control devices interfere with the performance of assigned tasks or
with other activities?
|________|________|________|________|________|________|________|
24. How well could you concentrate on the assigned tasks or required activities rather
than on the mechanisms used to perform those tasks or activities?
|________|________|________|________|________|________|________|
25. How completely were your senses engaged in this experience?
|________|________|________|________|________|________|________|
NOT AT ALL SLOWLY LESS THAN A
MINUTE
NOT
PROFICIENT
MODERATELY
PROFICIENT
VERY
PROFICIENT
NOT AT ALL
MODERATELY
INTERFERED
PREVENTED TASK
PERFORMANCE
NOT AT ALL
MODERATELY
INTERFERED
INTEREFERED
GREATLY
NOT AT ALL SOMEWHAT EXTENSIVELY
NOT
ENGAGED MILDLY
ENGAGED
COMPLETELY
ENGAGED
94
29. How easy was it to identify objects through physical interaction; like touching an
object, walking over a surface, or bumping into a wall or object?
|________|________|________|________|________|________|________|
30. Were there moments during the test environment experience when you felt
completely focused on the task or environment?
|________|________|________|________|________|________|________|
31. How easily did you adjust to the control devices used to interact with the test
environment?
|________|________|________|________|________|________|________|
32. Was the information provided through different senses in the test environment (e.g.,
vision, hearing, touch) consistent?
|________|________|________|________|________|________|________|
There are 4 subscales:
Involvement – 1, 2, 3, 4, 6, 7, 8, 10, 14, 17, 18, 29
Sensory Fidelity – 5, 11, 12, 13, 15, 16
Adaptation/Immersion – 9, 20, 21, 24, 25, 30, 31, 32
Interface Quality – 19, 22, 23
Note: The numbering of the above items is consistent with version 3.0 of the Presence
Questionnaire. However, the items themselves are from version 4.0.
Witmer, B., Jerome, C.J., & Singer, M.J. (2005). The factor structure of the presence questionnaire. Presence, 14(3),
298-312.
IMPOSSIBLE MODERATELY
DIFFICULT
VERY EASY
NONE OCCASIONALLY FREQUENTLY
DIFFICULT MODERATE VERY EASY
NOT
CONSISTENT
MODERATELY
CONSISTENT
VERY
CONSISTENT
95
Appendix F
Usability Subject: Subjective Questionnaire
Meeting space: ______________________ (This will be filled out by the test
administrator)
(Please provide the following information)
Naturalness of the Environment:
1. I had a sense of being in a meeting room.
2. I felt like I was in a usability testing laboratory environment.
3. The usability testing laboratory environment seemed natural.
4. I was confused in this usability testing laboratory environment.
0 1 2 3 4 5 6 7
Strongly
Disagree
Strongly
Agree
0 1 2 3 4 5 6 7
Strongly
Disagree
Strongly
Agree
0 1 2 3 4 5 6 7
Strongly
Disagree
Strongly
Agree
0 1 2 3 4 5 6 7
Strongly
Disagree
Strongly
Agree

96
User Satisfaction and Ease of use of the usability testing methodology:
5. I would like to participate in usability tests using this meeting environment.
6. This usability testing methodology was user friendly.
7. Learning to participate in the usability test in this environment was easy for me.
8. I found this meeting environment to be useful for a usability test.
9. Overall, I felt comfortable participating in the usability test.
0 1 2 3 4 5 6 7
Strongly
Disagree
Strongly
Agree
0 1 2 3 4 5 6 7
Strongly
Disagree
Strongly
Agree
0 1 2 3 4 5 6 7
Strongly
Disagree
Strongly
Agree
0 1 2 3 4 5 6 7
Strongly
Disagree
Strongly
Agree
0 1 2 3 4 5 6 7
Strongly
Disagree
Strongly
Agree
97
Quality of the usability test methodology
10. It was easy to identify usability defects in the website.
11. I feel confident that I identified the website’s most serious defects.
12. I had a strong sense of being with the usability expert within the environment.
13. I feel that I worked well with usability expert to complete the usability test.
14. I feel that the environment facilitated and supported collaboration with the test
administrator.
0 1 2 3 4 5 6 7
Strongly
Disagree
Strongly
Agree
0 1 2 3 4 5 6 7
Strongly
Disagree
Strongly
Agree
0 1 2 3 4 5 6 7
Strongly
Disagree
Strongly
Agree
0 1 2 3 4 5 6 7
Strongly
Disagree
Strongly
Agree
0 1 2 3 4 5 6 7
Strongly
Disagree
Strongly
Agree
98
15. I feel that the environment facilitated seamless communication (auditory and
visual) with the test administrator.
0 1 2 3 4 5 6 7
Strongly
Disagree
Strongly
Agree
99
16. List the most POSITIVE aspect of this meeting space for usability testing
17. List the most NEGATIVE aspect of this meeting space for usability testing
100
Appendix G
Usability test facilitator: Subjective Questionnaire
Please provide the following information based on your experience with the
Traditional in-lab usability test
Remote usability test using WebEx™
Remote Usability test using Wonderland.
Please provide subjective ratings for each of the usability testing environments with
respect to the feature.
1) Ease of use.
In-lab Usability test
WebEx™ based test
Usability test in Wonderland
0 1 2 3 4 5 6 7
Very
Difficult
Very
Easy
0 1 2 3 4 5 6 7
Very
Difficult
Very
Easy
0 1 2 3 4 5 6 7
Very
Difficult
Very
Easy
101
2) Seamless communication with the usability participant during the think-aloud
process.
In-lab Usability test
WebEx™ based test
Usability test in Wonderland
0 1 2 3 4 5 6 7
Very
Difficult
Very
Easy
0 1 2 3 4 5 6 7
Very
Difficult
Very
Easy
0 1 2 3 4 5 6 7
Very
Difficult
Very
Easy
102
3) A strong sense of presence with the usability participant.
In-lab Usability test
WebEx™ based test
Usability test in Wonderland
0 1 2 3 4 5 6 7
Never Always
0 1 2 3 4 5 6 7
Never Always
0 1 2 3 4 5 6 7
Never Always

103
4) Confidence in conducting the usability test.
In-lab Usability test
WebEx™ based test
Usability test in Wonderland
0 1 2 3 4 5 6
7
Not at all
confident
Very confident
0 1 2 3 4 5 6
7
Not at all
confident
Very confident
0 1 2 3 4 5 6 7
Not at all
confident
Very confident
104
5) Efficiency.
In-lab Usability test
WebEx™ based test
Usability test in Wonderland
0 1 2 3 4 5 6 7
Very
inefficient
Very
efficient
0 1 2 3 4 5 6 7
Very
inefficient
Very
efficient
0 1 2 3 4 5 6 7
Very
inefficient
Very
efficient
105
6) Ability to analyze user interaction with the web interface.
In-lab Usability test
WebEx™ based test
Usability test in Wonderland
0 1 2 3 4 5 6
7
Very
Difficult
Very
Easy
0 1 2 3 4 5 6 7
Very
Difficult
Very
Easy
0 1 2 3 4 5 6 7
Very
Difficult
Very
Easy

106
7) Comfort.
In-lab Usability test
WebEx™ based test
Usability test in Wonderland
0 1 2 3 4 5 6
7
Very
uncomfortable
Very
comfortable
0 1 2 3 4 5 6
7
Very
uncomfortable
Very
comfortable
0 1 2 3 4 5 6
7
Very
uncomfortable
Very
comfortable
107
8) As usability test administrator, how much would you like to use these
approaches?
In-lab Usability test
WebEx™ based test
Usability test in Wonderland
Thank you for your participation!
0 1 2 3 4 5 6 7
Never
Use
Frequently
use
0 1 2 3 4 5 6 7
Never
Use
Frequently
use
0 1 2 3 4 5 6
7
Never
Use
Frequently
use
108
REFERENCES
Bartek, V., & Cheatham, D. (2003). Experience remote usability testing, part 1.
Retrieved 8/12/2009, 2009, from http://www.ibm.com/developerworks/library/wa-
rmusts1/
Bartek, V., & Cheatham, D. (2003). Experience remote usability testing, part 2.
Retrieved 8/19/2009, 2009, from http://www.ibm.com/developerworks/library/wa-
rmusts2.html
Benford, S., Dourish, P., & Rodden, T. (2000). Introduction to the special issue on
human-computer interaction and collaborative virtual environments. ACM
Trans.Comput.-Hum.Interact., 7(4), 439-441.
Bias, R. (1991). Interface-walkthroughs: Efficient collaborative testing. IEEE Software,
8(5), 94-95. Retrieved from
http://doi.ieeecomputersociety.org/10.1109/MS.1991.10047
Brush, A. J. B., Ames, M., & Davis, J. (2004). A comparison of synchronous remote and
local usability studies for an expert interface. Paper presented at the CHI '04: CHI '04
Extended Abstracts on Human Factors in Computing Systems, Vienna, Austria. 1179-
1182. Retrieved from http://doi.acm.org/10.1145/985921.986018
Bruun, A., Gull, P., Hofmeister, L., & Stage, J. (2009). Let your users do the testing: A
comparison of three remote asynchronous usability testing methods. Paper presented
at the CHI '09: Proceedings of the 27th International Conference on Human Factors

109
in Computing Systems, Boston, MA, USA. 1619-1628. Retrieved from
http://doi.acm.org/10.1145/1518701.1518948
Card, S . K . , Moran, T. P., & Newell , A . (1983) The Psychology of Human-Computer
Interaction. Hillsdale, NJ: Erlbaum Assoc.
Castillo, J. C., Hartson, H. R., & Hix, D. (1998). Remote usability evaluation: Can users
report their own critical incidents? Paper presented at the CHI '98: CHI 98
Conference Summary on Human Factors in Computing Systems, Los Angeles,
California, United States. 253-254. Retrieved from
http://doi.acm.org/10.1145/286498.286736
Castillo, J. C. (1997). The user-reported critical incident method for remote usability
evaluation. (Master's thesis). Retrieved from
http://research.cs.vt.edu/usability/publications/castillo-remote-usability.pdf
Chin, J. P., Diehl, V. A., & Norman, K. L. (1988). Development of an instrument
measuring user satisfaction of the human-computer interface. Paper presented at the
CHI '88: Proceedings of the SIGCHI Conference on Human Factors in Computing
Systems, Washington, D.C. 213-218. Retrieved from
http://doi.acm.org/10.1145/57167.57203
De Lucia, A., Francese, R., Passero, I., & Tortora, G. (2008). Supporting jigsaw-based
collaborative learning in second life. Paper presented at the IEEE International
110
Conference on Advanced Learning Technologies (ICALT 2008), 806-8. Retrieved
from http://dx.doi.org/10.1109/ICALT.2008.61
del Galdo, E.M., Williges, R.C., Williges, B.H., & Nixon, D. (1986). An evaluation of
critical incidents for software documentation design. Proceedings of the 30th Annual
Meeting of the Human Factors Society, 19-23. Retrieved from
http://www.ingentaconnect.com/content/hfes/hfproc/1986/00000030/00000001/art00
004
Dray, S., & Siegel, D. (2004). Remote possibilities?: International usability testing at a
distance. Interactions, 11(2), 10-17.
Dumas, J. S., & Redish, J. C. (1999). A Practical Guide To Usability Testing, (Rev. ed.),
Bristol, England: Intellect Ltd.
Erbe, H., & Müller, D. (2006). Distributted work environments for collaborative
engineering Retrieved from http://dx.doi.org/10.1007/978-0-387-36594-7_14
Ericsson, K. A., & Simon, H. A. (1985). Protocol analysis : Verbal reports as data ,
(Rev. ed.). Cambridge, MA: The MIT Press.
Ericsson, K. A., & Simon, H. A. (1998). How to study thinking in everyday life:
Contrasting think-aloud protocols with descriptions and explanations of thinking.
Mind, Culture, and Activity, 5(3), 178. Retrieved from
http://www.informaworld.com/10.1207/s15327884mca0503_3
111
Greenstein, J. S., Hayes, H., Stephens, B. R., & Peters, C. L. (2007). The effect of
supplementing textual materials with virtual world experiences on learning and
engagement. In Proceedings of the Human Factors and Ergonomics Society 52nd
Annual Meeting, New York. 619-623.
Hammontree, M., Weiler, P., & Nayak, N. (1994). Remote usability testing. Interactions,
1(3), 21-25. Retrieved from http://doi.acm.org/10.1145/182966.182969
Hartson, H. R., Castillo, J. C., Kelso, J., & Neale, W. C. (1996). Remote evaluation: The
network as an extension of the usability laboratory. Paper presented at the CHI '96:
Proceedings of the SIGCHI Conference on Human Factors in Computing Systems,
Vancouver, British Columbia, Canada. 228-235. Retrieved from
http://doi.acm.org/10.1145/238386.238511
Hartson, H. R., & Castillo, J. C. (1998). Remote evaluation for post-deployment usability
improvement. Paper presented at the AVI '98: Proceedings of the Working
Conference on Advanced Visual Interfaces, L'Aquila, Italy. 22-29. Retrieved from
http://doi.acm.org/10.1145/948496.948499
Hartson, H. R., Andre, T. S., & Williges, R. C. (2003). Criteria for evaluating usability
evaluation methods. International Journal of Human-Computer Interaction, 15(1),
145-181.
112
Hong, J., Heer, J., Waterson, S., Landay, J. (2001). WebQuilt: A proxy-based approach to
remote web usability testing. ACM Trans.Inf.Syst., 19(3), 263-285. Retrieved from
http://doi.acm.org/10.1145/502115.502118
Kohler, T., Matzler, K., & Füller, J. (2009). Avatar-based innovation: Using virtual
worlds for real-world innovation. Technovation, 29(6-7), 395-407. doi:DOI:
10.1016/j.technovation.2008.11.004
Krauss, F. S. H. (2003). Methodology for remote usability activities: A case study. IBM
Syst.J., 42(4), 582-593.
Landauer, T. K. (1996). The trouble with computers: Usefulness, usability, and
productivity. Cambridge, MA: The MIT Press.
Lewis, C., Polson, P. G., Wharton, C., & Rieman, J. (1990). Testing a walkthrough
methodology for theory-based design of walk-up-and-use interfaces. Paper presented
at the CHI '90: Proceedings of the SIGCHI Conference on Human Factors in
Computing Systems, Seattle, Washington, United States. 235-242. Retrieved from
http://doi.acm.org/10.1145/97243.97279
Millen, D. R. (1999). Remote usability evaluation: User participation in the design of a
web-based email service. SIGGROUP Bull., 20(1), 40-45. Retrieved from
http://doi.acm.org/10.1145/327556.327616
113
Nielsen, J. (1992). Evaluating the thinking-aloud technique for use by computer
scientists. Advances in human-computer interaction (vol. 3) (pp. 69-82) Ablex
Publishing Corp.
Nielsen, J. (1995). Usability engineering. San Francisco, CA, USA: Morgan Kaufmann
Publishers Inc.
Nielsen, J., & Mack, R. L. (1994). Usability inspection methods. New York, NY, USA:
John Wiley \& Sons, Inc.
Nielsen, J. (2000). Usability testing with 5 users (jakob nielsen's alertbox). Retrieved
8/12/2009, 2009, from http://www.useit.com/alertbox/20000319.html
Nielsen, J. (2005). Severity ratings for usability problems. Retrieved 8/12/2009, 2009,
from http://www.useit.com/papers/heuristic/severityrating.html
Nielsen, J., & Landauer, T. K. (1993). A mathematical model of the finding of usability
problems. Paper presented at the CHI '93: Proceedings of the INTERACT '93 and CHI
'93 Conference on Human Factors in Computing Systems, Amsterdam, The
Netherlands. 206-213. Retrieved from http://doi.acm.org/10.1145/169059.169166
Nielsen, J., & Levy, J. (1994). Measuring usability preference vs. performance.
Communications of the ACM, 37(4), 66-75. Retrieved from
http://dx.doi.org/10.1145/175276.175282
114
Nielsen, J., & Mack L., R. (1994). Heuristic evaluation. In J. Nielsen, & R. Mack L.
(Eds.), Usability inspection methods (pp. 25-64) Wiley.
Nielsen, J., & Molich, R. (1990). Heuristic evaluation of user interfaces. Paper presented
at the CHI '90: Proceedings of the SIGCHI Conference on Human Factors in
Computing Systems, Seattle, Washington, United States. 249-256. Retrieved from
http://doi.acm.org/10.1145/97243.97281
Paganelli, L., & Paterno Fabio. (2002). Intelligent analysis of user interactions with web
applications. Paper presented at the IUI '02: Proceedings of the 7th International
Conference on Intelligent User Interfaces, San Francisco, California, USA. 111-118.
Retrieved from http://doi.acm.org/10.1145/502716.502735
Polson, P. G., & Lewis, C. H. (1990). Theory-based design for easily learned interfaces.
Hum.-Comput.Interact., 5(2), 191-220.
Scholtz, J. (2001). Adaptation of traditional usability testing methods for remote testing.
Paper presented at the HICSS '01: Proceedings of the 34th Annual Hawaii
International Conference on System Sciences ( HICSS-34)-Volume 5, 5030.
Sears, A., Jacko, J., Sears, A., & Jacko, J. (2007). The human-computer interaction
handbook: Fundamentals, evolving technologies, and emerging applications, second
edition (human factors and ergonomics) CRC.
115
Selvaraj, P. (2004). Comparative study of synchronous remote and traditional lab
usability evaluation methods. (Master's thesis). Retrieved from
http://scholar.lib.vt.edu/theses/available/etd-05192004-
122952/unrestricted/Thesis_Prakaash_Selvaraj.pdf
Shneiderman, B. (1980). Software psychology: Human factors in computer and
information systems (winthrop computer systems series),Cambridge, MA: Winthrop
Publishers.
Spool, J., & Schroeder, W. (2001). Testing web sites: Five users is nowhere near enough.
Paper presented at the CHI '01: CHI '01 Extended Abstracts on Human Factors in
Computing Systems, Seattle, Washington. 285-286. Retrieved from
http://doi.acm.org/10.1145/634067.634236
Thompson, K. E., Rozanski, E. P., & Haake, A. R. (2004). Here, there, anywhere:
Remote usability testing that works. Paper presented at the CITC5 '04: Proceedings
of the 5th Conference on Information Technology Education, Salt Lake City, UT,
USA. 132-137. Retrieved from http://doi.acm.org/10.1145/1029533.1029567
Traum, M. (2007). Second life: A virtual universe for real engineering. Retrieved March
8, 2009, from http://www.designnews.com/article/6322-
Second_Life_A_Virtual_Universe_for_Real_Engineering.php
116
Tullis, T., Fleischman, S., McNulty, M., Cianchette, C., and Bergel, M. (2002). An
empirical comparison of lab and remote usability testing of web Sites. In Proc. UPA
2002, Usability Professional's Association.
U.S. Department of Health & Human Services. (2002). Can usability be measured? -
usability basics | usability.gov. Retrieved 9/9/2009, 2009, from
http://www.usability.gov/basics/measured.html
Vasnaik, O., & Longoria, R. (2006). Bridging the gap with a remote user. In Proc. UPA
2002, Usability Professional's Association.
Virzi, R. A. (1992). Refining the test phase of usability evaluation: How many subjects
is enough? Hum.Factors, 34(4), 457-468.
Whiteside, J., Bennett, J., & Holtzblatt, K. (1988). Usability engineering: Our experience
and evolution. Handbook of human-computer interaction (2nd ed., pp. 791-817)
Elsevier Science Pub Co.
Winckler, M. A. A., Freitas, C. M. D. S., & de Lima, J. V. (2000). Usability remote
evaluation for WWW. Paper presented at the CHI '00: CHI '00 Extended Abstracts
on Human Factors in Computing Systems, The Hague, The Netherlands. 131-132.
Retrieved from http://doi.acm.org/10.1145/633292.633367