Remote temperature monitoring device using a … · Remote temperature monitoring device using a...
9
DEVELOPMENT REPORT Open Access Remote temperature monitoring device using a multiple patients-coordinator set design approach Cheng S Chin 1* , William Atmodihardjo 2 , Lok W Woo 1 and Ehsan Mesbahi 1 Abstract This paper aims to develop a prototype for a web-based wireless remote temperature monitoring device for patients. This device uses a patient and coordinator set design approach involving the measurement, transmission, receipt and recording of patients’ temperatures via the MiWi wireless network. The results of experimental tests on the proposed system indicated a wider distance coverage and reasonable temperature resolution and standard deviation. The system could display the temperature and patient information remotely via a graphical-user interface as shown in the tests on three healthy participants. By continuously monitoring participants’ temperatures, this device will likely improve the quality of the health care of the patients in normal ward as less human workload is involved. Keywords: Temperature; Wireless; Web-based; Remote; Monitoring; Patient set; Coordinator set Background During the severe acute respiratory syndrome (SARS) outbreak in 2003, hospitals became treatment centres in most countries. Because a patient’ s core body tempera- ture is one vital parameter for monitoring the progress of the patient’ s health, it is often measured manually at a frequency ranging from once every few hours to once a day [1]. However, such manual measurement of the temperature of patients requires the efforts of many staff members. In addition, when the patients suffer from conditions that result in abrupt changes of the core body temperature, e.g., due to infection at a surgical site after surgery, the staff on duty will not know such a tem- perature change occurred until the next temperature measurement. Such a delay may lead to patients being unnoticed while their health conditions worsen, which is dangerous because a difference of 1.5 degrees Celsius can result in adverse outcomes [2]. Furthermore, there is always a need to have a monitoring system to improve the quality of health care [3], such as temperature moni- toring of elderly and challenged persons using a wireless remote temperature monitoring system. Body temperature can be used to monitor the pain level of a patient following an operation [4] or after shoulder endoprosthesis [5]. In some cases, the tissue transient temperature was monitored during microwave liver ablation [6] for the treatment of liver metastases. Instead of using a temperature sensor, pulse-echo ultra- sound [7] was used to visualize changes in the tempe- rature of the patient’ s body. In addition, a non-contact temperature-measuring device, such as a thermal ima- ging camera [8], was successfully used to detect human body temperature during the SARS outbreak. However, it can be quite expensive to equip each patient room with a thermal imaging camera. In addition, there are a few wireless temperature-monitoring systems (e.g., CADIT™, Primex™, and TempTrak™) on the market that are used to monitor and store a patient’ s temperature for medical research by using body sensor networks [9]. Most of these systems consist of an electronic module and a temperature-sensing device. The systems include a stand-alone electronic module with a display screen that allows the temperature sensor data to be transmit- ted over a secure wireless network. However, these systems can be difficult to reconfigure to suit the current database system used in the hospital. In addition, the current systems using short message ser- vice (SMS)-based telemedicine [10] systems with hard- ware equipment were developed to monitor the mobility of patients. However, proper hardware and software to manage the messages and the patient’ s temperature for display on mobile phones are not widely available. * Correspondence: [email protected] 1 Faculty of Science Agriculture and Engineering, University of Newcastle upon Tyne, Newcastle upon Tyne NE1 7RU, United Kingdom Full list of author information is available at the end of the article © 2015 Chin et al.; licensee Springer. This is an Open Access article distributed under the terms of the Creative Commons Attribution License (http://creativecommons.org/licenses/by/4.0), which permits unrestricted use, distribution, and reproduction in any medium, provided the original work is properly credited. Chin et al. ROBOMECH Journal (2015) 2:4 DOI 10.1186/s40648-015-0027-x
Transcript of Remote temperature monitoring device using a … · Remote temperature monitoring device using a...
Chin et al. ROBOMECH Journal (2015) 2:4 DOI 10.1186/s40648-015-0027-x
DEVELOPMENT REPORT Open Access
Remote temperature monitoring device using amultiple patients-coordinator set design approachCheng S Chin1*, William Atmodihardjo2, Lok W Woo1 and Ehsan Mesbahi1
Abstract
This paper aims to develop a prototype for a web-based wireless remote temperature monitoring device forpatients. This device uses a patient and coordinator set design approach involving the measurement, transmission,receipt and recording of patients’ temperatures via the MiWi wireless network. The results of experimental tests onthe proposed system indicated a wider distance coverage and reasonable temperature resolution and standarddeviation. The system could display the temperature and patient information remotely via a graphical-user interfaceas shown in the tests on three healthy participants. By continuously monitoring participants’ temperatures, this devicewill likely improve the quality of the health care of the patients in normal ward as less human workload is involved.
Keywords: Temperature; Wireless; Web-based; Remote; Monitoring; Patient set; Coordinator set
BackgroundDuring the severe acute respiratory syndrome (SARS)outbreak in 2003, hospitals became treatment centres inmost countries. Because a patient’s core body tempera-ture is one vital parameter for monitoring the progressof the patient’s health, it is often measured manually at afrequency ranging from once every few hours to once aday [1]. However, such manual measurement of thetemperature of patients requires the efforts of many staffmembers. In addition, when the patients suffer fromconditions that result in abrupt changes of the core bodytemperature, e.g., due to infection at a surgical site aftersurgery, the staff on duty will not know such a tem-perature change occurred until the next temperaturemeasurement. Such a delay may lead to patients beingunnoticed while their health conditions worsen, which isdangerous because a difference of 1.5 degrees Celsiuscan result in adverse outcomes [2]. Furthermore, there isalways a need to have a monitoring system to improvethe quality of health care [3], such as temperature moni-toring of elderly and challenged persons using a wirelessremote temperature monitoring system.Body temperature can be used to monitor the pain
level of a patient following an operation [4] or after
* Correspondence: [email protected] of Science Agriculture and Engineering, University of Newcastleupon Tyne, Newcastle upon Tyne NE1 7RU, United KingdomFull list of author information is available at the end of the article
© 2015 Chin et al.; licensee Springer. This is anAttribution License (http://creativecommons.orin any medium, provided the original work is p
shoulder endoprosthesis [5]. In some cases, the tissuetransient temperature was monitored during microwaveliver ablation [6] for the treatment of liver metastases.Instead of using a temperature sensor, pulse-echo ultra-sound [7] was used to visualize changes in the tempe-rature of the patient’s body. In addition, a non-contacttemperature-measuring device, such as a thermal ima-ging camera [8], was successfully used to detect humanbody temperature during the SARS outbreak. However,it can be quite expensive to equip each patient roomwith a thermal imaging camera. In addition, there area few wireless temperature-monitoring systems (e.g.,CADIT™, Primex™, and TempTrak™) on the market thatare used to monitor and store a patient’s temperaturefor medical research by using body sensor networks [9].Most of these systems consist of an electronic moduleand a temperature-sensing device. The systems includea stand-alone electronic module with a display screenthat allows the temperature sensor data to be transmit-ted over a secure wireless network.However, these systems can be difficult to reconfigure
to suit the current database system used in the hospital.In addition, the current systems using short message ser-vice (SMS)-based telemedicine [10] systems with hard-ware equipment were developed to monitor the mobilityof patients. However, proper hardware and software tomanage the messages and the patient’s temperature fordisplay on mobile phones are not widely available.
Open Access article distributed under the terms of the Creative Commonsg/licenses/by/4.0), which permits unrestricted use, distribution, and reproductionroperly credited.

Chin et al. ROBOMECH Journal (2015) 2:4 Page 2 of 9
Hence, a medical device to continuously measure thebody temperature of patients using a wireless tempera-ture sensor [4,11,12] is required. With such a wirelesstemperature sensor system, nurses will no longer have tomanually measure the temperature of patients, whichwill free their time for other tasks and also reduce therisk associated with coming into contact with patientswith contagious diseases, such as SARS. The readingswill be transmitted wirelessly to the central nurse sta-tion, where they can be monitored by the staff-on-duty.In addition, the current and past history of the bodytemperature measurements can be stored in an onlinedatabase, which allows the medical staff to access thedatabase when they are not in the hospital.To the best of our knowledge, a MiWi wireless (besides
using the Zigbee[11]) temperature-monitoring systemusing a patient and coordinator set design that pro-vides remote internet access to the temperature data-base has not been reported in any publication. Theobjective is therefore to develop and implement aprototype temperature-monitoring system for patientsusing a MiWi wireless remote connection to thenurse’s station for frequent real-time monitoring. Thetemperature monitoring system was designed based ona proposed patient and coordinator set design ap-proach. The proposed temperature-monitoring systemfor use in normal ward will likely to improve the qual-ity of the health care of the patients as the nursingworkload is reduced. In this paper, the discussion onmedical regulations and policy will not be included.
MethodDesign concepts of the wireless remote temperature-monitoring systemThe core body temperature of a human is one of thevital statistics used to determine individual health. Nor-mal human body temperature (normothermia) is approxi-mately 37°C, with variations depending on factors suchas age and geological factor [13]. When the body failsto regulate itself by dissipating heat, it increases the
Table 1 Wireless technologies comparison
Descriptions ZigBee B
Applications Control and monitoring, sensor networks W
Data rate 20,40, and 250 kbps 1
Frequency band 868 MHz, 900-928 MHz, and 2.4GHz 2
Range (meters) 10-100 1
Nodes per network 65,000 7
Memory 32-60 Kb 1
Topology Star, tree, and mesh T
Complexity Low H
Power consumption Very low M
Standby current 3 μA 2
core body temperature above the normal condition.This condition is called hyperthermia. The highest re-corded surviving core body temperature is 45°C [14].Generally, there are four locations [15] that can be usedto measure human core body temperature, rectal (anus),oral (mouth), tympanic (ear) and axillary (armpit), withthe rectal measurement considered to be the most ac-curate in measuring the core body temperature. Rectalmeasurement of body temperature is the preferred me-thod to perform a core body temperature measurement.In order to track a patient’s core body temperature wire-lessly (assuming the patient is not moving), the axillarymeasurement was chosen for the initial trial. The pro-posed measurement system must be able to measurewithin the temperature deviation [16,17] of 0.3-0.5°C anddetect changes in the human body temperature (at mini-mum resolution of 0.1°C).
MiWi wireless networkThe originality of the paper is to develop and test a proto-type temperature-monitoring system for patients using theMiWi wireless remote connection to the nurse’s stationfor frequent real-time monitoring. As this project aims tobe implemented in a hospital environment, when choosingthe appropriate wireless technology it should be noted thatthe chosen technology should be the best choice in termsof cost, connectivity range, speed, etc. for the chosen en-vironment. Table 1 below depicts the comparison betweenZigBee, Bluetooth and Wi-Fi.It is concluded from the table that ZigBee is the most
fitting technology for this project. The main reason forthis decision is because ZigBee requires very low powerconsumption by staying on sleep mode most of the timewhile still having the same range potential as Bluetoothand Wi-Fi. Another advantage of using ZigBee comesfrom having more possible topology which is star thatallows 1 FFD (Full Function Device) unit to control mul-tiple RFD (Reduced Function Device) units and meshwhich allows the system to be more resistant to RFDunit breaking down as can be seen on Figure 1. While
luetooth Wi-Fi
ireless connection between devices Wireless LAN, internet access
Mbps 11 and 55 Mbps
.4GHz 2.4 and 5 GHz
0 50-100
30
00 Kb 100 Kb
ree Tree
igh High
edium High
00 μA 20 μA

Figure 1 Different ZigBee topologies.
Chin et al. ROBOMECH Journal (2015) 2:4 Page 3 of 9
ZigBee has lower data rate than the other two, it is suffi-cient for transmitting the temperature data that will bemeasured in this project.ZigBee’s is mostly used in low power, low data rate ap-
plication such as home monitoring system due to itsbenefits compared to other wireless technologies as ex-plained in Table 1. Each device can be configured intotwo different types: FFD which can communicate withboth types and RFD which can only communicate withFFD type. FFD can be configured into a coordinatorwhich is the base station in this project, or router whichserves to extend the range of the system. FFD is config-ured as patient’s unit in this project. The ZigBee networkitself works in layers as shown in Figure 2 with each hav-ing specific task to manage the wireless connection. ThePHY (physical) layer manages data transmission by per-forming quality checking on both channel frequency andin/outgoing signals and also managing the RF transceivermodule. Some of the specific tasks it needs to do areenergy detection, link quality indication, clear channelassessment and channel selection. The MAC (MediaAccess Control) layer manages the access of data intothe frequency channel and control the network beacon-ing. It also assigns time slots for the transmitted data
Figure 2 ZigBee wireless network layers.
and manages data security. The NWK (network) layermanages the whole network connectivity by doing taskssuch as ensuring the MAC layer is used correctly andidentifying whether a neighbouring device belongs to thesystem or not. The NWK layer is also responsible for cre-ating a suitable interface for highest APL (application)layer in which the users can interact with the ZigBee ap-plication and interface.Unfortunately, the ZigBee protocol stack is too large
for most commonly used MCUs’ memory to handle.Therefore MiWi protocol stack will be used instead.MiWi wireless transceiver (MRF24J40MA) used in theproject support P2P protocol. There is no significant dif-ferent from other P2P protocols. But when comparedwith the ZigBee protocol stack, ZigBee protocol is toolarge for most commonly used MCUs’ memory to han-dle. The reason is that MiWi protocol stack only usesthe MAC and PHY layers which reduce the code used.Another merits using MiWi P2P are the protocol is pro-prietary and it is not interoperable. In addition, MiWiP2P has also a small footprint and a very low overheadas compared with ZigBee protocol. However, the de-merits of MiWi P2P are the small network size and onlyallow small number of hops.

Chin et al. ROBOMECH Journal (2015) 2:4 Page 4 of 9
When compared to grid networks which provide manyservers to moderate-sized communities and emphasizethe integration of resources to deliver in an environmentof at least limited trust, P2P deal with many more partic-ipants but offer limited and specialized servers, havebeen less concerned with qualities of service, and limitedassumptions about trust. But as system scale increases inthe grid networks, it may face and address problems re-lating to autonomic configuration and management. Onthe other hand, the P2P developed rapidly around shar-ing and are now seeking to expand to more sophisticatedapplications and management.
Multiple patients-coordinator set design approachTo accomplish the axillary temperature measurement,the wireless remote temperature monitoring system de-sign (see Figure 3) includes a MiWi wireless transceiver(MRF24J40MA), a PIC microprocessor (PIC18LF4620)/MCU, a temperature sensing circuit, a patient set (onthe patients) and a coordinator set (at the nurse’s station)for the data coordination between the patients and thecentral nurse station. The temperature sensor producedan output voltage (and power consumption of 0.24 mW)with a magnitude equal to the body temperature. Theanalogue-to-digital convertor (ADC) had 13 analoguechannels and a 10-bit resolution in the microprocessor toconvert the output voltage into digital values. The patient’stransceiver transmitted that digital value via the MiWiwireless protocol stack to the coordinator’s transceiver.The coordinator MCU sent the temperature reading tothe computer through RS232 that records and stored thetemperature measurements in the database. The proposedwireless temperature-monitoring device could support
Figure 3 Overall block diagram of the multiple patients-coordinator s
multiple patients when they were connected to the samewireless network.There are a few wireless and wired temperature sen-
sors available to monitor the temperature of patients.The temperature resolution is approximately +/-0.2°Cfor the range 25-60°C. However, a 1.5°C loss [2] in bodytemperature, e.g., due to surgical site infection after sur-gery, may lead to adverse outcomes. Hence, a resolutionof +/- 0.1°C is required. Because the highest recordedsurviving core body temperature is 45°C, the temperaturerange required for the temperature sensor is reduced.For initial prototyping, a non-medical-grade LM35CAZtemperature sensor with a maximum range of 45°C wasused. The temperature sensor used draws only 60 μAfrom its supply and power consumption is approxi-mately 0.24 mW. The following is the specifications ofthe LM35CAZ temperature sensor.
� Calibrated Directly in ° Celsius (Centigrade)� Linear + 10 mV/°C Scale Factor� 0.5°C Ensured Accuracy (at +25°C)� Rated for Full −55°C to +150°C Range� Operates from 4 to 30 V� Less than 60-μA Current Drain� Low Self-Heating, 0.08°C in Still Air� Low Impedance Output, 0.1 Ω for 1 mA Load
Thus, the only advantage compared to the medical-grade sensor is the low power consumption. Nevertheless,the sensor can be replaced with any medical-gradetemperature probe (such as a standard stick-on skinprobe) with minor changes in the hardware andsoftware.
et design approach.

Chin et al. ROBOMECH Journal (2015) 2:4 Page 5 of 9
Patient set designThe patient set consists of three main components: tem-perature sensor circuit, MCU and transceiver. The elec-tronic components were mounted onto a small PCBboard and connected to the patient’s MCU. As shown inFigure 4, the setup (within the enclosure) was strapped tothe patient’s arm during temperature monitoring.Initially, only two patient sets were used. When the pa-
tient MCU was turned on, it established a connection withthe coordinator set using a wireless protocol stack. For theinitial phase of the project, the easy-to-use alternative forsimple wireless communication of MiWi (by MicroChip)was used to implement the low-cost and power wirelesscontrol networks (with a battery usage of 95-115 μWcompared with ZigBee at approximately 30 mW).A MiWi wireless transceiver module (MRF24J40MA-
2.5GHz IEEE 802.15.4) was mounted onto a carrier board.To allow easy configuration and to monitor packet trans-actions, a ZENA wireless network analyser (DM183023)and software were used. Figure 5 (top) shows an exampleof a transmitted message viewed on the ZENA networkanalyser. The first line indicates the patient node attempt-ing to join a network, while the second line indicates thecoordinator recognizing the patient node as a member ofthe network.Because the ADC has 10 bits, the output was sepa-
rated into two registers (two bytes). The 2-byte digitaloutput values were sent to the coordinator set with anadditional byte to indicate which patient set sent thedata. Sometimes, there may be a disruption or glitch inthe MiWi wireless network that prevents the coordin-ator from receiving the data from the patient. To over-come this issue, a cyclic redundancy check (CRC) of 16bits (or 2 bytes in length) was used to determine whe-ther the packet was correctly transmitted. For example,if the entire set of bits was correct, the CRC valuematched. FCS had the OK bit in the last byte of the data.However, if a single bit was incorrect, the data need tobe retransmitted.
Figure 4 Prototype temperature-monitoring system strapped on pati
The patient set temperature conversion process fromthe temperature sensor is as follows. The temperaturesensor of Patient Set 1 produced an output voltage of0.365 V or 36.5°C. This voltage was amplified 5.12 timesto 1.868 V. The ADC converted the voltage into tworegisters of 1 byte each (conversion to hexadecimal) toobtain 02 46. Subsequently, the MCU added an add-itional byte to identify the patient set. If Patient Set 1was used, the extra byte was 01. Subsequently, the trans-ceiver transmitted the 3 bytes to the coordinator MCUand displayed the temperature on the computer with theGUI.
Coordinator set designAs shown in Figure 5 (centre), the coordinator set re-quires a similar MCU and transceiver in the patient set.Each patient set was designed to send a message of 3bytes to the coordinator MCU. The coordinator’s MCUperforms a few tasks, as shown in the flow chart. Thetasks was to establish a connection with each patientset, send an acknowledgement byte to the patient setafter receiving the message, and send the message tothe coordinator. The GUI of the coordinator set cre-ated a text file containing the temperature reading for aday. The file was stored in the local PC folder with allof the temperature data, the patients’ name (with serialor patient number) and the time stamps. The graphicalrepresentation of the temperature distribution of thepatient is shown in Figure 5. Statistical information,such as the mean and standard deviation for certaintime frame, was then computed. The information wasdisplayed on the staff computer near the coordinatorpatient set.
Patient and coordinator set wireless transmission testsThe hardware setup in the laboratory consists of thetemperature sensor, amplifier circuit, coordinator MCUand patient MCU, as shown in Figure 4 (right). The out-put voltage was calibrated and compared with a digital
ent set 1 (left) and circuit board (right).
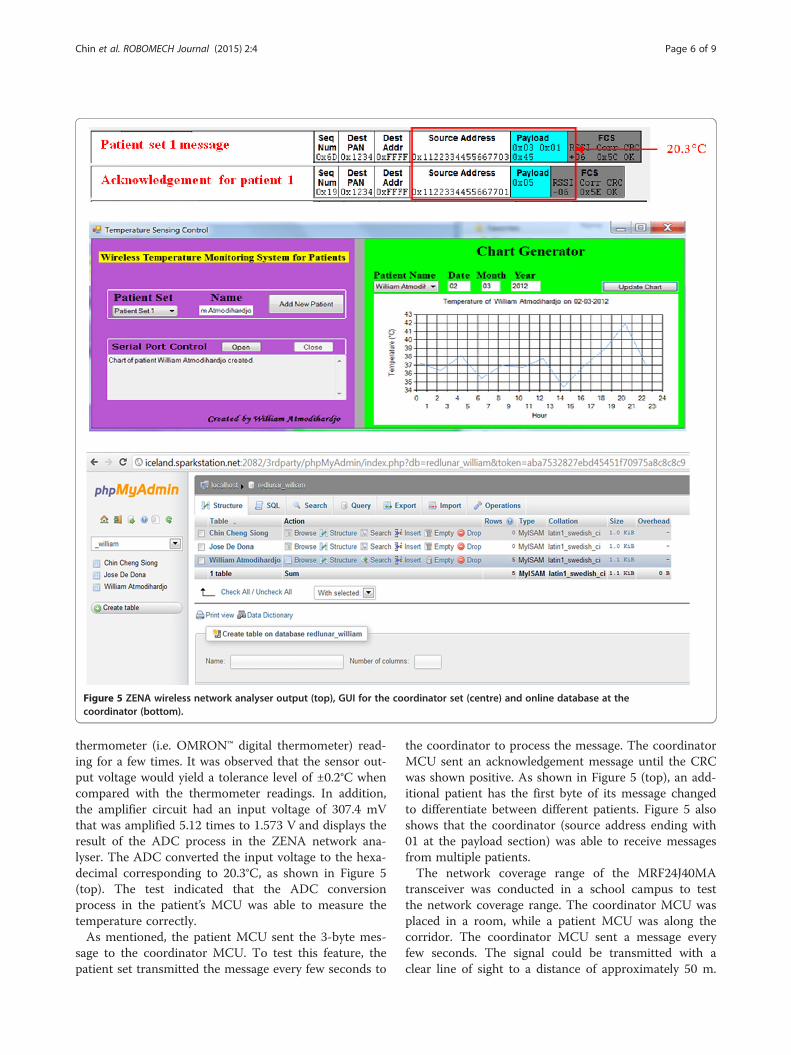
Figure 5 ZENA wireless network analyser output (top), GUI for the coordinator set (centre) and online database at thecoordinator (bottom).
Chin et al. ROBOMECH Journal (2015) 2:4 Page 6 of 9
thermometer (i.e. OMRON™ digital thermometer) read-ing for a few times. It was observed that the sensor out-put voltage would yield a tolerance level of ±0.2°C whencompared with the thermometer readings. In addition,the amplifier circuit had an input voltage of 307.4 mVthat was amplified 5.12 times to 1.573 V and displays theresult of the ADC process in the ZENA network ana-lyser. The ADC converted the input voltage to the hexa-decimal corresponding to 20.3°C, as shown in Figure 5(top). The test indicated that the ADC conversionprocess in the patient’s MCU was able to measure thetemperature correctly.As mentioned, the patient MCU sent the 3-byte mes-
sage to the coordinator MCU. To test this feature, thepatient set transmitted the message every few seconds to
the coordinator to process the message. The coordinatorMCU sent an acknowledgement message until the CRCwas shown positive. As shown in Figure 5 (top), an add-itional patient has the first byte of its message changedto differentiate between different patients. Figure 5 alsoshows that the coordinator (source address ending with01 at the payload section) was able to receive messagesfrom multiple patients.The network coverage range of the MRF24J40MA
transceiver was conducted in a school campus to testthe network coverage range. The coordinator MCU wasplaced in a room, while a patient MCU was along thecorridor. The coordinator MCU sent a message everyfew seconds. The signal could be transmitted with aclear line of sight to a distance of approximately 50 m.

Chin et al. ROBOMECH Journal (2015) 2:4 Page 7 of 9
In addition to testing the indoor network coverage, therange of 120 meters provided in the datasheet was validatedin a test outdoors at an ambient temperature of 26°C.
ResultsActual implementation of the proposed system onpatientsThe proposed wireless remote temperature monitoringdevice was tested on three healthy participants at aclassroom (with computers) in the school environmentfor three different days. We took their temperaturewhen they were sitting during the experiment. The sen-sor was attached to the body during the measurementonly. They took the sensor off when they wanted torelax and lay on foldable beds.The authors had received the ethics approvals and in-
formed consent from the three participants before thetests were conducted.The GUI of the coordinator set (for the nurse’s station)
in Figure 5 (centre) was used. The coordinator set wasconnected to the coordinator computer via the RS-232serial cable. Each time the coordinator MCU received atemperature reading message, it sent the message to thecoordinator’s computer. Upon clicking on the ‘UpdateChart’ button, the GUI read and generated the tempe-rature record chart for that particular patient and date.Once the message was received, the GUI converted theinputs to actual temperature reading.The user can allocate a patient name tagged with his/
her admission serial number. Once allocated, the patientname with the serial number was applied to the localfolder in the database. Figure 5 (bottom) shows the localtemperature record of a subject. The temperature recordwas saved in the text file, and the data were formatted as“Temperature-Time”.In the nurse’s station, the two main components used
in the implementation of the online database were the
Figure 6 Temperature of three different participants over three days.
MySQL database and the PHP scripts. An online hostingserver called sparkstation.net was used. Each set of pa-tient information includes the temperature, time, anddate created by the coordinator. To operate the systemproperly, the users were trained to retrieve and providethe correct patient information. There was an added fea-ture of using different colours to indicate the patientswith high fever; in addition, in the event of a large stand-ard deviation (or equivalent to a sharp slope), an alarmwould be triggered.Statistical information, such as the mean and the
standard deviation, for evaluating the data variation wasdetermined. For an initial trial, 20 minutes of recordingand sampling at an interval of 2 minutes was conductedto test the proposed system. The subsequent tempera-ture recording was sampled or taken in every hour. Themean of the participant temperature was 36.6 (95% con-fidence intervals of 35.9 and 37.3). The standard devi-ation was 1.0 (95% confidence intervals of 0.7 and 1.8),and the median was 36.9 (95% confidence intervals of36.0 and 37.2).The wireless remote temperature monitoring system
was tested in three different days (named D1, D2 andD3) on three healthy male participants (named P1, P2and P3) with ages ranging from 28 to 30 years. Theinterval between each measurement was set to one hour,starting at 1 am. The body temperatures of the three par-ticipants were recorded and plotted on a time series plot,as shown in Figure 6. The statistical mean temperaturesfor P1, P2, and P3 on different days were 36.8°C, 36.7°C,and 37.8°C, respectively, and the statistical standard devia-tions for P1, P2, and P3 were approximately 0.3°C. Thesevalues were computed using the temperature data col-lected over 24 hour.As seen in Figure 6, the wireless remote temperature
monitoring system was able to measure the temperaturesof the participants from 1st to 24th hour. The highest

Chin et al. ROBOMECH Journal (2015) 2:4 Page 8 of 9
standard deviation was approximately 0.3°C, which iswithin the range of 0.3 to 0.5°C [16,17] in an enclosedbuilding environment throughout the test period. In sum-mary, the proposed system could measure body tempe-rature within the resolution of 0.3 to 0.5°C and exhibitsmall standard deviation of 0.3°C.
DiscussionsThe temperature readings of the participants who worethe portable temperature monitoring devices were trans-mitted wirelessly to the main station where they weremonitored. The body temperature measurements werestored in an online database, which allowed the userto access the database when they were not with theparticipants.The target patients using the device are for those in
the normal wards instead of intensive care unit (ICU).Although the monitoring once a day is enough to detectthe adverse or other problems because the nurses goaround the normal wards to see the patients, the pro-posed device helps to free their time for other tasks andalso reduce the risk associated with coming into contactwith patients with contagious diseases. With the help ofthe device, it offers an added precautionary measure toensure adequate temperature monitoring for all patientsin the normal ward are done with minimal effort. Duringthe tests on the three participants in different days, weobserved that the P1 and P2 had a higher temperaturethan P3 in particular on the Day 3. That might be due tosome “exhaustion” after 2 days. We did suspect thetemperature sensor problem but when we calibrated thetemperature against the thermometer, it was fine. Thereason for no trend in the temperature reason (such ashaving the circadian rhythm [18]) is due to the partici-pants was actually quite awake (for example, they werechatting and playing with their smart phones) and theydid not really fall into sleep.
ConclusionsThis paper presents a web-based MiWi wireless remotetemperature-monitoring device using temperature sen-sors for the axillary measurement. The temperature datawere sent via the MiWi wireless protocol to the nurse’sstation connected to internet. This approach was facili-tated by a patient and coordinator set design that con-nects the process of monitoring, transmitting, alertingand recording of the temperature. The experimentaltests on the proposed device indicated that it provideslong-distance coverage, a temperature resolution of 0.3to 0.5°C and small standard deviation of approximately0.3°C. Importantly, the system will likely to improve thequality of care through 24-hour continuous monitoringof the temperature of patients and reducing the work-load of the nursing staff in normal ward.
The remote temperature monitoring device will be fur-ther developed into a low-cost product with plug-and-play feature that enable untrained nurse or doctors touse with minimal assistance. The software interface forusers will be improved and made easy to be installedand downloaded. For future work involving remotemonitoring, the use of different wireless network proto-cols, such as ZigBee and WiFi, will be compared. Astandard medical temperature probe, such as a tympanicprobe, and standard disposable tape will be used for finalimplementation in the hospital. Further evaluation ofthe proposed system against current measurement tech-niques needs to be performed. The privacy and securityprotection and export to clinical information system(CIS) will be studied.
Competing interestsThe authors declare that they have no competing interests.
Authors’ contributionsCSC carried out the design concepts of the wireless remote temperature-monitoring system and testing. WA carried out the systems integration,programming, and testing on participants. WLW carried out the dataanalysis. EM provided advice on future works and proof-reading of paper. Allauthors read and approved the final manuscript.
AcknowledgementsThe authors would like to thanks Newcastle University (UK) and University ofNewcastle (Australia) for providing the support during the project.
Author details1Faculty of Science Agriculture and Engineering, University of Newcastleupon Tyne, Newcastle upon Tyne NE1 7RU, United Kingdom. 2Faculty ofEngineering and Built Environment, University of Newcastle, Callaghan, NSW2308, Australia.
Received: 30 September 2014 Accepted: 2 January 2015
References1. Rush M, Wetherall A (2003) Temperature measurement: practice guidelines.
Paediatr Nurs 15(9):25–282. Mahoney C, Odom J (1999) Monitoring intraoperative normothermia: a
meta-analysis of outcomes with costs. AANA J 67(2):155–1643. Yamakoshi KI (2011) In the spotlight: bioinstrumentation. IEEE Rev Biomed
Eng 4:6–84. Jiann SS, Chun YD, Yeong RW, Wei ZS (2007) A novel fuzzy pain demand
index derived from patient-controlled analgesia for postoperative pain.IEEE Trans Biomed Eng 54(12):2123–2132
5. Graichen F, Arnold R, Rohlmann A, Bergmann G (2007) Implantable9-channel telemetry system for in vivo load measurements with orthopedicimplants. IEEE Trans Biomed Eng 54(2):253–261
6. Yang D, Converse MC, Mahvi DM, Webster JG (2007) Measurement andanalysis of tissue temperature during microwave liver ablation. IEEE TransBiomed Eng 54(1):150–155
7. Liu DL, Ebbini ES (2010) Real-time 2-D temperature imaging usingultrasound. IEEE Trans Biomed Eng 57(1):12–16
8. Ng EY (2005). Is thermal scanner losing its bite in mass screening of feverdue to SARS? Medical Physics 32(1):93-7.
9. Bae J, Song K, Lee HW, Cho HW, Yoo HJ (2012) A low-energy crystal-lessdouble-FSK sensor node transceiver for wireless body-area network.IEEE J Solid-State Circuits 47(11):2678–2692
10. Scanail I, Cliodhna N, Ahearne B, Lyons GM (2006) Long-term telemonitoringof mobility trends of elderly people using SMS messaging. IEEE Trans InfTechnol Biomed 10(2):412–413
Chin et al. ROBOMECH Journal (2015) 2:4 Page 9 of 9
11. Malhi K, Mukhopadhyay SC, Schnepper J, Haefke M, Ewald H (2012) Azigbee-based wearable physiological parameters monitoring system.IEEE Journal of Sensors 12(3): 423–430
12. Shahriyar R, Bari MF, Kundu G, Ahamed SI, Akbar MM (2009) Intelligentmobile health monitoring system. Int J Control Automation 2(3):13–27
13. Ivy AC (1945) Comment: what is normal body temperature?Gastroenterology 5:326–329
14. Jeffrey RS (2007) Recovery from severe hyperthermia (45°C) andrhabdomyolysis induced by methamphetamine body-stuffing. J Emerg Med8(3):93–95
15. Levander S, Forsberg MC, Wahren LK (2002) Normal oral, rectal, tympanicand axillary body temperature in adult men and women: a systematicliterature review. Scand J Caring Sci 16(2):122–128
16. Bridges E, Thomas K (2009) Noninvasive measurement of body temperaturein critically Ill patients. Crit Care Nurse 29(3):94–97
17. Langham GE, Maheshwari A, Contrera K, You J, Mascha E, Sessler DI (2009)Noninvasive temperature monitoring in postanesthesia care units.Anesthesiology 111(1):90–96
18. Baker FC, Waner JI, Vieira EF, Taylor SR, Driver HF, Mitchell D (2001) Sleepand 24 hour body temperatures: a comparison in young men, naturallycycling women and women taking hormonal contraceptives. J Physiol530(3):565–574
Submit your manuscript to a journal and benefi t from:
7 Convenient online submission
7 Rigorous peer review
7 Immediate publication on acceptance
7 Open access: articles freely available online
7 High visibility within the fi eld
7 Retaining the copyright to your article
Submit your next manuscript at 7 springeropen.com