REMOTE SMART METERING FOR MULTIPLE UTILITIES · 2014-07-28 · REMOTE SMART METERING FOR MULTIPLE...
6
Scientific Bulletin of the Electrical Engineering Faculty – Year 14 No.1 (25) ISSN 1843-6188 42 REMOTE SMART METERING FOR MULTIPLE UTILITIES A.V. MIRON VALAHIA University of Târgoviște, Doctoral School of Engineering Science - Electrical Engineering E-mail: [email protected] Abstract. “Technology is a useful servant but a dangerous master” - Christian Lous Lange. The aim of this article is to highlight the advantages, versatility and functionality of wireless transmission of gathered data from smart meters to consumers and suppliers alike. The era of manual analogue reading have long gone, so the meters got digital and got smart aswell. Now it's all about which one is smarter cheaper and reliable, so the developers came out with some pretty nifty ones. This system uses a BigPic5 development platform for testing and it’s powered by an 8 bit core PIC18F family microcontroller from Microchip. The microcontrollers reads out the analogue data from electric, water and gas meter through electronic sensors, converts the signal to a digital one and sends it wirelessly to a GPRS terminal which has it’s job to forward the data to another GPRS terminal of a data center, data that can be processed and acknowledged by utilities suppliers and consumers through internet web interface. Keywords: smart metering, energy monitoring, wireless data, BigPic5, ZigBee, GPRS, microcontroller. 1. INTRODUCTION As the world developed, new needs emerged in utilities field. One of them was building ways to monitor and register consumption of them (electric, water, gas and heat) by using either electric or mechanical devices attached to the sources. Suppliers of utilities needed parameter values of consumption to generate pricing policies for ever demanding consumers such as commercial and residential ones. Nowadays, each consumer has these devices installed where needed and by the growing of demand for new buildings and settlements, meters had to be more reliable, more advanced and versatile. Unlike classic meters, that didn’t provide network feedback, just analogue readings by mechanical ways, smart meters use electronic sensing technology and feedback through either a wired or a wireless network. Many of them come with a digital display where we (suppliers or consumers) could read consumption values and even pricing and through the signal wires which they can send gathered data to central systems either in real-time or at a certain pre established time schedule. Smart meters come with a full batch of advantages and characteristics that are adapted to every specific demand. Some of them has energy efficient options for household devices, some has the ability to disconnect the user from the main power grid if hazardous events took place or if the user just didn’t payed his bill or wants to select another supply agent and some of them can notify it’s user about pricing and consumption on mobile devices. Smart metering is done in a bi-directional way so there’s always a feedback between requestor and provider. 2. REFERENCE MARKET PRODUCTS The smart meter and energy monitoring companies developed their own complex solution of collecting data from meters through either a compact local Wi-Fi transmission to portable energy meter readers, used by specialised personnel, or automatically, through internet WANs, involving GSM, SMS or GPRS modems that transmit harvested data from local meters, directly to utility suppliers dispatches. One example would be Sierra Wireless [1] global corporation, a company that offers wireless solutions like “machine-to-machine” (M2M) – which “refers to technologies that allow both wireless and wired systems to communicate with other devices of the same type” as shown in Figure 1. Figure 1. Sierra Wireless - data management solutions schematic with embedded wireless modules and M2M cloud service. Aside from their “AirPrime” wireless embedded modules (Figure 2), they also offer gathering information with intelligent gateways like “AirLink” (Figure 3) and cloud resources through “AirVantage M2M Cloud” that simplifies interconnection between M2M devices, offers security, data storage and data management. Figure 2. Sierra Wireless - “AirPrime” embedded wireless modules.
Transcript of REMOTE SMART METERING FOR MULTIPLE UTILITIES · 2014-07-28 · REMOTE SMART METERING FOR MULTIPLE...
Scientific Bulletin of the Electrical Engineering Faculty – Year 14 No.1 (25) ISSN 1843-6188
42
REMOTE SMART METERING FOR MULTIPLE UTILITIES
A.V. MIRON VALAHIA University of Târgoviște, Doctoral School of Engineering Science - Electrical Engineering
E-mail: [email protected]
Abstract. “Technology is a useful servant but a dangerous master” - Christian Lous Lange. The aim of this article is to highlight the advantages, versatility and functionality of wireless transmission of gathered data from smart meters to consumers and suppliers alike. The era of manual analogue reading have long gone, so the meters got digital and got smart aswell. Now it's all about which one is smarter cheaper and reliable, so the developers came out with some pretty nifty ones. This system uses a BigPic5 development platform for testing and it’s powered by an 8 bit core PIC18F family microcontroller from Microchip. The microcontrollers reads out the analogue data from electric, water and gas meter through electronic sensors, converts the signal to a digital one and sends it wirelessly to a GPRS terminal which has it’s job to forward the data to another GPRS terminal of a data center, data that can be processed and acknowledged by utilities suppliers and consumers through internet web interface.
Keywords: smart metering, energy monitoring, wireless data, BigPic5, ZigBee, GPRS, microcontroller.
1. INTRODUCTION As the world developed, new needs emerged in utilities field. One of them was building ways to monitor and register consumption of them (electric, water, gas and heat) by using either electric or mechanical devices attached to the sources. Suppliers of utilities needed parameter values of consumption to generate pricing policies for ever demanding consumers such as commercial and residential ones. Nowadays, each consumer has these devices installed where needed and by the growing of demand for new buildings and settlements, meters had to be more reliable, more advanced and versatile. Unlike classic meters, that didn’t provide network feedback, just analogue readings by mechanical ways, smart meters use electronic sensing technology and feedback through either a wired or a wireless network. Many of them come with a digital display where we (suppliers or consumers) could read consumption values and even pricing and through the signal wires which they can send gathered data to central systems either in real-time or at a certain pre established time schedule. Smart meters come with a full batch of advantages and characteristics that are adapted to every specific demand. Some of them has energy efficient options for household devices, some has the ability to disconnect the user from the main power grid if hazardous events took place or if the user just didn’t payed his bill or wants to select another supply agent and some of them can notify it’s user about pricing and consumption on mobile devices. Smart metering is done in a bi-directional way so there’s always a feedback between requestor and provider.
2. REFERENCE MARKET PRODUCTS
The smart meter and energy monitoring companies developed their own complex solution of collecting data from meters through either a compact local Wi-Fi transmission to portable energy meter readers, used by specialised personnel, or automatically, through internet WANs, involving GSM, SMS or GPRS modems that transmit harvested data from local meters, directly to utility suppliers dispatches. One example would be Sierra Wireless [1] global corporation, a company that offers wireless solutions like “machine-to-machine” (M2M) – which “refers to technologies that allow both wireless and wired systems to communicate with other devices of the same type” as shown in Figure 1.
Figure 1. Sierra Wireless - data management solutions
schematic with embedded wireless modules and M2M cloud service.
Aside from their “AirPrime” wireless embedded modules (Figure 2), they also offer gathering information with intelligent gateways like “AirLink” (Figure 3) and cloud resources through “AirVantage M2M Cloud” that simplifies interconnection between M2M devices, offers security, data storage and data management.
Figure 2. Sierra Wireless - “AirPrime” embedded wireless
modules.

ISSN 1843-6188 Scientific Bulletin of the Electrical Engineering Faculty – Year 14 No.1 (25)
43
Figure 3. Sierra Wireless - “AirLink” 3G/4G intelligent
gateways.
3. OUR HARDWARE COMPONENTS USED AND REPRESENTATION OF THE SYSTEM
This paper is a continuation and an improvement of a system developed by an electrical engineering student from “Valahia” University of Târgoviște, Paduraru Costin-Gabriel [2], under the Henri George-Coanda dean’s supervision and refers to a “Management and control system using ZigBee [3] technology”, a system that harvests the benefits of wireless ZigBee [4] technology in conjunction with a BigPic5 [5] development board equipped with a PIC18F [6] family microcontroller which is capable of monitoring and gathering data from three kinds of meters as shown in Figure 4. This system uses master and slave BigPic5 terminals, where slave unit gathers data from meters, process it, displays it on a local GLCD while sending it through an USART1 port to the master receiving unit by using another USART1 port, displays the data and forwards it from USART2 port to RS232 port of a PC, with a central software system application, thus achieving databasing and final client billing.
Figure 4. Simplified block diagram for communications
between two ZigBee terminals and BigPic5 master-slave units of the original project.
Now, our work about wireless metering will take a step further and implement GPRS [7] modules to provide a full comprehensive solution to exploit in the near future. As follows, we will gradually describe the system in a more detailed manner, such as in Figure 5 which represents our project concept of making smart metering [9] with low cost devices and less time to execute interconnections between modules.
Each utility has it’s own meter (gas, water, electricity) and each meter will send real time data through an electronic reading device or sensor when used.
Figure 5. Detailed block diagram of main components and
modules used in our project. Itron company provides a comprehensive solution for measuring and analysis of their meters by the help of a “Cyble Sensor v2” [8]. This sensor is a wired communication module, with built in 3V lithium battery, that can be attached to either a water or a gas meter designed by them and can send digital impulses as output signal. The next step is done by a microcontroller (or BigPic5) that converts the sensor signal into numbers to show on an LCD/GLCD and to transmit the binary code from a connected ZigBee module to another one that is mounted in a local data acquisition box or terminal that can be mounted on a telephone pole for example. The ZigBee modules compliances with the IEEE 802.15.4 international standards and operates in a 2.4GHz frequency band. The signal received from all wireless modules are processed by another microcontroller (or BigPic5) for sending through a GPRS/GSM/SMS wireless module from the local area, where the information is gathered, to a remote data center or PC that has it’s own GPRS module and microcontroller for receiving the data, and then finally processed by it into a manageable values for a database and billing reports. The sensor’s electronic circuit includes 3 detector coils (Schlumberger patent). Under flowing conditions, the target passes in front of each coil. The presence of the target is detected by a variation of the signal within the coil, due to an eddy current effect. The use of 3 coils ensures that the direction of rotation of the needle and therefore the forward and return directions of the water flow are identified. The sensor produces a high frequency signal when the needle has completed a full revolution (Figure 6).
Figure 6. “Cyble Sensor” working principle when target
on/off.
Scientific Bulletin of the Electrical Engineering Faculty – Year 14 No.1 (25) ISSN 1843-6188
44
Components list used in the laboratory: • Energy meter: Finder 7E.23. • Water meter: Itron Flodis class C. • Gas meter: Itron RF1. • Wired Cyble Sensor for water/gas. • BigPic5 development board and Microchip
PIC18Fxxxx microcontrollers. • Hitachi HD44780 LCD or a BigPic5 GLCD. • EasyBee (ZigBee) wireless modules. • Telit GM-862 GSM/GPRS wireless modules. • Windows PC and software application.
4. HARDWARE TECHNICAL SPECIFICATIONS We will begin with a brief description of the components and modules available in the laboratory that helped us define the application. Let’s start with the core of the project, the meters. As an energy meter we have used a german 7E.23.8.230 a model, produced by Finder (Figure 7). It’s a one-phase meter with multi-functional LCD, capable of displaying total consumption, partial consumption (resettable value) and instantaneous: power, voltage and current. This Finder meter can output pulses (open collector) for remote energy management system, it’s small size, has protection class II with an accuracy class 1/B and complies with EN 62053-21 international and EN 50470 european standards. The energy meter used in the lab is also equipped with two DZ47-63A series miniature circuit breakers booth for phase and neutral line as we see in Figure 8.
Figure 7. Finder energy meter product (left) and schematic (right).
Figure 8. Finder energy meter connected in the laboratory at a 220V power source with a PC unit plugged in as a consumer.
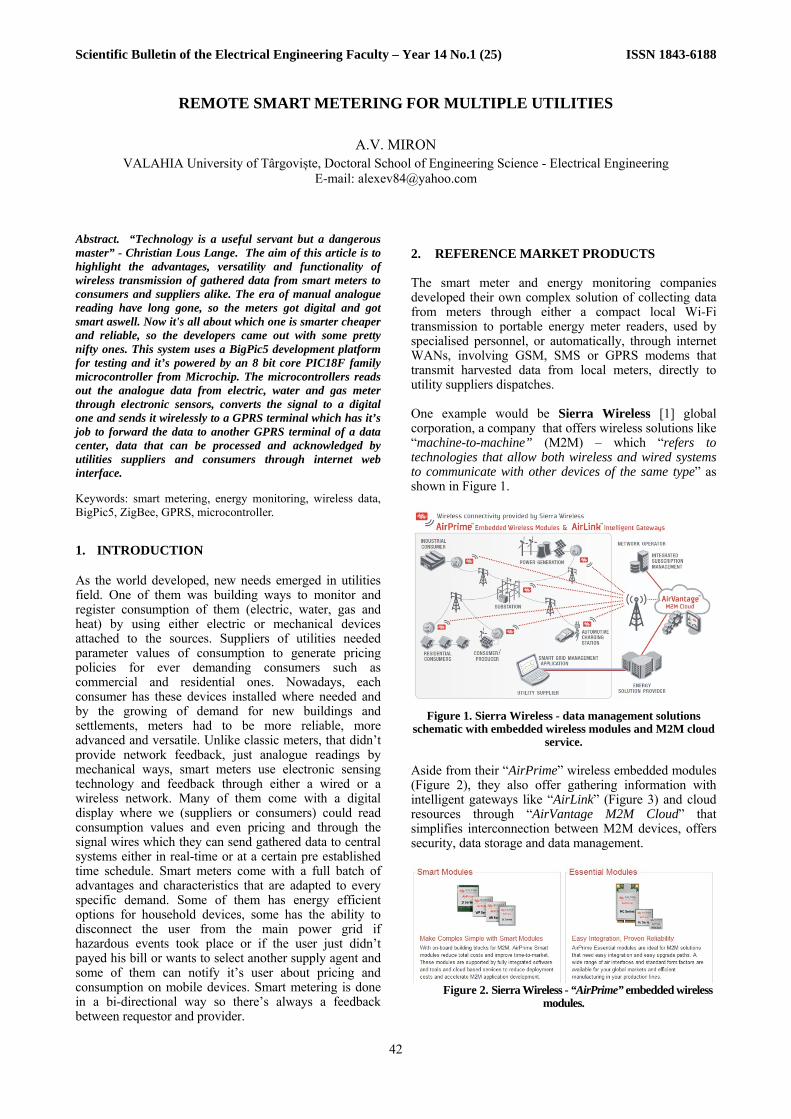
Moving on the second meter, the Itron “Flodis” class C water meter is a monojet turbine counter, with robust and simple design but capable of using “Cyble Sensor” technology which allows the meter to send electronic
impulses through this add-on pulse module to a management data console.
Figure 9. Itron “Flodis” water meter and a “Cyble Sensor”
mounted. Also “Cyble Sensor” standalone in the bottom of the figure.
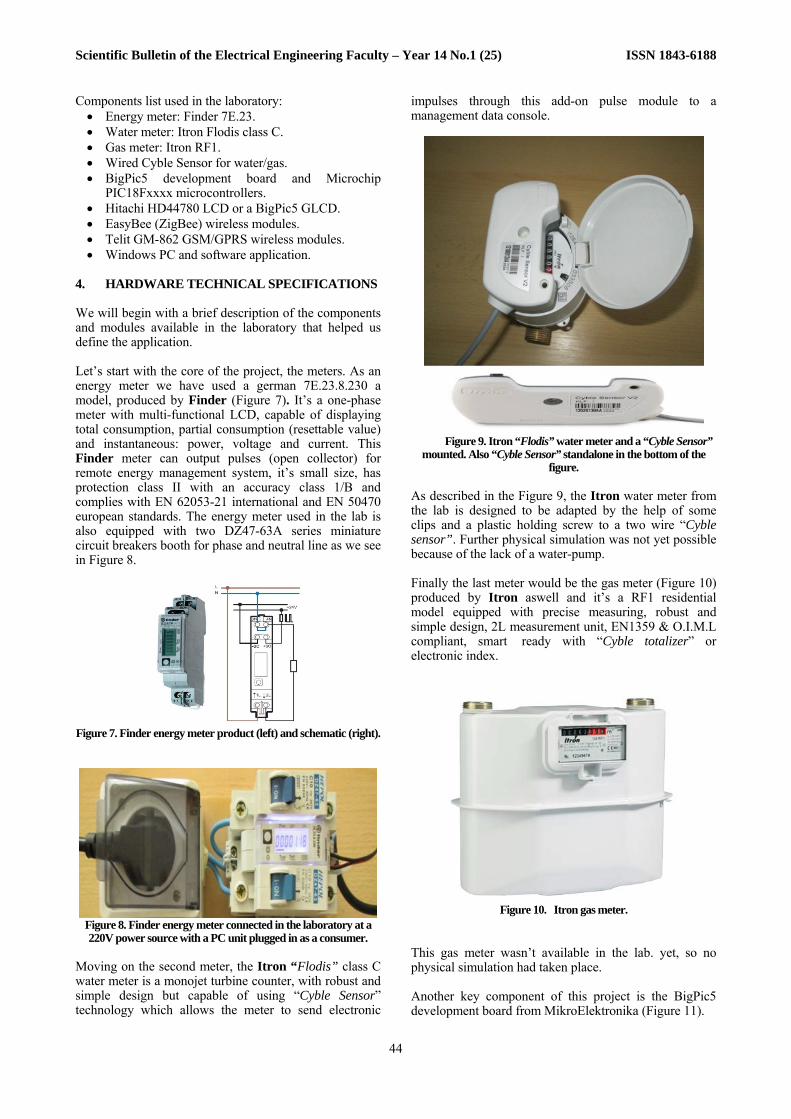
As described in the Figure 9, the Itron water meter from the lab is designed to be adapted by the help of some clips and a plastic holding screw to a two wire “Cyble sensor”. Further physical simulation was not yet possible because of the lack of a water-pump. Finally the last meter would be the gas meter (Figure 10) produced by Itron aswell and it’s a RF1 residential model equipped with precise measuring, robust and simple design, 2L measurement unit, EN1359 & O.I.M.L compliant, smart ready with “Cyble totalizer” or electronic index.
Figure 10. Itron gas meter.
This gas meter wasn’t available in the lab. yet, so no physical simulation had taken place. Another key component of this project is the BigPic5 development board from MikroElektronika (Figure 11).

ISSN 1843-6188 Scientific Bulletin of the Electrical Engineering Faculty – Year 14 No.1 (25)
45
Figure 11. BigPic5 development board from MikroElektronika.
This electronic simulation board, combined with the mikroC development software suite, helps students and engineers create their own programs, load them into the board’s microcontroller (e.g. PIC18f8520) and execute them in applications for either educational or simulation purposes. The main advantage of BigPic5 board is that it comes with different optional modules for communications, ports, leds, jumpers for settings, buttons, storage and other types of communication protocols. A quick description of the BigPic5 reveals some of the key features in the list below: • Double RS-232 ports. • Real-Time Clock with it’s own battery supply. • SD card slot. • Onboard jumpers pull-up/pull-down port config. • Touch panel controller and connector. • Graphic LCD and 16x2 LCD. • Temp sensor DS1820. • USB external power source. • 67 leds to indicate logic states of microcontroller
pins. • A/D and D/A converters. • CAN module for communication and 2
potentiometers for A/D conversion testing. We will focus now on the “brain” of the BigPic5 development platform, the PIC18F8520 microcontroller architecture, from Microchip. A typical microcontroller is “a small computer on a single integrated circuit containing a processor core, memory, and programmable input/output peripherals” as represented in Figure 12.
Figure 12. Microcontroller block diagram with it’s base elements
and internal connections. The PIC18F8520 microcontroller characteristics: • C compiler optimized architecture/instruction set. • Linear program memory addressing to 128 Kbytes. • 1 Kbyte of data EEPROM. • Linear data memory addressing to 3840 bytes. • Priority levels for interrupts. • 10-bit, up to 16-channel Analog-to-Digital
Converter (A/D). • Dual analog comparators. • 1,000,000 erase/write cycle Data EEPROM
memory typical. • Watchdog Timer (WDT) with its own On-Chip RC
Oscillator for reliable operation. • Power saving Sleep mode. • Programmable code protection. • In-Circuit Serial Programming™ (ICSP™) via two
pins. • Two Addressable USART modules. • Parallel Slave Port (PSP) module.
These were just a few of the main characteristics that we’re going to use more often. Another essential part in our project plays the wireless communication modules, where we used plenty of them, especially for transmitting data from the meters to the outdoor ones located on the transmission poles along with the GSM modules. BigPic5 uses it’s own add-on wireless module called “EasyBee” (Figure 13). Based on the ZigBee technology, “EasyBee” has it’s name from the ease of integration, development and exceptional performance vs. price range.

Scientific Bulletin of the Electrical Engineering Faculty – Year 14 No.1 (25) ISSN 1843-6188
46
Figure 13. “EasyBee” board with I/O port pins switches.
The key concept for this interesting application was to finally implement a GPRS module to transmit data to remote dispatches and into data centers for suppliers and clients. The Telit wireless solutions company offers a good alternative for expensive GSM modules, one that suits our BigPic5 board involved in the project. It’s the “SmartGM862” board, a full-featured development tool for the Telit GM862 GSM/GPRS module (Figure 14). Some of the key features are: it has microfone and speaker connectors, UART communication with microcontroller and 7-23V AC or 9-32V DC power supply voltage.
Figure 14. Telit “SmartGM862” GSM module connected to a
BigPic dev. board by UART port. 5. SOFTWARE DEVELOPMENT AND APPLICATIONS
For a real time application we have to take in consideration a basic schedule and working criteria of acquiring data from the meteres. So we will have the following criteria found in Table 1.
Table 1. Working criteria of data from counters to
slave units/master units. f1-light impulse f2-water impulse f3-gas impulse 3 index val. written in slave mem. each 6h = 4 wr./24h 3 counters consumption monitor/day on GLCD/LCD
read slave, wr. data on pc 1/day, read Z.B. send GPRS read/write to dispatch pc 1/day
Each day the slave units read at each 6 hours the data from the “P” counters, starting with 10 o’clock. In the 4 to 5 hour interval, data is sent to the master unit while the dispatch gets data through GPRS, around 5 to 6 hour interval. The slave units will display 4 values read per day while the master unit will display the total consumption values from all places each day (Figure 15).
Figure 15. Diagram process of transmitting data from slave to
master then to dispatch with GPRS modules (based on Table 1). Figure 16 illustrates the consumption status of the counters for light, water and gas displayed on a local BigPic5 slave unit, data received from the local meters to it’s ZigBee module each 6 hours.
Figure 16. Counters state – consumption displayed on the
receiving BigPic5 – slave unit through ZigBee. To better understand the computing process of the program written in the BigPic5 microcontrollers, we have presented a process flowchart in the Figure 17. The flowchart is comprised of two processes side by side for slave receiving unit and master receiving unit. When further implementation is achieved with the GPRS modules for dispatch, a similar process will be generated to finally have a complete solution starting at the meter and ending on a bill for client.
Figure 17. Process flowchart for slave unit (left) and master unit
(right).

ISSN 1843-6188 Scientific Bulletin of the Electrical Engineering Faculty – Year 14 No.1 (25)
47
As a final stage of this article, a software application solution is presented downwards in the Figure 18. The program was written in “Visual Basic” and it’s composed of two panels. The left panel describes the three counter data collected at certain hour intervals and dates while the right panel describes the number of subscribers with date intervals prelevation and counters consumption in numbers.
Figure 18. Software application for billing created in Visual Basic 6. RESULTS AND CONCLUSIONS The project itself gives plenty of room for further research and for developing innovative new ideas to implement in. A lot of upgrades and optimization could be made to counters, microcontroller coding, and dispatch software. All in all, this application highlights the numerous possibilities of implementing a low cost solution that could be done with even cheaper meters and microcontrollers and standard LCDs instead of costly GLCDs. The wireless communication using GPRS/GSM modules for a dispatch to acquire data from field is the top strength of the project, giving the fact that the specialized market and producers already began implementing wireless transmissions form smart meters to dispatches thus cutting the efforts and costs with human resources needed to periodically manually check the meters indexes or hardware costs for wired infrastructure or intermediary equipments. Further ambitions are to optimize this project and deliver a ready to use, tested and scientifically approved solution for booth residential consumers and utilities suppliers alike. 7. REFERENCES
[1] Sierra Wireless - wireless equipment solutions
http://www.sierrawireless.com/ [2] Paduraru Costin-Gabriel, Sistem de gestiune şi
control utilizând tehnologia ZigBee, Supervised by Henri - George COANDĂ.
[3] Mohd Yunus Nayan, Aryo Handoko Primicanta, Mohammad Awan, Hybrid Automatic Meter Reading System, International Conference on Computer Technology and Development, 2009.
[4] Drew Gislason, ZigBee Wireless Netorking, Elsevier, 2008.
[5] MikroElektronica, BIGPIC5 Manual, 2001. [6] MicroChip, PIC18F8520 Datasheet, 2004. [7] Telit, Telit GM862 Family Hardware User Guide,
2011. [8] Cyble Sensor V2 -
www.eurooriental.com/schlumberger/cyble.pdf [9] Tony Richards and Phil Crewe, The Development
of Remote Wireless Meter Reading System, Plextek Ltd .United Kindom;