
Distributed generation: remote power systems with advanced ...

PGA_REWA2013_RemoteTrafos_ID12637.doc 1 / 18
Remote Services for Power Generation Equipment
Marc Antoine*, Gabriele Nani**,
Paul A. Ammann, Pierre Lorin***, Luiz Cheim****Anders Grano*****
ABB Power Systems, (Switzerland)*, (Italy)**
ABB Power Products, (Switzerland)***, (USA) ****, (Sweden)*****
Abstract
This paper describes the advantages of remote services for the power industry with particular focus on power transformers.
Remote services significantly improve plant operation and maintenance activities by providing continuous condition monitoring to avoid downtime and improve performance. Power assets can be continuously monitored, as well as plant units or an entire fleet. All relevant information is made available across different assets by means of a remote access platform.
Further development of distributed generation (renewable power) and new loads (e.g. electric cars) add significant challenges on to the electric grid and, in particular, to power transformers. In addition, a large amount of local energy producers change the flow of energy going through the distribution network leading to load peaks (both predictable and unexpected) that drive new needs for improved transformer cooling and thermal management. In order to extend asset life time, secure a high reliability and avoid unplanned outage, associated with possible penalties, power plant owners and utilities give a high priority to controlling and monitoring their transformers. Moreover, there is also an increased trend towards more advanced technologies to monitor for example the core, windings, oil, tap changer and bushings of the transformer.
Traditionally, data collected from the monitoring devices have been treated manually. Given the increasing amount of data, this will no longer be feasible. Remote monitoring and automated assistance is crucial to transform the data stream into useful actionable information that can be presented through customized dashboards on a fleet as well as equipment level.
Last but not least, remote services also provide significant benefits by connecting the best (or most familiar) service engineers to the customer quickly and determine the necessary actions efficiently.
PGA_REWA2013_RemoteTrafos_ID12637.doc 2 / 18
1 Introduction
Today, the justification of plant budgets is not only based on engineering criteria related to Operation and Maintenance (O&M), but they have become increasingly more focused on Return On Assets (ROA). The primary task of asset management is to reduce costs by identifying performance problems, improving predictive maintenance, extending asset lifecycles, and most of all, developing solid business plans for investments. This requires services for lifecycle costing, which implies cost minimization starting with the initial investment, continuing through the lifecycle of the equipment, and ending with recycling or evolution to the next equipment generation. These services typically consist of:
Monitoring the condition and identifying performance problems of assets.
Improving predictive maintenance (reducing downtime).
Optimizing asset lifecycles and evaluating the impact of asset failure.
Having access to service engineers and product experts.
Ensuring compliance to safety and security regulations.
2 Availability is key
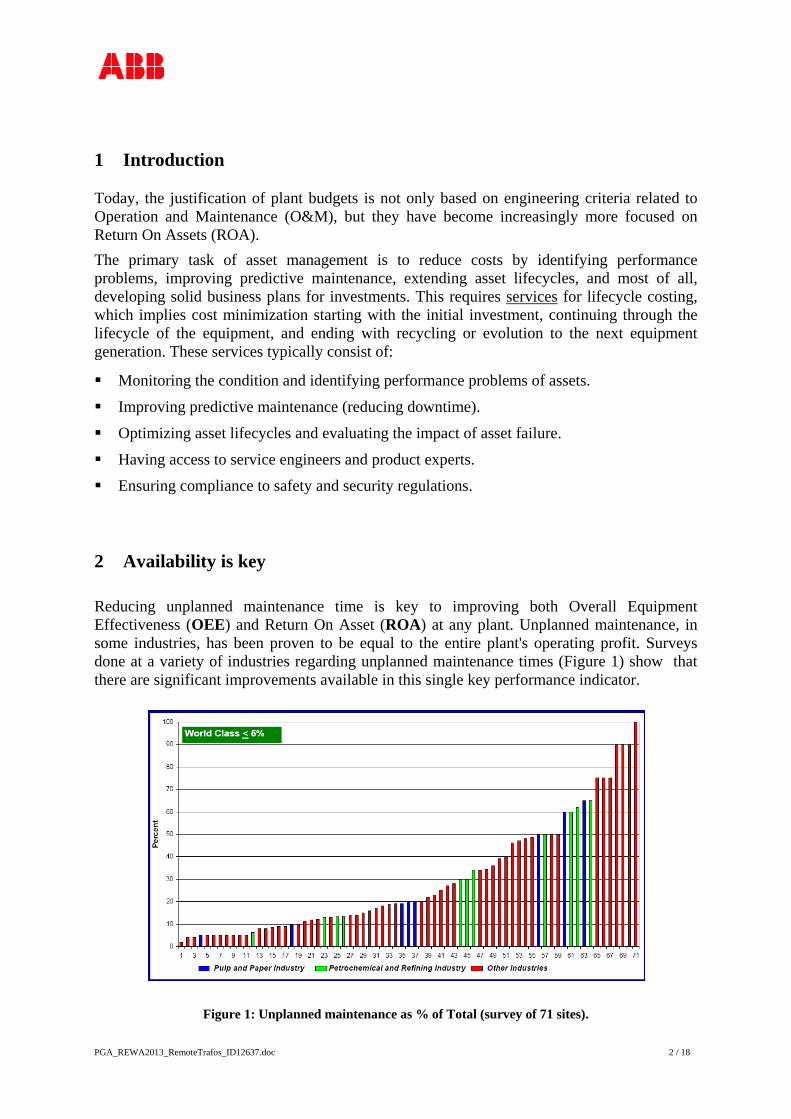
Reducing unplanned maintenance time is key to improving both Overall Equipment Effectiveness (OEE) and Return On Asset (ROA) at any plant. Unplanned maintenance, in some industries, has been proven to be equal to the entire plant's operating profit. Surveys done at a variety of industries regarding unplanned maintenance times (Figure 1) show that there are significant improvements available in this single key performance indicator.
Figure 1: Unplanned maintenance as % of Total (survey of 71 sites).
PGA_REWA2013_RemoteTrafos_ID12637.doc 3 / 18
Before any kind of optimization and control decisions are made, plant managers need to know the condition and performance of their plant and its equipment. In addition to this, the asset lifecycle approach informs the operator about the influence of his actions on the future plant state. Based on this, a business decision can be taken on, e.g. whether to run the plant aggressively (taking advantage of higher market prices) and to initiate maintenance earlier, or to run the plant more smoothly and extend the maintenance interval. The bottom line remains:
Increasing, or maintaining equipment performance and availability.
Minimizing asset lifecycle costs.
3 Proactive maintenance through remote monitoring
Health checks consist of a fixed-scope service that identifies system performance and reliability issues through data collection and analysis – called fingerprints. It generates both a system benchmark and an improvement plan which can be delivered either on-site or remotely, using a remote access platform. These fingerprints typically are the building blocks of a three-step optimization process: Diagnose, Implement, Sustain.
Diagnose: The initial fingerprints are used to generate performance reports which can be delivered at varying frequencies based upon user and system requirements. For example, fingerprints for automation systems [2], include measurement and analysis of system performance, network communication, and controller loading, specifically: software, firmware, network parameters, cyber security settings, etc.
Implement: Based on the fingerprints, improvement recommendations are determined and scheduled for implementation, to start the optimization process. Improvements may be completed all at once or scheduled to be completed incrementally over a period of time. In either case, the implementation ensures that changes can be made and maintained remotely with steady progress toward the performance goal.
Sustain: Regular fingerprinting, implementation and sustaining services are recommended as a component of the customer’s service contract agreement to achieve and continue the improvement process. These can be scheduled as part of a single- or multi-year service agreement.
Besides remote troubleshooting and health checks, remote services are also utilized to remotely monitor the process as well as plant equipment performance on a continuous basis.
Scan services provide a periodic performance analysis of previously fingerprinted systems. These scans can be performed at varying frequencies depending on customer and system requirements, and allow for verification of corrections that are made after the fingerprint service. In addition, they analyze and search for new or recurring issues. On completion of

PGA_REWA2013_RemoteTrafos_ID12637.doc 4 / 18
the scan service, a report stating findings and an implementation plan with recommended actions are provided.
Track services provide continuous condition monitoring of a plant system and sends proactive event notifications based on Key Performance Indicators (KPI’s) to designated plant personnel, or to the service center. The KPI’s are based on parameters reviewed and established during the Scan service. Notification triggers may be based on a single KPI or a combination of KPI’s to ensure that problems are properly addressed. This gradually shifts services from a reactive (corrective) to a proactive or condition-based approach (Figure 2).
While the Scan and Track services provide obvious on-site benefits via reports and system monitoring on a local basis, they offer even higher benefits when implemented as remote monitoring services.
Figure 2: Moving from reactive (corrective) to proactive services (condition-based).
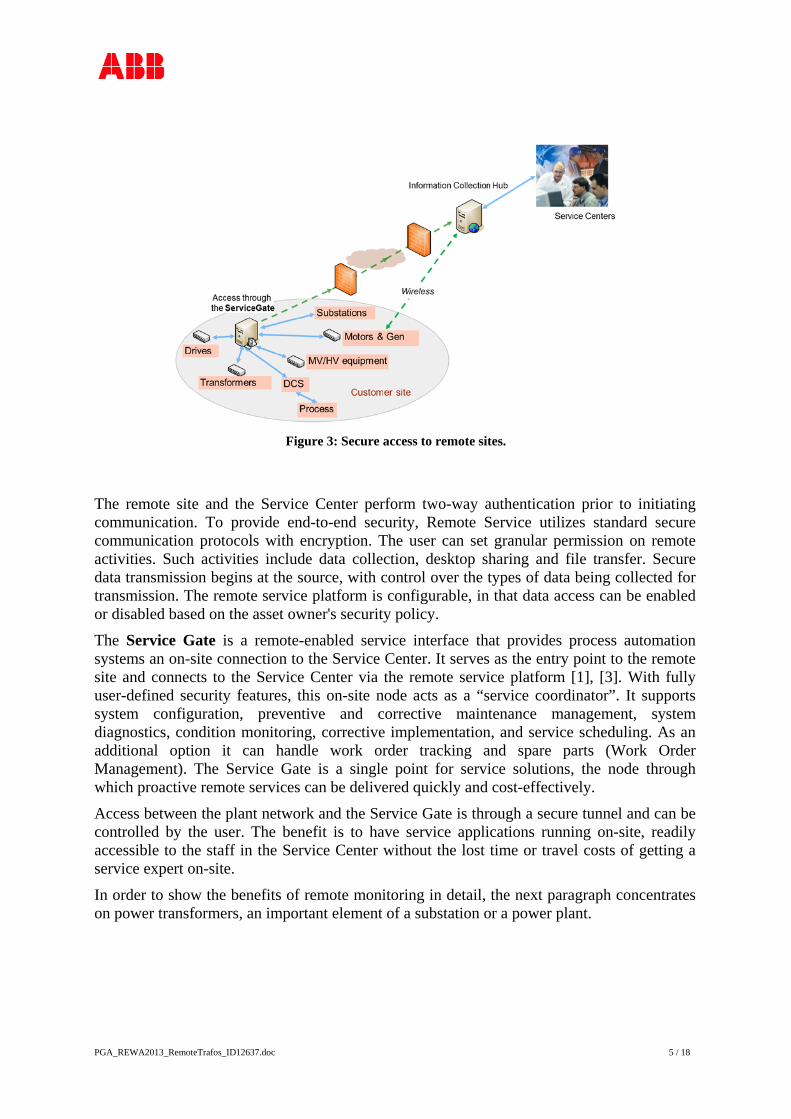
4 Remote secure access
The remote service platform provides remote connection security between the Service Center and the user site. This platform enables secure, real-time remote monitoring and control of devices located at customer sites (Figure 3).
PGA_REWA2013_RemoteTrafos_ID12637.doc 5 / 18
Figure 3: Secure access to remote sites.
The remote site and the Service Center perform two-way authentication prior to initiating communication. To provide end-to-end security, Remote Service utilizes standard secure communication protocols with encryption. The user can set granular permission on remote activities. Such activities include data collection, desktop sharing and file transfer. Secure data transmission begins at the source, with control over the types of data being collected for transmission. The remote service platform is configurable, in that data access can be enabled or disabled based on the asset owner's security policy.
The Service Gate is a remote-enabled service interface that provides process automation systems an on-site connection to the Service Center. It serves as the entry point to the remote site and connects to the Service Center via the remote service platform [1], [3]. With fully user-defined security features, this on-site node acts as a “service coordinator”. It supports system configuration, preventive and corrective maintenance management, system diagnostics, condition monitoring, corrective implementation, and service scheduling. As an additional option it can handle work order tracking and spare parts (Work Order Management). The Service Gate is a single point for service solutions, the node through which proactive remote services can be delivered quickly and cost-effectively.
Access between the plant network and the Service Gate is through a secure tunnel and can be controlled by the user. The benefit is to have service applications running on-site, readily accessible to the staff in the Service Center without the lost time or travel costs of getting a service expert on-site.
In order to show the benefits of remote monitoring in detail, the next paragraph concentrates on power transformers, an important element of a substation or a power plant.

PGA_REWA2013_RemoteTrafos_ID12637.doc 6 / 18
5 Transformer monitoring
Power transformers, which are often among the most valuable asset in a plant are indispensable components of high-voltage equipment for power generation plants, transmission systems and large industrial plants. Unexpected failures cause major disturbances to operating systems, resulting in unscheduled outages and power delivery problems. Such failures can be the result of poor specification or design, poor maintenance, poor operation, poor protection, undetected faults or even lightning (Figure 4, Figure 5).
Figure 4: A nearly catastrophic failure damaged a transformer.
Figure 5: The transformer (previous figure) has been remanufactured to a fully functional status.
PGA_REWA2013_RemoteTrafos_ID12637.doc 7 / 18
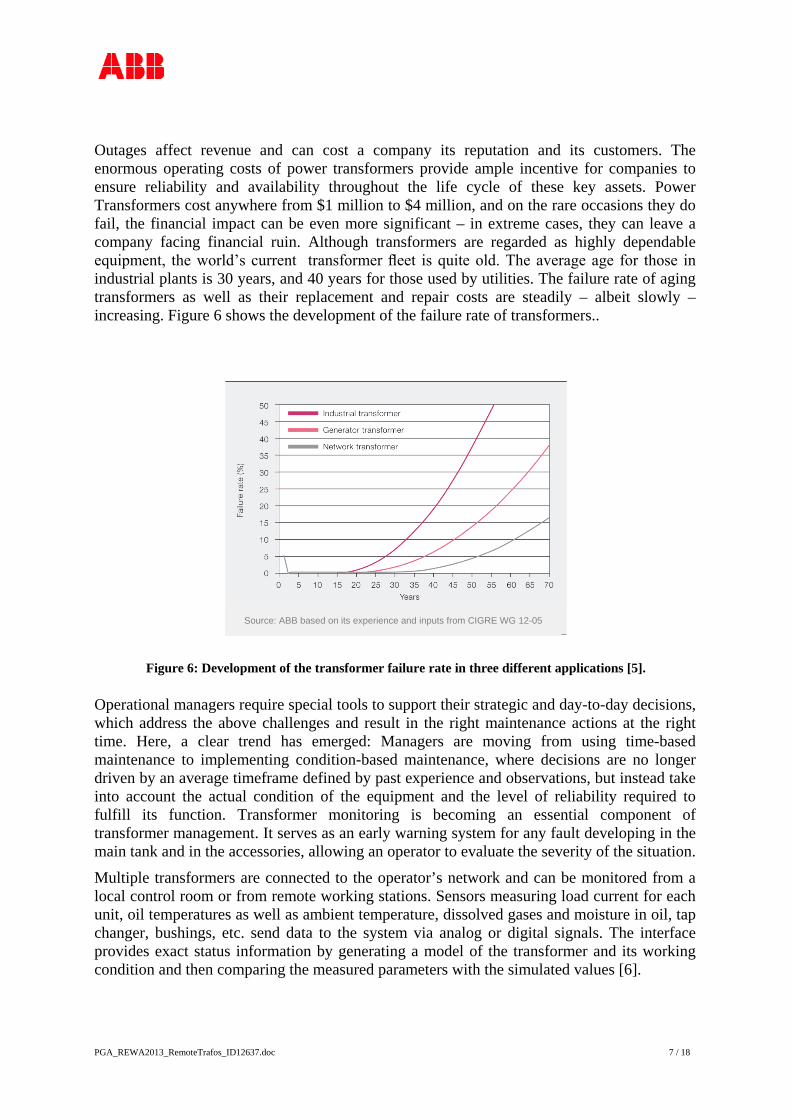
Outages affect revenue and can cost a company its reputation and its customers. The enormous operating costs of power transformers provide ample incentive for companies to ensure reliability and availability throughout the life cycle of these key assets. Power Transformers cost anywhere from $1 million to $4 million, and on the rare occasions they do fail, the financial impact can be even more significant – in extreme cases, they can leave a company facing financial ruin. Although transformers are regarded as highly dependable equipment, the world’s current transformer fleet is quite old. The average age for those in industrial plants is 30 years, and 40 years for those used by utilities. The failure rate of aging transformers as well as their replacement and repair costs are steadily – albeit slowly – increasing. Figure 6 shows the development of the failure rate of transformers..
Figure 6: Development of the transformer failure rate in three different applications [5].
Operational managers require special tools to support their strategic and day-to-day decisions, which address the above challenges and result in the right maintenance actions at the right time. Here, a clear trend has emerged: Managers are moving from using time-based maintenance to implementing condition-based maintenance, where decisions are no longer driven by an average timeframe defined by past experience and observations, but instead take into account the actual condition of the equipment and the level of reliability required to fulfill its function. Transformer monitoring is becoming an essential component of transformer management. It serves as an early warning system for any fault developing in the main tank and in the accessories, allowing an operator to evaluate the severity of the situation.
Multiple transformers are connected to the operator’s network and can be monitored from a local control room or from remote working stations. Sensors measuring load current for each unit, oil temperatures as well as ambient temperature, dissolved gases and moisture in oil, tap changer, bushings, etc. send data to the system via analog or digital signals. The interface provides exact status information by generating a model of the transformer and its working condition and then comparing the measured parameters with the simulated values [6].
Source: ABB based on its experience and inputs from CIGRE WG 12-05

PGA_REWA2013_RemoteTrafos_ID12637.doc 8 / 18
1 Transformer temperature• Bottom oil, top oil and hot-spot are shown• Hot-spot values are calculated for the HV, LV and TV windings• Reference temperature are calculated from an internal
software model2 Transformer loading• HV, LV and TV bushings currents are displayed• The highest load is used to indicate the load of the transformer3 Overload capacity• Indicates the highest load under which the transformer can be
operated for a certain amount of time without exceeding the preset top oil and hot-spot temp
4 Tap-changer functionality• The tap-changer temperature is calculated and compared with
measured values to indicate tap-changer faults• The tap-changer position, moisture level and temperature are
shown5 Gas and moisture content• The dissolved gas and moisture content are shown as present
values or overtime• It is possible to see if a gas change is load dependent, which
indicates a possible overheating problem6 Cooling control• Starts on top oil, hot-spot, and forecast to optimize overload
capacity and keep the temperature stable to limit breathing and reduce ageing
• Up to six cooler groups can be monitored• All cooler groups are equally used and started every week to
extend their lifetime
Figure 7: User friendly interface showing real-time status of important parts of the transformer.
The strength of a Transformer Electronic Control (TEC) monitoring system is that it receives all the relevant information from just a few multipurpose sensors. Other necessary parameters are calculated based on an intelligent model, adding only minimal complexity to the transformer. The end user receives relevant information indicating the necessary actions for first-level maintenance, and the time spent sorting and interpreting data is reduced (Figure 7). As all utilities and major energy companies now have focused attention on, among other things, asset management and remaining life management, an increasing number of power transformers around the world are being equipped with monitoring devices.
To achieve the goal of making power transformers 'intelligent' with optimized maintenance plans, a common electronic interface was created that exchanges information with the following apparatus: Monitoring and diagnostics devices of the transformer and components, cooling system and overall protection system. Through this interface, TEC provides exact status information to enable utilities to extend transformer lifetime and save costs by reducing maintenance and increasing availability. It does this by generating a model of the transformer and its working condition and then comparing the measured parameters with the simulated values. Discrepancies are detected and potential malfunctions and/or normal wear in the transformer and its ancillaries are indicated.

PGA_REWA2013_RemoteTrafos_ID12637.doc 9 / 18
TEC also keeps track of transformer trips and alarms, recording the actual events as well as the sequence to assist operators in determining their root cause. The status traffic light identifies the most heavily worn contact in the tap-changer, based on the actual load during each operation. The user sees when the next service is due. Oil treatment is condition-based, being dependent on the development of moisture as indicated by the temperature and moisture sensor in the tap-changer compartment. Early warning is given of any increase in tap-changer temperature beyond the normal value. The user interface runs on any web browser. The PC start panel shows a transformer model with basic data such as the top oil and bottom oil temperatures, up to three hot-spot temperatures, the apparent power and the tap-changer position and operations. More detailed information can be obtained by clicking on the object on the transformer model or by pressing one of the status information buttons. All of the transformer and tap changer documentation, including instruction films can be viewed on the PC in the control room or any other remote place of convenience.
Figure 8: Transformer failure rate without monitoring [7].
CIGRE research has shown that Remote Monitoring results in significant lower non - catastrophic and catastrophic failures of Transformer. In the CIGRE study example - while the probability of catastrophic failures is 0.0007 and the probability of catastrophic failures is 0.0063 in the case of a transformer without monitoring (Figure 8) - it can be expected, that remote monitoring lowers the probability of catastrophic failures to 0.00028 and of non-catastrophic failures to 0.00252 (Figure 9). A significant lower rate of non-detectable failure rate and a potential lower failure probability of 40% are impressive statistics showing the potential benefits of remote monitoring. Furthermore, it has been shown that early detection of problems can reduce repair costs by 75% and loss of revenue by 60%, and that annual cost

PGA_REWA2013_RemoteTrafos_ID12637.doc 10 / 18
savings equal to 2% of the price of a new transformer – i.e. approximately $40’000 to $80’000 – can be achieved [8].
Figure 9: Transformer failure rate with monitoring [7].
6 Integration of business intelligence
Since data are coming from many sources, both on-line and off-line, the effort for analysis and reporting quickly becomes time prohibitive. Even when using efficient data management and analysis tools, the results need to be easily available to a variety of end-users, in an efficient and consistent way. This can be achieved by using a variety of business intelligence tools and techniques (e.g. drill-down capabilities, key performance indicators, real-time information dashboards, customized reports, etc.). Providing this business intelligence on a web portal, is the base for a wide range of decision processes, both strategic and operational [4].
The Business Intelligence (BI) layer implemented in the Service Center is the value added feature of the Service Center. Several examples are shown in the screenshots below.
6.1 Data collection presentation Maps (Google-based) show the geographic location of plants using icons (Figure 10). Another frame, close to the map, contains a list of available plants with dynamic traffic lights and icons summarizing:

PGA_REWA2013_RemoteTrafos_ID12637.doc 11 / 18
• Contractual KPI's (e.g. production, availability, efficiency, detailed equipment performance, etc.).
• Presence of open maintenance tickets. • Status of the connection to the Service Gate.
Figure 10: Map representation of top-level data and locations.
6.2 Production and performance cockpit(s) Other business applications, such as Performance Ratio monitoring, Equipment condition trending, Fleet analysis, etc. are shown in dedicated dash boards of the web portal (see Figures below):
Figure 11: Typical real-time cockpit for current production level and relevant KPI’s.

PGA_REWA2013_RemoteTrafos_ID12637.doc 12 / 18
Figure 12: Real-time equipment trending.
6.3 Reporting and ticketing system The remote service platform stores plant data and the web portal uses these data to automatically generate specific reports, such as:
• Production reports. • Interventions and Operators’ actions reports. • O&M log book. • Executive level reports with information necessary to manage the plants (Figure 13). • Business analysis level reports. • Predefined reports with structured information.
Figure 13: Investors monthly business report.

PGA_REWA2013_RemoteTrafos_ID12637.doc 13 / 18
7 Adding value through remote services
Remote Services help plant owners by minimizing their operating and service costs, keeping their system operating at its peak performance, and freeing resources to proactively focus on production. Remote Services are used for diagnosis, condition monitoring and optimization, and can be deployed at any level of the plant hierarchy. Field instruments can be continuously monitored, as well as control loops, plant equipment, plant units or entire fleets. All relevant information is made available across different assets by means of a remote access platform.
By providing an array of services (and options to choose from), customers can access continuous support for maintenance and enhancements to installed equipment. This allows them to fully benefit from condition-based maintenance and to select an incremental, cost-effective evolution path for their installed systems. Thus, maintenance work, dispatching and lifecycle management can be planned more efficiently, and downtimes are minimized. This approach is applicable to almost all types of plants, but is crucial for operating plants with reduced staff in remote locations.
8 Examples of proactive maintenance through remote monitoring
The three following cases show the main benefits of remote monitoring: Shorten down-time in case of an event, optimize loading, reduce aging and extend lifetime of a transformer as well as secure energy delivery. Remote monitoring is a main driver to achieve the main goals of every energy producer: Availability and Reliability of the energy system.
8.1 Case 1: Remote Monitoring to shorten downtime in case of event - Swiss Hydro-Power Plant
AET Swiss utility has equipped seven transformers with on-line monitoring systems. These are installed in two substations. Four units, rated 55 and 63 MVA 150 kV, were built 20 years ago. Three units were built during the period 1996 – 1998 which were equipped with the sensors during manufacturing. Inputs to the systems are analog signals from sensors for dissolved gases, moisture in oil, oil temperature, load current for each unit and ambient temperature. In addition, digital alarm signals from the gas relay (Buchholz) and from the gas and moisture sensors are also connected. The cost of such a complete system represents an investment of approximately 6% of the cost of a new transformer. Depending on the strategic impact of the transformer, simple systems are available for an investment of less than 1-2% of the value of an identical transformer.
The economic aspect will be the most important driver in the future [9]. The current trend is that no funds are available, even for emerging technologies, without having shown the payback by a predictable cost saving. In the case of the transformer mentioned above, we should identify all costs related to operation, e.g. inspection, maintenance, significant failures and, finally, loss of revenues.
Using economic data and the statistical risk of failures, it can be shown that early detection of problems results in repair costs reduced by 75%, loss of revenue reduced by 63% and cost savings per year representing 2% of the price of a new transformer.
As an example, six months after installation of the first monitoring system by AET, electrical

PGA_REWA2013_RemoteTrafos_ID12637.doc 14 / 18
disturbances on the network were responsible for three short-circuits on one of the brand new GSU transformers. Each of the short circuits had an intensity of three times the nominal current for a few tenths of a second. Right after the short circuits, the maintenance team from the utility was able to analyze the trends of the monitored parameters, especially the dissolved gas in oil and contact the authors of the paper that installed the system, in order to take an expert decision regarding diagnostic and corrective actions to be implemented. It was decided to perform a series of off-line diagnostic tests including a Dissolved Gas Analysis (DGA) and Frequency Response Analysis (FRA), to check the winding geometry.
After analyzing all results, the unit was reenergized. Special care was taken to follow up the trends of the different parameters during the next two months. This was included in a three year remote supervision contract established to check the status of the seven transformers and advise about possible preventive maintenance actions.
This example shows the reduction of outage time after defects, by providing remote access to experts located a few hundred kilometers away in order for them to quickly provide advice and plan the dispatch of field engineers to perform further tests. The benefit in terms of loss of production comparing to the traditional way to solve such an incident (traditional diagnosis and inspection of the active part after untanking) has been estimated by the utility. It appears that in this case, the utility saved the equivalent of 3-6 times the price of the monitoring system (included costs for off-line diagnosis). Also, these incidents demonstrated the good transient EMC protection required in the monitoring installation, which was not damaged.
8.2 Case 2: Remote Monitoring to optimize loading, reduce ageing and manage maintenance – Spanish wind farm
Transformer Electronic Control (TEC) has been installed on two transformers for a renewable power plant substation in Spain to improve transformer operation and maintenance efficiency. The objective was to improve the monitoring of the power transformers so that the power producer could better utilize their loading ( 450 MVA autotransformers, 400/138 kV). Each of the respective substations is integrated into the network and connected to the operation center for renewables of the utility. A communication server provides the maintenance team with the ability to access TEC data and embedded analysis models to monitor the performance of the transformers and its main components such as the on-load tap changer, bushings and cooling system directly from their distant office. Warning systems allow to optimize the maintenance management by alerting about a problem with a transformer, thus eliminating the need to analyze each variable in the SCADA system.
The utility can manage overload in their transformers, especially during peaks of wind energy production. TEC calculates the actual ageing rate of the transformer considering the loading and the ambient temperature. It also allows reducing the ageing thus maximizing the overload by controlling the cooling system in an optimized way. This is achieved by anticipating the cooling stages and starting the coolers in advance (based on the forecasted loading profile that feeds thermal models of the transformer to calculate different scenarios of hot spot temperatures and associated ageing rate).
The utility reported the potential provided by this solution for the operation of two transformers, as well as the advantages provided for maintenance. On-line monitoring is a powerful intelligent tool embedding standard sensors and transformer knowledge to help

PGA_REWA2013_RemoteTrafos_ID12637.doc 15 / 18
transformer owners increasing the performance, reducing risk of damage and cutting maintenance costs. It is also of prime importance to consider that a monitoring system must be safe, reliable, easy to use and profitable.
8.3 Case 3: Remote monitoring to extend life and secure energy delivery – Hydro Power Plant
A hydro power plant supplying a ski resort in the Alps has been operating a 12 MVA transformer at high load during 20 years until they asked for a condition assessment of the unit in order to ensure the capability to produce the required energy during the coming years.
Figure 14: 12 MVA, 20 years old generating Step-Up transformer.
Based on off-line analysis of diagnostic tests it appeared that the insulation of the transformer was very wet due to advanced ageing of the cellulose material. Until a new transformer was specified, budgeted, ordered, delivered and commissioned it was recommended to perform mandatory maintenance actions to reduce the risk of failure, and to install a monitoring system in order to closely follow the condition of the transformer over the coming months.
It was recommended not to switch-off the load on the transformer to avoid risks of flash-over due to possible formation of free water. This advice was not followed leading to an incident that further damaged the transformer. In order to safeguard the delivery of a minimum mandatory power allowing the ski resort to remain open during the upcoming winter season the authors of the paper were asked to provide recommendations how to operate the unit.
Thanks to a remote connection to the on-line monitoring system (Figure 15 and Figure 16), transformer life has been extended by 18 months until the transformer was finally replaced. An average load of 30% was delivered during the entire winter to the full satisfaction of the ski resorts and associated hotels. It also avoided important penalties for non-delivery of energy to the power producer.

PGA_REWA2013_RemoteTrafos_ID12637.doc 16 / 18
Figure 15: Monitoring parameters of the transformer before incident
(gas and moisture in oil, ambient and top oil temperatures, load).
Figure 16: Monitoring parameters after incident.
An average of 30% of the nominal load was safeguarded.

PGA_REWA2013_RemoteTrafos_ID12637.doc 17 / 18
9 Conclusions
Companies in the power and water industry are increasingly expecting remote services that supplement internal and contractor on-site support and improve the effectiveness of their operation and maintenance programs. Remote services provide expertise to the customer in a cost-effective and efficient way.
Fingerprinting and monitoring of plant equipment are the base for tracking and reporting Key Performance Indicators of the plant, and taking proactive actions. Thus, maintenance work, dispatching and lifecycle management can be planned more efficiently. Downtimes are minimized, and recovery times after defects are reduced, thereby avoiding loss of production and possible penalties.
This is particularly true for critical power generation equipment, such as power transformers. As examples show, in some cases the benefits can be as high as 75% repair cost reduction, or loss of revenue reduction by 63%. This paper describes new service approaches which are available to O&M staff as well as asset managers at corporate level, supporting daily O&M practice as well as supporting strategic asset decision making processes.

PGA_REWA2013_RemoteTrafos_ID12637.doc 18 / 18
10 References
[1] “Improving operations and maintenance through remote optimization”, Antoine M., Nani G., PowerGen Europe 2012.
[2] “Harmony performance fingerprint” ABB brochure 3BUS094565 E SM2011-027.
[3] “Information Security for Power System Control Operations”, IEC-62351.
[4] “Remote monitoring of PV power plants”, ABB InControl 2/2011.
[5] “On-site Repair, refurbishment and high voltage tests of large power transformers in the transmission grid “, Aschwanden Th., Schenk A., Kreuzer J., Fuhr J. Hässig M., CIGRE 2004.
[6] “Transforming Transforming - Advanced transformer control and monitoring with TEC”, Jonsson Lars, ABB Review 4/2002.
[7] “Guide on Economics of Transformer Management” CIGRE 2004, WG A2-20 (Formerly WG 12-20), Members: P. Boss (CH), J-P. Patelli (F), J. Aubin (CA), P. Boman (USA), J-M. Braun (CA), E. Figueroa (CA), J. Foldi (CA), H. Fridman, (Israel), J. MacEnri (IE), C. Rajotte (CA), K. Ryen (NO), R. Sobocki (PL), D. Woodcock (USA), 2004.
[8] “Economical aspects and experiences of power transformer on-line monitoring”, Boss P., Lorin P., Viscardi A., Isecke J., Harley J., CIGRE 2000.
[9] Optimizing lifetime costs for transformers through informed decisions”, Lorin P., ABB Review Special Report, 10 – 15, 2004.
11 Acronyms
CIGRE Conseil International des Grands Réseaux Électriques DGA Dissolved Gas Analysis FRA Frequency Response Analysis KPI Key Performance Indicator O&M Operation & Maintenance OEE Overall Equipment Effectiveness PV Photo-Voltaic ROA Return On Asset TEC Transformer Electronic Control TV Tertiary Voltage