Remote Sens. 2015 OPEN ACCESS remote...
22
Remote Sens. 2015, 7, 10501-10522; doi:10.3390/rs70810501 remote sensing ISSN 2072-4292 www.mdpi.com/journal/remotesensing Article Performance of Burn-Severity Metrics and Classification in Oak Woodlands and Grasslands Michael C. Stambaugh 1, *, Lyndia D. Hammer 2 and Ralph Godfrey 3 1 Department of Forestry, 203 ABNR Building, University of Missouri-Columbia, Columbia, MO 65211, USA 2 Lomakatsi Restoration Project, PO Box 3084, Ashland, OR 97520, USA; E-Mail: [email protected] 3 Wichita Mountains Wildlife Refuge, U.S. Fish and Wildlife Service, 32 Refuge Headquarters, Indiahoma, OK 73552, USA; E-Mail: [email protected] * Author to whom correspondence should be addressed; E-Mail: [email protected]; Tel.: +1-573-882-8841; Fax: +1-573-882-1977. Academic Editors: Ioannis Gitas, Josef Kellndorfer and Prasad S. Thenkabail Received: 1 April 2015 / Accepted: 12 August 2015 / Published: 17 August 2015 Abstract: Burn severity metrics and classification have yet to be tested for many eastern U.S. deciduous vegetation types, but, if suitable, would be valuable for documenting and monitoring landscape-scale restoration projects that employ prescribed fire treatments. Here we present a performance analysis of the Composite Burn Index (CBI) and its relationship to spectral data (differenced Normalized Burn Ratio (dNBR) and its relative form (RdNBR)) across an oak woodland - grassland landscape in southwestern Oklahoma, USA. Correlation and regression analyses were used to compare CBI strata, assess models describing burn severity, and determine thresholds for burn severity classes. Confusion matrices were used to assess burn severity classification accuracy. Our findings suggest that dNBR and RdNBR, thresholded using total CBI, can produce an accurate burn severity map in oak woodlands, particularly from an initial assessment period. Lower accuracies occurred for burn severity classifications of grasslands and raises questions related to definitions and detection of burn severity for grasslands, particularly in transition to more densely treed structures such as savannas and woodlands. Keywords: CBI; drought; fire history; Landsat; dNBR; RdNBR; remote sensing OPEN ACCESS
Transcript of Remote Sens. 2015 OPEN ACCESS remote...
Remote Sens. 2015, 7, 10501-10522; doi:10.3390/rs70810501
remote sensing ISSN 2072-4292
www.mdpi.com/journal/remotesensing
Article
Performance of Burn-Severity Metrics and Classification in Oak
Woodlands and Grasslands
Michael C. Stambaugh 1,*, Lyndia D. Hammer 2 and Ralph Godfrey 3
1 Department of Forestry, 203 ABNR Building, University of Missouri-Columbia, Columbia,
MO 65211, USA 2 Lomakatsi Restoration Project, PO Box 3084, Ashland, OR 97520, USA;
E-Mail: [email protected] 3 Wichita Mountains Wildlife Refuge, U.S. Fish and Wildlife Service, 32 Refuge Headquarters,
Indiahoma, OK 73552, USA; E-Mail: [email protected]
* Author to whom correspondence should be addressed; E-Mail: [email protected];
Tel.: +1-573-882-8841; Fax: +1-573-882-1977.
Academic Editors: Ioannis Gitas, Josef Kellndorfer and Prasad S. Thenkabail
Received: 1 April 2015 / Accepted: 12 August 2015 / Published: 17 August 2015
Abstract: Burn severity metrics and classification have yet to be tested for many eastern
U.S. deciduous vegetation types, but, if suitable, would be valuable for documenting and
monitoring landscape-scale restoration projects that employ prescribed fire treatments. Here
we present a performance analysis of the Composite Burn Index (CBI) and its relationship
to spectral data (differenced Normalized Burn Ratio (dNBR) and its relative form (RdNBR))
across an oak woodland - grassland landscape in southwestern Oklahoma, USA. Correlation
and regression analyses were used to compare CBI strata, assess models describing burn
severity, and determine thresholds for burn severity classes. Confusion matrices were used
to assess burn severity classification accuracy. Our findings suggest that dNBR and RdNBR,
thresholded using total CBI, can produce an accurate burn severity map in oak woodlands,
particularly from an initial assessment period. Lower accuracies occurred for burn severity
classifications of grasslands and raises questions related to definitions and detection of burn
severity for grasslands, particularly in transition to more densely treed structures such as
savannas and woodlands.
Keywords: CBI; drought; fire history; Landsat; dNBR; RdNBR; remote sensing
OPEN ACCESS
Remote Sens. 2015, 7 10502
1. Introduction
Despite burn severity metrics and classification through remote sensing being used throughout the
world [1–4], they have yet to be described for many eastern U.S. vegetation types, such as deciduous
forests. The ability to describe, quantify, and remotely sense burn severity in this region would be
particularly useful for documentation, monitoring, and prioritization of landscape-scale restoration projects
that include prescribed burning [5]. In the last decade, research on fire regime characteristics and
post-fire effects has included increased emphasis on understanding the importance of the full range of
burn severities in forest ecosystems [6–8]. The role of mixed- to high-severity fire has been of particular
interest, both in wildfire and prescribed fire contexts [9–11].
Burn severity describes fire effects on above-ground vegetation and soil organic matter [12,13]. From
field measures to remote sensing and modeling, assessing burn severity presents diverse challenges [14].
Within remote sensing, various data (e.g., optical, RADAR, LiDAR) and approaches for assessing burned
areas exist [15–17]. Burn severity assessments have attempted to develop predictive models relating
multispectral satellite data to field measured burn severity measures [18], compare conceptual historical
fire regimes to current fire regimes [19], evaluate effectiveness of fuel treatments [20,21], and monitor
trends over time [22,23]. In relation to forest ecology and management, burn severity data can be used
to measure severity by vegetation type(s), project forest successional trajectories, and contribute to
modeling second-order fire effects [24,25].
FIREMON Landscape Assessment [26] is a standardized burn severity monitoring approach that
allows measuring and mapping burn severity from a combination of remotely sensed vegetation change
and ground-based plot data, although other burn severity assessment techniques are capable of providing
spatial data needed to support pre- and post-fire management decisions and monitoring [27,28]. A
commonly used technique utilizes the magnitude of change in reflected electromagnetic (EM) radiation
between pre-fire and post-fire landscape conditions. The spectral response curve of typical vegetation
occurs from 0.4 to 2.5 µm. A relatively high green reflectance response occurs due to chlorophyll
pigmentation in the visible range. A high near infrared (NIR; reflected infrared) response occurs due to
healthy plant cell structure and shortwave-infrared (SWIR; partly reflected, partly emitted) has a relatively
low response due to moisture absorption.
The Landsat satellite collects multispectral EM data divided into spectral bands. Landsat Band 4
measures radiance in the NIR range and Band 7 has sensitivity in the SWIR range. The band ratio between
Band 4 (healthy vegetation) and Band 7 (burned area; increased cover of bare soil and ash, decreased
greenness, and reduced plant moisture content) are commonly used for burn severity mapping [29]. This
change metric is at the resolution of the remote sensing imagery (e.g., 30 m) and, as a result, the effects
on the ground specific to trees, plants and soil are averaged to imagery resolution. In many cases, imagery
resolution limits visibility of finer-scale variation of fire effects and a bridge is needed between the
ground level and remotely sensed scales to help define the meaning of a range of severity scores across
the landscape [29]. To this end, the Composite Burn Index (CBI) field protocol [26] was developed to
enable “ground truthing” or definition of burn severity conditions at the plot level, to enable adjustment
of the severity score at the resolution of imagery, and to understand the ground-level effects described
by the severity classification across the landscape. CBI rates burn effects from the soil to the upper
canopy layers and then averages those ratings to derive a plot-level index value (i.e., CBI). Rating factors
Remote Sens. 2015, 7 10503
include changes to soil color, fuels consumed, stem char, vegetation mortality and resprouting, and changes
in plant community composition [26]. Rating factors were designed to describe ecological attributes of
change and correlate with changes detected by multispectral satellite imagery [26]. CBI has been tested
and used to validate burn severity maps in many ecosystems [13,30,31], but has not been tested specifically
in open-canopy structured oak woodlands of the eastern U.S. The objectives of this research were to:
(1) describe burn severity in this community type using the CBI protocol; and (2) gauge the performance
of satellite imagery to map burn severity across a gradient of grasslands and oak woodlands by
considering differences in land-types, CBI strata, and remotely-sensed burn severity metrics.
2. Data and Methods
2.1. Study Site
The study site was located in the Wichita Mountains Wildlife Refuge (WMWR) at the western edge
of the Cross Timbers region in southwestern Oklahoma, Comanche County, USA (Figure 1). Mountain
peaks are surrounded by a matrix of mixed-grass prairie with wooded lower slopes and creeks forming
an intermediate zone between the relatively flat valley floor and the steep, rocky slopes. Elevations range
from 411 m asl to 756 m asl. Three major land-types (grasslands, woodlands, and rock outcrops) occupy
98.5% of the refuge area.
The WMWR serves as an important ecotone for eastern and western plant and animal species.
Dominant trees are post oak (Quercus stellata), blackjack oak (Quercus marilandica) and eastern
redcedar (Juniperus virginiana), and dominant grasses include little bluestem (Schizachyrium scoparium),
big bluestem (Andropogon gerardii) and hairy grama (Bouteloua hirsuta) [32]. Southwestern Oklahoma,
encompassing the Wichita Mountains, is characterized by a continental, temperate climate with a mean
annual temperature of 16.1 degrees Celsius (Period: 1895–2011; National Climatic Data Center, Division 7,
SW Oklahoma) and 78 cm average annual rainfall (period: 1914–2008) [33].
Since the beginning of the 20th century, the landscape of the WMWR has been transitioning towards
more forested conditions and increased eastern redcedar density primarily due to altered fire regimes [34,35].
Starting 29 January 2010, one of the most destructive ice storms of local record caused significant
damage to overstory trees and, consequently, large increases in woody fuel loadings. From about July
2010, much of the southern plains had experienced severe to exceptional drought conditions (i.e., Palmer
Drought Severity Index (PDSI) ≤ −3.0). Beginning in May 2011, drought conditions were extreme
(PDSI < −4.0) for much of southwestern Oklahoma. The Ferguson Fire of September 2011 burned a
large portion of the WMWR and resulted in a wide range of fire severities. The Ferguson Fire started
1 September 2011 during exceptional drought conditions and continued until 7 September 2011, with
a total of 16,150 hectares burned (Figure 1). Moisture contents of 1000-h fuels were recorded at 3% by
WMWR fire staff. Though drought conditions eased during spring of 2012, southwestern Oklahoma
continued to be moderately to exceptionally dry until summer 2015 [36]. Persistent drought conditions
following the Ferguson Fire likely accentuated the observed fire effects.
Remote Sens. 2015, 7 10504
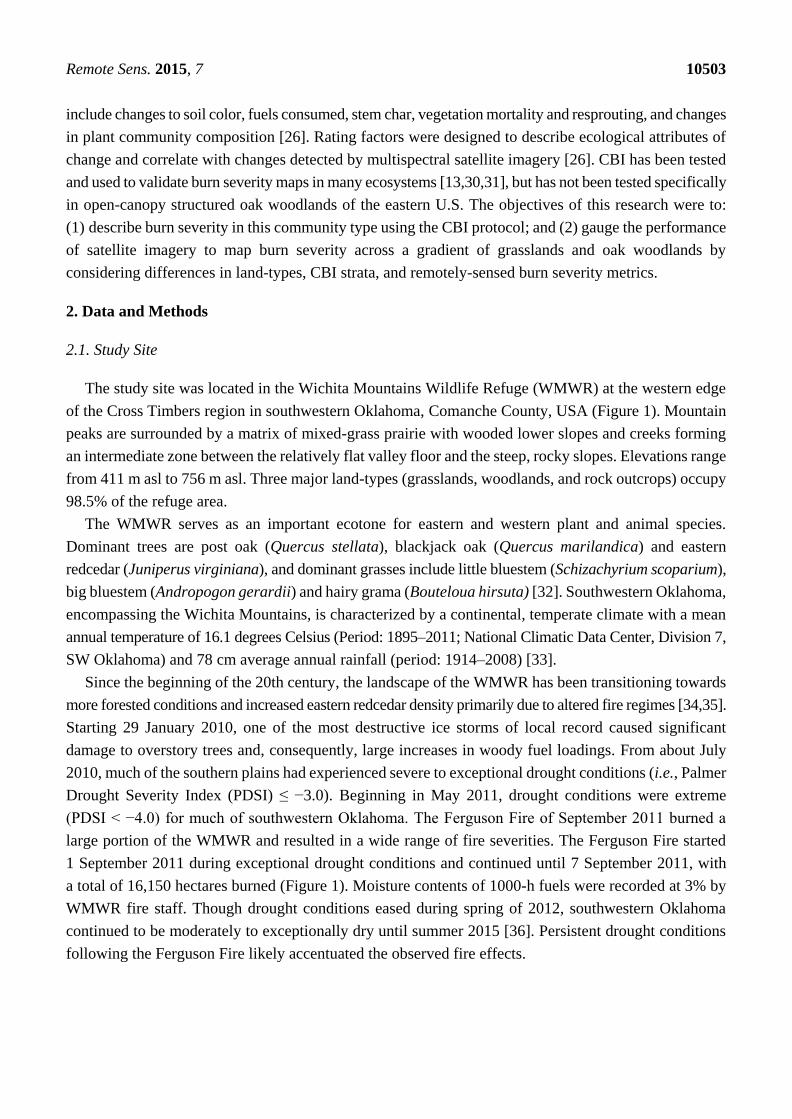
Figure 1. Topographic map of the Wichita Mountains Wildlife Refuge (WMWR) showing
the perimeter of the Ferguson Fire and locations of plots used to measure post-fire vegetation
and burn severity. Asterisk on inset map of Oklahoma indicates location of the study area.
2.2. Sampling Design
Prior to the Ferguson Fire, 343 vegetation plots (706 m2) were sampled across WMWR. Plot locations
were randomly generated in GIS (ArcView 3.2; ESRI) and then realigned to the center of the associated
30-meter grid cell of a digital elevation model (DEM) [37]. Plot vegetation was classified into three
land-types following Hoagland’s [38] Oklahoma vegetation community type definitions with minor
modification: (1) woodland: ≥25% deciduous tree cover; (2) grassland: >25% combined grass and forb
cover, and <25% deciduous tree cover; and (3) rocky: >25% rock cover and <25% deciduous or
grassland cover.
Following the Ferguson Fire, we re-measured 120 plots (Figure 1). This resampling effort was timed
with the production of the Monitoring Trends in Burn Severity (MTBS) Extended Assessment for the
Ferguson Fire. The MTBS project utilizes Landsat multispectral data and the differenced Normalized
Burn Ratio algorithm (dNBR, Equation (2)) to produce burn severity maps for all large fires in the US,
significantly aiding the efforts of land managers and researchers in assessment of fire effects [39].
Criteria for re-measurement of vegetation plots were: (1) located within the Landsat 7 dataset (i.e., not
included in strips of “no data” resulting from a known Scan Line Corrector error (see Figure 2);
(2) photographed prior to the fire; (3) evenly distributed among burn severity classes (unburned, low,
Remote Sens. 2015, 7 10505
moderate, and high) (Figure 2); (4) located within a relatively homogenous burn severity “patch”;
(5) distributed among land-types (grassland, rocky, and woodland); and (6) readily accessible. To locate
plots on the ground, we utilized GPS locations (3 m horizontal accuracy) followed by geo-rectification from
four pre-fire photographs taken from plot center. Plots were stratified by severity using the classified,
extended assessment (EA) (Table 1) differenced Normalized Burn Ratio (dNBR) dataset produced by
the USGS Center for Earth Resources Observation and Science (EROS) for the MTBS project in July
2012. Landsat pair acquisition and processing followed MTBS EA protocols and was timed to detect
maximum greenness one growing season post-fire, coincided with our season of survey, and was
constrained by cloud, dust, and smoke-free atmospheric conditions [39]. We expected that utilizing the
extended assessment (EA) data, as compared to the Initial Assessment (IA) data, would enable
accounting for delayed mortality or survival of vegetation and better characterize the longer-term
ecological response to burn severity [26]. Additionally, based on observations by WMWR biologists,
the EA classified dNBR severity map more closely matched the visually detected effects on canopy trees
than did the classified initial assessment severity map.
Thirty plots were resampled in each burn severity class. Focal statistics analysis (Spatial Analyst,
ArcGIS 10.0) on a 3 × 3 neighborhood identified the range (minimum − maximum) of dNBR values and
was used to select plots located in relatively homogeneous burn severity patches. Previous work by Key
and Benson [26] suggested that sampling within a patch of uniform burn severity was useful for refining
relationships among remotely sensed data and CBI. Due to the offset between the circular vegetation
plot coverage and the center of each grid cell, bilinear interpolation was used with the Spatial Analyst
Extract (ArcGIS 10.0) tool to assign dNBR and Relative differenced Normalized Burn Ratio (RdNBR)
values to plots. Bilinear interpolation considered the average value of the four nearest adjacent cells,
while the no interpolation option gives the value of the grid cell containing the center point. Because
plots may not always be located exactly at the center point of a grid cell, point scores could differ from
half or more of the plot score. Thus, the interpolation option was expected to improve the correlation
between CBI and burn ratios based on a comparable study [30] that found that bilinear interpolation
performed better than using the nearest neighbor average or a distance-weighted averaging method of
16 surrounding cells.
2.3. Composite Burn Index (CBI)
CBI measurements followed methods of Key and Benson [26] with scores generated for five strata:
(1) substrate; (2) herbs, low shrubs and trees <1-m tall (termed “grass stratum” in remainder of
document); (3) tall shrubs and trees (1 to 5 m tall; termed “shrub stratum” in remainder of document);
(4) short trees; and (5) tall trees. Due to the short stature of trees in the Cross Timbers and at the WMWR,
we modified tree height ranges measured in each stratum resulting in “short trees” ranging from 3 to 9 m
tall, and “tall trees” being >9 m tall. Tree height was the only modification we made to the CBI protocol.
Trees were scored based on the total change to foliage as green, scorched or torched, percent canopy
mortality, and total char height.
Remote Sens. 2015, 7 10506
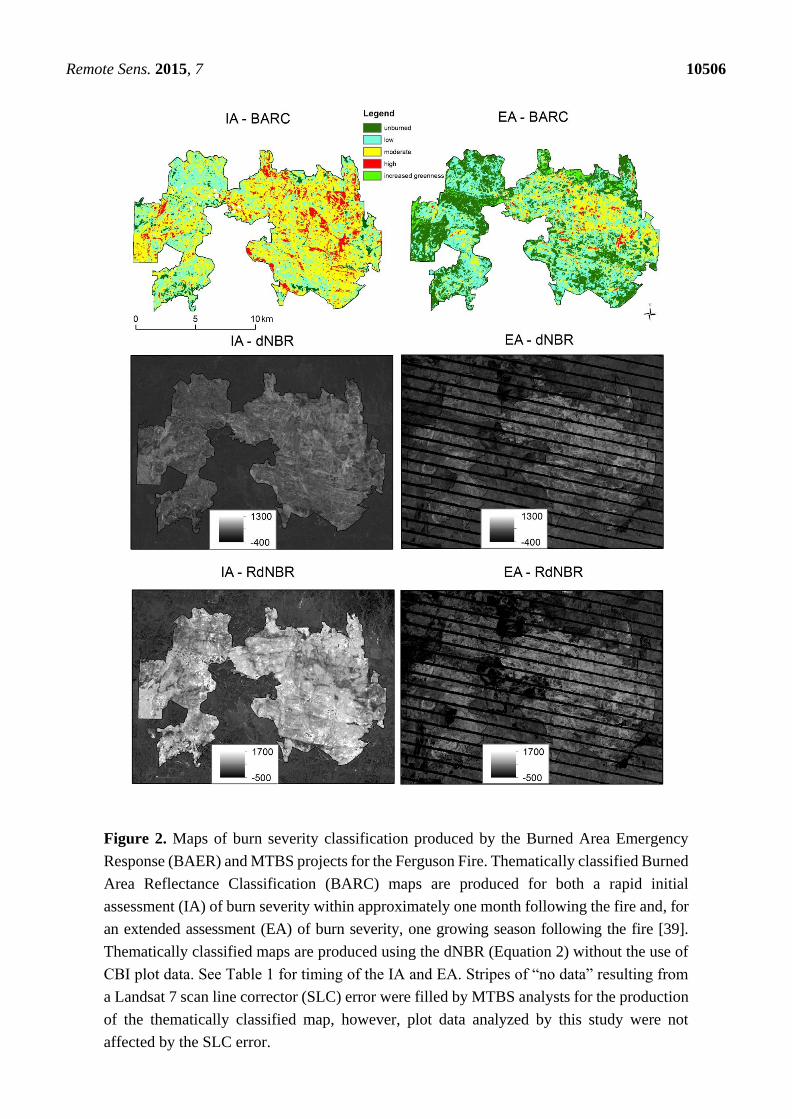
Figure 2. Maps of burn severity classification produced by the Burned Area Emergency
Response (BAER) and MTBS projects for the Ferguson Fire. Thematically classified Burned
Area Reflectance Classification (BARC) maps are produced for both a rapid initial
assessment (IA) of burn severity within approximately one month following the fire and, for
an extended assessment (EA) of burn severity, one growing season following the fire [39].
Thematically classified maps are produced using the dNBR (Equation 2) without the use of
CBI plot data. See Table 1 for timing of the IA and EA. Stripes of “no data” resulting from
a Landsat 7 scan line corrector (SLC) error were filled by MTBS analysts for the production
of the thematically classified map, however, plot data analyzed by this study were not
affected by the SLC error.
Remote Sens. 2015, 7 10507
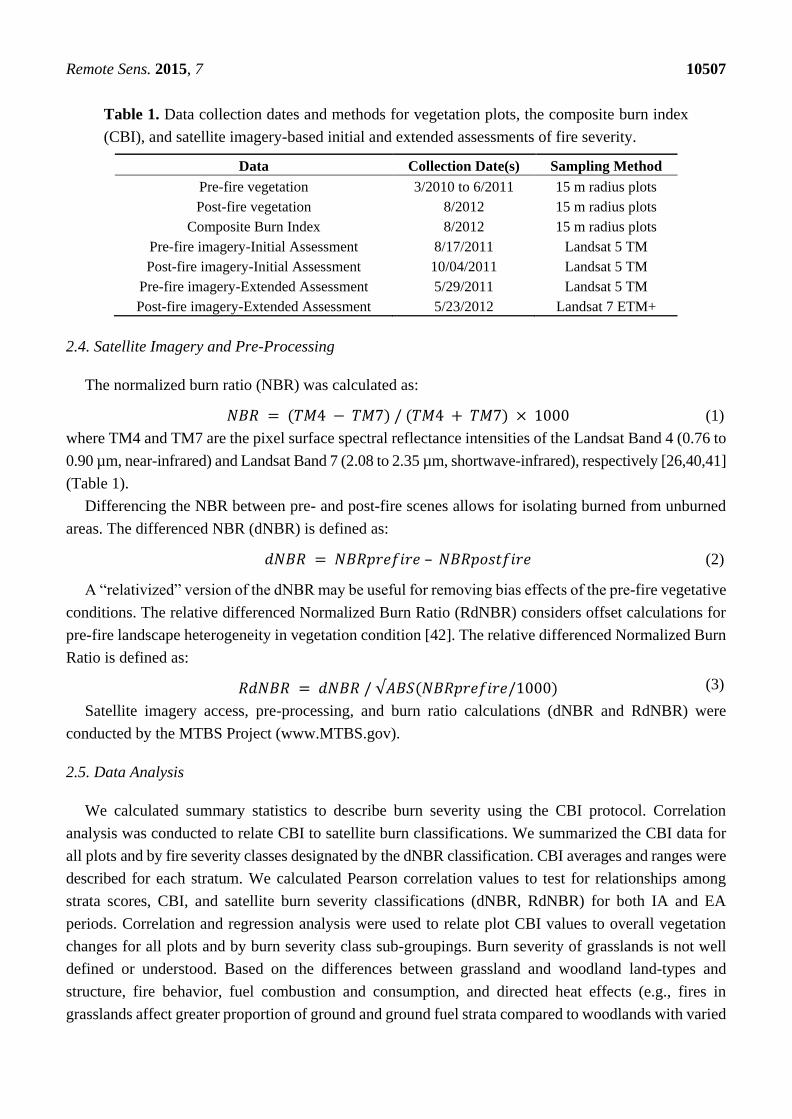
Table 1. Data collection dates and methods for vegetation plots, the composite burn index
(CBI), and satellite imagery-based initial and extended assessments of fire severity.
Data Collection Date(s) Sampling Method
Pre-fire vegetation 3/2010 to 6/2011 15 m radius plots
Post-fire vegetation 8/2012 15 m radius plots
Composite Burn Index 8/2012 15 m radius plots
Pre-fire imagery-Initial Assessment 8/17/2011 Landsat 5 TM
Post-fire imagery-Initial Assessment 10/04/2011 Landsat 5 TM
Pre-fire imagery-Extended Assessment 5/29/2011 Landsat 5 TM
Post-fire imagery-Extended Assessment 5/23/2012 Landsat 7 ETM+
2.4. Satellite Imagery and Pre-Processing
The normalized burn ratio (NBR) was calculated as:
𝑁𝐵𝑅 = (𝑇𝑀4 − 𝑇𝑀7) / (𝑇𝑀4 + 𝑇𝑀7) × 1000 (1)
where TM4 and TM7 are the pixel surface spectral reflectance intensities of the Landsat Band 4 (0.76 to
0.90 µm, near-infrared) and Landsat Band 7 (2.08 to 2.35 µm, shortwave-infrared), respectively [26,40,41]
(Table 1).
Differencing the NBR between pre- and post-fire scenes allows for isolating burned from unburned
areas. The differenced NBR (dNBR) is defined as:
𝑑𝑁𝐵𝑅 = 𝑁𝐵𝑅𝑝𝑟𝑒𝑓𝑖𝑟𝑒 – 𝑁𝐵𝑅𝑝𝑜𝑠𝑡𝑓𝑖𝑟𝑒 (2)
A “relativized” version of the dNBR may be useful for removing bias effects of the pre-fire vegetative
conditions. The relative differenced Normalized Burn Ratio (RdNBR) considers offset calculations for
pre-fire landscape heterogeneity in vegetation condition [42]. The relative differenced Normalized Burn
Ratio is defined as:
𝑅𝑑𝑁𝐵𝑅 = 𝑑𝑁𝐵𝑅 / √𝐴𝐵𝑆(𝑁𝐵𝑅𝑝𝑟𝑒𝑓𝑖𝑟𝑒/1000) (3)
Satellite imagery access, pre-processing, and burn ratio calculations (dNBR and RdNBR) were
conducted by the MTBS Project (www.MTBS.gov).
2.5. Data Analysis
We calculated summary statistics to describe burn severity using the CBI protocol. Correlation
analysis was conducted to relate CBI to satellite burn classifications. We summarized the CBI data for
all plots and by fire severity classes designated by the dNBR classification. CBI averages and ranges were
described for each stratum. We calculated Pearson correlation values to test for relationships among
strata scores, CBI, and satellite burn severity classifications (dNBR, RdNBR) for both IA and EA
periods. Correlation and regression analysis were used to relate plot CBI values to overall vegetation
changes for all plots and by burn severity class sub-groupings. Burn severity of grasslands is not well
defined or understood. Based on the differences between grassland and woodland land-types and
structure, fire behavior, fuel combustion and consumption, and directed heat effects (e.g., fires in
grasslands affect greater proportion of ground and ground fuel strata compared to woodlands with varied
Remote Sens. 2015, 7 10508
strata), it is possible that separate CBI reflectance models are needed for the different land-types. For
these reasons, we developed separate predictive models of burn severity for grasslands and woodlands.
Regression models were compared among CBI and satellite burn severity classifications. We developed
final regression models predicting dNBR and RdNBR using CBI. Model performance using linear and
non-linear regression was compared based on model significance and r-square. Final regression model
selections were based on model significance, r-square values, and normality of residuals. Final
regression models were used to determine severity class threshold values for dNBR and RdNBR.
Thresholds of severity classifications can be adapted to address many applications and, using the
regression equations, CBI severity determinations can easily be converted to threshold values for dNBR
and RdNBR [30]. We chose CBI threshold values that both signified observed changes in vegetation
conditions and facilitated comparison of our results to those of other studies. These thresholds were:
unburned (CBI = 0 to 0.1); low severity (0.1 to 1.24); moderate severity (1.25 to 2.24); and high severity
(2.25 to 3.0). Reclassifications were done using the Classify command in ArcToolbox (ArcGIS 10.3).
Models of dNBR and RdNBR were compared based on model r-square values and confusion matrices
that assessed classification accuracy. Confusion matrices showed the classification of field plots and
remotely sensed pixels for each model. From confusion matrices we calculated the overall classification
accuracy, user’s accuracy, and producer’s accuracy. Overall accuracy is the percentage of correct
classifications across all burn severity classes, user’s accuracy is the percentage of pixel values classified
correctly in each burn severity class, and producer’s accuracy represents the percentage of CBI plots
classified correctly in each burn severity class. User’s and producer’s accuracies were developed for
each burn severity class and compared. All statistical analyses and development of classifications were
performed using SAS v 9.3 (Cary, NC, USA) statistical software package.
3. Results
3.1. Composite Burn Index (CBI)
CBI scores ranged from 0.05 to 2.94 with a mean value of 1.90. Grass was the only stratum scored
on all plots while the tall tree stratum was scored on the fewest (n = 14). Among strata, all had CBI
scores that spanned nearly the entire range of possible values (0 to 3.0). The shrub stratum showed the
highest mean CBI score (2.27) while tall trees had the lowest (1.22). Scores of grass and shrub strata
were consistently higher than their respective plot-level CBI scores. Although plots were stratified by
severity classes prior to sampling (i.e., 30 each of unburned, low, moderate, and high severity as
classified in the dNBR EA (MTBS)), based on plot CBI scores of burned plots, we sampled 12 low
severity plots (CBI ≤ 1.25), 52 moderate severity plots (CBI = 1.26 to 2.25), and 27 high severity plots
(CBI > 2.26).
Rank patterns in stratum scores were similar for low and moderate severity conditions (Figure 3).
Specifically, average stratum scores increased from the substrate layer to the shrub layer and then
decreased to the tall tree layer. The tall tree layer had the lowest average strata score for low and moderate
severities. For high severity plots, all strata had average CBI scores >2.0 except for the tall tree stratum
(mean score = 1.93) and, of these, the stratum scores of grass and shrub strata were the highest. Mean
CBI values for low, moderate, and high classes increased with the severity classification. Similarly,

Remote Sens. 2015, 7 10509
within the low, moderate, and high classes, each stratum’s mean CBI score also increased with severity
(Figure 3).
Figure 3. Box plots summarizing stratum scores and total plot CBI scores by severity class.
Severity classes are determined by measured CBI scores of plots. The boundary of the box
closest to zero indicates the 25th percentile, the line within the box marks the median, and
the boundary of the box farthest from zero indicates the 75th percentile. Whiskers (error
bars) above and below the box indicate the 90th and 10th percentiles. Means are represented
by the dotted line.
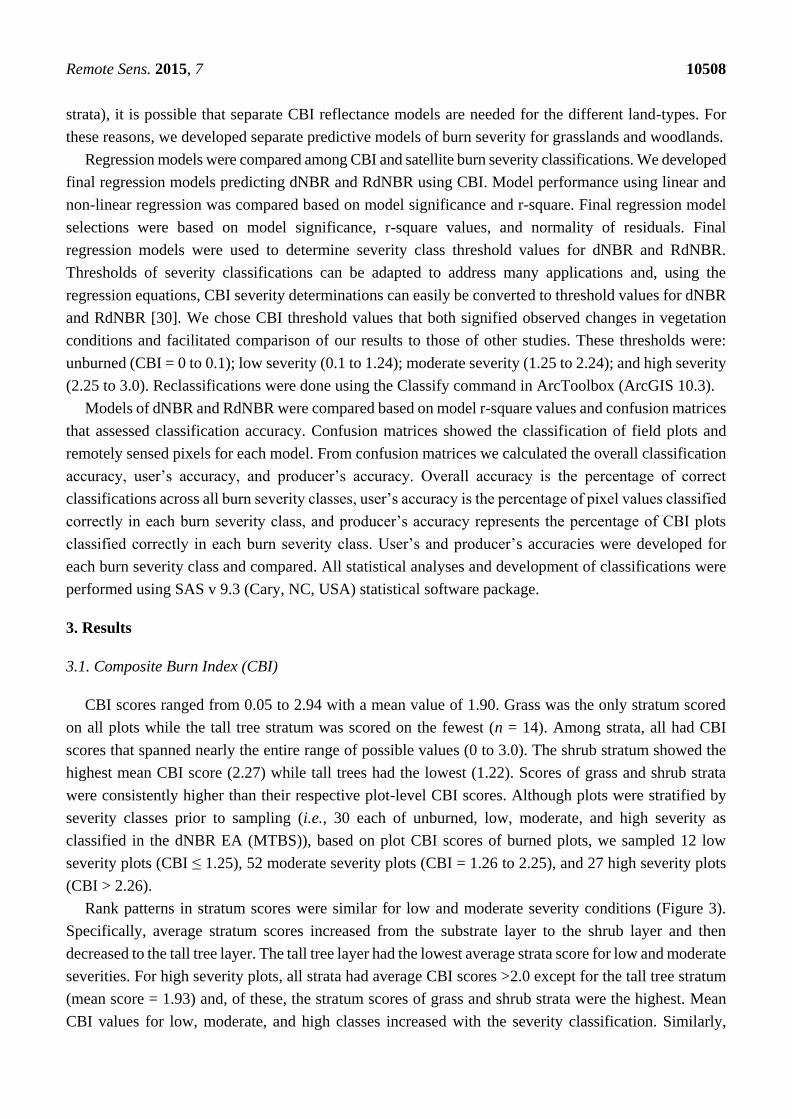
Data distributions and means of CBI stratum scores followed similar patterns across land-types
(Figure 4). Only data from woodlands spanned the full range of CBI scores in all strata (Figure 4). From
Remote Sens. 2015, 7 10510
the substrate to the tall tree stratum, scores tended to increase to the shrub stratum and then decrease.
Mean CBI scores for grasslands were always higher than the grassland substrate stratum scores and
lower than shrub stratum scores. Mean and median scores for shrubs were generally greater than 2.0
while these scores for short trees were less than 2.0.
Figure 4. Box plots summarizing stratum scores and total plot CBI scores. Plots show
differences in stratum scores by land-types and for all land-types combined. The boundary
of the box closest to zero indicates the 25th percentile, the line within the box marks the
median, and the boundary of the box farthest from zero indicates the 75th percentile.
Whiskers (error bars) above and below the box indicate the 90th and 10th percentiles. Means
are represented by the dotted line.
Remote Sens. 2015, 7 10511
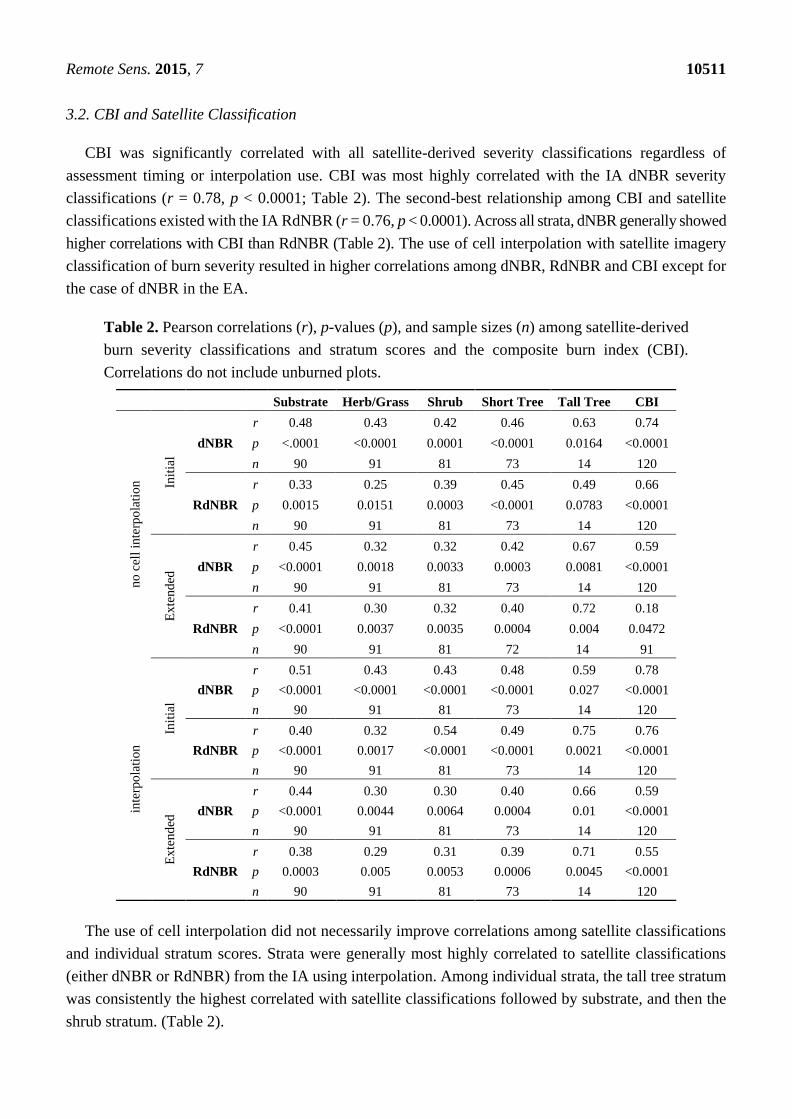
3.2. CBI and Satellite Classification
CBI was significantly correlated with all satellite-derived severity classifications regardless of
assessment timing or interpolation use. CBI was most highly correlated with the IA dNBR severity
classifications (r = 0.78, p < 0.0001; Table 2). The second-best relationship among CBI and satellite
classifications existed with the IA RdNBR (r = 0.76, p < 0.0001). Across all strata, dNBR generally showed
higher correlations with CBI than RdNBR (Table 2). The use of cell interpolation with satellite imagery
classification of burn severity resulted in higher correlations among dNBR, RdNBR and CBI except for
the case of dNBR in the EA.
Table 2. Pearson correlations (r), p-values (p), and sample sizes (n) among satellite-derived
burn severity classifications and stratum scores and the composite burn index (CBI).
Correlations do not include unburned plots.
Substrate Herb/Grass Shrub Short Tree Tall Tree CBI
no
cel
l in
terp
ola
tio
n
Init
ial
dNBR
r 0.48 0.43 0.42 0.46 0.63 0.74
p <.0001 <0.0001 0.0001 <0.0001 0.0164 <0.0001
n 90 91 81 73 14 120
RdNBR
r 0.33 0.25 0.39 0.45 0.49 0.66
p 0.0015 0.0151 0.0003 <0.0001 0.0783 <0.0001
n 90 91 81 73 14 120
Ex
tend
ed dNBR
r 0.45 0.32 0.32 0.42 0.67 0.59
p <0.0001 0.0018 0.0033 0.0003 0.0081 <0.0001
n 90 91 81 73 14 120
RdNBR
r 0.41 0.30 0.32 0.40 0.72 0.18
p <0.0001 0.0037 0.0035 0.0004 0.004 0.0472
n 90 91 81 72 14 91
inte
rpo
lati
on
Init
ial
dNBR
r 0.51 0.43 0.43 0.48 0.59 0.78
p <0.0001 <0.0001 <0.0001 <0.0001 0.027 <0.0001
n 90 91 81 73 14 120
RdNBR
r 0.40 0.32 0.54 0.49 0.75 0.76
p <0.0001 0.0017 <0.0001 <0.0001 0.0021 <0.0001
n 90 91 81 73 14 120
Exte
nded
dNBR
r 0.44 0.30 0.30 0.40 0.66 0.59
p <0.0001 0.0044 0.0064 0.0004 0.01 <0.0001
n 90 91 81 73 14 120
RdNBR
r 0.38 0.29 0.31 0.39 0.71 0.55
p 0.0003 0.005 0.0053 0.0006 0.0045 <0.0001
n 90 91 81 73 14 120
The use of cell interpolation did not necessarily improve correlations among satellite classifications
and individual stratum scores. Strata were generally most highly correlated to satellite classifications
(either dNBR or RdNBR) from the IA using interpolation. Among individual strata, the tall tree stratum
was consistently the highest correlated with satellite classifications followed by substrate, and then the
shrub stratum. (Table 2).

Remote Sens. 2015, 7 10512
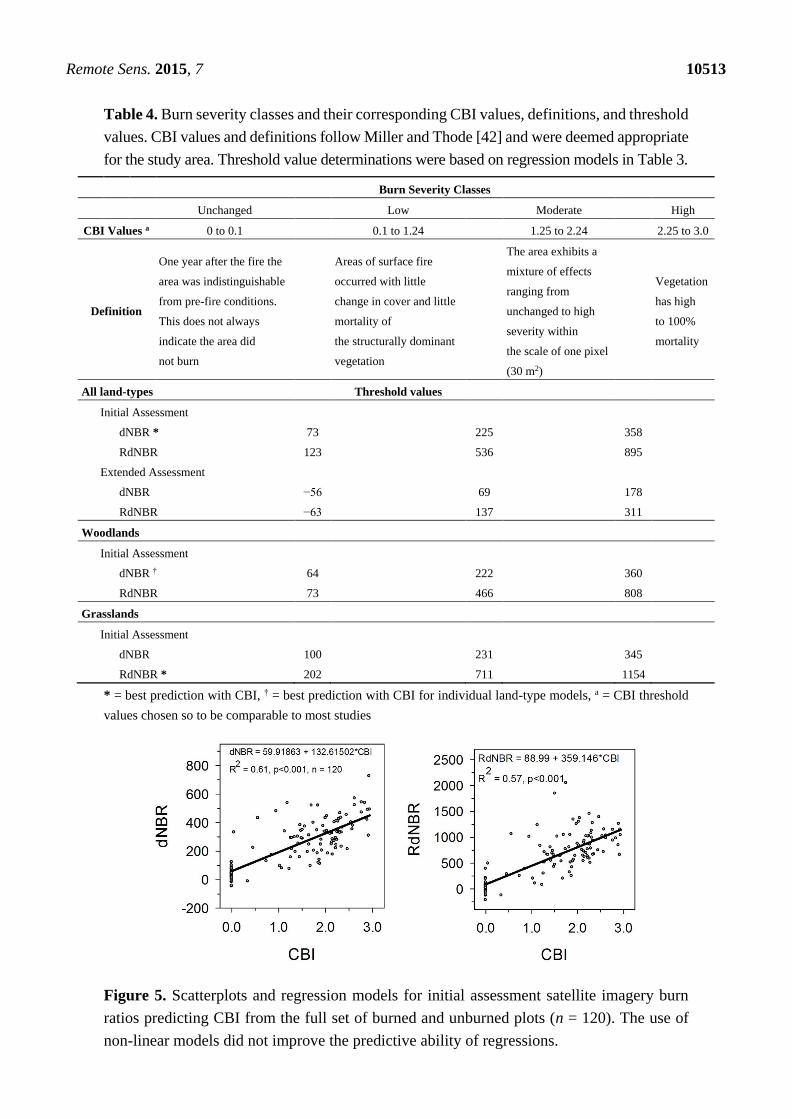
3.3. Predictive Models of Burn Severity and Thresholding
The ability of CBI to predict burn ratios was equal when comparing linear and non-linear models.
Significant predictive models of both dNBR and RdNBR were made for the IA and EA periods (Table 3,
Figure 5). Overall, best models occurred with the IA rather than the EA period. Examination and
ground-truthing of IA models and maps, particularly of dNBR, suggested that satellite-derived burn
severity in grassland land-types may be overestimated. Rocky plots were grouped with the woodlands
since they typically supported trees. When separated by type, models utilizing data from woodlands
performed better than those from grasslands. However, even models from grasslands were found to be
significant (Table 3). Burn severity class threshold values were generally lower using dNBR versus
RdNBR and higher for grasslands compared to woodlands (Table 4).
Table 3. Regression models of remotely sensed burn ratios and the composite burn index (CBI).
Variable Parameter Estimate SE Probability > t Model Probability > F Adjusted R2
All plots (n = 120)
dNBR_IA <0.001 0.61
Intercept 59.91863 16.93055 0.0006
CBI 132.61502 9.76113 <0.0001
RdNBR_IA
Intercept 88.9992 49.41016 0.0742 <0.001 0.57
CBI 359.14602 28.48691 <0.0001
dNBR_EA
Intercept −66.04456 28.40856 0.0056 <0.001 0.35
CBI 108.52425 13.49596 <0.0001
RdNBR_EA
Intercept −79.28319 42.58894 0.0651 <0.001 0.30
CBI 173.74911 24.55421 <0.0001
Woodlands (n = 86)
dNBR_IA <0.001 0.69
Intercept 50.92341 17.82425 0.0054
CBI 137.77572 10.02647 <0.0001
RdNBR_IA
Intercept 40.5572 39.24262 0.3043 <0.001 0.74
CBI 341.74184 22.07469 <0.0001
Grasslands (n = 34)
dNBR_IA <0.001 0.38
Intercept 89.38738 41.63793 0.0395
CBI 114.00274 25.70259 0.0001
RdNBR_IA
Intercept 159.81218 134.76715 0.2444 <0.001 0.47
CBI 442.91999 83.19011 <0.0001
Remote Sens. 2015, 7 10513
Table 4. Burn severity classes and their corresponding CBI values, definitions, and threshold
values. CBI values and definitions follow Miller and Thode [42] and were deemed appropriate
for the study area. Threshold value determinations were based on regression models in Table 3.
Burn Severity Classes
Unchanged Low Moderate High
CBI Values a 0 to 0.1 0.1 to 1.24 1.25 to 2.24 2.25 to 3.0
Definition
One year after the fire the
area was indistinguishable
from pre-fire conditions.
This does not always
indicate the area did
not burn
Areas of surface fire
occurred with little
change in cover and little
mortality of
the structurally dominant
vegetation
The area exhibits a
mixture of effects
ranging from
unchanged to high
severity within
the scale of one pixel
(30 m2)
Vegetation
has high
to 100%
mortality
All land-types Threshold values
Initial Assessment
dNBR * 73 225 358
RdNBR 123 536 895
Extended Assessment
dNBR −56 69 178
RdNBR −63 137 311
Woodlands
Initial Assessment
dNBR † 64 222 360
RdNBR 73 466 808
Grasslands
Initial Assessment
dNBR 100 231 345
RdNBR * 202 711 1154
* = best prediction with CBI, † = best prediction with CBI for individual land-type models, a = CBI threshold
values chosen so to be comparable to most studies
Figure 5. Scatterplots and regression models for initial assessment satellite imagery burn
ratios predicting CBI from the full set of burned and unburned plots (n = 120). The use of
non-linear models did not improve the predictive ability of regressions.

Remote Sens. 2015, 7 10514
3.4. Accuracy Assessment
In general, the accuracy assessment of severity classifications did not reveal any model that excelled
above all others. Accuracies generally seemed to be comparable to that of the MTBS classification;
however these results may not be comparable due to different classification methods, particularly of
the unburned areas. Overall model accuracies ranged from 37.5 to 44.2 percent using data from all
land-types (Table 5). Overall accuracies of satellite classifications using IA dNBR, IA RdNBR, and EA
dNBR were nearly equal (43% to 44%) while EA RdNBR was lower (37.5%). Compared to overall
accuracies based on all land-types, accuracies were improved 4.4% to 11.6% by considering burn
severity classification developed from woodlands only. Models considering just burn severity in
grasslands had similar accuracies as those that consider all land-types. User’s accuracies were highest
for moderate and high severity classes and lowest for classifications of unburned conditions.
For all land-types, user’s accuracies of the high severity class were more accurately predicted by EA
imagery, while moderate and low severity classes were more accurately predicted by IA imagery (Table 5).
For woodlands, user’s accuracy generally decreased from high to moderate to low severity classes.
For grasslands, user’s accuracies were greatest for moderate severity classes and lowest for high and low
severity classes. Producer’s accuracies (i.e., the probability that a given fire severity class of a plot is
classified as such) were lowest for unburned and high severity classes and greatest for low and moderate
severity classes. Unburned class thresholds were typically only slightly outside of the dNBR and RdNBR
ranges, but nonetheless were classified incorrectly. Producer’s accuracies were mixed across burn
severities for the different combinations of dNBR and RdNBR in initial and extended assessments.
Compared to models based on all land-types, producer’s accuracies were generally higher for models
based only on woodlands and lower for models based on grasslands.
Table 5. Confusion matrices results showing the accuracies of the different methods/models
produced. User’s and producer’s accuracies are divided into four burn severity classes; unb.
(unburned), low, mod (moderate), and high. Overall accuracy of the MTBS classification
method may be inflated since classification of some severity classes (e.g., unburned) did not
follow the same methodology.
Method Overall Accuracy User’s Accuracy Producer’s Accuracy
unb. low mod high unb. low mod high
All land-types
dNBR_IA 43.3 100.0 13.0 61.1 61.1 6.7 54.5 66.0 37.9
RdNBR_IA 44.2 - 16.7 60.3 53.3 0.0 63.6 76.0 27.6
dNBR_EA 43.3 100.0 10.9 57.4 90.9 6.7 45.5 70.0 34.5
RdNBR_EA 37.5 - 10.6 51.5 100.0 0.0 45.5 70.0 17.2
Woodlands
dNBR_IAwood 47.7 100.0 12.9 60.5 80.0 8.7 57.1 71.9 50.0
RdNBR_IAwood 55.8 83.3 15.4 68.6 78.9 21.7 57.1 75.0 62.5
Grasslands
dNBR_IAgrass 44.1 - 15.4 66.7 33.3 0.0 50.0 66.7 20.0
RdNBR_IAgrass 44.1 - 15.4 68.4 0.0 0.0 50.0 72.2 0.0
MTBS - - 19.4 65.6 57.1 - 54.5 42.0 55.2

Remote Sens. 2015, 7 10515
4. Discussion
4.1. Application of CBI
This study quantified changes in oak woodland and grassland vegetation across a gradient of burn
severities. The results of this study are new given that no known published information using the Landscape
Assessment [26] is currently available from oak woodlands and only one other published study in the
eastern U.S. exists from a site with a significant oak component [43]. FIREMON Landscape Assessment
methods and applications are new for many managers and scientists in this region likely due to the lack
of large-scale wildfires and federal lands compared to the western U.S. Methods and results presented
here may help to refine and understand future burn severity and monitoring activities.
An impetus for this study was concern that burn severity classifications do not perform well in oak
woodland and grassland vegetation. Burn severity classification in grasslands poses a concern because
vegetation change detection has potential to underestimate burn severities despite observations that fire
may alter the composition of grasslands (e.g., shift composition from native bunchgrass to forb and
annual grass dominance) which may not be detected using satellite imagery. However, it is possible that
the IA imagery could detect a level of ash or bare soil that would correlate with resulting, lagged effects
in grassland or woodland composition. This could explain why CBI was generally more highly correlated
with the IA than the EA. In a longleaf pine (Pinus palustris) ecosystem, Picotte and Robertson [31] note
that some burn severity effects evident on the ground at the time of CBI sampling one year post fire were
no longer detected by the EA imagery and as a result compared the IA and the EA with imagery taken
at an intermediate time frame of three months.
A consequence of the lack of studies from the eastern U.S. that have utilized the Landscape
Assessment methodology is that fire severity has been poorly defined with regard to changes in vegetation.
By measuring the CBI at each plot we were able to identify strata changes associated with this burn
severity classification scheme. Mean CBI scores were slightly higher for woodlands than grasslands.
Though somewhat counterintuitive, mean CBI scores (Figure 4) in woodlands were higher than the means
for both short and tall tree strata. For all land-types, mean scores of grass and shrub strata were
consistently higher than the mean CBI while mean scores of substrate and short tree strata closely
matched the mean CBI. Within grasslands, CBI scores were frequently higher than the substrate stratum
score and lower than shrub stratum score. This suggests that the shrub stratum in the grasslands more
readily achieved high severity effects and its scores generally elevated the CBI. In grasslands and open
woodlands, there may be little opportunity to rate severity based on effects on woody cover change.
However, where woody cover is present in grasslands, this may aid in better defining fire severity in
grasslands, and may support the notion that ratings for grassland CBI scores are comparable to those of
more forested areas and effects. Definitions and understanding of fire severity in grasslands are lacking,
and therefore it is difficult to judge whether CBI methods are appropriate for grassland plots. A synthesis
of fire severity and vegetation response is needed for grasslands similar to that presented by Keeley [13].
Based on our measurements, it appeared that most grassland plots had moderate burn severities and few
fell within the ranges of low and high severity conditions.
We thought that to get a representative severity assessment using the CBI in short-statured oak
woodlands (i.e., Cross Timbers), we needed to modify the CBI strata. Stratum heights were developed
Remote Sens. 2015, 7 10516
in western, coniferous forests [26] and we were concerned that the tree height break points did not fit
the short tree stature and lack of canopy stratification that exists in woodlands and more open forest
community structures. For example, little duff exists in the substrate strata of the WMWR, tall shrubs
and short trees are largely composed of 1 to 3 m tall blackjack oak, and the overstory canopy is typically
short (3 to 9 m) and rarely exceeds 9 m. For these reasons, we scaled the tree strata to what we perceived
as an accurate representation of the pre-fire height stratification of these woodlands.
Miller and Thode [42] attempted a relativized change metric based on the heterogeneity of the unburned
landscape leading to the development of the RdNBR and DeSantis and Chuvieco [44] tested modifications
to the CBI for a similar reason; to weight severity scores by pre-fire cover. Both efforts attempted to
scale or adapt broad change metrics to more localized conditions. We chose to modify the height
categories for the tree strata, for the same purpose: to scale the burn index to local conditions. However,
because we did not sample with a control to compare results of un-modified strata, we cannot say if
scaling the stratum heights had any effect on the classification accuracy or predictive relationship among
CBI and satellite classifications. Another discrepancy between the CBI protocol and its apparent fit to
the xeric oak ecosystem of the south central U.S. occurred regarding char heights in that they were too
high and not appropriately scaled to the short trees in the Cross Timbers (thus lowering the score for that
stratum). For example, for intermediate and tall trees, low severity char height was 1.8 m, moderate
severity was 2.8 m, and high severity was greater than 5 m. In many cases, to score the highest rating
for the char height (i.e., 3.0), char would have to be taller than the trees. This resulted in an incongruous
score for char height relative to the other metrics in that stratum, and potentially had the effect of
artificially lowering the severity score for that tree layer. To mitigate this problem in the future, if tree
heights are modified, then char height modifications should perhaps also be considered.
4.2. Satellite Imagery Classification
Based on correlations among strata and satellite imagery classifications (Table 2), the tall tree stratum
was most strongly related to satellite classifications, regardless of assessment timing, use of interpolation,
or burn ratio (dNBR or RdNBR). The tall tree stratum was only measured on 14 of the 120 plots and this
is likely to be a common rating frequency in short-statured forests and in open-structures in a mosaic of
grasslands. The next best strata correlated with burn ratio were substrate and short tree. These strata were
typically more highly correlated to burn ratios than the grass or shrub strata. All correlations among CBI
and the substrate, grass, shrub, and short tree strata were greatest with the IA dNBR using interpolation;
therefore we chose this burn ratio as the best-suited for predicting CBI.
CBI and burn ratio correlations were higher in woodlands than grasslands. Other studies have shown
that performance and utility of remotely sensed burn severity may be limited in grassland-dominated
regions [45]. The observation that dNBR was more highly correlated with CBI for all plots, but RdNBR
was more highly correlated with woodlands and grasslands separately, suggests that the relationships
among the two ratios and CBI differed by land-type. This was our premise for providing separate models
and thresholds for woodlands and grasslands in Table 4. Regardless of which burn severity ratio is
chosen, it should be expected that the majority of the variance in observed CBI can be explained.
Correlations among burn ratios and CBI were consistently higher for the IA compared to EA and this
difference was consistent when separating correlations by strata (Table 2). Why would IA imagery better

Remote Sens. 2015, 7 10517
predict burn severity when the timing of the measurement of burn severity matched the EA? Higher
correlation between CBI and the IA imagery suggests that immediate post-fire changes detected by
satellite remain identifiable by observers utilizing the CBI one year later, and/ or that “green-up” detected
by EA imagery may mask post-fire effects detectable on the ground. The EA should provide additional
data about delayed survival and mortality and, at this time, it is not clear why the EA is less useful for
classifying severity. We hypothesize that it is related to the properties of grassland vegetation, their
post-fire recovery, and reflectance.
IA models for dNBR and RdNBR explained 61 and 57 percent of the variance in CBI, respectively.
Coefficients of determination (R2) are comparable to or lower than the best model accuracies presented
by Cansler and McKenzie [30] for the northern Cascades, Miller et al. [18] for sites in the Sierra Nevada
and Klamath Mountains, Picotte and Robertson [31] for the southeastern U.S., and many other sites
throughout the western U.S. (see Table 12 in Cansler and McKenzie [30] and Parks et al. [46]). Despite
our models having similar explanatory power as many others, overall the classification accuracies
were lower.
Accuracies of burn classifications were much lower in unburned (user’s accuracy) and low severity
classes (producer’s accuracy) compared to moderate and high severity classes. Accuracies of moderate
and high severity classifications were comparable to those reported in other studies. It appears that the
cause for the inaccuracy of unburned/low severity areas was that many of the unburned plots had image
classified burn ratios in the range of low severity values. This situation is a case where a regression only
approach to deriving class thresholds could be supplemented and improved with slight adjustments. In
this case, classifications between unburned and low severity classes could be improved by increasing IA
threshold values to around 140 for dNBR and 320 for RdNBR. These values would be on the high range
for unburned/low severity threshold values compared to other sites throughout the western U.S. (see
Table 13 in Cansler and McKenzie [30] and Parks et al. [46]). Based on the data, it is not clear why
increasing these threshold values for dNBR and RdNBR is needed and whether similar results would be
found in comparable conditions or vegetation. Differences in conditions (e.g., spatial, temporal, radiometric,
and geographic) of two image scenes can affect fire severity quantification [29]. Further, it is possible
that the need to increase threshold values is because changes on unburned plots are higher than typically
observed due to the added effects of exceptional drought on vegetation conditions. Combined drought
and fire effects influencing CBI is an example for why thresholds can vary between burns and thresholding
may be needed for each fire. Further work could be done to refine threshold points and increase
accuracies by including ground-truthing sites near mapped break points.
Classification of high burn severity had the highest user’s accuracy while classification of moderate
burn severity had the highest producer’s accuracy. Other studies have shown higher classification accuracies
with increased severity. Depending on application, it may be that the accuracy of the burn severity
classification is adequate for specific situations such as distinguishing moderate to high severity classes.
Considering the accuracy of the woodland only model, it seems that woodland burn severity classification
should be reliable, particularly for classifying moderate to high severity conditions. Based on the
accuracy differences between woodlands and grasslands (Table 5), it would seem that much of the
inaccuracy of classifying “All land-types” is likely to be due to classifying grasslands. Efforts to improve
models and classification of grassland burn severity may consider modifications to the burn rating
system (e.g., CBI), imagery processing approaches (i.e., scene timing), and classification methodology.
Remote Sens. 2015, 7 10518
4.3. Recommended Methods for Validating Future Fire Severity Maps in Oak Woodlands
Recommendations for future work are based solely on our findings from this single fire. Ideally, more
studies would be available to compare the results over replications. Considering this, we would
recommend using an unaltered CBI protocol paired with the IA period burn severity imagery (dNBR or
RdNBR). In the Cross Timbers region it is highly likely that the tall tree class will not be rated using the
standard CBI form. CBI—Satellite relationships will likely be best for strata that capture the dominant
overstory layer, particularly for woodlands. Areas with higher percentages of woody cover are likely to
be more accurately classified than those dominated by grasslands. In many parts of the eastern U.S. high
severity burns are uncommon and occur during drought conditions. Burn severity monitoring should
consider the non-fire related effects, such as drought, and how much they may contribute to the overall
variability in vegetation observed.
5. Conclusions
Our findings suggest that dNBR and RdNBR reflectance data, thresholded using total CBI,
particularly from the IA period, produces the most accurate burn severity map in oak woodlands. To our
knowledge, this paper presents one of the most rigorous analyses of burn severity in eastern U.S.
deciduous forests and is the first time that remotely sensed information has been used to develop burn
severity thresholds and maps in oak-dominated woodlands including a gradient to grassland vegetation.
The accuracy of burn severity models (Table 5) suggests that burn severity metrics have greatest utility
for monitoring fire effects to woodlands and, less so, in grasslands. The lowered accuracies of
classifications of grasslands (i.e., non-woody areas) beg the question: What are definitions of burn
severity for grass/ herbaceous dominated areas, particularly in situations where they occur within
a matrix of woodlands? Further advancements in burn severity monitoring in eastern U.S. vegetation
types, including improved detection of substrate and grass strata change, would both improve our
understanding of their fire ecology and significantly enhance documentation and monitoring through
remote sensing.
Acknowledgments
This research was funded by the U.S. Fish & Wildlife Service. We thank Paige Schmidt,
Walter Munsterman, Dan McDonald, and Jeremy Dixon of the (U.S. Fish and Wildlife Service) for their
assistance in study design, training, and fieldwork. Nate Benson (National Park Service) provided critical
guidance regarding CBI data collection and analysis and helpful review comments on previous versions
of this manuscript. Stephen Howard (USGS Center for Earth Resources Observation and Science
(EROS)) graciously provided the extended assessment satellite classification data. Fieldwork assistance
was provided by Carter Kinkead, Matt Bourscheidt, Ryan Simms, Jonathan Hogg, Michael Womack,
Ian Dudley, Michael Johnson, Chris Burgess, and Lydia Tomlinson. The findings and conclusions in
this article are those of the authors and do not necessarily represent the views of the US Fish and
Wildlife Service.
Remote Sens. 2015, 7 10519
Author Contributions
Michael Stambaugh conceived study, designed sampling, conducted the analysis, wrote the paper;
Lyndia Hammer conceived study, designed sampling, collected data, and contributed to writing the
paper; Ralph Godfrey conceived study, designed sampling, collected data, and contributed to writing
the paper.
Conflicts of Interest
The authors declare no conflict of interest.
References
1. De Santis, A.; Chuvieco, E. Burn severity estimation from remotely sensed data: Performance of
simulation versus empirical models. Remote Sens. Environ. 2007, 108, 422–425.
2. Boer, M.M.; Macfarlane, C.; Norris, J.; Sadler, R.J.; Wallace, J.; Grierson, P.F. Mapping burned
areas and burn severity patterns in SW Australian eucalypt forest using remotely-sensed changes in
leaf area index. Remote Sens. Environ. 2008, 112, 4358–4369.
3. Wang, Z.; Jiang, L.; Kong, B.; Chen, H.; Zhang, T. Remote sensing measure of severity on the
Zhalong wetlands and consequent ecological effects. In Proceedings of the Third International
Workshop on Earth Observation and Remote Sensing Applications, Changsha, China, 11–14 June 2014.
4. Salvia, M.; Ceballos, D.; Grings, F.; Karszenbaum, H.; Kandus, P. Post-fire effects in wetland
environments: Landscape assessment of plant coverage and soil recovery in the Paraná River delta
marshes, Argentina. Fire Ecol. 2012, 8, 17–37.
5. Wiens, J.; Sutter, R.; Anderson, M.; Blanchard, J.; Barnett, A.; Aguilar-Amuchastegui, N.;
Avery, C.; Laine, S. Selecting and conserving lands for biodiversity: The role of remote sensing.
Remote Sens. Environ. 2009, 113, 1370–1381.
6. Kulakowski, D; Veblen, T.T. Effect of prior disturbances on the extent and severity of wildfire in
Colorado subalpine forests. Ecology 2007, 88, 759–769.
7. Perry, D.A.; Hessburg, P.F.; Skinner, C.N.; Spies, T.A.; Stephens, S.L.; Taylor, A.H.; Franklin, J.F.;
McComb, B.; Riegel, G. The ecology of mixed severity fire regimes in Washington, Oregon, and
Northern California. Forest Ecol. Manag. 2011, 262, 703–717.
8. Koldan, C.A; Rogan, J. Mapping wildfire burn severity in the Arctic Tundra from downsampled
MODIS data. Arct. Antarct. Alp. Res. 2013, 45, 64–76.
9. Twidwell, D.T.; Rogers, W.E.; McMahon, E.A.; Thomas, B.R.; Kreuter, U.P.; Blankenship, T.L.
Prescribed extreme fire effects on richness and invasion in coastal prairie. Invasive Plant Sci. Manag.
2012, 5, 330–340.
10. Williams, M.A.; Baker, W.L. Spatially extensive reconstructions show variable-severity fire and
heterogeneous structure in historical western United States dry forests. Glob. Ecol. Biogeogr. 2012,
21, 1042–1052.
11. Fulé, P.Z.; Swetnam, T.W.; Brown, P.M.; Falk, D.A.; Peterson, D.L.; Allen, C.D. Unsupported
inferences of high severity fire in historical western United States dry forests: Response to Williams
and Baker. Glob. Ecol. Biogeogr. 2013, 23, 825–830.
Remote Sens. 2015, 7 10520
12. Ryan, K.C.; Noste, N.V. Evaluating prescribed fires. In Proceedings of the Symposium and
Workshop on Wilderness Fire, Missoula, MT, USA, 15–18 November 1983.
13. Keeley, J.E. Fire intensity, fire severity and burn severity: A brief review and suggested usage.
Int. J. Wildland Fire 2009, 18, 116–126.
14. Morgan, P.; Keane, R.E.; Dillon, G.K.; Jain, T.B.; Hudak, A.T.; Karau, E.C.; Sikkink, P.G.;
Holden, Z.A.; Strand, E.K. Challenges of assessing fire and burn severity using field measures,
remote sensing and modelling. Int. J. Wildland Fire 2014, 23, 1045–1060.
15. Stroppiana, D.; Azar, R.; Calò, F.; Pepe, A.; Imperatore, P.; Boschetti, M.; Silva, J.M.N.;
Brivio, P.; Lanari, R. Integration of optical and SAR data for burned area mapping in Mediterraean
regions. Remote Sens. 2014, 7, 1320–1345.
16. Pierce, A.D.; Farris, C.A.; Taylor, A.H. Use of random forests for modeling and mapping
forest canopy fuels for fire behavior analysis in Lassen Volcanic National Park, California, USA.
Forest Ecol. Manag. 2012, 279, 77–89.
17. Bolton, D.K.; Coops, N.C.; Wulder, M.A. Characterizing residual structure and forest recovery
following high-severity fire in the western boreal of Canada using Landsat time-series and airborne
LiDAR data. Remote Sens. Environ. 2015, 163, 48–60.
18. Miller, J.D.; Knapp, E.E.; Key, C.H.; Skinner, C.N.; Isbell, C.J.; Creasy, R.M.; Sherlock, J.W.
Calibration and validation of the relative differenced Normalized Burn Ratio (RdNBR) to three measures
of fire severity in the Sierra Nevada and Klamath Mountains, California, USA. Remote Sens.
Environ. 2009, 113, 645–656.
19. Hessburg, P.F.; Agee, J.K.; Franklin, J.F. Dry forests and wildland fires of the inland Northwest
USA: Contrasting the landscape ecology of the pre-settlement and modern eras. Forest Ecol.
Manag. 2005, 211, 117–139.
20. Prichard, S.J; Kennedy, M.C. Fuel treatments and landform modify landscape patterns of burn
severity in an extreme fire event. Ecol. Appl. 2014, 24, 571–590.
21. Wimberly, M.C.; Cochrane, M.A.; Baer, A.D.; Pabst, K. Assessing fuel treatment effectiveness
using satellite imagery and spatial statistics. Ecol. Appl. 2009, 19, 1377–1384.
22. Miller, J.D.; Safford, H.D. Trends in wildfire severity 1984–2010 in the Sierra Nevada, Modoc
Plateau and southern Cascades, California, USA. Fire Ecol. 2012, 8, 41–57.
23. Parks, S.A.; Miller, C.; Nelson, C.R.; Holden, Z.A. Previous fires moderate burn severity of
subsequent wildland fires in two large western US wilderness areas. Ecosystems 2014, 17, 29–42.
24. Johnstone, J.F.; Rupp, T.S.; Olson, M.; Verbyla, D. Modeling impacts of fire severity on
successional trajectories and future fire behavior in Alaskan boreal forests. Landsc. Ecol. 2011,
26, 487–500.
25. Russell, R.E.; Saab, V.A.; Dudley, J.G. Habitat-suitability models for cavity-nesting birds in
a postfire landscape. J. Wildl. Manag. 2007, 71, 2600–2611.
26. Key, C.H.; Benson, N.C. Landscape Assessment (LA): Sampling and analysis methods.
In FIREMON: Fire Effects Monitoring and Inventory System; Lutes, D.C., Keane, R.E., Caratti, C.H.,
Key, N.C., Sutherland, S., Eds.; Rocky Mountain Research Station, USDA Forest Service:
Fort Collins, CO, USA, 2006; p. 51.
27. Montealegre, A.L.; Lamelas, M.T.; Tanase, M.A.; de la Riva, J. Forest fire severity assessment
using ALS data in a mediterranean environment. Remote Sens. 2014, 6, 4240–4265.
Remote Sens. 2015, 7 10521
28. Tanase, M.A.; Santoro, M.; Wegmüller, U.; de la Riva, J.; Pérez-Cabello, F. Properties of X-, C- and
L-band repeat-pass interferometric SAR coherence in Mediterranean pine forests affected by fires.
Remote Sens. Environ. 2010, 114, 2182–2194.
29. Key, C.H. Ecological and sampling constraints on defining landscape fire severity. Fire Ecol. 2006,
2, 34–59.
30. Cansler, C.A., McKenzie, D. How robust are burn severity indices when applied in a new region?
Evaluation of alternate field-based and remote-sensing methods. Remote Sens. 2012, 4, 456–483.
31. Picotte, J.J.; Robertson, K.M. Validation of remote sensing of burn severity in south-eastern US
ecosystems. Int. J. Wildl. Fire 2011, 20, 453–464.
32. Buck, P. Relationships of the woody vegetation of the Wichita Mountains Wildlife Refuge to
geological formations and soil types. Ecology 1964, 45, 336–344.
33. National Climate Data Center (NCDC). Monthly Surface Data. National Climate Data Center,
Asheville, North Carolina, USA. 1999. Available online: http://www.ncdc/noaa.gov/ (accessed on
28 May 2009).
34. Stambaugh, M.C.; Marschall, J.M.; Guyette, R.P. Linking fire history to successional changes of
xeric oak woodlands. Forest Ecol. Manag. 2014, 320, 83–95.
35. Hammer, L.D.; Stambaugh, M.C. Environmental gradients and controls of eastern redcedar
(Juniperus virginiana L.) expansion from ancient refugia. Biol. Invasions 2015, in press.
36. U.S. Drought Monitor. 2013. Available online: http://droughtmonitor.unl.edu/monitor.html
(accessed on 9 July 2013).
37. Gesch, D.; Evans, G.; Mauck, J.; Hutchinson, J.; Carswell, W.J., Jr. The National Map—Elevation:
U.S. Geological Survey Fact Sheet 2009-3053. Available online: http://ned.usgs.gov (accessed on
1 April 2015).
38. Hoagland, B. The vegetation of Oklahoma: A classification for landscape mapping and conservation
planning. Southwest. Nat. 2000, 45, 385–420.
39. Eidenshink, J.; Schwind, B.; Brewer, K.; Zhu Z.L.; Quayle, B.; Howard, S. A project for monitoring
trends in burn severity. Fire Ecol. 2007, 3, 3–21.
40. Key, C.H.; Benson, N.C. Measuring and remote sensing of burn severity: The CBI and NBR.
In Proceedings of the Joint Fire Science Conference and Workshop, Boise, ID, USA, 15–17 June 1999.
41. Brewer, C.K.; Winne, J.C.; Redmond, R.L.; Opitz, D.W.; Mangrich, M.V. Classifying and mapping
wildfire severity: A comparison of methods. Photogramm. Eng. Remote Sens. 2005, 71, 1311–1320.
42. Miller, J.D.; Thode, A.E. Quantifying burn severity in a heterogeneous landscape with a relative
version of the delta Normalized Burn Ratio (dNBR). Remote Sens. Environ. 2007, 109, 66–80.
43. Wimberly, M.C.; Reilly, M.J. Assessment of fire severity and species diversity in the southern
Appalachians using Landsat TM and ETM+ imagery. Remote Sens. Environ. 2007, 108, 189–197.
44. De Santis, A.; Chuvieco, E. GeoCBI: A modified version of the Composite Burn Index for the initial
assessment of the short-term burn severity from remotely sensed data. Remote Sens. Environ. 2009,
113, 554–562.

Remote Sens. 2015, 7 10522
45. Roy, D.P.; Boschetti, L.; Trigg, S.N. Remote sensing of fire severity: assessing the performance of
the normalized burn ratio. IEEE Geosci. Remote Sens. Lett. 2006, 3, 112–116.
46. Parks, S.A.; Dillon, G.K.; Miller, C. A new metric for quantifying burn severity: The relativized
burn ratio. Remote Sens. 2014, 6, 1827–1844.
© 2015 by the authors; licensee MDPI, Basel, Switzerland. This article is an open access article
distributed under the terms and conditions of the Creative Commons Attribution license
(http://creativecommons.org/licenses/by/4.0/).


![Remote Sens. 2015 OPEN ACCESS remote sensing · 2015-10-23 · Remote Sens. 2015, 7 11018 larger area with ecosystem models [16–19]. As an important proxy of terrestrial carbon](https://static.fdocuments.in/doc/165x107/5f4fbc1257712b67c20c897b/remote-sens-2015-open-access-remote-sensing-2015-10-23-remote-sens-2015-7-11018.jpg)


![Remote Sens. 2014 remote sensing - University of North ...Remote Sens. 2014, 6 5797 hyperspectral images. In [11], ELM was used for land cover classification, which achieved comparable](https://static.fdocuments.in/doc/165x107/5e45e70180fe3c153c1ed74b/remote-sens-2014-remote-sensing-university-of-north-remote-sens-2014-6.jpg)
![Remote Sens. 2013 OPEN ACCESS remote sensing · 2017-08-18 · Remote Sens. 2013, 5 2166 datasets have emerged like Structure from Motion (SfM) [22]. Most recently, successful vineyard](https://static.fdocuments.in/doc/165x107/5f664f42bc872d2c2004934f/remote-sens-2013-open-access-remote-sensing-2017-08-18-remote-sens-2013-5-2166.jpg)
![Remote Sens. OPEN ACCESS remote sensing · PDF fileRemote Sens. 2015, 7 9255 correlation and extracting principal component of the data, Lee [10] developed a generalized principal](https://static.fdocuments.in/doc/165x107/5ab813a47f8b9aa6018c3787/remote-sens-open-access-remote-sensing-sens-2015-7-9255-correlation-and-extracting.jpg)