Remote Monitoring of Implantable Cardioverter-Defibrillators, … · 2018-10-23 · Under usual...
199
Published October 2018 Volume 18, Number 7 ONTARIO HEALTH TECHNOLOGY ASSESSMENT SERIES Remote Monitoring of Implantable Cardioverter-Defibrillators, Cardiac Resynchronization Therapy and Permanent Pacemakers: A Health Technology Assessment KEY MESSAGES What Is This Health Technology Assessment About? People suffering from certain types of heart failure, or an abnormal heart rate or rhythm, may have one of several electronic devices implanted (e.g., a defibrillator or a pacemaker). However, patients require routine follow up in-clinic for clinical assessment and to verify that the device is functioning properly, which can be a burden for those who have difficulty traveling or live far from a clinic. Remote monitoring—in which device data are recorded and transmitted to health care personnel by phone or over the internet—may offer benefits to the patient and the health care system. Currently, physician services for remote monitoring and the remote monitoring system are not publicly funded. This health technology assessment looked at how effective and cost-effective remote monitoring is for people implanted with cardiac electronic devices and how that impacts their experience of living with the device. What Did This Health Technology Assessment Find? We found that remote monitoring plus clinic visits works well compared to clinic follow-up alone. Remote monitoring resulted in a shorter time to detection and treatment of medical and device-related events, as well as fewer clinic visits. We found that funding remote monitoring could result in cost savings to the Ontario health care system. Patients and their family members reported positive experiences with remote cardiac monitoring. Participants reported that these devices provide important medical and safety benefits in managing their heart condition. For instance, there were fewer inappropriate shocks, a cause of discomfort and anxiety among people with these devices. Fewer clinic visits increased freedom and independence of patients and family members, while the early detection of technical and clinical problems improved their ability to live without worry about their heart condition.
Transcript of Remote Monitoring of Implantable Cardioverter-Defibrillators, … · 2018-10-23 · Under usual...

Published October 2018 Volume 18, Number 7
ONTARIO HEALTH TECHNOLOGY ASSESSMENT SERIES
Remote Monitoring of Implantable Cardioverter-Defibrillators, Cardiac Resynchronization Therapy and Permanent Pacemakers: A Health Technology Assessment KEY MESSAGES
What Is This Health Technology Assessment About? People suffering from certain types of heart failure, or an abnormal heart rate or rhythm, may have one of several electronic devices implanted (e.g., a defibrillator or a pacemaker). However, patients require routine follow up in-clinic for clinical assessment and to verify that the device is functioning properly, which can be a burden for those who have difficulty traveling or live far from a clinic. Remote monitoring—in which device data are recorded and transmitted to health care personnel by phone or over the internet—may offer benefits to the patient and the health care system. Currently, physician services for remote monitoring and the remote monitoring system are not publicly funded. This health technology assessment looked at how effective and cost-effective remote monitoring is for people implanted with cardiac electronic devices and how that impacts their experience of living with the device.
What Did This Health Technology Assessment Find? We found that remote monitoring plus clinic visits works well compared to clinic follow-up alone. Remote monitoring resulted in a shorter time to detection and treatment of medical and device-related events, as well as fewer clinic visits. We found that funding remote monitoring could result in cost savings to the Ontario health care system. Patients and their family members reported positive experiences with remote cardiac monitoring. Participants reported that these devices provide important medical and safety benefits in managing their heart condition. For instance, there were fewer inappropriate shocks, a cause of discomfort and anxiety among people with these devices. Fewer clinic visits increased freedom and independence of patients and family members, while the early detection of technical and clinical problems improved their ability to live without worry about their heart condition.

October 2018
Ontario Health Technology Assessment Series; Vol. 18: No. 7, pp. 1–199, October 2018 2
HEALTH TECHNOLOGY ASSESSMENT AT HEALTH QUALITY ONTARIO This report was developed by a multidisciplinary team from Health Quality Ontario. The clinical epidemiologist was Vania Costa; the health economist was Man Wah Yeung; the patient, caregiver, and public engagement analyst was Jenny Gilbert; and the medical librarian was Corinne Holubowich. The medical editor was Timothy Maguire. Others involved in the development and production of this report were Paul Kolodziej, Alison Clement, Kellee Kaulback, Ana Laing, Claude Soulodre, Sarah McDowell, Andrée Mitchell, Vivian Ng, Nancy Sikich, and Irfan Dhalla. We are grateful to Krystina Lewis (University of Ottawa), Jeff Healey (McMaster University), and Raymond Yee (Western University) for contributing their expertise to the development of this health technology assessment. The statements, conclusions, and views expressed in this report do not necessarily represent the views of the consulted experts.
Citation Health Quality Ontario. Remote monitoring of implantable cardioverter-defibrillators, cardiac resynchronization therapy, and permanent pacemakers: a health technology assessment. Ont Health Technol Assess Ser [Internet]. 2018 Oct;18(7):1–199. Available from: http://www.hqontario.ca/evidence-to-improve-care/journal-ontario-health-technology-assessment-series

October 2018
Ontario Health Technology Assessment Series; Vol. 18: No. 7, pp. 1–199, October 2018 3
ABSTRACT
Background
Under usual care, people with an implantable cardioverter-defibrillator (ICD), cardiac resynchronization therapy with or without a defibrillator (CRT-D and CRT-P, respectively), or a permanent pacemaker have follow-up in-person clinic visits. Remote monitoring of these devices allows the transfer of the information stored in the device so that it can be accessed by the clinic personnel via a secured website.
Methods
We completed a health technology assessment, which included an evaluation of clinical benefits and harms, value for money, and patient preferences for remote monitoring of ICDs, CRTs, and permanent pacemakers plus clinic visits compared with clinic visits alone. This is an update of a 2012 health technology assessment. In addition to the eligible randomized controlled trials (RCTs) from the 2012 publication, we included RCTs identified through a systematic literature search on June 1, 2017. We assessed the risk of bias of each study using the Cochrane risk of bias tool and the quality of the body of evidence according to the Grading of Recommendations Assessment, Development, and Evaluation (GRADE) Working Group criteria. We conducted an economic evaluation to determine the cost-effectiveness of remote monitoring blended with in-clinic follow-up compared to in-clinic follow-up alone in patients with an ICD, a CRT-D, or a pacemaker. We determined the budget impact of blended remote monitoring in patients implanted with ICD, CRT-D, CRT-P, or pacemaker devices from the perspective of the Ontario Ministry of Health and Long-Term Care. To understand patient experiences with remote monitoring, we interviewed 16 patients and family members.
Results
Based on 15 RCTs in patients with implanted ICDs or CRT-Ds, remote monitoring plus clinic visits resulted in fewer patients with inappropriate ICD shocks within 12 to 37 months of follow-up (moderate quality evidence; absolute risk difference −0.04 [95% confidence interval −0.07 to −0.01]), fewer total clinic visits (moderate quality evidence), and a shorter time to detection and treatment of events (moderate quality evidence) compared with clinic visits alone. There was a similar risk of major adverse events (moderate quality evidence). Based on 6 RCTs in patients with pacemakers, remote monitoring plus clinic visits reduced the arrhythmia burden (high quality evidence), the time to detection and treatment of arrhythmias (high quality evidence), and the number of clinic visits (moderate quality evidence]) compared with clinic visits alone. Here again, there was a similar risk of major adverse events (high quality evidence). Results from the economic evaluation showed that among ICD and CRT-D recipients, blended remote monitoring (remote monitoring plus in-clinic follow ups) was more costly (incremental value of $4,354 per person) and more effective, providing higher quality-adjusted life years (incremental value of 0.19), compared to in-clinic follow-up alone. Among pacemaker recipients, blended remote monitoring was less costly (with an incremental saving of $2,370 per person) and more effective (with an incremental value of 0.12 quality-adjusted life years) than with in-clinic follow-up alone. We estimated that publicly funding remote monitoring could result in cost savings of $14 million over the first five years.

October 2018
Ontario Health Technology Assessment Series; Vol. 18: No. 7, pp. 1–199, October 2018 4
Participants using remote monitoring reported that these devices provide important medical and safety benefits in managing their heart condition. Remote cardiac monitoring provides patients and their family members with an increased freedom. Their belief that the device will help with earlier detection of technical or clinical problems reduces the amount of stress and distraction their condition causes in their lives.
Conclusions
Remote monitoring of ICDs, CRT-Ds, and pacemakers plus clinic visits resulted in improved outcomes without increasing the risk of major adverse events compared with clinic visits alone. Remote monitoring is a cost-effective option for patients implanted with cardiac electronic devices. Patients reported positive experiences using remote monitoring, and perceived that the device provided important medical and safety benefits.

October 2018
Ontario Health Technology Assessment Series; Vol. 18: No. 7, pp. 1–199, October 2018 5
TABLE OF CONTENTS
LIST OF TABLES ...................................................................................................................... 9
LIST OF FIGURES ...................................................................................................................12
OBJECTIVE .............................................................................................................................13
BACKGROUND ........................................................................................................................13
Health Condition .......................................................................................................................................... 13
Sudden Cardiac Death ........................................................................................................................ 13
Heart Failure ....................................................................................................................................... 13
Bradycardia ......................................................................................................................................... 14
Clinical Need and Target Population .......................................................................................................... 14
Number of People in Ontario with Cardiac Implantable Electronic Devices ....................................... 14
Current Treatment Options ......................................................................................................................... 14
Clinic Follow-Up of People with Implanted ICDs, CRTs, and Pacemakers ........................................ 14
Health Technology Under Review .............................................................................................................. 15
Overview of Remote Monitoring of Implanted Electronic Cardiac Devices (ICDs, CRTs, and Pacemakers) ....................................................................................................................................... 15
Existing Systematic Reviews and Health Technology Assessments ......................................................... 16
Regulatory Information ................................................................................................................................ 17
Ontario Context ........................................................................................................................................... 17
CLINICAL EVIDENCE ..............................................................................................................18
Research Question ..................................................................................................................................... 18
Methods....................................................................................................................................................... 18
Literature Search ................................................................................................................................. 18
Literature Screening ............................................................................................................................ 18
Inclusion Criteria ................................................................................................................................. 18
Exclusion Criteria ................................................................................................................................ 19
Outcomes of Interest ........................................................................................................................... 19
Data Extraction .................................................................................................................................... 19
Statistical Analysis .............................................................................................................................. 19
Critical Appraisal of Evidence ............................................................................................................. 20
Expert Consultation ............................................................................................................................. 20
Results ........................................................................................................................................................ 20
Literature Search ................................................................................................................................. 20
Study Design and Characteristics for RCTs—ICDs and CRT-Ds ....................................................... 21
Baseline Patient Characteristics for RCTs—Remote Monitoring of ICDs and CRT-Ds ..................... 24
Risk of Bias for RCTs—Remote Monitoring of ICDs and CRT-Ds ..................................................... 24
RCT Results—Remote Monitoring of ICDs and CRT-Ds ................................................................... 24
RCT Study Design and Characteristics—Remote Monitoring of Pacemakers ................................... 41
Baseline Characteristics—RCTs of Remote Monitoring of Pacemakers ............................................ 43
Risk of Bias for RCTs—Remote Monitoring of Pacemakers .............................................................. 43
RCT Study Results for Remote Monitoring of Pacemakers ................................................................ 43
Ongoing and Unpublished Randomized Controlled Trials .................................................................. 47
Quality of the Body of Evidence .......................................................................................................... 49

October 2018
Ontario Health Technology Assessment Series; Vol. 18: No. 7, pp. 1–199, October 2018 6
Discussion ................................................................................................................................................... 53
Conclusions ................................................................................................................................................. 54
ECONOMIC EVIDENCE ...........................................................................................................55
Research Question ..................................................................................................................................... 55
Methods....................................................................................................................................................... 55
Economic Literature Search ................................................................................................................ 55
Literature Screening ............................................................................................................................ 55
Inclusion Criteria ................................................................................................................................. 55
Exclusion Criteria ................................................................................................................................ 55
Outcomes of Interest ........................................................................................................................... 56
Data Extraction .................................................................................................................................... 56
Study Applicability and Methodological Quality .................................................................................. 56
Results ........................................................................................................................................................ 56
Literature Search ................................................................................................................................. 56
Review of Included Economic Studies ................................................................................................ 57
Applicability of the Included Studies ................................................................................................... 62
Methodological Quality of the Included Studies .................................................................................. 62
Discussion ................................................................................................................................................... 62
Conclusions ................................................................................................................................................. 63
PRIMARY ECONOMIC EVALUATION .....................................................................................64
Research Questions .................................................................................................................................... 64
Methods....................................................................................................................................................... 64
Type of Analysis .................................................................................................................................. 64
Target Population ................................................................................................................................ 64
Perspective.......................................................................................................................................... 65
Intervention.......................................................................................................................................... 65
Discounting and Time Horizon ............................................................................................................ 67
Main Assumptions ............................................................................................................................... 67
Model Structure/Structure of the Analysis ........................................................................................... 68
Clinical Outcome and Utility Parameters ............................................................................................ 71
Cost Parameters ................................................................................................................................. 82
Analysis ............................................................................................................................................... 86
Generalizability .................................................................................................................................... 89
Expert Consultation ............................................................................................................................. 89
Results ........................................................................................................................................................ 89
Reference Case Analysis .................................................................................................................... 89
Sensitivity Analysis .............................................................................................................................. 91
Limitations ................................................................................................................................................... 94
Discussion ................................................................................................................................................... 95
Conclusions ................................................................................................................................................. 96
BUDGET IMPACT ANALYSIS .................................................................................................97
Research Question ..................................................................................................................................... 97
Methods....................................................................................................................................................... 97
Target Population ................................................................................................................................ 98
October 2018
Ontario Health Technology Assessment Series; Vol. 18: No. 7, pp. 1–199, October 2018 7
Resource and Costs .......................................................................................................................... 101
Analysis ............................................................................................................................................. 102
Assumptions ...................................................................................................................................... 102
Expert Consultation ........................................................................................................................... 102
Results ...................................................................................................................................................... 103
Reference Case ................................................................................................................................ 103
Scenario Analysis .............................................................................................................................. 103
Limitations ................................................................................................................................................. 104
Discussion ................................................................................................................................................. 104
Conclusions ............................................................................................................................................... 105
PATIENT PREFERENCES AND VALUES ............................................................................. 106
Background ............................................................................................................................................... 106
Methods..................................................................................................................................................... 106
Engagement Plan .............................................................................................................................. 106
Outreach Process ............................................................................................................................. 107
Approach ........................................................................................................................................... 107
Data Extraction and Analysis ............................................................................................................ 108
Results ...................................................................................................................................................... 108
Lived experience with an implanted cardiac device .......................................................................... 108
Information About Remote Cardiac Monitoring ................................................................................. 109
Use of Remote Cardiac Monitoring ................................................................................................... 110
Concerns with the Use of Remote Cardiac Monitoring ..................................................................... 111
Discussion ................................................................................................................................................. 112
Conclusions ............................................................................................................................................... 113
ABBREVIATIONS .................................................................................................................. 115
GLOSSARY ............................................................................................................................ 116
APPENDICES......................................................................................................................... 117
Appendix 1: New York Heart Association Functional Classification ......................................................... 117
Appendix 2: System Characteristics for Remote Monitoring of Implantable Cardioverter-Defibrillators, Cardiac Resynchronization Therapy, and Permanent Pacemakers ......................................................... 118
Appendix 3: Literature Search Strategies ................................................................................................. 120
Clinical Evidence Search .................................................................................................................. 120
Economic Evidence Search .............................................................................................................. 122
Appendix 4: Study Design and Characteristics—Remote Monitoring of ICDs, CRT-Ds, and Pacemakers .................................................................................................................................................................. 129
Appendix 5: Baseline Characteristics—Remote Monitoring of ICDs/CRT-Ds and Pacemakers .............. 142
Appendix 6: Risk of Bias in Included Studies ............................................................................................ 152
Appendix 7: Results of RCTs .................................................................................................................... 154
Appendix 8: Economic Evidence .............................................................................................................. 162
Results of Applicability Checklist for Studies Included in Economic Literature Review ................... 162
Methodological Quality of Studies Included in Economic Literature Review .................................... 163
Appendix 9: Primary Economic Evaluation ............................................................................................... 164
Target Population .............................................................................................................................. 164
Intervention........................................................................................................................................ 164

October 2018
Ontario Health Technology Assessment Series; Vol. 18: No. 7, pp. 1–199, October 2018 8
Model Structure ................................................................................................................................. 164
Clinical Outcome and Utility Parameters .......................................................................................... 172
Natural History (Model 1: ICD and CRT-D population) ..................................................................... 172
Results .............................................................................................................................................. 179
Appendix 10: Budget Impact Analysis ...................................................................................................... 182
Target Population .............................................................................................................................. 182
Resource and Costs .......................................................................................................................... 184
Appendix 11: Letter of Information ............................................................................................................ 185
Appendix 12: Patient Interview Guide ....................................................................................................... 186
REFERENCES ....................................................................................................................... 187
October 2018
Ontario Health Technology Assessment Series; Vol. 18: No. 7, pp. 1–199, October 2018 9
LIST OF TABLES
Table 1: Frequency of Scheduled Follow-Up Visits and Data Transmission—RCTs of Remote Monitoring of ICDs and CRT-Ds ....................................................................................23
Table 2: ICD Shocks—RCTs of Remote Monitoring of ICDs and CRT-Ds .................................28 Table 3: Time From Event Onset to Data Review/Clinical Decision—RCTs of Remote
Monitoring of ICDs and CRT-Ds ....................................................................................30 Table 4: Clinic Visits—RCTs of Remote Monitoring of ICDs and CRT-Ds .................................33 Table 5: Emergency Department Visits—RCTs of Remote Monitoring of ICDs and CRT-Ds.....36 Table 6: Quality of Life and Satisfaction with ICD Care—RCTs of Remote Monitoring of ICDs
and CRT-Ds ..................................................................................................................41 Table 7: Frequency of Scheduled Follow-Up Visits and Data Transmission—RCTs of Remote
Monitoring of Pacemakers .............................................................................................42 Table 8: Clinic Visits—RCTs of Remote Monitoring of Pacemakers ..........................................45 Table 9: Not Published/Ongoing RCTs—Remote Monitoring of ICDs/CRT-Ds ..........................48 Table 10: GRADE Evidence Profile for Comparison of Remote and Non-Remote Monitoring of
ICDs and CRT-Ds .........................................................................................................50 Table 11: GRADE Evidence Profile for Comparison of Remote and Non-Remote Monitoring of
Pacemakers ..................................................................................................................52 Table 12: Results of Economic Literature Review: Summary, Remote Monitoring of Cardiac
Implantable Electronic Devices With Clinic Visit Versus Clinic Visit Alone .....................59 Table 13: Disease Interventions and Comparators Evaluated in the Primary Economic Model .66 Table 14: Monthly Transition Probabilities Between NYHA Classes ..........................................71 Table 15: Monthly Transition Probabilities for Any-Cause Hospitalization and Any-Cause
Rehospitalization (1st Month After Hospital Discharge) by NYHA Class ........................72 Table 16: Model Inputs for Unscheduled and Scheduled Health Care Use for ICD and CRT-D
Recipients .....................................................................................................................73 Table 17: Monthly Transition Probabilities for Excess Mortality by NYHA Class ........................73 Table 18: Hazard Ratios Up to 1 Year for All-Cause Mortality After Hospital Discharge of Any
Cause (Applied to All NYHA Functional Classes) ..........................................................74 Table 19: Time to ICD and CRT-D device replacement (used in scenario analysis with time
horizon extended to 10 years) .......................................................................................74 Table 20: Monthly Transition Probabilities for Hospitalization and Rehospitalizations, Including
the Proportion of Admissions that Are Stroke-Relateda ..................................................75 Table 21: Model Inputs for Unscheduled and Scheduled Health Care Use for Pacemaker
Recipients .....................................................................................................................76 Table 22: Monthly Transition Probabilities for Mortality (Excess or All Cause) ..........................77 Table 23: Time to ICD and CRT-D Battery Replacement (used in scenario analyses with a 10-
year time horizon) ..........................................................................................................77 Table 24: Impact of Remote Monitoring on Mortality and Health Care Use (Remote Monitoring
Versus Clinic Visits Alone) .............................................................................................79 Table 25: The Impact of Remote Monitoring on Mortality and Health Care Use (Remote
Monitoring Versus Clinic Visits Alone) ...........................................................................80 Table 26: Mean Differencea in Health Utilities Associated With Remote Monitoring ..................81 Table 27: Utilities for Health States in Models 1 and 2 ..............................................................82 Table 28: Disutilities Associated With Hospitalization Events for Models 1 and 2 ......................82 Table 29: Age-Related Decrement per Year Used in Both Models 1 and 2 ...............................82 Table 30: Costs Associated With Health Care Use for Models 1 and 2 in the Reference Case .85 Table 31: Payment Models for Remote Monitoring Systems (Charged to Hospitals and
Reimbursed by the Ministry) ..........................................................................................86 Table 32: Additional Costs Used in Sensitivity and Scenario Analyses .....................................86

October 2018
Ontario Health Technology Assessment Series; Vol. 18: No. 7, pp. 1–199, October 2018 10
Table 33: Sensitivity Analyses and Scenario Analyses, Primary Economic Evaluation..............87 Table 34: Reference Case Analysis Results .............................................................................90 Table 35: Scenario Analysis Results in ICD and CRT-D Recipients (Model 1) ..........................92 Table 36: Scenario Analysis Results in Pacemaker Recipients (Model 2) .................................93 Table 37: Patients Receiving Cardiac Implants in Ontario Based on Inpatient and Day Surgery
Records from Administrative Data, 2010/15 ..................................................................98 Table 38: Forecasteda target population of new cardiac implant recipients in Ontario ..............99 Table 39: Reference Case: Remote Monitoring Uptake Over 5 Years Among New Patients
Implanted With ICD, CRT-P, CRT-D, and Pacemaker Devices in Ontario ................... 100 Table 40: Scenario Analysis: Remote Monitoring Uptake Over 5 Years Among New Patients
Implanted With ICD and CRT-P, and CRT-D, and Pacemaker Devices in Ontario ...... 100 Table 41: Estimated Cost Per Patient Relevant to the Ontario Ministry of Health and Long-Term
Care for Calculating the Budget Impact of Publicly Funding Remote Monitoring .......... 101 Table 42: Reference Case Results of Budget Impact Analysis (Total and Net Budget Impact) 103 Table 43: Scenario Analysis Results of Budget Impact Analysis (Total and Net Budget Impacts)
.................................................................................................................................... 104 Table A1: Remote Monitoring of ICDs, CRTs, and Pacemakers—Systems’ Characteristics ... 118 Table A2: Study Design and Characteristics—RCTs of Remote Monitoring of ICDs and/or CRT-
Ds ................................................................................................................................ 129 Table A3: Study Design and Characteristics—RCTs of Remote Monitoring of Pacemakers ... 138 Table A4: Baseline Characteristics—RCTs of Remote Monitoring of ICDs and CRT-Ds ......... 142 Table A5: Baseline Characteristics—RCTs of Remote Monitoring of Pacemakers .................. 148 Table A6: Risk of Bias of the RCTs Included Based on the Cochrane Risk of Bias Tool ......... 152 Table A7: Remote Monitoring Data Transmission—RCTs of Remote Monitoring of ICDs and CRT-
Ds ................................................................................................................................ 154 Table A8: Composite End Point—RCTs of Remote Monitoring of ICDs and CRT-Ds .............. 155 Table A9: Mortality—RCTs of Remote Monitoring of ICDs and CRT-Ds.................................. 157 Table A10: Hospitalizations—RCTs of Remote Monitoring of ICDs and CRT-Ds .................... 160 Table A11: Assessment of the Cost-Effectiveness of Remote Monitoring CIED ...................... 162 Table A12: Assessment of the Cost-Effectiveness of Remote Monitoring CIED ...................... 163 Table A13: Distribution of New York Heart Association Functional Class Among De Novo
Implant Recipients in Ontario Between February 2007 and May 2009 ......................... 164 Table A14: Monthly Transition Probabilities for Background Mortality, Adjusted to a Population
of 70% males for Model 1 (Starting at Age 65) and 65% males for Model 2 (Starting at Age 70) ........................................................................................................................ 172
Table A15: Monthly Transition Probabilities Between New York Heart Association Functional Classes Used in Scenario Analysis (Based on Patients With Worse Functional Class Than in the Reference Case) ....................................................................................... 172
Table A16: Model Inputs for Scheduled Health Care Use for Scenario Analysis ..................... 173 Table A17: Procedure and Consultation Fee Codes for Physician Services for In-Clinic
Assessments ............................................................................................................... 173 Table A18: Patient Grouping Methodology Codes for Hospitalizations and Emergency
Department Visits ........................................................................................................ 173 Table A19: Procedure Codes for Pulse Generator Replacement ............................................ 174 Table A20: Procedure Codes for Device Replacement ........................................................... 174 Table A21: Nursing Time and Hourly Wage Associated With Remote and In-Clinic Assessments
for Models 1 and 2 ....................................................................................................... 175 Table A22: Sensitivity and Scenario Analyses for Primary Economic Evaluation .................... 176 Table A23: One-Way Sensitivity Analysis for Percent Reduction in Payment for Remote
Interrogation as Compared to the Payment for a Clinic Visit for ICD and CRT-D Recipients ................................................................................................................... 179
October 2018
Ontario Health Technology Assessment Series; Vol. 18: No. 7, pp. 1–199, October 2018 11
Table A24: Reference Case: Number of Patients Followed Remotely Plus Clinic Visits and In-Clinic Visits Alone Over Five Years ............................................................................. 182
Table A25: Scenario Analysis: Number of Patients Followed Remotely Plus Clinic Visits and Clinic Visits Alone Over Five Years ............................................................................. 183
Table A26: Disaggregated Costs From Primary Economic Evaluation for ICD and CRT-D Recipients and Pacemaker Recipients Under Publicly Funded Remote Monitoring Plus Clinic Visits Versus Clinic Visits Alone ......................................................................... 184

October 2018
Ontario Health Technology Assessment Series; Vol. 18: No. 7, pp. 1–199, October 2018 12
LIST OF FIGURES
Figure 1: PRISMA Flow Diagram—Clinical Search Strategy .....................................................21 Figure 2: ICD Shocks—RCTs of Remote Monitoring of ICDs and CRT-Ds (A. Risk Ratio; B.
Risk Difference) .............................................................................................................27 Figure 3: Stroke—RCTs of Remote Monitoring of ICDs and CRT-Ds (A. Risk Ratio; B. Risk
Difference) .....................................................................................................................31 Figure 4: Total Clinic Visits—RCTs of Remote Monitoring of ICDs and CRT-Ds .......................32 Figure 5: All-Cause Hospitalizations—RCTs of Remote Monitoring of ICDs and CRT-Ds (A.
Risk Ratio; B. Risk Difference).......................................................................................35 Figure 6: Heart Failure/Cardiovascular Hospitalizations—RCTs of ICDs and CRT-Ds (A. Risk
Ratio; B. Risk Difference) ..............................................................................................35 Figure 7: All-Cause Mortality—RCTs of Remote Monitoring of ICDs and CRT-Ds (A. Risk Ratio;
B. Risk Difference; C. Hazard Ratio) .............................................................................38 Figure 8: Cardiovascular Mortality—RCTs of Remote Monitoring of ICDs and CRT-Ds (A. Risk
Ratio; B. Risk Difference; C. Hazard Ratio) ...................................................................39 Figure 9: Stroke—RCTs of Remote Monitoring of Pacemakers (A. Risk Ratio; B. Risk
Difference) .....................................................................................................................45 Figure 10: Patients With Cardiovascular Hospitalizations—RCTs of Remote Monitoring of
Pacemakers (A. Risk Ratio; B. Risk Difference) ............................................................46 Figure 11: All-Cause Mortality—RCTs of Remote Monitoring of Pacemakers (A. Risk Ratio; B.
Risk Difference) .............................................................................................................47 Figure 12: PRISMA Flow Diagram—Economic Search Strategy ...............................................57 Figure 13: Blended Model of Remote Monitoring Plus Clinic Visits: Schedule of ICD and CRT-D
Recipients, as per the Latest Canadian Recommendations11 ........................................66 Figure 14: Blended Model of Remote Monitoring Plus Clinic Visits: Schedule of Pacemaker
Recipients, as per the Latest Canadian Recommendations11 ........................................67 Figure 15: State Transition Diagram for ICD or CRT-D Recipients With Heart Failure 3 Months
After Successful Implantation, Remote Monitoring Plus Clinic Visits Versus Clinic Visits Alone .............................................................................................................................69
Figure 16: State Transition Diagram for Pacemaker Recipients With Arrhythmia 3 Months After Successful Implantation, Remote Monitoring Plus Clinic Visits Versus Clinic Visits Alone ......................................................................................................................................69
Figure 17: Incremental Cost-Effectiveness Plane for ICD and CRT-D Recipients With a Willingness-to-Pay at $50,000 Per Quality-Adjusted Life-Year ......................................90
Figure 18: Incremental Cost-Effectiveness Plane for Pacemaker Recipients With a Willingness-to-Pay at $50,000 Per Quality-Adjusted Life-Year .........................................................91
Figure 19: One-Way Sensitivity Analysis for ICD and CRT-D Recipients: Percent of Patients Using Northern Health Travel Grant and Percent Reduction in Payment for Remote Interrogation as Compared to the Payment for a Clinic Visit ..........................................94
Figure 20: Budget Impact Model Schematic ..............................................................................97 Figure A1: Health States for ICD and CRT-D Recipients ......................................................... 165 Figure A2: Subtree for Stable Heart Failure (NYHA II). ........................................................... 166 Figure A3: Subtree for Post-Hospitalization (NYHA II)............................................................. 167 Figure A4: Health states for pacemaker recipients. ................................................................. 168 Figure A5: Subtree for Stable Arrhythmia ................................................................................ 169 Figure A6: Subtree After Hospitalization for a Non–Stroke-Related Event ............................... 170 Figure A7: Subtree for After Hospitalization for a Stroke-Related Event .................................. 171 Figure A8: Tornado Diagram for Key Parameters Used in Model 1 ......................................... 180

October 2018
Ontario Health Technology Assessment Series; Vol. 18: No. 7, pp. 1–199, October 2018 13
OBJECTIVE
This health technology assessment looked at the clinical benefits, cost-effectiveness, budget impact, and patient experiences with remote monitoring plus clinic visits compared with clinic visits alone in adults implanted with cardioverter defibrillators, cardiac resynchronization therapy devices with or without defibrillators, and pacemakers.
BACKGROUND
Health Condition
Sudden Cardiac Death
A sudden cardiac death is an unexpected fatal cardiac arrest that is usually caused by ventricular tachyarrhythmias (dangerous heart rate irregularities that occur in the lower chambers of the heart),1 including those resulting from myocardial infarction.2 Most people who suffer sudden cardiac death have coronary heart disease.2 The risk of sudden cardiac death increases with the decrease in left ventricular ejection fraction (i.e., deterioration of functional capacity in people with heart failure).3 The annual incidence of sudden cardiac death in the United States is believed to be 300,000–450,000.2 In Canada, it is estimated that 15% of the over 200,000 deaths each year are sudden and unexpected.4 Applying an electrical shock to the heart muscle, or defibrillation, within minutes of onset of cardiac arrest may restore normal heart rhythm.1 External defibrillation may be used when an automated external defibrillator is available.1 People with known risk factors for sudden cardiac death are eligible for an implantable cardioverter-defibrillator (ICD), a battery-powered electronic medical device that monitors the heart rhythm and provides anti-tachycardia pacing and cardioversion (electrical shock or defibrillation) to restore normal rhythm when a life-threatening arrhythmia (irregular heart beat) is detected.1 ICDs need to be replaced every 5 to 8 years due to battery depletion.1
Heart Failure
Heart failure is caused by any structural or functional cardiac disorder that negatively affects the heart’s pumping function.1 It results in significant morbidity and mortality and leads to frequent hospitalizations due to the progressive nature of the condition and the resulting pulmonary fluid overload.5 Common causes of heart failure include coronary artery disease, arterial hypertension, cardiomyopathy, and valve defects.1 More than 485,000 people in Canada have been diagnosed with heart failure.6 The functional capacity of people with heart failure is classified according to the severity of their symptoms using the New York Heart Association (NYHA) classification system (additional information in Appendix 1).1 People with NYHA class II and III heart failure are more susceptible to sudden cardiac death, while people with the more severe class IV are more likely to die from heart failure.1 Sudden cardiac death is the cause of death in 30%–50% of people with heart failure.2 People presenting with heart failure are usually treated with medication. Additionally, cardiac resynchronization therapy (CRT) attempts to improve the synchronized contraction of both the left and right ventricles to improve the cardiac output.1 People with heart failure and wide QRS complexes (an abnormality shown in an electrocardiogram [ECG] reading) with a low ejection fraction and who are symptomatic despite optimal medical therapy are candidates for the use of CRT.7 People with a combination of a low ejection fraction and clinical heart failure are at an

October 2018
Ontario Health Technology Assessment Series; Vol. 18: No. 7, pp. 1–199, October 2018 14
increased risk of sudden cardiac death. They may benefit from both ICD and CRT treatment with a defibrillator (CRT-D).1
Bradycardia
Pathological bradycardia is a heart arrhythmia characterized by a slower than normal heart rate.8 It may be caused by different conditions that affect the heart’s conduction system and is the main indication for a permanent pacemaker.8 Implantable permanent pacemakers are battery-powered electronic medical devices.8 They are used in the treatment of symptomatic bradycardia resulting from sinus node dysfunction and atrioventricular block, and in high risk asymptomatic individuals.9 Implantable permanent pacemakers will be referred to as pacemakers throughout this report.
Clinical Need and Target Population
Number of People in Ontario with Cardiac Implantable Electronic Devices
According to the Canadian Institute for Health Information Cardiac Rate Book 2016,10 the number of people who received new or replacement implanted cardiac devices annually in Ontario for the years 2010–2015 were as follows:
• Pacemakers: between 6,036 and 6,996
• CRTs without a defibrillator (CRT-Ps): between 49 and 146
• CRT-Ds and ICDs: between 1,798 and 2,208
It is unclear how many of these devices have remote monitoring capabilities or how many of these people are using remote monitoring.
Current Treatment Options
Clinic Follow-Up of People with Implanted ICDs, CRTs, and Pacemakers
People with an implanted ICD, CRT, or pacemaker are monitored through in-person clinic visits with the aim of verifying whether the device is functioning adequately, and for assessment of arrhythmias and other clinical symptoms and findings.1 During the routine clinic visits, the physician, nurse, or technician is able to read the information stored by the device using a magnetically inductive programming wand.1 This provides information on arrhythmic episodes, delivered therapeutic device responses, and device integrity.1 Additionally, a clinical assessment of symptoms and need for changes in medication is performed. Depending on the findings from the clinic visit, if necessary, the physician may decide to change the patient medications, hospitalize the person, reprogram the device, and/or schedule a lead system revision or device replacement.1 The frequency of routine clinic follow-up during the maintenance phase depends on the patient’s needs and typically occurs every 12 months for pacemakers and every 6 months for ICDs and CRTs.11 In addition to the routine scheduled clinic visits, unscheduled clinic visits may be necessary in case of worsening of the disease, device alerts, ICD delivered shocks (appropriate or inappropriate), or other complications or conditions that indicate a clinic visit is needed. Transtelephonic monitoring provides limited data on pacemaker function, including a real-time electrocardiogram, and battery longevity information through a telephone landline.12 It requires coordination between the patient and the personnel at the clinic to transfer the data and it
October 2018
Ontario Health Technology Assessment Series; Vol. 18: No. 7, pp. 1–199, October 2018 15
cannot capture diagnostic information stored in the device as is the case with remote monitoring of cardiac implantable electronic devices.12
Health Technology Under Review
Overview of Remote Monitoring of Implanted Electronic Cardiac Devices (ICDs, CRTs, and Pacemakers)
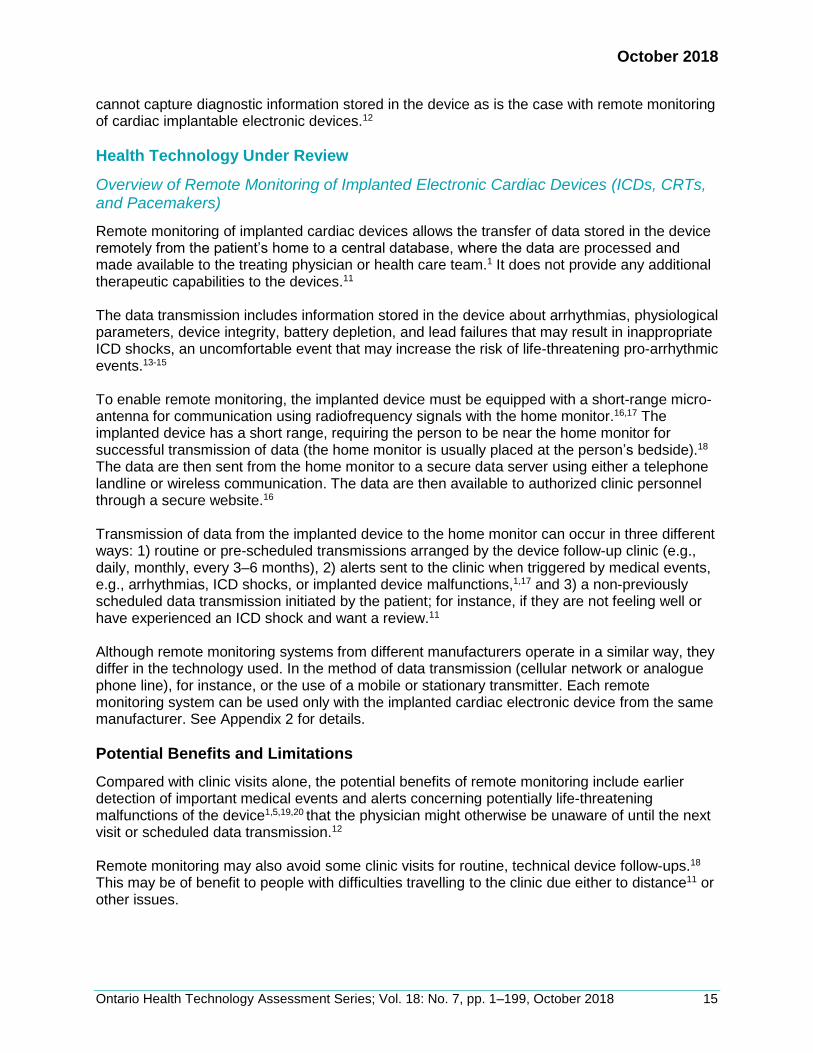
Remote monitoring of implanted cardiac devices allows the transfer of data stored in the device remotely from the patient’s home to a central database, where the data are processed and made available to the treating physician or health care team.1 It does not provide any additional therapeutic capabilities to the devices.11 The data transmission includes information stored in the device about arrhythmias, physiological parameters, device integrity, battery depletion, and lead failures that may result in inappropriate ICD shocks, an uncomfortable event that may increase the risk of life-threatening pro-arrhythmic events.13-15 To enable remote monitoring, the implanted device must be equipped with a short-range micro-antenna for communication using radiofrequency signals with the home monitor.16,17 The implanted device has a short range, requiring the person to be near the home monitor for successful transmission of data (the home monitor is usually placed at the person’s bedside).18 The data are then sent from the home monitor to a secure data server using either a telephone landline or wireless communication. The data are then available to authorized clinic personnel through a secure website.16
Transmission of data from the implanted device to the home monitor can occur in three different ways: 1) routine or pre-scheduled transmissions arranged by the device follow-up clinic (e.g., daily, monthly, every 3–6 months), 2) alerts sent to the clinic when triggered by medical events, e.g., arrhythmias, ICD shocks, or implanted device malfunctions,1,17 and 3) a non-previously scheduled data transmission initiated by the patient; for instance, if they are not feeling well or have experienced an ICD shock and want a review.11
Although remote monitoring systems from different manufacturers operate in a similar way, they differ in the technology used. In the method of data transmission (cellular network or analogue phone line), for instance, or the use of a mobile or stationary transmitter. Each remote monitoring system can be used only with the implanted cardiac electronic device from the same manufacturer. See Appendix 2 for details.
Potential Benefits and Limitations
Compared with clinic visits alone, the potential benefits of remote monitoring include earlier detection of important medical events and alerts concerning potentially life-threatening malfunctions of the device1,5,19,20 that the physician might otherwise be unaware of until the next visit or scheduled data transmission.12 Remote monitoring may also avoid some clinic visits for routine, technical device follow-ups.18 This may be of benefit to people with difficulties travelling to the clinic due either to distance11 or other issues.

October 2018
Ontario Health Technology Assessment Series; Vol. 18: No. 7, pp. 1–199, October 2018 16
On the other hand, people without a landline or mobile telephone connection cannot transmit data and therefore are not good candidates for remote monitoring. People also need to be educated about the purpose of remote monitoring, how the information is transmitted, used and managed, and its benefits and limitations.11 For instance, remote monitoring is not intended as an emergency service and does not completely replace in-person clinic visits.11 Patient privacy and security are out of scope for this report and were not evaluated.
Frequency of Remote Monitoring
The 2013 joint position statement from the Canadian Cardiovascular Society/Canadian Heart Rhythm Society recommends that in-person clinic visits occur more frequently in the ICD, CRT, and pacemaker post-implant period, but that they should be tapered to a maintenance routine follow-up interval of every 6 months for ICDs and every 12 months for pacemakers.11 The position statement also suggests that, in patients with a stable clinical and device status, routine follow-up assessment during the maintenance phase should alternate between remote transmissions and clinic visits in a 1:1 ratio.11 However, the authors of the position statement also caution that centres should take a flexible approach to tailor remote monitoring follow-up to each person, recognizing that the suggested 1:1 ratio is intended as a guide.11 According to CorHealth Ontario (formerly known as the Cardiac Care Network), remote monitoring of implanted pacemakers should not completely replace in-clinic follow-up, and people should be seen at the clinic at least once a year if remote monitoring is being used.9 Remote monitoring is also recommended to supplement in-person monitoring of the patient and of the device in clinical circumstances that require more intensive surveillance; for instance, when the device is nearing the end of service or when the device is under advisory or recall.11
Existing Systematic Reviews and Health Technology Assessments
A health technology assessment published in 2012 by Health Quality Ontario concluded that, for remote monitoring of ICD devices, there was a significant reduction in clinic visits in the first year after implantation compared to in-clinic monitoring.19 The detection rates of clinically significant events were higher and the time to detection was shorter with remote monitoring. The earlier detection of clinical events in the remote monitoring group, however, was not associated with lower morbidity or mortality rates or reduction in hospitalizations or emergency department visits for the duration of the study follow-up.19 The report also found that there was limited clinical trial information on the effectiveness of remote monitoring for pacemakers compared with ICDs.19 Two systematic reviews with meta-analyses comparing remote and non-remote monitoring of ICDs and CRT-Ds were published since the 2012 HTA.20,21 The meta-analysis by Parthiban et al,20 including seven RCTs published up to August 2014, did not show a statistically significant difference between the two groups in terms of all-cause mortality, cardiovascular mortality, atrial arrhythmia detection, number of hospitalizations and unscheduled visits, or total ICD shocks. However, there were fewer inappropriate ICD shocks in the remote monitoring versus non-remote monitoring group, and a statistically significantly shorter time to event detection and/or clinical decision.20 In a sensitivity analysis, the authors found a statistically significant benefit in mortality (odds ratio 0.65, 95% CI: 0.45–0.94) based on three out of seven studies using a remote monitoring system with daily data transmission and verification compared with no remote monitoring.20
October 2018
Ontario Health Technology Assessment Series; Vol. 18: No. 7, pp. 1–199, October 2018 17
The meta-analysis by Klersy et al21 evaluated the effects of remote versus non-remote monitoring of ICDs and CRT-Ds in the number of hospitalizations, clinic, and emergency room visits, and costs. It included 13 RCTs identified through a systematic literature search conducted in July 2015.21 No statistically significant difference between the two groups was reported for cardiac hospitalizations, or for all-cause or cardiovascular mortality.21 There was an increased rate of emergency department visits and a decrease in clinic visits in the remote monitoring group.21 A more recent (2017) meta-analysis by Hindricks et al22 was identified. The analysis wasn’t based on a new systematic search of the literature, but on the studies identified by the systematic literature review performed in 2014 by Parthiban et al.20 The meta-analysis by Hindricks et al22 combined patient-level data of the three studies that used a remote monitoring system with daily verification of transmission. The authors reported that the 12-month mortality was statistically significantly lower in the remote monitoring group compared with the non-remote monitoring group (RD −0.019 [−0.001 to −0.038], relative risk [RR] 0.62 [95% CI 0.40–0.95]).22 The risk of cardiovascular mortality was not statistically significantly different between the two groups based on two RCTs.22 No systematic reviews on remote monitoring of pacemakers were identified since the 2012 HTA.19 No new formal HTA reports on remote monitoring of ICDs, CRTs, or pacemakers have been identified.
Regulatory Information
There are currently five remote monitoring systems for ICDs, CRTs, and pacemakers approved
by Health Canada.
• CardioMessenger (Biotronik)
• Carelink (Medtronic)
• Latitude (Boston Scientific)
• Merlin.net (Abbott)
• Smartview (Livanova)
Ontario Context
Currently, cardiac centres that are using remote monitoring have their own clinic processes to review the data transmitted. Most sites do not have dedicated staff for remote monitoring, although this may be the case in some centres. Hospitals in Ontario that use remote monitoring for patients implanted with ICDs, CRTs, or pacemakers monitor only a portion of their patients remotely. Remote monitoring may be helpful for people who have difficulty attending clinic follow-up in-person due to distance from the clinic or other difficulties.
October 2018
Ontario Health Technology Assessment Series; Vol. 18: No. 7, pp. 1–199, October 2018 18
CLINICAL EVIDENCE
Research Question
What are the effectiveness and safety of remote monitoring of adults implanted with ICDs,
CRTs, or permanent pacemakers plus clinic visits compared with clinic visits alone?
Methods
We developed the research questions in consultation with health care providers, clinical experts, and other health system stakeholders. This report is an update of the 2012 HQO health technology assessment on remote monitoring of implantable electronic cardiac devices.19 Therefore, our literature search started where the literature search of the 2012 publication ended. Eligible studies included in the 2012 publication are also part of this report.
Literature Search
We performed a literature search on June 1, 2017, to retrieve studies published from January 1, 2010, to the search date. We used the Ovid interface to search the following databases: MEDLINE, Embase, Cochrane Central Register of Controlled Trials, Cochrane Database of Systematic Reviews, Health Technology Assessment, and National Health Service Economic Evaluation Database (NHS EED); and we used the EBSCOhost interface to search the Cumulative Index to Nursing & Allied Health Literature (CINAHL). Search strategies were developed by medical librarians using controlled vocabulary (e.g., Medical Subject Headings) and relevant keywords. The final search strategy was peer-reviewed using the PRESS Checklist.23 Database auto-alerts were created in MEDLINE, Embase, and CINAHL and reviewed until November 2, 2017. We performed targeted grey literature searching of health technology assessment agency sites and clinical trial registries. See Appendix 3 for Literature Search Strategies, including all search terms.
Literature Screening
A single reviewer used DistillerSR management software (Evidence Partners, Ottawa, Canada) to conduct an initial screening of titles and abstracts and obtained the full text of studies that appeared eligible for the review, according to the inclusion criteria. The author then examined the full text articles and selected studies that were eligible for inclusion.
Inclusion Criteria
• Randomized controlled trials (RCTs) of adults implanted with ICDs, CRT-Ps, CRT-Ds,
and permanent pacemakers
• Identified both through the systematic literature search or through Health Quality
Ontario’s 2012 Health Technology Assessment19
• Comparing remote monitoring of patients plus clinic visits with clinic visits without remote
monitoring
• Full-text, English language publications

Clinical Evidence October 2018
Ontario Health Technology Assessment Series; Vol. 18: No. 7, pp. 1–199, October 2018 19
• Evaluating at least one of the outcomes of interest below
Exclusion Criteria
• Studies evaluating transtelephonic monitoring, unless used as a comparator for remote
monitoring
• Studies evaluating algorithms or the accuracy of detecting clinical and device system
alerts
• Abstracts and conference proceedings
Outcomes of Interest
• ICD shocks (total, appropriate, and inappropriate, as defined by the study authors)
• Arrhythmias (pacemaker recipients)
• Time to detection of medical events
• Time from detected medical events to clinical decisions
• Worsening of heart failure NYHA functional class
• Percentage of respondents to CRT
• Stroke
• Mortality (all-cause and cardiovascular)
• Quality of life
• Number of clinic visits (total, scheduled, and unscheduled)
• Hospitalizations (all-cause, heart failure/cardiovascular)
• Emergency department visits
• Length of hospital stay
• Remote monitoring system malfunction or issues with transmission of data or alerts
• Patient adherence
• Adverse events
Data Extraction
We extracted relevant data on study design and characteristics, risk-of-bias items, and PICOT (population, intervention, comparison, outcome, time). We also extracted baseline characteristics of the patients included in the studies, including those based on the PROGRESS-Plus categories (place of residence, race/ethnicity, occupation, gender, religion, education, socioeconomic status, social capital).24 Additional information regarding the frequency of data transmission, frequency of clinic review of the data transmitted, total follow-up, study population (heart failure severity, primary or secondary prevention of sudden cardiac death), and type of device and remote monitoring system were collected from each study. We contacted authors of the studies to provide clarification as needed.
Statistical Analysis
The results for continuous outcomes were reported as mean plus or minus standard deviation (SD), median and interquartile range, and mean per patient-year, as per the information provided in the studies. For the clinic visit analyses, we used the rate ratio. For dichotomous variables, the number and percentage of participants who experienced the outcome were

Clinical Evidence October 2018
Ontario Health Technology Assessment Series; Vol. 18: No. 7, pp. 1–199, October 2018 20
reported. The risk ratio, risk difference, and/or the hazard ratio (HR) and 95% CI were also provided whenever described in the study. The results of intention-to-treat analyses were used when possible. Most studies grouped patients with ICDs and CRT-Ds for the outcomes listed above. However, if the study provided the information, the results for ICDs and CRT-Ds were reported separately. The results for pacemakers were reported separately. We reported results stratified by patient characteristics such as heart failure severity, primary or secondary prevention of sudden cardiac death, and by PROGRESS-Plus categories if the information was provided in the studies. Meta-analyses were performed when appropriate using Review Manager v. 5.3 (Copenhagen: The Nordic Cochrane Centre, The Cochrane Collaboration, 2014). Statistical heterogeneity was assessed using the I2 statistic and examination of the graphical display of the forest plot.
Critical Appraisal of Evidence
We assessed the risk of bias using the Cochrane Risk of Bias Tool for RCTs.25 The quality of the body of evidence for each outcome was evaluated according to the Grading of Recommendations Assessment, Development, and Evaluation (GRADE) guidelines.26 Bias may arise from flaws in measurement or estimate, study design, or conscious or unconscious assumptions that may affect the hypothesis, process, or interpretation of the study results. Our first consideration was study design; we started with the assumption that RCTs are high quality, whereas observational studies are low quality. We then took into account five additional factors—risk of bias, inconsistency, indirectness, imprecision, and publication bias. Limitations in these areas resulted in downgrading the quality of evidence. For more detailed information, please refer to the latest series of GRADE articles.26
Expert Consultation
We solicited expert consultation on remote monitoring of ICDs, CRTs, and pacemakers. The role of the expert advisors was to contextualize the evidence and provide advice on topic.
Results
Literature Search
The literature search yielded 4,750 citations published between January 1, 2010, and June 1, 2017. Six studies were identified through the grey literature search, two from the list of studies of the previous health technology assessment, and one from literature search alerts. After removal of duplicates, 3,364 remained. Figure 1 presents the flow diagram for the Preferred Reporting Items for Systematic Reviews and Meta-analyses (PRISMA).

Clinical Evidence October 2018
Ontario Health Technology Assessment Series; Vol. 18: No. 7, pp. 1–199, October 2018 21
Figure 1: PRISMA Flow Diagram—Clinical Search Strategy
Source: Adapted from Moher et al.27
Study Design and Characteristics for RCTs—ICDs and CRT-Ds
Fifteen RCTs reported in 20 publications evaluated remote monitoring in patients implanted with an ICD or a CRT.15,28-46 The studies consisted of open label, randomized trials comparing the use of remote monitoring for ICDs and CRTs plus clinic visits with a control group where patients were seen in person at the clinic and did not receive remote monitoring. Twelve studies were conducted in European countries28,29,31-40 and three in the United States.41,42,46
The studies mostly included patients with indications for either a new implantation or a replacement of an ICD or CRT-D, for either primary or secondary prevention of sudden cardiac death. One study included a small number of patients (13%) implanted with CRTs without a
Sc
ree
nin
g
Inclu
de
d
Eli
gib
ilit
y
Iden
tifi
cati
on
Records identified through
database searching (n = 4,750) Additional records identified through
other sources (n = 9)
Records after duplicates removed (n = 3,364)
Records screened (n = 3,364)
Records excluded (n = 2,973)
Full-text articles assessed for eligibility (n = 391)
Full-text articles excluded (n = 365)
• Not in adults (n = 1)
• Not on remote monitoring of ICDs, CRTs or pacemakers (n = 20)
• Not an RCT (n = 101)
• Conference abstract (n = 231)
• Does not evaluate any of the outcomes of interest (n = 10)
• Not in English (n = 1)
• Duplicate (n = 1)
Studies included in qualitative synthesis
(n = 26)
Studies included in quantitative synthesis
(meta-analysis) (n = 24)

Clinical Evidence October 2018
Ontario Health Technology Assessment Series; Vol. 18: No. 7, pp. 1–199, October 2018 22
defibrillator (CRT-Ps).28 One study had a 1-month run-in phase before the randomization, in which all patients received remote monitoring. Only those patients with automatic remote data monitoring in at least 80% of the days during this phase were subsequently randomized to either the remote or non-remote monitoring group.35 One study was terminated early due to lower than expected enrolment of patients—917 out of an expected 1,720 patients were randomized into this study.29 The main outcome in nine studies was a composite end point.28,29,31,35-37,40,42,46 It usually consisted of the occurrence of at least one of a list of events: mortality and/or hospitalizations and/or emergency department visits. Other studies evaluated mortality, hospitalizations, and time to event detection as the main outcome.32,34,41 Cost of treatment was the main outcome in three studies.33,38,39 The statistical power and sample size calculation was based on the composite end point in most studies. Secondary outcomes included individual components of the composite end point, length of hospital stay, quality of life, time from event detection to clinical decision, and percentage of CRT responders.
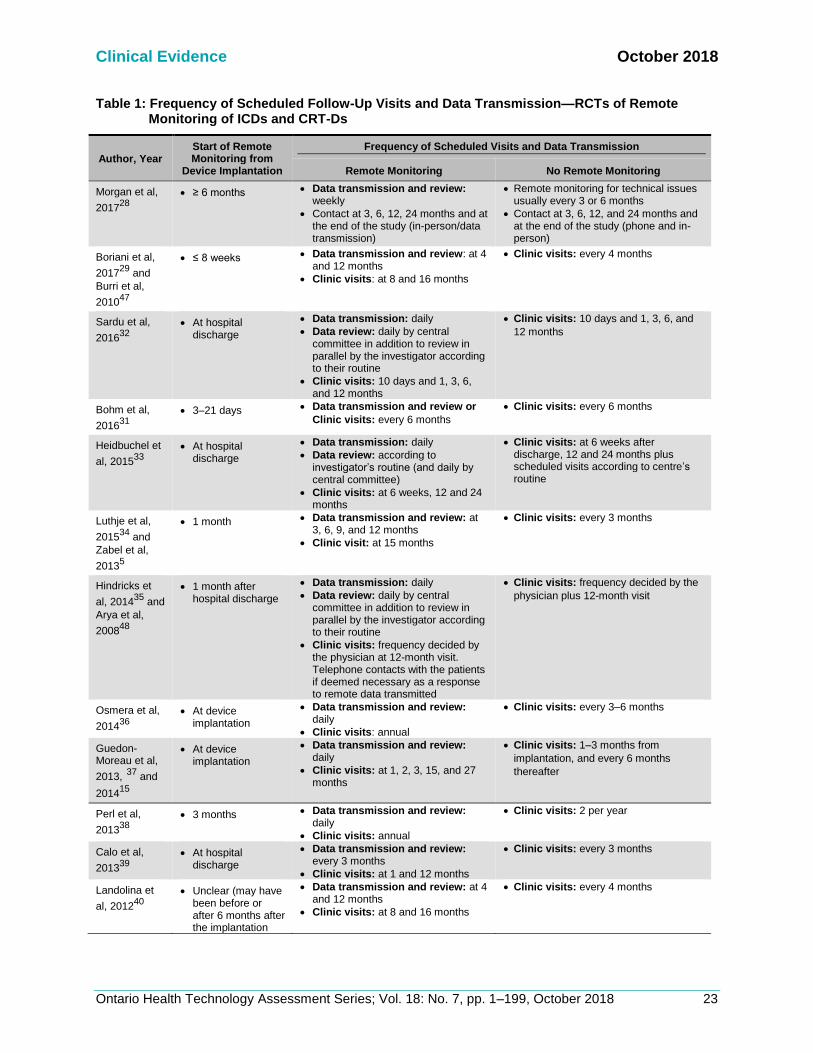
The number of patients included in the studies varied between 151 and 1,650, and the duration of follow-up varied between 12 and 42 months. Thirteen studies used one single type of remote monitoring system. Seven used the CardioMessenger,32,33,35-38,42 and six used CareLink.29,31,34,40,41,46 In two studies, patients also used other Health Canada–approved systems, such as Merlin and Latitude.28,39 Some studies started to evaluate remote monitoring early; i.e., as soon as the ICD or CRT-D was implanted, or within the first two months of use. Other studies waited at least 12 weeks to start evaluating the remote monitoring (Table 1). In the remote monitoring group, the frequency of data transmission and review by the clinic varied widely, from once a day to once every 6 months (Table 1). The frequency of scheduled clinic visits varied between groups and between studies, and it was generally less frequent in the remote monitoring group than in the non-remote monitoring group (Table 1). In Hindricks et al,35 on the other hand, visits were scheduled according to the standard of care at each site. The frequency was not provided. Additional, unscheduled, visits occurred when deemed necessary either by the treating physician or the patient. The remote monitoring systems also sent alerts to notify the physician of medical events such as arrhythmias, ICD shocks, and device-related events such as ICD and CRT device integrity. Programming of alerts was at the physician’s discretion. In one study, only alerts for fluid status monitoring, a marker of pulmonary congestion, were enabled.31 In another study, alerts were not used to trigger interactions with the patients, but data trends for multiple parameters based on remote data transmission were used.28 In most studies, the response to alerts was also left to physician’s discretion. In some studies, alerts triggered contact by telephone to verify the person’s condition and to decide on appropriate measures.31,35,36,40 See Appendix 4 for additional information.
Clinical Evidence October 2018
Ontario Health Technology Assessment Series; Vol. 18: No. 7, pp. 1–199, October 2018 23
Table 1: Frequency of Scheduled Follow-Up Visits and Data Transmission—RCTs of Remote Monitoring of ICDs and CRT-Ds
Author, Year Start of Remote Monitoring from
Device Implantation
Frequency of Scheduled Visits and Data Transmission
Remote Monitoring No Remote Monitoring
Morgan et al,
201728
• ≥ 6 months • Data transmission and review: weekly
• Contact at 3, 6, 12, 24 months and at the end of the study (in-person/data transmission)
• Remote monitoring for technical issues usually every 3 or 6 months
• Contact at 3, 6, 12, and 24 months and at the end of the study (phone and in-person)
Boriani et al,
201729
and
Burri et al,
201047
• ≤ 8 weeks • Data transmission and review: at 4 and 12 months
• Clinic visits: at 8 and 16 months
• Clinic visits: every 4 months
Sardu et al,
201632
• At hospital discharge
• Data transmission: daily
• Data review: daily by central committee in addition to review in parallel by the investigator according to their routine
• Clinic visits: 10 days and 1, 3, 6, and 12 months
• Clinic visits: 10 days and 1, 3, 6, and
12 months
Bohm et al,
201631
• 3–21 days • Data transmission and review or
Clinic visits: every 6 months
• Clinic visits: every 6 months
Heidbuchel et
al, 201533
• At hospital discharge
• Data transmission: daily
• Data review: according to investigator’s routine (and daily by central committee)
• Clinic visits: at 6 weeks, 12 and 24 months
• Clinic visits: at 6 weeks after discharge, 12 and 24 months plus scheduled visits according to centre’s routine
Luthje et al,
201534
and
Zabel et al,
20135
• 1 month • Data transmission and review: at 3, 6, 9, and 12 months
• Clinic visit: at 15 months
• Clinic visits: every 3 months
Hindricks et
al, 201435
and
Arya et al,
200848
• 1 month after hospital discharge
• Data transmission: daily
• Data review: daily by central committee in addition to review in parallel by the investigator according to their routine
• Clinic visits: frequency decided by the physician at 12-month visit. Telephone contacts with the patients if deemed necessary as a response to remote data transmitted
• Clinic visits: frequency decided by the
physician plus 12-month visit
Osmera et al,
201436
• At device implantation
• Data transmission and review: daily
• Clinic visits: annual
• Clinic visits: every 3–6 months
Guedon-Moreau et al,
2013, 37 and
201415
• At device implantation
• Data transmission and review: daily
• Clinic visits: at 1, 2, 3, 15, and 27 months
• Clinic visits: 1–3 months from
implantation, and every 6 months
thereafter
Perl et al,
201338
• 3 months • Data transmission and review: daily
• Clinic visits: annual
• Clinic visits: 2 per year
Calo et al,
201339
• At hospital discharge
• Data transmission and review: every 3 months
• Clinic visits: at 1 and 12 months
• Clinic visits: every 3 months
Landolina et
al, 201240
• Unclear (may have been before or after 6 months after the implantation
• Data transmission and review: at 4 and 12 months
• Clinic visits: at 8 and 16 months
• Clinic visits: every 4 months

Clinical Evidence October 2018
Ontario Health Technology Assessment Series; Vol. 18: No. 7, pp. 1–199, October 2018 24
Author, Year Start of Remote Monitoring from
Device Implantation
Frequency of Scheduled Visits and Data Transmission
Remote Monitoring No Remote Monitoring
Crossley et al,
201141
• At device implantation
• Data transmission and review: every 3 months
• Clinic visits: at 1 and 15 months
• Clinic visits: at 1 month and every 3 months thereafter
Varma et al,
201042
• 0–45 days after hospital discharge
• Data transmission: Daily
• Data review: every 3 months by investigator, daily online at service centre
• Clinic visits: at 3 and 15 months
• Clinic visits: every 3 months
Al-Khatib et al,
201046
• Information not provided
• Data transmission and review: every 3 months
• Clinic visit: at 12 months and phone contact at 6 months
• Clinic visits: every 3 months
Baseline Patient Characteristics for RCTs—Remote Monitoring of ICDs and CRT-Ds
The mean age of the patients included in the studies was about 65 years and the majority were male (> 75% in most studies). Ethnicity was reported in one study where 63% of the patients were white.46 Eight studies included patients implanted with either ICDs or CRT-Ds,28,31,34,35,39-41,46 five with ICDs only,33,36-38,42 and two with CRT-Ds only.29,32 The participants presented mostly with NYHA functional classes II and III and the mean left ventricular ejection fraction varied from 25% to 39% (relevant information was not provided in three studies). In the studies that included patients implanted with ICDs, the device was used for primary prevention in 38% to 100% of the patients (relevant information was not provided in six studies). See Appendix 5 for additional information.
Risk of Bias for RCTs—Remote Monitoring of ICDs and CRT-Ds
The risk of bias was considered low for the studies identified because the random sequence generation and allocation concealment were performed adequately. It was not possible to blind the outcome assessors; however, we did not consider this a substantial risk of bias for the outcomes reported, especially as in nine studies, an independent committee reviewed and adjudicated the study end points. The risk of selective reporting bias was considered low. See Appendix 6 for additional information.
RCT Results—Remote Monitoring of ICDs and CRT-Ds
Participant Withdrawal
In the remote monitoring group, 4.5% to 27% of the participants withdrew from the study, compared with 2.7% to 25% in the non-remote monitoring group.28,29,31-37,40-42,46 Reasons for withdrawal commonly included withdrawal of consent, inability or failure to attend follow-up, need for device or lead revision or replacement, heart transplantation, death, and non-adherence. However, the studies did not report whether the withdrawal rate differed between the groups. None of the studies reported crossover between study groups.
Remote Monitoring System Data Transmission and Patient Adherence With Scheduled Visits
Three studies provided information on issues with data transmission in the remote monitoring group. In two studies, data transmission occurred in about 86% of the follow-up days.35,45 A third

Clinical Evidence October 2018
Ontario Health Technology Assessment Series; Vol. 18: No. 7, pp. 1–199, October 2018 25
study reported that, in 62% of patients, data transmission occurred in ≥75% of the weeks over the 24 month period of the study.28 Gaps in transmission of more than 3 days were seen in 241 (48%) patients in the study by Hindricks et al,35 usually because the patient was away from home for that period. In one study, 55% of automatic alerts (180) were successfully transmitted, representing 149 clinical events (45%).41 Another study reported that alerts were successfully transmitted in 83% of the cases (88% if “patients” excludes hospitalized patients).29 In both studies, reasons for problems in transmission included the monitor turned off or not properly set up, phone line connection problems, and patient’s absence from home.29,41 One study reported that adherence to scheduled clinic visits was similar in the remote and non-remote monitoring groups, 99.0% and 93.6%, respectively, within 24 months of follow-up.29 However, Varma et al45 reported that adherence to follow-up every 3 months was higher in the remote monitoring group (59% of patients) compared with the non-remote monitoring group (47% of patients; P < .001) after 15 months of follow-up. See Appendix 7 for additional information.
Composite End Point
Eight studies reported the results of a composite end point.28,29,31,35,37,40,42,46 Its composition varied across studies but it commonly consisted of a combination of death and all-cause or cardiovascular/device-related hospitalization or emergency room visits. Based on a mean follow-up of 12 to 34 months, there was a statistically significant difference between the remote monitoring and the control group in only one study.35 In that study, patients in the remote monitoring group had a lower risk (odds ratio: 0.63; 0.43–0.90) of having a worsened clinical score (death, heart failure hospitalization, NYHA functional class, or global self-assessment) compared to patients without remote monitoring.35 In subgroup analyses, remote monitoring had a stronger effect in patients with a history of atrial fibrillation.35 No meta-analysis was performed as the outcome definition varied from study to study. See Appendix 7 for additional information.
ICD Shocks
Five studies (six publications) with a mean follow-up of 12 to 37 months reported the occurrence of ICD shock therapies, including total number of shocks and the number of appropriate and inappropriate shocks.15,32,34,36,37,46 A sixth study planned to evaluate the incidence of ICD shocks, but its results were not available in the literature.33 An ICD shock was considered appropriate if delivered as a result of a ventricular tachyarrhythmia.15 In the remote monitoring group, 15% to 22% of patients had an ICD shock, compared to 11% to 29% of patients in the non-remote monitoring group.15,32,34,36,37,46 Appropriate ICD shocks were experienced by 14% to 17% and 14% to 18%, respectively, in two studies.36,37 Inappropriate ICD shocks were reported in 2% to 6% of patients in the remote monitoring group, and 2% to 12% of patients in the non-remote monitoring group.15,34,36,37,46 Our meta-analysis did not show a statistically significant difference between the two groups in the number of patients with an ICD shock (either appropriate or inappropriate) or an appropriate ICD shock only (Figure 2). On the other hand, our meta-analysis showed fewer patients with

Clinical Evidence October 2018
Ontario Health Technology Assessment Series; Vol. 18: No. 7, pp. 1–199, October 2018 26
inappropriate ICD shocks in the remote monitoring group compared to the non-remote monitoring group (RR 0.53 [95% CI: 0.32–0.89]; RD −0.04 [95% CI: −0.07 to −0.01]; Figure 2). The studies also indicate that the number of inappropriate shocks was generally higher in the non-remote versus remote monitoring group, although it is not clear if the difference in number of shocks was statistically significant (Table 2). One study reported that inappropriate shocks occurred due to supraventricular tachyarrhythmias (48.5%), ventricular oversensing (18.2%), T wave oversensing (15.2%), lead dysfunction (15.2%), and surgical interventions (3%).15 Another study reported that inappropriate ICD shocks were due to atrial fibrillation, fast ventricular rate, sinus tachycardia, lead failure, and electrocauterization.34 According to the authors of one of the studies, the reduction in inappropriate ICD shocks in the remote monitoring group may be due to an early warning of events that can trigger multiple inappropriate shocks provided by the remote monitoring system. Once the health care provider receives the warnings (alerts) from the system, they can act to prevent recurrence of inappropriate shocks.15

Clinical Evidence October 2018
Ontario Health Technology Assessment Series; Vol. 18: No. 7, pp. 1–199, October 2018 27
A.
B.
Figure 2: ICD Shocks—RCTs of Remote Monitoring of ICDs and CRT-Ds (A. Risk Ratio; B. Risk Difference)
Sources: Guedon-Moreau et al,15 Luthje et al,34 Osmera et al,36 and Al-Khatib et al.46
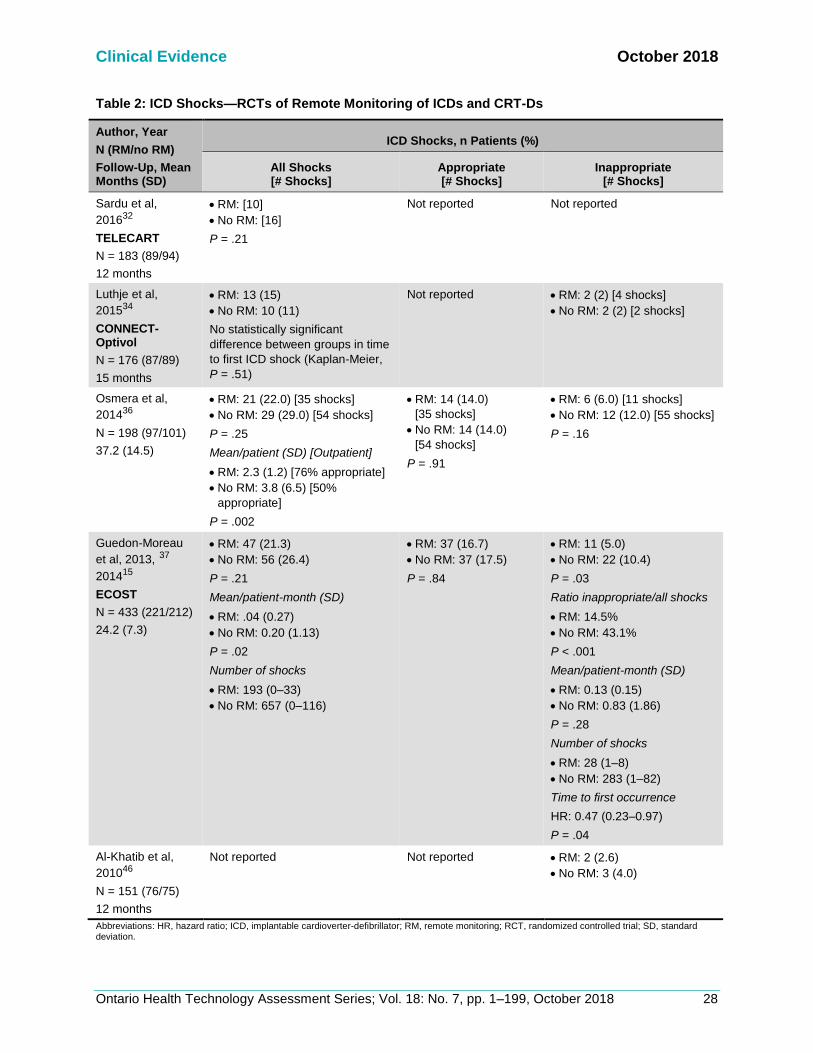
Clinical Evidence October 2018
Ontario Health Technology Assessment Series; Vol. 18: No. 7, pp. 1–199, October 2018 28
Table 2: ICD Shocks—RCTs of Remote Monitoring of ICDs and CRT-Ds
Author, Year
N (RM/no RM)
Follow-Up, Mean Months (SD)
ICD Shocks, n Patients (%)
All Shocks [# Shocks]
Appropriate [# Shocks]
Inappropriate [# Shocks]
Sardu et al,
201632
TELECART
N = 183 (89/94)
12 months
• RM: [10]
• No RM: [16]
P = .21
Not reported Not reported
Luthje et al,
201534
CONNECT-Optivol
N = 176 (87/89)
15 months
• RM: 13 (15)
• No RM: 10 (11)
No statistically significant
difference between groups in time
to first ICD shock (Kaplan-Meier,
P = .51)
Not reported • RM: 2 (2) [4 shocks]
• No RM: 2 (2) [2 shocks]
Osmera et al,
201436
N = 198 (97/101)
37.2 (14.5)
• RM: 21 (22.0) [35 shocks]
• No RM: 29 (29.0) [54 shocks]
P = .25
Mean/patient (SD) [Outpatient]
• RM: 2.3 (1.2) [76% appropriate]
• No RM: 3.8 (6.5) [50%
appropriate]
P = .002
• RM: 14 (14.0)
[35 shocks]
• No RM: 14 (14.0)
[54 shocks]
P = .91
• RM: 6 (6.0) [11 shocks]
• No RM: 12 (12.0) [55 shocks]
P = .16
Guedon-Moreau
et al, 2013, 37
201415
ECOST
N = 433 (221/212)
24.2 (7.3)
• RM: 47 (21.3)
• No RM: 56 (26.4)
P = .21
Mean/patient-month (SD)
• RM: .04 (0.27)
• No RM: 0.20 (1.13)
P = .02
Number of shocks
• RM: 193 (0–33)
• No RM: 657 (0–116)
• RM: 37 (16.7)
• No RM: 37 (17.5)
P = .84
• RM: 11 (5.0)
• No RM: 22 (10.4)
P = .03
Ratio inappropriate/all shocks
• RM: 14.5%
• No RM: 43.1%
P < .001
Mean/patient-month (SD)
• RM: 0.13 (0.15)
• No RM: 0.83 (1.86)
P = .28
Number of shocks
• RM: 28 (1–8)
• No RM: 283 (1–82)
Time to first occurrence
HR: 0.47 (0.23–0.97)
P = .04
Al-Khatib et al,
201046
N = 151 (76/75)
12 months
Not reported Not reported • RM: 2 (2.6)
• No RM: 3 (4.0)
Abbreviations: HR, hazard ratio; ICD, implantable cardioverter-defibrillator; RM, remote monitoring; RCT, randomized controlled trial; SD, standard deviation.

Clinical Evidence October 2018
Ontario Health Technology Assessment Series; Vol. 18: No. 7, pp. 1–199, October 2018 29
Time From Event Onset to Data Review or Clinical Decision
Four studies (five publications) evaluated the time taken from the onset of an event either until data review at the clinic or until a clinical decision was made.30,40-42,44 Events included fluid accumulation, atrial tachycardia/atrial fibrillation burden, fast ventricular rates during atrial fibrillation episodes, ventricular fibrillation, ventricular tachycardia, ICD shocks, and device malfunction. The study follow-up varied from 12 to 16 months. In the remote monitoring group, dates of event alert detection and review were based on information provided by the study sites. In the non-remote monitoring group, it was based on the date of the clinic visit where the information stored in the device was retrieved.30,40-42 Based on the results of three studies (four publications), the time from event onset or remote monitoring system alert to data review at the clinic was statistically significantly shorter in the remote versus the non-remote monitoring group; i.e., median times varied between 1 and 4 days versus 9 and 42 days, respectively.30,40,42,44 Two studies reported a statistically significantly shorter time from event onset to clinical decision in the remote versus non-remote monitoring group, median times varied from 2 to 5 days compared with 22 to 29 days, respectively.30,41

Clinical Evidence October 2018
Ontario Health Technology Assessment Series; Vol. 18: No. 7, pp. 1–199, October 2018 30
Table 3: Time From Event Onset to Data Review/Clinical Decision—RCTs of Remote Monitoring of ICDs and CRT-Ds
Author, Year
N (RM/no RM)
Follow-Up, Mean Months (SD)
Time From Alert/Onset to Event Review
Median Days (IQR)
Time From Event Onset to Clinical Decision
Median Days (IQR)
Boriani et al, 201730
MORE-CARE
12 months
N = 148 (76/72)
Time from alert to event review at clinic
• RM: 3 (1–10)
• No RM: 37 (14–71)
P < .001
• RM: 2 (1–4)
• No RM: 29 (3–51)
P = .004
Varma et al, 201644
TRUST
N = 1,339 (908/431)
1st 3 months post-implant
Time to discovery of actionable events, mean days
(SD)
1st 3 months post-implant
• RM: 4.4 (11.9)
• No RM: 8.7 (16.9)
P = .03
Not reported
Landolina et al, (2012,
2013)40
EVOLVO
N = 200 (99/101)
Up to 16 months
Time from alert to data review
• RM: 1.4 (0.8–7.3)
• No RM: 24.8 (9.5–48.8)
P < .001
Not reported
Crossley et al, 201141
CONNECT
N = 1,997 (1,014/983)
15 months
Not reported • RM: 4.6
• No RM: 22.0
P < .001
Varma et al, 201042
and 201445
TRUST
N = 1,339 (908/431)
11.5 (2.6)
Time from onset to physician evaluation
First AF/VF/VT
• RM: 1.0
• No RM: 35.5
P < .001
Clinically asymptomatic AF, VT, VF, SVT
• RM: 1.0 (1; 6)
• No RM: 41.5 (10.5; 70.3)
P < .001
Device-related issues
• RM: 1.0 (0; 4)
• No RM: 5.0 (1; 27)
P = .05
Not reported
Abbreviations: AF, atrial fibrillation; CRT-D, cardiac resynchronization therapy with defibrillator; ICD, implantable cardioverter-defibrillator; IQR, interquartile range; RM, remote monitoring; RCT, randomized controlled trial; SD, standard deviation; SVT, supraventricular tachycardia; VF; ventricular fibrillation; VT, ventricular tachycardia.
Cardiac Resynchronization Therapy Responders
Sardu et al32 evaluated the number of patients who responded to the cardiac resynchronization therapy. Non-response to therapy was defined by the presence of at least one of the following: deteriorating function (heart failure–related death or need for heart transplantation), increase in

Clinical Evidence October 2018
Ontario Health Technology Assessment Series; Vol. 18: No. 7, pp. 1–199, October 2018 31
left ventricular ejection fraction by ≤4 absolute percentage points, or a worsening of the peak oxygen consumption, quality of life score, or distance walked in 6 minutes.49 They did not find a statistically significant difference in the number of CRT responders between the two groups; i.e., 67% and 63% of patients in the remote and non-remote monitoring groups were considered responders, respectively (P = .31).32
Worsening of NYHA Functional Class or Clinical Status
Based on the results of Hindricks et al,35 the number of patients with worsening of NYHA functional class was not statistically significantly different between the remote and non-remote monitoring groups; i.e., 29 (8.7%) and 35 (10.6%) patients, respectively (P = .43). Landolina et al40 reported a worsening of clinical status in 34 patients (34%) in the remote monitoring group and 44 patients (44%) in the non-remote monitoring group (difference not statistically significant).
Stroke
In our meta-analysis, there was no statistically significant difference in the number of patients with a stroke between the remote and non-remote monitoring groups within a 12-month follow-up based on the results of two studies (Figure 3).32,42 The small number of events reported makes it difficult to interpret the results. A.
B.
Sources: Sardu et al32 and Varma et al.42
Figure 3: Stroke—RCTs of Remote Monitoring of ICDs and CRT-Ds (A. Risk Ratio;
B. Risk Difference)
Number of Clinic Visits
Ten studies evaluated the number of total, scheduled, and unscheduled clinic visits for patients in the remote and non-remote monitoring groups.29,33,35-42 With the exception of one study, where clinic visits in both groups were scheduled according to the clinical standard at each study site, visits were scheduled less frequently in the remote

Clinical Evidence October 2018
Ontario Health Technology Assessment Series; Vol. 18: No. 7, pp. 1–199, October 2018 32
monitoring group.35 However, the number of unscheduled clinic visits was generally higher in the remote compared to the non-remote monitoring group. In six studies, the total number of clinic visits was statistically significantly lower in the remote monitoring group compared with the non-remote monitoring group.29,33,36-38,42 The remaining four studies did not report whether the difference was statistically significant.35,39-41 In three of these four studies, the mean number of total clinic visits was lower with remote versus non-remote monitoring.39-41 The mean total number of clinic visits per patient-year varied from 0.9 to 3.9 in the remote monitoring group and from 1.7 to 6.3 in the non-remote monitoring group within 12 to 37 months of follow-up (Table 4). We were not able to provide a pooled mean number of visits in each group because some of the studies did not provide sufficient information for the analysis. We calculated the rate of clinic visits in the two groups based on the mean number of visits per patient-year provided in 7 of 10 studies. 29,35,37,38,40-42 The rate ratio varied between 0.50 and 0.74, with the exception of the study by Hindricks et al35 (Figure 4). Given the substantial heterogeneity (I2 = 96%) in the results across studies, we decided not to meta-analyse the studies. Only Hindricks et al35 did not show a decrease in the mean total number of clinic visits. In this study, clinic visits were scheduled according to the clinical standard at each site in both groups (information on frequency of scheduling of visits was not provided).48 Varma et al44 compared the number of clinic visits for patients with remote and non-remote monitoring within the first 3 months of the ICD implantation. Neither the number of patients who had a clinic visit before the 3-month scheduled visit (132 [15%] vs. 53 [12.3%], respectively, P = .31) nor the number of visits per patient-year (0.93 vs. 0.67, respectively, P = .28) differed between the two groups.44
Figure 4: Total Clinic Visits—RCTs of Remote Monitoring of ICDs and CRT-Ds
Sources: Boriani et al,29 Crossley et al,41 Guedon-Moreau et al,15 Hindricks et al,35 Perl et al,38 Landolina et al,40 and Varma et al.42

Clinical Evidence October 2018
Ontario Health Technology Assessment Series; Vol. 18: No. 7, pp. 1–199, October 2018 33
Table 4: Clinic Visits—RCTs of Remote Monitoring of ICDs and CRT-Ds
Author, Year
N (RM/no RM)
Follow-Up, Mean Months (SD)
Number of Clinic Visits
Total Visits Scheduled Visits Unscheduled Visits
Boriani et al, 2013,30
201729
MORE-CARE
Median (IQR): 24 (15, 25)
N = 865 (437/428)
Rate/patient at 24 months,a
% (95% CI)
• RM: 3.16 (2.97–3.34)
• No RM: 5.38 (5.15–5.63)
Adjusted IRR: (95% CI):
0.59 (0.56–0.62) P < .001
Rate/patient at 24 months,a %
(95% CI)
• RM: 2.46 (2.30–2.62)
• No RM: 5.14 (4.90–5.38)
Adjusted IRR: (95% CI): 0.48
(0.46–0.50) P < .001
Rate/patient at 24 months,a %
(95% CI)
• RM: 0.70 (0.62–0.80)
• No RM: 0.24 (0.19–0.30)
Adjusted IRR: (95% CI): 2.8
(2.16–3.63) P < .001
Heidbuchel et al, 201533
EuroEco- ICD
N = 303 (159/144)
24.0 (IQR: 23.1, 24.5)
Mean/patient (SD)
• RM: 3.8 (1.7)
• No RM: 5.5 (2.3)
P < .001
Mean/patient (SD)
• RM: 2.8 (0.8)
• No RM: 4.9 (1.9)
P < .001
Mean/patient (SD)
• RM: 1.0 (1.5)
• No RM: 0.6 (1.3)
• P = .005
Hindricks et al, 201435
In-TIME
N = 664 (333/331)
11.2 (2.6)
Mean/patient-year
• RM 3.13
• No RM: 2.86
Not reported Not reported
Osmera et al, 201436
N = 198 (97/101)
37.2 (14.5)
Mean/patient (SD)
• RM: 4.3 (1.8)
• No RM: 7.1 (3.0)
P < .001
Number of visits
• RM: 3.7 (1.4)
• No RM: 6.8 (3.0)
P < .001
Number of visits
• RM: 36
• No RM: 24
P = .12
Guedon-Moreau et al,
201337
ECOST
N = 433 (221/212)
Mean/patient-year
• RM: 1.46
• No RM: 2.23
P < .001
Number of visits
• RM: 624
• No RM: 880
Number of visits
• RM: 180
• No RM: 112
Perl et al, 201338
SAVE-HM
N = 36 (18/18)
26.3 (8.6)
Mean/patient-year (SD)
• RM:0.87 (0.25)
• No RM: 1.73 (0.53)
P < .001
Not reported Not reported
Calo et al, 201339
N = 233 (117/116)
12 months
Mean/patient
• RM: 1.3
• No RM: 4.2
• RM: 1.0
• No RM: 4.0
P = .001
• RM: 0.3
• No RM: 0.2
• P = .07
Landolina et al, 201240
EVOLVO
N = 200 (99/101)
Up to 16 months
Mean/patient-year
• RM: 3.75
• No RM: 5.1
Not reported Not reported
Crossley et al, 201141
CONNECT
N = 1,997 (1,014/983)
15 months
Mean/patient-year
• RM: 3.9
• No RM: 6.3
Not reported CV, mean/patient-year
• RM: 2.24
• No RM: 1.95
P = .099

Clinical Evidence October 2018
Ontario Health Technology Assessment Series; Vol. 18: No. 7, pp. 1–199, October 2018 34
Author, Year
N (RM/no RM)
Follow-Up, Mean Months (SD)
Number of Clinic Visits
Total Visits Scheduled Visits Unscheduled Visits
Varma et al, 201042
TRUST
N = 1,339 (908/431)
11.5 (2.6)
Mean/patient-year
• RM: 2.1
• No RM: 3.8
P < .001
Mean/patient-year
• RM: 1.3
• No RM: 3.3
P < .001
Mean/patient-year
• RM: 0.78
• No RM: 0.50
P = .009
Abbreviations: CRT-D, cardiac resynchronization therapy with defibrillator; CV, cardiovascular; ICD, implantable cardioverter-defibrillator; IQR, interquartile range; IRR, incidence rate ratio; RM, remote monitoring; RCT, randomized controlled trial; SD, standard deviation. aThe study reported the rate of visits per 100 patients.
Hospitalizations
Ten studies with a mean follow-up of 11 to 33 months reported on hospitalizations for all-cause, heart failure, or cardiovascular events.28,29,31,32,34,35,40-42,46 No statistically significant difference in the number of patients with at least one hospitalization for any cause was observed between the remote and non-remote monitoring groups in a meta-analysis of four studies that reported such data (Figure 5). A fifth study reported that there were fewer hospitalizations in the remote versus the non-remote monitoring group (P < .001)42; however, the study could not be included in the meta-analysis due to insufficient data. Similarly, no statistically significant difference between the two groups was observed in the number of patients with at least one heart failure or cardiovascular hospitalization in a meta-analysis of five studies (Figure 6). In this meta-analysis, we sought to include data on heart failure hospitalizations; however, in the one study in which the information was not available, we used information on cardiovascular hospitalization.28 Two studies did not report the number of patients with hospitalizations and therefore could not be included in the meta-analysis.40,41 In these two studies, the mean number of hospitalizations per patient-year was not statistically significantly different between the two groups. Two studies reported the length of hospital stay.35,41 In one, the median length of stay was not statistically significantly different between the remote and non-remote monitoring groups; that is, 8 days versus 7 days, respectively (P = 0.21).35 The other study reported a statistically significantly shorter length of stay with remote monitoring versus non-remote monitoring, 3.3 days versus 4 days, respectively (P = 0.002).41 See Appendix 7 for additional information.

Clinical Evidence October 2018
Ontario Health Technology Assessment Series; Vol. 18: No. 7, pp. 1–199, October 2018 35
A.
B.
Figure 5: All-Cause Hospitalizations—RCTs of Remote Monitoring of ICDs and CRT-Ds
(A. Risk Ratio; B. Risk Difference)
Sources: Al-Khatib et al,46 Bohm et al,31 Boriani et al,29 and Morgan et al.28
A.
B.
Figure 6: Heart Failure/Cardiovascular Hospitalizations—RCTs of ICDs and CRT-Ds (A. Risk Ratio;
B. Risk Difference)
Sources: Bohm et al,31 Boriani et al,29 Hindricks et al,35 Luthje et al,34 and Morgan et al.28

Clinical Evidence October 2018
Ontario Health Technology Assessment Series; Vol. 18: No. 7, pp. 1–199, October 2018 36
Emergency Department Visits
Five studies evaluated the number of emergency department visits (Table 5).29,34,40,41,46 One study reported a statistically significantly lower 24-month rate of emergency department visits per patient in the remote versus non-remote monitoring groups.29 A second study reported a statistically significantly lower 24-month rate of emergency department visits and urgent clinic visits due to worsening of heart failure per patient-year. The result was not significant for emergency department visits alone.40 The other three studies did not observe a statistically significant difference in the mean number of visits between the two groups.34,41,46
Table 5: Emergency Department Visits—RCTs of Remote Monitoring of ICDs and CRT-Ds
Author, Year N (RM/no RM)
Follow-Up, Mean Months (SD) Device Emergency Department Visits, n Patients (%)
Boriani et al, 201330 and 2017
29
MORE-CARE
Median (IQR): 24 (15;25)
N = 865 (437/428)
• RM: 27 (6.2)
• No RM: 41 (9.6)
24-month rate/patient (95% CI)
• RM: 0.11 (0.08–0.15)
• No RM: 0.16 (0.12–0.20)
Adjusted IRR: (95% CI): 0.72 (0.53–0.98) P = .04
Luthje et al, 201534
N = 176 (87/89)
15 months
Mean (SD)
• RM: 0.10 (0.25)
• No RM: 0.10 (0.23)
P = .73
Landolina et al, 201240
EVOLVO
N = 200 (99/101)
Up to 16 months
Emergency department visits for HF, arrhythmias, ICD-related events
Mean/patient-year
• RM: 0.19
• No RM: 0.30
Emergency department/ urgent in-office visits for worsening HF
Mean/patient-year
• RM: 0.38
• No RM: 0.73
IRR: 0.52 (0.37–0.75)
P < .001
No statistically significant difference for arrhythmias or ICD-related visits
Crossley et al, 201141
CONNECT
N = 1,997 (1,014/983)
15 months
Mean/patient-year
• RM: 0.24
• No RM: 0.21
P = .33
Al-Khatib et al, 201046
N = 151 (76/75)
12 months
• RM: 5 (7)
• No RM: 4 (5)
P = .74
Abbreviations: CI, confidence interval; CRT-D, cardiac resynchronization therapy with defibrillator; HF heart failure; ICD, implantable cardioverter-defibrillator; IQR, interquartile range; IRR, incidence rate ratio; RM, remote monitoring; RCT, randomized controlled trial; SD, standard deviation.

Clinical Evidence October 2018
Ontario Health Technology Assessment Series; Vol. 18: No. 7, pp. 1–199, October 2018 37
Mortality
All-Cause Mortality
Thirteen studies evaluated all-cause mortality in patients in the remote and non-remote monitoring groups.28,29,31-37,40-42,46 Mortality rates were reported for follow-ups of 12 to 37 months. At 12 months, 2.5% to 8.6% of patients in the remote monitoring group had died, compared with 2.8% to 8.2% in the non-remote monitoring group.32,34,35,42,46 At 24 months, 6.3% to 11.2%, and 9.4% to 15.7% of the patients in the remote and non-remote monitoring groups, respectively, had died.29,31,37 In two studies that followed patients for more than 24 months, mortality ranged from 15% to 30% and 16% to 28%, respectively.28,36 Only Hindricks et al35 found a statistically significant difference in mortality between the remote and non-remote monitoring groups (3.4% vs. 8.7% at 12 months, respectively; HR: 0.36 [0.17–0.74]). In this study, only patients with at least 80% of remote data transmission during a 1-month run-in phase were randomized into the remote and non-remote monitoring groups.35 Clinic visits were scheduled according to the physician’s discretion (in contrast to all other studies, where clinic visits were scheduled less frequently in the remote monitoring group than in the non-remote monitoring group). According to the authors, close monitoring of the patients through remote monitoring, telephone contact, and clinic visits, along with monitoring of the suboptimal cardiac resynchronization therapy function, may have contributed to the positive results. However, we cannot determine whether this can explain the difference in the results for this study. See Appendix 7 for additional information. Our meta-analysis revealed no statistically significant difference in all-cause mortality between the two groups (RR 0.89 [0.78–1.02]; RD −0.01 [−0.03 to 0.00]) (Figure 7). Where mortality rates were provided for different follow-up times in the same study, the one corresponding to the longest follow-up was used. One study reported that the mortality rates at 12 months of follow-up were not statistically significantly different between the two groups.41 However, because the number of deaths in each group was not provided, this study was not included in the meta-analysis. The hazard ratio is an appropriate measure for this outcome because it takes into account not only the occurrence of the event, but also the timing of the event. However, only four studies provided information on the hazard ratio. Based on these four studies, the pooled hazard ratio was not statistically significant (HR 0.81 [0.60–1.10]).

Clinical Evidence October 2018
Ontario Health Technology Assessment Series; Vol. 18: No. 7, pp. 1–199, October 2018 38
A.
B.
C.
Figure 7: All-Cause Mortality—RCTs of Remote Monitoring of ICDs and CRT-Ds (A. Risk Ratio;
B. Risk Difference; C. Hazard Ratio)
Sources: Al-Khatib et al,46 Bohm et al,31 Boriani et al,29 Guedon-Moreau et al,37 Heidbuchel et al,33 Hindricks et al,35 Landolina et al, 40 Luthje et al,34 Morgan et al,28 Osmera and Bulava,36 Sardu et al,32 Varma et al.42
Cardiovascular Mortality
Eight studies reported cardiovascular mortality rates.28,29,31,32,34,35,37,42 Within 12 to 34 months of follow-up, 1% to 13% of the patients in the remote monitoring group died of cardiovascular causes, compared with 1.6% to 14.3% in the non-remote monitoring group.28,29,31,32,34,35,37,42 Similarly to all-cause mortality, only the study by Hindricks et al35 found a statistically significant difference in cardiovascular mortality (2.4% vs. 6.3%, respectively, HR: 0.37 ([0.16–0.83] at 12 months).

Clinical Evidence October 2018
Ontario Health Technology Assessment Series; Vol. 18: No. 7, pp. 1–199, October 2018 39
Based on our meta-analysis, there was no statistically significant difference in cardiovascular mortality between the two groups (RR 0.89 [0.75–1.05]; RD −0.01 [−0.02 to 0.00]) (Figure 8). The pooled hazard ratio was not statistically significant (HR 0.78 [0.55–1.11]), according to the three studies that provided information. See Appendix 7 for additional information. A.
B.
C.
Figure 8: Cardiovascular Mortality—RCTs of Remote Monitoring of ICDs and CRT-Ds
(A. Risk Ratio; B. Risk Difference; C. Hazard Ratio)
Sources: Bohm et al,31 Boriani et al,29 Guedon-Moreau et al,37 Hindricks et al,35 Luthje et al,34 Morgan et al,28 Sardu et al,32 and Varma et al.42
Adverse Events
Four RCTs with a follow-up of 11 to 24 months reported data on adverse events.37,38,42,50 One non-inferiority trial evaluated the rate of major adverse events, including all-cause mortality and cardiovascular-, procedural-, and device-related events (≥1 inappropriate shock, ≥2 symptomatic, inappropriate antitachycardia pacing, etc.) in patients in the remote and non-remote monitoring groups.37 No difference was observed between the groups; i.e., 85 of the patients (39%) in the remote monitoring group and 88 of the patients (42%) in the non-remote monitoring group experienced at least one major adverse event (P = 0.53), which confirmed the

Clinical Evidence October 2018
Ontario Health Technology Assessment Series; Vol. 18: No. 7, pp. 1–199, October 2018 40
non-inferiority hypothesis (non-inferiority P = .04).37 Guedon-Moreau et al also reported that there was no statistically significant difference between groups for each of the individual components.37 A second non-inferiority trial also reported a nonstatistically significant difference in the overall rate of serious adverse events (death, stroke, and surgical intervention) between the remote and non-remote monitoring groups (10.4% in both groups), which confirmed the non-inferiority hypothesis (non-inferiority P = .005).42 The rate of serious and non-serious adverse events (lead defects, stroke, hospitalizations) was not statistically significantly different between remote and non-remote monitoring in the study by Perl et al.38 Boriani et al29 reported that the rate of adverse events related to the implanted device did not differ between groups (0.08 per patient-year in both groups, P = 0.92). The types of events were not specified in the publication.
Quality of Life and Satisfaction With Care
Four studies compared the changes in quality of life and the satisfaction with ICD care between patients in the remote and non-remote monitoring groups.29,33,40,46 Three studies originally planned to measure quality of life; however, the results for this outcome were not included in the published studies.28,31,34 Two studies did not find any statistically significant difference between the groups in the change in quality of life from baseline (Table 6).29,33 Landolina et al40 found a statistically significant improvement in quality of life at 16 months of follow-up in the remote monitoring group compared with the non-remote monitoring group, using the Minnesota Living with Heart Failure questionnaire. Al-Khatib et al46 found a statistically significant improvement with remote monitoring in the EuroQoL thermomether at six months, but not at 12 months. When the EuroQoL score was used to measure quality of life, no statistically significant difference was observed between the groups at either 6 or 12 months. Al-Khatib et al46 reported a statistically significantly higher satisfaction with ICD care with remote monitoring compared with no remote monitoring at 6 months but not at 12 months.
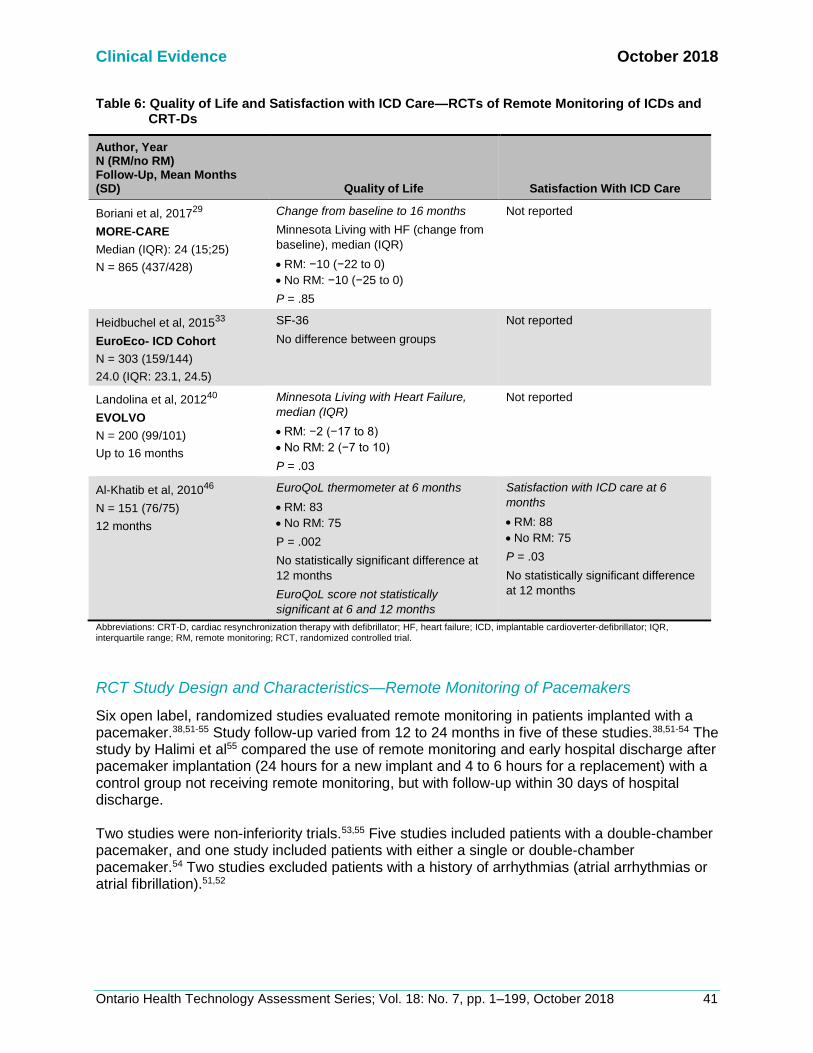
Clinical Evidence October 2018
Ontario Health Technology Assessment Series; Vol. 18: No. 7, pp. 1–199, October 2018 41
Table 6: Quality of Life and Satisfaction with ICD Care—RCTs of Remote Monitoring of ICDs and CRT-Ds
Author, Year N (RM/no RM) Follow-Up, Mean Months (SD) Quality of Life Satisfaction With ICD Care
Boriani et al, 201729
MORE-CARE
Median (IQR): 24 (15;25)
N = 865 (437/428)
Change from baseline to 16 months
Minnesota Living with HF (change from
baseline), median (IQR)
• RM: −10 (−22 to 0)
• No RM: −10 (−25 to 0)
P = .85
Not reported
Heidbuchel et al, 201533
EuroEco- ICD Cohort
N = 303 (159/144)
24.0 (IQR: 23.1, 24.5)
SF-36
No difference between groups
Not reported
Landolina et al, 201240
EVOLVO
N = 200 (99/101)
Up to 16 months
Minnesota Living with Heart Failure,
median (IQR)
• RM: −2 (−17 to 8)
• No RM: 2 (−7 to 10)
P = .03
Not reported
Al-Khatib et al, 201046
N = 151 (76/75)
12 months
EuroQoL thermometer at 6 months
• RM: 83
• No RM: 75
P = .002
No statistically significant difference at
12 months
EuroQoL score not statistically
significant at 6 and 12 months
Satisfaction with ICD care at 6
months
• RM: 88
• No RM: 75
P = .03
No statistically significant difference
at 12 months
Abbreviations: CRT-D, cardiac resynchronization therapy with defibrillator; HF, heart failure; ICD, implantable cardioverter-defibrillator; IQR, interquartile range; RM, remote monitoring; RCT, randomized controlled trial.
RCT Study Design and Characteristics—Remote Monitoring of Pacemakers
Six open label, randomized studies evaluated remote monitoring in patients implanted with a pacemaker.38,51-55 Study follow-up varied from 12 to 24 months in five of these studies.38,51-54 The study by Halimi et al55 compared the use of remote monitoring and early hospital discharge after pacemaker implantation (24 hours for a new implant and 4 to 6 hours for a replacement) with a control group not receiving remote monitoring, but with follow-up within 30 days of hospital discharge. Two studies were non-inferiority trials.53,55 Five studies included patients with a double-chamber pacemaker, and one study included patients with either a single or double-chamber pacemaker.54 Two studies excluded patients with a history of arrhythmias (atrial arrhythmias or atrial fibrillation).51,52

Clinical Evidence October 2018
Ontario Health Technology Assessment Series; Vol. 18: No. 7, pp. 1–199, October 2018 42
The number of patients included in the studies varied between 300 and 897. The studies were conducted in France,51,53,55 Austria,38 Brazil,52 and the United States.54 Five studies used CardioMessenger,38,51-53,55 and one used the CareLink remote monitoring system.54 For all six studies, the intervention group received remote monitoring in addition to clinic visits. In the control group, patients were seen in person at the clinic and did not receive remote monitoring, with the exception of one study where remote monitoring was compared to transtelephonic monitoring.54 In the transtelephonic monitoring group, in addition to clinic visits, information about battery status, pacemaker function analysis, and a limited electrocardiogram strip providing information about the patient’s rhythm at the time of transmission was transmitted.54 In the study by Lima et al,52 remote monitoring was used in the control group with the sole purpose of transmitting safety data to an external committee. The frequency of follow-up visits (in-person or remote) and data transmission varied from study to study. In five studies in the remote monitoring group, data were transmitted daily. In one study, data transmission occurred at 3, 6, and 9 months. Alerts in response to pre-specified medical and device-related events were sent in the remote monitoring group. The frequency of scheduled clinic visits varied both within study groups and between studies. See Table 7 for additional information. The outcomes in the studies consisted of time to management of arrhythmias or other clinical events, clinical events such as arrhythmias, stroke and mortality, quality of life, and number of hospitalizations and clinic visits. See Appendix 4 for additional information. Table 7: Frequency of Scheduled Follow-Up Visits and Data Transmission—RCTs of Remote
Monitoring of Pacemakers
Author, Year Timing of Start of
Remote Monitoring Remote Monitoring No Remote Monitoring
Amara et al,
201751
• At hospital discharge following implantation
• Data transmission: daily
• Data review: daily on workdays
• Clinic visits: 1–3 and 12 months; additional visits at the physician’s discretion
• Clinic visits: 1–3, and 12 months; additional visits at the physician’s discretion
Lima et al,
201652
• Immediately after implantation
• Data transmission: daily
• Data review: frequency not reported
• Clinic visits: 1, 3, 6, 12, 18, and 24 months
• Remote monitoring for safety data (received by a committee, not the investigator)
• Clinic visits: 1, 3, 6, 12, 18, and 24 months
Mabo et al,
201253
• > 1 month after implantation
• Data transmission: daily
• Clinic visits: none scheduled
• Clinic visits: as per each centre’s policy
Perl et al, 201338
• Not specified • Data transmission: daily
• Clinic visits: none scheduled
• Clinic visits: 1/year according to centre’s policy
Crossley et al,
200954
• Not specified • Data transmission: at 3, 6, and 9 months
• Clinic visits: at 12 months
• Transtelephonic transmission: at 2, 4, 6 (single-chamber pacemaker only), 8, and 10 months
• Clinic visits: at 6 (double-chamber pacemaker only) and 12 months
Halimi et al,
200855
• Immediately after implantation
• Data transmission and review: daily
• Follow-up: optional home nurse visits, 1 telephone follow-up, clinic visit at 1 month
• Follow-up: optional home nurse visits,
1 telephone follow-up, clinic visit at 1
month

Clinical Evidence October 2018
Ontario Health Technology Assessment Series; Vol. 18: No. 7, pp. 1–199, October 2018 43
Baseline Characteristics—RCTs of Remote Monitoring of Pacemakers
The mean age of the study participants varied between 68 and 79 years and 45% to 65% were men.38,49,51-54 The indication for pacemaker implantation in most cases was either atrioventricular block (66% to 89% in four studies) or heart block (33% to 57% in two studies).38,49,51-54 Other indications included sinus node dysfunction and bundle branch block.38,49,51-54 Based on three studies, most study participants received their first pacemaker implant at the time of study enrolment (52% to 90%).51-53 See Appendix 5 for additional information.
Risk of Bias for RCTs—Remote Monitoring of Pacemakers
The risk of bias was considered low for the studies identified as the random sequence generation and allocation concealment were performed adequately. It was not possible to blind the outcome assessors; however, we did not consider this a substantial risk of bias for the outcomes reported, especially because, in some studies, an independent committee reviewed and adjudicated the study end points. The risk of selective reporting bias was considered low. See Appendix 6 for additional information.
RCT Study Results for Remote Monitoring of Pacemakers
Participant Withdrawal
In the remote monitoring group, 8% to 14% of the participants withdrew from the study, compared with 9% to 14% in the non-remote monitoring group.51,53 Reasons for withdrawal commonly included withdrawal of consent, need for device revision or replacement, and loss to follow-up. We could not determine whether the reasons for withdrawal differed between the two groups. None of the studies reported any crossovers between the study groups.
Remote Monitoring System Data Transmission
One study reported that the mean data transmission rate was 87% (SD 18).51 In this study, only 5 (2%) participants did not transmit any data during the 12-month study follow-up.51 In a short-term 1-month study, no data were transmitted in 12 (6.5%) patients due to improper use of the transmitter; i.e., it was turned off or out of reach in 10 patients and 2 patients reported unmanageable stress caused by the remote monitoring system.55 The study reported that remote monitoring was successfully implemented and operational in 346 (91%) patients.55
Arrhythmias
The study by Amara et al51 in patients without a known history of atrial arrhythmias evaluated the atrial tachyarrhythmia burden within a 12 month follow-up period. The percentage of patients with atrial tachyarrhythmias (episodes lasting >6 hours per day) was not significantly different between the two groups at 28% (83) and 22% (66) in the remote and non-remote monitoring groups, respectively (P = 0.06).51 The mean percentage of time spent in a day at an atrial rate above the programmed value (i.e., atrial tachyarrhythmia burden) was statistically significantly lower in the remote compared to the non-remote monitoring group (mean 8% [SD 26] vs. 28% [SD 43], P = .04).51 The difference between the two groups became statistically significant at 9 months of follow-up.51 In the study by Lima et al52 that followed elderly patients without a history of atrial fibrillation for 24 months, the rate of occurrence of atrial fibrillation did not differ between the two groups, at

Clinical Evidence October 2018
Ontario Health Technology Assessment Series; Vol. 18: No. 7, pp. 1–199, October 2018 44
24% and 19.3% in the remote and non-remote monitoring groups, respectively (P = 0.36). Similarly, the rate of recurrence of atrial fibrillation did not differ between groups, at 16% for first recurrence.52 The mean number of daily atrial fibrillation burden > 10% was lower in the remote compared with the non-remote monitoring group, 16 (95% CI 8.9–23.2) versus 51.2 (95% CI 21.9–81.9), respectively (P = 0.028).52
Time to Detection and Treatment of Arrhythmias
Amara et al51 reported that, among participants with an untreated atrial tachyarrhythmia, the median time between the pacemaker implantation and the first treated atrial tachyarrhythmia was shorter in the remote monitoring group compared to the non-remote monitoring group (mean 114 days [interquartile range (IQR) 44–241] vs. 224 days [IQR 67–366], HR 0.56 [95% CI 0.37–0.86]). The authors theorized that the shorter time to diagnosis and treatment of atrial fibrillation may explain the reduction in atrial tachyarrhythmia burden observed starting at 9 months of follow-up.51 Lima et al52 reported that the median time for atrial fibrillation detection (either occurrence or recurrence) was shorter in the remote versus non-remote monitoring group; i.e., 111 versus 196 days, respectively (P < .001). When evaluated separately, the median time for detection of occurrence was not statistically significantly different between the groups however, the median time for detection of recurrence was shorter in the intervention group, 54 days versus 100 days, respectively (P = .004).52
Time to Medical Interventions
In the study by Mabo et al,53 the median time to a medical intervention was shorter in the remote monitoring group (median 17 days [IQR 4–48]), compared with the non-remote monitoring group (139 days [IQR 33–201]). The difference between the groups was statistically significant, −117 days (95% CI −49 to −184, P = 0.001).53 The types of medical interventions were not specified in the study.
Stroke
Based on the results of three studies, between 0.7% and 2% of patients in the remote monitoring group and 0 and 2.3% of patients in non-remote monitoring group had a stroke within a mean follow-up period of 12 to 17 months.38,51,52 In our meta-analysis, the difference between the two groups was not statistically significant (Figure 9). The number of events was very low (14 strokes in total for both groups), which makes it difficult to interpret the results. One study reported four deaths (1.6%) due to stroke in the non-remote monitoring group, whereas none were reported in the remote monitoring group.53

Clinical Evidence October 2018
Ontario Health Technology Assessment Series; Vol. 18: No. 7, pp. 1–199, October 2018 45
A.
B.
Figure 9: Stroke—RCTs of Remote Monitoring of Pacemakers (A. Risk Ratio; B. Risk Difference)
Sources: Amara et al,51 Lima et al,52 and Perl et al.38
Clinic Visits
In the two studies that evaluated the outcome, there were fewer in-clinic visits in the remote versus the non-remote monitoring group (Table 8).38,53 In the study by Mabo et al,53 the difference between groups became statistically significant after 6 months of follow-up (Table 8). Table 8: Clinic Visits—RCTs of Remote Monitoring of Pacemakers
Author, Year
N (RM/no RM)
Follow-Up, Mean Months (SD)
Number of Clinic Visits
(Scheduled and Unscheduled)
Perl et al, 201338
SAVE-HM
N = 115 (50/65)
17.1 (9.2)
Mean visits/year, (SD)
• RM: 0.29 (0.6)
• No RM: 0.53 (0.5)
P < .001
Mabo et al, 201253
COMPAS
N = 494 (248/246)
18.3 (3.3)
Mean/patient-year (SD; 95% CI)
• RM: 1.04 (1.02; 0.94–1.14)
• No RM: 1.63 (1.12; 1.50–1.76)
Difference became statistically significant after 6 months of follow-up
Abbreviations: CI, confidence interval; RCT, randomized controlled trial; RM, remote monitoring; SD, standard deviation.
Hospitalizations
Based on the results of three studies, there was no statistically significant difference between remote and non-remote monitoring in the percentage of patients with a cardiovascular hospitalization within a mean follow-up of 12 to 18 months (Figure 10).38,51,53 None of the studies reported all-cause hospitalizations.

Clinical Evidence October 2018
Ontario Health Technology Assessment Series; Vol. 18: No. 7, pp. 1–199, October 2018 46
Amara et al51 reported that the length of hospital stay was similar between the remote and non-remote monitoring groups (mean 10 days [SD 14] and mean 11 days [SD 13], although this difference was not statistically significant). Halimi et al55 compared the use of remote monitoring and early hospital discharge after pacemaker implantation with a control group not receiving remote monitoring and with hospital discharge according to clinical practice. In their study, 160 (87%) remote monitoring participants and 57 (29%) non-remote monitoring participants were discharged from hospital either on the day of or the day after implantation.55 The mean length of stay for the pacemaker implantation procedure was shorter in the remote versus non–remote monitoring group by study design (mean 3.2 days [SD 3.2] vs. mean 4.8 days [SD 3.7], respectively, P < .001.55 A.
B.
Figure 10: Patients With Cardiovascular Hospitalizations—RCTs of Remote Monitoring of
Pacemakers (A. Risk Ratio; B. Risk Difference)
Sources: Amara et al,51 Mabo et al,53 and Perl et al.38
Adverse Events
Two non-inferiority trials evaluated the rate of major adverse events.53,55 In Mabo et al,53 major adverse events included death or hospitalizations for complications due to either the pacing system or a cardiovascular event occurring within 18 months of follow-up. No statistically significant difference in the number of patients experiencing the composite end point was observed between the two groups; i.e., 43 (17.3%) and 47 (19.1%) of patients in the remote and non–remote monitoring groups, respectively (HR: 0.90 [95% CI 0.59–1.41]).53 This result satisfied the study’s a priori non-inferiority hypothesis. The test for interaction was not statistically significant when stratified by age, sex, indication, ejection fraction, and underlying heart disease. Halimi et al55 evaluated the occurrence of major adverse events evaluated the occurrence of major adverse events, including death, prolongation of hospitalization for peri- or postoperative complications, and readmission to hospital within 1 month of follow-up. A total of 17 (9.2%)

Clinical Evidence October 2018
Ontario Health Technology Assessment Series; Vol. 18: No. 7, pp. 1–199, October 2018 47
patients in the remote monitoring group and 26 (13.3%) patients in the non-remote monitoring group experienced at least one major adverse event during the 1 month of follow-up.55 The difference between the two groups was not statistically significant (RD −0.041, P = 0.98), confirming the noninferiority hypotheses of the study.55 The rate of serious and non-serious adverse events (e.g., lead defects, stroke, hospitalizations) within 12 months of follow-up was not statistically significantly different between remote and non-remote monitoring groups in the study by Perl et al.38
Mortality
Based on the results of two studies, all-cause mortality varied from 5.2% to 7.3% and 4.3% to 5.3% in the remote and non-remote monitoring groups, respectively, after a mean follow-up of 12 to 18 months.51,53 The results of our meta-analysis did not show any statistically significant difference between the two groups (Figure 11). Based on the results of one study, cardiovascular mortality was reported in three (1.2%) and four (1.6%) patients in the remote and non-remote monitoring groups, respectively (not statistically significant).53 A.
B.
Figure 11: All-Cause Mortality—RCTs of Remote Monitoring of Pacemakers (A. Risk Ratio;
B. Risk Difference)
Sources: Amara et al51 and Mabo et al.53
Quality of Life
Two studies evaluated the patients’ quality of life using the SF-36 questionnaire, one used a
1-month follow-up, the other a 12-month.53,55 Neither study observed a statistically significant
difference between the two groups in the physical, psychological, and overall scores.
Ongoing and Unpublished Randomized Controlled Trials
We are aware of eight RCTs comparing remote versus non-remote monitoring of implanted ICDs and CRT-Ds that have not been published in the peer-reviewed literature13,56-62 Five of

Clinical Evidence October 2018
Ontario Health Technology Assessment Series; Vol. 18: No. 7, pp. 1–199, October 2018 48
these studies have been completed56-59,61 and two were terminated early, one due to slow enrolment60 and the other due to ethical concerns over following patients implanted with CRT-Ds without using the included remote monitoring feature.62 A study by Versteeg et al13 in patients implanted with either an ICD or CRT-D is ongoing and is expected to be completed in December 2017. Additional information is presented in Table 9. One RCT comparing remote versus non-remote monitoring of implanted pacemakers was terminated early due to the increased number of clinic visits by the remote monitoring group.63 The expected completion date for the study was September 2012,63 but we were not able to locate this study publication in the peer-reviewed literature. Table 9: Not Published/Ongoing RCTs—Remote Monitoring of ICDs/CRT-Ds
Author
N (planned)
Follow-Up
Funding Population Outcomes Estimated Date of Study
Completiona
EuroEco CRT
cohort62
N = 312
24 months
Biotronik
• De novo indication
for CRT-D
• Cost analysis (1a.)
• Clinic visits
• Inappropriate ICD shocks
• Quality of life
• Terminated as it was considered
unethical to have patients with
remote monitoring turned off
(last updated June 2017)
Versteeg et al13,64
REMOTE-CIED
N = 600
24 months
Research grant by Boston Scientific
• First-time
implantation of ICD
or CRT-D
• Patient reported health status and
device acceptance (1a.)
• Patient satisfaction with care
• Mortality
• Inappropriate ICD therapy
• Clinic visits
• Hospitalizations
• Cost-effectiveness
• December 2017b
Oliveira et al56,65
PORTLink
N = 200
12 months
Medtronic Research Centre
• Patients with CRT-D
or ICDs
• Satisfaction with remote monitoring
(1a.)
• Quality of life
• Anxiety and Depression
• Adverse events
• Unscheduled visits and reasons
• Successful transmissions
• Physician’s ease of use and
satisfaction with remote monitoring
• Health care resource use
• October 2016 (completed)
Mabo et al57
EVATEL
N = 1,501
12 months
Rennes University Hospital
• Patients with 1st
implantation of a
single or dual
chamber ICD
• Composite major cardiovascular event
(mortality, hospitalization, inappropriate
or ineffective ICD therapy) (1a.)
• Individual events from composite end
point (mortality, etc.)
• Time to events
• Resource use and costs
• May 2011 (completed)
Zabel et al58,66
Monitor-ICD
N = 413
12–24 months
Research collaborator: Biotronik
• Patients undergoing
first implantation of
single- or dual-
chamber ICDs
• Disease-specific costs (1a.) and non-
disease specific costs
• Cardiovascular mortality
• ICD shocks (appropriate/inappropriate)
• Cardiovascular hospitalizations
• Quality of life
• December 2012 (unknown)

Clinical Evidence October 2018
Ontario Health Technology Assessment Series; Vol. 18: No. 7, pp. 1–199, October 2018 49
Author
N (planned)
Follow-Up
Funding Population Outcomes Estimated Date of Study
Completiona
REACT59
N = 220
24 months
St. Jude Medical
• Indication for CRT-D
and ICD
implantation
• Time from event detection to clinical
decision (1a.)
• Time to review data
• Anxiety and depression
• April 2014 (completed)
ANVITE60
N = not reported
27 months
Biotronik
• Indication for single
chamber ICD
• Significant adverse events (death,
hospitalization, inadequate device
therapy) (1a.)
• Mortality
• Clinic visits
• Quality of life
• December 2011 (terminated due
to slow enrolment)
QUANTUM61
N = 148
9 months
Biotronik
• ICD indication for
primary or
secondary
prevention (new
implant)
• Anxiety and depression score (1a.)
• Quality of life
• Frequency of contacts with physician
• Patient’s perception of ICD therapy
• Patient mobility
• October 2012 (completed)
Abbreviations: CRT-D, cardiac resynchronization therapy with defibrillator; ICD, implantable cardioverter-defibrillator. aStatus based on clinicaltrials.gov bOngoing at the time of publication of this analysis.
Quality of the Body of Evidence
The quality of the body of evidence for each outcome was assessed according to the GRADE guidelines.26 Depending on the outcome, the quality of the body of evidence ranged from very low to moderate for studies of remote monitoring of ICDs and CRT-Ds, and from low to high for studies of remote monitoring of pacemakers (Tables 10 and 11).

Clinical Evidence October 2018
Ontario Health Technology Assessment Series; Vol. 18: No. 7, pp. 1–199, October 2018 50
Table 10: GRADE Evidence Profile for Comparison of Remote and Non-Remote Monitoring of ICDs and CRT-Ds
Number of Studies (Design) Risk of Bias Inconsistency Indirectness Imprecision
Publication Bias
Upgrade Considerations Quality
Composite end point (mortality, all-cause/cardiovascular hospitalizations or emergency department visits)
8 (RCTs) No serious limitations
No serious limitations
Serious limitations (−1)a
Serious limitations (−1)b
Likely (−1)c Not applicable ⊕ Very Low
All-cause mortality
12 (RCTs) No serious limitations
No serious limitations
No serious limitations
Serious limitations (–1)b
Likely (−1)c Not applicable ⊕⊕ Low
Patients with inappropriate ICD shocks
4 (RCTs) No serious limitations
No serious limitations
No serious limitations
No serious limitations
Likely (−1)c Not applicable ⊕⊕⊕ Moderate
Number of clinic visits
7 (RCTs) No serious limitations
No serious limitations
No serious limitations
No serious limitations
Likely (−1)c Not applicable ⊕⊕⊕ Moderate
Time to event detection or clinical decision
4 (RCTs) No serious limitations
No serious limitations
No serious limitations
No serious limitations
Likely (−1)c Not applicable ⊕⊕⊕ Moderate
Stroke
2 (RCTs) No serious limitations
No serious limitations
No serious limitations
Very serious limitations (−2)d
Likely (−1)c Not applicable ⊕ Very Low
Patients with heart failure hospitalizations
5 (RCTs) No serious limitations
No serious limitations
No serious limitations
Serious limitations (−1)b
Likely (−1)c Not applicable ⊕⊕ Low
Number of emergency department visits
4 (RCTs) No serious limitations
Serious limitations (−1)e
No serious limitations
Serious limitations (−1)f
Likely (−1)c Not applicable ⊕ Very Low
Quality of life
4 (RCTs) No serious limitations
Serious limitations (−1)g
No serious limitation
Serious limitations (−1)h
Likely (−1)c Not applicable ⊕ Very Low

Clinical Evidence October 2018
Ontario Health Technology Assessment Series; Vol. 18: No. 7, pp. 1–199, October 2018 51
Number of Studies (Design) Risk of Bias Inconsistency Indirectness Imprecision
Publication Bias
Upgrade Considerations Quality
Major adverse events (composite of mortality, cardiovascular, procedural, or device-related adverse events)
3 (RCTs) No serious limitations
No serious limitations
No serious limitations
No serious limitationsi
Likely (−1)c Not applicable ⊕⊕⊕ Moderate
Abbreviations: CRT-D, cardiac resynchronization therapy with defibrillator; ICD, implantable cardioverter-defibrillator; RCT, randomized controlled trial. aThe use of a composite end point affects the generalizability of the results to clinical practice because it is difficult to separate the contribution of each individual component. Each component may have different implications for the study participants.
bAs determined by the lack of statistically significant results and the failure to achieve the minimal information size. cOur search identified seven unpublished completed RCTs. This could affect the results of our meta-analysis. dThe power to detect a difference between the two groups was very low and the number of events reported in the study was very small. eResults were inconsistent across studies. fThree studies did not show a statistically significant difference in the rate of emergency department visits between the two groups. gTwo studies found a statistically significant difference in quality of life and two studies did not find a difference. hNo statistically significant difference in quality of life was reported in two studies and, in one study, a statistically significant difference was only demonstrated in only one of the two quality of life measures. iA statistically significant difference in major adverse events was not observed in any of the three studies. However, since two of the studies were designed as non-inferiority trials and the non-inferiority hypothesis was satisfied in both, we decided not to downgrade for imprecision.

Clinical Evidence October 2018
Ontario Health Technology Assessment Series; Vol. 18: No. 7, pp. 1–199, October 2018 52
Table 11: GRADE Evidence Profile for Comparison of Remote and Non-Remote Monitoring of Pacemakers
Number of Studies (Design) Risk of Bias Inconsistency Indirectness Imprecision Publication Bias
Upgrade Considerations Quality
Major adverse events: (Composite of mortality, or hospitalizations due to cardiovascular, device, or implant-procedure complications)
2 (RCTs) No serious limitations
No serious limitations
No serious limitations
No serious limitationsa
Undetected Not applicable ⊕⊕⊕⊕ High
All-cause mortality
2 (RCTs) No serious limitations
No serious limitations
No serious limitations
Very serious limitations (−2)b
Undetected Not applicable ⊕⊕ Low
Arrhythmia burden
2 (RCTs) No serious limitations
No serious limitations
No serious limitations
No serious limitations
Undetected Not applicable ⊕⊕⊕⊕ High
Time to detection and treatment of arrhythmias
2 (RCTs) No serious limitations
No serious limitations
No serious limitations
No serious limitations
Undetected Not applicable ⊕⊕⊕⊕ High
Stroke
3 (RCTs) No serious limitations
No serious limitations
No serious limitations
Very serious limitations (−2)b
Undetected Not applicable ⊕⊕ Low
Clinic visits
2 (RCTs) No serious limitations
No serious limitations
No serious limitations
No serious limitations
Likely (−1)c Not applicable ⊕⊕⊕ Moderate
Cardiovascular hospitalizations
3 (RCTs) No serious limitations
No serious limitations
No serious limitations
Serious limitations (−1)d
Undetected Not applicable ⊕⊕⊕ Moderate
Quality of life
2 (RCTs) No serious limitations
No serious limitations
No serious limitations
Serious limitations (−1)e
Undetected Not applicable ⊕⊕⊕ Moderate
Abbreviations: RCT, randomized controlled trial. aAlthough no statistically significant differences were observed between groups, both RCTs were designed as non-inferiority trials and the results obtained satisfied the studies’ hypotheses; i.e. the P value for non-inferiority between groups was statistically significant. Therefore, we did not consider imprecision to be a serious limitation, bThe power to detect a difference between the two groups was very low and the number of events reported in the studies was very small. cOne unpublished RCT was terminated because of the increased number of clinic visits in the remote monitoring group.63 This may affect the results for this outcome. dThe results were not statistically significant and the optimal information size was not met. eNo statistically significant differences in quality of life were identified between the two groups.

Clinical Evidence October 2018
Ontario Health Technology Assessment Series; Vol. 18: No. 7, pp. 1–199, October 2018 53
Discussion
Remote monitoring of ICDs, CRTs, and pacemakers allows the transfer of data from the implanted device remotely from the person’s home to a central database where the data are made available to authorized clinic personnel. Our systematic literature review suggests that the use of remote monitoring of ICDs and CRT-Ds plus clinic visits may result in a decrease in the number of inappropriate ICD shocks, a decrease in the total number of clinic visits, and a shorter time for the physician to detect a medical event and act upon it, without increasing the risk of major adverse events and mortality when compared to standard clinic follow-up. There was no statistically significant difference between the two groups for stroke and hospitalization, either cardiovascular or all-cause. The results for emergency department visits were inconsistent across studies. One study showed a decrease in the number of visits, but in three other studies, the differences were not statistically significant. According to experts, the shorter time to detect abnormalities as a result of alerts from the remote monitoring system is relevant, as it may lead to earlier treatment of important medical events, and to the discovery and correction of device issues that are potentially life-threatening. This is corroborated by Varma et al.42 Multiple ICD shocks are a major cause of discomfort, anxiety, and depression.37 They affect the patient’s quality of life37 and, in case of inappropriate shocks, may increase the risk of death if triggered by supraventricular tachyarrhythmia.15 According to Guedon-Moreau et al,15 the reduction in inappropriate ICD shocks in the remote monitoring group may have been due to early warning by the remote monitoring system of events that can trigger multiple inappropriate shocks. Once alerted by the system, health care providers can act to prevent recurrence of inappropriate shocks.15 Only Hindricks et al35 showed a statistically significant difference in mortality and in the composite end point, but this study had unique design elements.35 For instance, they limited participants to patients who complied with remote data transmission during a pre-randomization phase. Also, clinic visits were scheduled according to the physician’s discretion. In all other studies, study protocol dictated that clinic visits be scheduled less frequently in the remote monitoring group than in the non-remote monitoring group. According to the authors, close monitoring of the patients through remote monitoring, telephone contacts, and clinic visits, and the fact that the suboptimal cardiac resynchronization therapy function was monitored may have contributed to the positive results. 35 However, we cannot determine whether this explains the difference in the results in this study. Most of the ICD and CRT-D studies identified were designed to evaluate a composite end point that typically included mortality (either all-cause or cardiovascular only) and/or hospitalizations or emergency department visits. The studies were not powered to evaluate individual outcomes such as mortality, stroke, clinic visits, hospitalizations, or shocks, so results should be interpreted with caution. In the pacemaker studies, the time to detection and treatment of atrial arrhythmias was reduced in the group remotely monitored; a factor that, according to Amara et al51 and Lima et al,52 may help explain the lower burden of atrial arrhythmias observed in this group compared with patients without remote monitoring. There were fewer clinic visits with remote monitoring without an increase in the risk of major adverse events (mortality, stroke, and hospitalization) compared
Clinical Evidence October 2018
Ontario Health Technology Assessment Series; Vol. 18: No. 7, pp. 1–199, October 2018 54
to the non-remote monitoring group. No statistically significant difference in the safety composite end point consisting of death and hospitalization was observed by Mabo et al53 or Halimi et al,55 which satisfied their non-inferiority hypothesis. Reported issues with remote data transmission did not seem substantial and often resulted from connection problems or improper set up of the home monitor. However, since very few studies provided this type of information, it is difficult to draw conclusions regarding the extent of transmission gaps. The studies by Morgan et al,28 Bohm et al,31 and Hindricks et al35 stratified the results by some of the PROGRESS-Plus categories such as age and sex, and they did not find a difference in the effects of remote monitoring in these sub-groups. According to some authors, the effects of remote monitoring depend not just on the remote transmission of data and alerts, but also on the physician’s reaction to the information received.31,35 The effectiveness and safety of remote monitoring compared with non-remote monitoring was not evaluated in acute phases, including shortly after device implantation, as the device battery is nearing the end of its expected life, or when there is a device/lead advisory. The results of seven large completed studies on remote monitoring of ICDs or CRT-Ds, (planned to have 148–1,500 participants per study) and one planned study on remote monitoring of pacemakers63 have not been published in the peer-reviewed literature, which precludes their inclusion in our analyses.13,56-62 It is not possible to determine whether their inclusion would corroborate our findings or change our conclusions.
Conclusions
In people implanted with ICDs and CRT-Ds, remote monitoring plus clinic visits compared with clinic visits alone:
• Reduced the number of clinic visits, the number of people with inappropriate ICD shocks, and the time from medical event onset to both detection by the physician and clinical action (GRADE: Moderate)
• Did not increase the risk of major adverse events (GRADE: Moderate), mortality (GRADE: Low), stroke (GRADE: Very Low), or hospitalizations due to heart failure (GRADE: Low)
In people implanted with permanent pacemakers, remote monitoring plus clinic visits compared with clinic visits alone:
• Had a shorter time to detection and treatment of arrhythmias (GRADE: High), a lower burden of arrhythmias (GRADE: High), and fewer clinic visits (GRADE: Moderate)
• Did not increase the risk of major adverse events (GRADE: High), mortality (GRADE: Low), stroke (GRADE: Low), or cardiovascular hospitalizations (GRADE: Moderate)

October 2018
Ontario Health Technology Assessment Series; Vol. 18: No. 7, pp. 1–199, October 2018 55
ECONOMIC EVIDENCE
Research Question
Based on the published literature, what is the cost-effectiveness of remote monitoring of adults implanted with ICDs, CRTs, or permanent pacemakers plus clinic visits compared with clinic visits alone?
Methods
Economic Literature Search
We performed an economic literature search on June 2, 2017, for studies published from January 1, 2010, to the search date. Methodological filters were applied to the clinical search to limit retrieval to economic evaluations, cost, quality of life, and health utilities studies.67 Database auto-alerts were created in MEDLINE, Embase, and CINAHL and monitored for the duration of the HTA review. We performed targeted grey literature searching of HTA agency sites, clinical trial registries, and Tufts Cost-Effectiveness Analysis Registry. See Clinical Evidence, Literature Search above, for further details on methods used, and Appendix 3 for Literature Search Strategies, including all search terms.
Literature Screening
A single reviewer reviewed titles and abstracts and obtained full-text articles for citations likely to meet the eligibility criteria.
Inclusion Criteria
• English-language full-text publications
• Published between January 1, 2010, and June 2, 2017 (update since previous Health Quality Ontario health technology assessment. Note that no economic studies were identified in the previous assessment)19
• Adults implanted with ICDs, CRT-Ps, CRT-Ds, and permanent pacemakers
• Remote monitoring (in lieu of clinic visits or in combination with clinic visits)
• Cost-utility, cost-effectiveness, cost-benefit, or cost-minimization studies
Exclusion Criteria
• Cost analyses
• Cost-consequence analyses
• Studies evaluating transtelephonic monitoring, unless used as a comparator for remote monitoring
• Studies evaluating hemodynamic monitoring (devices that measure intercardiac pressures, pulmonary artery pressure, etc.)
• Studies evaluating algorithms or the accuracy of detecting clinical and device system alerts

Economic Evidence October 2018
Ontario Health Technology Assessment Series; Vol. 18: No. 7, pp. 1–199, October 2018 56
Outcomes of Interest
• Incremental costs, incremental effectiveness outcomes, incremental quality-adjusted life-years (QALYs), incremental cost-effectiveness ratio (ICER), and incremental net benefit
Data Extraction
We extracted relevant data on the following:
• Source (i.e., name, location, year)
• Population and comparator
• Interventions
• Outcomes (i.e., health outcomes, costs, and incremental cost-effectiveness ratio)
Authors were contacted for more information for clarification of methods and results as needed. We present original cost figures, without converting to the same currency or inflating to the same year.
Study Applicability and Methodological Quality
We determined the usefulness of each identified study for decision-making by applying a modified methodology checklist for economic evaluations developed by the National Institute for Health and Care Excellence (NICE) in the United Kingdom. The original checklist is used to inform development of clinical guidelines by NICE.68 We modified the wording of the questions to remove references to guidelines and to make it Ontario specific. The first section of the checklist assessed applicability to the research question, whereby studies could be directly applicable, partially applicable, or not applicable. The second section of the checklist assessed methodological quality, whereby studies could have minor limitations, potentially serious limitations, or very serious limitations.
Results
Literature Search
The literature search yielded 357 citations published between January 1, 2010, and June 2, 2017, after duplicates were removed. We excluded a total of 344 records based on information in the title and abstract. We then obtained the full-texts of 13 potentially relevant records for further assessment. Figure 12 presents the flow diagram for the Preferred Reporting Items for Systematic Reviews and Meta-analyses (PRISMA).

Economic Evidence October 2018
Ontario Health Technology Assessment Series; Vol. 18: No. 7, pp. 1–199, October 2018 57
Figure 12: PRISMA Flow Diagram—Economic Search Strategy
Source: Adapted from Moher et al.27
A total of five studies were included in the economic evidence review, two of which were identified from database searching,69,70 two from grey literature searching,71,72 and one from hand searching reference lists of included studies.73 One study identified in the grey literature was an update of another study;71,72 therefore, we present their results together.
Review of Included Economic Studies
Table 12 summarizes the results of the included studies. Cost-utility results were reported in three studies, of which two were trials.69,70 The third was a decision tree.73 Exploratory cost-effectiveness results were reported in one study, with outcomes measured in life-years.71 Cost-minimization results were reported in two studies.71,72 Model structures of the cost-minimization
Records identified through database searching (n = 514)
Sc
ree
nin
g
Inclu
de
d
Eli
gib
ilit
y
Iden
tifi
cati
on
Additional records identified through other sources (n = 7)
Records after duplicates removed (n = 357)
Records screened (n = 357)
Records excluded (n = 344)
Full-text articles assessed for eligibility (n = 13)
Full-text articles excluded (n = 8)
• No full-texts (n = 5)
• Cost-consequence (n = 1)
• Irrelevant intervention (n = 1)
• Case study (n = 1)
Studies included in synthesis (n = 5)

Economic Evidence October 2018
Ontario Health Technology Assessment Series; Vol. 18: No. 7, pp. 1–199, October 2018 58
and cost-effectiveness analyses were not reported. We were unable to obtain more information from the authors. Results varied across the analyses. Several (n = 3) concluded remote monitoring in combination with clinic visits was cost-saving and had similar health outcomes compared to clinic visits alone.69,71,72 Two analyses concluded remote monitoring in combination with clinic visits was dominant—that is, it provided health gains at a lower cost.70,73 One exploratory cost-effectiveness analysis concluded that remote monitoring in combination with clinic visits may be cost-effective—that is, it provided health gains at a higher cost (ICER = $26,269.70 AUD per life-year gained).71

Economic Evidence October 2018
Ontario Health Technology Assessment Series; Vol. 18: No. 7, pp. 1–199, October 2018 59
Table 12: Results of Economic Literature Review: Summary, Remote Monitoring of Cardiac Implantable Electronic Devices With Clinic Visit Versus Clinic Visit Alone
Name, Year, Location
Analytic Technique, Study
Design, Perspective, Time
Horizon Population Interventions, Comparators
Results
Health Outcomes Cost Cost-Effectiveness
Ricci et al,69 2017, Italy
• CUA
• Trial-based (TARIFF: prospective, non-randomized, multicentre clinical trial)
• Italian national health care payer
• 12 mo
Patients implanted with St. Jude Medical implants (included single chamber ICD, dual chamber ICD, CRT-D) Mean age ≈ 69 years
Male = 85%
RM combination Clinic visit at enrollment and after 12 mo + RM interrogations at 3, 6, and 9 mo + response to predefined technical and clinical alerts Clinic visit only At 3, 6, 9, and 12 mo
RM combination 0.87 ± SD 0.13 QALYs Clinic visit only 0.85 ± SD 0.17 QALYs Difference P = 0.53 No discounting (trial-based). EQ-5D-3L administered at baseline and at 12 mo; imputed
RM combination €482.87 ± SD 2,488.10 per person per year Clinic visit only €1,044.89 ± SD 1,990.47 per person per year Adjusted difference −€1,053.41; P = 0.0149; adjusted for baseline characteristics EUR (Year NR) No discounting
Cost-saving (no ICER calculated because QALYs were similar at a lower cost) Scenario analysis (assumed an additional tariff for RM combination): cost-saving
Zanaboni et al,70 2013, Italy
• CUA
• Trial-based (EVOLVO multicentre RCT)
• Italian national health care payer
• 16 mo
Heart failure patients implanted with Medtronic CareLink home monitor defibrillators (ICD, CRT-D) Median age ≈ 66 to 69 yr
Male = 79%
RM combination Clinic visits at 8 and 16 mo + RM interrogations at 4 and 12 mo Clinic visit only At 4, 8, 12, and 16 mo
RM combination 1.032 ± SD 0.177 QALYs Clinic visit only 0.966 ± SD 0.231 QALYs Mean difference −0.066 QALYs (95% CI: −0.126 to −0.005); P = 0.03 No discounting (trial based) EQ-5D administered at baseline and 16 mo; imputed
RM combination €1,962.78 per person per year Clinic visit only €2,130.01 per person per year Mean difference −€167.23 (95% CI: −1,158.61 to −1,493.06); P = 0.80 EUR (2010) No discounting (trial based)
Dominant (based on deterministic analysis) Scenario analysis (assumed an additional annual device fee to manufacturers): dominant

Economic Evidence October 2018
Ontario Health Technology Assessment Series; Vol. 18: No. 7, pp. 1–199, October 2018 60
Name, Year, Location
Analytic Technique, Study
Design, Perspective, Time
Horizon Population
Interventions, Comparators
Results
Health Outcomes Cost Cost-Effectiveness
Klersy et al,73 2011, USA, Italy, France, Germany, UK
• CUA and CEA
• Decision treea • European and
American national health care payers
• 12 months
Heart failure patients (from RCTs) with implants Age = NR Male = NR
RM Frequency of interrogations not defined; included (i) telephone monitoring; and (ii) technology-assisted monitoring (external monitors and implants) Note: RM definition broader than in present review (also included telephone monitoring and remote external monitors). Sensitivity analysis separated out technology-assisted monitoring from telephone monitoring Clinic visit only Frequency not defined
Mean difference 0.06 QALYsb
RM (assuming median DRG across five countries) €1,007.17 Clinic visit only €1,458.66 EUR (Year NR) No discounting (short time horizon)
Dominant (outcomes calculated without decision tree) Sensitivity analysis: NR

Economic Evidence October 2018
Ontario Health Technology Assessment Series; Vol. 18: No. 7, pp. 1–199, October 2018 61
Name, Year, Location
Analytic Technique, Study
Design, Perspective, Time
Horizon Population
Interventions, Comparators
Results
Health Outcomes Cost Cost-Effectiveness
Medical Services Advisory Committee
201471
and
2016 update,72, Australia
• CMA
• Model NR
• Australian national health care payer
• 12 mo
Patients implanted with Biotronik CardioMessenger implants (PM, ICD, CRT). Indications included patients at risk for sudden cardiac death, patents with chronic heart failure (except NYHA IV) Age = NR Male = NR
RM combination Clinic visit annually + RM interrogations every 3 mo + response to alerts for arrhythmia, device function, or lead parameters (reviewed by cardiologist) Clinic visit only Every 6 mo for patients with pacemakers; every 3 mo for patients with ICDs or CRT devices (seen by cardiologist or technician)
Assumed non-inferiority 2014 NR 2016 Update RM combination $8,611 per new patient implanted with ICD or CRT-D per year Clinic visit only $8,960 per new patient per year AUD (Year NR) No discounting (short time horizon)
2014 Cost-saving: annual savings of $19.51 per person implanted with ICD or CRT; annual savings of $0.71 per person implanted with PM 2016 Update Cost-saving for implanted ICD or CRT-D: $349 per new patient Cost-saving for ongoing costs of RM (included generator replacement costs): $92.11 per patient
• CEA (exploratory)
• Model NR
• Australian national health care payer
• 5 yr
Same as above Same as above Mean difference
0.1142 life years
Extrapolated 12-mo survival data from IN-TIME trial to 5 yr
2014 only
Mean difference
Equal to cost of remote transmitter (redacted)
No discounting
2014 only
$26,269.70 per life-year gained
Abbreviations: AUD, Australian dollar; CEA, cost-effectiveness analysis; CMA, cost-minimization analysis; CRT-D, cardiac resynchronization therapy defibrillator; CUA, cost-utility analysis; DRG, diagnosis-related group: EQ-5D, EuroQol five dimensions questionnaire; EUR, Euro; ICD, implantable cardioverter defibrillator; ICER, incremental cost-effectiveness ratio; NR, not reported; NYHA, New York Heart Association Functional Classification; PM, pacemaker; QALY, quality-adjusted life year; RCT, randomized controlled trial; RM, remote monitoring. aStudy presented a decision tree but did not appear to have transition probabilities. bThe study used a crude calculation to obtain QALY without a decision tree.

Economic Evidence October 2018
Ontario Health Technology Assessment Series; Vol. 18: No. 7, pp. 1–199, October 2018 62
Applicability of the Included Studies
Table A11 (see Appendix 8) shows the assessment of applicability for the included studies. None evaluated remote monitoring from the perspective of the Ontario or Canadian public health care payer. Studies took the perspective of health care payers from Italy (n = 2),69,70 Australia (n = 2),71,72 or a grouping of European countries plus the United States.73 Two studies focused specifically on heart failure patients with cardiac implantable electronic devices,70,73 rather than patients implanted with CIEDs for any indication, as in the present review. Four studies examined remote monitoring in combination with clinic visits.69-72 The remaining study was unclear on whether the intervention was remote monitoring alone or remote monitoring in combination with clinic visits.73 As a result, all the studies were deemed partially applicable.
Methodological Quality of the Included Studies
Table A12 (see Appendix 8) shows the assessment of methodological quality. Of the three modelling studies,71-73 only one presented a model structure.73 Even so, the decision tree model did not inform QALY calculations (only cost calculations), nor did it likely capture the natural history of heart failure after implantation. Trial-based studies had follow-up times of between 12 and 16 months.69,70 Model-based studies used a time horizon of 12 months,71-73 but one considered a time horizon of 5 years in an exploratory analysis.71 Data were extrapolated from the only RCT to date that showed a survival benefit associated with remote monitoring (IN-TIME).35 Studies did not adequately examine parameter or structural uncertainty. Only two studies conducted a scenario analysis that assumed additional device or follow-up costs.69,70 The authors of three studies either received consultancy fees from the device manufacturers or were employees of the manufacturers.69,70,73 The remaining two reports were from a national agency that based its assessment on manufacturer-submitted models.71,72 Overall, four studies69-72 had potentially serious limitations, and one study73 had very serious limitations.
Discussion
The published literature on the cost-effectiveness of remote monitoring plus clinic visits compared to clinic visits alone for people with a cardiac implantable electronic device favoured remote monitoring. Conclusions varied from remote monitoring being dominant, to being cost-saving, to being potentially cost-effective. The high heterogeneity may be due to differences in study design, setting, patient population, cost parameters, follow-up time, and/or modelling of the treatment effect of remote monitoring. The main strengths of the included studies were the inclusion of relevant costs and some key health outcomes such as safety and clinical events. There were many limitations to the included studies. Trial-based studies were limited by the short follow-up time (≤16 months). Model-based studies were limited by the inconclusive clinical evidence of remote monitoring on resource use and health-related quality of life. Various randomized controlled trials noted either improvement or equivalence of remote monitoring plus clinic visits compared to clinic visits alone in terms of mortality, hospitalizations, length of stay, emergency department visits, outpatient visits, and patient satisfaction, among others. This inconclusiveness of clinical evidence adds uncertainty to economic modelling, which was also noted in an assessment by the Belgian Health Care Knowledge Centre in 2010.1 The included model-based studies did not conduct sensitivity analyses, sufficient scenario analyses, or probabilistic analyses to account for uncertainty in model parameters, model structure, or methodological assumptions. The quality of trial- and model-based studies was difficult to fully assess given the limited reporting of methods and results.

Economic Evidence October 2018
Ontario Health Technology Assessment Series; Vol. 18: No. 7, pp. 1–199, October 2018 63
Overall, given these limitations, as well as the lack of Canadian studies and lack of generalizability of study results, we decided to conduct an analysis for the Ontario population (see Primary Economic Evaluation, below).
Conclusions
Five economic evaluation studies were identified in people with cardiac implantable electronic devices comparing remote monitoring plus clinic visits with clinic visits alone. However, there were no Canadian studies and these five studies were not directly applicable to Ontario. For this reason, we conducted an economic evaluation comparing remote monitoring plus clinic visits to clinic visits alone among people with cardiac implantable electronic device.

October 2018
Ontario Health Technology Assessment Series; Vol. 18: No. 7, pp. 1–199, October 2018 64
PRIMARY ECONOMIC EVALUATION
The published economic evaluations identified in the literature review addressed remote monitoring plus clinic visits compared with clinic visits alone; however, none were conducted using a Canadian/Ontarian perspective. Further, cost-effectiveness results varied based on inconsistent clinical evidence on outcomes and resource use. For these reasons, we conducted an economic evaluation comparing remote monitoring plus clinic visits to clinic visits alone for people with cardiac implantable electronic devices. In the primary economic evaluation and budget impact analysis that follow, “remote monitoring” includes two aspects12:
• Automated transmission of data based on a manufacturer-specific schedule, and clinician-configured clinical/device alerts; and
• Remote interrogation (routine, scheduled device checkup structured to mirror a clinic visit)
Remote monitoring does not include remote programming (changing the operating parameters of the device to optimize system performance; e.g., pacing features). While the remote programming feature is available in some devices, it is not yet clinically implemented for safety reasons.11,74 As of 2017, programming is performed only in-clinic by health care practitioners. The definition of remote monitoring varies in the literature. In some cases, remote monitoring is defined as above, including both the automated transmission and remote interrogation aspects. In other cases, remote monitoring includes only automated transmission.12
Research Questions
Within the context of the Ontario Ministry of Health and Long-Term Care:
• What is the cost-effectiveness of remote monitoring plus clinic visits in comparison with clinic visits alone in adult ICD and CRT-D recipients with heart failure?
• What is the cost-effectiveness of remote monitoring plus clinic visits in comparison with clinic visits alone in adult pacemaker recipients with arrhythmia?
Methods
The information presented follows the reporting standards set out by the Consolidated Health Economic Evaluation Reporting Standards Statement.75
Type of Analysis
We developed a cost-utility analysis using a state transition Markov cohort model to capture measures of patient preferences (utilities) associated with remote monitoring. Main outcomes were mean quality-adjusted life-years and mean costs.
Target Population
We conducted our reference case analyses in two populations. The populations were identified based on RCT data in the clinical evidence review and confirmed by expert consultations.

Primary Economic Evaluation October 2018
Ontario Health Technology Assessment Series; Vol. 18: No. 7, pp. 1–199, October 2018 65
The first study population comprised adult patients with heart failure implanted with ICDs or CRT-Ds. Based on RCTs and expert opinion, we modelled the following demographics to broadly represent this patient population.
• Mean age: 65 years
• Sex distribution: 70% males
• Functional status: NYHA class II Rationale: The majority of RCTs recruited and reported the results of ICD and CRT-D recipients together. The majority of these RCTs recruited patients with heart failure exclusively or recruited a sample that included heart failure. The demographics of trial participants were similar to those found in the Ontario ICD Registry.76-78 The “average” NYHA class among de novo recipients in the Ontario registry was class II (see calculations in Appendix 9, Target Population). The second study population comprised adults with arrhythmia implanted with pacemakers. Based on RCTs and expert opinion, we modelled the following demographics to broadly represent this patient population.
• Mean age: 70 years
• Sex distribution: 65% males Rationale: The included pacemaker RCTs recruited patients with a broad range of arrhythmia indications: sinus node dysfunction, heart block (including atrioventricular block, bundle branch block), bradycardia, and tachycardia. We did not model CRT-P recipients because no trials in this population were identified in the clinical review.
Perspective
We conducted this analysis from the perspective of the Ontario Ministry of Health and Long-Term Care.
Intervention
Based on the latest Canadian position paper on remote monitoring11 (see Appendix 9, Intervention), we modelled patients who are in the maintenance phase (3 months after successful device implementation). We compared a blended model of remote monitoring plus clinic visits (1:1 ratio) versus clinic visits alone. Table 13 summarizes the interventions evaluated in the economic model.

Primary Economic Evaluation October 2018
Ontario Health Technology Assessment Series; Vol. 18: No. 7, pp. 1–199, October 2018 66
Table 13: Disease Interventions and Comparators Evaluated in the Primary Economic Model
Interventions11 Comparators Patient Population Outcomes
RM blended with clinic visits in a 1:1 ratio
Alternate assessments every 6 mo
Clinic visits alone
- Assessments every 6 mo
Adults with heart failure implanted with ICDs or CRT-Ds
- Mean age: 65 years
- 70% males
- NYHA class II
- Mortality - Health care use - Health-related quality of life - Costs
RM blended with clinic visits in a 1:1 ratio
Alternate assessments every 12 mo
Clinic visits alone
- Assessments every 12 mo
Adults with arrhythmia implanted with pacemakers
- Mean age: 70 years
- 65% males
- Mortality - Health care use - Health-related quality of life - Costs
Abbreviations: CRT-D, cardiac resynchronization therapy defibrillator; ICD, implantable cardioverter defibrillator; NYHA, New York Heart Association functional class; RM, remote monitoring.
Remote monitoring comprised automated data transmission that occurred throughout the maintenance phase and remote interrogations that occurred according the following schedules for ICD and CRT-D recipients (Figure 13) and pacemaker recipients (Figure 14)11:
Figure 13: Blended Model of Remote Monitoring Plus Clinic Visits: Schedule of ICD and CRT-D Recipients, as per the Latest Canadian Recommendations11

Primary Economic Evaluation October 2018
Ontario Health Technology Assessment Series; Vol. 18: No. 7, pp. 1–199, October 2018 67
Figure 14: Blended Model of Remote Monitoring Plus Clinic Visits: Schedule of Pacemaker Recipients, as per the Latest Canadian Recommendations11
According to clinical experts, centres followed the recommended Canadian remote monitoring schedule for ICD and CRT-D recipients. Centres often did not put pacemaker recipients on remote monitoring, but when they did, the recommended remote monitoring schedule was followed. When patients experienced a major clinical event, clinical experts did not interrupt remote monitoring, but used remote monitoring to closely monitor them. Hence, the model assumed no remote monitoring suspension.
Discounting and Time Horizon
After a year, an annual discount rate of 1.5% was applied to both cost and quality-adjusted life-years in the model, as per Canadian guidelines.79 Discount rates of 0%, 3%, and 5% were applied in the sensitivity analysis. The time horizon in the reference case was 5 years. This is also the approximate lifespan of the device battery (pulse generator).80,81 Battery replacements were, therefore, not captured in this model. To explore the potential impact of battery replacements on the cost-effectiveness of RM, we explored a longer time horizon in a scenario analysis of 10 years (the life expectancy of an ICD recipient).80 Battery replacement is a surgical procedure that does not require entering the chest cavity. Leads are disconnected from the old pulse generator and reconnected to a new pulse generator placed in the same location (under the skin or chest wall muscles). Remote monitoring does not appear to significantly drain battery life and does not affect time to replacement or rates of replacement.37,82 This scenario analysis assumed intervention effects from existing RCTs were maintained over the 10-year period despite RCT follow-up times being much shorter (e.g., ≤27 months in the REFORM trial).83
Main Assumptions
The major assumptions for this model are:
• Implantable devices from different manufacturers are equivalent
• Single- and dual-chamber devices (for ICDs and pacemakers) have the same effectiveness8,35,84,85

Primary Economic Evaluation October 2018
Ontario Health Technology Assessment Series; Vol. 18: No. 7, pp. 1–199, October 2018 68
• There is no crossover between remote monitoring and non-remote monitoring (i.e., participants do not switch between intervention arms)
We excluded the following events that are equally likely to occur in either intervention arm (and therefore would cancel out if included):
• Lead recalls/ revisions (i.e., lead malfunctions that require surgical revision)
• Deactivation
• Upgrade of device (i.e., from CRT-P to CRT-D; from CRT-P to ICD)
• Downgrade of device (i.e., from CRT-D to CRT-P)
• Surgical or device complications—we assume that complications are most likely to occur before the maintenance phase
• Explantation—we assume the procedure would have occurred before the maintenance phase
• Re-implantation attempts—we assume the procedure would have occurred before the maintenance phase
• Medications—patients with heart failure or with stable arrhythmia would continue their medications regardless of remote or non-remote follow-up. Other therapies, such as rehabilitation after stroke, would be usual care regardless of follow-up. Based on the clinical review, intervention arms did not differ with statistical significance for worsening of heart failure or for number of strokes. We assumed medications would also not differ between arms
Model Structure/Structure of the Analysis
We developed a state transition Markov model that follows patients during the maintenance phase (3 months after successful implantation). The two model populations were: (1) ICD and CRT-D recipients with heart failure (Figure 15), and (2) pacemaker recipients with arrhythmia (Figure 16). The full structures are shown in Figures A1 to A7 (see Appendix 9, Model Structure).

Primary Economic Evaluation October 2018
Ontario Health Technology Assessment Series; Vol. 18: No. 7, pp. 1–199, October 2018 69
Figure 15: State Transition Diagram for ICD or CRT-D Recipients With Heart Failure 3 Months After
Successful Implantation, Remote Monitoring Plus Clinic Visits Versus Clinic Visits Alone
Abbreviations: NYHA = New York Heart Association functional class
Figure 16: State Transition Diagram for Pacemaker Recipients With Arrhythmia 3 Months After
Successful Implantation, Remote Monitoring Plus Clinic Visits Versus Clinic Visits Alone

Primary Economic Evaluation October 2018
Ontario Health Technology Assessment Series; Vol. 18: No. 7, pp. 1–199, October 2018 70
The health states in Model 1 and Model 2 are described below. The cycle length was 1 month, meaning patients transitioned to a different health state no more than once a month:
Model 1 Health States: ICD or CRT-D Recipients (3 Months After Successful Implantation)
• Stable heart failure—the cohort enters the model when implant recipients have stable heart failure (NYHA functional class II). They may remain in this state, transition to the “post-hospitalized” state, or transition to the “dead” state. Within the stable state, patients may have scheduled remote interrogations or clinic visits (alternating every 6 months in the remote monitoring arm). In addition, they may have unscheduled clinic visits and/or emergency department visits
• NYHA classes—patients may transition between NYHA functional classes (I to IV). A higher class represents greater heart disease severity (see Appendix 9, Model Structure, for NYHA class descriptions). In the reference case, patients may improve by no more than one functional class in any month. However, greater improvements are possible in sensitivity analysis
• Post-hospitalized, Year 1—after an any-cause hospitalization event, patients transition to a post-hospitalized state for 1 year after their discharge. In the reference case, patients discharge with the same NYHA functional class they were admitted with. In a scenario analysis, patients discharge with an improved functional class (one class lower than the class they were admitted with). For 1 year, patients have an increased risk of mortality before they return to levels of risk prior to hospitalization. During their time in the post-hospitalized state, patients may be readmitted to hospital, seek scheduled and unscheduled care, and transition to other NYHA functional classes
• Dead—at any point during the model horizon, patients have a probability of death, due either to background mortality (age and sex specific) or to cardiovascular-related mortality
Model 2: Pacemaker Recipients (3 Months After Successful Implantation)
• Stable arrhythmia—the cohort enters the model where implant recipients have stable arrhythmia. They may remain in this state, transition to the post-hospitalized state or transition to the dead state. Within the stable state, patients may have scheduled remote monitoring interrogations or clinic visits (i.e., alternating every year in the remote monitoring arm). In addition, they may have unscheduled clinic visits and emergency department visits
• Post-hospitalized, non-stroke related, Year 1— patients may be hospitalized due to a stroke event or a non-stroke event. For the latter, patients transition into this post-hospitalized state for 1 year, where their risk of mortality and hospital readmission (stroke or non-stroke) is higher than baseline. During this year, patients may seek scheduled and/or unscheduled care. After 1 year, they return to the stable arrhythmia state.
• Post-stroke—after a stroke-related hospitalization, patients have an increased risk of mortality and hospital readmission (stroke or non-stroke) for the remainder of the time modelled. Note that post-stroke patients who are readmitted for non-stroke causes remain in the post-stroke state and do not transition to the post-hospitalized, non–stroke-related state. We assume this because the disability and resource use for patients who have had a stroke is significant, and we expect this to continue for the remainder of the time.

Primary Economic Evaluation October 2018
Ontario Health Technology Assessment Series; Vol. 18: No. 7, pp. 1–199, October 2018 71
• Dead—at any point during the model time horizon, patients have a probability of death, due either to background mortality (age and sex specific) or to cardiovascular-related mortality.
Clinical Outcome and Utility Parameters
We used several parameters to populate the model, including:
• Variables used to model the natural history of the disease
• Variables used to modify the natural history model to account for treatment effects of remote monitoring
Natural History
Natural history inputs are described below, along with corresponding distributions, for Model 1 and Model 2, respectively. Distributions are used to quantify uncertainty or variability of model inputs.
Model 1: ICD or CRT-D Recipients (3 Months After Successful Implantation)
NYHA functional classes—for the population of ICD and CRT-D recipients with heart failure, patients begin in the Markov model with NYHA class II, reflecting demographics reported in the Ontario ICD Registry (see Appendix 9, Target Population).77 Over time, patients with heart failure may improve, worsen, or remain in the same NYHA class. Table 14 shows the monthly probability of patients transitioning between NYHA classes, which we assumed would remain constant over the 5 years of the model regardless of whether they are followed remotely or in-clinic only. Table A15 (Appendix 9, Natural History) shows the transition probabilities of more severe heart failure patients that was used for sensitivity analysis (based on a trial with patients in NYHA III or IV who were implanted with CRT-Ds or CRT-Ps). Unlike the reference case, these alternate transition probabilities allow for patients to worsen by more than two functional classes in 1 month (i.e., from NYHA I to IV), or to improve by two or more functional classes in 1 month (i.e., from NYHA IV to II or I). Table 14: Monthly Transition Probabilities Between NYHA Classes
From
To
NYHA I NYHA II NYHA III NYHA IV
NYHA I 0.977 0.019 0.004 0
NYHA II 0.008 0.981 0.01 0.001
NYHA III 0 0.034 0.96 0.006
NYHA IV 0 0 0.055 0.945
Abbreviation: NYHA, New York Heart Association functional class.
Note: Higher NYHA class represents a worse functional status. Non-zero monthly transition probabilities were modelled as beta distributions assuming a standard deviation = 10% of the mean.
Source: Ford et al, 2012.86
Hospitalizations (events)—the length of stay (mean = 8.9 d, SD = 10.9 d) for patients implanted with cardioverters/defibrillators was based Ontario administrative data (Ontario Case Costing 2015/16, case mix group 161). Given that the mean length of stay was shorter than the cycle length of 1 month, we modelled hospitalizations as events. Table 15 shows the monthly probability of patients being hospitalized or rehospitalized for any cause. Once patients are

Primary Economic Evaluation October 2018
Ontario Health Technology Assessment Series; Vol. 18: No. 7, pp. 1–199, October 2018 72
discharged, we assumed their probability of rehospitalization is higher for 1 month before returning to baseline levels. Costs and disutilities are applied to hospitalization events. Table 15: Monthly Transition Probabilities for Any-Cause Hospitalization and Any-Cause
Rehospitalization (1st Month After Hospital Discharge) by NYHA Class
Estimate SD Distribution Source
Hospitalization
NYHA I 0.015188 0.0076 Beta Ford 2012,86 Verhoef 201587
NYHA II 0.023978 0.0120 Beta Ford 2012,86 Verhoef 201587
NYHA III 0.023978 0.0112 Beta Ford 2012,86 Verhoef 201587
NYHA IV 0.153970 0.0770 Beta Ford 2012,86 Verhoef 201587
Rehospitalization, first month after discharge
NYHA I 0.01588 0.0076a Beta Assumed same as index hospitalization
NYHA II 0.052 0.01a,b Beta Liu 201688
NYHA III 0.052 0.01a,b Beta Liu 2016,88 Eichhorn 201189
NYHA IV 0.168 0.01a,b Beta Liu 2016,88 Eichhorn 201189
Abbreviations: CI, confidence interval; NYHA, New York Heart Association functional class.
Note: Higher NYHA class represents worse functional status. aAssumed same as index hospitalization. bSD for rehospitalizations were assumed based on SD for hospitalizations.
Unscheduled health care use (events)—Table 16 shows the monthly probability of patients seeking unscheduled health care, including emergency department visits and unscheduled clinic visits. We assumed that patients may have either one emergency visit or one unscheduled clinic visit at most within any month. Scheduled remote interrogation for remote monitoring patients (events)—ICD and CRT-D recipients followed remotely are scheduled to have remote interrogations (in lieu of a clinic visit) every 12 months. However, not all data transmissions are successful due to patients being unavailable (e.g., away from home), connection problems, or clinic oversight in checking transmissions.41,45 We assumed that only data transmissions that were successfully received and reviewed by health care practitioners (Table 16) have an associated cost. Adherence to scheduled clinic visits—Not all patients attend their scheduled clinic visit (every 12 months for ICD and CRT-D recipients).30,45 In the reference case, we modelled adherence identified from the clinical review (Table 16). However, adherence is expected to be higher in clinical trials compared to the real world. In sensitivity analysis, we assumed a lower adherence based on observational data (Table A16, Appendix 9, Natural History).90

Primary Economic Evaluation October 2018
Ontario Health Technology Assessment Series; Vol. 18: No. 7, pp. 1–199, October 2018 73
Table 16: Model Inputs for Unscheduled and Scheduled Health Care Use for ICD and CRT-D Recipients
Estimate SD Distribution Source
Unscheduled health care use (monthly transition probabilities)
ED visit 0.0247 0.0025a Beta EVOLVO trial91
Unscheduled clinic visit 0.1175 0.0118a Beta EVOLVO trial91
Scheduled health care use (%)
Successful data transmission for remote interrogation 98.54 11.25b Beta
TRUST trial,45 (Range: CONNECT trial)41
Adherence to clinic visits 93.6 9.36a Beta MORE-CARE trial30
Abbreviations: CRT-D,cardiac resynchronization therapy-defibrillator; ED, emergency department; ICD, implantable cardioverter defibrillator; SD, standard deviation. aSD assumed to be 10% of mean. bSD estimated from range as per Hozo et al, 2005.92
Mortality—patients may transition at any time to the “dead” state due to background mortality (non–cardiovascular-related causes of death) and excess mortality (cardiovascular-related causes of death). Background mortality was adjusted for the model population (65 years, 70% male) using Ontario age- and sex-specific rates (Statistics Canada Life Table 053-0003) (see Appendix 9, Table A14). Excess mortality for patients outside of hospital and in-hospital were obtained from the literature (Table 17).87,93 We captured the increased risk of death up to 1 year after hospitalization (Table 18). After 1 year, we assumed the risk of death returns to levels prior to hospitalization. Table 17: Monthly Transition Probabilities for Excess Mortality by NYHA Class
Probability SD Distribution
NYHA I 0 N/A N/A
NYHA II 0.0026 0.0013 Beta
NYHA III 0.0067 0.0024 Beta
NYHA IV 0.0072 0.0048 Beta
In-hospital, NYHA I N/A N/A N/A
In-hospital, NYHA II 0.0109 0.0055 Beta
In-hospital, NYHA III 0.0179 0.0060 Beta
In-hospital, NYHA IV 0.0533 0.0168 Beta
Abbreviations: NYHA, New York Heart Association functional class; SD, standard deviation.
Note: Higher NYHA class represents a worse functional status.
Source: Verhoef et al, 2015.87

Primary Economic Evaluation October 2018
Ontario Health Technology Assessment Series; Vol. 18: No. 7, pp. 1–199, October 2018 74
Table 18: Hazard Ratios Up to 1 Year for All-Cause Mortality After Hospital Discharge of Any Cause (Applied to All NYHA Functional Classes)
Time Since Discharge (mo) Hazard Ratio 95% CI Distribution
0 to 1 3.87 4.81–7.93 Lognormal
1 to 3 2.97 3.50–5.50 Lognormal
3 to 6 2.67 2.86–4.39 Lognormal
6 to 12 2.55 2.59–3.75 Lognormal
Abbreviations: CI, confidence interval; NYHA, New York Heart Association functional class; SE, standard error.
Source: Solomon et al, 2007.93
Time to battery replacement (scenario analysis)—battery replacements were accounted for in a scenario analysis where the time horizon was extended from 5 years to 10 years. We modelled both estimates for ICD and CRT-D devices reported from observational studies (Table 19). One-time replacement costs are applied when it becomes time for battery replacement. Table 19: Time to ICD and CRT-D device replacement (used in scenario
analysis with time horizon extended to 10 years)
Meana SDa Distribution
Single and dual-chamber ICD, years 5.9 1.52 Gamma
CRT-D, years 4.9 1.29 Gamma
Abbreviations: CRT-D, cardiac resynchronization therapy-defibrillator; ICD, implantable cardioverter defibrillator; SD, standard deviation. aMean and standard deviation were derived from median and interquartile range as per Hozo et al. 2005.92
Source: Zanon et al, 2016.94
Model 2: Pacemaker Recipients (3 Months After Successful Implantation)
Baseline characteristics—the main indication for pacemakers was arrhythmia. Pacemaker recipients entered the model through the “stable arrhythmia” health state. Hospitalizations—Table 20 shows the monthly probability of patients being hospitalized or rehospitalized for any cause, as well as the proportion of those admissions that are stroke-related (with non–stroke-related admissions being the complement [1 − proportionstroke]). After an index hospitalization unrelated to stroke, patients have a higher risk of readmission up to 6 months after discharge before returning to baseline. After an index hospitalization related to stroke, patients have a higher risk of readmission for the remainder of the time modelled. As a simplifying assumption, probabilities of post-stroke readmissions were kept as point estimates because of the low number of patients entering the post-stroke state. The length of stay (mean = 5.5 d, SD = 5.9 d) for patients implanted with pacemakers was based on Ontario administrative data (Ontario Case Costing 2015/16, case mix group 187). Given that the mean length of stay was shorter than the cycle length of 1 month, we modelled hospitalizations as events. Costs and disutilities are applied to hospitalization events.

Primary Economic Evaluation October 2018
Ontario Health Technology Assessment Series; Vol. 18: No. 7, pp. 1–199, October 2018 75
Table 20: Monthly Transition Probabilities for Hospitalization and Rehospitalizations, Including the Proportion of Admissions that Are Stroke-Relateda
Estimate SD Distribution Source
Stable arrhythmia
Hospitalization, any cause 0.0153 0.0015b Beta SAVE HM trial38
Stroke-related, hospitalized (%) 0.0625 0.0063b Beta SAVE HM trial38
After hospitalization, non-stroke, Year 1:
Readmission, any cause, 1 mo after discharge 0.1760 0.0176b Beta Kim et al, 200995
Readmission, any cause, 3 mo after discharge 0.1728 0.0173b Beta Kim et al, 200995
Readmission, any cause, 6 mo after discharge 0.1637 0.0164b Beta Kim et al, 200995
Stroke-related, readmitted (%) 0.0245 0.0025b Beta Nationwide Readmissions
Database96
Post-stroke
Readmission, any cause, 1 mo after discharge 0.1328 Table (fixed) Caro et al, 200697
Readmission, any cause, 2–6 mos after discharge 0.0853 Table (fixed) Caro et al, 200697
Readmission, any cause, 7–12 mos after discharge
0.0668 Table (fixed) Caro et al, 200697
Readmission, any cause, 1 yr after discharge 0.0527 Table (fixed) Caro et al, 200697
Readmission, any -cause, 2 yr after discharge 0.0472 Table (fixed) Caro et al, 200697
Readmission, any cause, 3 yr after discharge 0.0456 Table (fixed) Caro et al, 200697
Readmission, any cause, 4 yr after discharge 0.0440 Table (fixed) Caro et al, 200697
Readmission, any cause, ≥5 yr after discharge 0.0440 Table (fixed) Caro et al, 200697
Stroke-related, readmitted (%), 1 mo 0.328 Table (fixed) Caro et al, 200697
Stroke-related, readmitted (%), 2–6 mo 0.214 Table (fixed) Caro et al, 200697
Stroke-related, readmitted (%), 7–12 mo 0.147 Table (fixed) Caro et al, 200697
Stroke-related, readmitted (%), 1 yr 0.089 Table (fixed) Caro et al, 200697
Stroke-related, readmitted (%), 2 yr 0.067 Table (fixed) Caro et al, 200697
Stroke-related, readmitted (%), 3 yr 0.056 Table (fixed) Caro et al, 200697
Stroke-related, readmitted (%), 4 yr 0.058 Table (fixed) Caro et al, 200697
Stroke-related, readmitted (%), ≥ 5yr 0.048 Table (fixed) Caro et al, 200697
Abbreviation: SD, standard deviation. aNon–stroke-related probabilities are the complement of stroke-related probabilities (1 − probabilitystroke). bSD assumed to be 10% of mean.
Unscheduled health care use (events)—the clinical review did not identify studies that reported emergency department visits and unscheduled clinic visits in the pacemaker population. We assumed the probability of unscheduled events was the same as the ICD and CRT-D population (Table 16). Scheduled remote interrogation for remote monitoring patients (events)—pacemaker recipients monitored remotely are scheduled to have remote interrogations (in lieu of a clinic

Primary Economic Evaluation October 2018
Ontario Health Technology Assessment Series; Vol. 18: No. 7, pp. 1–199, October 2018 76
visit) every 24 months. We assumed that only data transmissions that are successfully received and reviewed by health care practitioners (Table 20) have an associated cost. Adherence to scheduled clinic visits—not every scheduled clinic visit (every 24 months) takes place. The clinical review did not identify studies that reported adherence to scheduled clinic visits in the pacemaker population. We assumed the same adherence rates as for the ICD and CRT-D population for the reference case (based on clinical trial data) and sensitivity analysis (based on observational data). Table 21: Model Inputs for Unscheduled and Scheduled Health Care Use for Pacemaker Recipients
Estimate SD Distribution Source
Unscheduled health care use (monthly transition probabilities)
ED visit 0.0247 0.0025a Beta Assumed same as ICD and CRT-D population (EVOLVO trial)91 Unscheduled clinic visit 0.1175 0.0118a Beta
Scheduled health care use (%)
Successful data transmission for remote interrogation 91.0 3.06 Beta Ren et al., 201398
Adherence for clinic visits 93.6 9.36a Beta
Assumed same as ICD and CRT-D population (MORE-CARE trial)30
Abbreviations: CRT-D, cardiac resynchronization therapy-defibrillator; ED, emergency department; ICD, implantable cardioverter defibrillator; SD, standard deviation. aSD assumed to be 10% of mean.
Mortality—patients with stable arrhythmia may transition at any time to the “dead” state due to background mortality (non–cardiovascular-related causes of death) or excess mortality (cardiovascular-related causes of death). Background mortality was adjusted for the model population (70 years, 65% male) using Ontario age- and sex-specific rates (Statistics Canada Life Table 053-0003) (Table A14, Appendix 9, Clinical Outcome and Utility Parameters). After stroke or non–stroke-related hospitalizations, patients had an increased risk of all-cause mortality (Table 22). Patients admitted for non–stroke-related causes returned to baseline levels of mortality after 1 year (as “stable arrhythmia” patients), whereas those admitted for stroke-related causes remain in the “post-stroke” state with a higher mortality risk.

Primary Economic Evaluation October 2018
Ontario Health Technology Assessment Series; Vol. 18: No. 7, pp. 1–199, October 2018 77
Table 22: Monthly Transition Probabilities for Mortality (Excess or All Cause)
Estimate SD Distribution Source
Stable arrhythmia
Excess 0.0009 0.0001a Beta Mabo et al, 201253
After hospitalization, non-stroke state, Year 1
All cause, 1 mo after discharge 0.0513 0.0051a Beta IMMEDIATE AIM99
All cause, 2–12 mo after discharge 0.0097 0.001a Beta IMMEDIATE AIM99
After stroke
All cause, 1 mo after discharge 0.1175 0.0016 Beta CIHI Indicators, 2014
All cause, 1 yr after discharge 0.0050 N/A Table Edwards 2017100
All cause, 3 yr after discharge 0.0052 N/A Table Edwards 2017100
All cause, ≥5 yr after discharge 0.0054 N/A Table Edwards 2017100
Abbreviation: SD, standard deviation. aSD assumed to be 10% of mean.
Time to battery replacement—device replacements were accounted for in the scenario analysis when the time horizon was extended from 5 to 10 years. We modelled different estimates reported in observational studies (Table 23). Table 23: Time to ICD and CRT-D Battery Replacement (used in scenario analyses with a 10-year
time horizon)
Mean SD Distribution Source
Pacemaker (yr) 6.3 3.3 Gamma Netherlands Central Pacemaker Patients Registration101
7.3 3.1 Gamma Hauser et al, 2007102
Abbreviation: CRT-D, cardiac resynchronization therapy-defibrillator; ICD, implantable cardioverter defibrillator; SD, standard deviation.
Remote Monitoring Impact on Natural History
The measures of association for remote monitoring plus clinic visits compared to clinic visits alone are described below for Model 1 (Table 24) and Model 2 (Table 25). Note that while many measures are modelled as distributions with no statistically significant difference, the mean point estimates are not null. In other words, the mean point estimates indicate a difference in the intervention arms, most often in favour of remote monitoring. This has implications on the interpretation of the mean cost-effectiveness results (see Discussion, below).
Model 1: ICD or CRT-D Recipients (3 Months After Successful Implantation)
In the reference case, we modelled no statistically significant difference between intervention arms for mortality, hospitalizations, emergency department visits, or adherence to scheduled clinic visits. We modelled a statistically significant increase in unscheduled clinic visits. No significant difference in mortality associated with remote monitoring—based on the clinical review meta-analysis, there was no statistically significant difference in all-cause
Primary Economic Evaluation October 2018
Ontario Health Technology Assessment Series; Vol. 18: No. 7, pp. 1–199, October 2018 78
mortality or cardiovascular mortality between patients monitored remotely plus clinic visits and those by clinic visit alone, regardless of the measure of associated used (risk ratio, hazard ratio). In the reference case, we modelled no significant difference in cardiovascular-related mortality. In one sensitivity analysis, we modelled no significant difference in all-cause mortality from the meta-analysis. In another, we modelled survival benefits seen in the IN-TIME trial, which is the only trial to date to have shown improvements.35 No significant difference in the number of hospitalizations associated with remote monitoring—based on the meta-analysis, the number of all-cause hospitalizations did not statistically significantly differ between patients monitored remotely plus clinic visits versus clinic visits alone. We applied the risk ratio to both index hospitalizations and rehospitalizations. In sensitivity analysis, we modelled a reduction in all-cause hospitalization associated with remote monitoring, as demonstrated in an observational, economic study.103 Statistically significant increase in unscheduled, clinic visits associated with remote monitoring—patients sometimes seek unscheduled, clinic visits. For remote monitoring patients, these visits may be triggered by clinician-configured clinical or device alerts. Based on the clinical review, the remote monitoring group generally had more unscheduled clinic visits. In sensitivity analysis, we modelled a statistically significant reduction reported in one trial specific to urgent clinic visits and emergency department visits. No significant difference in number of emergency department visits associated with remote monitoring—based on the clinical report, trials generally reported no statistically significant difference in emergency department visits between patients monitored remotely plus clinic visits versus clinic visits alone. Those trials that found no difference reported P values, but not measures of association. Hence, we modelled an incidence rate ratio of 1 as a point estimate. One trial noted a statistically significant reduction in emergency visits, which we modelled in the sensitivity analysis. No significant difference in adherence to scheduled clinic visits associated with remote monitoring—based on the clinical review, the MORE-CARE trial30,104 showed no statistically significant difference in adherence compared to clinic visits alone, whereas the TRUST trial45 showed more participants had 100% adherence in the control arm. Both trials provided P values for significance testing, but neither provided a measure of association. The reference case was based on the MORE-CARE trial, where we derived a relative risk for adherence to clinic visits by dividing adherence in the remote monitoring arm (99%) by the non–remote monitoring arm (93.6%), and assumed a 20% SD. In sensitivity analyses, we modelled an increase in adherence to scheduled clinic visits. We derived a relative risk based on the TRUST trial, dividing the proportion of participants with 100% adherence in the remote monitoring arm (59.7%) by the proportion in the non–remote monitoring arm (47.3%), and assumed a 5% SD.

Primary Economic Evaluation October 2018
Ontario Health Technology Assessment Series; Vol. 18: No. 7, pp. 1–199, October 2018 79
Table 24: Impact of Remote Monitoring on Mortality and Health Care Use (Remote Monitoring Versus Clinic Visits Alone)
Estimate 95% CI Distribution Source
Reference case
(1) Cardiac mortality, RR 0.89 0.75–1.06 Lognormal Meta-analysis
(2) All-cause hospitalizations, RR 1.03 0.97–1.09 Lognormal Meta-analysis
(3) Unscheduled clinic visits, IRR 2.80 2.16–3.63 Lognormal MORE-CARE trial29
(4) ED visits, IRR 1 N/Aa N/Aa Clinical review
(4) Adherence to scheduled clinic visits, RR 1.06 0.69–1.58 Lognormal MORE-CARE trial 30,104
Sensitivity analyses
(1a) All-cause mortality, HR 0.81 0.60–1.11 Lognormal Meta-analysis
(1b) All-cause mortality, HRb 0.36 0.17–0.74 Lognormal IN-TIME trial35
(2) All-cause hospitalizations, RRb 0.59 N/Aa N/Aa EFFECT study103
(3) Unscheduled clinic visits, IRRb 0.65 0.49–0.88 Lognormal EVOLVO trial91
(4) ED visits, IRR 0.72 0.53–0.98 Lognormal MORE-CARE trial29
(4) Adherence to scheduled clinic visits, RRb 1.26 1.12–1.43 Lognormal TRUST trial45
Abbreviation: CI, confidence interval; ED, emergency department; HR, hazard ratio; IRR, incidence rate ratio; RR, risk ratio. aAssumed as point estimate. Studies provided only P values and did not provide measures of association. bEstimates were also used in an Optimistic Scenario analysis that simultaneously modelled all measures of association in favour of RM.
Model 2: Pacemaker Recipients (3 Months After Successful Implantation)
In the reference case, we modelled no statistically significant difference between intervention
arms for mortality, hospitalizations, strokes, unscheduled health care use, or adherence.
No significant difference in mortality associated with remote monitoring—based on the
clinical review meta-analysis, there was no statistically significant difference in all-cause
mortality between patients with remote monitoring plus clinic visits versus clinic visits alone
(Table 25). Note that the point estimate is not in favour of remote monitoring, showing greater
mortality. In the sensitivity analysis, we assumed a null point estimate so that mortality is the
same between intervention arms.
No significant difference in number of hospitalizations associated with remote
monitoring—based on the meta-analysis, the number of cardiovascular hospitalizations did not
statistically differ between patients monitored remotely plus clinic visits versus clinic visits only.
We assumed the pooled risk ratio was the same for all-cause hospitalizations (which were not
reported in identified studies). We applied the risk ratio to both index and subsequent any-cause
hospitalizations. In the sensitivity analysis, we modelled a reduction in the number of
hospitalizations based on one of the three meta-analyzed trials that reported a point estimate in
favour of remote monitoring; however, these results were not statistically significant.
No significant difference in strokes associated with remote monitoring—based on the
meta-analysis, the number of strokes did not differ between patients monitored remotely plus

Primary Economic Evaluation October 2018
Ontario Health Technology Assessment Series; Vol. 18: No. 7, pp. 1–199, October 2018 80
clinic visits versus clinic visits only. We assumed the pooled risk ratio for stroke-related
hospitalizations was the same as the pooled risk ratio for the number of strokes.
No data on unscheduled health care use (emergency department visits and unscheduled clinic visits) associated with remote monitoring—in the reference case, we did not model the impact of remote monitoring on unscheduled health care use because no data were identified in the clinical review. In the sensitivity analysis, we assumed the same measures of association as for the ICD and CRT-D population. No data on adherence to scheduled clinic visits associated with remote monitoring—in the reference case, we did not model the impact of remote monitoring on adherence to scheduled clinic visits because no data were identified in the clinical review. In the sensitivity analysis, we assumed the same measures of association as for the ICD and CRT-D population. Table 25: The Impact of Remote Monitoring on Mortality and Health Care Use (Remote Monitoring
Versus Clinic Visits Alone)
Estimate 95% CI Distribution Source
Reference case
All-cause mortality, RR 1.29 0.78–2.13 Lognormal Meta-analysis
All-cause hospitalizations, RRa 0.97 0.72–1.31 Lognormal Meta-analysis
Stroke-related hospitalizations, RRb 0.82 0.3–2.25 Lognormal Meta-analysis
ED visits, IRR N/A
Unscheduled clinic visits, IRR N/A
Sensitivity analysis
All-cause mortality, RR 1 N/A Assumption
All-cause hospitalizations, RRa 0.60 0.18–2.02 Lognormal SETAM study51
Unscheduled clinic visits, IRR 0.65 0.49–0.88 Lognormal
Assumed same as ICD and CRT-D population
Unscheduled clinic visits, IRR 2.80 2.16–3.63 Lognormal
ED visits, IRR 0.72 0.53–0.98 Lognormal
Abbreviation: CI, confidence interval; CRT-D, cardiac resynchronization therapy-defibrillator; ED, emergency department; ICD, implantable cardioverter defibrillator; IRR, incidence rate ratio; RR, risk ratio. aRisk ratio assumed to be the same as that of cardiovascular hospitalizations. bRisk ratio assumed to be the same as that of number of strokes.
Utilities
Utility values associated with remote monitoring were obtained from a targeted literature search using MEDLINE (Ovid interface) performed on July 21, 2017, for studies published from inception to the search date. The search was based on the clinical search strategy with a methodological filter applied to limit retrieval to health state utility values.67 See Appendix 3 for literature search strategies, including all search terms. This search is specific to health utilities and differs from the search in the clinical review, which also reported on quality of life. For ICD and CRT-D recipients (Model 1), we identified four studies that used preference-based measures, which allowed health utilities to be calculated in our model (EQ-5D questionnaire),46,69,70,105 and we identified four studies that used non–preference-based measures (SF-36 questionnaire, Minnesota Living With Heart Failure Questionnaire).33,35,70,106 For pacemaker recipients (Model 2), we identified one study that used both a preference-based

Primary Economic Evaluation October 2018
Ontario Health Technology Assessment Series; Vol. 18: No. 7, pp. 1–199, October 2018 81
measure (EQ-5D) and non–preference-based measures (visual analogue scale, Aquarel questionnaire).107 No significant difference in quality of life associated with remote monitoring—for both
model populations, none of the identified studies found a statistically significant difference in
health-related quality of life between patients followed remotely versus by clinic visit only,
regardless of the questionnaire. Table 26 shows the mean difference in health utilities used in
the economic model. We modelled no significant difference over the entire time horizon
(5 years) beyond the trials’ follow-up periods (between 6 and 16 months). For the Model 2
reference case, we used a mean difference based on the visual analogue scale divided by 100,
as opposed to the difference based on the EQ-5D because the former estimate was more
aligned with Model 1. In sensitivity analysis, we modelled the EQ-5D estimate.
Table 26: Mean Differencea in Health Utilities Associated With Remote Monitoring
Estimate 95% CI Distribution Source
Model 1 (ICD and CRT-D recipients)
0.043 −0.043 to 0.128 Normal EVOLVO trial 70
Model 2 (pacemaker recipients)
Reference case 0.058 −0.049 to 0.164 Normal Comoretto et al,
2017107 (based on
VAS) Sensitivity analysis 0.120 −0.04 to 0.27 Normal Comoretto et al,
2017107 (based on
EQ-5D) Abbreviation: CI, confidence interval; CRT-D, cardiac resynchronization therapy-defibrillator; ICD, implantable cardioverter defibrillators; SD, standard deviation. aMean difference = the remote monitoring group minus the clinic visit only group. Health utilities range between 0 (equivalent to dead) to 1 (equivalent to perfect health).
We searched the Cost-Effectiveness Analysis Registry published by Tuft’s Medical Center for utilities and disutilities (decrement in quality of life) associated with the different health states (Table 27) and events (Table 28) for Models 1 and 2. Additionally, we accounted for age-related decrement in quality of life for every year of increase in age (Table 29).

Primary Economic Evaluation October 2018
Ontario Health Technology Assessment Series; Vol. 18: No. 7, pp. 1–199, October 2018 82
Table 27: Utilities for Health States in Models 1 and 2
Health State Utility SD Distribution Reference
Model 1
NYHA I 0.815 0.0176 Beta Yao et al, 2007108
NYHA II 0.720 0.0143 Beta Yao et al, 2007108
NYHA III 0.590 0.0199 Beta Yao et al, 2007108
NYHA IV 0.508 0.0492 Beta Yao et al, 2007108
Post-hospitalized, NYHA I–IVa
Model 2
Stable arrhythmia 0.795 0.0795b Beta Caro et al, 2006109
Post-hospitalized, non-stroke-related, Year 1c
Post-stroke 0.41 0.085 Beta Post et al, 2001110
Abbreviations: NYHA, New York Heart Association functional class; SD, standard deviation. aThe utility of NYHA state (as a beta distribution) minus the disutility associated with respective NYHA hospitalization (as a beta distribution). bSD is assumed to be 10% of mean. cThe utility of stable arrhythmia (as a beta distribution) minus the disutility associated with hospitalization (as a beta distribution).
Table 28: Disutilities Associated With Hospitalization Events for Models 1 and 2
Event Disutility SD Distribution Reference
Model 1
Hospitalization, NYHA I 0.07 0.01a Beta Griffiths et al, 2014111
Hospitalization, NYHA II 0.03 0.01a Beta Griffiths et al, 2014111
Hospitalization, NYHA III 0.08 0.01a Beta Griffiths et al, 2014111
Hospitalization, NYHA IV 0.21 0.01a Beta Griffiths et al, 2014111
Model 2
Hospitalization 0.04 0.0102 Beta Reynolds et al,
2010112
Abbreviations: NYHA, New York Heart Association functional class; SD, standard deviation. aSD assumed based on regression error term.
Table 29: Age-Related Decrement per Year Used in Both Models 1 and 2
Age Disutility SDa Distribution Reference
66 to 69 yr 0.004 0.017 Beta Berg et al, 2015113
≥70 yr 0.005 0.017 Beta Berg et al, 2015113
Abbreviation: SD, standard deviation. aSD assumed based on regression error term.
Cost Parameters
Currently in Ontario, most centres have no staff dedicated specifically to remote monitoring. Hence, in the economic model, we assumed that no new personnel would be hired to fulfill remote monitoring tasks.

Primary Economic Evaluation October 2018
Ontario Health Technology Assessment Series; Vol. 18: No. 7, pp. 1–199, October 2018 83
Costs were obtained from the Ontario Health Insurance Schedule of Benefits and Fees, administrative data (via Ontario Case Costing Tool), the Ontario Nurses’ Association,114 and from consultations with the Ontario Ministry of Health and Long-Term Care and with industry. Costs are listed below and presented in Table 30 (reference case) and Table 32 (scenario analysis). The diagnosis and procedure codes used to search the administrative data are presented in Appendix 9 Table A17 (physician costs), Table A18 (hospitalization, emergency department costs), and Tables A20 and A21 (battery/ device replacement costs in scenario analysis). Procedural costs from the Ontario Case Costing Initiative (OCCI) are based on the inpatient setting. All costs are reported in Canadian dollars adjusted to 2017. Where 2017 costs were not available, the health care component of the Statistics Canada Consumer Price Index was used to adjust all costs (June 2017 CPI = 127.4).115
Costs for Scheduled Clinic Visits
According to clinical and industry experts, most clinic assessments involve a registered nurse who interrogates the devices and reviews transmitted data. After this, the staff electrophysiologist interprets the data and makes the management decision. Monitoring is typically done by a registered nurse but is sometimes conducted by a technician who does not have a nursing background. We assumed the staffing costs of a technician are the same as that of a registered nurse. Nursing time and wages are presented in Appendix 9.
Costs for Unscheduled Clinic Visits
According to clinical experts, the same procedures and consultations are done in both unscheduled and scheduled visits.
Reimbursement for Remote Interrogation
There are currently no physician fee codes associated with remote interrogations (which are performed in lieu of clinic visits). In the base case analysis, we assumed a fee for remote interrogation that would be the same as the fee for a clinic visit. We explored various reductions in payment in sensitivity analyses because any fee would likely be subject to negotiations if remote monitoring were publicly funded.
Emergency Department Visit Costs
We applied the same cost of emergency department visits to both intervention arms.
Hospitalization Costs
Based on the clinical review, there is no difference in length of stay between patients followed remotely plus clinic visits versus clinic visits only. Hence, we applied the same cost of hospitalization to both intervention arms.
Remote Monitoring Costs
According to industry consultations, manufacturers in the past have embedded the costs of the home transmitter hardware, network server, downloads, server time, website, technical/patient support, etc. into the cost of the implantable device. Given the declining costs of devices due to pricing competition, new payment models are being implemented based on the hospital tenders or the tier of products purchased. Currently in Ontario, manufacturers continue to embed all remote monitoring costs into the purchase of the implantable device for high volume tenders

Primary Economic Evaluation October 2018
Ontario Health Technology Assessment Series; Vol. 18: No. 7, pp. 1–199, October 2018 84
and top tier ICD and CRT-D devices. Otherwise, the costs of remote monitoring components are pulled out as line items charged to the hospital as one-time costs. Line items include the home transmitter hardware and connection accessories. See Table 31. For pacemaker devices, remote monitoring costs are not embedded in the purchase of the device because the device costs are already low. Unlike some European countries (i.e., France, United Kingdom), Ontario manufacturers do not have a subscription payment model, where an annual fee is paid to the manufacturers to cover infrastructure and technical/patient support costs, etc. Our reference case assumes the manufacturer charges the hospital for home transmitters as a line items which the Ministry reimburses. This is the status quo for lower tier devices or lower volume tenders.
Post-Stroke (Model 2 Only)
We applied costs for the management of participants who have suffered a stroke for the first year post-stroke (mean monthly cost = $5,497.95; range: $1,823.45 to $5,805.51), which includes health care, social services, and patient and caregiver resource use.116
Ministry Northern Health Travel Grants (Scenario Analysis)
The Ministry offers a travel grant program for patients to access a medical specialist or approved health care facility services that are not available locally (within 100 kilometres). One grant is available for each round trip of medical treatment. The amount provided is calculated based on distance from the facility. We obtained mean costs of Northern health travel grants for cardiologist-related visits but were unable to separate out device-related visits from other cardiology appointments. In the reference case, we did not incorporate travel grant costs for clinic visits. In sensitivity analyses, we varied the proportion of patients who received a travel grant for each clinic visit.
Battery Replacements (Scenario Analysis)
Battery replacements were accounted for in the scenario analysis where time horizon was extended from 5 to 10 years. First, we modelled time to battery replacement, then applied the mean inpatient cost for a pulse generator procedure. As an alternative procedure cost, we applied the mean inpatient cost for a device implantation procedure, which includes device replacement (i.e., replacing both the pulse generator and leads). We did not model downstream costs of replacement, subsequent complications, or the increased frequency of assessments (remote monitoring vs. clinic visits) before the recommended replacement time in this scenario.
Excluded Costs
We did not include costs of first device implantation because the implantation occurred before the start of the model. Similarly, any surgical or device complications likely occurred before the start of the model and were excluded. We did not include capital costs for hospitals, such as manufacturer-specific equipment used to receive and transmit data via telemetry (called programmers). We did not include costs for hospitals to procure computers or to access the internet as these setups already exist in hospitals in Ontario.

Primary Economic Evaluation October 2018
Ontario Health Technology Assessment Series; Vol. 18: No. 7, pp. 1–199, October 2018 85
Table 30: Costs Associated With Health Care Use for Models 1 and 2 in the Reference Case
Variable Cost Per
Visita
Sensitivity Analysis Distribution Reference
Clinic visit (Models 1 and 2)
Physician 108.90
Range:
61.25–179.80 N/A Ontario Health Insurance Schedule of Benefits and Fees
Nursing (interrogation = 12 min, administrative activities = 2 min) 11.95 SD: 0.92 Gamma
Ontario Nurses’ Association, 114
Elsner et al, 2006117
RM (Models 1 and 2)
Physician 108.90
Range:
61.25–179.80 N/A Assumed same payment as an Clinic visit
Nursing (interrogation = 1.2 min) 1.02 SD: 1.02 Gamma
Ontario Nurses’ Association, 114
Elsner et al, 2006117
RM administrative activities (1.9 min per month)b 1.628 SD: 10.61 Gamma
Ontario Nurses’ Association, 114
Elsner et al, 2006117
Emergency department visit
Model 1 17,808 8,800 Gamma Ontario Case Costing Tool 2015/2016
Model 2 8,753 SD: 4,802 Gamma Ontario Case Costing Tool 2015/2016
Hospitalization, all causes
Model 1 32,248 SD: 26,503 Gamma Ontario Case Costing Tool 2015/2016
Model 2 13,393 SD: 13,421 Gamma Ontario Case Costing Tool 2015/2016
Abbreviations: RM, remote monitoring; SD, standard deviation. aCanadian dollars adjusted to 2017.
bRM administrative activities include training patients, scheduling appointments, and contacting patients as a reaction to remote monitoring findings or to restore interrupted remote transmissions.

Primary Economic Evaluation October 2018
Ontario Health Technology Assessment Series; Vol. 18: No. 7, pp. 1–199, October 2018 86
Table 31: Payment Models for Remote Monitoring Systems (Charged to Hospitals and Reimbursed by the Ministry)
Payment Model Mean Cost
Lower SA
Upper SA
Reference case
Line items, home transmitter (3G wireless)
Model 1 1,150 400 1,500
Model 2 450 250 1,400
Scenario analyses
Line items: home transmitter (bedside)
Model 1 650 450 750
Model 2 450 250 650
Line items: accessories only (home transmitter embedded into cost of device)
Model 1 450 200 750
Model 2 N/A N/A N/A
All RM components embedded into cost of device
Model 1 0 0 0
Model 2 N/A N/A N/A
Abbreviation: SA, sensitivity analysis.
Source: Biotronik, Medtronic, Boston Scientific, Abbott.
Table 32: Additional Costs Used in Sensitivity and Scenario Analyses
Variable Costa SA/Scenario Reference
NHTG
Models 1 and 2 266.85 Varied proportion of patients who received NHTG for each clinic visit
Ontario Ministry of Health and Long-Term Care
Procedure for Pulse generator replacement
Model 1 11,497 (SD: 10,624) Gamma distribution; applied as one-time costs in scenario with 10-year time horizon
Ontario Case Costing Tool 2015/2016 (inpatient)
Model 2 19,659 (SD: 9,135)
Procedure for Device replacement
Model 1 29,256 (SD: 26,662) Gamma distribution; applied as one-time costs in scenario with 10-year time horizon
Ontario Case Costing Tool 2015/2016 (inpatient)
Model 2 13,393 (SD: 14,767)
Abbreviations: NHTG, Northern health travel grant; SA, sensitivity analysis; SD, standard deviation. aCanadian dollars adjusted to 2017.
Analysis
In the reference case, the model was analyzed probabilistically. We performed 10,000 Monte Carlo simulations, with values for the input parameters drawn from distributions reflecting the underlying parameter uncertainty. Results of the probabilistic analysis are presented on a cost-effectiveness plane as well as on a cost-effectiveness acceptability curve.

Primary Economic Evaluation October 2018
Ontario Health Technology Assessment Series; Vol. 18: No. 7, pp. 1–199, October 2018 87
In sensitivity analyses, we tested alternate inputs drawn from distributions. In scenario analyses, we tested structural assumptions (i.e., modifying the clinical pathway). We modelled optimistic scenarios where multiple effects on natural history were in favour of remote monitoring, and we modelled null scenarios where most effects were set to no difference. The key analyses are summarized in Table 33 (for full list, see Appendix 9). These analyses were all conducted probabilistically. We assessed variability and uncertainty in the model through one-way sensitivity analyses by varying specific model variables over a range and examining the impact on the results. Of note, we varied the physician reimbursement for conducting a remote interrogation (a percent reduction from a clinic visit reimbursement), and the proportion of patients using Northern health travel grants for clinic visits. The results of the one-way sensitivity analyses are presented in a tornado diagram. Table 33: Sensitivity Analyses and Scenario Analyses, Primary Economic Evaluation
Scenario Parameter(s) Used in
Reference Case Parameter(s) Used in Scenario Analysis
Structural
Models 1 and 2
Time Horizon 5 yr 10 yr (includes battery replacement costs, time to replacement mean = 5.9 yr for ICD and CRT-D, mean = 6.3 yr for pacemakers)
Remote monitoring impact on natural history
Model 1
Optimistic scenario Cardiac mortality:
RR = 0.89 (95% CI: 0.75–1.06)
All-cause hospitalization:
RR = 1.03 (95% CI: 0.97–1.09)
Unscheduledclinic visits:
IRR = 2.80 (95% CI: 2.16–3.63)
ED visits:
IRR = 1 (95% CI: N/A)
Adherence:
RR = 1.06 (95% CI: 0.69–1.58)
Simultaneously modelled effects in favour of RM
Reduced all-cause mortality:
HR = 0.36 (95% CI: 0.17–0.74)
Reduced all-cause hospitalization:
RR = 0.59 (95% CI: N/A)
Reduced unscheduled clinic visits:
IRR = 0.65 (95% CI: 0.49–0.88)
Reduced ED visits:
IRR = 0.72 (95% CI: 0.53–0.98)
Increased adherence:
RR = 1.26 (95% CI: 1.12–1.43)
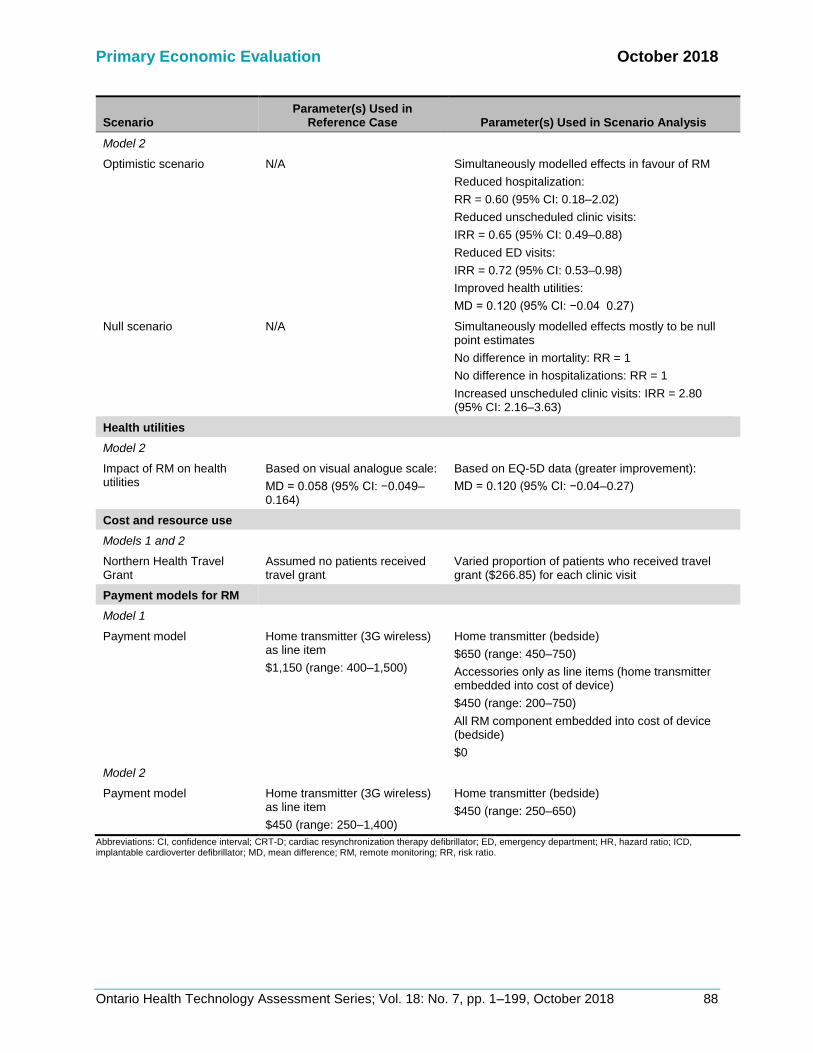
Primary Economic Evaluation October 2018
Ontario Health Technology Assessment Series; Vol. 18: No. 7, pp. 1–199, October 2018 88
Scenario Parameter(s) Used in
Reference Case Parameter(s) Used in Scenario Analysis
Model 2
Optimistic scenario N/A Simultaneously modelled effects in favour of RM
Reduced hospitalization:
RR = 0.60 (95% CI: 0.18–2.02)
Reduced unscheduled clinic visits:
IRR = 0.65 (95% CI: 0.49–0.88)
Reduced ED visits:
IRR = 0.72 (95% CI: 0.53–0.98)
Improved health utilities:
MD = 0.120 (95% CI: −0.04 0.27)
Null scenario N/A Simultaneously modelled effects mostly to be null point estimates
No difference in mortality: RR = 1
No difference in hospitalizations: RR = 1
Increased unscheduled clinic visits: IRR = 2.80 (95% CI: 2.16–3.63)
Health utilities
Model 2
Impact of RM on health utilities
Based on visual analogue scale:
MD = 0.058 (95% CI: −0.049–0.164)
Based on EQ-5D data (greater improvement):
MD = 0.120 (95% CI: −0.04–0.27)
Cost and resource use
Models 1 and 2
Northern Health Travel Grant
Assumed no patients received travel grant
Varied proportion of patients who received travel grant ($266.85) for each clinic visit
Payment models for RM
Model 1
Payment model Home transmitter (3G wireless) as line item
$1,150 (range: 400–1,500)
Home transmitter (bedside)
$650 (range: 450–750)
Accessories only as line items (home transmitter embedded into cost of device)
$450 (range: 200–750)
All RM component embedded into cost of device (bedside)
$0
Model 2
Payment model Home transmitter (3G wireless) as line item
$450 (range: 250–1,400)
Home transmitter (bedside)
$450 (range: 250–650)
Abbreviations: CI, confidence interval; CRT-D; cardiac resynchronization therapy defibrillator; ED, emergency department; HR, hazard ratio; ICD, implantable cardioverter defibrillator; MD, mean difference; RM, remote monitoring; RR, risk ratio.

Primary Economic Evaluation October 2018
Ontario Health Technology Assessment Series; Vol. 18: No. 7, pp. 1–199, October 2018 89
Generalizability
The findings of this economic analysis cannot be generalized to all patients implanted with ICDs, CRT-Ds, or pacemakers. They may, however, be used to guide decision-making about the specific patient populations addressed in the trials investigated by Health Quality Ontario.
Expert Consultation
We solicited expert consultation on the use of remote monitoring in patients with cardiac implantable electronic devices. The consultation included nurses and physicians in the specialty areas of cardiology and electrophysiology. The role of the expert advisors was to provide important contextual information on the use of the remote monitoring, including expertise on the health condition, patients, diffusion of the technology, and clinical issues that contextualize the research question to Ontario. However, the statements, conclusions, and views expressed in this report do not necessarily represent the views of the consulted experts.
Results
Reference Case Analysis
The reference case results for our analysis are presented in Table 34. Among ICD and CRT-D recipients, remote monitoring plus clinic visits provided greater health gains for an incremental cost compared to clinic visits alone. The point estimate for the ICER was $23,373.70 per quality-adjusted life year. Figure 17 shows the incremental cost-effectiveness plane, where each point represents one ICER from one Monte Carlo simulation. Using a willingness-to-pay (WTP) of $50,000 per QALY, 71% of the simulations were considered cost-effective (below the WTP line in quadrant 1), 15% were considered not cost-effective (above the WTP line in quadrant 1), 13% were considered inferior (higher cost, less effective, quadrant 2), and the remaining 1% were in quadrants 3 and 4. Among pacemaker recipients, remote monitoring plus clinic visits provided greater health gains at a lower cost compared to clinic visits alone (dominant). Figure 18 shows the incremental cost-effectiveness plane. Assuming a WTP of $50,000 per QALY, 53% of the simulations were dominant (lower cost, more effective), 20% were cost-effective (below the WTP line in quadrant 1, and below the WTP line in quadrant 3), 15% were considered not cost-effective (above the WTP line in quadrant 1 and above the WTP line in quadrant 3), and 12% were inferior (higher cost, less effective, quadrant 2).

Primary Economic Evaluation October 2018
Ontario Health Technology Assessment Series; Vol. 18: No. 7, pp. 1–199, October 2018 90
Table 34: Reference Case Analysis Results
Strategy Average Total
Costs ($) Incremental
Costa ($) Average Total Effects (QALY)
Incremental Effectb
(QALY) ICERc
($/QALY)
Model 1: ICD and CRT-D recipients
Clinic visit alone 55,137.74 2.38
RM + clinic visit 59,491.84 4,354.10 2.56 0.19 23,373.70
Model 2: Pacemaker recipients
RM + clinic visit 30,396.52 2.76
Clinic visit alone 32,766.66 −2,370.14 2.64 0.12 Dominant
Abbreviations: CRT-D, cardiac resynchronization therapy defibrillator; ICD, implantable cardioverter defibrillator; ICER, incremental cost-effectiveness ratio; RM, remote monitoring; QALY, quality-adjusted life-years. aIncremental cost = average cost (RM + clinic visit) − average cost (clinic visit alone). bIncremental effect = average effect (RM + clinic visit) − average effect (clinic visit alone). cICER = incremental cost ÷ incremental effect.
Figure 17: Incremental Cost-Effectiveness Plane for ICD and CRT-D Recipients With a
Willingness-to-Pay at $50,000 Per Quality-Adjusted Life-Year
Abbrevation: WTP, willingness to pay.
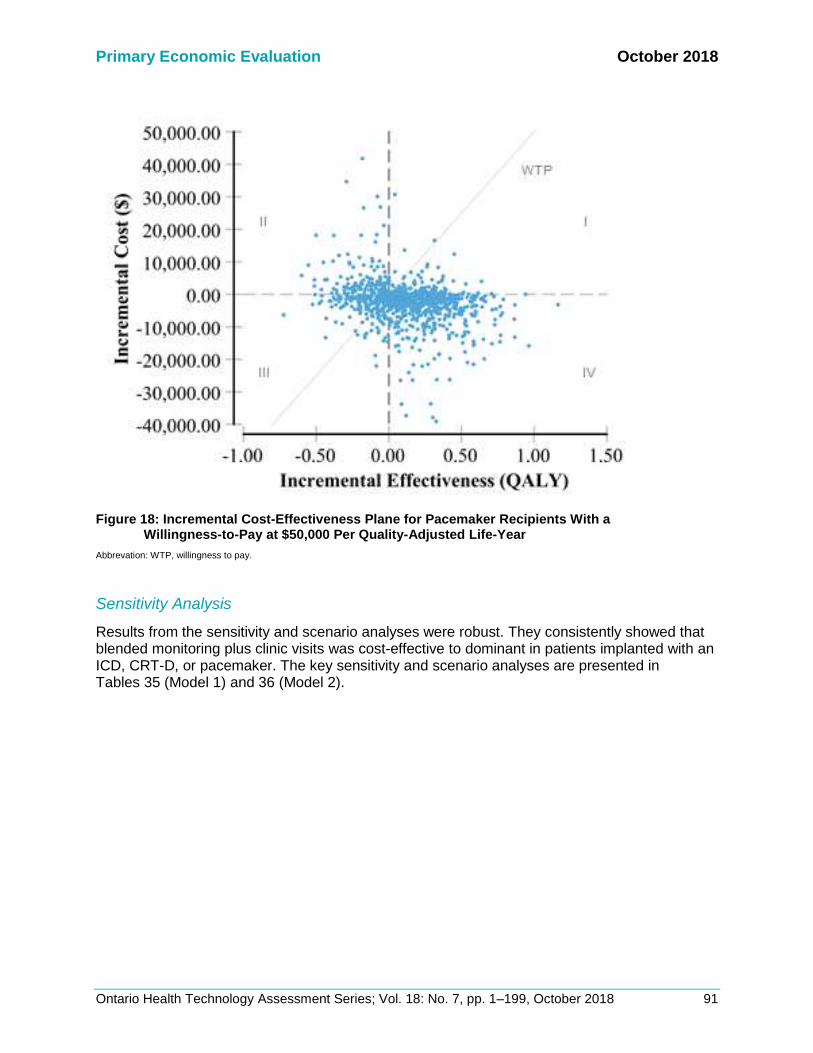
Primary Economic Evaluation October 2018
Ontario Health Technology Assessment Series; Vol. 18: No. 7, pp. 1–199, October 2018 91
Figure 18: Incremental Cost-Effectiveness Plane for Pacemaker Recipients With a
Willingness-to-Pay at $50,000 Per Quality-Adjusted Life-Year
Abbrevation: WTP, willingness to pay.
Sensitivity Analysis
Results from the sensitivity and scenario analyses were robust. They consistently showed that blended monitoring plus clinic visits was cost-effective to dominant in patients implanted with an ICD, CRT-D, or pacemaker. The key sensitivity and scenario analyses are presented in Tables 35 (Model 1) and 36 (Model 2).

Primary Economic Evaluation October 2018
Ontario Health Technology Assessment Series; Vol. 18: No. 7, pp. 1–199, October 2018 92
Table 35: Scenario Analysis Results in ICD and CRT-D Recipients (Model 1)
Strategy Average
Total Costs Incremental
Costa Average
Total QALYs Incremental
QALYsb ICERc
Probability RM Is Cost-Effective
Structural: time horizon extended to 10 yr (time to replacement, mean = 5.9 yr)
Clinic visits alone
87,939.72 3.57 CE in Q1: 73%
Inferior: 11%
RM + clinic visits
95,154.48 7,214.76 3.89 0.32 22,243.39
Impact on natural history: optimistic scenario
RM plus clinic visits
44,130.25 3.20
Clinic visits alone
62,172.57 −18,042.31 2.58 0.61 Dominant Dominant: 98%
Payment model for RM: home transmitter (bedside)
Clinic visits alone
45,780.23 2.38 CE in Q1: 74%
Inferior: 14%
RM plus clinic visits
49,451.06 3,670.83 2.56 0.19 19,701.98
Payment model for RM: accessories only
Clinic visits alone
45,780.23 2.38 CE in Q1: 75%
Inferior: 13%
RM plus clinic visits
49,251.06 3,470.83 2.56 0.19 18,628.54
Payment model for RM: all RM components embedded
Clinic visits alone
55,137.74 2.38 CE in Q1: 75%
Inferior: 13%
RM + clinic visits
58,341.84 3,204.10 2.56 0.19 17,200.27
Abbreviations: CE, cost-effective; CRT-D, cardiac resynchronization therapy defibrillator; ICD, implantable cardioverter defibrillator; ICER, incremental cost-effectiveness ratio; RM, remote monitoring; QALY, quality-adjusted life-years; Q1, quadrant 1 of incremental cost-effectiveness plane. aIncremental cost = average cost (RM + clinic visit) − average cost (clinic visit alone). bIncremental effect = average effect (RM + clinic visit) − average effect (clinic visit alone). cICER = incremental cost ÷ incremental effect.

Primary Economic Evaluation October 2018
Ontario Health Technology Assessment Series; Vol. 18: No. 7, pp. 1–199, October 2018 93
Table 36: Scenario Analysis Results in Pacemaker Recipients (Model 2)
Strategy Average
Total Costs Incremental
Costa Average
Total Effects Incremental
Effectb ICERc Probability RM Is Cost-effectived
Structural: time horizon extended to 10 years (time to replacement, mean = 6.3 years)
RM + clinic visits
59,018.50 4.15 Dominant: 43%
CE in Q1: 10%
CE in Q3: 12%
Not CE in Q3: 27%
Inferior: 7%
Clinic visits alone
66,674.87 −7,656.36 4.09 0.06 Dominant
Impact on natural history: optimistic scenario
RM + clinic visits
22,438.01 3.24 Dominant: 83%
CE in Q1: 3%
CE in Q3: 2%
Not CE in Q3: 4%
Inferior: 8%
Clinic visits alone
32,766.66 −10,328.65 2.64 0.61 Dominant
Impact on natural history: null scenario
RM + clinic visits
34,441.31 1,674.65 2.83 0.20 8,525.61
CE in Q1: 81%
Inferior: 15% Clinic visits alone
32,766.66 2.64
Impact of RM on health utilities: greater improvement associated with RM
RM + clinic visits
30,396.52 2.98 Dominant: 64%
CE in Q1: 20%
CE in Q3:3%
Not CE in Q1: 2%
Not CE in Q3: 6%
Inferior: 5%
Clinic visits alone
32,766.66 −2,370.14 2.64 0.34 Dominant
Payment model for RM: home transmitter (bedside)
RM + clinic visits
30,396.52 2.76 Dominant: 53%
CE in Q1: 13%
CE in Q3: 6%
Not CE in Q1: 2%
Not CE in Q3: 14%
Inferior: 12%
Clinic visits alone
32,766.66 −2,370.14 2.64 0.12 Dominant
Abbreviations: CE, cost-effective; ICER, incremental cost-effectiveness ratio; RM, remote monitoring; QALY, quality-adjusted life-years; Q1–Q4, quadrants 1–4 of incremental cost-effectiveness plane. aIncremental cost = average cost (RM + clinic visits) − average cost (clinic visits alone). bIncremental effect = average effect (RM + clinic visits) − average effect (clinic visits alone). cICER = incremental cost ÷ incremental effect. dQ2 = inferior; Q4 = dominant.
One-way sensitivity analyses are presented in Figure A8 (Appendix 9). The most sensitive variables were the transition probabilities for emergency visits and hospitalizations because these events were the main drivers of cost. Of note, we varied the proportion of patients receiving a Northern health travel grant from 0% to 100%. Among ICD and CRT-D recipients, the simulated ICERs remained cost-effective under commonly used thresholds (Figure 19). With 100% of patients receiving the grant, the ICER

Primary Economic Evaluation October 2018
Ontario Health Technology Assessment Series; Vol. 18: No. 7, pp. 1–199, October 2018 94
increased to $35,804.50 per QALY. Note that the ICERs did not decrease as more patients used the travel grant. Remote monitoring patients are scheduled to have half the number of clinic visits, so the incremental cost should decrease. However, we do not see this because we modelled remote monitoring patients to have more unscheduled clinic visits (incidence rate ratio = 2.8). Hence, remote monitoring patients are still using the travel grant for unscheduled visits, rather than for scheduled visits. Among pacemaker recipients, the ICERs remained dominant (less costly, more effective) even when 100% of patients receive the grant.
Figure 19: One-Way Sensitivity Analysis for ICD and CRT-D Recipients: Percent of Patients Using
Northern Health Travel Grant and Percent Reduction in Payment for Remote Interrogation as Compared to the Payment for a Clinic Visit
Abbreviation: NHTG, Northern health travel grant.
We also varied the reimbursement for remote interrogation. In the reference case, we assumed the payment for remote interrogation would be the same as the payment for a clinic visit. In the deterministic sensitivity analysis, we varied the payment for remote interrogation from a 0% reduction to a 100% reduction compared to a clinic visit. Among ICD and CRT-D recipients, the simulated ICERs remained cost-effective under commonly used thresholds. Table A23 (Appendix 9) shows a selection of payment reductions and their corresponding ICERs. Among pacemaker recipients, the ICERs remained dominant (less costly, more effective) regardless of the percent reduction.
Limitations
Our model cannot be generalized to all uses of remote monitoring or to all geographic areas. This economic evaluation reflects the use of remote monitoring as per Canadian recommendations (alternating between remote monitoring plus clinic visits every 6 months for ICD and CRT-D recipients and every year for pacemaker recipients).11 Some published RCTs have used remote monitoring as a means of earlier hospital discharge or have used a different frequency of assessment. We modelled only the maintenance phase (beginning 3 months after implantation). We did not model an increased surveillance phase (i.e., increasing assessments to every 1 to 3 months), which occurs when the recommended replacement time is approaching, when there is a device advisory, or when there is a documented or suspected device dysfunction.11 Our analysis did not include downstream costs of battery replacement (i.e., complications), patient costs (i.e., out-of-pocket travel expenses), or societal costs (i.e., caregiver time,

Primary Economic Evaluation October 2018
Ontario Health Technology Assessment Series; Vol. 18: No. 7, pp. 1–199, October 2018 95
productivity costs, or leisure time). Patient and societal costs are challenging to capture.118 RCT data predominantly come from European trials where health systems and reimbursement policies differ. We suspect the incorporation of productivity costs using a societal perspective may improve incremental cost-effectiveness results. Finally, we were unable to conduct a primary economic evaluation for CRT-P recipients because no RCTs were identified in the clinical review specific to this population.
Discussion
Results from the reference case and scenario analyses suggested that remote monitoring plus clinic visits may be cost-effective compared to clinic visits alone in patients implanted with ICD and CRT-D and pacemakers. However, there was significant uncertainty surrounding the findings. This uncertainty reflects the wide confidence intervals for some clinical effectiveness parameters comparing remote monitoring to standard care. These results are in line with those of the trial- and model-based economic evaluations identified in the economic review.69-73 All five studies showed cost-savings, with two showing that remote monitoring plus clinic visits was dominant over clinic visits alone. The economic model assumes that no new staff would be hired specifically for RM tasks. Different centres may set up their work flow and number of full-time equivalents differently. Including additional staff in the economic model would increase RM costs and increase ICER estimates. Model parameters (i.e., costs and patient demographics) were specific to Ontario wherever possible. There are some qualifiers in interpreting the mean cost-effectiveness results from the probabilistic analyses. The mean ICER represents the best estimate using the mean estimates of our parameter inputs. Although we modelled no statistically significant difference for most measures associated with remote monitoring (i.e., effect of remote monitoring on mortality, hospitalization, etc.), the mean point estimates of these parameters are not null. The mean point estimates show a difference in patients followed remotely plus clinic visits versus through clinic visits alone. These point estimates were generally in favour of remote monitoring, consequently influencing the ICER to be more favourable to remote monitoring as well. The incremental cost-effectiveness plane provides additional information on uncertainty based on the distributions of model parameters. Among ICD and CRT-D recipients, the majority of simulations (71%) showed remote monitoring plus clinic visits was cost-effective compared to clinic visits alone under a willingness-to-pay of $50,000 per QALY. A subset of simulations (14%) are considered inferior (more costly and less effective). Among pacemaker recipients, the majority of simulations (53%) were dominant, although a subset (12%) are inferior. ICERs with opposite conclusions occur because the measures associated with remote monitoring have distributions where one end of the tail is very in favour of remote monitoring (i.e., tail estimate is below the null for harms outcome) while the other end of the tail is not (i.e., tail estimate is above the null for harms outcome). There are several strengths to this analysis. First, we considered structural, parameter, and methodological uncertainties. Our results remained robust across different scenarios and our conclusions are in line with the published literature. Second, the clinical effectiveness measures reported in this HTA are based on a substantial body of RCT evidence, especially for the population of ICD and CRT-D recipients. Many of these measures are based on meta-analyses of RCT data. Study methodology is based on consultations with stakeholders, including clinical

Primary Economic Evaluation October 2018
Ontario Health Technology Assessment Series; Vol. 18: No. 7, pp. 1–199, October 2018 96
experts (nurse, electrophysiologists/ cardiologists), manufacturers (five that sell devices in Ontario), the Ontario Ministry of Health and Long-Term Care, and CorHealth Ontario.
Conclusions
Our economic analysis indicates that remote monitoring plus clinic visits provides greater QALY gains compared to clinic visits alone at a higher cost among adult ICD and CRT-D recipients with heart failure. Further, remote monitoring provides greater QALY gains at a lower cost among adult pacemaker recipients with arrhythmia. These results were robust to parameter uncertainties and assumptions as described.

October 2018
Ontario Health Technology Assessment Series; Vol. 18: No. 7, pp. 1–199, October 2018 97
BUDGET IMPACT ANALYSIS
We conducted a budget impact analysis from the perspective of the Ontario Ministry of Health and Long-Term Care to estimate the cost burden over the next 5 years of funding remote monitoring in adults newly implanted with cardiac electronic devices. All costs are reported in 2017 Canadian dollars.
Research Question
What is the budget impact of publicly funding remote monitoring in adults newly implanted with cardiac electronic devices within the context of the Ontario Ministry of Health and Long-Term Care?
Methods
The budget impact of remote monitoring was estimated as the cost difference between two scenarios: no public funding for remote monitoring (the Current Scenario) and with public funding for remote monitoring (the New Scenario). The analytic framework is shown in Figure 20.
Figure 20: Budget Impact Model Schematic
Abbreviation: RM, remote monitoring.
Size of the target population
Current mix of implant recipients followed by remote monitoring plus
clinic visits and clinic visits only
Projected mix of implant recipients followed by remote monitoring plus
clinic visits and clinic visits only
Resource utilization without RM Resource utilization with RM
Total cost without RM Total cost with RM
Budget impact (difference in costs between two scenarios)
Current Scenario (without publicly funded RM)
New Scenario (with publicly funded
RM)

Budget Impact Analysis October 2018
Ontario Health Technology Assessment Series; Vol. 18: No. 7, pp. 1–199, October 2018 98
Target Population
The target population was adults newly implanted with one of the following cardiac electronic devices:
• Implantable cardioverter defibrillator (ICD)
• Cardiac resynchronization therapy pacemaker (CRT-P)
• Cardiac resynchronization therapy defibrillator (CRT-D)
• Pacemaker Note that the target population includes only new device implantations, not device replacements. The population includes a small number of CRT-P recipients (excluded from the Primary Economic Evaluation).
Total Implant Recipients
Table 37 shows the number of patients receiving device implants in Ontario by year from population-based administrative data (CIHI Cardiac Rate Books).10 Volumes include both newly implanted recipients and patients requiring device replacements. The total number of implants increased from 7,883 in 2010/11 to 9,350 in 2014/15. We assume the number of patients receiving cardiac devices will continue to grow. Further, we assume remote monitoring will not impact these rates of growth as remote monitoring does not slow disease progression and does not statistically significantly reduce mortality. Table 37 also shows the forecasted number of implant recipients over the next 5 years based on a linear regression applied to Ontario historical data. Table 37: Patients Receiving Cardiac Implants in Ontario Based on Inpatient
and Day Surgery Records from Administrative Data, 2010/15
Year Pacemakers CRT-P ICD, CRT-D Total mplants
Historical data
2010/11 6,036 49 1,798 7,883
2011/12 6,315 69 1,964 8,348
2012/13 6,465 77 1,911 8,453
2013/14 6,456 100 1,974 8,530
2014/15 6,996 146 2,208 9,350
Forecasted dataa
2017/18 7,484 201 2,386 10,071
2018/19 7,690 223 2,469 10,382
2019/20 7,896 246 2,552 10,694
2020/21 8,102 268 2,635 11,006
2021/22 8,309 291 2,718 11,317
Abbreviations: CRT-D, cardiac resynchronization therapy-defibrillator; CRT-P, cardiac resynchronization therapy-pacemaker; ICD, implantable cardioverter defibrillator. aBased on a linear regression applied to historical data. There are an estimated 312 additional implant recipients per year.

Budget Impact Analysis October 2018
Ontario Health Technology Assessment Series; Vol. 18: No. 7, pp. 1–199, October 2018 99
New Implant Recipients (Not Replacements)
We assumed 20.8% of total implants were replacements. Therefore 79.2% were new implants (Ontario ICD Registry, 2007 to 2009; Table 38).119
Table 38: Forecasteda target population of new cardiac implant recipients in Ontario
Year
Estimated New Implants
ICD, CRT-D, and CRT-P Pacemaker
2017/18 2,049 5,927
2018/19 2,132 6,091
2019/20 2,216 6,254
2020/21 2,299 6,417
2021/22 2,383 6,580
Abbreviations: CRT-D, cardiac resynchronization therapy-defibrillator; CRT-P, cardiac resynchronization therapy-pacemaker; ICD, implantable cardioverter defibrillator. aForecasts were based on a linear regression applied to historical data from CIHI Cardiac Rate Book, 2016.10 De novo implants were calculated assuming 79.2% of implantations were de novo.119
Reference Case: Uptake of Remote Monitoring
Since the late 2000’s, remote monitoring capabilities have been built into all new devices. However, the remote monitoring capabilities are not always used and can be switched on or off. Reasons for not using remote monitoring functions include patient-specific issues (i.e., privacy concerns, lack of landline/mobile network, person not clinically indicated for remote monitoring, etc.), as well as issues that are not related to patient factors (i.e., lack of reimbursement, need for new organizational models, workflow issues, etc.).120 We sought input from clinical experts on the current and projected uptake of remote monitoring in Ontario. For current uptake, we assumed 15% of implant recipients use remote monitoring, based on data from an Ontario research hospital. Currently, physicians do not bill for remote interrogation, so when remote interrogation is used, costs are absorbed by physicians and/or hospitals. With public funding, we assume remote monitoring uptake increases by 10% immediately, with an additional 10% in each subsequent year (for sensitivity analyses, we assumed 15% increases). The 10% increase expected by clinical experts aligned with the increase used in a budget impact analysis conducted by the Australian Medical Services Advisory Committee.71 We capped uptake at 47% for all devices based on evidence from ICD recipients in the United States, where remote monitoring has been reimbursed since 2006.120 Our sensitivity analyses explored different uptake caps for pacemaker recipients (22%) versus ICD, CRT-P, and CRT-D recipients (capped at 71%) based on European data, where remote monitoring is reimbursed in some countries but not in others.121 Table 39 summarizes the remote monitoring uptake rate over 5 years in the current scenario (without public funding) and new scenarios (with public funding). Table A24 (Appendix 10) summarizes the corresponding number of patients followed remotely.

Budget Impact Analysis October 2018
Ontario Health Technology Assessment Series; Vol. 18: No. 7, pp. 1–199, October 2018 100
Table 39: Reference Case: Remote Monitoring Uptake Over 5 Years Among New Patients Implanted With ICD, CRT-P, CRT-D, and Pacemaker Devices in Ontario
Remote Monitoring Uptake (%)
Year 1 Year 2 Year 3 Year 4 Year 5
Current scenario: without publicly funded RM (15% uptake at baseline)
Any device 15 15 15 15 15
New scenario 1: publicly funded RM (10% increase immediately and for each subsequent year, cap at 47%)
Any device 25 35 45 47 47
New scenario 2: publicly funded RM (15% increase immediately and for each subsequent year, cap at 71%)
Any device 30 45 60 71 71
New scenario 3: publicly funded RM (10% increase immediately and for each subsequent year, cap at 71% for ICD, CRT-D, and CRT-P and 22% for pacemakers)
ICD, CRT-P, and CRT-D 25 35 45 55 65
Pacemakers 22 22 22 22 22
Abbreviations: CRT-D, cardiac resynchronization therapy-defibrillator; CRT-P, cardiac resynchronization therapy-pacemaker; ICD, implantable cardioverter defibrillator; RM, remote monitoring.
Scenario Analysis: Uptake of RM
According to stakeholder consultations, there is wide variation in how remote monitoring is offered among cardiac centres, from no remote monitoring offered to remote monitoring offered to every patient. Given this, we conducted a scenario analysis that assumed a different uptake at baseline than the reference case (15%). Without public funding, we used a 50% current uptake for ICD and CRT-P, and CRT-D and a 4% current uptake for pacemakers, based on manufacturer estimates. With public funding, we assumed a 10% increase in uptake immediately and for each subsequent year for any device, capped at 71% (Table 40). Table A25 (Appendix 10) summarizes the corresponding number of patients followed remotely. Table 40: Scenario Analysis: Remote Monitoring Uptake Over 5 Years Among New Patients
Implanted With ICD and CRT-P, and CRT-D, and Pacemaker Devices in Ontario
Remote Monitoring Uptake (%)
Year 1 Year 2 Year 3 Year 4 Year 5
Current scenario: without publicly funded RM (50% uptake at baseline for ICD and CRT-D, and CRT-P and 4% for pacemakers)
ICD, CRT-P, CRT-D 50 50 50 50 50
Pacemakers 4 4 4 4 4
New scenario: publicly funded RM (10% increase immediately and for each subsequent year for any device, capped at 71%)
ICD, CRT-P, and CRT-D 60 70 71 71 71
Pacemakers 14 24 34 44 54
Abbreviations: CRT-D, cardiac resynchronization therapy-defibrillator; CRT-P, cardiac resynchronization therapy-pacemaker; ICD, implantable cardioverter defibrillator; RM, remote monitoring.
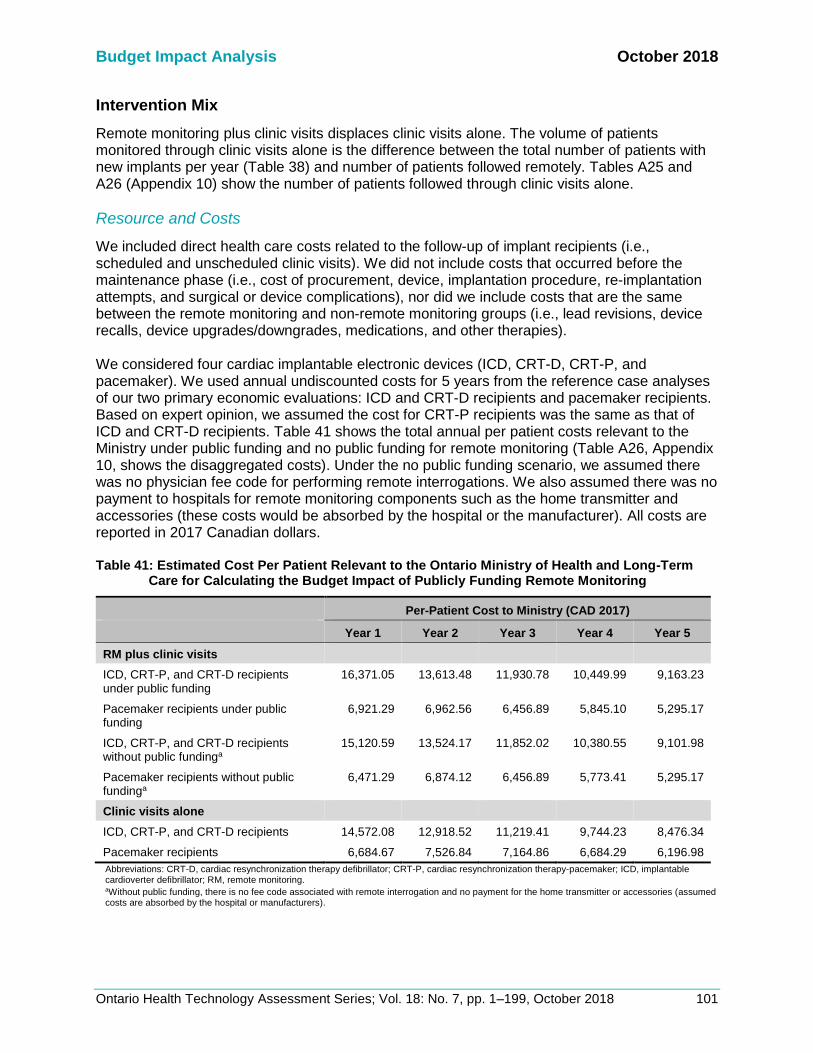
Budget Impact Analysis October 2018
Ontario Health Technology Assessment Series; Vol. 18: No. 7, pp. 1–199, October 2018 101
Intervention Mix
Remote monitoring plus clinic visits displaces clinic visits alone. The volume of patients monitored through clinic visits alone is the difference between the total number of patients with new implants per year (Table 38) and number of patients followed remotely. Tables A25 and A26 (Appendix 10) show the number of patients followed through clinic visits alone.
Resource and Costs
We included direct health care costs related to the follow-up of implant recipients (i.e., scheduled and unscheduled clinic visits). We did not include costs that occurred before the maintenance phase (i.e., cost of procurement, device, implantation procedure, re-implantation attempts, and surgical or device complications), nor did we include costs that are the same between the remote monitoring and non-remote monitoring groups (i.e., lead revisions, device recalls, device upgrades/downgrades, medications, and other therapies). We considered four cardiac implantable electronic devices (ICD, CRT-D, CRT-P, and pacemaker). We used annual undiscounted costs for 5 years from the reference case analyses of our two primary economic evaluations: ICD and CRT-D recipients and pacemaker recipients. Based on expert opinion, we assumed the cost for CRT-P recipients was the same as that of ICD and CRT-D recipients. Table 41 shows the total annual per patient costs relevant to the Ministry under public funding and no public funding for remote monitoring (Table A26, Appendix 10, shows the disaggregated costs). Under the no public funding scenario, we assumed there was no physician fee code for performing remote interrogations. We also assumed there was no payment to hospitals for remote monitoring components such as the home transmitter and accessories (these costs would be absorbed by the hospital or the manufacturer). All costs are reported in 2017 Canadian dollars. Table 41: Estimated Cost Per Patient Relevant to the Ontario Ministry of Health and Long-Term
Care for Calculating the Budget Impact of Publicly Funding Remote Monitoring
Per-Patient Cost to Ministry (CAD 2017)
Year 1 Year 2 Year 3 Year 4 Year 5
RM plus clinic visits
ICD, CRT-P, and CRT-D recipients under public funding
16,371.05 13,613.48 11,930.78 10,449.99 9,163.23
Pacemaker recipients under public funding
6,921.29 6,962.56 6,456.89 5,845.10 5,295.17
ICD, CRT-P, and CRT-D recipients without public fundinga
15,120.59 13,524.17 11,852.02 10,380.55 9,101.98
Pacemaker recipients without public fundinga
6,471.29 6,874.12 6,456.89 5,773.41 5,295.17
Clinic visits alone
ICD, CRT-P, and CRT-D recipients 14,572.08 12,918.52 11,219.41 9,744.23 8,476.34
Pacemaker recipients 6,684.67 7,526.84 7,164.86 6,684.29 6,196.98
Abbreviations: CRT-D, cardiac resynchronization therapy defibrillator; CRT-P, cardiac resynchronization therapy-pacemaker; ICD, implantable cardioverter defibrillator; RM, remote monitoring. aWithout public funding, there is no fee code associated with remote interrogation and no payment for the home transmitter or accessories (assumed costs are absorbed by the hospital or manufacturers).

Budget Impact Analysis October 2018
Ontario Health Technology Assessment Series; Vol. 18: No. 7, pp. 1–199, October 2018 102
Analysis
We calculated the total budget impact for managing new patients implanted with ICD, CRT-P, CRT-D, and pacemakers over 5 years. The total budget impact represents the annual costs of the intervention mix (patients monitored remotely plus clinic visits and through clinic visits alone) for the current and new scenarios. We calculated the net budget impact as the difference in total costs between the current scenario and the new scenario. In the reference case, we used a 15% uptake rate at baseline. In the scenario analysis, we used a baseline uptake of 50% for ICD, CRT-P, and CRT-D, and 4% for pacemakers.
Assumptions
We assumed the following:
• CRT-P recipients have the same effectiveness and costs as CRT-D recipients (no trial data are available; this assumption is based on clinical expertise)
• There is no crossover between remote monitoring and non-remote monitoring (participants do not switch between intervention arms)
• There is no remote monitoring suspension (patients in the remote monitoring strategy do not stop using remote monitoring)
Expert Consultation
We solicited expert consultation on the use of remote monitoring in patients with cardiac implantable electronic devices. The consultation included nurses and physicians in the specialty areas of cardiology and electrophysiology. The expert advisors provided important contextual information on the use of remote monitoring, including information on the health condition, eligible patients, the diffusion of the technology, and clinical issues that contextualize the research question to Ontario. However, the statements, conclusions, and views expressed in this report do not necessarily represent the views of the consulted experts.

Budget Impact Analysis October 2018
Ontario Health Technology Assessment Series; Vol. 18: No. 7, pp. 1–199, October 2018 103
Results
Reference Case
Table 42 shows the total and net budget impacts of the reference case. Publicly funding remote monitoring results in cost savings over the 5-year period projected. Table 42: Reference Case Results of Budget Impact Analysis (Total and Net Budget Impact)
Total Cost to Ministry (in $ millions CAD)
Scenario Year 1 Year 2 Year 3 Year 4 Year 5 Total
Total budget impact
Current scenario: without publicly funded RM (15% uptake at baseline)
69.45 144.75 216.48 284.04 347.84 1,062.57
New scenario 1: publicly funded RM (15% uptake at baseline, 10% increase immediately and for each subsequent year for any device, capped at 47%)
70.75 144.23 214.03 279.15 340.23 1,048.39
New scenario 2: publicly funded RM (15% uptake at baseline, 15% increase immediately and for each subsequent year for any device, capped at 71%)
71.00 144.66 214.51 279.75 340.17 1,050.09
New scenario 3: Publicly funded RM (15% uptake at baseline, 10% increase immediately and for each subsequent year for any device, capped at 71% for ICD, CRT-D, and CRT-P, and 22% for pacemakers)
70.71 144.14 214.26 280.62 343.49 1,053.22
Net budget impact
New scenario 1 – current scenario 1.29 −0.52 −2.45 −4.90 −7.60 −14.18
New scenario 2 – current scenario 1.55 −0.09 −1.96 −4.30 −7.67 −12.47
New scenario 3 – current scenario 1.25 −0.61 −2.22 −3.43 −4.34 −9.34
Abbreviations: CRT-D, cardiac resynchronization therapy defibrillator; CRT-P, cardiac resynchronization therapy-pacemaker; ICD, implantable cardioverter defibrillator; RM, remote monitoring.
Scenario Analysis
Table 43 shows the total and net budget impacts of different scenarios using different uptake
rates at baseline, different increases in uptake rates per year, and different caps to uptake.
When the baseline uptake is at 15%, greater uptake of remote monitoring shows trends of cost
saving each year. When the baseline uptake is higher for ICD, CRT-P, and CRT-D (50%) and
lower for pacemakers (4%), there are no cost savings for greater uptake of remote monitoring.

Budget Impact Analysis October 2018
Ontario Health Technology Assessment Series; Vol. 18: No. 7, pp. 1–199, October 2018 104
Table 43: Scenario Analysis Results of Budget Impact Analysis (Total and Net Budget Impacts)
Total Cost to the Ministry (in $ millions CAD)
Scenario Year 1 Year 2 Year 3 Year 4 Year 5 Total
Total budget impact
Current scenario: without publicly funded RM (50% uptake at baseline for ICD, CRT-D, and CRT-P and 4% for pacemakers)
69.99 143.86 214.46 281.26 344.50 1,054.07
New scenario: publicly funded RM (50% uptake at baseline for ICD, CRT-D, and CRT-P and 4% for pacemakers, a 10% increase immediately and in each subsequent year for any device, capped at 71%)
71.88 146.28 216.77 282.94 344.93 1,062.80
Net budget impact
New scenario − current scenario 1.90 2.42 2.31 1.67 0.43 8.73
Abbreviations: CRT-D, cardiac resynchronization therapy defibrillator; CRT-P, cardiac resynchronization therapy-pacemaker; ICD, implantable cardioverter defibrillator; RM, remote monitoring.
Limitations
There are several limitations to this analysis. Based on expert opinion, we assumed the costs and effects associated with remote monitoring among CRT-P recipients were the same as those of ICD and CRT-D recipients. We did not build a primary economic evaluation for the CRT-P population due to the lack of evidence, as identified in the clinical review. However, the CRT-P population in Ontario is small relative to other cardiac implantations and it is unlikely to affect the budget impact analysis. We tried to capture a range of costs; however, we did not include costs of surgical or device complications, medications, or downstream costs of battery replacement. We assumed these events are equally likely to occur in either intervention arm. Our estimate of current uptake of remote monitoring affects the conclusions qualitatively. At a lower current uptake of 15%, funding remote monitoring plus clinic visits led to a cost saving over the 5 years. However, with a different current uptake (50% for ICD, CRT-P, and CRT-D and 4% for pacemaker recipients), the net budget impact was not cost saving (see Table 43, above).
Discussion
The net budget impact was $1.29 million in the first year and was cost saving in subsequent years, for a net savings of $14 million over 5 years. The savings come from fewer clinical events incurred, so this budget impact analysis assumes these costs could be recouped. In reality, the costs may not be recouped, but the resources may be used to provide other services. Pacemaker recipients, who make up the majority of cardiac implant recipients, drive these results because the primary economic evaluation demonstrated remote monitoring to be dominant (less costly, more effective) in this population. As described in the Discussion section of the primary economic evaluation, the point estimates of the intervention effects were mostly in favour of remote monitoring (i.e., showing reduced mortality). Costs from the primary economic evaluation reference case were then used to inform the budget impact analysis. Uncertainty around the clinical effectiveness of remote monitoring may affect the budget impact of publicly funding remote monitoring. In the scenario analysis where the baseline was higher (50% for ICD, CRT-P, and CRT-D recipients and 4% for pacemaker recipients), the net budget impact ranged from $1.9 million in the first year (2017) to $0.43 million in the fifth year (2021). Pacemaker recipients no longer drive the results in the scenario analysis because there is a much smaller remote monitoring uptake in this population. It is important for decision-makers to note that results varied depending on the current uptake of remote monitoring.

Budget Impact Analysis October 2018
Ontario Health Technology Assessment Series; Vol. 18: No. 7, pp. 1–199, October 2018 105
There are several strengths to this analysis. We explored different scenarios for current uptake of remote monitoring, projected increase in uptake, and caps in uptake. In addition, the per-patient costs were derived from our primary economic evaluations, which capture mortality, clinical events, and disability.
Conclusions
Publicly funding blended remote monitoring among people implanted with ICD, CRT-P, CRT-D, and pacemakers would likely lead to notional cost savings over 5 years (net budget impact of $1.3 million in the first year, leading to a savings of $7.6 million in the fifth year).

October 2018
Ontario Health Technology Assessment Series; Vol. 18: No. 7, pp. 1–199, October 2018 106
PATIENT PREFERENCES AND VALUES
Background
Patient preferences and values explores the lived experience of a person with a health condition, including the impact the condition and its treatment has on the patient, the patient’s family or other caregivers, and the patient’s personal environment. Patient, Caregiver, and Public Engagement intends to increase awareness and build appreciation for the needs, priorities, and preferences of the individual at the centre of a treatment program. The insights provide an in-depth picture of lived experience through an intimate look at the values that underpin the experience. Lived experience is a unique source of evidence about the personal impact of a health condition and how that condition is managed, including what it is like to navigate the health care system with that condition, and how technologies may or may not make a difference in people’s lives. Information shared from lived experience can also identify gaps or limitations in published research (for example, outcome measures that do not reflect what is important to those with lived experience).122-124 Additionally, lived experience can also provide information or perspectives on the ethical and social values implications of technologies and treatments. Because the needs, priorities, preferences, and values of those with lived experience in Ontario are not often adequately explored by published literature, Health Quality Ontario makes an effort to reach out to, and directly speak with, people who live with the health condition, including those who may have experience with the intervention in question.
The impact of a heart condition and living with an implanted cardiac device on patients and families was perceived at the outset of this project to have significant bearing on quality of life. To understand what the impact on quality of life truly was, we heard from people with lived experience of implanted cardiac devices, most of whom had experience with remote monitoring. Understanding and appreciating their day to day functioning and experience of any treatments, including the intervention in question, helps to contextualize the potential value of the intervention from a lived experience perspective.
Methods
Engagement Plan
Engagement as a concept captures a range of efforts used to involve the public and patients in various domains and stages of HTA decision-making.125 Rowe and Frewer outline three types of engagement: communication, consultation, and participation.126 Communication describes a one-way transfer of information from the sponsor to the individual, while participation involves the sponsor and individual collaborating through real-time dialogue. The engagement approach for this HTA was consultation, defined as the seeking out and soliciting of information (for example, experiential input) by a sponsor from the public, patients, and caregivers who are affected by the technology or intervention in question.127 Within this typology, the engagement design focussed on interview methodology to examine the lived experience of patients, caregivers, and families, including those having undergone the intervention. The qualitative interview was selected as an appropriate methodology because it allowed HQO staff to explore the meaning of central themes in the lived experience of the participants. The main task in interviewing is to understand the meaning of what participants say.128 Interviews are particularly useful for getting the story behind a participant’s experiences, which was the

Patient Preferences and Values October 2018
Ontario Health Technology Assessment Series; Vol. 18: No. 7, pp. 1–199, October 2018 107
objective in this portion of the Health Technology Assessment. The sensitive nature of exploring quality of life issues supports the use of interviews for this project.
Outreach Process
For this project, we actively recruited individuals with direct lived experience of the intervention in question and of individuals considering using it. Health Quality Ontario staff reached out to patients, caregivers, and families through a variety of partner organizations, including University of Ottawa Heart Institute, London Cardiac Institute, Hamilton Health Sciences Pacemaker/ICD Clinic, Southlake Hospital Heart Rhythm Program, and the Heart and Stroke Foundation, as well as through clinical experts in the field.
Inclusion Criteria
We sought people with lived experience with implanted cardiac devices—pacemakers, cardioverter defibrillators, or cardiac resynchronization therapy defibrillators. Participants were not required to have experience with remote monitoring technology. We sought broad geographic, cultural, and socioeconomic representations in an attempt to identify possible equity issues in accessing and using continuous glucose monitoring devices.
Exclusion Criteria
We did not set specific exclusion criteria.
Participants
We conducted interviews with 16 individuals—13 patients and 3 spouses of patients. Participant’s ages ranged from under 50 to late seventies. Some patients had very recently been diagnosed with a heart condition and received an implanted cardiac device, while others had been dealing with a heart condition for decades. The majority of participants had experience with remote monitoring technology. Because most did not receive their remote cardiac monitoring device immediately upon implantation of their pacemaker or defibrillator, they were able to compare their experiences of managing their heart condition with and without these devices. A quarter of the participants lived in what they described as rural or Northern settings—places where they had to drive for more than an hour, and sometimes several hours, to access care related to their cardiac device.
Approach
At the outset of the interview, we explained the purpose of this Health Technology Assessment, the risks to participation, and how we would protect participants’ personal health information. This context was explained to individuals verbally and through a letter of information (see Appendix 11). Interviews were recorded and transcribed with participants’ consent. Interviews lasted approximately 20 to 60 minutes. They were semi-structured and consisted of a series of open-ended questions. Questions were based on a list developed by the Health Technology Assessment International Interest Group on Patient and Citizen Involvement in Health Technology Assessment.129 Questions focused on the impact of the heart condition on

Patient Preferences and Values October 2018
Ontario Health Technology Assessment Series; Vol. 18: No. 7, pp. 1–199, October 2018 108
patients’ and families’ quality of life, their experiences with treatment options, and their perceptions of the benefits or limitations of using remote cardiac monitoring to support the management of their condition. See Appendix 12 for our patient interview guide.
Data Extraction and Analysis
We used a modified version of grounded theory methodology to analyze transcripts of participant interviews.Grounded theory follows an iterative process of eliciting, documenting, and analyzing responses while simultaneously collecting and analyzing data using a constant comparative approach.130,131 This allowed us to organize and compare information on experiences across participants.Staff coded transcripts and compared themes using NVivo (QSR International, Doncaster, Victoria, Australia), a qualitative software program that enabled identification and interpretation of patterns in the interview data. The patterns we identified allowed us to highlight the impact of health conditions and treatments on the patients, family members, and caregivers we interview.
Results
Lived experience with an implanted cardiac device
People who have received an implantable cardioverter defibrillator or pacemaker have in most cases suffered a significant cardiac event, and in many cases more than one event. Some people we spoke with had initially been able to manage a heart condition with medication, until it progressed and they needed an implanted device. For others, cardiac arrest or a heart attack came without warning. Several participants reported multiple heart attacks over several years, necessitating bypass surgery or other interventions before receiving an implantable cardiac device. A patient is not a candidate for an implanted cardiac device unless their arrthymia is considered life threatening. Participants described multiple hospital admissions, interventions, and surgeries and time spent in intensive cardiac care units as part of managing their clinical condition. Several people experienced complications from surgery to implant their cardiac device. While some participants have not seen a significant drop in their activity levels, many (especially among those under 60 years of age) said that they are no longer able to live the way they had before their heart attack(s):
I can’t do half as much as I would like to do or used to do. I have to miss things because I'm just too exhausted and that's just all part of the heart disease. Being young, I'm only 44… I can't drink alcohol anymore, I have to reduce salt intake. I have to be careful what I eat if I'm going to a dinner or going out with friends or having people to my house.
Participants adjusted their lifestyle to accommodate their condition:
There are a lot of things I can't do anymore. I mean, even if I go up and down the stairs a couple of times, I start to get pain in the chest, and that’s why we moved seven years ago, so I would be in a one-floor house, but I'm talking now about going to the basement. I go down to the basement once or twice and then I have to sit down till my heart stops pounding, and until I can get my breath back.

Patient Preferences and Values October 2018
Ontario Health Technology Assessment Series; Vol. 18: No. 7, pp. 1–199, October 2018 109
One participant noted that, before remote monitoring, his life was significantly impacted by his heart condition and his need for frequent contact with his physicians:
In the earlier years, because I have a very rare heart condition, any little thing, I would phone in to the clinic…and say, hey, gee, this just happened 25 minutes ago; do I need to be alarmed? Do I need to do anything? Should I go to the hospital? Do I need to make an appointment? Do I need to come in and drop everything? And so I guess the doctors were starting to build a bit of a portfolio and some historical data on me. I’d have to come in. So you know, there have been times when I've been on a flight, had an episode, or I've been in another country, had an episode, and I would drop everything and come in.
Throughout our interviews, we sought out people’s physical and emotional experiences of living with heart issues and an implanted cardiac device. A number of the participants were in their late seventies or early eighties and they acknowledged that some of their limitations, such as diabetes and arthritis, were age-related. Some participants had been living with an implanted cardiac device for decades and had adapted their lifestyles to this condition. These people were less inclined to share the emotional impacts.
The physical and emotional impact of living with an implanted cardiac device was shared in more detail by the younger participants, several of whom were still juggling full time work and family obligations while managing their condition.
Information About Remote Cardiac Monitoring
People using remote heart monitoring were offered the device through the cardiac clinic they attended. They had not researched it or sought it out themselves; instead, their clinicians offered it to them as the standard of care at that particular clinic or for their particular clinical condition. The patients we spoke with shared that they found the monitors easy to use. A number of the participants said that they aren’t particularly tech-savvy, but they experienced no barriers to use. They just plugged the device in and were ready to go:
It's not a very complicated method. You just go home, plug it in, get set up, and once you're set up it's good to go. You don’t have to touch it, it's just there if you need to use it. Because it's so simple to use, I think that's what makes it more adaptable, especially to an elderly population.
I received my first Medtronic monitor about three years ago. And the ease of installation—I'm not a computer savvy guy—it was pretty simple. Follow the steps, you're hooked, you're set up. I had it set up probably within ten minutes.
One participant shared that the wireless model was superior to an earlier version that transmitted monitoring data over the phone line:
You just plugged it into your phone jack, but then at that time it would interrupt your phone calls coming in and you know, that’s why they went to this wireless like you know, then it’s been really good that way, too.

Patient Preferences and Values October 2018
Ontario Health Technology Assessment Series; Vol. 18: No. 7, pp. 1–199, October 2018 110
Some participants we spoke with had their cardiac devices for years but only recently had been offered the monitoring system, while others received it as part of the standard of care at the cardiac clinic they attended immediately after surgery. One participant shared that after she moved to a more rural area, the cellular service wasn’t strong and her remote monitoring device didn’t work properly. She was able to remedy the problem by purchasing a cellular signal booster. Other people have continued paying for a landline in their home solely for the monitoring system.
Use of Remote Cardiac Monitoring
Emotional, Medical, and Safety Benefits
Participants shared that the device gave them peace of mind, to know that they can be monitored by their care team from afar. This improved their quality of life, reducing the feeling of having to be vigilant or alert to their condition all the time:
This gives tremendous advancements for people in remote areas to have this monitoring equipment, as long as they can get the communication working to cover those distances. It certainly is a blessing to know that they can monitor that stuff from afar. It just gives you a tremendous peace of mind. It’s actually relaxed me to know that I have this, that it would help if something happened, like if it went too slow or something like that or if I had another heart attack they would know about it right away and I would know about it right away too. They could monitor it. That does relax me a lot, knowing that there’s something there that’s going to help me if I need it.
A caregiver, the wife of a patient, shared that the remote monitoring has been very important for her and her husband’s peace of mind. She noted that on several occasions they have received calls from the clinic to let them know that the remote monitoring showed that the medication her husband was taking for his congestive heart failure wasn’t doing enough and that he needed to adjust his medications. She credits that knowledge from the monitoring system with saving his life and feels that they wouldn’t be able to travel and lead such an active lifestyle without it. Participants also shared that remote monitoring could help them avoid unnecessary emergency room visits and could offer reassurance when what they were experiencing didn’t require immediate medical attention:
I definitely think it's beneficial. Like, for example, sending a report on to emerg before I get there or just even being able to… send them a transmission and talk to a nurse there and get reassurance that it's a normal pattern. I think it's wonderful just knowing that I have that access there and am able to transmit within a couple of minutes and give them a call is really comforting,… and of course the emergency waits are hours long. So with a transmission at least, … they're able to take a look at it right away and get back to you with what's going on or with recommendations.
Nearly every participant mentioned that by using remote monitoring they could reduce the number of their appointments from three to four per year to only one per year. This had the added benefit of reducing costs such as gas and parking.

Patient Preferences and Values October 2018
Ontario Health Technology Assessment Series; Vol. 18: No. 7, pp. 1–199, October 2018 111
It’s saved me of extra visits to the clinic, because I only go once a year now.… But in the meantime, I was going every three months before and now I don’t have to—so it saves me lots of visits and paying parking to the hospital.
Another participant said that the remote monitoring allows her to flag specific events to her care team to assess whether she should make the trip to the clinic:
When I first had the implant done, they sent me the machine to hook up or whatever and I know they do scheduled transmissions, to keep an eye on if there were any events or anything that happened.... I'm also hooked up all the time in case an event does happen, I can send an automatic transmission to them and give them a call to have them look at it—it's really convenient.
Reduced appointments and travel are especially important for people who live far away from their cardiac clinic. It impacts not just them, but also the caregivers who support them and drive them to appointments. One person who was waiting to receive her remote monitoring system shared that, since she lived several hours away from the hospital, she was eager to try the system. It would save her a lot of time on the road and spare her daughter the time it takes to drive her to those appointments. Another patient, who has dealt with cardiac issues her whole life and lives a few hours from her cardiac clinic has other significant health issues as well. She is unable to work or drive because of her condition, so she relies on her husband or parents to drive her. She shared that she feels challenged by how often she relies on others for support and how challenging that can be for her and her family members:
If I had to go to the actual office more often to have it checked, I'd have to have my husband take time off work so that he could drive me…having to get places for me is difficult because of not being able to drive. Also then it's more sitting in doctors' offices waiting in horribly uncomfortable chairs, and more just, you know, wasting my life away in hospitals or doctors' offices.
The wife of one participant said the most important impact of remote monitoring has been the reduction of 2.5-hour drives to Newmarket for clinic appointments—especially during the winter when roads are not always safe:
We don’t have to drive in the winter now because we make every appointment for September…. A lot of patients come from Thunder Bay, North Bay, you know, a heck of a lot further than we do. If they had to come every three months, I don’t know how in the heck they’d do it. I’m too old to drive all the way down there in the winter, so this helps me considerably.
Concerns with the Use of Remote Cardiac Monitoring
A minority of patients and families expressed concerns about using remote cardiac monitoring, or gave reasons for not using it. Several participants shared that they occasionally worry about their device being hacked into and tampered with. One participant shared concerns that may indicate a need for clearer patient education and communication regarding monitoring. She stated that, while she and her husband appreciate having the remote monitoring device, she doesn’t see many benefits because it is not being monitored by a health care professional as regularly as she thinks would be useful:

Patient Preferences and Values October 2018
Ontario Health Technology Assessment Series; Vol. 18: No. 7, pp. 1–199, October 2018 112
He'll have an episode and you'd like to think that this remote monitoring is like an emergency support…. The whole point of getting it was because we thought, if something goes wrong this will help us. But what I find with it is, we'll get a phone call like three or four days later and at that point, really how is that going to help you?
She shared that it would be helpful to have more active support with the remote monitoring, to have real-time feedback so she knows exactly when her husband is having atrial fibrillation, and clearer indication on when they should go to the hospital:
We still have to use our own judgement and make a call based on what we know…. [It would be better] if the remote monitor was immediate or at least within two hours or something you’d get the call, "Okay he’s showing he’s in AFib, get yourself to the hospital." Because AFib—I mean, you could be in it for 10 minutes and then it goes away and it doesn't come back for another five months—let's say he's in AFib for two hours or something, then he'd like to know that it's an extended period and he should be checked out.
Despite the limitations, she stated that she appreciated having the device:
I would never say to you, "It's not worth it, I'll give it back," never. This to some extent gives us peace of mind. It's just you want that piece of mind and you want it more immediate.
Another participant who is not currently using remote monitoring, when asked if she would like to use it, shared that she was worried about the burden of keeping up with more technology in her life:
I'm sort of half fascinated by the prospect of it and the other half of me goes, it's another thing for me to obsess over.... So, I don't know, I really don't. Like I say, is it another thing for me to obsess over like I do my Fitbit? Or is it just something
that I need really. I don't know.
Conversely, one younger participant said that she would like to have her remote monitoring device connected to an app so that she could more easily monitor her heart functioning:
The one thing that I do know now from the nurse that I work with at the cardiac clinic here is that there's actually an app for, your iPad or your phone or whatever, for the device, and that you can actually look at your own... However, it's not available in Canada. So, it's only available in the states, so I was like, oh, I wish I had that. Because I like to be on top of everything with my health stuff and I like to be able to monitor every little thing, and that would be one great thing to have available here.
Discussion Sixteen people participated in interviews. The results of patient engagement revealed the burden and challenges experienced by people with a heart condition. Participants shared that having an implanted cardiac device affected their lives to varying degrees, with some citing age

Patient Preferences and Values October 2018
Ontario Health Technology Assessment Series; Vol. 18: No. 7, pp. 1–199, October 2018 113
as an additional factor limiting activities. Those with remote monitoring appreciated that the device allowed them to relax somewhat, knowing that they were being looked after. We did not discuss the specific benefits of particular brands of devices as part of the patient engagement for this topic. We did not receive any responses from people around the province who wanted to use remote cardiac monitoring but were unable to access it. However, since not all cardiac clinics in Ontario are using remote monitoring, it is reasonable to expect that there are people who could benefit or may be interested if their clinic used the technology. We were able to talk with people in different regions of the province and, although most were located within 500 kilometers of Toronto, a number of participants described themselves as residing in a rural area. People living in rural areas were particularly enthusiastic about the benefits of remote monitoring since it enabled them to save many hours of travel to and from the clinic. It also allowed them more flexibility to schedule clinic visits; for instance, enabling them to eliminate dangerous winter driving. Several participants expressed concerns with the device, which they described as minor. Every participant using remote monitoring believed that the advantages outweighed any disadvantages. Overwhelmingly, people saw remote cardiac monitoring as something that provided reassurance and helped them avoid unnecessary trips to the emergency room and reduced the number of medical appointments they needed to attend. All of these factors worked to reduce the burden of managing their heart condition.
Conclusions Patients and their family members reported positive experiences with remote cardiac monitoring. Participants perceived that these devices provide important medical and safety benefits in managing their heart condition. Remote cardiac monitoring provides patients and their family members with an increased freedom and reduces anxiety around their heart condition. They trust that the device can help with earlier detection of technical or clinical problems.

October 2018
Ontario Health Technology Assessment Series; Vol. 18: No. 7, pp. 1–199, October 2018 114
CONCLUSIONS OF THE HEALTH TECHNOLOGY ASSESSMENT Remote monitoring of ICDs, CRT-Ds, and pacemakers, plus clinic visits, resulted in improved outcomes without increasing the risk of major adverse events compared with clinic visits alone, and is a cost-effective option for people implanted with cardiac electronic devices. In people implanted with ICDs and CRT-Ds, remote monitoring plus clinic visits reduced the number of clinic visits, the number of people with inappropriate ICD shocks, and the time from medical event onset to both detection by the physician and clinical action without increasing the risk of major adverse events. In people implanted with permanent pacemakers, remote monitoring plus clinic visits compared with clinic visits was associated with a shorter time to detection and treatment of arrhythmias, a lower burden of arrhythmias, and fewer clinic visits without increasing the risk of major adverse events. Our economic analysis indicates that publicly funding remote monitoring plus clinic visits among people implanted with ICD, CRT-P, CRT-D, and pacemakers would likely lead to notional cost savings over 5 years (net budget impact of $1.3 million in the first year, with savings of $7.6 million in the fifth year). Remote monitoring plus clinic visits provides greater QALY gains compared to clinic visits alone at a higher cost among adult ICD and CRT-D recipients with heart failure, and greater QALY gains at a lower cost among adult pacemaker recipients with arrhythmia.
Patients and their family members reported positive experiences with remote cardiac monitoring. Participants perceived that these devices provide important medical and safety benefits in managing their heart condition, while increasing freedom and reducing anxiety.

October 2018
Ontario Health Technology Assessment Series; Vol. 18: No. 7, pp. 1–199, October 2018 115
ABBREVIATIONS
CI Confidence interval
CRT Cardiac resynchronization therapy
CRT-D Cardiac resynchronization therapy with defibrillator
CRT-P Cardiac resynchronization therapy without a defibrillator
GRADE Grading of Recommendations Assessment, Development, and Evaluation
HR Hazard ratio
ICD Implantable cardioverter-defibrillator
ICER Incremental cost-effectiveness ratio
NYHA New York Heart Association
QALY Quality-adjusted life-year
RCT Randomized controlled trial
RM Remote monitoring
RR Relative risk
SD Standard deviation

October 2018
Ontario Health Technology Assessment Series; Vol. 18: No. 7, pp. 1–199, October 2018 116
GLOSSARY
Cost–utility analysis A type of analysis that estimates the value for money of an intervention by weighing the cost of the intervention against the improvements in length of life and quality of life. The result is expressed as a dollar amount per “quality-adjusted life-year” or QALY.
Hazard ratio The chance of an event happening in one study group as compared to the chance of that event happening in the comparison group(s), taking into consideration that it hasn’t happened up to the current point in time.
Incremental cost-effectiveness ratio (ICER)
Determines “a unit of benefit” for an intervention by dividing the incremental cost by the effectiveness. The incremental cost is the difference between the cost of the treatment under study and an alternative treatment. The effectiveness is usually measured as additional years of life or as “quality-adjusted life years.”
Markov model A type of modelling that measures the health state of a patient over the course of treatment. A patient may stay in one health state or move from one health state to another, depending on the effect of the treatment and the progression of the disease.
Mean difference Also known as difference in means, it is the difference between the average values of two different groups (treatment group versus control group).
Probabilistic analysis A method of analysis where aspects of the population under study are given as ranges of possible values rather than as specific numerical values.
Quality-adjusted life-year (QALY)
A measurement that takes into account both the number of years gained by a patient from a procedure and the quality of those extra years (ability to function, freedom from pain, etc.). The QALY is commonly used as an outcome measure in cost–utility analyses.
Reference case analysis
A set of recommended methods used in evaluations to enable the comparison of results for different technologies and different decisions. Promotes uniformity and transparency in analyses.
Risk ratio Also known as “relative risk,” a method of comparison between the risk that an event will occur in one study group and the risk that the event will occur in the comparison group(s).
Scenario analysis
An analysis exploring a range of possible outcomes for an action by projecting the effects of different future events.

October 2018
Ontario Health Technology Assessment Series; Vol. 18: No. 7, pp. 1–199, October 2018 117
APPENDICES
Appendix 1: New York Heart Association Functional Classification
Under the New York Heart Association (NYHA) Functional Classification system,132 the heart failure class (I–IV) is defined according to the severity of the patient’s symptoms as follows. (Note: Higher NYHA class represents a worse functional status.)
• I: No limitation of physical activity. Ordinary physical activity does not cause undue fatigue, palpitation, dyspnea (shortness of breath)
• II: Slight limitation of physical activity. Comfortable at rest. Ordinary physical activity results in fatigue, palpitation, dyspnea (shortness of breath)
• III: Marked limitation of physical activity. Comfortable at rest. Less than ordinary activity causes fatigue, palpitation, or dyspnea
• IV: Unable to carry on any physical activity without discomfort. Symptoms of heart failure at rest. If any physical activity is undertaken, discomfort increases
Original source: Criteria Committee, New York Heart Association, Inc. Diseases of the Heart and Blood Vessels. Nomenclature and Criteria for diagnosis, 6th edition Boston, Little, Brown and Co. 1964, p 114.

Appendices October 2018
Ontario Health Technology Assessment Series; Vol. 18: No. 7, pp. 1–199, October 2018 118
Appendix 2: System Characteristics for Remote Monitoring of Implantable Cardioverter-Defibrillators, Cardiac Resynchronization Therapy, and Permanent Pacemakers
Table A1: Remote Monitoring of ICDs, CRTs, and Pacemakers—Systems’ Characteristics
Features CardioMessenger CareLink Latitude Merlin.net SmartView
Wireless communication
(implanted device––
monitor)
• Radiofrequency • Radiofrequency • Radiofrequency • Radiofrequency • Radiofrequency
Data transmission • Cellular, landline • Cellular (automatic monitor)
• Cellular or WIFI (non-automatic
monitor)
• Cellular, internet, landline • Cellular, internet, landline • Landline, wireless
Transmitter • Mobile or Stationary • Stationary (can be brought when
travelling) • Stationary • Stationary (can be brought
when travelling)
• Stationary (can be brought
when travelling)
Effective communication
range (distance from
device to transmitter)
• 2 meters • 3 meters • Unknown • 3 meters • 3 meters
Data transmission
(Patient needs to be near
the transmitter for data to
be sent)
• Data automatically sent
from implanted device to
monitor (daily)
• Remote data
transmission cannot be
initiated by the patient
• Data sent from the
monitor to central
database and made
available to physician on
secure site
• Data automatically sent from
implanted device to monitor
• Automatically reads implanted
device information at times
scheduled by the clinic
(automatic model)
• Non-automatic model requires
patient initiation of transmission
• Remote data transmission can
be initiated by the patient (both
automatic and non-automatic
model)
• Data sent from the monitor to
central database and made
available to physician on secure
website
• Data automatically sent
from implanted device
information at times
scheduled by the clinic
• Remote data transmission
may also be initiated by
the patient
• Data sent from the
monitor to central
database and made
available to physician on
secure site
• Data automatically sent
from implanted device
information at times
scheduled by the clinic
• Remote data transmission
can also to be initiated by
the patient
• Data sent from the monitor
to central database and
made available to physician
on secure site
• Data automatically sent
from implanted device
information at times
scheduled by the
physician/clinic
• Remote data transmission
can be initiated by the
patient
• Data sent from the monitor
to central database and
made available to physician
on secure website
Frequency of alerts
transmission
(Patient needs to be near
the transmitter for alerts to
be sent)
• Red alerts as events are
detected
• Daily for other alerts
• Automatice model: alerts sent
by device to the monitor If the
device is not within range of the
monitor, the device will attempt
to send the data every 3 hours
for 3 days
• Non-automatic model: no alerts
are sent
• Alerts sentas detected • Daily alert check at 2 a.m. • Daily checks for alerts

Appendices October 2018
Ontario Health Technology Assessment Series; Vol. 18: No. 7, pp. 1–199, October 2018 119
Features CardioMessenger CareLink Latitude Merlin.net SmartView
Remote alert setting by
physician • Yes • No • Yes • Yes • Yes
Physician/Clinic
notification of alerts • Fax, phone, email
• Information made
available on secure
website
• Fax, phone, email
• Information made available on
secure website
• Phone, fax
• Information made
available on secure
website
• Fax, phone, email, text
• Information made available
on secure website
• Fax, phone, email, text
• Information made available
on secure website
Can the physician re-
program the device
remotely (is the feature
currently in use?)
• No • No • No
• No • No
Source: Device manuals and personal communication with manufacturers.

Appendices October 2018
Ontario Health Technology Assessment Series; Vol. 18: No. 7, pp. 1–199, October 2018 120
Appendix 3: Literature Search Strategies
Clinical Evidence Search
Search date: June 1, 2017 Databases searched: Ovid MEDLINE, Embase, Cochrane Database of Systematic Reviews, Cochrane Central Register of Controlled Trials, CRD Health Technology Assessment Database, NHS Economic Evaluation Database, and CINAHL. Database: EBM Reviews - Cochrane Central Register of Controlled Trials <April 2017>, EBM Reviews - Cochrane Database of Systematic Reviews <2005 to May 24, 2017>, EBM Reviews - Health Technology Assessment <4th Quarter 2016>, EBM Reviews - NHS Economic Evaluation Database <1st Quarter 2016>, Embase <1980 to 2017 Week 22>, All Ovid MEDLINE(R) <1946 to Present>. Search Strategy: -------------------------------------------------------------------------------- 1 Defibrillators, Implantable/ (27255) 2 exp Cardiac Pacing, Artificial/ (60442) 3 exp Pacemaker, Artificial/ (96482) 4 (((cardiac or cardiovascular or cardio vascular) adj2 implant* adj2 electronic adj2 device*) or (cardiac resynchroni#ation adj2 (therap* or defibrillator* or device*)) or (Implant* adj1 (cardiac or cardioverter) adj1 (defibrillator* or device*)) or ((implant* or dual chamber or biventricular or ventricular) adj1 defibrillator*) or pacemaker or pacemakers or CRT-D or CRT-Ds or CRT-P or CRT-Ps or ICD or ICDs or CIED or CIEDs).ti,ab,kf. (185360) 5 or/1-4 (270805) 6 Monitoring, Physiologic/ (54453) 7 exp Monitoring, Ambulatory/ (39424) 8 exp Telemetry/ (32544) 9 exp Telecommunications/ (135822) 10 Internet/ (155893) 11 (((remote or remotely) adj1 monitor*) or home monitor* or ((remote or remotely) adj2 (followup* or follow up*)) or ((remote or remotely) adj1 (interrogat* or manag* or notification* or patient monitor* or rhythm monitor* or data transmi*)) or telemonitor* or tele-monitor* or telemedicine or tele-medicine or telecardio* or tele-cardio* or teleconsult* or tele-consult* or telemetry).ti,ab,kf. (46467) 12 or/6-11 (399982) 13 5 and 12 (7767) 14 (Cardiomessenger* or CareLink* or (Latitude* adj2 (patient management system* or remote monitor*)) or Smartview* or Merlin?home* or Merlin?net* or (home monitor* system* adj3 biotronik)).ti,ab,kf. (563) 15 remote cardiac monitor*.ti,ab,kf. (24) 16 or/13-15 (8064) 17 limit 16 to (english language and yr="2010 -Current") [Limit not valid in CDSR; records were retained] (3847) 18 17 use ppez,cctr,coch,clhta,cleed (1350) 19 implantable cardioverter defibrillator/ (47206) 20 cardiac resynchronization therapy/ (18017) 21 exp artificial heart pacemaker/ (70165) 22 (((cardiac or cardiovascular or cardio vascular) adj2 implant* adj2 electronic adj2 device*) or (cardiac resynchroni#ation adj2 (therap* or defibrillator* or device*)) or (Implant* adj1 (cardiac

Appendices October 2018
Ontario Health Technology Assessment Series; Vol. 18: No. 7, pp. 1–199, October 2018 121
or cardioverter) adj1 (defibrillator* or device*)) or ((implant* or dual chamber or biventricular or ventricular) adj1 defibrillator*) or pacemaker or pacemakers or CRT-D or CRT-Ds or CRT-P or CRT-Ps or ICD or ICDs or CIED or CIEDs).tw,kw,dv. (188801) 23 or/19-22 (239914) 24 physiologic monitoring/ (56134) 25 ambulatory monitoring/ (18304) 26 home monitoring/ (3761) 27 self monitoring/ (6016) 28 patient monitoring/ (130513) 29 exp telemedicine/ (51025) 30 exp telemetry/ (32544) 31 internet/ (155893) 32 (((remote or remotely) adj1 monitor*) or home monitor* or ((remote or remotely) adj2 (followup* or follow up*)) or ((remote or remotely) adj1 (interrogat* or manag* or notification* or patient monitor* or rhythm monitor* or data transmi*)) or telemonitor* or tele-monitor* or telemedicine or tele-medicine or telecardio* or tele-cardio* or teleconsult* or tele-consult* or telemetry).tw,kw,dv. (49438) 33 or/24-32 (399685) 34 23 and 33 (6223) 35 (Cardiomessenger* or CareLink* or (Latitude* adj2 (patient management system* or remote monitor*)) or Smartview* or Merlin?home* or Merlin?net* or (home monitor* system* adj3 biotronik)).tw,kw,dv. (642) 36 remote cardiac monitor*.tw,kw,dv. (24) 37 or/34-36 (6551) 38 limit 37 to (english language and yr="2010 -Current") [Limit not valid in CDSR; records were retained] (3753) 39 38 use emez (2778) 40 18 or 39 (4128) 41 40 use ppez (1151) 42 40 use cctr (180) 43 40 use coch (1) 44 40 use cleed (7) 45 40 use clhta (11) 46 40 use emez (2778) 47 remove duplicates from 40 (3259) CINAHL
# Query Results
S1 (MH "Defibrillators, Implantable") 7,587
S2 (MH "Cardiac Pacing, Artificial+") 6,725
S3 (MH "Pacemaker, Artificial") 6,066
S4
(((cardiac or cardiovascular or cardio vascular) N2 implant* N2 electronic N2 device*) or (cardiac resynchroni?ation N2 (therap* or defibrillator* or device*)) or (Implant* N1 (cardiac or cardioverter) N1 (defibrillator* or device*)) or ((implant* or dual chamber or biventricular or ventricular) N1 defibrillator*) or pacemaker or pacemakers or CRT-D or CRT-Ds or CRT-P or CRT-Ps or ICD or ICDs or CIED 26,344

Appendices October 2018
Ontario Health Technology Assessment Series; Vol. 18: No. 7, pp. 1–199, October 2018 122
or CIEDs)
S5 S1 OR S2 OR S3 OR S4 28,624
S6 (MH "Monitoring, Physiologic") 15,809
S7 (MH "Electrocardiography, Ambulatory") 2,103
S8 (MH "Telemetry") 1,516
S9 (MH "Telecommunications+") 93,047
S10
(((remote or remotely) N1 monitor*) or home monitor* or ((remote or remotely) N2 (followup* or follow up*)) or ((remote or remotely) N1 (interrogat* or manag* or notification* or patient monitor* or rhythm monitor* or data transmi*)) or telemonitor* or tele-monitor* or telemedicine or tele-medicine or telecardio* or tele-cardio* or teleconsult* or tele-consult* or telemetry) 12,416
S11 S6 OR S7 OR S8 OR S9 OR S10 113,712
S12 S5 AND S11 1,268
S13
(Cardiomessenger* or CareLink* or (Latitude* N2 (patient management system* or remote monitor*)) or Smartview* or Merlin?home* or Merlin?net* or (home monitor* system* N3 biotronik)) 60
S14 remote cardiac monitor* 49
S15 S12 OR S13 OR S14 1,310
S16 S12 OR S13 OR S14 Limiters - Published Date: 20100101-20171231; English Language 622
Economic Evidence Search
Search date: June 2, 2017 Databases searched: Ovid MEDLINE, Embase, Cochrane Central Register of Controlled Trials, Cochrane Database of Systematic Reviews, Centre for Reviews and Dissemination (CRD) Health Technology Assessment Database, National Health Service (NHS) Economic Evaluation Database and Cumulative Index to Nursing and Allied Health Literature (CINAHL). Database: EBM Reviews - Cochrane Central Register of Controlled Trials <April 2017>, EBM Reviews - Cochrane Database of Systematic Reviews <2005 to May 24, 2017>, EBM Reviews - Health Technology Assessment <4th Quarter 2016>, EBM Reviews - NHS Economic Evaluation Database <1st Quarter 2016>, Embase <1980 to 2017 Week 22>, All Ovid MEDLINE(R) <1946 to Present>. Search Strategy: -------------------------------------------------------------------------------- 1 Defibrillators, Implantable/ (27258) 2 exp Cardiac Pacing, Artificial/ (60442) 3 exp Pacemaker, Artificial/ (96486) 4 (((cardiac or cardiovascular or cardio vascular) adj2 implant* adj2 electronic adj2 device*) or (cardiac resynchroni#ation adj2 (therap* or defibrillator* or device*)) or (Implant* adj1 (cardiac

Appendices October 2018
Ontario Health Technology Assessment Series; Vol. 18: No. 7, pp. 1–199, October 2018 123
or cardioverter) adj1 (defibrillator* or device*)) or ((implant* or dual chamber or biventricular or ventricular) adj1 defibrillator*) or pacemaker or pacemakers or CRT-D or CRT-Ds or CRT-P or CRT-Ps or ICD or ICDs or CIED or CIEDs).ti,ab,kf. (185387) 5 or/1-4 (270832) 6 Monitoring, Physiologic/ (54453) 7 exp Monitoring, Ambulatory/ (39426) 8 exp Telemetry/ (32545) 9 exp Telecommunications/ (135827) 10 Internet/ (155899) 11 (((remote or remotely) adj1 monitor*) or home monitor* or ((remote or remotely) adj2 (followup* or follow up*)) or ((remote or remotely) adj1 (interrogat* or manag* or notification* or patient monitor* or rhythm monitor* or data transmi*)) or telemonitor* or tele-monitor* or telemedicine or tele-medicine or telecardio* or tele-cardio* or teleconsult* or tele-consult* or telemetry).ti,ab,kf. (46482) 12 or/6-11 (400010) 13 5 and 12 (7767) 14 (Cardiomessenger* or CareLink* or (Latitude* adj2 (patient management system* or remote monitor*)) or Smartview* or Merlin?home* or Merlin?net* or (home monitor* system* adj3 biotronik)).ti,ab,kf. (563) 15 remote cardiac monitor*.ti,ab,kf. (24) 16 or/13-15 (8064) 17 economics/ (251513) 18 economics, medical/ or economics, pharmaceutical/ or exp economics, hospital/ or economics, nursing/ or economics, dental/ (767580) 19 economics.fs. (400987) 20 (econom* or price or prices or pricing or priced or discount* or expenditure* or budget* or pharmacoeconomic* or pharmaco-economic*).ti,ab,kf. (748930) 21 exp "costs and cost analysis"/ (536764) 22 (cost or costs or costing or costly).ti. (231235) 23 cost effective*.ti,ab,kf. (267409) 24 (cost* adj2 (util* or efficacy* or benefit* or minimi* or analy* or saving* or estimate* or allocation or control or sharing or instrument* or technolog*)).ab. (173500) 25 models, economic/ (10558) 26 markov chains/ or monte carlo method/ (69438) 27 (decision adj1 (tree* or analy* or model*)).ti,ab,kf. (34487) 28 (markov or markow or monte carlo).ti,ab,kf. (110177) 29 quality-adjusted life years/ (32452) 30 (QOLY or QOLYs or HRQOL or HRQOLs or QALY or QALYs or QALE or QALEs).ti,ab,kf. (55500) 31 ((adjusted adj (quality or life)) or (willing* adj2 pay) or sensitivity analys*s).ti,ab,kf. (89812) 32 or/17-31 (2256415) 33 16 and 32 (706) 34 33 use ppez,cctr,coch,clhta (251) 35 16 use cleed (9) 36 or/34-35 (260) 37 limit 36 to english language [Limit not valid in CDSR; records were retained] (227) 38 limit 37 to yr="2010 -Current" (147) 39 implantable cardioverter defibrillator/ (47209) 40 cardiac resynchronization therapy/ (18017) 41 exp artificial heart pacemaker/ (70165)
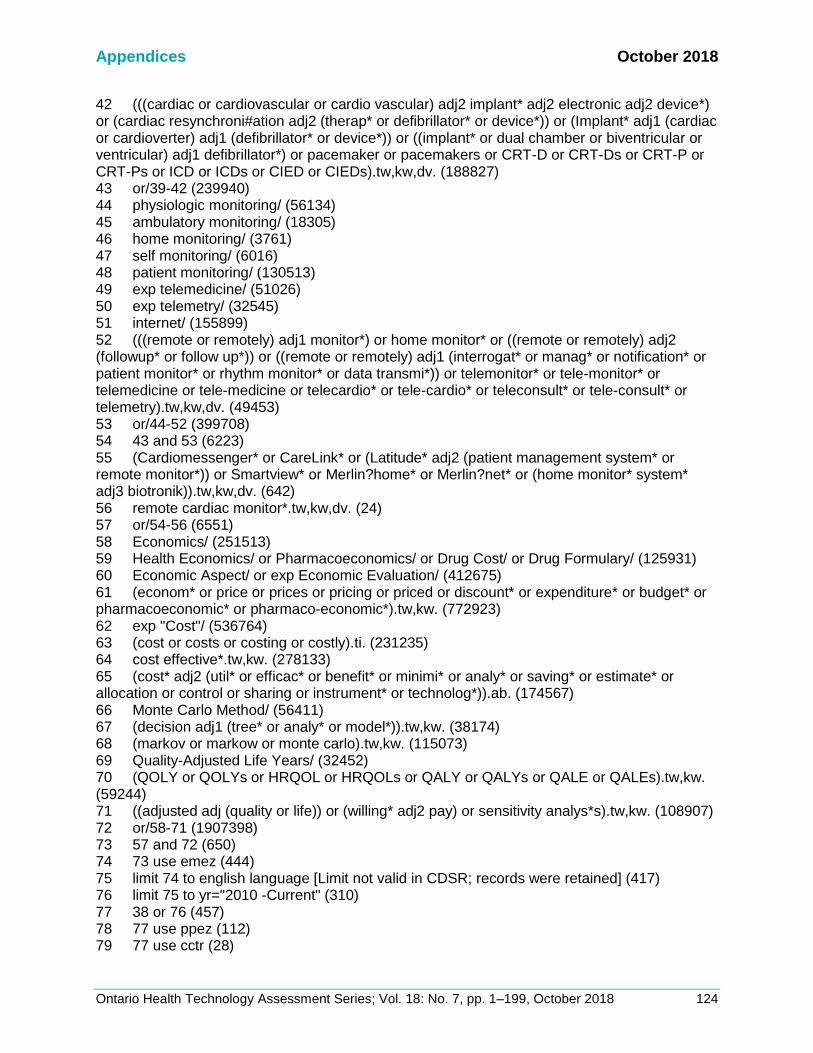
Appendices October 2018
Ontario Health Technology Assessment Series; Vol. 18: No. 7, pp. 1–199, October 2018 124
42 (((cardiac or cardiovascular or cardio vascular) adj2 implant* adj2 electronic adj2 device*) or (cardiac resynchroni#ation adj2 (therap* or defibrillator* or device*)) or (Implant* adj1 (cardiac or cardioverter) adj1 (defibrillator* or device*)) or ((implant* or dual chamber or biventricular or ventricular) adj1 defibrillator*) or pacemaker or pacemakers or CRT-D or CRT-Ds or CRT-P or CRT-Ps or ICD or ICDs or CIED or CIEDs).tw,kw,dv. (188827) 43 or/39-42 (239940) 44 physiologic monitoring/ (56134) 45 ambulatory monitoring/ (18305) 46 home monitoring/ (3761) 47 self monitoring/ (6016) 48 patient monitoring/ (130513) 49 exp telemedicine/ (51026) 50 exp telemetry/ (32545) 51 internet/ (155899) 52 (((remote or remotely) adj1 monitor*) or home monitor* or ((remote or remotely) adj2 (followup* or follow up*)) or ((remote or remotely) adj1 (interrogat* or manag* or notification* or patient monitor* or rhythm monitor* or data transmi*)) or telemonitor* or tele-monitor* or telemedicine or tele-medicine or telecardio* or tele-cardio* or teleconsult* or tele-consult* or telemetry).tw,kw,dv. (49453) 53 or/44-52 (399708) 54 43 and 53 (6223) 55 (Cardiomessenger* or CareLink* or (Latitude* adj2 (patient management system* or remote monitor*)) or Smartview* or Merlin?home* or Merlin?net* or (home monitor* system* adj3 biotronik)).tw,kw,dv. (642) 56 remote cardiac monitor*.tw,kw,dv. (24) 57 or/54-56 (6551) 58 Economics/ (251513) 59 Health Economics/ or Pharmacoeconomics/ or Drug Cost/ or Drug Formulary/ (125931) 60 Economic Aspect/ or exp Economic Evaluation/ (412675) 61 (econom* or price or prices or pricing or priced or discount* or expenditure* or budget* or pharmacoeconomic* or pharmaco-economic*).tw,kw. (772923) 62 exp "Cost"/ (536764) 63 (cost or costs or costing or costly).ti. (231235) 64 cost effective*.tw,kw. (278133) 65 (cost* adj2 (util* or efficac* or benefit* or minimi* or analy* or saving* or estimate* or allocation or control or sharing or instrument* or technolog*)).ab. (174567) 66 Monte Carlo Method/ (56411) 67 (decision adj1 (tree* or analy* or model*)).tw,kw. (38174) 68 (markov or markow or monte carlo).tw,kw. (115073) 69 Quality-Adjusted Life Years/ (32452) 70 (QOLY or QOLYs or HRQOL or HRQOLs or QALY or QALYs or QALE or QALEs).tw,kw. (59244) 71 ((adjusted adj (quality or life)) or (willing* adj2 pay) or sensitivity analys*s).tw,kw. (108907) 72 or/58-71 (1907398) 73 57 and 72 (650) 74 73 use emez (444) 75 limit 74 to english language [Limit not valid in CDSR; records were retained] (417) 76 limit 75 to yr="2010 -Current" (310) 77 38 or 76 (457) 78 77 use ppez (112) 79 77 use cctr (28)

Appendices October 2018
Ontario Health Technology Assessment Series; Vol. 18: No. 7, pp. 1–199, October 2018 125
80 77 use coch (0) 81 77 use cleed (7) 82 77 use clhta (0) 83 77 use emez (310) 84 remove duplicates from 77 (343) CINAHL
# Query Results
S1 (MH "Defibrillators, Implantable") 7,587
S2 (MH "Cardiac Pacing, Artificial+") 6,725
S3 (MH "Pacemaker, Artificial") 6,066
S4
(((cardiac or cardiovascular or cardio vascular) N2 implant* N2 electronic N2 device*) or (cardiac resynchroni?ation N2 (therap* or defibrillator* or device*)) or (Implant* N1 (cardiac or cardioverter) N1 (defibrillator* or device*)) or ((implant* or dual chamber or biventricular or ventricular) N1 defibrillator*) or pacemaker or pacemakers or CRT-D or CRT-Ds or CRT-P or CRT-Ps or ICD or ICDs or CIED or CIEDs) 26,344
S5 S1 OR S2 OR S3 OR S4 28,624
S6 (MH "Monitoring, Physiologic") 15,809
S7 (MH "Electrocardiography, Ambulatory") 2,103
S8 (MH "Telemetry") 1,516
S9 (MH "Telecommunications+") 93,047
S10
(((remote or remotely) N1 monitor*) or home monitor* or ((remote or remotely) N2 (followup* or follow up*)) or ((remote or remotely) N1 (interrogat* or manag* or notification* or patient monitor* or rhythm monitor* or data transmi*)) or telemonitor* or tele-monitor* or telemedicine or tele-medicine or telecardio* or tele-cardio* or teleconsult* or tele-consult* or telemetry) 12,416
S11 S6 OR S7 OR S8 OR S9 OR S10 113,712
S12 S5 AND S11 1,268
S13
(Cardiomessenger* or CareLink* or (Latitude* N2 (patient management system* or remote monitor*)) or Smartview* or Merlin?home* or Merlin?net* or (home monitor* system* N3 biotronik)) 60
S14 remote cardiac monitor* 49
S15 S12 OR S13 OR S14 1,310
S16 (MH "Economics") 11,217
S17 (MH "Economic Aspects of Illness") 6,738

Appendices October 2018
Ontario Health Technology Assessment Series; Vol. 18: No. 7, pp. 1–199, October 2018 126
S18 (MH "Economic Value of Life") 520
S19 MH "Economics, Dental" 108
S20 MH "Economics, Pharmaceutical" 1,786
S21 MW "ec" 142,920
S22 (econom* or price or prices or pricing or priced or discount* or expenditure* or budget* or pharmacoeconomic* or pharmaco-economic*) 219,946
S23 (MH "Costs and Cost Analysis+") 85,724
S24 TI cost* 40,502
S25 (cost effective*) 29,378
S26 AB (cost* N2 (util* or efficacy* or benefit* or minimi* or analy* or saving* or estimate* or allocation or control or sharing or instrument* or technolog*)) 20,253
S27 (decision N1 (tree* or analy* or model*)) 5,310
S28 (markov or markow or monte carlo) 3,464
S29 (MH "Quality-Adjusted Life Years") 2,690
S30 (QOLY or QOLYs or HRQOL or HRQOLs or QALY or QALYs or QALE or QALEs) 6,575
S31 ((adjusted N1 (quality or life)) or (willing* N2 pay) or sensitivity analys?s) 12,304
S32 S16 OR S17 OR S18 OR S19 OR S20 OR S21 OR S22 OR S23 OR S24 OR S25 OR S26 OR S27 OR S28 OR S29 OR S30 OR S31 294,156
S33 S15 AND S32 85
S34 S15 AND S32 Limiters - Published Date: 20100101-20171231; English Language 57
Health State Utility Value Search Search date: July 21, 2017 Database: All Ovid MEDLINE(R) <1946 to Present> Search Strategy: -------------------------------------------------------------------------------- 1 Defibrillators, Implantable/ (14918) 2 exp Cardiac Pacing, Artificial/ (23628) 3 exp Pacemaker, Artificial/ (25744) 4 (((cardiac or cardiovascular or cardio vascular) adj2 implant* adj2 electronic adj2 device*) or (cardiac resynchroni#ation adj2 (therap* or defibrillator* or device*)) or (Implant* adj1 (cardiac or cardioverter) adj1 (defibrillator* or device*)) or ((implant* or dual chamber or biventricular or ventricular) adj1 defibrillator*) or pacemaker or pacemakers or CRT-D or CRT-Ds or CRT-P or CRT-Ps or ICD or ICDs or CIED or CIEDs).ti,ab,kf. (73137) 5 or/1-4 (97392) 6 Monitoring, Physiologic/ (51382)

Appendices October 2018
Ontario Health Technology Assessment Series; Vol. 18: No. 7, pp. 1–199, October 2018 127
7 exp Monitoring, Ambulatory/ (26136) 8 exp Telemetry/ (11539) 9 exp Telecommunications/ (79980) 10 Internet/ (62904) 11 (((remote or remotely) adj1 monitor*) or home monitor* or ((remote or remotely) adj2 (followup* or follow up*)) or ((remote or remotely) adj1 (interrogat* or manag* or notification* or patient monitor* or rhythm monitor* or data transmi*)) or telemonitor* or tele-monitor* or telemedicine or tele-medicine or telecardio* or tele-cardio* or teleconsult* or tele-consult* or telemetry).ti,ab,kf. (20460) 12 or/6-11 (216707) 13 5 and 12 (4018) 14 (Cardiomessenger* or CareLink* or (Latitude* adj2 (patient management system* or remote monitor*)) or Smartview* or Merlin?home* or Merlin?net* or (home monitor* system* adj3 biotronik)).ti,ab,kf. (117) 15 remote cardiac monitor*.ti,ab,kf. (8) 16 or/13-15 (4075) 17 Quality-Adjusted Life Years/ (9815) 18 (quality adjusted or adjusted life year*).tw. (12638) 19 (qaly* or qald* or qale* or qtime*).tw. (8146) 20 (illness state$1 or health state$1).tw. (5384) 21 (hui or hui1 or hui2 or hui3).tw. (1229) 22 (multiattribute* or multi attribute*).tw. (723) 23 (utility adj3 (score$1 or valu* or health* or cost* or measure* or disease* or mean or gain or gains or index*)).tw. (11464) 24 utilities.tw. (5814) 25 (eq-5d or eq5d or eq-5 or eq5 or euro qual or euroqual or euro qual5d or euroqual5d or euro qol or euroqol or euro qol5d or euroqol5d or euro quol or euroquol or euro quol5d or euroquol5d or eur qol or eurqol or eur qol5d or eurqol5d or euro?qul or eur?qul5d or euro* quality of life or European qol).tw. (7923) 26 (euro* adj3 (5 d or 5d or 5 dimension* or 5dimension* or 5 domain* or 5domain*)).tw. (2697) 27 (sf36* or sf 36* or sf thirtysix or sf thirty six).tw. (19038) 28 (time trade off$1 or time tradeoff$1 or tto or timetradeoff$1).tw. (1648) 29 ((qol or hrqol or quality of life).ti. or *quality of life/) and ((qol or hrqol* or quality of life) adj2 (increas* or decreas* or improve* or declin* or reduc* or high* or low* or effect or effects of worse or score or scores or change$1 or impact$1 or impacted or deteriorate$)).ab. (24803) 30 Cost-Benefit Analysis/ and (cost effectiveness ratio* and (perspective* or life expectanc*)).tw. (2660) 31 *quality of life/ and (quality of life or qol).ti. (44877) 32 quality of life/ and ((quality of life or qol) adj3 (improve* or chang*)).tw. (19630) 33 quality of life/ and ((quality of life or qol) adj (score$1 or measure$1)).tw. (9733) 34 quality of life/ and health-related quality of life.tw. (24667) 35 quality of life/ and ec.fs. (8824) 36 quality of life/ and (health adj3 status).tw. (7528) 37 (quality of life or qol).tw. and cost-benefit analysis/ (10017) 38 models, economic/ (8493) 39 or/17-38 (130162) 40 16 and 39 (66) 41 limit 40 to english language (60)

Appendices October 2018
Ontario Health Technology Assessment Series; Vol. 18: No. 7, pp. 1–199, October 2018 128
Grey Literature Performed: May 29 to June 5, 2017 Websites searched: HTA Database Canadian Repository, Alberta Health Technologies Decision Process reviews, Canadian Agency for Drugs and Technologies in Health (CADTH), Institut national d’excellence en santé et en services sociaux (INESSS), Institute of Health Economics (IHE), McGill University Health Centre Health Technology Assessment Unit, National Institute for Health and Care Excellence (NICE), Agency for Health care Research and Quality (AHRQ) Evidence-based Practice Centers, Australian Government Medical Services Advisory Committee, Centers for Medicare & Medicaid Services Technology Assessments, Institute for Clinical and Economic Review, Ireland Health Information and Quality Authority Health Technology Assessments, Washington State Health Care Authority Health Technology Reviews, ClinicalTrials.gov, Tufts CEA Registry. Keywords used: remote cardiac monitor, remote cardiac monitors, remote cardiac monitoring, cardiomessenger, cardiomessengers, carelink, smartview, merlin, cardiac implantable electronic devices, implantable cardioverter defibrillator, cardiac resynchronization therapy. Results: 6
• 19 clinical trials not included in PRISMA total
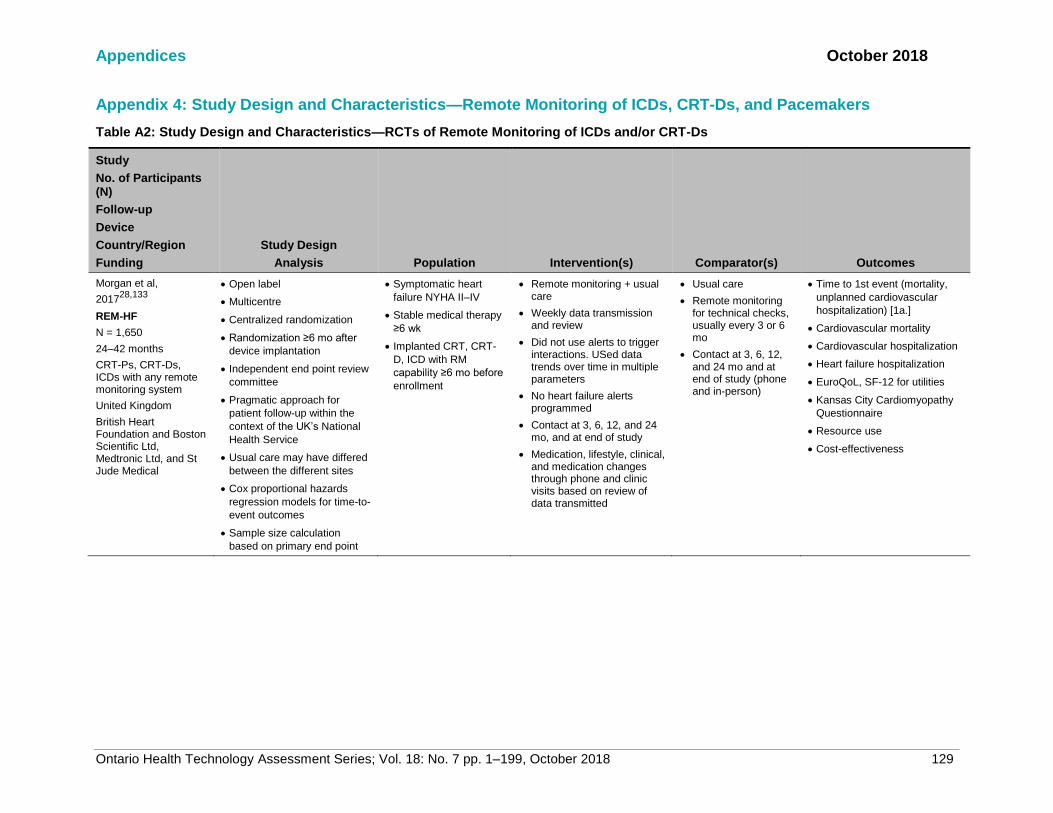
Appendices October 2018
Ontario Health Technology Assessment Series; Vol. 18: No. 7 pp. 1–199, October 2018 129
Appendix 4: Study Design and Characteristics—Remote Monitoring of ICDs, CRT-Ds, and Pacemakers
Table A2: Study Design and Characteristics—RCTs of Remote Monitoring of ICDs and/or CRT-Ds
Study
No. of Participants (N)
Follow-up
Device
Country/Region
Funding
Study Design
Analysis Population Intervention(s) Comparator(s) Outcomes
Morgan et al,
201728,133
REM-HF
N = 1,650
24–42 months
CRT-Ps, CRT-Ds, ICDs with any remote monitoring system
United Kingdom
British Heart Foundation and Boston Scientific Ltd, Medtronic Ltd, and St Jude Medical
• Open label
• Multicentre
• Centralized randomization
• Randomization ≥6 mo after
device implantation
• Independent end point review
committee
• Pragmatic approach for
patient follow-up within the
context of the UK’s National
Health Service
• Usual care may have differed
between the different sites
• Cox proportional hazards
regression models for time-to-
event outcomes
• Sample size calculation
based on primary end point
• Symptomatic heart
failure NYHA II–IV
• Stable medical therapy
≥6 wk
• Implanted CRT, CRT-
D, ICD with RM
capability ≥6 mo before
enrollment
• Remote monitoring + usual care
• Weekly data transmission and review
• Did not use alerts to trigger interactions. USed data trends over time in multiple parameters
• No heart failure alerts programmed
• Contact at 3, 6, 12, and 24 mo, and at end of study
• Medication, lifestyle, clinical, and medication changes through phone and clinic visits based on review of data transmitted
• Usual care
• Remote monitoring for technical checks, usually every 3 or 6 mo
• Contact at 3, 6, 12, and 24 mo and at end of study (phone and in-person)
• Time to 1st event (mortality,
unplanned cardiovascular
hospitalization) [1a.]
• Cardiovascular mortality
• Cardiovascular hospitalization
• Heart failure hospitalization
• EuroQoL, SF-12 for utilities
• Kansas City Cardiomyopathy
Questionnaire
• Resource use
• Cost-effectiveness

Appendices October 2018
Ontario Health Technology Assessment Series; Vol. 18: No. 7 pp. 1–199, October 2018 130
Study
No. of Participants (N)
Follow-up
Device
Country/Region
Funding
Study Design
Analysis Population Intervention(s) Comparator(s) Outcomes
Boriani et al, 201750
and 201047
MORE-CARE
N = 865
Phase 1: 1 year
Phase 2: 2 years
Phase 1: CRT-D with CareLink and Optivol function
PHASE 2: terminated early due to slow enrollment
Italy
Medtronic Inc.
• Open label
• Centralized randomization
• Randomization within 8 wk of
device implantation
• Time-to-event analysis using
Kaplan-Meier curve and log-
rank test and Cox
proportional hazards
regression models
• Event adjudication committee
verified study end points
• Sample size calculation
based on primary end point
• NYHA III or IV
• LVEF ≤35%
• QRS ≥120 ms
• With class I indication
for CRT-D
• Within 8 wk of
implantation
• Had not previously
received CareLink
Network monitor
• Optimized medical
treatment
• Remote monitoring
• Visits every 4 mo alternating between clinic visits and remote data transmission
• Automatic alerts for lung fluid accumulation, atrial tachyarrhythmia/fibrillation, and system integrity
• Some audible alerts to the patient enabled
• No remote monitoring
• Clinic visits every 4
mo
• Some audible alerts to
the patient enabled
Phase 1
• Time from event detection to
clinical action (1a.)
• Time from clinical decision to
resolution of event
• Minnesotal Living With Heart
Failure (QoL)
• EQ-5D (QoL)
Phase 2
• Composite end point (death
from any cause,
cardiovascular and device-
related hospitalizations >48 hr)
[1a.]
• Hospitalizations
• LOS
• QOL
• Patients with optimal medical
treatment for AF
• Costs and health care
resources

Appendices October 2018
Ontario Health Technology Assessment Series; Vol. 18: No. 7 pp. 1–199, October 2018 131
Study
No. of Participants (N)
Follow-up
Device
Country/Region
Funding
Study Design
Analysis Population Intervention(s) Comparator(s) Outcomes
Sardu et al, 201632
TELECART
N = 183 (89/94)
12 months
CRT-Ds with Home Monitoring
Italy
Funding not provided
• Open label
• Multicentre
• Centralized randomization
• Randomization before the
implantation procedure
• Unclear which outcome was
used for sample size
calculation
• Standard indications
for CRT-D
• Chronic heart failure ≥3
mo
• NYHA II or III
• Left bundle branch
block
• LVEF <35%
Exclusions:
• Prior ICD, CRT-D, or
pacemaker
implantation
• Remote monitoring + standard care
• Office visits at 10 d, and 1, 3, 6, and 12 mo after clinical discharge
• Automatic daily remote monitoring + alerts
• Data reviewed daily on working days by central committee and by investigators according to their clinical routine
• No remote monitoring
(standard care)
• Office visits at 10 d,
and 1, 3, 6, and 12
mo after clinical
discharge
• Mortality (all-cause and
cardiovascular) [1a.]
• HF hospitalization (1a.)
• ICD shocks
• % CRT-D responders

Appendices October 2018
Ontario Health Technology Assessment Series; Vol. 18: No. 7 pp. 1–199, October 2018 132
Study
No. of Participants (N)
Follow-up
Device
Country/Region
Funding
Study Design
Analysis Population Intervention(s) Comparator(s) Outcomes
Bohm et al, 201631,134
OptiLink HF
N = 1,002
18–24 months
ICDs or CRT-Ds with Carelink and OptiVol Fluid Status Monitoring
Germany
Medtronic PLC (Minneapolis, MN, USA)
• Open label
• Multicentre
• Centralized randomization
stratified by NYHA, AF
history, VT/VF history, and
ischemic status
• Enrolment 3–21 d after
implantation
• Follow-up extended during
the study to until all patients
completed 18 mo due to slow
enrolment
• Time-to-event analysis using
Kaplan-Meier curve and
stratified log-rank test and
Cox proportional hazards
regression models
• Independent Data Safety
Monitoring Board reviewed
outcomes
• Sample size calculation
based on primary end point
• Stable, chronic HF
NYHA II–III
• LVEF ≤35%
• ICD or CRT-D
implantation/
replacement
• One of the conditions:
HF hospitalization in
the last 12 mo, diuretic
treatment in the last 30
d, or increased BNP/N-
terminal-pro-BNP
within 30 d
For CRT-D patients
• QRS ≥120 ms
• Left ventricular
diameter ≥55 mm
• Remote monitoring + OptiVol fluid status monitoring
• Only intrathoracic fluid index threshold crossing alerts, programmed at investigator’s discretion
• No audible alerts to the patient
• Data transmission or clinic
visits every 6 mo
• No remote monitoring
• Clinic visits every 6
mo
• No audible alerts to
the patient
• Composite (all-cause mortality
and CV hospitalization) [1a.]
• All-cause mortality
• Cardiovascular mortality
• Composite of all-cause
mortality and hospitalization for
heart failure
• Cardiovascular hospitalizations
• Heart failure hospitalizations
• All-cause hospitalizations

Appendices October 2018
Ontario Health Technology Assessment Series; Vol. 18: No. 7 pp. 1–199, October 2018 133
Study
No. of Participants (N)
Follow-up
Device
Country/Region
Funding
Study Design
Analysis Population Intervention(s) Comparator(s) Outcomes
Heidbuchel et al, 201533
EuroEco
N = 312
24 months
ICDs with Home Monitoring (CRT cohort ongoing)
Europe
Biotronik SE & Co. KG, Berlin, Germany
• Open label
• Multicentre
• Randomization procedure not
described
• Randomization at hospital
discharge
• Actions taken by physicians
evaluated for clinical
relevance by two blinded
assessors
• No survival analysis
• Sample size calculation
based on reduction in time
needed for follow-up
• Standard indication for
new or replacement
ICD
• Remote monitoring
• Clinic visits at 6 wk after discharge, and at 12 and 24 mo
• Daily data transmission
• Frequency of RM data review and response to alerts at physician’s discretion
• No remote monitoring
• Clinic visits at 6 wk after discharge, and at 12 and 24 mo + scheduled visits according to centre’s routine
• Cost analysis (1a.)
• Hospital admissions
• Office visits
• QOL (SF-36)
• Staff time
Zabel et al, 20135 and Luthje et al, 201534
N = 176CONNECT-Optivol
15 months
ICDs and CRT-Ds with CareLink and OptiVol alerts
Germany
Medtronic Inc.
• Open label
• One centre
• Centralized randomization
stratified by device type
• Randomization at 1 mo after
implantation
• Adverse events reviewed
without knowledge of the
treatment group
• Kaplan-Meier and Cox
proportional hazards analyses
for time-to-event outcomes
• Pilot study, no sample size
calculation
• Indication for CRT-D or
ICD (new or
replacement)
• Remote monitoring with OptiVol alerts
• Automatic alerts sent to investigator
• Remote visits at 3, 6, 9, and 12 mo
• Clinic visit at 15 mo
• No remote monitoring
• Audio OptiVol
disabled
• Clinic visits every 3
mo
• Time to 1st heart failure
hospitalization (1a.)
• Time to 1st ICD shock
• Tachyarrhythmias
• Mortality
• Time to death
• Clinic visits
• Hospitalizations
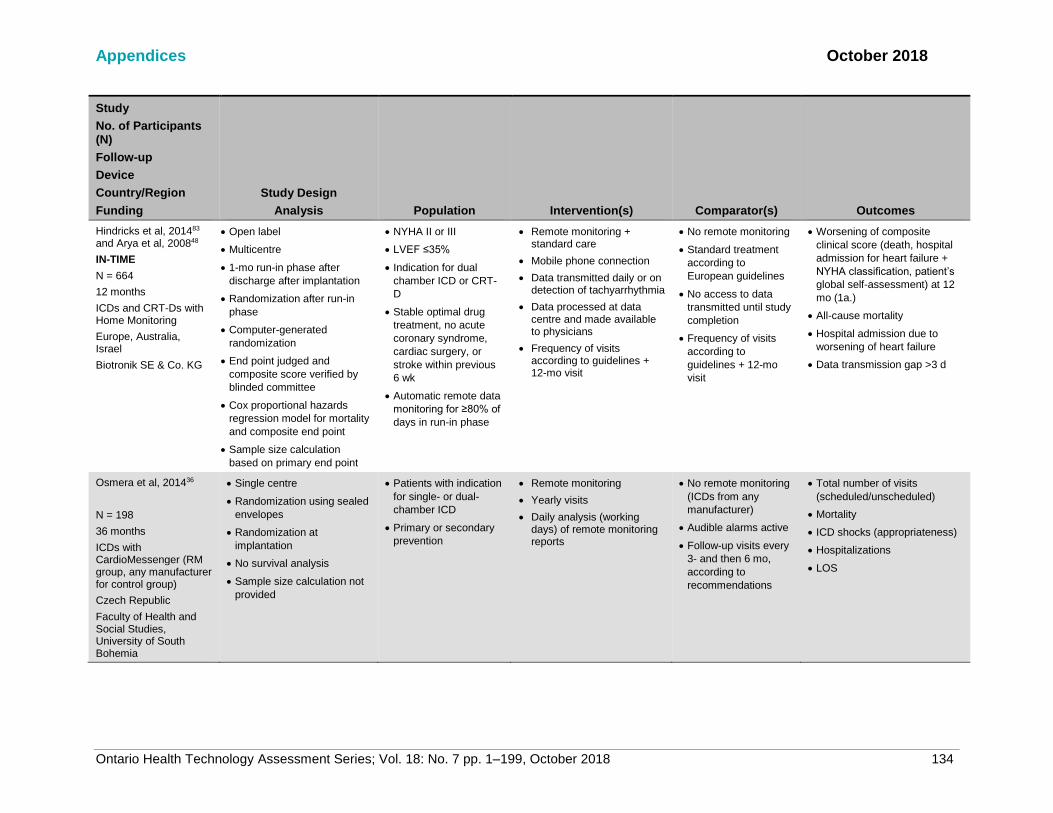
Appendices October 2018
Ontario Health Technology Assessment Series; Vol. 18: No. 7 pp. 1–199, October 2018 134
Study
No. of Participants (N)
Follow-up
Device
Country/Region
Funding
Study Design
Analysis Population Intervention(s) Comparator(s) Outcomes
Hindricks et al, 201483 and Arya et al, 200848
IN-TIME
N = 664
12 months
ICDs and CRT-Ds with Home Monitoring
Europe, Australia, Israel
Biotronik SE & Co. KG
• Open label
• Multicentre
• 1-mo run-in phase after
discharge after implantation
• Randomization after run-in
phase
• Computer-generated
randomization
• End point judged and
composite score verified by
blinded committee
• Cox proportional hazards
regression model for mortality
and composite end point
• Sample size calculation
based on primary end point
• NYHA II or III
• LVEF ≤35%
• Indication for dual
chamber ICD or CRT-
D
• Stable optimal drug
treatment, no acute
coronary syndrome,
cardiac surgery, or
stroke within previous
6 wk
• Automatic remote data
monitoring for ≥80% of
days in run-in phase
• Remote monitoring + standard care
• Mobile phone connection
• Data transmitted daily or on detection of tachyarrhythmia
• Data processed at data centre and made available to physicians
• Frequency of visits according to guidelines + 12-mo visit
• No remote monitoring
• Standard treatment
according to
European guidelines
• No access to data
transmitted until study
completion
• Frequency of visits
according to
guidelines + 12-mo
visit
• Worsening of composite
clinical score (death, hospital
admission for heart failure +
NYHA classification, patient’s
global self-assessment) at 12
mo (1a.)
• All-cause mortality
• Hospital admission due to
worsening of heart failure
• Data transmission gap >3 d
Osmera et al, 201436
N = 198
36 months
ICDs with CardioMessenger (RM group, any manufacturer for control group)
Czech Republic
Faculty of Health and Social Studies, University of South Bohemia
• Single centre
• Randomization using sealed
envelopes
• Randomization at
implantation
• No survival analysis
• Sample size calculation not
provided
• Patients with indication
for single- or dual-
chamber ICD
• Primary or secondary
prevention
• Remote monitoring
• Yearly visits
• Daily analysis (working days) of remote monitoring reports
• No remote monitoring
(ICDs from any
manufacturer)
• Audible alarms active
• Follow-up visits every
3- and then 6 mo,
according to
recommendations
• Total number of visits
(scheduled/unscheduled)
• Mortality
• ICD shocks (appropriateness)
• Hospitalizations
• LOS

Appendices October 2018
Ontario Health Technology Assessment Series; Vol. 18: No. 7 pp. 1–199, October 2018 135
Study
No. of Participants (N)
Follow-up
Device
Country/Region
Funding
Study Design
Analysis Population Intervention(s) Comparator(s) Outcomes
Guedon-Moreau et al, 201337 and 201415
ECOST
N = 433
27 months
ICDs with Home Monitoring
France
Biotronik SE & Co. KG
• Randomization (process not
described) before device
implantation
• Remote monitoring started at
implantation
• Non-inferiority trial
• External committee monitored
and adjudicated major
adverse events
• Kaplan-Meier and Cox
proportional hazards
regression model for
composite end point, but not
for its individual components
• Sample size calculated based
on a test of non-inferiority
• NYHA I–III
• Approved indication
single or dual chamber
ICD (new or
replacement)
• Remote monitoring
• Daily data transmission and verification
• Patient visits 1–3 mo from implantation, and at 15 and 27 mo
• No remote monitoring
• Patient visits 1–3 mo
from implantation, and
at 9, 15, 21, and 27
mo
• ≥1 major adverse event
(death, cardiovascular, or
procedure or device-related
event) [1a.]
• Mortality
• Inappropriate shocks
Perl et al, 201338
SAVE-HM
n = 11.5 (PM)
n = 36 (ICDs)
PM: 17.0 months
ICDs: 26.3 months
ICDs and PMs with Home Monitoring
Austria
Funding not provided
• Centralized randomization 3
mo after device implantation
• Sample size calculation not
provided
• Clinical indication for
dual-chamber PMs or
ICDs (primary
prevention of sudden
cardiac death in
patients with chronic
systolic heart failure)
• Living in area with
sufficient cellular phone
coverage
• Remote monitoring
• Daily data transmission and verification
• No scheduled office visits (PM)
• One scheduled office visit per year (ICD)
• No remote monitoring
• One clinic visit per
year (PM)
• Two clinic visits per
year (ICD)
• Number of clinic visits
• Reason for unscheduled visits
• Clinical relevance of visits
• Adverse events
• Cost analysis (1a.)
Calo et al, 2013135
N = 233
12 months
ICDs and CRTs with any
• Randomized (process not
described) at implantation
• Remote monitoring started
at hospital discharge
• Sample size calculation
• Standard indications
for ICD or CRT-D
• Remote monitoring
• Remote follow-up (data transmitted) every 3 mo
• One clinic visit at 1 and 12 mo
• No remote monitoring
• Clinic visits every 3
mo
• Unscheduled clinic visits
• Total number of clinic visits
• Unscheduled + scheduled
remote follow-up
• Health care staff time
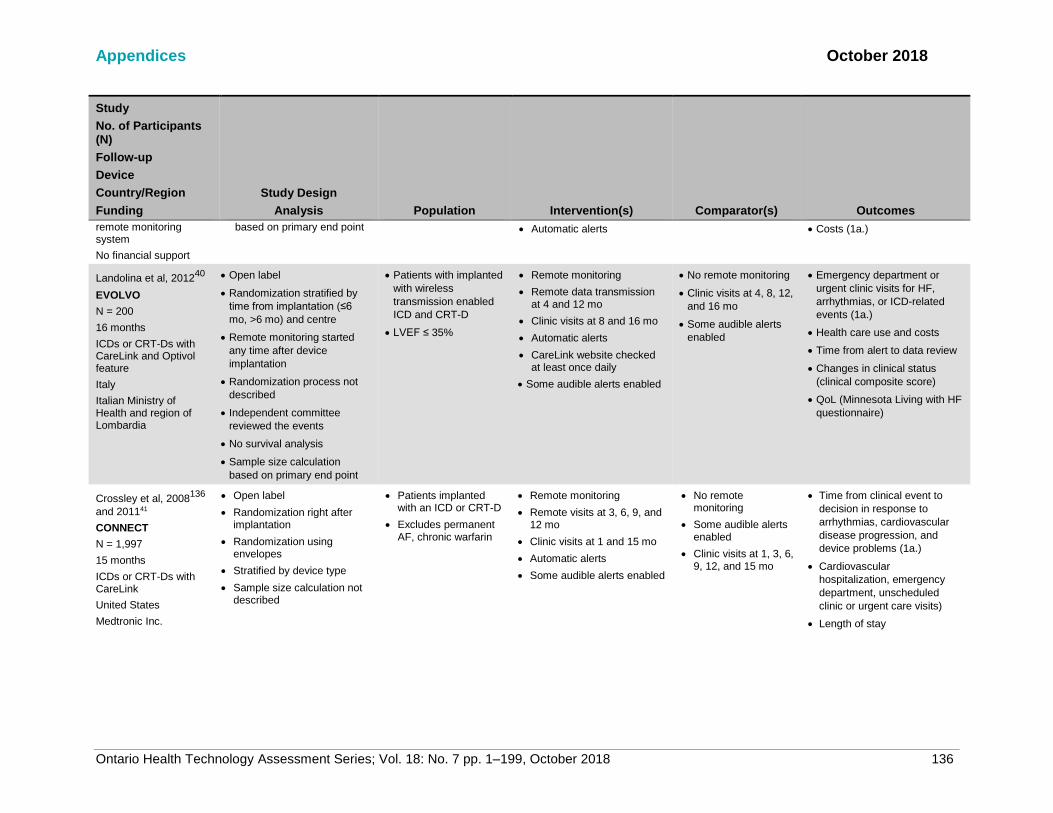
Appendices October 2018
Ontario Health Technology Assessment Series; Vol. 18: No. 7 pp. 1–199, October 2018 136
Study
No. of Participants (N)
Follow-up
Device
Country/Region
Funding
Study Design
Analysis Population Intervention(s) Comparator(s) Outcomes
remote monitoring system
No financial support
based on primary end point • Automatic alerts • Costs (1a.)
Landolina et al, 201240
EVOLVO
N = 200
16 months
ICDs or CRT-Ds with CareLink and Optivol feature
Italy
Italian Ministry of Health and region of Lombardia
• Open label
• Randomization stratified by
time from implantation (≤6
mo, >6 mo) and centre
• Remote monitoring started
any time after device
implantation
• Randomization process not
described
• Independent committee
reviewed the events
• No survival analysis
• Sample size calculation
based on primary end point
• Patients with implanted
with wireless
transmission enabled
ICD and CRT-D
• LVEF ≤ 35%
• Remote monitoring
• Remote data transmission at 4 and 12 mo
• Clinic visits at 8 and 16 mo
• Automatic alerts
• CareLink website checked at least once daily
• Some audible alerts enabled
• No remote monitoring
• Clinic visits at 4, 8, 12,
and 16 mo
• Some audible alerts
enabled
• Emergency department or
urgent clinic visits for HF,
arrhythmias, or ICD-related
events (1a.)
• Health care use and costs
• Time from alert to data review
• Changes in clinical status
(clinical composite score)
• QoL (Minnesota Living with HF
questionnaire)
Crossley et al, 2008136
and 201141
CONNECT
N = 1,997
15 months
ICDs or CRT-Ds with CareLink
United States
Medtronic Inc.
• Open label
• Randomization right after implantation
• Randomization using envelopes
• Stratified by device type
• Sample size calculation not described
• Patients implanted with an ICD or CRT-D
• Excludes permanent AF, chronic warfarin
• Remote monitoring
• Remote visits at 3, 6, 9, and 12 mo
• Clinic visits at 1 and 15 mo
• Automatic alerts
• Some audible alerts enabled
• No remote monitoring
• Some audible alerts enabled
• Clinic visits at 1, 3, 6, 9, 12, and 15 mo
• Time from clinical event to
decision in response to
arrhythmias, cardiovascular
disease progression, and
device problems (1a.)
• Cardiovascular
hospitalization, emergency
department, unscheduled
clinic or urgent care visits)
• Length of stay

Appendices October 2018
Ontario Health Technology Assessment Series; Vol. 18: No. 7 pp. 1–199, October 2018 137
Study
No. of Participants (N)
Follow-up
Device
Country/Region
Funding
Study Design
Analysis Population Intervention(s) Comparator(s) Outcomes
Varma et al, 2010,42 2013,43 and 201644
TRUST
N = 1,339
12 months
ICDs with Home Monitoring
United States
Biotronik Inc.
• Centralized randomization ≤45 d after device implantation
• Independent Clinical Events Committee adjudicated all deaths and adverse events
• Non-inferiority trial
• Sample size calculation based on primary safety end point and a non-inferiority test
• NYHA I–II indications for ICD
• Not pacemaker dependent
• Only patients with at least one follow-up visit included
• Remote monitoring
• Clinic visits scheduled at 3 and 15 mo after implantation
• Daily data transmission (reviewed online daily)
• Verification of data transmitted every 3 mo between clinic visits + automatic alerts
• No remote monitoring
• Clinic visits scheduled every 3 mo
• Total in-clinic device
evaluations (1a.)
• Major adverse events (death,
stroke, events requiring
surgical interventions) [1a.]
• Clinic visits
• Time from event onset to
physician evaluation of 1st
occurrence of AF, VT, VF,
SVT
• Missed clinic visits (control) or
failed data transmission
(remote monitoring)
• Unscheduled clinic evaluation
Al-Khatib et al, 201046
N = 151
12 months
ICD or CRT with CareLink
United States
Peer-reviewed grant from Medtronic-Duke University Strategic Alliance
• Randomization using sealed envelopes
• Unclear when remote monitoring started
• No survival analysis
• Sample size calculation not described
• Approved indication for CRT-D or ICD
• Devices already implanted
• Heart failure capabilities of devices not used
• Remote monitoring
• Verification of remote data transmission every 3 mo + automatic alerts
• Clinic visit at 12 mo
• Phone contact at 6 mo
• No remote monitoring
• Clinic visits every 3 mo
• Composite of cardiovascular hospitalization, emergency department visits for a cardiac cause, unscheduled visits to electrophysiologist (1a.)
• Medication use
• QoL (EuroQol)
• Patient satisfaction with ICD care
• Cost, cost-effectiveness
Abbreviations: AF, atrial fibrillation; BNP, brain natriuretic peptide; CV, CRT-p, cardiac resynchronization therapy pacing; CRT-D, cardiac resynchronization therapy with defibrillator; cardiovascular; HF, heart failure; ICD, implantable cardioverter-defibrillator; LOS, length of stay; LVEF, left ventricular ejection fraction; NYHA, New York Heart Association; QoL, quality of life; PM, pacemaker; RM, remote monitoring; SVT, supraventricular tachycardia; VF, ventricular fibrillation; VT, ventricular tachycardia.
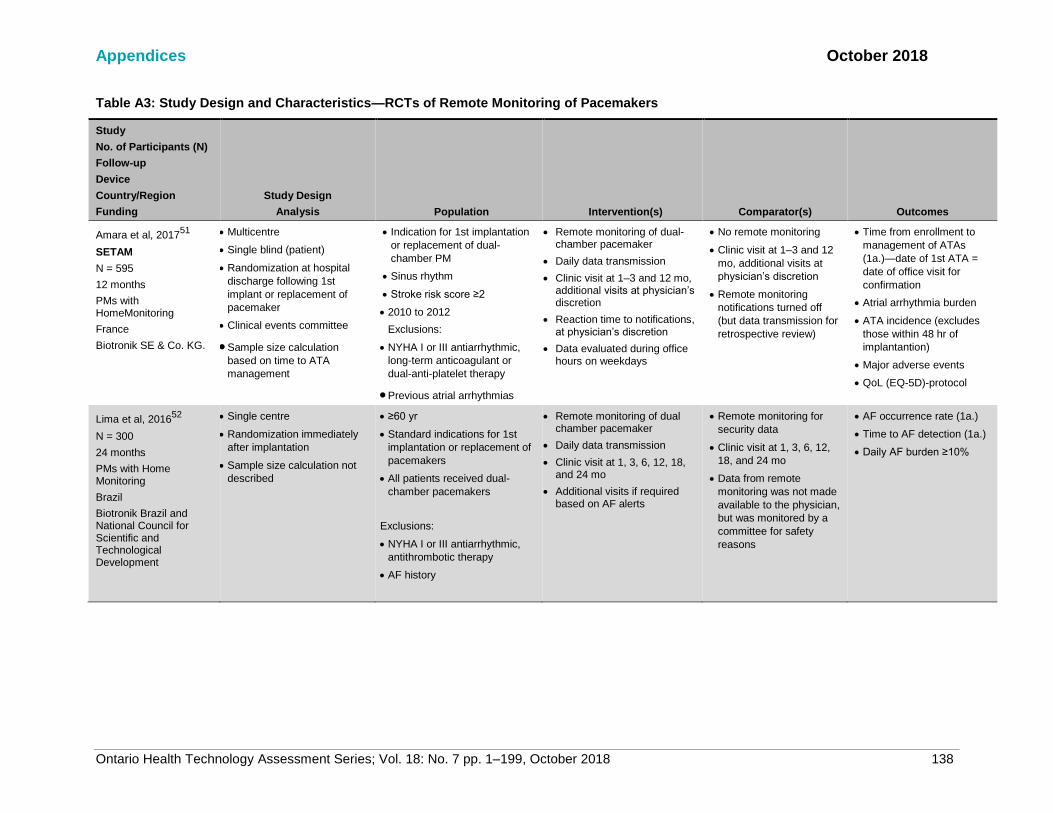
Appendices October 2018
Ontario Health Technology Assessment Series; Vol. 18: No. 7 pp. 1–199, October 2018 138
Table A3: Study Design and Characteristics—RCTs of Remote Monitoring of Pacemakers
Study
No. of Participants (N)
Follow-up
Device
Country/Region
Funding
Study Design
Analysis Population Intervention(s) Comparator(s) Outcomes
Amara et al, 201751
SETAM
N = 595
12 months
PMs with HomeMonitoring
France
Biotronik SE & Co. KG.
• Multicentre
• Single blind (patient)
• Randomization at hospital
discharge following 1st
implant or replacement of
pacemaker
• Clinical events committee
• Sample size calculation
based on time to ATA
management
• Indication for 1st implantation
or replacement of dual-
chamber PM
• Sinus rhythm
• Stroke risk score ≥2
• 2010 to 2012
Exclusions:
• NYHA I or III antiarrhythmic,
long-term anticoagulant or
dual-anti-platelet therapy
• Previous atrial arrhythmias
• Remote monitoring of dual-chamber pacemaker
• Daily data transmission
• Clinic visit at 1–3 and 12 mo, additional visits at physician’s discretion
• Reaction time to notifications, at physician’s discretion
• Data evaluated during office hours on weekdays
• No remote monitoring
• Clinic visit at 1–3 and 12
mo, additional visits at
physician’s discretion
• Remote monitoring
notifications turned off
(but data transmission for
retrospective review)
• Time from enrollment to
management of ATAs
(1a.)—date of 1st ATA =
date of office visit for
confirmation
• Atrial arrhythmia burden
• ATA incidence (excludes
those within 48 hr of
implantantion)
• Major adverse events
• QoL (EQ-5D)-protocol
Lima et al, 201652
N = 300
24 months
PMs with Home Monitoring
Brazil
Biotronik Brazil and National Council for Scientific and Technological Development
• Single centre
• Randomization immediately
after implantation
• Sample size calculation not
described
• ≥60 yr
• Standard indications for 1st
implantation or replacement of
pacemakers
• All patients received dual-
chamber pacemakers
Exclusions:
• NYHA I or III antiarrhythmic,
antithrombotic therapy
• AF history
• Remote monitoring of dual chamber pacemaker
• Daily data transmission
• Clinic visit at 1, 3, 6, 12, 18, and 24 mo
• Additional visits if required based on AF alerts
• Remote monitoring for
security data
• Clinic visit at 1, 3, 6, 12,
18, and 24 mo
• Data from remote
monitoring was not made
available to the physician,
but was monitored by a
committee for safety
reasons
• AF occurrence rate (1a.)
• Time to AF detection (1a.)
• Daily AF burden ≥10%

Appendices October 2018
Ontario Health Technology Assessment Series; Vol. 18: No. 7 pp. 1–199, October 2018 139
Study
No. of Participants (N)
Follow-up
Device
Country/Region
Funding
Study Design
Analysis Population Intervention(s) Comparator(s) Outcomes
Perl et al, 201338
SAVE-HM
Pacemaker group
n = 115
Mean follow-up: 17.0 months
PMs with Home Monitoring
Not provided
• Centralized randomization 3
mo after device implantation
• Sample size calculation not
described
• Clinical indication for dual-
chamber PMs
• Living in area with sufficient
cellular phone coverage
• Remote monitoring
• Daily data transmission and verification
• No scheduled clinic visits
• No remote monitoring
• One clinic visit per year
• Number of clinic visits
• Reason for unscheduled
visits
• Clinical relevance of visits
• Adverse events
• Cost analysis (1a.)
Mabo et al, 201253
COMPAS
N = 538
18 months
PMs with Home Monitoring
France
Biotronik SE & Co. KG.
• Open label
• Multicentre
• Non-inferiority trial
• Sample size calculation
based on non-inferiority of
RM for primary end point
• Safety monitoring committee
• Sample size calculation
based on a noninferiority
hypothesis for the primary
end point
• Standard indications for
PHILOS II DR-T DDD
pacemaker >1 mo before study
start
• 2005 to 2008
• Excluded if spontaneous
ventricular rate was <30 bpm
(i.e., pacemaker dependence)
• Remote monitoring of dual-chamber pacemakers equipped with Home Monitoring system
• Daily monitoring
• Reaction time to notifications at physician’s discretion
• Data evaluated during office hours
• Data collected through
remote monitoring but not
made available to
physician (used for
surveillance)
• Clinic follow-up as per
each centre’s policy
(encouraged to comply
with guidelines)
• Major adverse clinical
events (death,
hospitalization for
complications related to
the pacing system, or
cardiovascular event (1a.)
• Incidence of each major
adverse event
• Office visits
• Time to management of
adverse events
• QoL (SF-36)

Appendices October 2018
Ontario Health Technology Assessment Series; Vol. 18: No. 7 pp. 1–199, October 2018 140
Study
No. of Participants (N)
Follow-up
Device
Country/Region
Funding
Study Design
Analysis Population Intervention(s) Comparator(s) Outcomes
Crossley et al, 200954
PREFER
N = 897
12 months
PMs with CareLink
United States
Medtronic Inc.
• Open label
• Unblinded
• Multicentre
• Sample size calculation
based on the incidence of
first diagnosis
• Single or double-chamber
pacemaker users
• 2004 to 2007
• Remote monitoring of single- or double-chamber pacemakers
• Remote transmission at 3, 6, and 9 mo
• Clinic visit at 12 mo
• Pacemaker programming at physician’s discretion
• Transtelephonic
monitoring (battery
status, analysis of
sensing and stimulation
function, limited
electrocardiogram strip
providing information
about the patient’s rhythm
at the time of
transmission)
• Transmission at 2, 4, 8,
and 10 mo (maximally
permitted interval as per
Medicare and Medicaid
guidelines)
• At 6 mo, transmission for
single-chamber PMs, and
clinic visit for double-
chamber PMs
• Clinic visit at 12 mo
• Incidence of first diagnosis
of a clinically actionable
event (that increases
stroke risk, predispose to
CHF etc.) (1a.)
• Time to event
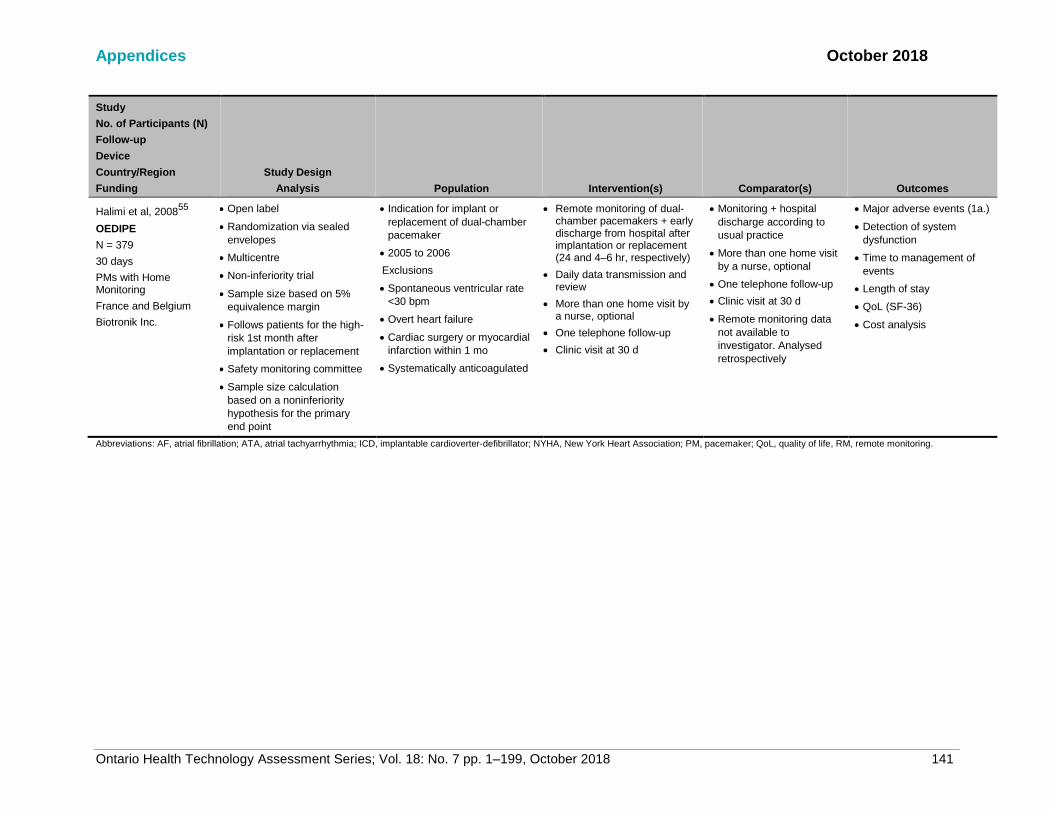
Appendices October 2018
Ontario Health Technology Assessment Series; Vol. 18: No. 7 pp. 1–199, October 2018 141
Study
No. of Participants (N)
Follow-up
Device
Country/Region
Funding
Study Design
Analysis Population Intervention(s) Comparator(s) Outcomes
Halimi et al, 200855
OEDIPE
N = 379
30 days
PMs with Home Monitoring
France and Belgium
Biotronik Inc.
• Open label
• Randomization via sealed
envelopes
• Multicentre
• Non-inferiority trial
• Sample size based on 5%
equivalence margin
• Follows patients for the high-
risk 1st month after
implantation or replacement
• Safety monitoring committee
• Sample size calculation
based on a noninferiority
hypothesis for the primary
end point
• Indication for implant or
replacement of dual-chamber
pacemaker
• 2005 to 2006
Exclusions
• Spontaneous ventricular rate
<30 bpm
• Overt heart failure
• Cardiac surgery or myocardial
infarction within 1 mo
• Systematically anticoagulated
• Remote monitoring of dual-chamber pacemakers + early discharge from hospital after implantation or replacement (24 and 4–6 hr, respectively)
• Daily data transmission and review
• More than one home visit by a nurse, optional
• One telephone follow-up
• Clinic visit at 30 d
• Monitoring + hospital
discharge according to
usual practice
• More than one home visit
by a nurse, optional
• One telephone follow-up
• Clinic visit at 30 d
• Remote monitoring data
not available to
investigator. Analysed
retrospectively
• Major adverse events (1a.)
• Detection of system
dysfunction
• Time to management of
events
• Length of stay
• QoL (SF-36)
• Cost analysis
Abbreviations: AF, atrial fibrillation; ATA, atrial tachyarrhythmia; ICD, implantable cardioverter-defibrillator; NYHA, New York Heart Association; PM, pacemaker; QoL, quality of life, RM, remote monitoring.

Appendices October 2018
Ontario Health Technology Assessment Series; Vol. 18: No. 7 pp. 1–199, October 2018 142
Appendix 5: Baseline Characteristics—Remote Monitoring of ICDs/CRT-Ds and Pacemakers
Table A4: Baseline Characteristics—RCTs of Remote Monitoring of ICDs and CRT-Ds
Study
No. of Participants (N) (RM/no RM)
Follow-up
Device
Country/Region
Funding Age, Mean Years
(SD) Male, n (%) ICDs or CRT-Ds LVEF, Mean %
(SD) NYHA Functional
Class, n (%)
Primary or Secondary
Prevention (ICDs)
Morgan et al, 201728
REM-HF
N = 1,650 (824/826)
• RM: 69.5 (10.3)
• No RM: 69.5 (10.0)
• RM: 707 (85.8)
• No RM: 708 (85.7) ICDs
• RM: 275 (33.4)
• No RM: 276 (33.4)
CRT-Ds
• RM: 442 (53.6)
• No RM: 438 (53.0)
CRT-Ps
• RM: 107 (13.0)
• No RM:112 (13.6)
• RM: 29.9 (10.2)
• No RM: 30.0 (9.8) II
• RM: 585 (71.0)
• No RM: 561 (67.9)
III
• RM: 238 (28.9)
• No RM: 263 (31.8)
IV
• RM: 1 (0.2)
• No RM: 2 (0.2)
Not reported
Boriani et al, 201750
MORE-CARE
N = 865 (437/428)
Europe and Israel
• RM: 66.0 (11.0)
• No RM: 67.0 (10.0)
• RM: 342 (78.8)
• No RM: 312 (73.1)
• All CRT-Ds • RM: 27.3 (6.6)
• No RM: 27.4 (6.0) III–IV
• RM: 265 (62.9)
• No RM: 258 (61.1)
Not applicable
Sardu et al, 201632
TELECART
N = 183 (89/94)
12 months
CRT-Ds with Home Monitoring
Italy
• RM: 71.8 (8.5)
• No RM: 72.6 (5.7)
• RM: 64 (71.9)
• No RM: 75 (79.8)
• All CRT-Ds
Not reported II
• RM: 37 (41.6)
• No RM: 46 (48.9)
III
• RM: 52 (58.4)
• No RM: 48 (51.1)
Not applicable

Appendices October 2018
Ontario Health Technology Assessment Series; Vol. 18: No. 7 pp. 1–199, October 2018 143
Study
No. of Participants (N) (RM/no RM)
Follow-up
Device
Country/Region
Funding Age, Mean Years
(SD) Male, n (%) ICDs or CRT-Ds LVEF, Mean %
(SD) NYHA Functional
Class, n (%)
Primary or Secondary
Prevention (ICDs)
Bohm et al, 201631
OptiLink HF
N = 1,002 (505/497)
• RM: 66.1 (10.1)
• No RM: 66.4 (10.7)
• RM: 390 (77.2)
• No RM: 409 (82.3) ICDs single-chamber
• RM: 111 (22.0)
• No RM: 122 (24.5)
ICDs dual-chamber
• RM: 71 (14.1)
• No RM: 71 (14.3)
CRT-Ds
• RM: 323 (64.0)
• No RM: 304 (61.2)
• RM: 26.7 (6.1)
• No RM: 26.7 (6.1) II
• RM: 99 (19.6)
• No RM: 95 (19.1)
III
• RM: 406 (80.4)
• No RM: 402 (80.9)
Not reported
Heidbuchel et al, 201533
EuroEco- ICD Cohort
N = 303 (159/144)
• RM: 62.0 (13.9)
• No RM: 62.9 (12.3)
• RM: 124 (78.0)
• No RM: 120 (83.3) ICDs single-chamber
• RM: 96 (60.4)
• No RM: 88 (61.1)
ICDs dual-chamber
• RM: 63 (39.6)
• No RM: 56 (38.9)
• RM: 39.2 (14.8)
• No RM: 39.5 (15.6) 1a. Prevention
• RM: 91 (57.0)
• No RM: 64 (44.1)
2a. Prevention
• RM: 68 (43.0)
• No RM: 80 (55.9)
Luthje et al, 201534
CONNECT-Optivol
N = 176 (87/89)
Germany
• RM: 66.0 (12.0)
• No RM: 65.9 (12.1)
• RM: 70 (80.5)
• No RM: 66 (74.2) ICDs
• RM: 43 (49)
• No RM: 45 (50.6)
CRT-Ds
• RM: 44 (50.6%)
• No RM: 44 (49.4)
• RM: 32.7 (11.4)
• No RM: 31.1 10.2)
I
• RM: 13 (14.9)
• No RM: 6 (6.8)
II
• RM: 40 (46.0)
• No RM: 40 (45.5)
1a. Prevention
• RM: 71 (81.6)
• No RM: 78 (87.6)
2a. Prevention
• RM: 16 (18.4)
• No RM: 11 (12.4)

Appendices October 2018
Ontario Health Technology Assessment Series; Vol. 18: No. 7 pp. 1–199, October 2018 144
Study
No. of Participants (N) (RM/no RM)
Follow-up
Device
Country/Region
Funding Age, Mean Years
(SD) Male, n (%) ICDs or CRT-Ds LVEF, Mean %
(SD) NYHA Functional
Class, n (%)
Primary or Secondary
Prevention (ICDs)
Hindricks et al, 201435
In-TIME
N = 664 (333/331)
• RM: 65.3 (9.3)
• No RM: 65.8 (9.6)
• RM: 274 (82.3)
• No RM: 262 (79.2) ICDs (dual-chamber)
• RM: 143 (42.9)
• No RM: 131 (39.6)
CRT-Ds
• RM: 190 (57.1)
• No RM: 200 (60.4)
• RM: 26.0 (6.0)
• No RM: 26.0 (7.0) II
• RM: 150 (45.2)
• No RM: 135 (40.8)
III
• RM: 182 (54.8)
• No RM: 196 (59.2)
Not reported
Osmera et al, 201436
N = 198 (97/101)
• RM: 66.0 (11.0)
• No RM: 68.0 (12.0)
• RM: 81 (83.5)
• No RM: 79 (78.2) ICDs (single-chamber)
• RM: 87 (89.7)
• No RM: 76 (75.2)
ICDs (Dual-chamber)
• RM: 10 (10.3)
• No RM: 25 (24.8)
• RM: 41 (15)
• No RM: 39 (14) Not reported 1a. Prevention
• RM: 38 (39.2)
• No RM: 37 (36.6)
2a. Prevention
• RM: 59 (60.8)
• No RM: 64 (63.4)
Guedon-Moreau et al, 201337
ECOST
N = 433 (221/212)
• RM: 62.0 (13.0)
• No RM: 61.2 (12.0)
• RM: 198 (87.3)
• No RM: 189 (89.2) ICDs (Single-
chamber)
• RM: 161 (72.9)
• No RM: 141 (66.5)
ICDs (Dual-chamber)
• RM: 60 (27.1)
• No RM: 71 (33.5)
• RM: 34.7 (13.0)
• No RM: 35.1 (13.6)
I
• RM: 60 (27.1)
• No RM: 53 (25.0)
II
• RM: 139 (62.9)
• No RM: 129 (60.8)
III
• RM: 15 (6.4)
• No RM: 25 (11.8)
1a. Prevention
• RM: 119 (53.8)
• No RM: 113 (53.3)
2a. Prevention
• RM: 102 (46.2)
• No RM: 99 (46.7)
Perl et al, 201338
SAVE-HMN = 36 (18/18)
• RM: 62.1 (8.4)
• No RM: 63.3 (12.8)
ICDs
100%
Not reported Not reported All for primary
prevention

Appendices October 2018
Ontario Health Technology Assessment Series; Vol. 18: No. 7 pp. 1–199, October 2018 145
Study
No. of Participants (N) (RM/no RM)
Follow-up
Device
Country/Region
Funding
Age, Mean Years
(SD) Male, n (%) ICDs or CRT-Ds
LVEF, Mean %
(SD)
NYHA Functional
Class, n (%)
Primary or
Secondary
Prevention (ICDs)
Calo et al, 2013135
N = 233 (117/116)
>55 yr of age
• RM: 103 (88.0)
• No RM: 103 (88.8)
• RM: 85 (73.0)
• No RM: 83 (71.0) ICDs
• RM: 83 (7.1)
• No RM: 94 (81.0)
CRT-Ds
• RM: 34 (29.1)
• No RM: 22 (19.0)
• RM: 29.7 (8.8)
• No RM: 31.6 (14.4)
I
• RM: 4 (3.0)
• No RM: 3 (2.0)
II
• RM: 20 (17.0)
• No RM: 17 (15.0)
III
• RM: 84 (72.0)
• No RM: 90 (78.0)
IV
• RM: 9 (8.0)
• No RM: 6 (5.0)
1a. Prevention
• RM: 98 (84.0)
• No RM: 96 (83.0)
2a. Prevention
• RM: 19 (16.0)
• No RM: 20 (17.0)
Landolina et al,
201240
EVOLVO
N = 200 (99/101)
• RM: 66 (range: 60–
72)
• No RM: 69 (60–73)
• RM: 81 (81.8)
• No RM: 76 (75.2) ICDs
• RM: 5 (5.1)
• No RM: 14 (13.9)
CRT-Ds
• RM: 94 (94.9)
• No RM: 87 (86.1)
• RM: 31 (range: 25–
35)
• No RM: 30 (25–34)
I
• RM: 11 (11.1)
• No RM: 13 (12.9)
II
• RM: 71 (71.7)
• No RM: 68 (67.3)
III
• RM: 17 (17.1)
• No RM: 20 (19.8)
Not reported

Appendices October 2018
Ontario Health Technology Assessment Series; Vol. 18: No. 7 pp. 1–199, October 2018 146
Study
No. of Participants (N) (RM/no RM)
Follow-up
Device
Country/Region
Funding
Age, Mean Years
(SD) Male, n (%) ICDs or CRT-Ds
LVEF, Mean %
(SD)
NYHA Functional
Class, n (%)
Primary or
Secondary
Prevention (ICDs)
Crossley et al, 201141
CONNECT
N = 1,997 (1,014/983)
• RM: 65.2 (12.4)
• No RM:64.9 (11.9)
• RM: 715 (70.5)
• No RM: 705 (71.7) Not reported • RM: 28.6 (10.0)
• No RM: 19.2 (10.3)
No heart failure
• RM: 54 (5.3)
• No RM: 66 (6.7)
I
• RM: 40 (3.9)
• No RM: 46 (4.7)
II
• RM: 415 (40.9)
• No RM: 388 (39.5)
III
• RM: 492 (48.5)
• No RM: 467 (47.5)
IV
• RM: 15 (1.5)
• No RM: 15 (1.5)
Not reported
Varma et al, 201042
TRUST
N = 1,339 (908/431)
• RM: 63.3 (12.8)
• No RM: 64.0 (12.1)
• RM: 254 (72.0)
• No RM: 315 (73.1) ICDs (single-chamber)
• RM: 383 (42.1)
• No RM: 187 (43.4)
ICDs (dual-chamber)
• RM: 525 (57.8)
• No RM: 244 (56.6)
• RM: 29 (10.7)
• No RM: 28.5 (9.8) I
• RM: 124 (13.8)
• No RM: 36 (8.4)
II
• RM: 504 (55.9)
• No RM: 258 (60.4)
III
• RM: 268 (29.2)
• No RM: 129 (30.2)
IV
• RM: 5 (0.4)
• No RM: 4 (0.9)
1a. Prevention
• RM: 656 (72.2)
• No RM: 318 (73.8)
2a. Prevention
• RM: 252 (27.8)
• No RM: 113 (26.2)
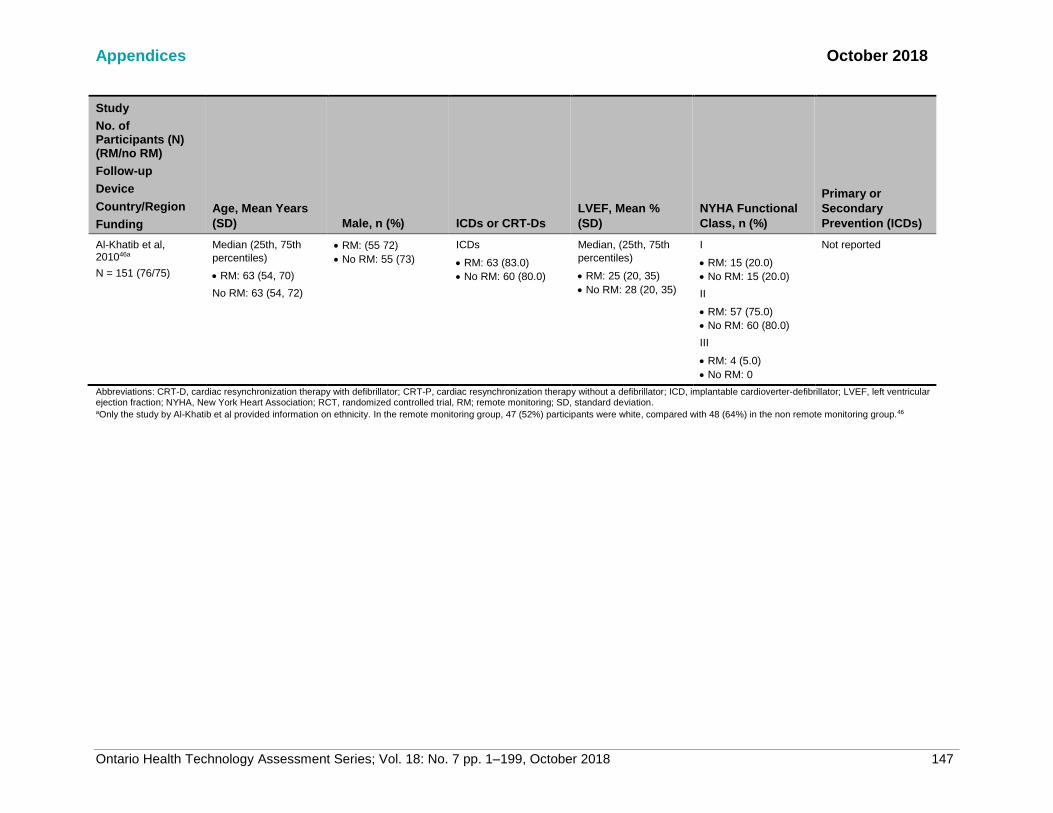
Appendices October 2018
Ontario Health Technology Assessment Series; Vol. 18: No. 7 pp. 1–199, October 2018 147
Study
No. of Participants (N) (RM/no RM)
Follow-up
Device
Country/Region
Funding
Age, Mean Years
(SD) Male, n (%) ICDs or CRT-Ds
LVEF, Mean %
(SD)
NYHA Functional
Class, n (%)
Primary or
Secondary
Prevention (ICDs)
Al-Khatib et al, 201046a
N = 151 (76/75)
Median (25th, 75th
percentiles)
• RM: 63 (54, 70)
No RM: 63 (54, 72)
• RM: (55 72)
• No RM: 55 (73)
ICDs
• RM: 63 (83.0)
• No RM: 60 (80.0)
Median, (25th, 75th
percentiles)
• RM: 25 (20, 35)
• No RM: 28 (20, 35)
I
• RM: 15 (20.0)
• No RM: 15 (20.0)
II
• RM: 57 (75.0)
• No RM: 60 (80.0)
III
• RM: 4 (5.0)
• No RM: 0
Not reported
Abbreviations: CRT-D, cardiac resynchronization therapy with defibrillator; CRT-P, cardiac resynchronization therapy without a defibrillator; ICD, implantable cardioverter-defibrillator; LVEF, left ventricular ejection fraction; NYHA, New York Heart Association; RCT, randomized controlled trial, RM; remote monitoring; SD, standard deviation. aOnly the study by Al-Khatib et al provided information on ethnicity. In the remote monitoring group, 47 (52%) participants were white, compared with 48 (64%) in the non remote monitoring group.46
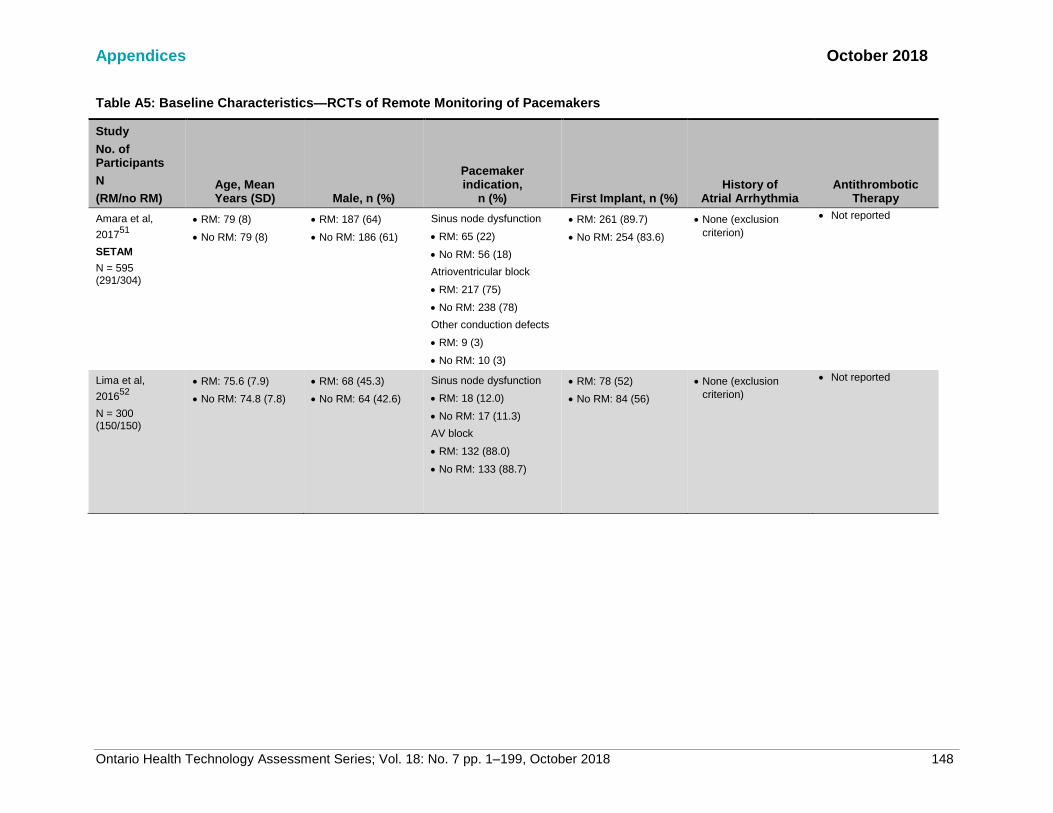
Appendices October 2018
Ontario Health Technology Assessment Series; Vol. 18: No. 7 pp. 1–199, October 2018 148
Table A5: Baseline Characteristics—RCTs of Remote Monitoring of Pacemakers
Study
No. of Participants
N
(RM/no RM) Age, Mean Years (SD) Male, n (%)
Pacemaker indication,
n (%) First Implant, n (%) History of
Atrial Arrhythmia Antithrombotic
Therapy
Amara et al,
201751
SETAM
N = 595 (291/304)
• RM: 79 (8)
• No RM: 79 (8)
• RM: 187 (64)
• No RM: 186 (61)
Sinus node dysfunction
• RM: 65 (22)
• No RM: 56 (18)
Atrioventricular block
• RM: 217 (75)
• No RM: 238 (78)
Other conduction defects
• RM: 9 (3)
• No RM: 10 (3)
• RM: 261 (89.7)
• No RM: 254 (83.6)
• None (exclusion
criterion)
• Not reported
Lima et al,
201652
N = 300 (150/150)
• RM: 75.6 (7.9)
• No RM: 74.8 (7.8)
• RM: 68 (45.3)
• No RM: 64 (42.6)
Sinus node dysfunction
• RM: 18 (12.0)
• No RM: 17 (11.3)
AV block
• RM: 132 (88.0)
• No RM: 133 (88.7)
• RM: 78 (52)
• No RM: 84 (56)
• None (exclusion
criterion)
• Not reported

Appendices October 2018
Ontario Health Technology Assessment Series; Vol. 18: No. 7 pp. 1–199, October 2018 149
Study
No. of Participants (N)
(RM/no RM)
Age, Mean
Years (SD) Male, n (%)
Pacemaker
indication,
n (%) First Implant, n (%)
History of
Atrial Arrhythmia
Antithrombotic
Therapy
Mabo et al,
201253
COMPAS
N = 538 (269/269)
• All: 76 (9) • All: 350 (65) Sinus node dysfunction
• RM: 69 (25.6)
• No RM: 73 (27.1)
Atrioventricular block
• RM: 177 (65.8)
• No RM: 186 (69.1)
Bundle branch block
• RM: 11 (4.1)
• No RM: 4 (1.5)
Others
• RM: 12 (4.5)
• No RM: 6 (2.2)
• RM: 237 (88.0)
• No RM: 234 (87.0)
• RM: 26 (9.7)
• No RM: 29 (10.8)
• RM: 131 (48.7)
• No RM: 133 (49.4)
Perl et al, 201338
SAVE-HM
N = 115 (50/65)
Austria
• RM: 74.5 (10.3)
• No RM: 74.3 (8.6)
• RM: 24 (48)
• No RM: 43 (65)
Sinus node dysfunction
• All: 21 (18.2)
Atrioventricular block
• All: 63 (55.0) Others
• All: 24 (20.9)
• Not reported • Not reported • Not reported

Appendices October 2018
Ontario Health Technology Assessment Series; Vol. 18: No. 7 pp. 1–199, October 2018 150
Study
No. of Participants
N
(RM/no RM)
Age, Mean
Years (SD) Male, n (%)
Pacemaker
indication,
n (%) First Implant, n (%)
History of
Atrial Arrhythmia
Antithrombotic
Therapy
Crossley et al,
200954
PREFER
N = 897 (602/295)
12 months
• RM: 68 (16.9)
• No RM: 69 (16.9)
• RM: 312 (52)
• No RM: 142 (48)
Not necessarily
indications
Sinus node dysfunction
• RM: 193 (32.0)
• No RM: 98 (33.2)
Heart block
• RM: 266 (44.2)
• No RM: 98 (33.2)
• Not reported Atrial fibrillation
• RM: 261 (43.4)
• No RM: 129 (21.4)
Atrial flutter
• RM: 82 (13.6)
• No RM: 37 (12.5)
Atrial tachycardia
• RM: 55 (9.1)
• No RM: 28 (9.5)
Premature ventricular
complexes
• RM: 115 (19.1)
• No RM: 53 (18.0)
Nonsustained
ventricular tachycardia
• RM: 38 (6.3)
• No RM: 25 (8.5)
Sustained ventricular
tachycardia
• RM: 1 (0.2)
• No RM: 0
• Not reported

Appendices October 2018
Ontario Health Technology Assessment Series; Vol. 18: No. 7 pp. 1–199, October 2018 151
Study
No. of Participants
N
(RM/no RM)
Age, Mean
Years (SD) Male, n (%)
Pacemaker
indication,
n (%) First Implant, n (%)
History of
Atrial Arrhythmia
Antithrombotic
Therapy
Halimi et al,
200855
OEDIPE
N = 379 (187/195)
• All: 75 (9.8) • All: 231 (61%) Bradycardia-tachycardia
or sinus node dysfunction
• RM: 52 (28.3)
• No RM: 63 (32.5)
Heart block
• RM: 104 (56.7)
• No RM: 98 (50.5)
Others/missing
information
• RM: 28 (15.0)
• No RM: 33 (17.0)
• RM: 158 (86.0)
• No RM: 170 (87.0)
Not reported No systemic
anticoagulation
Abbreviations: AV, atrial ventricular; RCT, randomized controlled trial; RM, remote monitoring; SD, standard deviation.
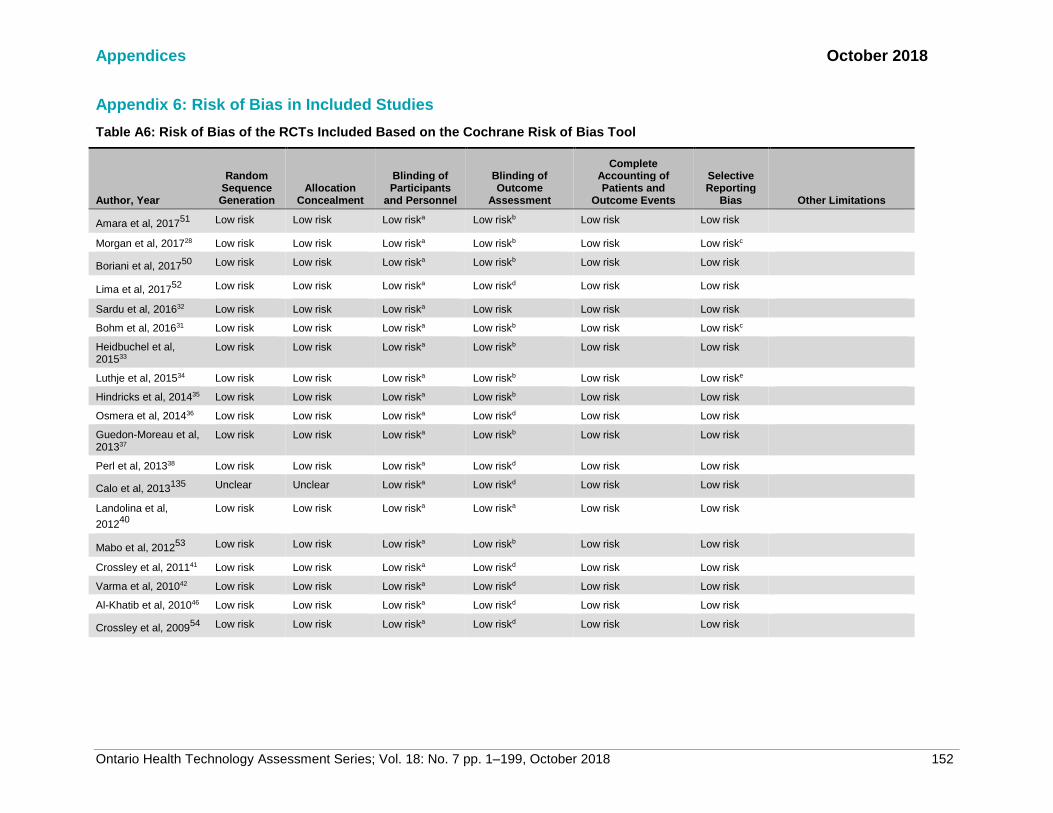
Appendices October 2018
Ontario Health Technology Assessment Series; Vol. 18: No. 7 pp. 1–199, October 2018 152
Appendix 6: Risk of Bias in Included Studies
Table A6: Risk of Bias of the RCTs Included Based on the Cochrane Risk of Bias Tool
Author, Year
Random Sequence Generation
Allocation Concealment
Blinding of Participants
and Personnel
Blinding of Outcome
Assessment
Complete Accounting of Patients and
Outcome Events
Selective Reporting
Bias Other Limitations
Amara et al, 201751
Low risk Low risk Low riska Low riskb Low risk Low risk
Morgan et al, 201728 Low risk Low risk Low riska Low riskb Low risk Low riskc
Boriani et al, 201750
Low risk Low risk Low riska Low riskb Low risk Low risk
Lima et al, 201752
Low risk Low risk Low riska Low riskd Low risk Low risk
Sardu et al, 201632 Low risk Low risk Low riska Low risk Low risk Low risk
Bohm et al, 201631 Low risk Low risk Low riska Low riskb Low risk Low riskc
Heidbuchel et al, 201533
Low risk Low risk Low riska Low riskb Low risk Low risk
Luthje et al, 201534 Low risk Low risk Low riska Low riskb Low risk Low riske
Hindricks et al, 201435 Low risk Low risk Low riska Low riskb Low risk Low risk
Osmera et al, 201436 Low risk Low risk Low riska Low riskd Low risk Low risk
Guedon-Moreau et al, 201337
Low risk Low risk Low riska Low riskb Low risk Low risk
Perl et al, 201338 Low risk Low risk Low riska Low riskd Low risk Low risk
Calo et al, 2013135
Unclear Unclear Low riska Low riskd Low risk Low risk
Landolina et al,
201240
Low risk Low risk Low riska Low riska Low risk Low risk
Mabo et al, 201253
Low risk Low risk Low riska Low riskb Low risk Low risk
Crossley et al, 201141 Low risk Low risk Low riska Low riskd Low risk Low risk
Varma et al, 201042 Low risk Low risk Low riska Low riskd Low risk Low risk
Al-Khatib et al, 201046 Low risk Low risk Low riska Low riskd Low risk Low risk
Crossley et al, 200954
Low risk Low risk Low riska Low riskd Low risk Low risk
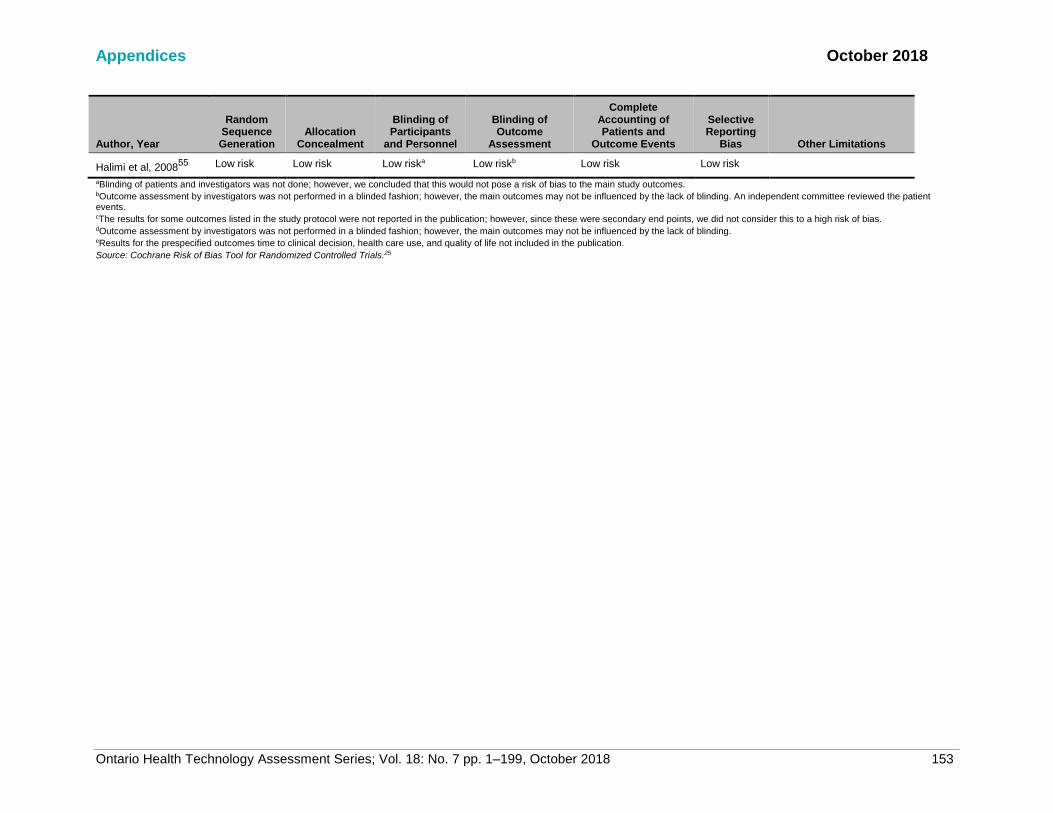
Appendices October 2018
Ontario Health Technology Assessment Series; Vol. 18: No. 7 pp. 1–199, October 2018 153
Author, Year
Random Sequence Generation
Allocation Concealment
Blinding of Participants
and Personnel
Blinding of Outcome
Assessment
Complete Accounting of Patients and
Outcome Events
Selective Reporting
Bias Other Limitations
Halimi et al, 200855
Low risk Low risk Low riska Low riskb Low risk Low risk
aBlinding of patients and investigators was not done; however, we concluded that this would not pose a risk of bias to the main study outcomes. bOutcome assessment by investigators was not performed in a blinded fashion; however, the main outcomes may not be influenced by the lack of blinding. An independent committee reviewed the patient events. cThe results for some outcomes listed in the study protocol were not reported in the publication; however, since these were secondary end points, we did not consider this to a high risk of bias. dOutcome assessment by investigators was not performed in a blinded fashion; however, the main outcomes may not be influenced by the lack of blinding. eResults for the prespecified outcomes time to clinical decision, health care use, and quality of life not included in the publication.
Source: Cochrane Risk of Bias Tool for Randomized Controlled Trials.25
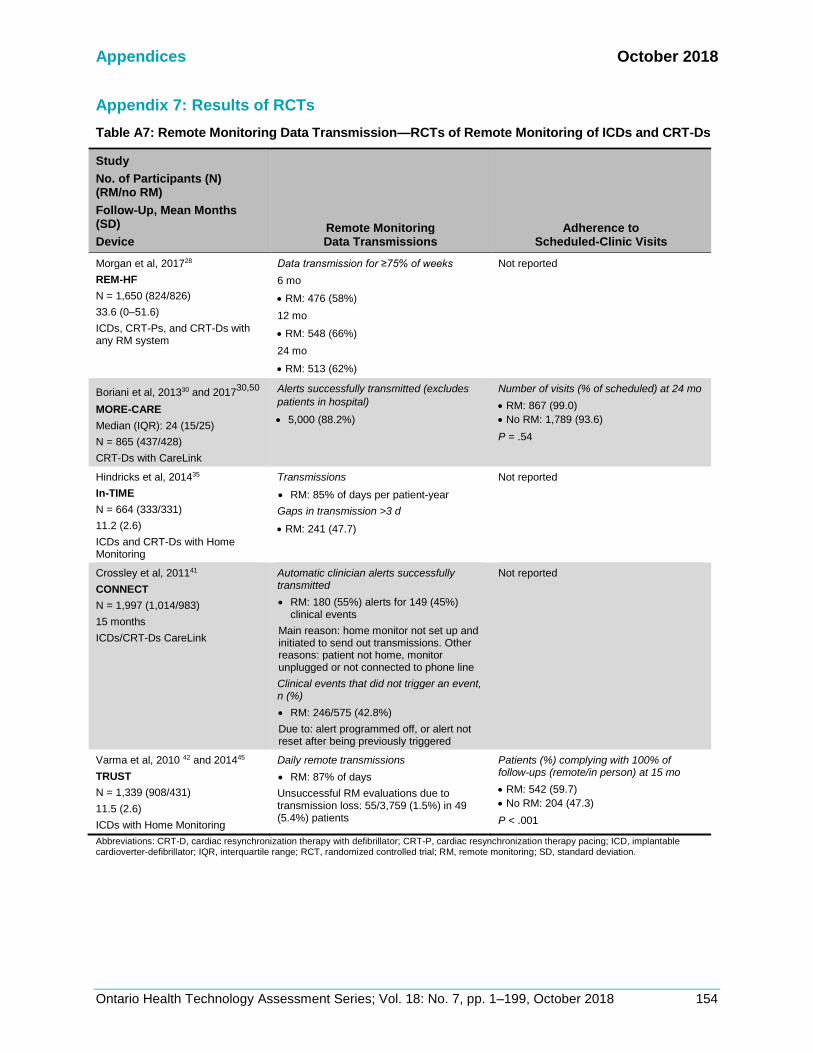
Appendices October 2018
Ontario Health Technology Assessment Series; Vol. 18: No. 7, pp. 1–199, October 2018 154
Appendix 7: Results of RCTs
Table A7: Remote Monitoring Data Transmission—RCTs of Remote Monitoring of ICDs and CRT-Ds
Study
No. of Participants (N) (RM/no RM)
Follow-Up, Mean Months (SD)
Device Remote Monitoring Data Transmissions
Adherence to Scheduled-Clinic Visits
Morgan et al, 201728
REM-HF
N = 1,650 (824/826)
33.6 (0–51.6)
ICDs, CRT-Ps, and CRT-Ds with any RM system
Data transmission for ≥75% of weeks
6 mo
• RM: 476 (58%)
12 mo
• RM: 548 (66%)
24 mo
• RM: 513 (62%)
Not reported
Boriani et al, 201330 and 201730,50
MORE-CARE
Median (IQR): 24 (15/25)
N = 865 (437/428)
CRT-Ds with CareLink
Alerts successfully transmitted (excludes
patients in hospital)
• 5,000 (88.2%)
Number of visits (% of scheduled) at 24 mo
• RM: 867 (99.0)
• No RM: 1,789 (93.6)
P = .54
Hindricks et al, 201435
In-TIME
N = 664 (333/331)
11.2 (2.6)
ICDs and CRT-Ds with Home Monitoring
Transmissions
• RM: 85% of days per patient-year
Gaps in transmission >3 d
• RM: 241 (47.7)
Not reported
Crossley et al, 201141
CONNECT
N = 1,997 (1,014/983)
15 months
ICDs/CRT-Ds CareLink
Automatic clinician alerts successfully transmitted
• RM: 180 (55%) alerts for 149 (45%) clinical events
Main reason: home monitor not set up and initiated to send out transmissions. Other reasons: patient not home, monitor unplugged or not connected to phone line
Clinical events that did not trigger an event, n (%)
• RM: 246/575 (42.8%)
Due to: alert programmed off, or alert not reset after being previously triggered
Not reported
Varma et al, 2010 42 and 201445
TRUST
N = 1,339 (908/431)
11.5 (2.6)
ICDs with Home Monitoring
Daily remote transmissions
• RM: 87% of days
Unsuccessful RM evaluations due to transmission loss: 55/3,759 (1.5%) in 49 (5.4%) patients
Patients (%) complying with 100% of follow-ups (remote/in person) at 15 mo
• RM: 542 (59.7)
• No RM: 204 (47.3)
P < .001
Abbreviations: CRT-D, cardiac resynchronization therapy with defibrillator; CRT-P, cardiac resynchronization therapy pacing; ICD, implantable cardioverter-defibrillator; IQR, interquartile range; RCT, randomized controlled trial; RM, remote monitoring; SD, standard deviation.

Appendices October 2018
Ontario Health Technology Assessment Series; Vol. 18: No. 7, pp. 1–199, October 2018 155
Table A8: Composite End Point—RCTs of Remote Monitoring of ICDs and CRT-Ds
Study
No. of Participants (N) (RM/no RM)
Mean Follow-Up (SD)
Device
Composite End Point, No. of Participants (%)
HR (95% CI) Subgroup Analyses
Morgan et al, 201728
REM-HF
N = 1,650 (824/826)
33.6 mo (0–51.6)
CRT-Ps, CRT-Ds, ICDs
Deaths or first unplanned CV hospitalization
• RM: 349 (42.4)
• No RM: 347 (40.8)
HR: 1.01 (0.87–1.18) P = .87
Age, gender, NYHA class, device type
etc)
No statistically significant difference
between groups
Boriani et al, 201750
MORE-CARE
N = 865 (437/428)
Median (IQR): 24 mo (15;25)
CRT-Ds
Deaths, CV- and device-related hospitalizations
• RM: 130 (29.7)
• No RM: 123 (28.7)
Kaplan-Meier estimates at 24 mo, % (95% CI)
• RM: 34.3 (29.7–39.4)
• No RM: 32.7 (28.2–37.8)
HR: 1.02 (0.80–1.30)
P = .89
Not reported
Bohm et al, 201631
OptiLink HF
18-mo follow-up
N = 1,002 (505/497)
Extended follow-up
N = 342 (175/167)
22.9 mo (18.2)
ICDs and CRT-Ds
All-cause mortality or 1st cardiovascular
hospitalization
• RM: 227 (45)
• No RM: 239 (48.1)
Adjusted HR
• 0.87 (0.72–1.04) P = .07
Results not different when stratified by
age, gender, NYHA class, device type,
etc
Hindricks et al, 201435
In-TIME
N = 664 (333/331)
11.2 mo (2.6)
ICDs and CRT-Ds
Worsened clinical score (death, HF
hospitalization, NYHA class, global self-
assessment)
• RM: 63 (18.9)
• No RM: 90 (27.2)
P = .01
OR: 0.63 (0.43–0.90)
Improved clinical score (NYHA class or
moderately to markedly improved self-
assessed condition)
• RM: 111 (33.3)
• No RM: 105 (31.7)
History of AF, OR (95% CI)
• Yes: 0.34 (0.16–0.70)
• No: 0.80 (0.29–1.02)
P interaction = .04
Type of device, OR (95% CI)
• ICD: 0.55 (0.29–1.02)
• CRT-D: 0.68 (0.43–1.08)
P interaction = .58
P interaction not statistically significant
for age, sex, LVEF within 3 mo of
enrolment, NYHA, ACE inhibitor use

Appendices October 2018
Ontario Health Technology Assessment Series; Vol. 18: No. 7, pp. 1–199, October 2018 156
Study
No. of Participants (N) (RM/no RM)
Mean Follow-Up (SD)
Device
Composite End Point, No. of Participants (%)
HR (95% CI) Subgroup Analyses
Guedon-Moreau et al, 201337
ECOST
N = 433 (221/212)
24.2 mo (7.3)
ICDs
Major adverse events (all-cause mortality,
cardiovascular-, procedural-, or device-related
major adverse event [≥1 inappropriate shock,
≥2 symptomatic, inappropriate antitachycardia
pacing, etc.])
• RM: 85 (38.5)
• No RM: 88 (41.5)
HR: 0.91 (0.68–1.23) P = .53
P = .04 for non-inferiority
Not reported
Landolina et al,
201240
EVOLVO
N = 200 (99/101)
Up to 16 mo
ICD and CRT-D
ED or urgent clinic visits for HF, arrhythmias,
or ICD-related events
Events per patient-year
• RM: 0.59
• No RM: 0.93
IRR: 0.65 (0.49–0.88)
P =.005
Number of events
• RM: 75
• No RM: 117
Not reported
Varma et al, 201042
TRUST
N = 1,339 (908/431)
11.5 mo (2.6)
ICDs
Safety (death, stroke, events requiring surgical
intervention)
• RM: 10.4%
• No RM: 10.4%
P for noninferiority = .01
Not reported
Al-Khatib et al, 201046
N = 151 (76/75)
12 mo
ICDs and CRT-Ds
Cardiac hospitalization or ED visit,
unscheduled visit for device-related issues
• RM: 24 (32)
• No RM: 26 (34)
P = .77
Not reported
Abbreviations: ACE, angiotensin-converting enzyme inhibitors; AF, atrial fibrillation; CI, confidence interval; CRT-D, cardiac resynchronization therapy with defibrillator; CRT-P, cardiac resychronization therapy without a defibrillator;CV, cardiovascular; ED, emergency department; HF, heart failure; HR, hazard ratio; ICD, implantable cardioverter-defibrillator; IQR, interquartile range; IRR, incidence rate ratio; LVEF, left ventricular ejection fraction; NYHA, New York Heart Association functional class; OR, odds ratio; RCT, randomized controlled trial; RM, remote monitoring; SD, standard deviation.

Appendices October 2018
Ontario Health Technology Assessment Series; Vol. 18: No. 7, pp. 1–199, October 2018 157
Table A9: Mortality—RCTs of Remote Monitoring of ICDs and CRT-Ds
Study
No. of Participants (N) (RM/no RM)
Device
All-Cause Mortality, n (%)
12–18 Mo
All-Cause Mortality, n (%)
24 Mo
All-Cause Mortality, n (%)
>24 Mo
Mortality by Cause, n (%)
HR (95% CI)
Morgan et al, 201728
REM-HF
N = 1,650 (824/826)
CRT-Ps, CRT-Ds, ICDs
Mean follow-up: 33.6 (0–51.6)
• RM: 128 (15.5)
• No RM: 152 (16.4)
HR: 0.83 (0.66–1.05)
P = .12
CV
• RM: 107 (13.0)
• No RM: 120 (14.3)
HR: 0.88 (0.68–1.14)
P = .34
Boriani et al, 201750
MORE-CARE
N = 865 (437/428)
Patient-years (707/693)
CRT-D
• RM: 16 (3.7)
• No RM: 19 (4.4)
Kaplan-Meier
estimates at 12 mo,
% (95% CI)
• RM: 4.0 (2.5–6.5)
• No RM: 4.8
(3.1–7.5)
• RM: 40 (9.2)
• No RM: 34 (7.9)
Kaplan-Meier estimates,
% (95% CI)
• RM: 11.2 (8.3–15.1)
• No RM: 9.4 (6.8–12.9)
P = .59
HR 1.13 (0.71–1.80)
P = .594
CV, Kaplan-Meier
estimates at 24 mo,
% (95% CI)
• RM: 8.2 (5.7–11.7)
• No RM: 7.8
(5.4–11.1)
P = .87
Sardu et al, 201632
TELECART
N = 183 (89/94)
CRT-Ds
At 12 mo
• RM: 7 (7.9)
• No RM: 8 (8.5)
P = .54
CV
At 12 mo
• RM: 3 (3.4)
• No RM: 5 (5.3)
P = .39
Bohm et al, 201631
OptiLink HF
18 months follow-up
n = 1,002 (505/497)
Extended follow-up
n = 342 (175/167)
ICD and CRT-D
Number of deaths
• RM: 59 (11.6)
• No RM: 63 (12.7)
Adjusted HR
0.86 (0.59–1.24) P = .41
CV causes
• RM: 46 (9.1)
• No RM: 48 (9.7)
Adjusted HR
0.89 (0.58–1.34)
P = .57
Heidbuchel et al, 201533
EuroEco- ICD Cohort
N = 303 (159/144)
24.0 (IQR: 23.1, 24.5)
At 12 mo
• RM: 4 (2.5)
• No RM: 4 (2.8)
Based on patient flow
(not reported as an
outcome by the
authors)
At 24 mo
• RM: 12 (7.5)
• No RM: 9 (6.3)
Based on patient flow (not
reported as an outcome
by the authors)
Luthje et al, 201534
CONNECT-Optivol
N = 176 (87/89)
Kaplan-Meier estimate
at 12 mo
• RM: 8.6%
• No RM: 4.6%
P = .50
At 15 mo
• RM: 8 (9.2)
• No RM: 6 (6.7)
CV
• RM: 7 (8.0)
• No RM: 4 (4.5)
Sudden death
• RM: 1 (1.1)
• No RM: 1 (1.1)
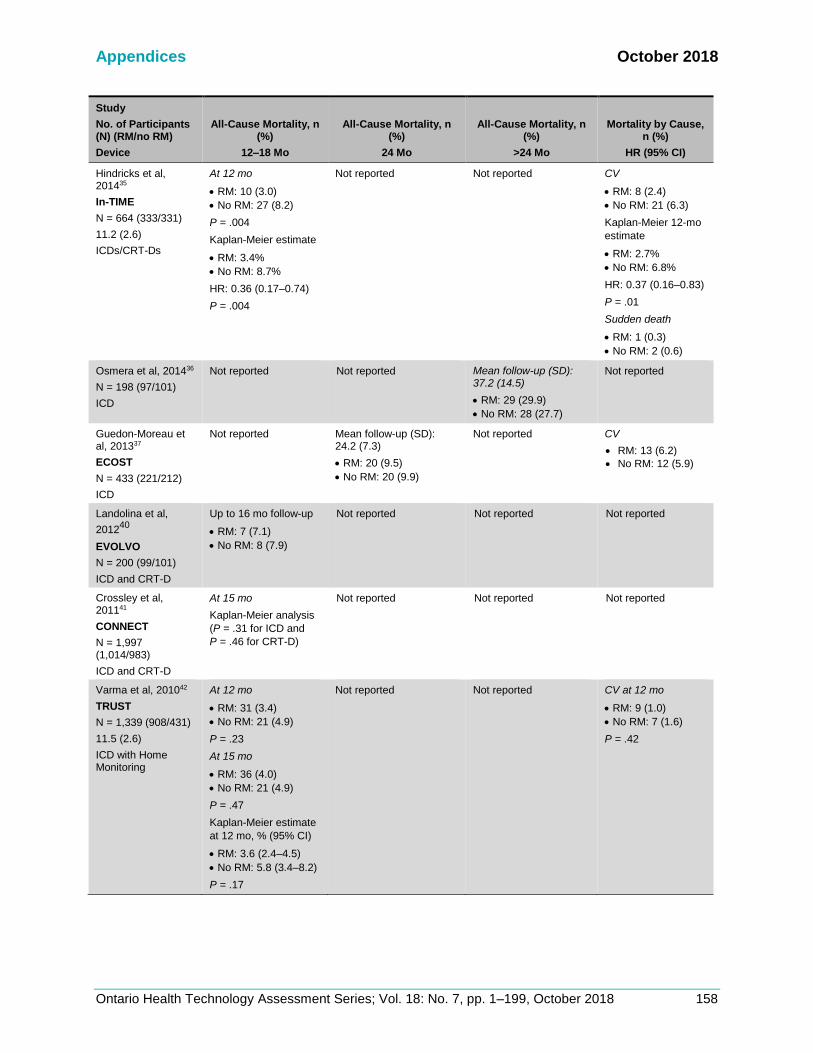
Appendices October 2018
Ontario Health Technology Assessment Series; Vol. 18: No. 7, pp. 1–199, October 2018 158
Study
No. of Participants (N) (RM/no RM)
Device
All-Cause Mortality, n (%)
12–18 Mo
All-Cause Mortality, n (%)
24 Mo
All-Cause Mortality, n (%)
>24 Mo
Mortality by Cause, n (%)
HR (95% CI)
Hindricks et al, 201435
In-TIME
N = 664 (333/331)
11.2 (2.6)
ICDs/CRT-Ds
At 12 mo
• RM: 10 (3.0)
• No RM: 27 (8.2)
P = .004
Kaplan-Meier estimate
• RM: 3.4%
• No RM: 8.7%
HR: 0.36 (0.17–0.74)
P = .004
Not reported Not reported CV
• RM: 8 (2.4)
• No RM: 21 (6.3)
Kaplan-Meier 12-mo
estimate
• RM: 2.7%
• No RM: 6.8%
HR: 0.37 (0.16–0.83)
P = .01
Sudden death
• RM: 1 (0.3)
• No RM: 2 (0.6)
Osmera et al, 201436
N = 198 (97/101)
ICD
Not reported Not reported Mean follow-up (SD): 37.2 (14.5)
• RM: 29 (29.9)
• No RM: 28 (27.7)
Not reported
Guedon-Moreau et al, 201337
ECOST
N = 433 (221/212)
ICD
Not reported Mean follow-up (SD): 24.2 (7.3)
• RM: 20 (9.5)
• No RM: 20 (9.9)
Not reported CV
• RM: 13 (6.2)
• No RM: 12 (5.9)
Landolina et al,
201240
EVOLVO
N = 200 (99/101)
ICD and CRT-D
Up to 16 mo follow-up
• RM: 7 (7.1)
• No RM: 8 (7.9)
Not reported Not reported Not reported
Crossley et al, 201141
CONNECT
N = 1,997 (1,014/983)
ICD and CRT-D
At 15 mo
Kaplan-Meier analysis
(P = .31 for ICD and
P = .46 for CRT-D)
Not reported Not reported Not reported
Varma et al, 201042
TRUST
N = 1,339 (908/431)
11.5 (2.6)
ICD with Home Monitoring
At 12 mo
• RM: 31 (3.4)
• No RM: 21 (4.9)
P = .23
At 15 mo
• RM: 36 (4.0)
• No RM: 21 (4.9)
P = .47
Kaplan-Meier estimate
at 12 mo, % (95% CI)
• RM: 3.6 (2.4–4.5)
• No RM: 5.8 (3.4–8.2)
P = .17
Not reported Not reported CV at 12 mo
• RM: 9 (1.0)
• No RM: 7 (1.6)
P = .42
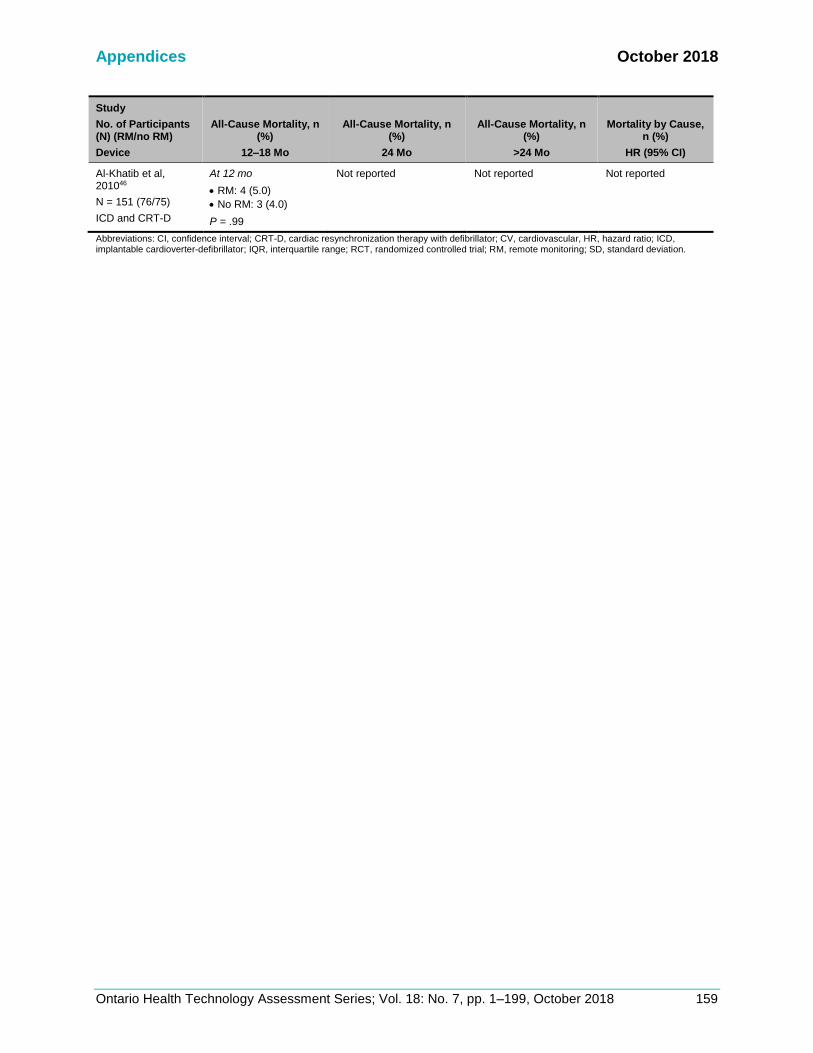
Appendices October 2018
Ontario Health Technology Assessment Series; Vol. 18: No. 7, pp. 1–199, October 2018 159
Study
No. of Participants (N) (RM/no RM)
Device
All-Cause Mortality, n (%)
12–18 Mo
All-Cause Mortality, n (%)
24 Mo
All-Cause Mortality, n (%)
>24 Mo
Mortality by Cause, n (%)
HR (95% CI)
Al-Khatib et al, 201046
N = 151 (76/75)
ICD and CRT-D
At 12 mo
• RM: 4 (5.0)
• No RM: 3 (4.0)
P = .99
Not reported Not reported Not reported
Abbreviations: CI, confidence interval; CRT-D, cardiac resynchronization therapy with defibrillator; CV, cardiovascular, HR, hazard ratio; ICD, implantable cardioverter-defibrillator; IQR, interquartile range; RCT, randomized controlled trial; RM, remote monitoring; SD, standard deviation.

Appendices October 2018
Ontario Health Technology Assessment Series; Vol. 18: No. 7, pp. 1–199, October 2018 160
Table A10: Hospitalizations—RCTs of Remote Monitoring of ICDs and CRT-Ds
Author, Year N) (RM/no RM)
Follow-Up, Mean Mo (SD)
Device
Hospitalizations,
All-Cause
Hospitalizations,
Cardiovascular Causes Length of Stay
Morgan et al, 201728
REM-HF
N = 1,650 (824/826)
33.6 (0–51.6)
CV + non-CV, n patients (%)
• RM: 541 (65.6)
• No RM: 511 (61.9)
CV, n patients (%)
• RM: 315 (38.2)
• No RM: 297 (36.0)
CV, events per year (95% CI)
• RM: 0.17 (0.15–0.19)
• No RM: 0.16 (0.14–0.18)
HR (95% CI): 1.07 (0.91–1.25) P = .42
Not reported
Boriani et al, 2014,
201730,50
MORE-CARE
Median (IQR): 24 (15–25)
Patient-years (707/693)
N = 865 (437/428)
Terminated early due to slow recruitment
n patients (%)
• RM: 165 (37.8)
• No RM: 151 (35.2)
24-mo rate per patient (95%
CI)a
All-cause
• RM: 0.96 (0.86–1.06)
• No RM: 0.90 (0.80–1.0)
Adjusted IRR: (95% CI):
1.02 (0.83–1.26) P = .83
n patients (%)
CV
• RM: 111 (25.4)
• No RM: 112 (26.2)
HF
• RM: 63 (14.4)
• No RM: 60 (14.0)
24-mo rate per patient (95% CI)a
CV
• RM: 0.56 (0.48–0.64)
• No RM: 0.58 (0.50–0.66)
Adjusted IRR: 0.91 (0.72–1.15)
P = .42
HF
• RM: 0.32 (0.26–0.38)
• No RM: 0.30 (0.24–0.36)
Adjusted IRR: 0.97 (0.74–1.29)
P = .85
Not reported
Bohm et al, 201631
OptiLink HF
N = 1,002 (505/497)
22.9 (18.2)
• RM: 286 (56.6)
• No RM: 292 (58.8)
HR: 0.91 (CI: 0.77–1.07)
P = .26
1st HF
• RM: 119 (23.6)
• No RM: 128 (25.8)
HR: 0.87 (0.67–1.12) P = .28
Events per patient-year
• RM: 0.24
• No RM: 0.30
P = .20
1st CV
• RM: 214 (42.4)
• No RM: 221 (44.5)
HR: 0.89 (0.71–1.05)
P = .14
Cardiovascular, n hospitalizations
• RM: 495
• No RM: 433
Not reported

Appendices October 2018
Ontario Health Technology Assessment Series; Vol. 18: No. 7, pp. 1–199, October 2018 161
Author, Year N) (RM/no RM)
Follow-Up, Mean Mo (SD)
Device
Hospitalizations,
All-Cause
Hospitalizations,
Cardiovascular Causes Length of Stay
Luthje et al, 201534
N = 176 (87/89)
15 mo
Not reported Worsening HF
• RM: 20 (22.9)
• No RM: 22 (24.7)
Time to first heart failure hospitalization, HR
(95% C)
HR: 1.23 (0.62–2.44) P = .55
Not reported
Hindricks et al, 201435
In-TIME
N = 664 (333/331)
11.2 (2.6)
Not reported Worsening HF, n patients (%)
• RM: 27 (8.1)
• No RM: 34 (10.3)
P = .35
Worsening HF, n hospitalizations
• RM: 44
• No RM: 47
P = .38
Median (IQR)
• RM: 8 (5–12)
• No RM: 7 (3–10)
P = .21
Landolina et al, 201240
EVOLVO
N = 200 (99/101)
Up to 16 mo
Not reported For HF, arrhythmias, ICD-related
Mean per patient-year
• RM: 0.45
• No RM: 0.39
P = 0.46
Not reported
Crossley et al, 201141
CONNECT
N = 1,997 (1,014/983)
15 mo
Not reported CV, mean per patient-year
• RM: 0.50
• No RM: 0.47
P = .52
Mean
All patients
• RM: 3.3
• No RM: 4.0
P = .002
ICDs
• RM: 3.0
• No RM: 3.6
CRT-Ds
• RM: 3.8
• No RM: 4.7
Varma et al, 2010,42 and 201445
TRUST
N = 1,339 (908/431)
11.5 (2.6)
Non-inferiority trial (safety)
Fewer hospitalizations in
RM vs. non-RM (numbers
not provided)
P < .001
Not reported Not reported
Al-Khatib et al, 201046
N = 151 (76/75)
12 mo
n hospitalizations (%)
• RM: 23
• No RM: 24
P = .88
Not reported Not reported
Abbreviations: CI, confidence interval; CRT-D, cardiac resynchronization therapy with defibrillator; CV, cardiovascular; HF, heart failure; HR, hazard ratio; ICD, implantable cardioverter-defibrillator; IQR, interquartile range; IRR, incidence rate ratio; RCT, randomized controlled trial; RM, remote monitoring; SD, standard deviation. aThe 24-month rate per 100 patients is provided in the study.

Appendices October 2018
Ontario Health Technology Assessment Series; Vol. 18: No. 7, pp. 1–199, October 2018 162
Appendix 8: Economic Evidence
Results of Applicability Checklist for Studies Included in Economic Literature Review
Table A11: Assessment of the Cost-Effectiveness of Remote Monitoring CIED
Author, Year
Is the Study Population
Similar to the Question?
Are the Interventions Similar to the
Question?
Is the Health Care System in Which the Study Was
Conducted Sufficiently Similar
to the Current Ontario Context?
Were the Perspectives
Clearly Stated and What Were They?
Are Estimates of Relative Treatment
Effect From the Best Available Source?
Ricci et al. 201769
Yes Yes (RM combination vs. in-person only)
No (Italy) Yes (health care payer)
Yes
Zanaboni et al.
201370
Partly (specific to heart failure patients)
Yes (RM combination vs. in-person only)
No (Italy) Yes (health care payer)
Yes
Klersy et al.
201173
Partly (specific to heart failure patients)
Yes (RM vs. in-person only)
No (USA, Italy, France, Germany, UK)
Yes (health care payer)
N/A
MSAC 201471
and
201672
Yes Yes (RM combination vs. in-person only)
No (Australia) Yes (health care payer)
Unclear
Author, Year
Are All Future Costs and Outcomes Discounted?
Is the Value of Health Effects
Expressed in Terms of Quality-Adjusted
Life-Years?
Are Costs and Outcomes From Other
Sectors Fully and Appropriately Measured and
Valued? Overall Judgementa
Ricci et al.
201769
No (appropriate, trial-based)
Yes No Partially applicable
Zanaboni et al.
201370
No (appropriate, trial-based)
Yes No Partially applicable
Klersy et al.
201173
No (short time horizon)
Partly (backhand calculations)
No Partially applicable
MSAC 201471
and 201672
No N/A (CMA, CEA) No Partially applicable
Abbreviations: CEA, cost-effectiveness analysis; CIED, cardiac implantable electronic device; CMA, cost-minimization analysis; MSAC, Medical Services Advisory Committee; RM, remote monitoring. aDirectly applicable, partially applicable, or not applicable.

Appendices October 2018
Ontario Health Technology Assessment Series; Vol. 18: No. 7, pp. 1–199, October 2018 163
Methodological Quality of Studies Included in Economic Literature Review
Table A12: Assessment of the Cost-Effectiveness of Remote Monitoring CIED
Author, Year
Does the Model
Structure Adequately Reflect the Nature of the Health Condition
Under Evaluation
?
Is the Time Horizon
Sufficiently Long to
Reflect All Important
Differences in Costs and Outcomes?
Are All Important
and Relevant Health
Outcomes Included?
Are the Estimates of Relative Treatment
Effects Obtained
From Best Available Sources?
Do the Estimates of Relative Treatment
Effect Match the Estimates Contained
in the Clinical Report?
Are all Important
and Relevant (Direct) Costs
Included in the
Analysis?
Are the Estimates
of Resource
use Obtained
From Best Available Sources?
Ricci et al. 201769
N/A No (12 mo) Yes Yes N/A Yes Yes
Zanaboni et al.
201370
N/A No (16 mo) Yes Yes N/A Yes Yes
Klersy et al. 201173
No No (12 mo) No Yes Yes No No
MSAC
201471
and 2016
update72
CMA NR No (12 mo) N/A N/A N/A Unclear Unclear
CEA NR Partly (5 yr) Yes Noa Yes Unclear Unclear
Author, Year
Are the Unit Costs of
Resources Obtained From Best Available Resources?
Is an Appropriate Incremental
Analysis Presented or
Can It Be Calculated From the Reported
Data?
Are Aall Important and
Uncertain Parameters Subjected to Appropriate Sensitivity Analysis?
Is There a Potential
Conflict of Interest?
Overall Assessment Including Applicability
to the Projectb
Ricci et al. 201769
Yes Yes (can be calculated)
No (one scenario analysis)
Yes Potentially serious limitations
Zanaboni et al.
201370
Yes Yes No (one scenario analysis)
Yes Potentially serious limitations
Klersy et al. 201173
No No No Yes Very serious limitations
MSAC
201471
and
201672
CMA Unclear N/A No No Potentially serious limitations
CEA Unclear Yes No No Potentially serious limitations
Abbreviations: CIED, cardiovascular implantable electronic device; CEA, cost-effectiveness analysis; CMA, cost-minimization analysis; MSAC, Medical Services Advisory Committee; NR, not reported. aExtrapolated survival. bMinor limitations, potentially serious limitations, very serious limitations.

Appendices October 2018
Ontario Health Technology Assessment Series; Vol. 18: No. 7, pp. 1–199, October 2018 164
Appendix 9: Primary Economic Evaluation
Target Population
Distribution of NYHA Functional Class in Ontario (Model 1)
Table A13 shows the severity of heart failure in patients implanted with a first-time cardiac device (not a device replacement) in Ontario between 2007 and 2009. We determined the “average” NYHA functional class of the Markov cohort to be class II (expected value, E(X) = ∑xipi ≈ 1.96 ≈ 2). Table A13: Distribution of New York Heart Association Functional Class Among De Novo Implant
Recipients in Ontario Between February 2007 and May 2009
NYHA functional class, n (%)
Total,
N = 3,340
I 1143 (34.2)
II 1252 (37.5)
III 880 (26.3)
IV 65 (1.9)
Abbreviation: NYHA, New York Heart Association. Note: Higher NYHA class represents a worse functional status. Source: Ontario ICD Registry.77
Intervention
Canadian Cardiovascular Society/Canadian Heart Rhythm Society Joint Position Statement 2013
For models 1 and 2, the RM assessment schedule was based on Canadian recommendations: • Initiate RM during the maintenance phase, 3 months after successful implantation (conditional
recommendation, low-quality evidence)
• Blend RM with in-clinic assessments, alternating assessments between in-clinic and RM interrogations in a 1:1 ratio (conditional recommendation, low-quality evidence)
Source: Yee et al, 201311
Model Structure
Full Markov Model Structure (Models 1 and 2)
Model 1
The two interventions (RM plus clinic visits and clinic vists only) have the same tree structure. Figure A1 shows the health states for ICD and CRT-D recipients. Figure A2 shows the subtree for stable heart failure (NYHA II). Figure A3 shows the subtree for post-hospitalization (NYHA II). Note that the other NYHA health states have an almost identical subtree structure to the NYHA II subtrees (i.e., events include hospitalization, unscheduled, and scheduled care). They differ in the possible transitions to other NYHA classes (i.e., improve, worsen, or remain in same class). After surviving a hospitalization event, patients discharge with the same or improved NYHA functional class that they were admitted with in the reference case.

Appendices October 2018
Ontario Health Technology Assessment Series; Vol. 18: No. 7, pp. 1–199, October 2018 165
Model 2
Figure A4 shows the health states for pacemaker recipients. Figure A5 shows patients may be admitted to hospital (for stroke-related or non–stroke-related events) or have scheduled and unscheduled clinic visits. After a non–stroke-related event (see Figure A6), patients remain in this post-hospitalization state for 1 year after discharge, with an increased risk of death and hospital readmission. One year after discharge, they return to baseline levels of risk (same as that of the stable arrhythmia health state). After a stroke-related event (see Figure A7), patients remain in this post-stroke state for the remainder of the model time horizon, with an increased risk of death and hospital readmission.
Figure A1: Health States for ICD and CRT-D Recipients
Abbreviations: CRT-D, cardiac resynchronization therapy-defibrillator; HF, heart failure; ICD, implantable cardioverter defibrillator; NYHA, New York Heart Association functional class; RM, remote monitoring.

Appendices October 2018
Ontario Health Technology Assessment Series; Vol. 18: No. 7, pp. 1–199, October 2018 166
Figure A2: Subtree for Stable Heart Failure (NYHA II).
Abbreviations: HF, heart failure; NYHA, New York Heart Association functional class; RM, remote monitoring.

Appendices October 2018
Ontario Health Technology Assessment Series; Vol. 18: No. 7, pp. 1–199, October 2018 167
Figure A3: Subtree for Post-Hospitalization (NYHA II).
Abbreviations: HF, heart failure; NYHA, New York Heart Association functional class; RM, remote monitoring.

Appendices October 2018
Ontario Health Technology Assessment Series; Vol. 18: No. 7, pp. 1–199, October 2018 168
Figure A4: Health states for pacemaker recipients.
Abbreviations: RM, remote monitoring.

Appendices October 2018
Ontario Health Technology Assessment Series; Vol. 18: No. 7, pp. 1–199, October 2018 169
Figure A5: Subtree for Stable Arrhythmia
Abbreviations: ED, emergency department; RM, remote monitoring.

Appendices October 2018
Ontario Health Technology Assessment Series; Vol. 18: No. 7, pp. 1–199, October 2018 170
Figure A6: Subtree After Hospitalization for a Non–Stroke-Related Event
Abbreviations: ED, emergency department; RM, remote monitoring.

Appendices October 2018
Ontario Health Technology Assessment Series; Vol. 18: No. 7, pp. 1–199, October 2018 171
Figure A7: Subtree for After Hospitalization for a Stroke-Related Event
Abbreviations: ED, emergency department; RM, remote monitoring.

Appendices October 2018
Ontario Health Technology Assessment Series; Vol. 18: No. 7, pp. 1–199, October 2018 172
Clinical Outcome and Utility Parameters
Background Mortality (Models 1 and 2)
Table A14: Monthly Transition Probabilities for Background Mortality, Adjusted to a Population of 70% males for Model 1 (Starting at Age 65) and 65% males for Model 2 (Starting at Age 70)
Age Model 1 Model 2
65 0.000847 N/A
66 0.000932 N/A
67 0.001027 N/A
68 0.001132 N/A
69 0.001249 N/A
70 0.001379 0.001350392
71 0.001524 0.001492344
72 0.001685 0.001650572
73 0.001865 0.001827418
74 0.002066 0.002024995
75 0.002291 0.002245409
76 0.002542 0.002492555
77 0.002823 0.002768933
78 0.003139 0.003079389
79 0.003493 0.003427477
80 0.003890 0.003819115
Source: Statistics Canada Life Table 053-0003.
Natural History (Model 1: ICD and CRT-D population)
Scenario Analysis: Transition Probabilities Between NYHA Functional Classes
Table A15: Monthly Transition Probabilities Between New York Heart Association Functional Classes Used in Scenario Analysis (Based on Patients With Worse Functional Class Than in the Reference Case)
From
To
NYHA I NYHA II NYHA III NYHA IV
NYHA I 0.906 0.075 0.016 0.003
NYHA II 0.067 0.896 0.033 0.004
NYHA III 0.007 0.121 0.864 0.009
NYHA IV 0.048 0.048 0.181 0.723
Abbreviation: NYHA, New York Heart Association functional class.
Note: Higher NYHA class represents worse functional status. Monthly transition probabilities were modelled as beta distributions assuming a standard deviation = 10% of the mean.
Source: Yao et al. 2007.108

Appendices October 2018
Ontario Health Technology Assessment Series; Vol. 18: No. 7, pp. 1–199, October 2018 173
Scenario Analysis: Transition Probabilities for Unscheduled Visits
Table A16: Model Inputs for Scheduled Health Care Use for Scenario Analysis
Estimate SDa Distribution Source
Adherence to clinic visits (%) 41.3 4.13 Beta Hess 201390
Abbreviation: SD, standard deviation. aSD assumed to be 10% of mean.
Costs
Table A17: Procedure and Consultation Fee Codes for Physician Services for In-Clinic Assessments
Variable Fee Code Total Cost ($)
Individual fee codes
Programmable including electrocardiography, interrogation and reprogramming
G321 47.65
Medical-specific re-assessment A604 61.25
Complex medical-specific re-assessment A601 70.90
Fee codes for in-clinic assessment
Reference case G321, A604 108.90
Sensitivity analysis, lower bound A604 61.25
Sensitivity analysis, upper bound G321, A604, A601
179.80
Source: Ontario Schedule of Benefits for Physician Services.
Table A18: Patient Grouping Methodology Codes for Hospitalizations and Emergency
Department Visits
Variable Codea
Age Group
Total Cost ($) Mean (SD)
Model 1
Hospital CMG Grouper: 161 -Implantation of Cardioverter/Defibrillator 18–69 31,086 (25,548)
ED CACS Grouper: C204-Mgmt/Removal Pacemaker/Defibrillator 18–69 10,214 (8,203)
Model 2
Hospital CMG Grouper: 187-Pacemaker Implantation 70+ 12,911 (12,938)
ED CACS Grouper: C204-Mgmt/Removal Pacemaker/Defibrillator 70+ 8,425 (7,817)
Abbreviations: CACS, comprehensive ambulatory classification system; CMG,= case mix group; ED, emergency department; SD, standard deviation. aThe CMG Grouper and CACS Grouper are assigned based on the most responsible diagnosis. We assumed these were the cost of an any-cause hospital visit or emergency department visit.
Source: Ontario Case Costing Tool 2015/2016.

Appendices October 2018
Ontario Health Technology Assessment Series; Vol. 18: No. 7, pp. 1–199, October 2018 174
Table A19: Procedure Codes for Pulse Generator Replacement
CCI Code Age Group
Model 1
1.YY.54.LA-NM Management of internal device, skin of surgically
constructed sites of cardiac pacemaker battery/generator using open (subcutaneous) approach
18–69
Model 2
1.YY.54.LA-FS Management of internal device, skin of surgically constructed sites of cardioverter or defibrillation device using open (subcutaneous) approach
70+
Table A20: Procedure Codes for Device Replacement
CCI Code Age Group
Model 1
1HZ53GRFS-Implant int dev heart PTA cardiovert/defib
1HZ53GRFU-Implant dev heart vn PTA resynchronization defib
1HZ53LAFU-Implant dev heart OA resynchronization defib
1HZ53HAFS-Implant int dev heart perc app cardvert/defib
1HZ53LAFS-Implant int dev heart OA cardiovert/defib
1HZ53SYFS-Implant int dev hrt OA & PTA cardvert/defib
1HZ53SYFU-Implant dev heart OA & PTA resynchronization defib
18–69
Model 2
1HZ53GRNK-Implant int dev PTA dual chamb rr pacer
1HZ53GRNM-Implant int dev heart PTA sing cham rr pacer
1HZ53GRNL-Implant int dev PTA fix rate pacer
1HZ53LANK-Implant int dev hrt OA dual cham rr pacr
1HZ53LANM-Implant int dev hrt OA sing cham rr pacr
1HZ53QANK-Implant int dev hrt subxphd OA dual cham rr pacr
1HZ53QANM-Implant int dev hrt subxphd OA sing cham rr pacr
70+
Source: Ontario Case Costing Tool Acute Inpatient 2015/2016.

Appendices October 2018
Ontario Health Technology Assessment Series; Vol. 18: No. 7, pp. 1–199, October 2018 175
Table A21: Nursing Time and Hourly Wage Associated With Remote and In-Clinic Assessments for Models 1 and 2
Variable Estimate Lower Bound
Upper Bound Source
Time spent
RM administrative activities,a minutes per month (median, IQR)
1.9 0.8 16.5 Ricci et al, 2014137
Remote interrogation, minutes per visit
Reference case (median, IQR) 1.2 0.6 2 Ricci et al, 2014137
Sensitivity analysis (mean) 5 5 15 Expert opinion
In-clinic interrogation, minutes per visit (mean, min, max)
12 N/A N/A Elsner et al, 2006117
Clinic visit administrative activities, minutes per visit (mean, min, max)
2 N/A N/A Elsner et al, 2006117
Hourly wage ($)b (mean, min, max) 51.20 36.40 52.10 Ontario Nurses’ Association114
Abbreviations: IQR, interquartile range; RM, remote monitoring.
aRM administrative activities include training patients, scheduling appointments, contacting patients as a reaction to remote monitoring findings, contacting patients to restore interrupted remote transmissions. bAssuming a registered nurse with 8 years of experience for the mean, no experience for the minimum, and ≥25 years for the maximum, plus 13% in lieu of benefits.
Note: Costs of activities were calculated as time spent × hourly wage. Lower bound = lower time × lower wage. Upper bound = upper time × upper wage.

Appendices October 2018
Ontario Health Technology Assessment Series; Vol. 18: No. 7, pp. 1–199, October 2018 176
Table A22: Sensitivity and Scenario Analyses for Primary Economic Evaluation
Scenario Parameter(s) Used in
Reference Case Parameter(s) Used in Scenario
Analysis
Structural
Models 1 and 2
Time Horizon 5 yr 10 yr (to include battery replacement costs)
Model 1
NYHA class after hospitalization Discharge with the same NYHA functional class as at admission
Discharge with an improved functional class (one class lower than the class they had at admission)
Natural history
Models 1 and 2
Adherence with scheduled clinic visits Based on trial data30:
Beta distribution, 93.6% (SD: 9.36).
Based on observational data (lower
adherence)90:
Beta distribution, 41.3% (SD: 4.13).
See Table A5, above.
Model 1
NYHA transition probabilities Transitions derived from HF patients with NYHA II and III functional class.
Transitions derived from more severe HF patients with NYHA III and IV functional classes. Unlike the reference case, these transitions allow for patients to worsen by more than two functional classes in 1 mo (i.e., from NYHA I to IV), or allow for patients to improve by two or more functional classes in 1 mo (i.e., from NYHA IV to II).
See Table A4, above.
Time to battery replacement (modelled when time horizon is extended to 10 yr)
N/A Based on ICD data94:
Gamma distribution, 5.9 yr (SD: 1.52)
Based on CRT-D94:
Gamma distribution, 4.9 yr (SD: 1.29)
Model 2
Time to battery replacement (modelled when time horizon is extended to 10 yr)
N/A Based on Dutch national data101:
Gamma distribution, 6.3 yr (SD: 3.3)
Based on US multicenter data102:
Gamma distribution, 7.3 yr (SD: 3.1)
Remote monitoring impact on natural history
Model 1
Impact of RM on mortality Cardiac mortality based on meta-analysis:
RR = 0.89
(95% CI: 0.75–1.06)
All-cause mortality based on meta-analysis:
HR = 0.81 (95% CI: 0.60–1.11)
All-cause mortality based on one trial
(reduced mortality)35:
HR = 0.36 (95% CI: 0.17–0.74)a
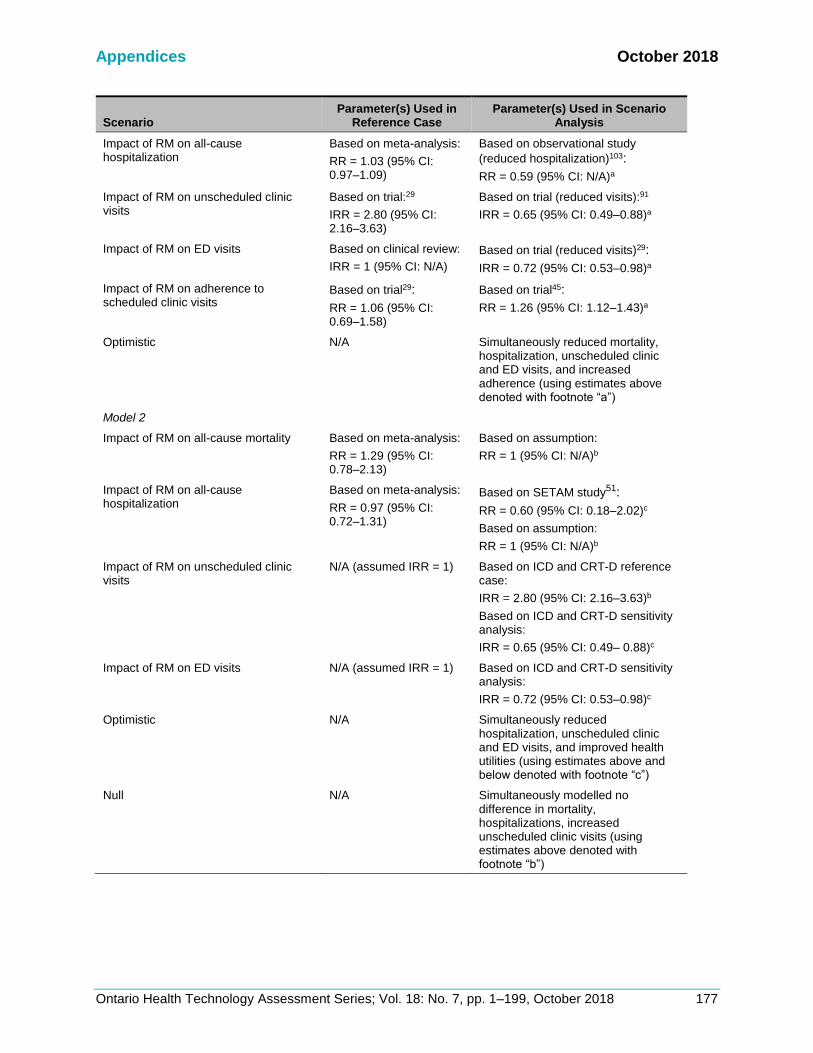
Appendices October 2018
Ontario Health Technology Assessment Series; Vol. 18: No. 7, pp. 1–199, October 2018 177
Scenario Parameter(s) Used in
Reference Case Parameter(s) Used in Scenario
Analysis
Impact of RM on all-cause hospitalization
Based on meta-analysis:
RR = 1.03 (95% CI: 0.97–1.09)
Based on observational study
(reduced hospitalization)103:
RR = 0.59 (95% CI: N/A)a
Impact of RM on unscheduled clinic visits
Based on trial:29
IRR = 2.80 (95% CI: 2.16–3.63)
Based on trial (reduced visits):91
IRR = 0.65 (95% CI: 0.49–0.88)a
Impact of RM on ED visits Based on clinical review:
IRR = 1 (95% CI: N/A)
Based on trial (reduced visits)29:
IRR = 0.72 (95% CI: 0.53–0.98)a
Impact of RM on adherence to scheduled clinic visits
Based on trial29:
RR = 1.06 (95% CI: 0.69–1.58)
Based on trial45:
RR = 1.26 (95% CI: 1.12–1.43)a
Optimistic N/A Simultaneously reduced mortality, hospitalization, unscheduled clinic and ED visits, and increased adherence (using estimates above denoted with footnote “a”)
Model 2
Impact of RM on all-cause mortality Based on meta-analysis:
RR = 1.29 (95% CI: 0.78–2.13)
Based on assumption:
RR = 1 (95% CI: N/A)b
Impact of RM on all-cause hospitalization
Based on meta-analysis:
RR = 0.97 (95% CI: 0.72–1.31)
Based on SETAM study51:
RR = 0.60 (95% CI: 0.18–2.02)c
Based on assumption:
RR = 1 (95% CI: N/A)b
Impact of RM on unscheduled clinic visits
N/A (assumed IRR = 1) Based on ICD and CRT-D reference case:
IRR = 2.80 (95% CI: 2.16–3.63)b
Based on ICD and CRT-D sensitivity analysis:
IRR = 0.65 (95% CI: 0.49– 0.88)c
Impact of RM on ED visits N/A (assumed IRR = 1) Based on ICD and CRT-D sensitivity analysis:
IRR = 0.72 (95% CI: 0.53–0.98)c
Optimistic N/A Simultaneously reduced hospitalization, unscheduled clinic and ED visits, and improved health utilities (using estimates above and below denoted with footnote “c”)
Null N/A Simultaneously modelled no difference in mortality, hospitalizations, increased unscheduled clinic visits (using estimates above denoted with footnote “b”)
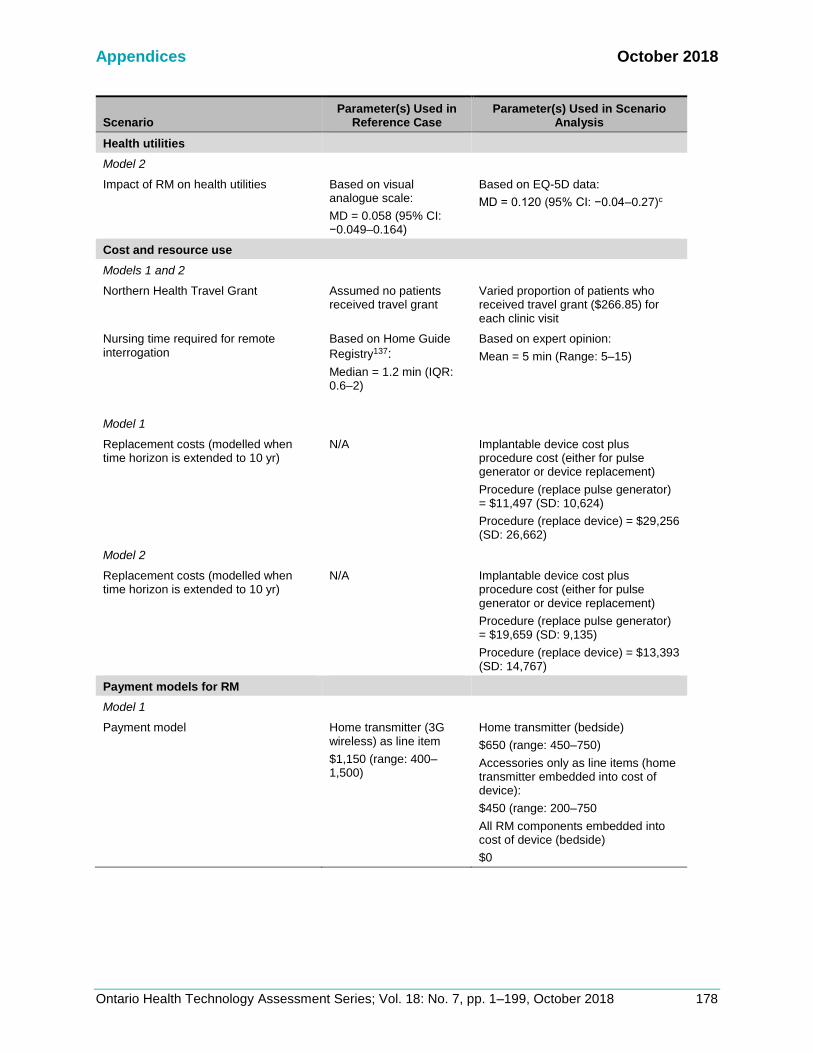
Appendices October 2018
Ontario Health Technology Assessment Series; Vol. 18: No. 7, pp. 1–199, October 2018 178
Scenario Parameter(s) Used in
Reference Case Parameter(s) Used in Scenario
Analysis
Health utilities
Model 2
Impact of RM on health utilities Based on visual analogue scale:
MD = 0.058 (95% CI: −0.049–0.164)
Based on EQ-5D data:
MD = 0.120 (95% CI: −0.04–0.27)c
Cost and resource use
Models 1 and 2
Northern Health Travel Grant Assumed no patients received travel grant
Varied proportion of patients who received travel grant ($266.85) for each clinic visit
Nursing time required for remote interrogation
Based on Home Guide
Registry137:
Median = 1.2 min (IQR: 0.6–2)
Based on expert opinion:
Mean = 5 min (Range: 5–15)
Model 1
Replacement costs (modelled when time horizon is extended to 10 yr)
N/A Implantable device cost plus procedure cost (either for pulse generator or device replacement)
Procedure (replace pulse generator) = $11,497 (SD: 10,624)
Procedure (replace device) = $29,256 (SD: 26,662)
Model 2
Replacement costs (modelled when time horizon is extended to 10 yr)
N/A Implantable device cost plus procedure cost (either for pulse generator or device replacement)
Procedure (replace pulse generator) = $19,659 (SD: 9,135)
Procedure (replace device) = $13,393 (SD: 14,767)
Payment models for RM
Model 1
Payment model Home transmitter (3G wireless) as line item
$1,150 (range: 400–1,500)
Home transmitter (bedside)
$650 (range: 450–750)
Accessories only as line items (home transmitter embedded into cost of device):
$450 (range: 200–750
All RM components embedded into cost of device (bedside)
$0

Appendices October 2018
Ontario Health Technology Assessment Series; Vol. 18: No. 7, pp. 1–199, October 2018 179
Scenario Parameter(s) Used in Reference Case
Parameter(s) Used in Scenario Analysis
Model 2
Payment model Home transmitter (3G wireless) as line item
$450 (range: 250–1,400)
Home transmitter (bedside)
$450 (range: 250–650)
Methodological
Discount rate 1.5% 0%, 3%, 5%
Abbreviations: CI, confidence interval; CRT-D, cardiac resynchronization therapy defibrillator; ED, emergency department; HF, heart failure; HR, hazard ratio; ICD, implantable cardioverter defibrillator; IQR, interquartile range; IRR, incidence rate ratio; MD, mean difference; NYHA, New York Heart Association; SD, standard deviation; RM, remote monitoring; RR, risk ratio. aSimultaneously modelled effects in favour of RM as part of the optimistic scenario (reduced mortality, hospitalization, unscheduled clinic visits, ED visits, and increased adherence). bSimultaneously modelled effects as part of the null scenario (no difference in mortality, hospitalizations, or increased unscheduled clinic visits). cSimultaneously modelled effects in favour of RM as part of the optimistic scenario (reduced hospitalization, unscheduled clinic visits, ED visits, and improved health utilities).
Results
Model 1: ICD and CRT-D Population
Table A23: One-Way Sensitivity Analysis for Percent Reduction in Payment for Remote Interrogation as Compared to the Payment for a Clinic Visit for ICD and CRT-D Recipients
Remote interrogation Payment
Incremental Cost ($)
Incremental Effect, QALY
ICER, $/QALY
90% reduction 4,124.99 0.17 23,838.63
80% reduction 4,163.60 0.17 24,061.77
70% reduction 4,202.21 0.17 24,284.92
60% reduction 4,240.83 0.17 24,508.07
50% reduction 4,279.44 0.17 24,731.22
40% reduction 4,318.05 0.17 24,954.37
30% reduction 4,356.67 0.17 25,177.52
20% reduction 4,395.28 0.17 25,400.67
10% reduction 4,433.89 0.17 25,623.81
Abbreviations: ICER, incremental cost-effectiveness ratio; QALY, quality-adjusted life-year.

Appendices October 2018
Ontario Health Technology Assessment Series; Vol. 18: No. 7, pp. 1–199, October 2018 180
Figure A8: Tornado Diagram for Key Parameters Used in Model 1

Appendices October 2018
Ontario Health Technology Assessment Series; Vol. 18: No. 7, pp. 1–199, October 2018 181
Variables in tornado diagram, from top to bottom:
Variable
Variable (sensitivity analysis) ICER ($/QALY)
Lower Upper Lower Upper
Incidence rate ratio for unscheduled ED visits 0.600 1.400 −18,595.89 70,289.81
Incidence rate ratio for unscheduled clinic visits 0.847 4.802 18,564.82 33,129.11
Mean difference in utilities associated with RM 0.043 0.086 13,606.36 25,846.96
Monthly probability of hospitalization for NYHA II 0.000 0.050 17,218.55 26,682.52
Monthly probability of remaining in NYHA II 0.780 1.000 23,611.34 31,883.55
Monthly probability of mortality for NYHA II 0.000 0.050 25,482.98 32,826.65
Monthly probability of ED visit 0.000 0.050 24,273.24 27,419.41
Monthly probability of hospitalization for NYHA III 0.000 0.050 23,560.21 26,613.90
Percent of successful transmissions (% who have scheduled remote interrogations) 0.400 1.000 22,901.65 25,880.33
Monthly probability of hospitalization for NYHA i 0.000 0.050 24,576.61 26,233.51
Risk ratio of adherence to scheduled, in-clinic visits 0.500 2.000 24,421.88 25,846.96
Monthly probability of mortality afterhospitalization, NYHA II 0.000 0.050 24,730.92 25,765.43
Health utilities for NYHA II 0.720 0.864 24,955.47 25,846.96
Monthly probability NYHA II to I (conditional) 0.337 0.505 25,486.78 26,213.87
Monthly probability NYHA II to IV (conditional) 0.073 0.109 25,730.83 25,963.50

Appendices October 2018
Ontario Health Technology Assessment Series; Vol. 18: No. 7, pp. 1–199, October 2018 182
Appendix 10: Budget Impact Analysis
Target Population
Reference Case
Table A24: Reference Case: Number of Patients Followed Remotely Plus Clinic Visits and In-Clinic Visits Alone Over Five Years
Patients (N)
Year 1 Year 2 Year 3 Year 4 Year 5
Current scenario: without publicly funded RM (15% uptake at baseline)
RM, ICD, CRT-P, and CRT-D 307 320 332 345 357
RM, pacemakers 889 914 938 963 987
Clinic only, ICD, CRT-P, and CRT-D 1,741 1,812 1,883 1,954 2,025
Clinic only, pacemakers 5,038 5,177 5,316 5,455 5,593
New scenario 1: publicly funded RM (10% increase immediately and for each subsequent year for any device, cap at 47%)
RM, ICD, CRT-P, and CRT-D 512 746 997 1,081 1,120
RM, pacemakers 1,482 2,132 2,814 3,016 3,093
Clinic only, ICD, CRT-P, and CRT-D 1,536 1,386 1,219 1,219 1,263
Clinic only, pacemakers 4,446 3,959 3,440 3,401 3,488
New scenario 2: publicly funded RM (15% increase immediately and for each subsequent year for any device, cap at 71%)
RM, ICD, CRT-P, and CRT-D 615 960 1,329 1,633 1,692
RM, pacemakers 1,778 2,741 3,752 4,556 4,672
Clinic only, ICD, CRT-P, and CRT-D 1,434 1,173 886 667 691
Clinic only, pacemakers 4,149 3,350 2,502 1,861 1,908
New scenario 3: publicly funded RM (10% increase immediately and for each subsequent year for any device, cap at 71% and 22% for ICD, CRT-D, and CRT-P and pacemakers, respectively)
RM, ICD, CRT-P, and CRT-D 512 746 997 1,265 1,549
RM, pacemakers 1,304 1,340 1,376 1,412 1,448
Clinic only, ICD, CRT-P, and CRT-D 1,536 1,386 1,219 1,035 834
Clinic only, pacemakers 4,623 4,751 4,878 5,005 5,133
Abbreviations: CRT-D, cardiac resynchronization therapy-defibrillator; CRT-P, cardiac resynchronization therapy-pacemaker; ICD, implantable cardioverter defibrillator; RM, remote monitoring.

Appendices October 2018
Ontario Health Technology Assessment Series; Vol. 18: No. 7, pp. 1–199, October 2018 183
Scenario Analysis
Table A25: Scenario Analysis: Number of Patients Followed Remotely Plus Clinic Visits and Clinic Visits Alone Over Five Years
Patients (N)
Year 1 Year 2 Year 3 Year 4 Year 5
Current scenario: without publicly funded RM (50% and 4% uptake at baseline for ICD, CRT-D, and CRT-P and pacemakers, respectively)
RM, ICD, CRT-P, and CRT-D 1,024 1,066 1,108 1,150 1,191
RM, pacemakers 237 244 250 257 263
Clinic only, ICD, CRT-P, and CRT-D 1,024 1,066 1,108 1,150 1,191
Clinic only, pacemakers 5,690 5,847 6,004 6,160 6,317
New scenario: publicly funded RM (10% increase immediately and for each subsequent year for any device, cap at 71%)
RM, ICD, CRT-P, and CRT-D 1,229 1,492 1,573 1,632 1,692
RM, pacemakers 830 1,462 2,126 2,823 3,553
Clinic only, ICD, CRT-P, and CRT-D 819 640 643 667 691
Clinic only, pacemakers 5,098 4,629 4,128 3,594 3,027
Abbreviations: CRT-D, cardiac resynchronization therapy-defibrillator; CRT-P, cardiac resynchronization therapy-pacemaker; ICD, implantable cardioverter defibrillator; RM, remote monitoring.

Appendices October 2018
Ontario Health Technology Assessment Series; Vol. 18: No. 7, pp. 1–199, October 2018 184
Resource and Costs
Table A26: Disaggregated Costs From Primary Economic Evaluation for ICD and CRT-D Recipients and Pacemaker Recipients Under Publicly Funded Remote Monitoring Plus Clinic Visits Versus Clinic Visits Alone
Costs ($, 2017)
Year 1 Year 2 Year 3 Year 4 Year 5 Total
ICD, CRT-D, and CRT-P recipients
RM plus clinic visits
Physicians 628.01 562.36 495.99 437.35 385.75 2,509.47
Nursing 58.83 52.75 46.52 41.02 36.18 235.30
Hospitalization 9,511.33 8,524.28 7,446.13 6,496.64 5,675.62 37,653.99
ED visits 5,009.74 4,474.02 3,945.77 3,479.32 3,068.87 19,977.72
Unscheduled visits 467.94 417.90 368.56 324.99 286.65 1,866.05
Scheduled visits 218.90 197.20 173.96 153.38 135.28 878.72
Clinic visits alone
Physicians 349.79 311.31 272.28 238.18 208.51 1,380.08
Nursing 28.18 25.16 22.01 19.25 16.85 111.45
Hospitalization 9,190.52 8,159.44 7,060.14 6,106.39 5,291.69 35,808.18
ED visits 4,998.34 4,427.87 3,872.51 3,387.85 2,965.97 19,652.54
Unscheduled visits 165.29 146.42 128.06 112.03 98.08 649.88
Scheduled visits 222.89 199.05 174.10 152.29 133.31 881.64
Pacemaker recipients
RM plus clinic visits
Physicians 256.87 224.10 209.78 181.35 168.78 1,040.88
Nursing 28.19 15.71 23.02 12.70 18.52 98.15
Hospitalization 3,650.36 4,268.63 3,914.18 3,513.50 3,140.70 18,487.36
ED visits 2,340.74 1,948.96 1,733.16 1,554.49 1,391.55 8,968.91
Unscheduled visits 166.38 150.54 135.54 121.69 108.93 683.07
Scheduled visits 118.68 89.27 97.26 72.37 78.37 455.95
Clinic visits alone
Physicians 251.16 238.13 213.34 201.28 179.55 1,083.45
Nursing 27.56 16.21 23.41 13.69 19.70 100.57
Hospitalization 3,857.99 4,693.86 4,413.53 4,049.23 3,699.69 20,714.30
ED visits 2,347.91 1,974.00 1,788.65 1,640.14 1,502.70 9,253.40
Unscheduled visits 167.59 154.55 142.19 130.53 119.57 714.43
Scheduled visits 111.13 109.70 94.56 92.84 79.68 487.91
Abbreviations: CRT-D, cardiac resynchronization therapy-defibrillator; CRT-P, cardiac resynchronization therapy-pacemaker; ICD, implantable cardioverter defibrillator; RM, remote monitoring.

Appendices October 2018
Ontario Health Technology Assessment Series; Vol. 18: No. 7, pp. 1–199, October 2018 185
Appendix 11: Letter of Information
Letter of Information Health Quality Ontario is conducting a review of Remote Cardiac Monitoring. The purpose is to understand whether this technology should be broadly funded in Ontario. An important part of this review involves speaking to patients and caregivers of those who have experience implanted heart devices, and who may or may not have used internet-based remote monitoring of their heart. Our goal is to make sure the experiences of patients and caregivers are considered in the funding recommendations for this technology.
WHAT DO YOU NEED FROM ME
✓ Willingness to share your story ✓ 30-50 minutes of your time for a phone or in-person interview ✓ Permission to audio- (not video-) record the interview
What Your Participation Involves
If you agree to share your experiences, you will be asked to have an interview with Health Quality Ontario staff. The interview will likely last 30-50 minutes. It will be held in a private location or over the telephone. With your permission, the interview will be audio-taped. The interviewer will ask you questions about your or your loved one’s condition and your perspectives about treatment options in Ontario. Participation is voluntary. You may refuse to participate, refuse to answer any questions or withdraw before or at any point during your interview. Withdrawal will in no way affect the care you receive.
Confidentiality
All information you share will be kept confidential and your privacy will be protected except as required by law. The results of this review will be published, however no identifying information will be released or published. Any records containing information from your interview will be stored securely until project completion. After the project completion, the records will be destroyed.
Risks to participation
There are no known physical risks to participating. Some participants may experience discomfort or anxiety after speaking about their experience.
If you are interested, please contact:

Appendices October 2018
Ontario Health Technology Assessment Series; Vol. 18: No. 7, pp. 1–199, October 2018 186
Appendix 12: Patient Interview Guide
• Please share how and when you were diagnosed with a heart condition.
• Do you have any other health conditions? If yes, what are they? Do you find that they
affect your ability to manage your heart condition?
• We are trying to include diverse perspectives within Ontario. Do you feel that you are
part of a group or community that is not served well by our health system? If yes, how
did it shape how you received or participated in care?
• What is your day-to-day routine and quality of life like?
• What is the impact of your heart condition on families and caregivers?
• Can you us tell about the heart monitoring methods that you are aware of?
• Of those methods, which were accessible to you and which ones have you explored?
• Was cost or caregiver support an issue?
• Were there any other difficulties to accessing these methods? Was it difficult to weigh
risks and benefits when deciding on the methods?
• If applicable, what are the benefits and challenges of the methods you have tried? Was
it easy to handle? Are there any side effects or risks? (Do you know the type of device
you are using?)
• Did these methods meet your or your family’s needs? Why or why not?
• Have you used remote cardiac monitoring?
• If yes, what are the benefits and challenges of remote monitoring? Was it easy to
handle? Did they meet you or your family’s needs? How so? (Did you miss the
interactions with your doctor? Were you concerned about your privacy or confidentiality?
Did you have any concerns about the technology?)
• How does remote cardiac monitoring compare with clinic visits? What are the pros and
cons from your perspective?
October 2018
Ontario Health Technology Assessment Series; Vol. 18: No. 7, pp. 1–199, October 2018 187
REFERENCES
(1) Vinck I, Stroobandt S, Gerkens S, De Laet C. Remote monitoring for patients with implanted defibrillator: technology evaluation and broader regulatory framework. [Internet]. Brussels (Belgium): Belgian Health Care Knowledge Centre; 2010 [cited 2018 Jan]. Available from: https://kce.fgov.be/sites/default/files/page_documents/kce_136c_remote_monitoring.pdf
(2) Adabag AS, Luepker RV, Roger VL, Gersh BJ. Sudden cardiac death: epidemiology and risk factors. Nat Rev Cardiol. 2010;7(4):216-25.
(3) Borne RT, Katz D, Betz J, Peterson PN, Masoudi FA. Implantable cardioverter-defibrillators for secondary prevention of sudden cardiac death: a review. J Am Heart Assoc. 2017;6(3).
(4) Bennett M, Parkash R, Nery P, Senechal M, Mondesert B, Birnie D, et al. Canadian Cardiovascular Society/Canadian Heart Rhythm Society 2016 implantable cardioverter-defibrillator guidelines. Can J Cardiol. 2017;33(2):174-88.
(5) Zabel M, Vollmann D, Luthje L, Seegers J, Sohns C, Zenker D, et al. Randomized clinical evaluation of wireless fluid monitoring and remote icd management using OptiVol alert-based predefined management to reduce cardiac decompensation and health care utilization: the CONNECT-OptiVol study. Contemp Clin Trials. 2013;34(1):109-16.
(6) Exner DV, Birnie DH, Moe G, Thibault B, Philippon F, Healey JS, et al. Canadian Cardiovascular Society guidelines on the use of cardiac resynchronization therapy: evidence and patient selection. Can J Cardiol. 2013;29(2):182-95.
(7) Linde C, Braunschweig F. Cardiac resynchronization therapy follow-up: role of remote monitoring. Heart Fail Clin. 2017;13(1):241-51.
(8) Castelnuovo E, Stein K, Pitt M, Garside R, Payne E. The effectiveness and cost-effectiveness of dual-chamber pacemakers compared with single-chamber pacemakers for bradycardia due to atrioventricular block or sick sinus syndrome: systematic review and economic evaluation. Health Technol Assess. 2005;9(43):1-246.
(9) Cardiac Care Network. Recommendations for permanent pacemaker services in Ontario [Internet]. Toronto (ON): The Network; 2011 [cited 2017 Jan 19]. Available from: http://www.ccn.on.ca/ccn_public/uploadfiles/files/CCN_11004_PPM_FNL_Aug29_final_version.pdf
(10) Canadian Institute for Health Information. Cardiac rate book, 2016: Cardiac implants—provincial data [Internet]. London (ON): The Institute; 2016 [cited 2017 Nov 30]. Available from: https://www.cihi.ca/en/cardiac-rate-book-2016-cardiac-implants-provincial-data
(11) Yee R, Verma A, Beardsall M, Fraser J, Philippon F, Exner DV. Canadian Cardiovascular Society/Canadian Heart Rhythm Society joint position statement on the use of remote monitoring for cardiovascular implantable electronic device follow-up. Can J Cardiol. 2013;29(6):644-51.
(12) Slotwiner D, Varma N, Akar JG, Annas G, Beardsall M, Fogel RI, et al. HRS expert consensus statement on remote interrogation and monitoring for cardiovascular implantable electronic devices. Heart Rhythm. 2015;12(7):e69-e100.
(13) Versteeg H, Pedersen SS, Mastenbroek MH, Redekop WK, Schwab JO, Mabo P, et al. Patient perspective on remote monitoring of cardiovascular implantable electronic devices: rationale and design of the REMOTE-CIED study. Neth Heart J. 2014;22(10):423-8.
(14) Spencker S, Coban N, Koch L, Schirdewan A, Muller D. Potential role of home monitoring to reduce inappropriate shocks in implantable cardioverter-defibrillator patients due to lead failure. Europace. 2009;11(4):483-8.

References October 2018
Ontario Health Technology Assessment Series; Vol. 18: No. 7, pp. 1–199, October 2018 188
(15) Guedon-Moreau L, Kouakam C, Klug D, Marquie C, Brigadeau F, Boule S, et al. Decreased delivery of inappropriate shocks achieved by remote monitoring of ICD: a substudy of the ECOST trial. J Cardiovasc Electrophysiol. 2014;25(7):763-70.
(16) Burri H, Senouf D. Remote monitoring and follow-up of pacemakers and implantable cardioverter defibrillators. Europace. 2009;11(6):701-9.
(17) Roka A, Schoenfeld MH. Remote monitoring of cardiac implantable electronic devices. Journal of Innovations in Cardiac Rhythm Management. 2011;2:381-93.
(18) de Cock CC, Elders J, van Hemel NM, van den Broek K, van Erven L, de Mol B, et al. Remote monitoring and follow-up of cardiovascular implantable electronic devices in the Netherlands: an expert consensus report of the Netherlands Society of Cardiology. Neth Heart J. 2012;20(2):53-65.
(19) Pron G, Ieraci L, Kaulback K, Medical Advisory Secretariat, Health Quality Ontario. Internet-based device-assisted remote monitoring of cardiovascular implantable electronic devices: an evidence-based analysis. Ontario Health Technol Assess Ser. 2012;12(1):1-86.
(20) Parthiban N, Esterman A, Mahajan R, Twomey DJ, Pathak RK, Lau DH, et al. Remote monitoring of implantable cardioverter-defibrillators: a systematic review and meta-analysis of clinical outcomes. J Am Coll Cardiol. 2015;65(24):2591-600.
(21) Klersy C, Boriani G, De Silvestri A, Mairesse GH, Braunschweig F, Scotti V, et al. Effect of telemonitoring of cardiac implantable electronic devices on healthcare utilization: a meta-analysis of randomized controlled trials in patients with heart failure. Eur J Heart Fail. 2016;18(2):195-204.
(22) Hindricks G, Varma N, Kacet S, Lewalter T, Sogaard P, Guedon-Moreau L, et al. Daily remote monitoring of implantable cardioverter-defibrillators: insights from the pooled patient-level data from three randomized controlled trials (IN-TIME, ECOST, TRUST). Eur Heart J. 2017;38:1749-55.
(23) McGowan J, Sampson M, Salzwedel DM, Cogo E, Foerster V, Lefebvre C. PRESS peer review of electronic search strategies: 2015 guideline statement. J Clin Epidemiol. 2016;75:40-6.
(24) O'Neill J, Tabish H, Welch V, Petticrew M, Pottie K, Clarke M, et al. Applying an equity lens to interventions: using PROGRESS ensures consideration of socially stratifying factors to illuminate inequities in health. J Clin Epidemiol. 2014;67(1):56-64.
(25) Higgins JP, Altman DG, Sterne JA. Assessing risk of bias in included studies. In: Higgins JPT, Green S, editors. Cochrane handbook for systematic reviews of interventions, version 5.1.0 [Internet]. London: Cochrane Collaboration; 2011 [updated 2011 Mar; cited 2017 Jan 19]. Available from: www.handbook.cochrane.org.
(26) Guyatt GH, Oxman AD, Schunemann HJ, Tugwell P, Knottnerus A. GRADE guidelines: a new series of articles in the Journal of Clinical Epidemiology. J Clin Epidemiol. 2011;64(4):380-2.
(27) Moher D, Liberati A, Tetzlaff J, Altman DG. Preferred reporting items for systematic reviews and meta-analyses: the PRISMA statement. PLoS Med. 2009;6(7):e1000097.
(28) Morgan JM, Kitt S, Gill J, McComb JM, Ng GA, Raftery J, et al. Remote management of heart failure using implantable electronic devices. Eur Heart J. 2017.
(29) Boriani G, Da Costa A, Quesada A, Ricci RP, Favale S, Boscolo G, et al. Effects of remote monitoring on clinical outcomes and use of healthcare resources in heart failure patients with biventricular defibrillators: results of the MORE-CARE multicentre randomized controlled trial. Eur J Heart Fail. 2017;19(3):416-25.
(30) Boriani G, Da Costa A, Ricci RP, Quesada A, Favale S, Iacopino S, et al. The monitoring resynchronization devices and cardiac patients (MORE-CARE) randomized controlled trial: phase 1 results on dynamics of early intervention with remote monitoring. J Med Internet Res. 2013;15(8):e167.

References October 2018
Ontario Health Technology Assessment Series; Vol. 18: No. 7, pp. 1–199, October 2018 189
(31) Bohm M, Drexler H, Oswald H, Rybak K, Bosch R, Butter C, et al. Fluid status telemedicine alerts for heart failure: a randomized controlled trial. Eur Heart J. 2016;37(41):3154-63.
(32) Sardu C, Santamaria M, Rizzo MR, Barbieri M, di Marino M, Paolisso G, et al. Telemonitoring in heart failure patients treated by cardiac resynchronisation therapy with defibrillator (CRT-D): the TELECART Study. Int J Clin Pract. 2016;70(7):569-76.
(33) Heidbuchel H, Hindricks G, Broadhurst P, Van Erven L, Fernandez-Lozano I, Rivero-Ayerza M, et al. EuroEco (European Health Economic Trial on Home Monitoring in ICD Patients): a provider perspective in five European countries on costs and net financial impact of follow-up with or without remote monitoring. Eur Heart J. 2015;36(3):158-69.
(34) Luthje L, Vollmann D, Seegers J, Sohns C, Hasenfus G, Zabel M. A randomized study of remote monitoring and fluid monitoring for the management of patients with implanted cardiac arrhythmia devices. Europace. 2015;17(8):1276-81.
(35) Hindricks G, Taborsky M, Glikson M, Heinrich U, Schumacher B, Katz A, et al. Implant-based multiparameter telemonitoring of patients with heart failure (IN-TIME): a randomised controlled trial. Lancet. 2014;384(9943):583-90.
(36) Osmera O, Bulava A. The benefits of remote monitoring in long-term care for patients with implantable cardioverter-defibrillators. Neuro Endocrinol Lett. 2014;35 Suppl 1:40-8.
(37) Guedon-Moreau L, Lacroix D, Sadoul N, Clementy J, Kouakam C, Hermida JS, et al. A randomized study of remote follow-up of implantable cardioverter defibrillators: safety and efficacy report of the ECOST trial. Eur Heart J. 2013;34(8):605-14.
(38) Perl S, Stiegler P, Rotman B, Prenner G, Lercher P, Anelli-Monti M, et al. Socio-economic effects and cost saving potential of remote patient monitoring (SAVE-HM trial). Int J Cardiol. 2013;169(6):402-7.
(39) Calo L, Gargaro A, De Ruvo E, Palozzi G, Sciarra L, Guarracini F, et al. Economic impact of remote monitoring on ordinary follow-up of implantable cardioverter defibrillators as compared with conventional in-hospital visits. A single-center prospective and randomized study. J Interv Card Electrophysiol. 2013;37(1):69-78.
(40) Landolina M, Perego GB, Lunati M, Curnis A, Guenzati G, Rordorf R, et al. Remote monitoring reduces healthcare use and improves quality of care in heart failure patients with implantable defibrillators: the evolution of management strategies of heart failure patients with implantable defibrillators (EVOLVO) study. Circ J. 2012;125(24):2985-92.
(41) Crossley GH, Boyle A, Vitense H, Chang Y, Mead RH, Investigators C. The CONNECT (Clinical Evaluation of Remote Notification to Reduce Time to Clinical Decision) trial: the value of wireless remote monitoring with automatic clinician alerts. J Am Coll Cardiol. 2011;57(10):1181-9.
(42) Varma N, Epstein AE, Irimpen A, Schweikert R, Love C, Trust Investigators. Efficacy and safety of automatic remote monitoring for implantable cardioverter-defibrillator follow-up: the Lumos-T safely reduces routine office device follow-up (TRUST) trial. Circulation. 2010;122(4):325-32.
(43) Varma N, Michalski J, Epstein AE, Schweikert R. Automatic remote monitoring of implantable cardioverter-defibrillator lead and generator performance: the Lumos-T Safely RedUceS RouTine Office Device Follow-Up (TRUST) trial. Circ Arrhythm Electrophysiol. 2010;3(5):428-36.
(44) Varma N, Epstein AE, Schweikert R, Michalski J, Love CJ, Trust Investigators. Role of automatic wireless remote monitoring immediately following ICD implant: the Lumos-T reduces routine office device follow-up study (TRUST) Trial. J Cardiovasc Electrophysiol. 2016;27(3):321-6.
(45) Varma N, Michalski J, Stambler B, Pavri BB, Trust Investigators. Superiority of automatic remote monitoring compared with in-person evaluation for scheduled ICD follow-up in

References October 2018
Ontario Health Technology Assessment Series; Vol. 18: No. 7, pp. 1–199, October 2018 190
the TRUST trial - testing execution of the recommendations. Eur Heart J. 2014;35(20):1345-52.
(46) Al-Khatib SM, Piccini JP, Knight D, Stewart M, Clapp-Channing N, Sanders GD. Remote monitoring of implantable cardioverter defibrillators versus quarterly device interrogations in clinic: results from a randomized pilot clinical trial. J Cardiovasc Electrophysiol. 2010;21(5):545-50.
(47) Burri H, Quesada A, Ricci RP, Boriani G, Davinelli M, Favale S, et al. The monitoring resynchronization devices and cardiac patients (MORE-CARE) study: rationale and design. Am Heart J. 2010;160(1):42-8.
(48) Arya A, Block M, Kautzner J, Lewalter T, Mortel H, Sack S, et al. Influence of home monitoring on the clinical status of heart failure patients: design and rationale of the IN-TIME study. Eur J Heart Fail. 2008;10(11):1143-8.
(49) D'Ascia SL, D'Ascia C, Marino V, Lombardi A, Santulli R, Chiariello M, et al. Cardiac resynchronisation therapy response predicts occurrence of atrial fibrillation in non-ischaemic dilated cardiomyopathy. Int J Clin Pract. 2011;65(11):1149-55.
(50) Boriani G, Da Costa A, Quesada A, Ricci RP, Favale S, Boscolo G, et al. Effects of remote monitoring on clinical outcomes and use of healthcare resources in heart failure patients with biventricular defibrillators: results of the MORE-CARE multicentre randomized controlled trial. Eur J Heart Fail. 2017;19(3):416-25.
(51) Amara W, Montagnier C, Cheggour S, Boursier M, Gully C, Barnay C, et al. Early detection and treatment of atrial arrhythmias alleviates the arrhythmic burden in paced patients: the SETAM study. Pacing Clin Electrophysiol. 2017;40(5):527-36.
(52) Lima C, Martinelli M, Peixoto GL, Siqueira SF, Wajngarten M, Silva RT, et al. Silent atrial fibrillation in elderly pacemaker users: a randomized trial using home monitoring. Ann Noninvasive Electrocardiol. 2016;21(3):246-55.
(53) Mabo P, Victor F, Bazin P, Ahres S, Babuty D, Da Costa A, et al. A randomized trial of long-term remote monitoring of pacemaker recipients (the COMPAS trial). Eur Heart J. 2012;33(9):1105-11.
(54) Crossley GH, Chen J, Choucair W, Cohen TJ, Gohn DC, Johnson WB, et al. Clinical benefits of remote versus transtelephonic monitoring of implanted pacemakers. J Am Coll Cardiol. 2009;54(22):2012-9.
(55) Halimi F, Clementy J, Attuel P, Dessenne X, Amara W. Optimized post-operative surveillance of permanent pacemakers by home monitoring: the OEDIPE trial. Europace. 2008;10(12):1392-9.
(56) Oliveira M, Fernandes M, Primo J, Reis H, Nicola P. Remote versus face-to-face monitoring for implantable cardiac devices: rationale and design of the PORTLink (PORTuguese research on telemonitoring with CareLink). [Portuguese, English]. Rev Port Cardiol. 2013;32(12):957-64.
(57) Remote follow-up of patients implanted with an ICD: the prospective randomized EVATEL study (Identifier NCT00598026) [Internet]. Bethesda (MD): ClinicalTrials.gov; c2017 [updated 2012 Feb 24; cited 2017 Nov 28]. Available from: https://www.clinicaltrials.gov/ct2/show/NCT00598026?term=evatel&rank=1
(58) Zabel M, Muller-Riemenschneider F, Geller JC, Brachmann J, Kuhlkamp V, Dissmann R, et al. Rationale and design of the MONITOR-ICD study: a randomized comparison of economic and clinical effects of automatic remote MONITORing versus control in patients with implantable cardioverter defibrillators. Am Heart J. 2014;168(4):430-7.
(59) Clinical evaluation of remote monitoring with direct alerts to reduce time from event to clinical decision (REACT) (Identifier NCT01090349) [Internet]. Bethesda (MD): ClinicalTrials.gov; c2017 [updated 2015 Oct 21; cited 2017 Apr 6]. Available from: https://www.clinicaltrials.gov/ct2/show/NCT01090349?term=01090349&rank=1

References October 2018
Ontario Health Technology Assessment Series; Vol. 18: No. 7, pp. 1–199, October 2018 191
(60) Follow-up of patients with implantable cardioverter defibrillators by home monitoring (ANVITE) (Identifier NCT00858559) [Internet]. Bethesda (MD): ClinicalTrials.gov; c2017 [updated 2011 May 19; cited 2017 Apr 6]. Available from: https://www.clinicaltrials.gov/ct2/show/NCT00858559?term=anvite&rank=1
(61) Psychosomatic effects of implantable cardioverter defibrillator with home monitoring function (QUANTUM) (Identifier NCT00325221) [Internet]. Bethesda (MD): ClinicalTrials.gov; c2017 [updated 2013 Jan 31; cited 2017 Apr 7]. Available from: https://www.clinicaltrials.gov/ct2/show/NCT00325221?term=00325221&rank=1
(62) European health economic trial on home monitoring in ICD and CRT-D patients (EuroEco) (Identifier NCT00776087) [Internet]. Bethesda (MD): ClinicalTrials.gov; c2017 [updated 2017 Jun 29; cited 2017 Sep 11]. Available from: https://www.clinicaltrials.gov/ct2/show/NCT00776087?term=00776087&rank=1
(63) Virtual clinic pacemaker follow-up (VIRTUE) (Identifier NCT00475124) [Internet]. Bethesda (MD): ClinicalTrials.gov; c2017 [updated 2014 Oct 31; cited 2017 Dec 4]. Available from: https://www.clinicaltrials.gov/ct2/show/NCT00475124?term=virtual+clinic+pacemaker&rank=1
(64) Patient perspectives on remote monitoring of cardiovascular implantable electronic devices (REMOTE-CIED) (Identifier NCT01691586) [Internet]. Bethesda (MD): ClinicalTrials.gov; c2017 [updated 2016 May 19; cited 2017 Aug 11]. Available from: https://www.clinicaltrials.gov/ct2/show/NCT01691586?term=remote+cied&rank=2
(65) PORTuguese research on telemonitoring with careLink (PORTLink) (Identified NCT03125382) [Internet]. Bethesda (MD): ClinicalTrials.gov; c2017 [updated 2017 Apr 24; cited 2017 Sep 19]. Available from: https://www.clinicaltrials.gov/ct2/show/NCT03125382?term=PortLink&rank=1
(66) Home-monitoring in implantable cardioverter defibrillator (ICD) patients (Monitor-ICD) (Identifier NCT 00787683) [Internet]. Bethesda (MD): ClinicalTrials.gov; c2017 [updated 2012 Jun 26; cited 2017 Sep 19]. Available from: https://www.clinicaltrials.gov/ct2/show/NCT00787683?term=monitor-icd&rank=1
(67) Glanville J, Arber M, Veale T, Garcia S. Sensitivity of a search filter designed to identify studies reporting health state utility values. Paper presented at: Mosaic, 116th Annual Meeting, Medical Library Association; 2016 May 15-20; Toronto, ON.
(68) National Institute for Health and Care Excellence. Process and methods guides. Appendix I quality appraisal checklist–economic evaluations [Internet]. London: The Institute; 2012 [cited 2017 Jun 20]. Available from: https://www.nice.org.uk/process/pmg4/chapter/appendix-i-quality-appraisal-checklist-economic-evaluations
(69) Ricci RP, Vicentini A, D'Onofrio A, Sagone A, Rovaris G, Padeletti L, et al. Economic analysis of remote monitoring of cardiac implantable electronic devices: results of the health economics evaluation registry for remote follow-up (TARIFF) study. Heart Rhythm. 2017;14(1):50-7.
(70) Zanaboni P, Landolina M, Marzegalli M, Lunati M, Perego GB, Guenzati G, et al. Cost-utility analysis of the EVOLVO study on remote monitoring for heart failure patients with implantable defibrillators: randomized controlled trial. J Med Internet Res. 2013;15(5):e106.
(71) Remote monitoring of patients with implanted cardiac devices (application no. 1197) [Internet]. Canberra (Australia): Medical Services Advisory Committee; c2018 [updated 2016 Oct 11; cited 2018 Jan]. Available from: http://www.msac.gov.au/internet/msac/publishing.nsf/Content/1197-public
(72) Remote monitoring of patients with implanted cardiac devices (application no. 1197.1) [Internet]. Canberra (Australia): Medical Services Advisory Committee; c2018 [updated

References October 2018
Ontario Health Technology Assessment Series; Vol. 18: No. 7, pp. 1–199, October 2018 192
2016 Jul 11; cited 2018 Jan]. Available from: http://www.msac.gov.au/internet/msac/publishing.nsf/Content/1197.1-public
(73) Klersy C, De Silvestri A, Gabutti G, Raisaro A, Curti M, Regoli F, et al. Economic impact of remote patient monitoring: an integrated economic model derived from a meta-analysis of randomized controlled trials in heart failure. Eur J Heart Fail. 2011;13(4):450-9.
(74) Wilkoff BL, Auricchio A, Brugada J, Cowie M, Ellenbogen KA, Gillis AM, et al. HRS/EHRA expert consensus on the monitoring of cardiovascular implantable electronic devices (CIEDs): description of techniques, indications, personnel, frequency and ethical considerations. Heart Rhythm. 2008;5(6):907-25.
(75) Husereau D, Drummond M, Petrou S, Carswell C, Moher D, Greenberg D, et al. Consolidated health economic evaluation reporting standards (CHEERS) statement. Int J Technol Assess Health Care. 2013;29(2):117-22.
(76) Lee DS, Birnie D, Cameron D, Crystal E, Dorian P, Gula LJ, et al. Design and implementation of a population-based registry of implantable cardioverter defibrillators (ICDs) in Ontario. Heart Rhythm. 2008;5(9):1250-6.
(77) Lee DS, Krahn AD, Healey JS, Birnie D, Crystal E, Dorian P, et al. Evaluation of early complications related to De Novo cardioverter defibrillator implantation insights from the Ontario ICD database. J Am Coll Cardiol. 2010;55(8):774-82.
(78) Yung D, Birnie D, Dorian P, Healey JS, Simpson CS, Crystal E, et al. Survival after implantable cardioverter-defibrillator implantation in the elderly. Circulation. 2013;127(24):2383-92.
(79) Canadian Agency for Drugs and Technologies in Health. Guidelines for the economic evaluation of health technologies: Canada [Internet]. 4th ed. Ottawa (ON): The Agency; 2017 [cited 2018 Jan]. Available from: https://www.cadth.ca/guidelines-economic-evaluation-health-technologies-canada-4th-edition.
(80) Hauser RG. The growing mismatch between patient longevity and the service life of implantable cardioverter-defibrillators. J Am Coll Cardiol. 2005;45(12):2022-5.
(81) Manolis AS, Maounis T, Koulouris S, Vassilikos V. "Real life" longevity of implantable cardioverter-defibrillator devices. Clin Cardiol. 2017;40(9):759-64.
(82) Ricci RP, Morichelli L, Quarta L, Porfili A, Magris B, Giovene L, et al. Effect of daily remote monitoring on pacemaker longevity: a retrospective analysis. Heart Rhythm. 2015;12(2):330-7.
(83) Hindricks G, Elsner C, Piorkowski C, Taborsky M, Geller JC, Schumacher B, et al. Quarterly vs. yearly clinical follow-up of remotely monitored recipients of prophylactic implantable cardioverter-defibrillators: results of the REFORM trial. Eur Heart J. 2014;35(2):98-105.
(84) Peterson PN, Varosy PD, Heidenreich PA, Wang Y, Dewland TA, Curtis JP, et al. Association of single- vs dual-chamber ICDs with mortality, readmissions, and complications among patients receiving an ICD for primary prevention. J Am Med Assoc. 2013;309(19):2025-34.
(85) Toff WD, Camm AJ, Skehan JD. Single-chamber versus dual-chamber pacing for high-grade atrioventricular block. N Engl J Med. 2005;353(2):145-55.
(86) Ford E, Adams J, Graves N. Development of an economic model to assess the cost-effectiveness of hawthorn extract as an adjunct treatment for heart failure in Australia. BMJ Open. 2012;2(5):e001094.
(87) Verhoef TI, Morris S, Mathur A, Singer M. Potential economic consequences of a cardioprotective agent for patients with myocardial infarction: modelling study. BMJ Open. 2015;5(11):e008164.

References October 2018
Ontario Health Technology Assessment Series; Vol. 18: No. 7, pp. 1–199, October 2018 193
(88) Liu SX, Xiang R, Lagor C, Liu N, Sullivan K. Economic modeling of heart failure telehealth programs: when do they become cost saving? Int J Telemed Appl. 2016;2016:3289628.
(89) Eichhorn EJ, Domanski MJ, Krause-Steinrauf H, Bristow MR, Lavori PW. A trial of the beta-blocker bucindolol in patients with advanced chronic heart failure. N Engl J Med. 2001;344(22):1659-67.
(90) Hess PL, Mi X, Curtis LH, Wilkoff BL, Hegland DD, Al-Khatib SM. Follow-up of patients with new cardiovascular implantable electronic devices: is adherence to the experts' recommendations associated with improved outcomes? Heart Rhythm. 2013;10(8):1127-33.
(91) Landolina M, Perego GB, Lunati M, Curnis A, Guenzati G, Vicentini A, et al. Remote monitoring reduces healthcare use and improves quality of care in heart failure patients with implantable defibrillators: the evolution of management strategies of heart failure patients with implantable defibrillators (EVOLVO) study. Circulation. 2012;125(24):2985-92.
(92) Hozo SP, Djulbegovic B, Hozo I. Estimating the mean and variance from the median, range, and the size of a sample. BMC Med Res Methodol. 2005;5:13.
(93) Solomon SD, Dobson J, Pocock S, Skali H, McMurray JJ, Granger CB, et al. Influence of nonfatal hospitalization for heart failure on subsequent mortality in patients with chronic heart failure. Circulation. 2007;116(13):1482-7.
(94) Zanon F, Martignani C, Ammendola E, Menardi E, Narducci ML, De Filippo P, et al. Device longevity in a contemporary cohort of ICD/CRT-D patients undergoing device replacement. J Cardiovasc Electrophysiol. 2016;27(7):840-5.
(95) Kim MH, Lin J, Hussein M, Battleman D. Incidence and temporal pattern of hospital readmissions for patients with atrial fibrillation. Curr Med Res Opin. 2009;25(5):1215-20.
(96) Munir MB, Sharbaugh MS, Ahmad S, Patil S, Mehta K, Althouse AD, et al. Causes and predictors of 30-day readmissions in atrial fibrillation (from the Nationwide Readmissions Database). Am J Cardiol. 2017;120(3):399-403.
(97) Caro JJ, Migliaccio-Walle K, Ishak KJ, Proskorovsky I, O'Brien JA. The time course of subsequent hospitalizations and associated costs in survivors of an ischemic stroke in Canada. BMC Health Serv Res. 2006;6:99.
(98) Ren X, Apostolakos C, Vo TH, Shaw RE, Shields K, Banki NM, et al. Remote monitoring of implantable pacemakers: in-office setup significantly improves successful data transmission. Clin Cardiol. 2013;36(10):634-7.
(99) Winkler C, Funk M, Schindler DM, Hemsey JZ, Lampert R, Drew BJ. Arrhythmias in patients with acute coronary syndrome in the first 24 hours of hospitalization. Heart Lung. 2013;42(6):422-7.
(100) Edwards JD, Kapral MK, Fang J, Swartz RH. Long-term morbidity and mortality in patients without early complications after stroke or transient ischemic attack. Can Med Assoc J. 2017;189(29):E954-61.
(101) de Vries LM, Leening MJG, Dijk WA, Hooijschuur CAM, Stricker BHC, van Hemel NM. Trends in service time of pacemakers in the Netherlands: a long-term nationwide follow-up study. Neth Heart J. 2017.
(102) Hauser RG, Hayes DL, Kallinen LM, Cannom DS, Epstein AE, Almquist AK, et al. Clinical experience with pacemaker pulse generators and transvenous leads: an 8-year prospective multicenter study. Heart Rhythm. 2007;4(2):154-60.
(103) Capucci A, De Simone A, Luzi M, Calvi V, Stabile G, D'Onofrio A, et al. Economic impact of remote monitoring after implantable defibrillators implantation in heart failure patients: an analysis from the EFFECT study. Europace. 2017;12:12.
(104) Boriani G, Da Costa A, Quesada A, Ricci RP, Favale S, Boscolo G, et al. Effects of remote monitoring on clinical outcomes and use of healthcare resources in heart failure

References October 2018
Ontario Health Technology Assessment Series; Vol. 18: No. 7, pp. 1–199, October 2018 194
patients with biventricular defibrillators: results of the MORE-CARE multicentre randomized controlled trial. Eur J Heart Fail. 2017;19(3):416-25.
(105) Lopez-Villegas A, Catalan-Matamoros D, Robles-Musso E, Peiro S. Effectiveness of pacemaker tele-monitoring on quality of life, functional capacity, event detection and workload: The PONIENTE trial. Geriatr Gerontol Int. 2016;16(11):1188-95.
(106) Joseph GK, Wilkoff BL, Dresing T, Burkhardt J, Khaykin Y. Remote interrogation and monitoring of implantable cardioverter defibrillators. J Interv Card Electrophysiol. 2004;11(2):161-6.
(107) Comoretto RI, Facchin D, Ghidina M, Proclemer A, Gregori D. Remote control improves quality of life in elderly pacemaker patients versus standard ambulatory-based follow-up. J Eval Clin Pract. 2017;23(4):681-9.
(108) Yao G, Freemantle N, Calvert MJ, Bryan S, Daubert JC, Cleland JG. The long-term cost-effectiveness of cardiac resynchronization therapy with or without an implantable cardioverter-defibrillator. Eur Heart J. 2007;28(1):42-51.
(109) Caro J, Ward A, Moller J. Modelling the health benefits and economic implications of implanting dual-chamber vs. single-chamber ventricular pacemakers in the UK. Europace. 2006;8(6):449-55.
(110) Post PN, Stiggelbout AM, Wakker PP. The utility of health states after stroke: a systematic review of the literature. Stroke. 2001;32(6):1425-9.
(111) Griffiths A, Paracha N, Davies A, Branscombe N, Cowie MR, Sculpher M. The cost effectiveness of ivabradine in the treatment of chronic heart failure from the U.K. National Health Service perspective. Heart. 2014;100(13):1031-6.
(112) Reynolds MR, Morais E, Zimetbaum P. Impact of hospitalization on health-related quality of life in atrial fibrillation patients in Canada and the United States: results from an observational registry. Am Heart J. 2010;160(4):752-8.
(113) Berg J, Lindgren P, Mejhert M, Edner M, Dahlstrom U, Kahan T. Determinants of utility based on the EuroQol five-dimensional questionnaire in patients with chronic heart failure and their change over time: results from the Swedish Heart Failure Registry. Value Health. 2015;18(4):439-48.
(114) Ontario Nurses' Association. Highlights of the collective agreement changes as a result of the Albertyn Award and items in agreement between ONA and participating hospitals. Term: April 1, 2016, to March 31, 2018 [Internet]. Toronto (ON): The Association; 2016 [cited 2018 Jan]. Available from: https://www.ona.org/wp-content/uploads/ona_2016hospitalawardhighlights_20160912.pdf?x72008
(115) Statistics Canada. Consumer price index, health and personal care, by province (Canada) [Internet]. Ottawa (ON): Statistics Canada; 2016 [cited 2017 Jul 20]. Available from: http://www5.statcan.gc.ca/cansim/a47
(116) Goeree R, Blackhouse G, Petrovic R, Salama S. Cost of stroke in Canada: a 1-year prospective study. J Med Econ. 2005;8(1-4):147-67.
(117) Elsner C, Sommer P, Piorkowski C, Taborsky M, Neuser H, Bytesnik J, et al. A prospective multicenter comparison trial of home monitoring against regular follow-up in MADIT II patients: additional visits and cost impact. Comput Cardiol. 2006;33:241-4.
(118) Burri H, Heidbuchel H, Jung W, Brugada P. Remote monitoring: a cost or an investment? Europace. 2011;13 Suppl 2:ii44-8.
(119) Krahn AD, Lee DS, Birnie D, Healey JS, Crystal E, Dorian P, et al. Predictors of short-term complications after implantable cardioverter-defibrillator replacement: results from the Ontario ICD Database. Circ Arrhythm Electrophysiol. 2011;4(2):136-42.
(120) Akar JG, Bao H, Jones P, Wang Y, Chaudhry SI, Varosy P, et al. Use of remote monitoring of newly implanted cardioverter-defibrillators: insights from the patient related determinants of ICD remote monitoring (PREDICT RM) study. Circulation. 2013;128(22):2372-83.

References October 2018
Ontario Health Technology Assessment Series; Vol. 18: No. 7, pp. 1–199, October 2018 195
(121) Mairesse GH, Braunschweig F, Klersy K, Cowie MR, Leyva F. Implementation and reimbursement of remote monitoring for cardiac implantable electronic devices in Europe: a survey from the health economics committee of the European Heart Rhythm Association. Europace. 2015;17(5):814-8.
(122) Barham L. Public and patient involvement at the UK National Institute for Health and Clinical Excellence. Patient. 2011;4(1):1-10.
(123) Messina J, Grainger DL. A pilot study to identify areas for further improvements in patient and public involvement in health technology assessments for medicines. Patient. 2012;5(3):199-211.
(124) OHTAC Public Engagement Subcommittee. Public engagement for health technology assessment at Health Quality Ontario—final report from the Ontario Health Technology Advisory Committee Public Engagement Subcommittee [Internet]. Toronto (ON): Queen's Printer for Ontario; 2015 [cited 2016 Jan]. Available from: http://www.hqontario.ca/Portals/0/documents/evidence/special-reports/report-subcommittee-20150407-en.pdf
(125) Tjornhoj-Thomsen T, Hansen HP. Knowledge in health technology assessment: who, what, how? Int J Technol Assess Health Care. 2011;27(4):324-9.
(126) Rowe G, Frewer LJ. A typology of public engagement mechanisms. Sci Technol Hum Val. 2005;30(2):251-90.
(127) Brundisini F, Giacomini M, DeJean D, Vanstone M, Winsor S, Smith A. Chronic disease patients' experiences with accessing health care in rural and remote areas: a systematic review and qualitative meta-synthesis. Ont Health Technol Assess Ser. 2013;13(15):1-33.
(128) Kvale S. Interviews: an introduction to qualitative research interviewing. Thousand Oaks (CA): Sage Publications; 1996.
(129) Health Technology Assessment International Interest Group on Patient and Citizen Involvement in HTA. Introduction to health technology assessment [Internet]. Edmonton (AB): Health Technology Assessment International; 2015 [cited 2016 Jan]. Available from: http://www.htai.org/fileadmin/HTAi_Files/ISG/PatientInvolvement/v2_files/Resource/PCISG-Resource-Intro_to_HTA__KFacey__Jun13.pdf
(130) Strauss AL, Corbin JM. Grounded theory research: procedures, canons, and evaluative criteria. Qual Sociol. 1990;13(1):3-21.
(131) Strauss AL, Corbin JM. Grounded theory methodology: an overview. In: Denzin NK, Lincoln YS, editors. Handbook of qualitative research. Thousand Oaks (CA): Sage Publications; 1994. p. 273-85.
(132) Classes of heart failure [Internet]. Dallas: American Heart Association; c2018 [updated 2017 May 31; cited 2017 Nov 30]. Available from: http://www.heart.org/HEARTORG/Conditions/HeartFailure/AboutHeartFailure/Classes-of-Heart-Failure_UCM_306328_Article.jsp#.WiAvz0qnGUk
(133) Morgan JM, Dimitrov BD, Gill J, Kitt S, Ng GA, McComb JM, et al. Rationale and study design of the REM-HF study: remote management of heart failure using implanted devices and formalized follow-up procedures. Eur J Heart Fail. 2014;16(9):1039-45.
(134) Brachmann J, Bohm M, Rybak K, Klein G, Butter C, Klemm H, et al. Fluid status monitoring with a wireless network to reduce cardiovascular-related hospitalizations and mortality in heart failure: rationale and design of the OptiLink HF Study (optimization of heart failure management using OptiVol fluid status monitoring and CareLink). Eur J Heart Fail. 2011;13(7):796-804.
(135) Calo L, Gargaro A, De Ruvo E, Palozzi G, Sciarra L, Rebecchi M, et al. Economic impact of remote monitoring on ordinary follow-up of implantable cardioverter

References October 2018
Ontario Health Technology Assessment Series; Vol. 18: No. 7, pp. 1–199, October 2018 196
defibrillators as compared with conventional in-hospital visits. A single-center prospective and randomized study. J Interv Card Electrophysiol. 2013;37(1):69-78.
(136) Crossley G, Boyle A, Vitense H, Sherfesee L, Mead RH. Trial design of the clinical evaluation of remote notification to reduce time to clinical decision: the clinical evaluation of remote notification to reduce time to clinical decision (CONNECT) study. Am Heart J. 2008;156(5):840-6.
(137) Ricci RP, Morichelli L, D'Onofrio A, Calo L, Vaccari D, Zanotto G, et al. Manpower and outpatient clinic workload for remote monitoring of patients with cardiac implantable electronic devices: data from the HomeGuide Registry. J Cardiovasc Electrophysiol. 2014;25(11):1216-23.

October 2018
Ontario Health Technology Assessment Series; Vol. 18: No. 7, pp. 1–199, October 2018 197
About Health Quality Ontario
Health Quality Ontario is the provincial lead on the quality of health care. We help nurses, doctors and others working hard on the frontlines be more effective in what they do – by providing objective advice and by supporting them and government in improving health care for the people of Ontario. Our focus is making health care more effective, efficient and affordable which we do through a legislative mandate of:
• Reporting to the public, organizations and health care providers on how the health system is performing,
• Finding the best evidence of what works, and
• Translating this evidence into concrete standards, recommendations and tools that health care providers can easily put into practice to make improvements.
Health Quality Ontario is governed by a 12-member Board of Directors appointed by the Minister of Health and Long-Term Care and with representation from the medical and nursing professions, patients and other segments of health care. In everything it does, Health Quality Ontario brings together those with first-hand experience – doctors, nurses, other health care providers, patients and families – to hear their experiences and how to make them better. Health Quality Ontario also works collaboratively with organizations across the province to encourage the spread of innovative and proven programs to support high quality, while also saving money and eliminating redundancy. And, we partner with patients to be full participants in designing our programs – another part of our work we take very seriously. Examples of what we do include providing ways for clinicians to use their collective wisdom and experience to bring about positive change. In 2017, 29 Ontario hospitals participated in a pilot program that reduced infections due to surgery by 18%. This program enabled surgeons to see their surgical data and how they perform in relation to each other and to 700 other hospitals worldwide. We then helped them identify and action improvement practices. Forty-six hospitals across Ontario are now part of this program. We also develop quality standards that are based on the best evidence, to guide on caring for health conditions where there are gaps in care. Each quality standard provides recommendations to government, organizations and clinicians, and is accompanied by a guide for patients to help them ask informed questions about their care. In addition, Health Quality Ontario’s health technology assessments use evidence to assess the value for money and safety of new technologies and procedures and make recommendations to government on whether or not they should be funded. And each year, we help organizations across the system create Quality Improvement Plans, for improving health care quality.

October 2018
Ontario Health Technology Assessment Series; Vol. 18: No. 7, pp. 1–199, October 2018 198
Health Quality Ontario is committed to supporting the development of a quality health care system based on six fundamental dimensions: efficient, timely, safe, effective, patient-centred and equitable. Our goal is to challenge the status quo and to focus on long-lasting pragmatic solutions that improve the health of Ontarians, enhance their experience of care, reduce health care costs, and support the well-being of health care providers – because we believe a quality health system results in Ontarians leading healthier and more productive lives, and a vibrant society in which everyone benefits.

October 2018
Ontario Health Technology Assessment Series; Vol. 18: No. 7, pp. 1–199, October 2018 199
About the Ontario Health Technology Advisory Committee About the Ontario Health Technology Assessment Series How to Obtain Reports From the Ontario Health Technology Assessment Series Disclaimer Health Quality Ontario 130 Bloor Street West, 10th Floor Toronto, Ontario M5S 1N5 Tel: 416-323-6868 Toll Free: 1-866-623-6868 Fax: 416-323-9261 Email: [email protected] www.hqontario.ca ISSN 1915-7398 (online) ISBN 978-1-4868-2370-3 (PDF) © Queen’s Printer for Ontario, 2018