Remote Measurements of On-Road Emissions from Heavy-Duty ...€¦ · The California Air Resources...
35
Remote Measurements of On-Road Emissions from Heavy-Duty Diesel Vehicles in California; Year 5, 2012 Annual Report prepared under National Renewable Energy Laboratory Subcontract AEV-8-88609-01 Gary A. Bishop and Donald H. Stedman Department of Chemistry and Biochemistry University of Denver Denver, CO 80208 April 2013 Prepared for: National Renewable Energy Laboratory 1617 Cole Blvd. Golden, CO 80401
Transcript of Remote Measurements of On-Road Emissions from Heavy-Duty ...€¦ · The California Air Resources...

Remote Measurements of On-Road Emissions from
Heavy-Duty Diesel Vehicles in California; Year 5, 2012
Annual Report prepared under
National Renewable Energy Laboratory Subcontract AEV-8-88609-01
Gary A. Bishop and Donald H. Stedman
Department of Chemistry and Biochemistry
University of Denver
Denver, CO 80208
April 2013
Prepared for:
National Renewable Energy Laboratory 1617 Cole Blvd. Golden, CO 80401

[2]
Executive Summary The University of Denver conducted two five-day remote sensing studies on heavy-duty diesel vehicles (HDDVs) at two sites (Water St. exit from the Trapac berths at the Port of Los Angeles and the Peralta weigh station on eastbound SR-91) in the Los Angeles Basin area of California in April/May and September of 2012. Highway construction on State Route 91 resulted in the closure of the Peralta weigh station until September delaying those measurements. Two remote sensing instruments (RSD 4600 made by ESP and FEAT 3002 equipped with dual UV spectrometers from the University of Denver) were used to measure emissions at the Port location while only the University of Denver instrument was used at the Peralta weigh station. These remote sensors measure the ratios of pollutants to carbon dioxide in vehicle exhaust. From these ratios, we calculate the mass emissions for each pollutant per mass or volume of fuel. The system from the University of Denver was also configured to determine the speed and acceleration of the vehicle, and was accompanied by a video system to record the license plate of the vehicle. The motivation for this five-year study was the implementation of new Federal vehicle emission standards and California retrofit and replacement standards for these trucks. This report covers the last year of this measurement program to monitor HDDV fleet and emission changes and compliance with the standards. Five days of field work at each of two sites between April 30 to May 4 and September 24-28 2012 were conducted, resulting in 4,293 HDDV emission measurements. The sites chosen were Peralta Weigh Station on Hwy 91 in Anaheim near the Weir Canyon Rd exit and a truck exit on Water St. at the Port of Los Angeles in San Pedro. The Peralta Weigh station site was previously used in 1997 to collect measurements and adds a historical perspective to the newer measurements. The heavy-duty California fleet observed at Peralta continues to slightly age and over the five year span has increased in age by about 0.9 model years. Since 2008 the average model year of just the California fleet has gone from 2000.2 (8.1 years old) to 2003.8 (9 years old). The fleet age at the Port has changed dramatically between our sampling campaigns in 2008 and 2012, averaging almost fourteen model years newer (1995.6 in 2008 vs. 2009.3 in 2009). A database for each site was compiled at Peralta and the Port, respectively, for which the states of California, Illinois, Oklahoma and Oregon provided make and model year information. This database, as well as any previous data our group has obtained for HDDV’s can be found at www.feat.biochem.du.edu. At Peralta NOx emissions have decreased by 27% over the five year measurement campaign with the largest drop (more than 60% of the total) occurring since the 2010 measurements. At the Port location NOx emissions have decreased by 55% during the same period, with the decrease slowing (a 12% reduction was observed between the 2010 and 2012 measurements) as expected since 2010. In combination with the NOx emission reductions at the Port large reductions in IR %opacity (54%) also occurred and showed no sign of any deterioration during the 2 year interval. The overall trend for IR %opacity at Peralta shows no statistical change since 2008, though a closer examination by chassis model year shows that the DPF equipped trucks (chassis models 2008 and newer) have similar IR %opacity reductions as those seen at the Port.

[3]
As mentioned gNOx/kg emissions saw their largest decrease during the last two years at the Peralta weigh station site and that is a direct result of the rapidly decreasing NOx emissions with 2011 chassis model year and newer vehicles. Our use of an additional digital camera to locate trucks equipped with urea tanks (we identified 184 trucks with a total of 233 measurements) was able to highlighted the fact that Selective Catalytic Reduction (SCR) systems are producing significant NOx reductions at Peralta. The newest 2013 models had a mean of 2.4 gNOx/kg compared to the fleet average of 19.9 gNOx/kg. This is now within a factor of 2 of the 2010 Federal engine test standard (0.2 g/bhp-hr translates to 1.33 gNOx/kg if we assume 0.15 kg of fuel is consumed per brake horsepower hour). Only 20 trucks (32 measurements) were identified at the Port and while NOx emissions continued to decrease at the Port location very few of the SCR systems appeared to be operational. While we saw these systems achieve large reductions in NOx emissions when they were not operational the emissions can be significantly higher than previous models and emphasizes the importance of need for these systems to be reliably maintained. Also new in this year’s measurements was the use of a Flir Thermovision infrared camera to image the elevated exhaust pipes of the trucks being measured. We successfully captured 1,969 images from Peralta and 766 images at the Port location which contained a recognizable exhaust pipe (low exhausts, mostly LNG trucks, were not included). The images were individually evaluated and assigned a temperature between 90 and 350° C. On average the trucks leaving our Port location have pipes which are 65 to 70°C cooler (mean 155°C versus 225°C) and below a critical catalytic operating temperature of approximately 200°C. This temperature difference was consistent when comparing the trucks from the early morning hours at Peralta (when ambient temperature are more like those at the coast) and with a matched set of identical trucks seen at both location (this help to eliminate any emissivity issues). The lower exhaust temperature of the Port trucks was not unexpected as their duty cycle at the berths involves mostly low speed driving with frequent stops. However, this is likely a contributing factor in the lower NO2/NOx ratios observed and higher NOx emissions observed from the SCR equipped trucks. This brings up the issue that the duty-cycle of the vehicle may work to undermine some additional NOx reductions at the Port because of low operating temperatures. LNG fueled trucks increased to their largest percentage of measurements in this year’s data set of 15.8% from their first introduction in 2009 when they represented only 5.6% of the measurements. These trucks are largely the stoichiometrically equipped engines as the number of lean burn LNG trucks dropped to only 10 measurements this year. Average ammonia emissions increased only slightly from 0.4 to 0.5 gNH3/kg with newer model year trucks having lower NH3 emissions when compared with the older 2009 and 2010 models. In addition the older 2009 and 2010 model year trucks are seeing a decreasing trend for NH3 combined with increasing NOx emissions. Sulfur dioxide emission measurements were very low with no high emitters observed this year compared to measurements observed in 2008, which exposed a number of trucks at the Port of Los Angles and a couple at Peralta that were likely using high sulfur fuels.
[4]
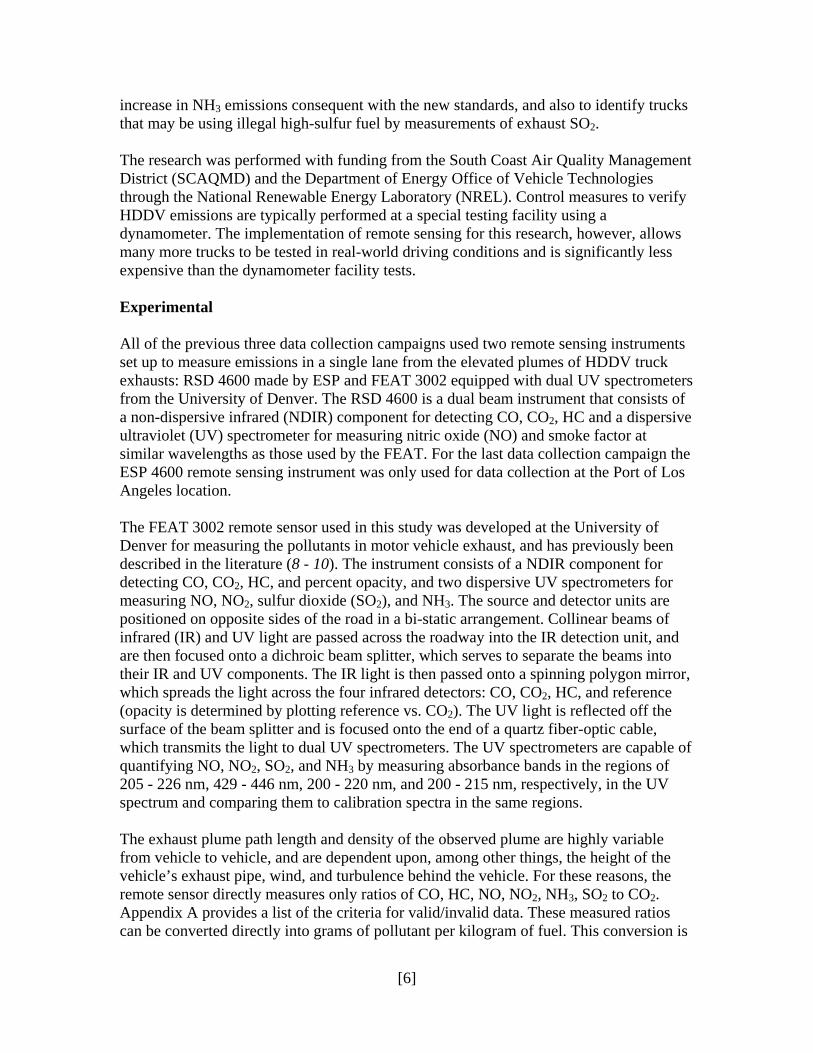
Introduction The United States Environmental Protection Agency (EPA) has recently mandated stricter emissions standards for on-road heavy-duty diesel vehicles (HDDVs) with the program represented in Table 1 (1). The standards are specifically for reduction of particulate matter (PM), non-methane hydrocarbons (NMHC), and oxides of nitrogen (NOx). However, beginning in 2007 most diesel engine manufacturers opted to meet a Family Emission Limit (FEL) with EPA allowing engine families with FEL’s exceeding the applicable standard to obtain emission credits through averaging, trading and/or banking. This will allow some diesel engine manufacturers to meet 2010+ standards with engines that do not meet a rigid 0.2 g/bhp-hr limit subsequent to the 2010 model year.
In California the National EPA Highway Diesel Program is just a part of a number of new regulations that will be implemented over the next decade. The San Pedro Bay Ports Clean Air Action Plan (CAAP) bans all pre-1989 model year trucks starting in October 2008. For all of the remaining trucks it further requires them to meet National 2007 emission standards by 2012. This requirement applies to all trucks, including interstate trucks, which move containers into the South Coast Air Basin and beyond. The California Air Resources Board (CARB) has implemented a Drayage Truck Regulation that requires by the end of 2009 that all pre-1994 engines be retired or replaced and all 1994 to 2008 engines must meet an 85% PM reduction. By the end of 2013 all drayage trucks must meet 2007 emission standards. This rule applies to all trucks with a gross vehicle weight rating of 33,000 pounds or more that move through port or intermodal rail yard properties for the purposes of loading, unloading or transporting cargo (2). In addition, CARB’s Statewide Truck and Bus Regulations will phase in most PM requirements for all trucks between 2011 and 2014 and will phase in NOx emission standards between 2013 and 2023 (3). These regulations will dramatically alter the composition and emission standards of the current South Coast Air Basin’s heavy-duty truck fleet, even though the HDDV fleet comprises only 2% of the total on-road population and 4% of the vehicle miles travelled in California’s South Coast Air Basin. HDDVs are estimated to account for 40-60% of PM and NOx emissions in the on-road mobile inventory (4, 5). Before advanced aftertreatment systems, control of NOx and PM emissions were constrained relative to technologies that trade-off the control of these two pollutants (see
Table 1. The 2007 EPA Highway Diesel Program.
Species Standard
(g/bhp-hr) Phase-In by Model Year
2007 2008 2009 2010
NOx 0.2 50% 50% 50% 100%
NMHC 0.14
PM 0.01 100% 100% 100% 100%

[5]
Figure 1). However, advanced control technologies deployed in the post-2007 timeframe for compliance with the U.S. EPA and CARB heavy-duty engine emission standards will not experience this trade-off. These advanced technologies will include a combination of diesel particle filter, selective catalytic reduction, and advanced exhaust gas recirculation (EGR) control strategies. In addition, diesel fuel composition can play a role in emission reductions. The compositions are not studied in this research; however, by measuring sulfur dioxide (SO2) emissions, we can infer the use of illegal high-sulfur fuels. Overall, understanding the expected impacts of future deployment of advanced emission control technologies will facilitate interpretation of data as it is generated throughout the course of this multi-year research project.
This research report specifically contains data from the last year (2012) of this multi-year study, to evaluate the impact on heavy-duty diesel emissions as stricter standards are being introduced into the on-road HDDV fleet. HDDV emissions were measured for one week in April/May 2012 at the Port of Los Angeles and for a week in September 2012 at a weigh station on SR92 near Yorba Linda, CA. CO, HC, NO, NO2, SO2, NH3, and opacity measurements were collected as ratios to their CO2 reading by the University of Denver equipment. Environmental Systems Products (ESP), the makers of the commercial on-road remote sensor, also had an instrument collecting CO, HC, NO, and UV smoke data collected also as ratios to CO2 at the Port location. Speed and acceleration data were also collected. The study will yield a large database of on-road HDDV emissions for characterization of the fleet. The data collected will allow us to verify the extent to which these new standards are met, to identify trucks not complying with standards, to measure any
Figure 1. Relative relationship between NOx and PM emissions in pre-control diesel engines (adapted from Heywood (7)). Particle filters, advanced exhaust gas recirculation techniques and selective catalytic reduction systems change this relationship.
Increased NOx
Incr
eas
ed P
M
Increasing NOx
Incr
easi
ng P
M
Pre-2007 Emission Control Technology PM-NOx Trade-Off
Impact of Post-2007 Emission Control Technology on PM and NOx Emissions
[6]
increase in NH3 emissions consequent with the new standards, and also to identify trucks that may be using illegal high-sulfur fuel by measurements of exhaust SO2. The research was performed with funding from the South Coast Air Quality Management District (SCAQMD) and the Department of Energy Office of Vehicle Technologies through the National Renewable Energy Laboratory (NREL). Control measures to verify HDDV emissions are typically performed at a special testing facility using a dynamometer. The implementation of remote sensing for this research, however, allows many more trucks to be tested in real-world driving conditions and is significantly less expensive than the dynamometer facility tests. Experimental All of the previous three data collection campaigns used two remote sensing instruments set up to measure emissions in a single lane from the elevated plumes of HDDV truck exhausts: RSD 4600 made by ESP and FEAT 3002 equipped with dual UV spectrometers from the University of Denver. The RSD 4600 is a dual beam instrument that consists of a non-dispersive infrared (NDIR) component for detecting CO, CO2, HC and a dispersive ultraviolet (UV) spectrometer for measuring nitric oxide (NO) and smoke factor at similar wavelengths as those used by the FEAT. For the last data collection campaign the ESP 4600 remote sensing instrument was only used for data collection at the Port of Los Angeles location. The FEAT 3002 remote sensor used in this study was developed at the University of Denver for measuring the pollutants in motor vehicle exhaust, and has previously been described in the literature (8 - 10). The instrument consists of a NDIR component for detecting CO, CO2, HC, and percent opacity, and two dispersive UV spectrometers for measuring NO, NO2, sulfur dioxide (SO2), and NH3. The source and detector units are positioned on opposite sides of the road in a bi-static arrangement. Collinear beams of infrared (IR) and UV light are passed across the roadway into the IR detection unit, and are then focused onto a dichroic beam splitter, which serves to separate the beams into their IR and UV components. The IR light is then passed onto a spinning polygon mirror, which spreads the light across the four infrared detectors: CO, CO2, HC, and reference (opacity is determined by plotting reference vs. CO2). The UV light is reflected off the surface of the beam splitter and is focused onto the end of a quartz fiber-optic cable, which transmits the light to dual UV spectrometers. The UV spectrometers are capable of quantifying NO, NO2, SO2, and NH3 by measuring absorbance bands in the regions of 205 - 226 nm, 429 - 446 nm, 200 - 220 nm, and 200 - 215 nm, respectively, in the UV spectrum and comparing them to calibration spectra in the same regions. The exhaust plume path length and density of the observed plume are highly variable from vehicle to vehicle, and are dependent upon, among other things, the height of the vehicle’s exhaust pipe, wind, and turbulence behind the vehicle. For these reasons, the remote sensor directly measures only ratios of CO, HC, NO, NO2, NH3, SO2 to CO2. Appendix A provides a list of the criteria for valid/invalid data. These measured ratios can be converted directly into grams of pollutant per kilogram of fuel. This conversion is

[7]
achieved by first converting the pollutant ratio readings to the moles of pollutant per mole of carbon in the exhaust from the following equation:
moles pollutant = pollutant = (pollutant/CO2) = (Q,2Q’,Q”) moles C CO + CO2 + 3HC (CO/CO2) + 1 + 6(HC/CO2) Q+1+2*3Q’ Q represents the CO/CO2 ratio, Q’ represents the HC/CO2 ratio and Q” represents the NO/CO2 ratio. Next, moles of pollutant are converted to grams by multiplying by molecular weight (e.g., 44 g/mole for HC since propane is measured), and the moles of carbon in the exhaust are converted to kilograms by multiplying (the denominator) by 0.014 kg of fuel per mole of carbon in fuel, assuming the fuel is stoichiometrically CH2. The HC/CO2 ratio uses a factor of two (Singer factor) times the reported HC because the equation depends upon carbon mass balance and the NDIR HC reading is about half a total carbon FID reading (11). For NG vehicles the appropriate factors for CH4 are used along with a Singer factor of 3.13. Grams per kg fuel can be converted to g/bhp-hr by multiplying by a factor of 0.15 based on an average assumption of 470 g CO2/bhp-hr (12). The FEAT detectors were calibrated, as external conditions warranted, from certified gas cylinders containing known amounts of the species that were tested. This ensures accurate data by correcting for ambient temperature, instrument drift, etc. with each calibration. Because of the reactivity of NO2 with NO and SO2 and NH3 with CO2, three separate calibration cylinders are needed: 1) CO, CO2, propane (HC), NO, SO2, N2 balance; 2) NO2, CO2, air balance; 3) NH3, propane, balance N2. The FEAT remote sensor is accompanied by a video system that records a freeze-frame image of the license plate of each vehicle measured. The emissions information for the vehicle, as well as a time and date stamp, is also recorded on the video image. The images are stored digitally, so that license plate information may be incorporated into the emissions database during post-processing. A device to measure the speed and acceleration of vehicles driving past the remote sensor was also used in this study. The system consists of a pair of infrared emitters and detectors (Banner Industries) which generate a pair of infrared beams passing across the road, six feet apart and approximately four feet above the surface. Vehicle speed is calculated from average of two times collected when the front of the tractors cab blocks the first and the second beam and the rear of the cab unblocks each beam. From these two speeds, and the time difference between the two speed measurements, acceleration is calculated, and reported in mph/s. An additional set of an emitter and detector are used to cue the FEAT detectors measurement of each truck plume. Appendix B defines the database format used for the data set. This is the fifth year of the study and fourth measurement campaign to characterize HDDV emissions in the Los Angeles area; the first year’s measurements were made in 2008 (13, 14). Measurements were collected on five days at two sites: the Peralta weigh

[8]
station in Anaheim and at the Port of Los Angeles in San Pedro, CA. The Peralta location was chosen in part because it has a history of previous measurements collected in 1997 that can be used for comparison (15). The 2012 data were collected similarly to the previous measurements with a major caveat that they were not collected in back to back weeks in May as previous campaigns were. Major construction on the SR-91 freeway closed the Peralta weigh station for an extended period of time forcing a postponement of those measurements until late September 2012. At the Peralta Weigh Station, measurements were made Monday, September 24, to Friday, September 28, between the hours of 8:00 and 17:00 on the lane reentering Highway 91 eastbound (SR-91 E) after the trucks had been weighed. This weigh station is just west of the Weir Canyon Road exit (Exit 39). A satellite photo showing the weigh station grounds and the approximate location of the scaffolding, motor home and camera is shown in Figure 2 (note that the satellite photo as of yet does not reflect the new construction). Figure 3 shows a close up picture of the measurement setup and Peralta’s new exit. Freeway construction eliminated our equipment placement markings requiring us to estimate the previous location of the sampling setup from previous year measurements and photographs. We were able to estimate the location of the scaffolding from pictures of prior year’s setup and its relationship to undisturbed vegetation and a former traffic control box. The repaving of the ramp slightly decreased the uphill grade at the measurement location from 1.8° to 1.6°. Appendix C lists the hourly temperature and humidity data collected at nearby Fullerton Municipal Airport. At the Port of Los Angeles, measurements were made on Monday, April 30, to Friday, May 4 between the hours of 8:00 and 17:00 just beyond the exit kiosk where truckers had checked out of the port. This location is just west of the intersection of West Water Street and South Fries Avenue. A satellite photo of the measurement location is shown in Figure 4 and a close up picture of the setup is shown in Figure 5. The grade at this measurement location is 0°. Appendix C lists the hourly temperature and humidity data collected at nearby Daugherty Field in Long Beach. The detectors were positioned on clamped wooden boards atop aluminum scaffolding at an elevation of 13’3”, making the photon beam and detector at an elevation of 14’3” (see Figures 3 and 5). The scaffolding was stabilized with three wires arranged in a Y shape. A second set of scaffolding was set up directly across the road on top of which the transfer mirror module (ESP) and IR/UV light source (FEAT) were positioned. The light source for the RSD 4600 is housed with the detector in the instrument and is shone across the road and reflected back. Behind the detector scaffolding was the University of Denver’s mobile lab housing the auxiliary instrumentation (computers, calibration gas cylinders and generator). Speed bar detectors were attached to each scaffolding unit which reported truck speed and acceleration. A video camera was placed down the road from the scaffolding, taking pictures of license plates when triggered. At the Peralta weigh station, detection took place on the single lane at the end of the station where trucks were reentering the highway. Most trucks were traveling between 10 and 20 mph in an acceleration mode to regain speed for the upcoming highway merger.

[9]
Figure 3. Photograph at the Peralta Weigh Station of the setup used to detect exhaust emissions from heavy-duty diesel trucks.
Figure 2. A satellite photo of the Peralta weigh station located on the Riverside Freeway (State Route 91). The scales are located on the inside lane next to the building in the top center and the outside lane is for unloaded trucks. The measurement location is circled at the upper right with approximate locations of the scaffolding, support vehicle and camera.

[10]
Figure 5. Photograph at the Port of Los Angeles of the setup used to detect exhaust emissions from heavy-duty diesel trucks.
Figure 4. A satellite photo of the Port of Los Angeles Water St. exit. The measurement location is circled in the lower left with approximate locations of the scaffolding, support vehicle and camera.

[11]
The Port of Los Angeles testing site was located at an exit near the intersection of Fries Avenue and Water Street near Wilmington, CA. The exit has three lanes allowing trucks to leave (one reserved for bobtails), and our equipment was set up in Lane #1 about 30 feet down the road from a booth where trucks stopped to check out of the Port. At the Port location the trucks were accelerating from a dead stop generally not reaching speeds higher than 5 mph. New data collected this year included exhaust thermographs taken with an infrared camera (Thermovision A20, FLIR Systems) for exploring qualitatively the exhaust temperatures of the trucks leaving the port and remote controlled digital pictures of the truck’s driver side for investigating the presence of urea tanks. Both video systems were successfully operated with the IR camera system capable of imaging the exhaust systems for a majority of the trucks that had elevated exhaust systems. This involved adding an additional computer system and software to capture and store the thermographs from the IR camera which we previously calibrated in the lab using a stainless steel exhaust pipe elbow from 100° C to 350°C. It was impossible to get a clear picture of the exhaust pipe from every truck as their placement and heat shielding varies a great deal. Figure 6 shows a sample picture of a truck leaving the Port location where the pipe is clearly visible and from which we were able to estimate an exhaust temperature. There currently are no emissions control equipment information provided through either vehicle registration or VIN data. With the advent of Selective Catalytic Reduction (SCR)
Figure 6. Thermographic image of the exhaust pipe of a truck leaving the port location. The relative scale is from ambient temperatures (the purple) to approximately 350° C for the bright red. The diamond checker boarding is a result of the picture being taken through a chain link fence.

[12]
To convert infrared emission images to an absolute temperature involves knowing the emissivity of the material being imaged. Heavy-duty truck exhaust systems are primarily stainless steel, however small changes in its formulation and finish can result in large (in some cases up to a factor of 10) changes to the steels emissivity (16). Since changes in emissivity should be common at both locations we can expect that unknown to cancel out with a large enough sample set. Therefore our ultimate goal is to sample a large enough number of trucks at each location whereby we can obtain an accurate difference in the two relative temperatures. There currently are no emissions control equipment information provided through either vehicle registration or VIN data. With the advent of Selective Catalytic Reduction (SCR) systems being added to many new heavy-duty diesel trucks we have observed that the urea tanks accompanying these systems often have large blue caps visible on the driver’s side of the truck. To attempt to identify trucks that have urea tanks we setup on a tripod a consumer grade Canon digital camera that could be remotely triggered by a computer controlled garage door opener to take pictures of the driver side of the truck chassis. These images were manually reviewed afterwards to identify trucks that are equipped with a urea tank and by association some type of SCR system. Figure 7 shows an example of what these images looked like with a truck that is equipped with a urea tank.
Figure 7. Driver side image of a truck leaving our port location with the urea tank clearly visable.

[13]
Results and Discussion The five days of data collection using the University of Denver FEAT remote sensor at the Peralta weigh station resulted in 3123 license plates that were readable. While California plated trucks constituted the large majority of the trucks measured, there were 717 measurements (~23%) from trucks registered outside of California. This is a slightly higher percentage of out-of-state plated trucks than seen previously (17 – 18 %) and may be a result of the freeway construction disabling the stations pre-pass system. Table 2 details the registration, the total measurements and the number of unique trucks they represent. License plates were matched for California, Illinois, Oklahoma and Oregon trucks. Data collected during the five days of measurements using the University of Denver FEAT remote sensor at the Port of LA site resulted in 1795 license plates that were readable. The plates were not read for the ESP equipment at this site. There were only 57 out–of-state plated trucks measured at the Port. Table 3 details the registration, the total measurements and the number of unique trucks measured. License plates were matched for the California, Illinois and Oregon vehicles. Table 4 and 5 provides a data summary of all the measurements that have been collected at the two sites including historical data collected in 1997. License plates were not read and matched during the 1997 measurements so we are unable to comment with any certainty on exactly how the fleet changed between 1997 and 2008. In addition keep in mind that the 2012 measurements were collected at the Peralta weigh station approximately a third of a year later than the 2012 measurements at the Port of LA. Fleet age at both locations did not keep up with the sampling time interval (i.e. at Peralta it was approximately 2.33 years since the last measurements and the 2012 mean chassis model year was only 2 years newer) increasing overall fleet age. This was expected at the Port since the fleet turnover was nearly complete when the 2010 measurements were collected. Table 6 provides a data summary comparison of the California-plate-matched trucks against the plate matched out-of-state trucks measured at the Peralta weigh station and compares their age and emission measurements. To simplify this comparison we required a valid measurement for each species so that the numbers of vehicles are consistent across all of the columns. The small sample of out-of-state trucks is almost 4 chassis model years newer with all emissions but HC and SO2 being lower. If we calculate the average age of the California fleet for each of the four measurement campaigns from this table in each report we find that during the past five years the California fleet has increased in age by 0.9 model years, 8.1 years to 9 years on average. Figures 9 and 10 are bar charts showing the emission trends for NOx and IR %Opacity (our surrogate for smoke emissions) at our two sampling locations. For the NOx graph the NO measurements are plotted as NO2 and for both plots the uncertainties are standard errors of the means determined from the daily averages. At Peralta NOx emissions have decreased by 27% with the largest drop (more than 60% of the total) occurring since the

[14]
Table 2. Distribution of Identifiable Peralta License Plates.
State / Country Readable
Plates Unique Plates
Matched Unique Plates
Total Measurements
Alabama 3 3 0 0 Arkansas 2 1 0 0 Arizona 75 73 0 0
California 2406 1810 1799 2394 Connecticut 4 4 0 0
Florida 7 7 0 0 Georgia 4 4 0 0
Iowa 19 17 0 0 Idaho 1 1 0 0
Illinois 93 82 82 93 Indiana 185 171 0 0
Louisiana 3 3 0 0 Michigan 3 3 0 0 Minnesota 10 9 0 0 Mississippi 1 1 0 0 Missouri 38 35 0 0 Montana 5 5 0 0 Nebraska 16 15 0 0
New Jersey 3 3 0 0 New Mexico 3 3 0 0
Nevada 8 8 0 0 North Dakota 1 1 0 0
Ohio 19 18 0 0 Oklahoma 26 26 20 20
Oregon 38 35 35 38 Pennsylvania 3 3 0 0 South Dakota 2 2 0 0
Tennessee 14 14 0 0 Texas 43 43 0 0 Utah 28 25 0 0
Washington 16 16 0 0 Wisconsin 5 5 0 0
Canada 10 10 0 0 Other 29 29 0 0 Totals 3123 2485 1936 2547

[15]
Table 4. Peralta Weigh Station FEAT Data Summary.
Study Year 1997 2008 2009 2010 2012
Mean CO/CO2 (g/kg of fuel)
0.008 (16.1)
0.005 (10.0)
0.005 (10.6)
0.005 (10.0)
0.004 (7.3)
Median gCO/kg 9.3 6.7 6.6 6.6 4.0 Mean HC/CO2 (g/kg of fuel)
0.0008 (5.0)
0.0004 (2.7)
0.0007 (4.8)
0.0007 (4.2)
0.0001 (0.6)
Median gHC/kg 3.7 2.1 2.9 2.9 1.3 Mean NO/CO2
(g/kg of fuel) 0.009 (19.2)
0.008 (16.4)
0.007 (15.4)
0.006 (14.7)
0.006 (11.8)
Median gNO/kg 18.0 15.2 14.3 13.5 11.5 Mean SO2/CO2 (g/kg of fuel)
NA 0.00006 (0.26)
0.00004 (0.16)
-0.00004 (-0.22)
-0.00008 (-0.36)
Median gSO2/kg NA 0.22 0.11 -0.2 -0.28 Mean NH3/CO2 (g/kg of fuel)
NA 0.00003 (0.03)
0.00002 (0.003)
0.000007 (0.008)
0.00002 (0.02)
Median gNH3/kg NA 0.02 0.016 0.006 0 Mean NO2/CO2 (g/kg of fuel)
NA 0.0006 (2.1)
0.0006 (1.9)
0.0005 (1.9)
0.0005 (1.8)
Median gNO2/kg NA 1.6 1.4 1.4 1.4 Mean / Median gNOx/kg NA 27.3 / 25.2 25.4 / 23.6 24.5 / 22.3 19.9 / 19.1
Mean/Median IR %Opacity 2.5 / 1.9 0.73 / 0.6 0.73 / 0.6 0.68 / 0.6 0. 69 / 0.5 Mean Model Year NA 2000.4 2001.3 2002.0 2004.0 Mean Speed (mph) NA 13.4 13.5 13.4 13.9
Mean Acceleration (mph/s) NA 1.1 0.9 0.8 1.1 Mean VSP(kw/tonne)
Slope (degrees) NA 1.8°
6.3 1.8°
5.8 1.8°
4.9 1.8°
6.6 1.6°
Table 3. Distribution of Identifiable Port of Los Angeles License Plates. State Readable
Plates Unique Plates
Unique Matched Plates
Total Measurements
Arizona 10 10 0 0 California 1738 1043 1041 1737
Illinois 6 5 5 6 Indiana 17 17 0 0
Missouri 1 1 0 0 New Jersey 9 9 0 0
Ohio 5 4 0 0 Oregon 3 3 3 3 Texas 3 3 0 0 Other 3 2 0 0 Totals 1795 1097 1049 1746

[16]
Table 6. Peralta emission summary comparison for California and out-of-state plate matched trucks.
State Trucks Mean
gCO/kg Mean
gHC/kg Mean
gNO/kg Mean
gNO2/kgMean
gNOx/kgMean
gSO2/kg Mean
gNH3/kg Mean Model
Year CA 2363 7.4 0.5 12.0 1.8 20.2 -0.4 0.02 2003.8
Other 151 5.3 1.3 7.7 1.3 13.1 -0.2 0.002 2007.7 28% -160% 36% 28% 35% -50% 90% -3.9
Table 5. Port of Los Angeles FEAT Data Summary. Study Year 2008 2009 2010 2012
Mean CO/CO2 (g/kg of fuel)
0.006 (12.7)
0.004 (7.6)
0.005 (8.6)
0.005 (8.2)
Median gCO/kg 10.6 4.0 2.7 4.0 Mean HC/CO2 (g/kg of fuel)
0.0009 (5.3)
0.0009 (5.4)
0.0009 (5.2)
0.0008 (3.7)
Median gHC/kg 4.2 3.3 2.5 2.5 Mean NO/CO2
(g/kg of fuel) 0.013 (27.1)
0.0083 (17.7)
0.0064 (13.6)
0.0057 (12.1)
Median gNO/kg 24.8 14.9 12.4 11.1 Mean SO2/CO2 (g/kg of fuel)
0.00004 (0.18)
-0.000004 (-0.02)
-0.00005 (-0.2)
-0.00008 (-0.3)
Median gSO2/kg 0.16 -0.003 -0.2 -0.3 Mean NH3/CO2 (g/kg of fuel)
0.00001 (0.02)
0.0002 (0.2)
0.0004 (0.4)
0.0005 (0.5)
Median gNH3/kg 0.02 0.01 0.02 -0.007 Mean NO2/CO2 (g/kg of fuel)
0.001 (3.9)
0.001 (3.3)
0.0008 (2.5)
0.0006 (2.0)
Median gNO2/kg 3.4 2.4 1.2 0.8 Mean / Median gNOx/kg 45.4 / 41.7 30.4 / 26.1 23.3/ 21.9 20.6 / 19.2
Mean/Median IR %Opacity 0.71 / 0.6 0. 44 / 0.3 0.33 / 0.2 0.33 / 0.2 Mean Model Year 1995.6 2003.5 2007.9 2009.3 Mean Speed (mph) ~<5 4.6 5.0 4.9
Mean Acceleration (mph/s) NA 0.5 0.5 0.5 Mean VSP(kw/tonne)
Slope (degrees) NA 0°
1.0 0°
1.0 0°
1.0 0°

[17]
Figure 9. Mean gNOx/kg emissions by measurement year for the two measurement locations. The mean model year for each data set is displayed above each measurement. Note that the time difference between last two measurement campaigns at Peralta is approximately a third of a year longer than at the Port location. NO data is graphed as NO2 equivalents and the uncertainties are standard errors of the means for the total.
50
40
30
20
10
0
Mea
n gN
Ox/
kg
NO2
NO
Peralta Port2008 2009 2010 2012 2008 2009 2010 2012
2000.4 2001.3 2002 2004
1995.6
2003.5
2007.9 2009.3
Figure 10. Mean IR %opacity emissions by measurement year for the two measurement locations. Note that the time difference between last two measurement campaigns at Peralta is approximately a third of a year longer than at the Port location. Uncertainties are standard errors of the means.
0.8
0.6
0.4
0.2
0.0
Mea
n IR
%O
paci
ty
Peralta Port2008 2009 2010 2012 2008 2009 2010 2012

[18]
2010 measurements. At the Port location NOx emissions have decreased by 55%, with the decrease slowing as expected since 2010. In combination with the NOx emission reductions at the Port large reductions in IR %opacity (54%) also occurred and remained unchanged during the 2 year interval. The overall trend for IR %opacity at Peralta shows no statistical change since 2008, though a closer examination by chassis model year, which we will discuss later, shows that the DPF equipped trucks (chassis models 2008 and newer) have similar IR %opacity reductions as those seen at the Port. Figures 11 and 12 plot mean gNOx/kg emissions for all of the measurement years for both sampling locations as a function of chassis model year. Measurements at Peralta show good repeatability for many chassis model years with decreasing emissions for newer trucks. There is of course noticeable increases in noise at the two ends of the plot where small numbers of older trucks and the newest chassis model years were sampled. Noticeable features are the increase in NOx emissions during the mid-90’s followed by a gradual decrease until 2003. Beginning with chassis model year 2004 a step reduction in emissions occurs for the next four model years. While published California and Federal NOx emission regulations were reduced beginning with 2004 model engines (which should translate to a 2005 chassis model year), as part of the consent decree manufacturers agreed to comply with those regulations on engines manufactured after October 1, 2002 moving up the effects of those regulations (17, 18). Another step reduction is evident for the 2008 through 2010 chassis model year trucks (DPF equipped vehicles). Starting with the 2011 chassis models a steep linear reduction in emissions begins ending with the newest 2013 models having a mean of 2.4 gNOx/kg. These last model years include HDDV now equipped with SCR emission systems. The federal 2010 NOx regulation required diesel vehicles to meet an engine test stand standard of 0.2 g/bhp-hr, though even for 2013 chassis model not all engines are required to be certified to this level yet. Assuming that 0.15 kg of fuel is consumed per brake horsepower hour a full implementation of the Federal NOx standard would result in an on-road mean of approximately 1.33 g/kg. The 2013 model year mean, which only includes 84 measurements, is now within a factor of 2 of that mark. The plot of mean gNOx/kg versus chassis model year at the Port (Figure 12) is much noisier, year over year, largely due to the rapid changes in the chassis model years of the trucks in the fleet. This left many model years with very few measurements for the averages in many measurement years. For example in 2008 there are less than 70 trucks with a chassis model year newer than 2001. This distribution then quickly flips over the next two years with almost all of the trucks being newer than chassis model year 2007. Since driving mode has a measureable effect on NOx emissions the smaller the number of measurements the more difficult it is at average out that effect with the result being the higher noise observed year to year in the Port data. With that caveat one is still able to discern the increased NOx emissions in the mid-90’s followed by a decrease through the early part of the 2000’s. The step reductions in 2004 and 2008 are not clearly discernible; however beginning with the 2011 chassis model year trucks we also see the beginnings of additional NOx emission reduction though at higher levels than observed at Peralta. The high power demand driving mode observed at the Port is again a major reason for this difference.

[19]
Figure 11. Mean gNOx/kg emissions for all of the measurement years at the Peralta Weigh Station. The two most recent chassis model years of the 2012 measurements are showing the effects of SCR implementation. Error bars are standard error of the means.
60
50
40
30
20
10
0
Mea
n g
NO
x/k
g
20102005200019951990
Chassis Model Year
2008 20092010 2012
Figure 12. Mean gNOx/kg emissions for the measurement years at the Port of LA. All years show a general trend of decreasing mean gNOx/kg as a function of chassis model year. There are only five measurements for model year 2007 for the 2008 data set and only single measurements for 1999 and 2000 chassis model years in 2012. Error bars are standard errors of the mean.
60
50
40
30
20
10
0
Mea
n gN
Ox/k
g
20102005200019951990
Chassis Model Year
2008 20092010 2012
[20]
The National and California emission regulations that have targeted major reduction in PM emissions have been met with the introduction of diesel particle filters (DPF). Because these filters physically trap the particles, they require a mechanism to oxidize the trapped particles to keep the filter from plugging. One approach used to date has been to install an oxidation catalyst upstream of the filter and use it to convert engine-out NO emissions to NO2. NO2 is then capable of oxidizing the trapped particles to regenerate the filter and is able to accomplish this at lower temperatures than is possible with other species. However, if the production of NO2 is not controlled well it can lead to an increase in tailpipe emissions of NO2, and the unintended consequence of increased ozone in urban areas (19, 20). European experiences with increasing the prevalence of DPF’s have shown a correlation with increases in urban NO2 emission (21). California has codified this concern by passing rules that limit any increases in NO2 emissions from the uncontrolled engine baseline emissions for retrofit DPF devices (22). Nationally, new vehicle manufacturers are constrained with only a total NOx standard that does not differentiate between NO and NO2 emissions. Traditionally diesel exhaust NO2 has comprised less than 10% of the tailpipe NOx emissions; however this ratio had increased significantly in the newer fleet beginning with the 2009 measurements. Figures 13 and 14 presents the data for the NO2/NOx ratio of the heavy-duty fleet by chassis model year for each of the four measurement campaigns completed. Each successive data set collected after 2009 shows a steady decrease in this ratio at both locations, consistent with the idea that a “de-greening” of the catalyst occurs with age. At the Port of LA location (Figure 14) the NO2/NOx ratio has decreased to where it is statistically indistinguishable from the pre-DPF equipped fleet. In addition the newest 2012 chassis model year vehicles do not show the usual first year increase in NO2 emissions. As in past years the NO2/NOx ratios are lower than those observed at the Peralta weigh station. While both locations show similar year over year decreasing trends the 2012 measured ratios at Peralta are still significantly greater than the pre-DPF equipped fleet. A contributing factor that might help explain these differences concerns the operating temperatures of the catalysts in the two fleets. To investigate this possibility we for the first time took advantage of the fact that the University of Denver owns a FLIR Thermovision A20 infrared camera to image the exhaust systems of the exiting trucks. The system captured 1,969 images from Peralta and 766 images at the Port location which contained a recognizable elevated exhaust pipe (low exhausts, mostly LNG trucks, were not included). The images were individually evaluated and assigned a temperature between 90 and 350° C. Figure 15 shows the distribution of those readings (the 360° bin is for readings in excess of 350°C). Table 7 details the mean measured exhaust temperatures for each location. To attempt to compensate for the inherent ambient temperature differences between the two sites (see Appendix C) we have included means for two early morning periods at Peralta. Finally we compare exhaust temperature measurements from 10 (1 equipped with an SCR) trucks seen at both locations.

[21]
Figure 13. Ratio of NO2/NOx vs. chassis model year for the heavy-duty fleet measured at the Peralta weigh station for all measurement years. Each successive year of measurements has seen a decrease in this ratio for 2008 and newer chassis model year vehicles as the catalyst age. Uncertainties are standard errors of the mean.
0.6
0.5
0.4
0.3
0.2
0.1
0.0
Mea
n M
ass
NO
2/N
Ox
2012201020082006200420022000
Chassis Model Year
2008200920102012
Figure 14. Ratio of NO2/NOx vs. chassis model year for the heavy-duty fleet measured at the Port of LA location. Each successive year of measurements has seen a decrease in this ratio for 2008 and newer chassis model year vehicles so that the 2012 ratios measured are statistically indistinguishable from pre-DPF trucks at this location. Uncertainties are standard errors of the mean.
0.6
0.5
0.4
0.3
0.2
0.1
0.0
Mea
n M
ass
NO
2/N
Ox
2012201020082006200420022000
Chassis Model Year
2008200920102012

[22]
As shown in Table 7 there is an observed mean temperature difference of about 65 to 70°C regardless of the grouping chosen. The similarities in the mean temperature differences, including the 10 trucks observed at both locations, supports the notion that changes in material emissivity between trucks to the first order cancels out in the comparison. Keep in mind that these observed temperatures should be considered a lower limit for the temperatures one would expect at the DPF or SCR which are closer to the engine. Nonetheless these temperatures suggest that a large percentage of vehicles observed at our Port location will have catalytic devices that are not at a sufficient operating temperature of greater than 200°C (23, 24). The reduce exhaust temperatures of the Port trucks was not entirely unexpected since the operations of these trucks on Port property includes a lot of low speed stop and go driving before they exit. During the stops most of the drivers rigorously follow the no-idle ordinances and turn the engines off while they wait, even if for very brief time periods. In contrast operations at the Peralta weigh station include low speed driving through the
Figure 15. Distribution of infrared estimated exhaust temperatures for trucks at the two measurement locations. The highest temperature bin (360°C) contains all trucks with exhaust temperatures that exceeded 350°C.
250
200
150
100
50
0
Tru
cks
90 110 130 150 170 190 210 230 250 270 290 310 330 350
IR Estimated Exhaust Temperature (ºC)
Peralta POLA
Table 7. Mean Infrared Estimated Exhaust Temperatures.
Groupings Measurements POLA / Peralta
POLA Mean / Median (°C)
Peralta Mean / Median (°C)
All Data 766 / 1969 155° / 150° 225° / 230° Peralta Before 10am 766 / 691 155° / 150° 220° / 230° Peralta Before 9am 766 / 400 155° / 150° 219° / 230° 10 Matched Trucks 13 / 11 152° / 130° 237° / 230°

[23]
scales (placarded at 5mph) but after exiting from freeway driving. The lower operating temperatures for the Port trucks likely is a major factor in the lower NO2/NOx ratios observed which is a positive for local ozone formation but may be a major obstacle for further NOx reductions in newer trucks using SCR technology. The NOx reductions observed starting with the 2011 chassis model year trucks accompanies the introduction of SCR systems to meet the Federal 2010 NOx standard. Because of engine family emission averaging not all new diesel engines are currently required to meet the 0.2 g/bhp-hr and as such not all new trucks have SCR systems. To investigate the effectiveness of these new NOx reduction systems we setup a consumer grade digital camera to photograph the driver sides of as many trucks as possible to locate urea tanks indicating an SCR equipped truck. The system was most effective at the Port sampling location where the speeds are constrained and consistent. At the Peralta weigh station the larger range of speeds (~5 to 25mph) made it impossible to successfully image every truck. However, we were able to identify 184 trucks (233 measurements) at Peralta and 20 trucks (32 measurements) at the Port exit equipped with a urea tank and by inference an SCR system. For these analyses we have not restricted the database to only vehicles with a license plate match, but have included any truck with an identified urea tank and valid emission measurements. This is only a factor for the Peralta data as all of the SCR equipped trucks observed at the Port are also in the plate matched database. Table 8 gives a statistical breakdown for the means and medians of the measurements for these trucks for each site. You will notice that all of the emissions except NH3 are much lower for the trucks measured at the Peralta weigh station. Both those species that are removed by the oxidation catalyst (CO/HC) and the reduction catalyst (NO/NO2) are multiple factors lower in the truck measurements at the weigh station. In addition only at Peralta is the mean IR estimated exhaust temperature above the critical operating temperature. At the Port these measurements are just below the fleet averages for all of the trucks again indicating little activity from the NOx reduction systems. There is a 2011 Mack truck that was measured at both locations. At the Port this trucks gNOx/kg emissions and exhaust temperature were 31.2 g/kg and 120°C and at Peralta 0.3 g/kg and 230°C. Obviously the NOx reduction system was fully operational at the weigh station and not in operation at the Port, likely simply due to operating conditions of which temperature is one factor.
Figures 16 and 17 are a binned category and fleet fraction of emissions plots highlighting what the distribution of the gNOx/kg emissions from SCR equipped trucks looks like at each site. It is very likely that we have only identified a subset of the SCR equipped
Table 8. Emissions Summary and Exhaust Temperatures for SCR Equipped Trucks.
Site (Number)
gCO/kg Mean
Median
gHC/kg Mean
Median
gNO/kgMean
Median
gNH3/kgMean
Median
gNO2/kgMean
Median
gNOx/kg Mean
Median
Mean IR Exhaust
Temperature °CPort (32)
7.03 2.66
2.55 1.26
11.00 9.88
-0.04 -0.01
1.83 1.69
18.69 17.23
142°
Peralta (233)
1.50 1.34
-1.22 -0.41
2.16 0.13
0.008 0.0
0.61 0.21
3.92 0.49
230°

[24]
Figure 16. Peralta gNOx/kg emissions distribution of the 233 measurements (184 unique trucks) collected on trucks observed with a urea tank. Inset graph plots the gNOx/kg emissions fraction against the fleet fraction for these same 233 measurements.
120
100
80
60
40
20
0
Tru
cks
0 4 8 12 16 20 24 28 32 36 40 44 48
gNOx/kg Bins
1.0
0.5
0.0
1.00.80.60.40.20.0 Fleet Fraction
gNO
x/kg
Frac
tion
Figure 17. Port of LA gNOx/kg emissions distribution of the 32 measurements (20 unique trucks) collected on trucks observed with a urea tank. Inset graph plots the gNOx/kg emissions fraction against the fleet fraction for these same 32 measurements.
10
8
6
4
2
0
Tru
cks
0 4 8 12 16 20 24 28 32 36 40 44 48
gNOx/kg Bins
1.0
0.5
0.0
1.00.80.60.40.20.0Fleet Fraction
gNO
x/kg
Frac
tion

[25]
trucks, especially at Peralta. One observation that can be made from looking at the individual measurements is that a new truck with its SCR not operating can have emissions as high as or higher than ten to twenty year old trucks. If we define a working SCR system as having gNOx/kg emissions of 4 or less this leaves about 20% of the measurements at Peralta as coming from trucks where the NOx reduction system is not fully operational and excludes all but one of the measurements at the Port location. At Peralta the fractional emissions distribution plot looks very much like on-road light-duty distributions with half of the gNOx/kg emissions coming from 7% of the measurements (the Port data is less skewed with half of the emissions caused by 26% of the measurements). The major caveat in making this comparison is that we do not suspect any malfunction issues with these new SCR systems just that for specific operational issues some of these units are not in use. At Peralta catalyst temperature does not appear to be one of those issues though it is likely a major factor at our Port location. It does however, bring up an important point that future NOx emission reductions in California will depend heavily on keeping these systems operational. In addition forecasting the NOx benefits one can expect from fleet turnover is no longer as simple as using the Federal engine certification standards as it is obvious that these new control systems have significant operational requirements to achieve the full benefit. In the case of moving freight at Port locations the nature of short trips with frequent engine off stops may prove a poor fit for this new emissions control technology. Our previous discussion of the overall emission trends for smoke emission plotted in Figure 10 showed large reduction in IR %Opacity for the fleet of trucks measured at our Port location but with little if any statistically significant change at Peralta. This might leave the impression that we are not seeing similar benefits from DPF equipped trucks at Peralta. 2008 and newer chassis model year trucks in this data set still only represent 30% of the plate matched fleet (29% of the CA plates). Figure 18 shows the mean IR %Opacity by model year for the 2012 measurements. The errors plotted are standard errors of the mean calculated from the daily means. There is a noticeable and significant break in the %opacity readings beginning with the 2008 chassis model year (2007 model engines which were required to meet the 0.01 g/bhp-hr emissions standard). If we compare the means %opacities of 2008 to 2012 trucks (mean of 0.445) with pre-2008 trucks (mean of 0.785) we find a 43% reduction in IR %opacity. This is not as large a percent reduction as observed at our Port location (54%) but still quite significant. Since most DPF applications involve some type of oxidation catalyst we would also expect to see reductions in CO and HC emissions. At Peralta the HC data is too noisy to unequivocally see any benefit but the CO data shows a clear trend very similar to that seen for the IR %opacity measurements. Figure 19 shows the mean CO emissions as a function of model year for all four years of data collected at Peralta. With the exception of a higher CO average for chassis model year 2008 in the 2010 measurements the introduction of an oxidation catalyst in 2008 trucks has resulted in a significant reduction of roughly a factor of 5 in diesel CO emissions along with controlling particle emissions.

[26]
Figure 18. Mean IR %Opacity plotted as a function of chassis model year for the 2012 measurements collected at the Peralta weigh station. Uncertainties are standard errors of the mean calculated from the daily means.
1.2
1.0
0.8
0.6
0.4
0.2
0.0
IR %
Opa
city
20122008200420001996
Chassis Model Year
Figure 19. Mean gCO/kg emissions versus chassis model year for the four years of measurements made at the Peralta weigh station.
14
12
10
8
6
4
2
Mea
n gC
O/k
g
20122010200820062004200220001998Chassis Model Year
2008200920102012
[27]
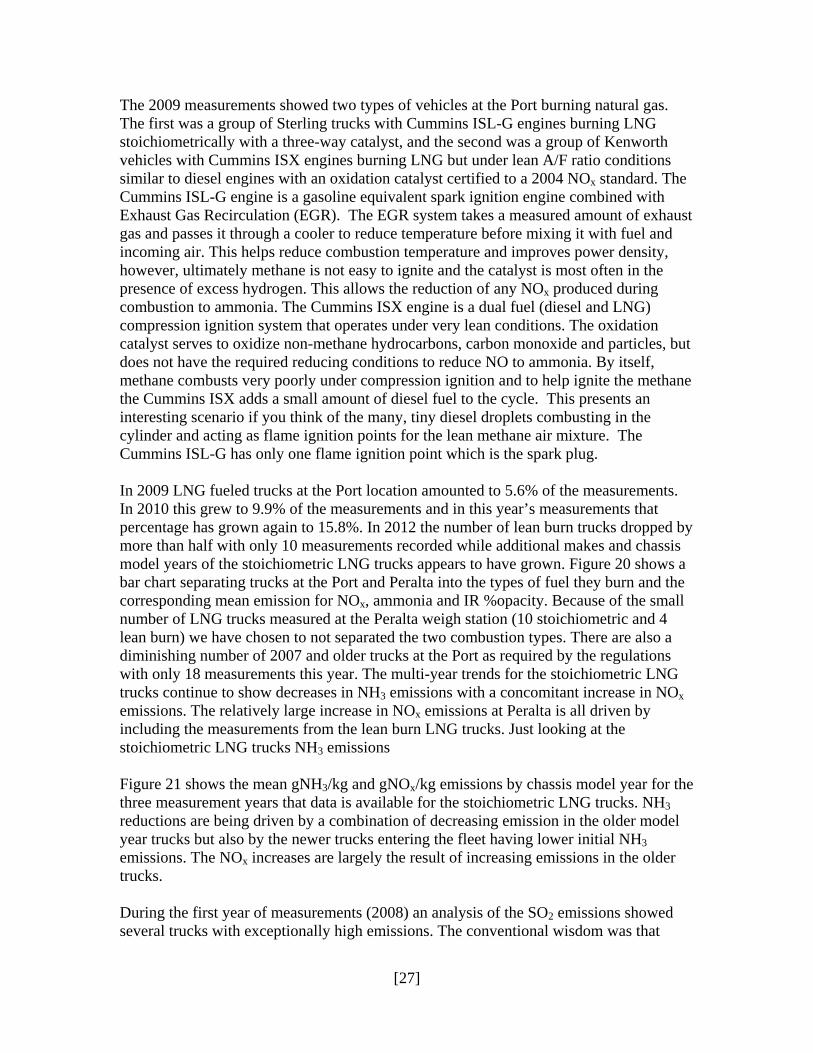
The 2009 measurements showed two types of vehicles at the Port burning natural gas. The first was a group of Sterling trucks with Cummins ISL-G engines burning LNG stoichiometrically with a three-way catalyst, and the second was a group of Kenworth vehicles with Cummins ISX engines burning LNG but under lean A/F ratio conditions similar to diesel engines with an oxidation catalyst certified to a 2004 NOx standard. The Cummins ISL-G engine is a gasoline equivalent spark ignition engine combined with Exhaust Gas Recirculation (EGR). The EGR system takes a measured amount of exhaust gas and passes it through a cooler to reduce temperature before mixing it with fuel and incoming air. This helps reduce combustion temperature and improves power density, however, ultimately methane is not easy to ignite and the catalyst is most often in the presence of excess hydrogen. This allows the reduction of any NOx produced during combustion to ammonia. The Cummins ISX engine is a dual fuel (diesel and LNG) compression ignition system that operates under very lean conditions. The oxidation catalyst serves to oxidize non-methane hydrocarbons, carbon monoxide and particles, but does not have the required reducing conditions to reduce NO to ammonia. By itself, methane combusts very poorly under compression ignition and to help ignite the methane the Cummins ISX adds a small amount of diesel fuel to the cycle. This presents an interesting scenario if you think of the many, tiny diesel droplets combusting in the cylinder and acting as flame ignition points for the lean methane air mixture. The Cummins ISL-G has only one flame ignition point which is the spark plug. In 2009 LNG fueled trucks at the Port location amounted to 5.6% of the measurements. In 2010 this grew to 9.9% of the measurements and in this year’s measurements that percentage has grown again to 15.8%. In 2012 the number of lean burn trucks dropped by more than half with only 10 measurements recorded while additional makes and chassis model years of the stoichiometric LNG trucks appears to have grown. Figure 20 shows a bar chart separating trucks at the Port and Peralta into the types of fuel they burn and the corresponding mean emission for NOx, ammonia and IR %opacity. Because of the small number of LNG trucks measured at the Peralta weigh station (10 stoichiometric and 4 lean burn) we have chosen to not separated the two combustion types. There are also a diminishing number of 2007 and older trucks at the Port as required by the regulations with only 18 measurements this year. The multi-year trends for the stoichiometric LNG trucks continue to show decreases in NH3 emissions with a concomitant increase in NOx emissions. The relatively large increase in NOx emissions at Peralta is all driven by including the measurements from the lean burn LNG trucks. Just looking at the stoichiometric LNG trucks NH3 emissions Figure 21 shows the mean gNH3/kg and gNOx/kg emissions by chassis model year for the three measurement years that data is available for the stoichiometric LNG trucks. NH3 reductions are being driven by a combination of decreasing emission in the older model year trucks but also by the newer trucks entering the fleet having lower initial NH3 emissions. The NOx increases are largely the result of increasing emissions in the older trucks. During the first year of measurements (2008) an analysis of the SO2 emissions showed several trucks with exceptionally high emissions. The conventional wisdom was that

[28]
Figure 20. Bar chart of mean emissions of oxides of nitrogen (left axis), ammonia and IR %opacity (right axis) by age, fuel and combustion technology. Error bars are standard error of the mean.
50
40
30
20
10
0
Mea
n gN
Ox/
kg6
5
4
3
2
1
0
Mean gN
H3 /kg | IR
%O
pacity
Port Diesels2008 - 2012
Port 2004Lean-LNG
PortStoich-LNG
PeraltaLNG
Port Diesels2007 & Older
2009 NOx 2009 NH3 2009 Opacity2010 NOx 2010 NH3 2010 Opacity2012 NOx 2012 NH3 2012 Opacity
Figure 21. Mean gNH3/kg (solid symbols) and gNOx/kg (open symbols) versus chassis model year for stoichiometric LNG trucks at the Port of Los Angeles location for the last 3 measurement campaigns.
4
3
2
1
0
Mea
n g/
kg
2012201120102009Chassis Model Year
2012 NH3 NOx
2010 NH3 NOx
2009 NH3 NOx

[29]
these trucks were likely using either low sulfur on-road fuel that had been adulterated with used oil or had access to non-road or Mexican high sulfur diesel fuel. Since 2008 we have not detected any additional outliers with excessive SO2 emissions and that includes the 2012 measurements. Acknowledgements We acknowledge financial support from the National Renewable Energy Laboratory under NREL subcontract number AEV-8-88609-01 and the South Coast Air Quality Management District under contract number 08230. Additionally we acknowledge the assistance of Sgt. Mark Webster of the California Highway Patrol and Paul Richey of TraPac. Comments from the various reviewers of this report were also invaluable. References
1. USEPA Highway Diesel Progress Review, 2002, http://www.epa.gov/oms/highway-diesel/compliance/420r02016.pdf.
2. California Code of Regulations, Title 13, Section 2027, 2008. 3. California Code of Regulations, Title 13, Section 2025, 2008. 4. 2006 Estimated Annual Average Emissions: Statewide.
http://www.arb.ca.gov/ei/emissiondata.htm, California Air Resources Board, 2007.
5. Harley, R.A.; Marr, L.C.; Lehner, J.K.; Giddings, S.N. Environ. Sci. Technol., 2005, 39, 5356-5362.
6. McCormick, R. L.; Ross, J. D.; Graboski, M. S. Environ. Sci. Tech., 1997, 31, 1144-1150.
7. Heywood, J. B. Internal Combustion Engine Fundamentals, McGraw-Hill Publishing: New York, p. 866, 1988.
8. Bishop, G.A.; Stedman, D.H. Acc. Chem. Res. 1996, 29, 489. 9. Popp, P.J.; Bishop, G.A.; Stedman, D.H. J. Air & Waste Manage. Assoc. 1999,
49, 1463. 10. Burgard, D.A.; Dalton, T.R.; Bishop, G.A.; Starkey, J.R.; Stedman, D.H. Rev. Sci.
Instrum. 2006, 77, 014101. 11. Singer, B.C.; Harley, R.A.; Littlejohn, D.; Ho, J.; Vo, T. Environ. Sci. Technol.
1998, 32, 3241. 12. Broering, L. C. Diesel Engine Emissions Reduction History and Future Prospects,
Cummins Engine Company, Presentation at the National Conference of State Legislatures, 1997.
13. Bishop, G.A.; Holubowitch, N.E.; Stedman, D.H. Remote Measurements of On-Road Emissions from Heavy-Duty Diesel Vehicles in California; Year 1, 2008.
14. Bishop, G. A.; Schuchmann, B. G.; Stedman, D. H.; Lawson, D. R. Environ. Sci. Technol. 2012, 46, 551-558.
15. Bishop, G.A.; Morris, J.A.; Stedman, D.H.; Cohen, L.H.; Countess, R.J; Countess, S.J.; Maly, P.; Scherer, S. Environ Sci. & Technol., 2001, 35, 1574-78.
16. http://www.engineeringtoolbox.com/emissivity-coefficients-d_447.html

[30]
17. U. S. Environmental Protection Agency, Compliance and Enforcement Web page. http://www.cfpub.epa.gov/compliance/cases/ (accessed January 2013).
18. California Air Resources Board, http://www.arb.ca.gov/board/ms/ms120700.htm (accessed January 2013).
19. Stedman, D.H. Environ. Chem., 2004, 1, 65-66. 20. Lawson, D.R., The Weekend Ozone Effect—The Weekly Ambient Emissions
Control Experiment EM, July 2003, pp. 17-25. 21. Lemaire, J. Österreichische Ingenieur und Architekten-Zeitschrift, 2007, 152, 1-
12, http://www.feat.biochem.du.edu/library/Lemaire_2007.pdf. 22. California Code of Regulations, Title 13, Section 2702(f) and 2706(a), 2003. 23. Johnson, T. V., Review of diesel emissions and control. Int. J. Engine Res. 2009,
10, 275-285. 24. Heeb, N. V.; Zimmerli, Y.; Czerwinski, J.; Schmid, P.; Zennegg, M.; Haag, R.;
Seiler, C.; Wichser, A.; Ulrich, A.; Honegger, P.; Zeyer, K.; Emmenegger, L.; Mosimann, T.; Kasper, M.; Mayer, A. Atmos. Environ. 2011, 45, 3203-3209.

[31]
APPENDIX A: FEAT criteria to render a reading “invalid”.
Invalid :
1) insufficient plume to rear of vehicle relative to cleanest air observed in front or in the rear; at least five, 10ms >160ppm CO2 or >400 ppm CO. (0.2 %CO2 or 0.5% CO in an 8 cm cell. This is equivalent to the units used for CO2 max.). For HDDV’s this often occurs when the vehicle shifts gears at the sampling beam.
2) excessive error on CO/CO2 slope, equivalent to +20% for CO/CO2 > 0.069, 0.0134 CO/CO2 for CO/CO2 < 0.069.
3) reported CO/CO2 , < -0.063 or > 5. All gases invalid in these cases.
4) excessive error on HC/CO2 slope, equivalent to +20% for HC/CO2 > 0.0166 propane, 0.0033 propane for HC/CO2 < 0.0166.
5) reported HC/CO2 < -0.0066 propane or > 0.266. HC/CO2 is invalid.
6) excessive error on NO/CO2 slope, equivalent to +20% for NO/CO2 > 0.001, 0.002 for NO/CO2 < 0.001.
7) reported NO/CO2 < -0.00465 or > 0.0465. NO/CO2 is invalid.
8) excessive error on SO2/CO2 slope, ± 0.0134 SO2/CO2.
9) reported SO2/CO2 , < -0.00053 or > 0.0465. SO2/CO2 is invalid.
10) excessive error on NH3/CO2 slope, ± 0.00033 NH3/CO2.
11) reported NH3/CO2 < -0.00053 or > 0.0465. NH3/CO2 is invalid.
12) excessive error on NO2/CO2 slope, equivalent to +20% for NO2/CO2 > 0.00133, 0.000265 for NO2/CO2 < 0.00133.
13) reported NO2/CO2 < -0.0033 or > 0.0465. NO2/CO2 is invalid.
Speed/Acceleration valid only if at least two blocks and two unblocks in the time buffer and all blocks occur before all unblocks on each sensor and the number of blocks and unblocks is equal on each sensor and 100mph>speed>5mph and 14mph/s>accel>-13mph/s and there are no restarts, or there is one restart and exactly two blocks and unblocks in the time buffer.

[32]
APPENDIX B: Explanation of the Peralt12.dbf and LAPort12.dbf databases.
The Peralt12.dbf and LAPort12.dbf are Microsoft FoxPro database files, and can be opened by any version of MS FoxPro. These files can be read by a number of other database management and spreadsheet programs as well, and is available from www.feat.biochem.du.edu. The grams of pollutant/kilogram of fuel consumed are calculated assuming that diesel fuel has 860 grams of carbon per kilogram of fuel and natural gas has 750 grams of carbon per kilogram of fuel. The following is an explanation of the data fields found in this database:
License Vehicle license plate.
State State license plate issued by.
Date Date of measurement, in standard format.
Time Time of measurement, in standard format.
Co_co2 Measured carbon monoxide / carbon dioxide ratio
Co_err Standard error of the CO/CO2 measurement.
Hc_co2 Measured hydrocarbon / carbon dioxide ratio (propane equivalents).
Hc_err Standard error of the HC/CO2 measurement.
No_no2 Measured nitric oxide / carbon dioxide ratio.
No_err Standard error of the NO/CO2 measurement.
So2_co2 Measured sulfur dioxide / carbon dioxide ratio.
So2_err Standard error of the SO2/CO2 measurement.
Nh3_co2 Measured ammonia / carbon dioxide ratio.
Nh3_err Standard error of the NH3/CO2 measurement.
No2_co2 Measured nitrogen dioxide / carbon dioxide ratio.
No2_err Standard error of the NO2/CO2 measurement.
Opacity IR Opacity measurement, in percent.
Opac_err Standard error of the opacity measurement.
Restart Number of times data collection is interrupted and restarted by a close-following vehicle, or the rear wheels of tractor trailer.
Hc_flag Indicates a valid hydrocarbon measurement by a “V”, invalid by an “X”.
No_flag Indicates a valid nitric oxide measurement by a “V”, invalid by an “X”.
So2_flag Indicates a valid sulfur dioxide measurement by a “V”, Invalid by an “X”.
Nh3_flag Indicates a valid ammonia measurement by a “V”, Invalid by an “X”.
No2_flag Indicates a valid Nitrogen dioxide measurement by a “V”, Invalid by an “X”.
Opac_flag Indicates a valid opacity measurement by a “V”, invalid by an “X”.

[33]
Max_co2 Reports the highest absolute concentration of carbon dioxide measured by the remote sensor over an 8 cm path; indicates plume strength.
Speed_flag Indicates a valid speed measurement by a “V”, an invalid by an “X”, and slow speed (excluded from the data analysis) by an “S”.
Speed Measured speed of the vehicle, in mph.
Accel Measured acceleration of the vehicle, in mph/s.
Ref_factor Reference factor.
CO2_factor CO2 factor.
Tag_name File name for the digital picture of the vehicle.
Exp_Date Date that current vehicle registration expires.
Year Model year of the vehicles chassis.
Make Manufacturer of the vehicle.
Vin Vehicle identification number.
County County code where vehicle resides.
CO_gkg Grams of CO per kilogram of fuel consumed.
HC_gkg Grams of HC per kilogram of fuel consumed.
NO_gkg Grams of NO per kilogram of fuel consumed.
SO2_gkg Grams of SO2 per kilogram of fuel consumed.
NH3_gkg Grams of NH3 per kilogram of fuel consumed.
NO2_gkg Grams of NO2 per kilogram of fuel consumed.
VSP Vehicle specific power in kw/tonne.

[34]
APPENDIX C: Temperature and Humidity Data.
Data collected at Fullerton Municipal Airport
Peralta 2012 Temperature and Humidity Data
Time 9/24 F
9/24 %RH
9/25 F
9/25 %RH
9/26 F
9/26 %RH
9/27 F
9/27 %RH
9/28 F
9/28 %RH
5:53 71 64 68 73 67 76 65 81 66 81 6:53 73 62 69 73 67 76 67 78 68 78 7:53 76 62 70 71 68 73 69 76 71 73 8:53 80 52 73 62 70 68 73 66 76 62 9:53 83 43 76 56 73 62 76 60 81 51 10:53 86 42 79 47 78 52 81 51 86 36 11:53 86 37 79 47 82 44 83 49 90 33 12:53 87 32 80 45 83 44 85 46 91 30 13:53 85 37 80 44 81 49 83 49 91 34 14:53 84 41 78 47 81 47 84 48 91 32 15:53 82 40 76 54 80 49 83 49 87 36 16:53 79 49 74 60 77 54 82 51 83 40 17:53 77 60 71 64 74 60 77 58 79 44 Data collected at Daugherty Field in Long Beach
Port of LA 2012 Temperature and Humidity Data
Time 4/30 F
4/30 %RH
5/1 F
5/1 %RH
5/2 F
5/2 %RH
5/3 F
5/3 %RH
5/4 F
5/4 %RH
5:53 63 75 59 90 59 84 60 78 58 87 6:53 63 75 60 87 60 78 61 75 59 81 7:53 63 75 61 81 62 73 62 73 60 78 8:53 64 73 62 84 64 68 64 68 62 70 9:53 65 70 63 75 64 65 66 61 64 65 10:53 65 70 65 68 65 63 68 55 66 63 11:53 67 66 65 65 66 61 68 55 67 61 12:53 68 63 64 68 65 63 70 51 68 57 13:53 67 66 64 70 65 61 68 55 69 55 14:53 67 66 65 68 64 63 70 53 69 57 15:53 66 68 64 65 65 61 69 53 69 55 16:53 65 70 63 68 63 65 68 55 69 57

[35]
APPENDIX D: Field Calibration Record.
Peralta 2012 FEAT Calibration Factors
Date Time CO HC NO SO2 NH3 NO2
9/24 9:00 1.43 1.33 1.4 1.67 0.915 0.93
9/25 7:45 1.66 1.44 1.66 1.59 0.8 1 9/25 10:30 1.46 1.32 1.32 1.94 0.88 0.96 9/25 14:40 1.31 1.20 1.20 1.40 0.92 0.76
9/26 7:25 1.72 1.57 1.70 1.78 0.8 1.19 9/26 9:55 1.42 1.32 1.38 1.44 0.81 1
9/27 7:30 1.73 1.57 1.60 1.33 0.79 1.10
9/27 9:25 1.54 1.44 1.32 1.3 0.84 0.89
9/27 12:45 1.44 1.35 1.24 1.28 0.84 0.87
9/28 7:35 1.87 1.75 1.70 1.72 0.79 1.31
9/28 9:40 1.69 1.56 1.50 1.94 0.85 1.10
9/28 11:00 1.45 1.36 1.34 1.72 0.88 1
Port of LA 2012 FEAT Calibration Factors
Date Time CO HC NO SO2 NH3 NO2
4/30 9:30 1.48 1.35 1.46 1.56 0.93 1.21 4/30 13:00 1.44 1.29 1.42 1.53 0.92 1.04
5/1 8:45 1.52 1.33 1.50 1.65 0.85 1.22 5/1 12:35 1.38 1.23 1.33 1.60 0.95 1.02
5/2 8:25 1.57 1.22 1.19 1.32 0.80 0.93 5/2 12:25 1.37 1.20 1.33 1.43 0.98 1.02
5/3 8:45 1.51 1.33 1.45 1.41 0.92 1.15 5/3 12:15 1.40 1.25 1.37 1.44 0.96 1.06
5/4 8:30 1.48 1.31 1.48 1.25 0.89 1.23 5/4 12:20 1.40 1.24 1.32 1.55 0.92 1.04


![Intermodal Drayage Onboarding Packet - UPDS SERVICE PROVIDER PRE-QUALIFICATION. O. N-BOARDING . Q. UESTIONNAIRE /I. NTERVIEW [Drayage and Trucking Services] PART I: BACKGROUND INFORMATION](https://static.fdocuments.in/doc/165x107/5ab98ffb7f8b9ac10d8e69a7/intermodal-drayage-onboarding-packet-service-provider-pre-qualification-o-n-boarding.jpg)