REMITTANCE TRANSFERS TO ARMENIA: …pdf.usaid.gov/pdf_docs/PNADN318.pdf · · 2008-12-12... 8 B....
23
SEPTEMBER 2008 This publication was produced for review by the United States Agency for International Development. It was prepared by Manuel Orozco Commissioned by USAID in Collaboration with The Central Bank of Armenia. REMITTANCE TRANSFERS TO ARMENIA: PRELIMINARY SURVEY DATA ANALYSIS microREPORT# 117
-
Upload
truongthuy -
Category
Documents
-
view
220 -
download
3
Transcript of REMITTANCE TRANSFERS TO ARMENIA: …pdf.usaid.gov/pdf_docs/PNADN318.pdf · · 2008-12-12... 8 B....

SEPTEMBER 2008
This publication was produced for review by the United States Agency for International Development. It was prepared by Manuel Orozco Commissioned by USAID in Collaboration with The Central Bank of Armenia.
REMITTANCE TRANSFERS TO ARMENIA: PRELIMINARY SURVEY DATA ANALYSIS microREPORT# 117


REMITTANCE TRANSFERS TO ARMENIA: PRELIMINARY SURVEY DATA ANALYSIS MICROREPORT# 117


REMITTANCE TRANSFERS TO ARMENIA: PRELIMINARY SURVEY DATA ANALYSIS i
CONTENTS
REMITTANCE TRANSFERS TO ARMENIA: PRELIMINARY SURVEY DATA ANALYSIS ................................................................ 5
INTRODUCTION .......................................................................... 5 A. CHARACTERISTICS OF REMITTANCE RECIPIENTS AND SENDERS OF REMITTANCES ........................................................ 6
Remittance Recipients ................................................. 6 Remittance Senders ..................................................... 8
B. THE MARKETPLACE FOR MONEY TRANSFERS ......................... 9 C. CONTINUITY OF MIGRATION AND REMITTANCES .................... 11 D. DETERMINANTS OF REMITTANCES, SAVINGS AND OTHER VARIABLES .............................................................................. 14
Intention to Migrate .................................................... 15 Determinants of the continuity of flows ...................... 16
E. PRELIMINARY SURVEY ESTIMATE OF REMITTANCES .............. 17 CONCLUSION ........................................................................... 19


TABLES AND FIGURES TABLE
1 Annual amount received from range ........................................ 6 2 Annual income and income dependence on remittances by
country of remittance origin ...................................................... 6 3 Income dependence and unemployed in the household ......... 7 4 Annual amount received from length of time receiving ............ 7 5 Distribution of use of remittances (%) ...................................... 7 6 Sender’s education level (%) ................................................... 8 7 Time living abroad--permanent migrants (%) ........................... 9 8 Main reason for migration (%) .................................................. 9 9 Education and main reason for migration (%) .......................... 9 10 Method of receiving money (%) ............................................. 10 11 Transfer method and choice (%) ............................................ 10 12 Transfer method by origin of remittances (%) ........................ 10 13 Change in total amount received in 2006 from previous
year ........................................................................................ 11 14 Prospects of a household member to migrate in the next 3
years ...................................................................................... 12 15 Chances of migrating and jobs .............................................. 12 16 Prospects of money transfers to continue .............................. 12 17 Seasonal worker since and continuity of flows ...................... 13 18 Permanent migrant and continuity of flows ............................ 13 19 Regression results on determinants of remittance received .. 14 20 Regression Results on Likelihood to Migrate ......................... 15 21 Continuity of remittances: regression results ......................... 16 22 Units of analysis and its size for the Armenian case .............. 17 23 Preliminary estimates: remittances by household or
migrants ................................................................................. 18 24 Estimates of Remittances by Income ..................................... 19 25 Number of people who remit to one household or number
of families who receive from a migrant .................................. 19 26 Estimate using method of sending, annual average and
number of beneficiaries .......................................................... 19
REMITTANCE TRANSFERS TO ARMENIA: PRELIMINARY SURVEY DATA ANALYSIS iii
iv REMITTANCE TRANSFERS TO ARMENIA: PRELIMINARY SURVEY DATA ANALYSIS
FIGURE
1 Money Transfer Method and Type of Migrant ........................ 11 2 Type of Migrant and Expectation of Receiving Money ........... 13

REMITTANCE TRANSFERS TO ARMENIA: PRELIMINARY SURVEY DATA ANALYSIS
INTRODUCTION This briefing offers a preliminary data analysis associated with remittance flows and migration trends in Armenia, interpreted from the Central Bank of Armenia’s household survey. The report offers a descriptive and statistical analysis of remittance trends by assessing typical behavior among recipients and senders, and the marketplace for money transfers. The briefing also analyzes the prospects for migration and remittances in the short term and explores some patterns that may exist or shed light on the continuity of flows.
The principal findings of this report indicate that over one-third of households receive remittances, and nearly one-third of senders remit to more than one household The average amount received is US $1,600 a year coming predominantly from Russia and sent to immediate relatives such as children and siblings. The amount received is an important complement to income in a country with a high degree of unemployment. Other findings show that senders migrated mostly due to the lack of jobs in the home country, rather than low salaries. As in other countries in Central Asia and the Caucasus region, transfers are made predominantly through formal licensed money transfer systems.
When looking at the use of remittances by recipients, the trend is similar to other remittance-recipient societies, whereby 70 percent of the money is spent on day-to-day expenses and the rest is spent on investments, or acquisition of durable goods. Only a very small percentage of people responded that they save, and the amounts reported were relatively negligible.
The report also highlights findings about the continuity of remittances and migration. Specifically, the survey results show that one-quarter of people are thinking of migrating, and only one-third of recipients do not expect to continue to receive more money over time. One running thread emerging from the survey is that the lack of jobs and unemployment are important predictors of amounts received, intention to migrate and the expectation of future flows. Furthermore, when people use bank deposits for money transfers, the amounts received are higher.
Finally, the study applies several methods using the data to provide estimates of annual flows going to the country.
REMITTANCE TRANSFERS TO ARMENIA: PRELIMINARY SURVEY DATA ANALYSIS 5

A. CHARACTERISTICS OF REMITTANCE RECIPIENTS AND SENDERS OF REMITTANCES1 The ultimate and primary players in remittances are people who send and receive money. Migrants make decisions about moving and in turn, seek to provide for their families. These families are living in households that require additional financial resources that cannot be obtained within their own nation. This section looks at the survey results of recipients and senders.
REMITTANCE RECIPIENTS According to the household survey, 37 percent of households receive remittances. The main recipients are individuals who have a direct relationship with the migrant such as siblings or children. One-third of recipients are female-headed households and the homes are relatively compact, containing on average four people: the father, mother and two children (daughter or son). Fifty percent of respondents said the sender is their son, and nearly 15 percent said it was a sibling. These relatives receive an average of US $1,600 a year, with children and siblings receiving over $1,000 each.
TABLE 1: ANNUAL AMOUNT RECEIVED FROM RANGE Sender member of family Mean US$ As percent of all recipients
spouse 2000 1 child 1486 52 sibling 1099 14 son/daughter-in-law 1012 3 parent 2138 3 grandchild 958 0 head 3570 3 Total 1612 100
Most migrants receive their money from relatives in Russia (77%), followed by Armenians in the United States (11%) and in Ukraine (3%); the remaining group receives from France, Kazakhstan, Spain and Greece. On average, the annual household income including remittances is nearly US $2,700 and is higher among recipients from migrants in the United States than Russia. Moreover, those remittances received represent on average 41 percent of total income and such income dependence on remittances (the ratio of remittances to total income) is higher among those remitting from Russia (44%) than from the U.S.
TABLE 2: ANNUAL INCOME AND INCOME DEPENDENCE ON REMITTANCES BY COUNTRY OF REMITTANCE ORIGIN
Country Income US$ Dependence
Russia 2,676 0.44
Ukraine 2,392 0.29
USA 3,548 0.29
1 All table results in this paper are from the Central Bank of Armenia’s household survey.
6 REMITTANCE TRANSFERS TO ARMENIA: PRELIMINARY SURVEY DATA ANALYSIS

Country Income US$ Dependence
Kazakhstan 2,455 0.35
Total 2,821 0.41
Another important issue is that the ratio of remittances to income grows higher with unemployment in the household, from 50 percent among those who are fully employed (25% of all households) to 75 percent for those with four or more people unemployed (5% of all households). The amount received also increases in general over time, from $1300 to nearly $2,000 for those who have been receiving for more than five years.
TABLE 3: INCOME DEPENDENCE AND UNEMPLOYED IN THE HOUSEHOLD Number unemployed Mean % of all households
0 .51 25.3 1 .60 34.3 2 .57 24.4 3 .57 10.9 Four or more .75 5.1 Total 57 100.0
TABLE 4: ANNUAL AMOUNT RECEIVED FROM LENGTH OF TIME RECEIVING Years Mean US$ %
Less than two 1318 31.7 2 to three 1595 15.7 3 to four 1584 9.2 4 to five 1627 8.6 Over five 1936 34.9 Total 1628 100.0
Another issue relating to remittances received is the way in which people spend the money. Seventy percent said they use the money for regular current expenses, and the rest is distributed to education, real estate or other investments such as savings. The percent of people who said they save was very small (2.5%), as was the percent saved. However, this percentage was still higher than investment in other areas, such as entrepreneurship and machinery, which are very uncommon.
TABLE 5: DISTRIBUTION OF USE OF REMITTANCES (%)
Gender of the HH* Weighted average share spent
Male Female Total % responding current expenses 72 74 72 88 expenses on primary education 4 4 4 13 expenses on other education 5 6 5 11 acquisition of real estate and land 1 1 1 1.9 Acquisition of agricultural machinery and goods 1 1 1 1.9
REMITTANCE TRANSFERS TO ARMENIA: PRELIMINARY SURVEY DATA ANALYSIS 7

Weighted average share spent Gender of the HH*
Male Female Total % responding repairs expenses 3 3 3 8.7 entrepreneurship 1 1 1 1.6 savings 1 1 1 2.5 acquisition of HH appliances 3 3 3 8.7 Other 11 8 10
*HH=head of the household
REMITTANCE SENDERS Nearly 40 percent of the senders are children of the head of the household, and one-third are a sibling of the head of the household. Over two-thirds (79%) of the recipients surveyed indicated that the person remitting to them is an immediate family member, while an additional 16% receive from a slightly more distant relative. The survey results suggest that most senders remit to only one family.
Seventy-seven percent of senders are wage earners/employees, and only 16 sixteen percent are entrepreneurs/business people. The average age of senders is 43 years old, an age above average among migrants in other places in the world, including Commonwealth of Independent States (CIS) countries. Migrants’ completed education level varies; senders are more or less divided equally among higher education, vocational training and secondary education.
TABLE 6: SENDER’S EDUCATION LEVEL (%) Higher 34.6
incomplete higher 2.8 vocational 26.0 secondary 34.7 incomplete secondary 1.9 Total 100.0
Sixty-eight percent of migrants are living abroad, and 31 percent are seasonal workers. The majority of those living abroad have been outside for five to fifteen years. Similarly, 75 percent of seasonal workers began migrating in the past seven years—66 percent since the beginning of the millennium. These numbers highlight the fact that not only is there an emerging tradition of circular migration, but that the large bulk of remitters are people who have been abroad for over five years.
One of the questions from the survey relates to the remittance sender’s disposition to stay in Armenia depending on the amount he/she would be prepared to earn for his/her work. It is notable that nearly half of seasonal workers would return for a monthly US$300-600 in Armenia. These wages are extremely high compared to the country’s average monthly income which is under $150.
More importantly, however, is that migration is predominantly a function of the lack of jobs in the country, rather than low wages. People with secondary education suffer mostly because of lack of jobs in general, while those with higher education suffer the most because of the absence of professional jobs and low salaries.
8 REMITTANCE TRANSFERS TO ARMENIA: PRELIMINARY SURVEY DATA ANALYSIS
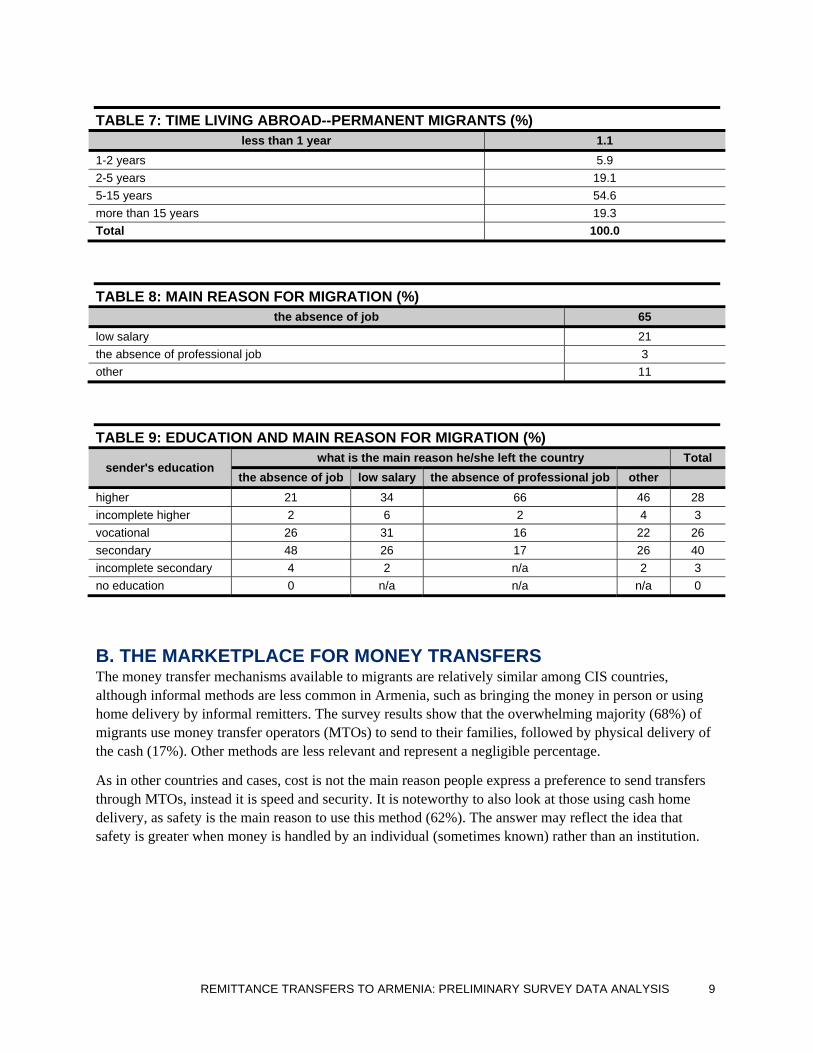
TABLE 7: TIME LIVING ABROAD--PERMANENT MIGRANTS (%) less than 1 year 1.1
1-2 years 5.9 2-5 years 19.1 5-15 years 54.6 more than 15 years 19.3 Total 100.0
TABLE 8: MAIN REASON FOR MIGRATION (%) the absence of job 65
low salary 21 the absence of professional job 3 other 11
TABLE 9: EDUCATION AND MAIN REASON FOR MIGRATION (%)
sender's education what is the main reason he/she left the country Total
the absence of job low salary the absence of professional job other higher 21 34 66 46 28 incomplete higher 2 6 2 4 3 vocational 26 31 16 22 26 secondary 48 26 17 26 40 incomplete secondary 4 2 n/a 2 3 no education 0 n/a n/a n/a 0
B. THE MARKETPLACE FOR MONEY TRANSFERS The money transfer mechanisms available to migrants are relatively similar among CIS countries, although informal methods are less common in Armenia, such as bringing the money in person or using home delivery by informal remitters. The survey results show that the overwhelming majority (68%) of migrants use money transfer operators (MTOs) to send to their families, followed by physical delivery of the cash (17%). Other methods are less relevant and represent a negligible percentage.
As in other countries and cases, cost is not the main reason people express a preference to send transfers through MTOs, instead it is speed and security. It is noteworthy to also look at those using cash home delivery, as safety is the main reason to use this method (62%). The answer may reflect the idea that safety is greater when money is handled by an individual (sometimes known) rather than an institution.
REMITTANCE TRANSFERS TO ARMENIA: PRELIMINARY SURVEY DATA ANALYSIS 9

TABLE 10: METHOD OF RECEIVING MONEY (%) MTO 68
Cash 17 by providing passport 8 brokerage offices 5 bank account 1 Other 1 postal wire transfer 0 authorized used card 0
TABLE 11: TRANSFER METHOD AND CHOICE (%)
method of money transfer REASON
Total cheap fast nearby safe other
bank account 16.7 41.7 41.7 100.0 by providing passport 16.7 15.4 5.1 56.4 6.4 100.0 MTO 10.5 46.4 2.3 40.2 .6 100.0 brokerage offices 50.0 21.4 14.3 14.3 100.0 authorized used card 100.0 100.0 cash 10.1 .6 .6 61.5 27.2 100.0 Total 12.0 32.9 2.4 45.9 6.8 100.0
There are, however, relevant variations in sending method based on country of origin and type of migrant. In the first case, transfers from Russia and Ukraine are predominantly handled by MTOs, while transfers received from the U.S. come from a mix of brokerage offices, MTOs, and cash delivery. One important issue regarding transfers from the U.S. is that international foreign currency is handled predominantly by an MTO, bank, or any entity licensed to offer a money service business. Brokerage offices, or in this particular case, foreign exchange houses, are not particularly involved in the money transfer business in the U.S. However, money transfer agents may also advertise foreign currency exchange and sell their services as brokers, although they are likely to perform the transaction through a bank or an MTO. In the payout or remittance destination country, brokerage offices can then make the transfer.
TABLE 12: TRANSFER METHOD BY ORIGIN OF REMITTANCES (%)
method of money transfer Country
Russia Ukraine USA bank account 0 3 by providing passport 9 9 3 MTO 74 64 30 brokerage offices 0 1 48 authorized used card 0 cash 16 22 16 postal wire transfer 0 3 0 other 1 0 Total 100 100 100
10 REMITTANCE TRANSFERS TO ARMENIA: PRELIMINARY SURVEY DATA ANALYSIS
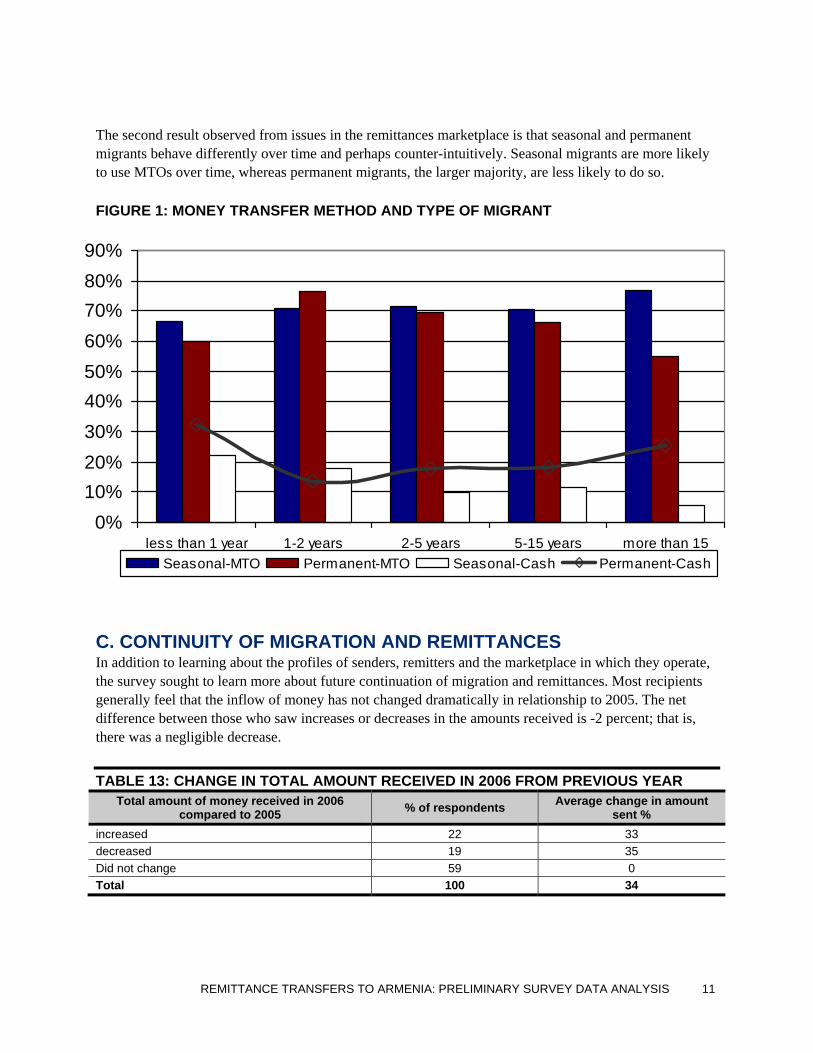
The second result observed from issues in the remittances marketplace is that seasonal and permanent migrants behave differently over time and perhaps counter-intuitively. Seasonal migrants are more likely to use MTOs over time, whereas permanent migrants, the larger majority, are less likely to do so.
FIGURE 1: MONEY TRANSFER METHOD AND TYPE OF MIGRANT
0%10%20%30%40%50%60%70%80%90%
less than 1 year 1-2 years 2-5 years 5-15 years more than 15Seasonal-MTO Permanent-MTO Seasonal-Cash Permanent-Cash
C. CONTINUITY OF MIGRATION AND REMITTANCES In addition to learning about the profiles of senders, remitters and the marketplace in which they operate, the survey sought to learn more about future continuation of migration and remittances. Most recipients generally feel that the inflow of money has not changed dramatically in relationship to 2005. The net difference between those who saw increases or decreases in the amounts received is -2 percent; that is, there was a negligible decrease.
TABLE 13: CHANGE IN TOTAL AMOUNT RECEIVED IN 2006 FROM PREVIOUS YEAR Total amount of money received in 2006
compared to 2005 % of respondents Average change in amount sent %
increased 22 33 decreased 19 35 Did not change 59 0 Total 100 34
REMITTANCE TRANSFERS TO ARMENIA: PRELIMINARY SURVEY DATA ANALYSIS 11
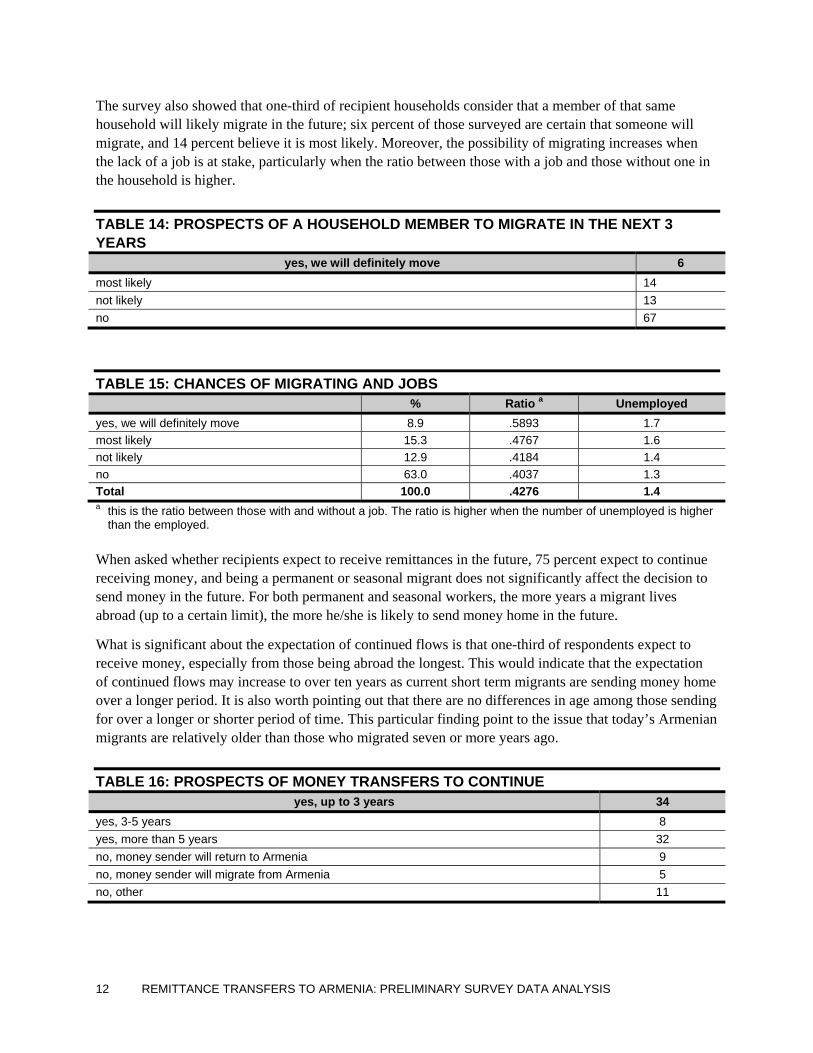
The survey also showed that one-third of recipient households consider that a member of that same household will likely migrate in the future; six percent of those surveyed are certain that someone will migrate, and 14 percent believe it is most likely. Moreover, the possibility of migrating increases when the lack of a job is at stake, particularly when the ratio between those with a job and those without one in the household is higher.
TABLE 14: PROSPECTS OF A HOUSEHOLD MEMBER TO MIGRATE IN THE NEXT 3 YEARS
yes, we will definitely move 6 most likely 14 not likely 13 no 67
TABLE 15: CHANCES OF MIGRATING AND JOBS % Ratio a Unemployed
yes, we will definitely move 8.9 .5893 1.7 most likely 15.3 .4767 1.6 not likely 12.9 .4184 1.4 no 63.0 .4037 1.3 Total 100.0 .4276 1.4 a this is the ratio between those with and without a job. The ratio is higher when the number of unemployed is higher
than the employed. When asked whether recipients expect to receive remittances in the future, 75 percent expect to continue receiving money, and being a permanent or seasonal migrant does not significantly affect the decision to send money in the future. For both permanent and seasonal workers, the more years a migrant lives abroad (up to a certain limit), the more he/she is likely to send money home in the future.
What is significant about the expectation of continued flows is that one-third of respondents expect to receive money, especially from those being abroad the longest. This would indicate that the expectation of continued flows may increase to over ten years as current short term migrants are sending money home over a longer period. It is also worth pointing out that there are no differences in age among those sending for over a longer or shorter period of time. This particular finding point to the issue that today’s Armenian migrants are relatively older than those who migrated seven or more years ago.
TABLE 16: PROSPECTS OF MONEY TRANSFERS TO CONTINUE yes, up to 3 years 34
yes, 3-5 years 8 yes, more than 5 years 32 no, money sender will return to Armenia 9 no, money sender will migrate from Armenia 5 no, other 11
12 REMITTANCE TRANSFERS TO ARMENIA: PRELIMINARY SURVEY DATA ANALYSIS

TABLE 17: SEASONAL WORKER SINCE AND CONTINUITY OF FLOWS
will the money transfer continue?
up to 3 years 3-5 years more than 5 years
No
Seasonal worker since...
Before 1970 .4 .4 .4 1970s .4 2.5 .4 1980s 5.8 1.4 5.8 1.1 1990s 25.6 5.8 23.1 8.3 2000s 9.7 3.2 1.8 4..0
TABLE 18: PERMANENT MIGRANT AND CONTINUITY OF FLOWS
lives outside Armenia for: will the money transfer continue?
up to 3 years 3-5 years more than 5 years no less than 1 year .9 .1 1.2 1-2 years 3.8 .5 1.2 3.5 2-5 years 8.7 1.9 5.3 6.2 5-15 years 14.6 4.4 21.2 9.8 more than 15 years 3.7 1.2 5.8 3.9
FIGURE 2: TYPE OF MIGRANT AND EXPECTATION OF RECEIVING MONEY
05
10152025303540
No up to 3 years 3-5 years more than 5years
seasonal worker lives outside
REMITTANCE TRANSFERS TO ARMENIA: PRELIMINARY SURVEY DATA ANALYSIS 13
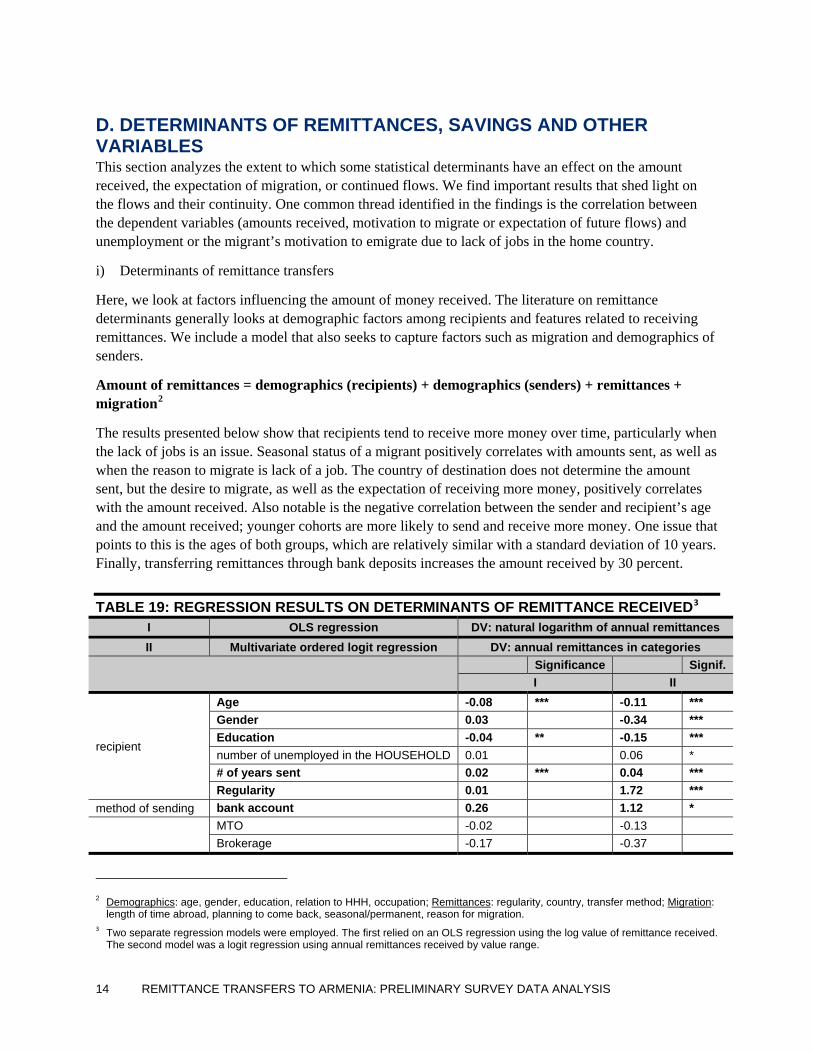
D. DETERMINANTS OF REMITTANCES, SAVINGS AND OTHER VARIABLES This section analyzes the extent to which some statistical determinants have an effect on the amount received, the expectation of migration, or continued flows. We find important results that shed light on the flows and their continuity. One common thread identified in the findings is the correlation between the dependent variables (amounts received, motivation to migrate or expectation of future flows) and unemployment or the migrant’s motivation to emigrate due to lack of jobs in the home country.
i) Determinants of remittance transfers
Here, we look at factors influencing the amount of money received. The literature on remittance determinants generally looks at demographic factors among recipients and features related to receiving remittances. We include a model that also seeks to capture factors such as migration and demographics of senders.
Amount of remittances = demographics (recipients) + demographics (senders) + remittances + migration2
The results presented below show that recipients tend to receive more money over time, particularly when the lack of jobs is an issue. Seasonal status of a migrant positively correlates with amounts sent, as well as when the reason to migrate is lack of a job. The country of destination does not determine the amount sent, but the desire to migrate, as well as the expectation of receiving more money, positively correlates with the amount received. Also notable is the negative correlation between the sender and recipient’s age and the amount received; younger cohorts are more likely to send and receive more money. One issue that points to this is the ages of both groups, which are relatively similar with a standard deviation of 10 years. Finally, transferring remittances through bank deposits increases the amount received by 30 percent.
TABLE 19: REGRESSION RESULTS ON DETERMINANTS OF REMITTANCE RECEIVED3 I OLS regression DV: natural logarithm of annual remittances II Multivariate ordered logit regression DV: annual remittances in categories
Significance Signif.
I II
recipient
Age -0.08 *** -0.11 *** Gender 0.03 -0.34 *** Education -0.04 ** -0.15 *** number of unemployed in the HOUSEHOLD 0.01 0.06 * # of years sent 0.02 *** 0.04 *** Regularity 0.01 1.72 ***
method of sending bank account 0.26 1.12 *
MTO -0.02 -0.13 Brokerage -0.17 -0.37
2 Demographics: age, gender, education, relation to HHH, occupation; Remittances: regularity, country, transfer method; Migration:
length of time abroad, planning to come back, seasonal/permanent, reason for migration. 3 Two separate regression models were employed. The first relied on an OLS regression using the log value of remittance received.
The second model was a logit regression using annual remittances received by value range.
14 REMITTANCE TRANSFERS TO ARMENIA: PRELIMINARY SURVEY DATA ANALYSIS
I OLS regression DV: natural logarithm of annual remittances II Multivariate ordered logit regression DV: annual remittances in categories
Significance Signif.
I II Cash -0.24 -0.52
sender
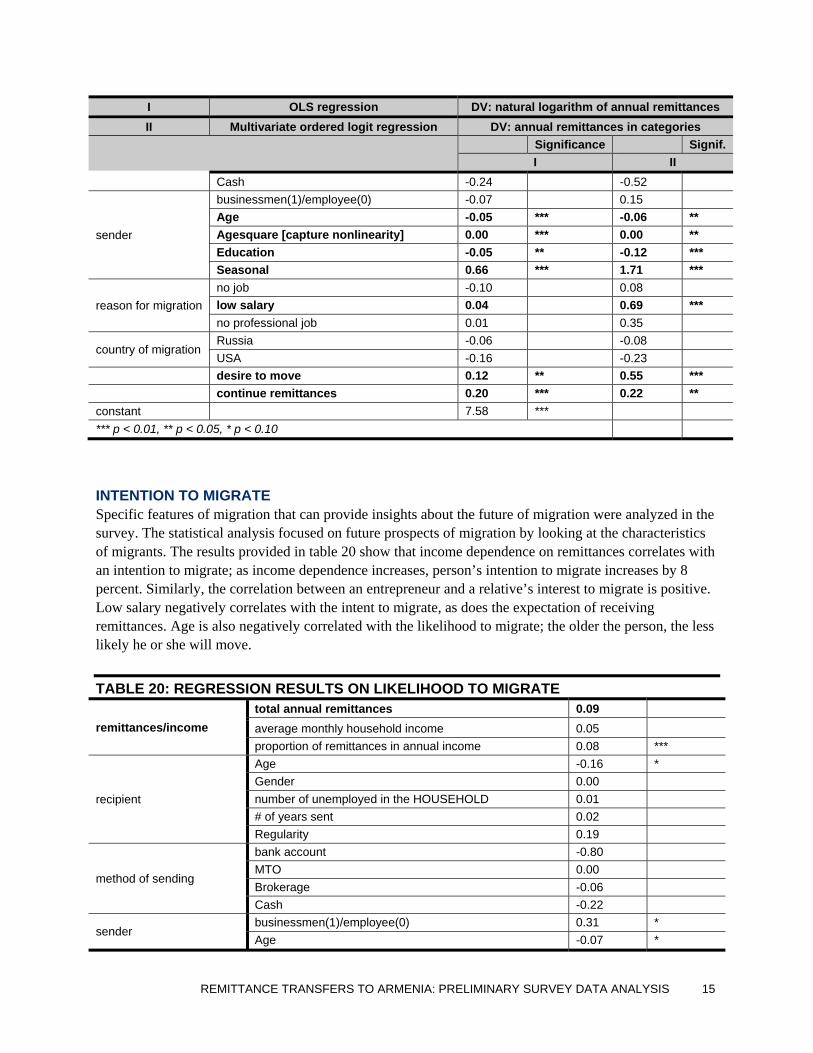
businessmen(1)/employee(0) -0.07 0.15 Age -0.05 *** -0.06 ** Agesquare [capture nonlinearity] 0.00 *** 0.00 ** Education -0.05 ** -0.12 *** Seasonal 0.66 *** 1.71 ***
reason for migration no job -0.10 0.08 low salary 0.04 0.69 *** no professional job 0.01 0.35
country of migration Russia -0.06 -0.08 USA -0.16 -0.23
desire to move 0.12 ** 0.55 *** continue remittances 0.20 *** 0.22 ** constant 7.58 *** *** p < 0.01, ** p < 0.05, * p < 0.10
INTENTION TO MIGRATE Specific features of migration that can provide insights about the future of migration were analyzed in the survey. The statistical analysis focused on future prospects of migration by looking at the characteristics of migrants. The results provided in table 20 show that income dependence on remittances correlates with an intention to migrate; as income dependence increases, person’s intention to migrate increases by 8 percent. Similarly, the correlation between an entrepreneur and a relative’s interest to migrate is positive. Low salary negatively correlates with the intent to migrate, as does the expectation of receiving remittances. Age is also negatively correlated with the likelihood to migrate; the older the person, the less likely he or she will move.
TABLE 20: REGRESSION RESULTS ON LIKELIHOOD TO MIGRATE
remittances/income total annual remittances 0.09 average monthly household income 0.05 proportion of remittances in annual income 0.08 ***
recipient
Age -0.16 * Gender 0.00 number of unemployed in the HOUSEHOLD 0.01 # of years sent 0.02 Regularity 0.19
method of sending
bank account -0.80 MTO 0.00 Brokerage -0.06 Cash -0.22
sender businessmen(1)/employee(0) 0.31 * Age -0.07 *
REMITTANCE TRANSFERS TO ARMENIA: PRELIMINARY SURVEY DATA ANALYSIS 15

Agesquare 0.00 Education 0.01 Seasonal -0.35 **
reason for migration low salary -0.30 * no professional job 0.07 *
country of migration Russia 0.01 continue remittances -0.33 ** increase in amount sent compared to 2005 0.17
constant 0.20 *** p < 0.01, ** p < 0.05, * p < 0.10
DETERMINANTS OF THE CONTINUITY OF FLOWS The expectation of receiving more money over time, which applied to two-thirds of recipients, shows a correlation with different variables. Those interested in migrating demonstrate a positive correlation with their expectation of receiving remittances. Ceteris paribus, this statistic may support the thesis that receiving remittances becomes an incentive for migration as the flows may operate as a proxy for the opportunities offered at the remittance-source country. Also, other interesting findings are that those receiving more money are less likely to expect the flows to continue over time, but those with higher incomes, but more dependence on remittances, are more likely to expect greater flows. Similarly, older recipients expect to continue to receive more money in the future, and unemployment in the household also correlates positively with the expectation of future flows.
TABLE 21: CONTINUITY OF REMITTANCES: REGRESSION RESULTS desire to move (0.69) ***
remittances/income total annual remittances (0.39) *** average monthly household income 0.13 * proportion of remittances in annual income 0.22 ***
recipient
Age 0.10 * Gender 0.22 number of unemployed in the HOUSEHOLD 0.11 * # of years sent 0.06 *** regularity 0.56
method of sending
ba 1.93 ** MTO 0.88 *** brokerage 0.40 cash 1.02 *** businessmen(1)/employee(0) 0.36 *
sender
age 0.03 agesquare (0.00) education 0.18 *** seasonal (0.11)
reason for migration low salary (0.64) *** no professional job (0.27)
country of migration Russia (0.27) increase in amount sent compared to 2005 0.60 ***
*** p < 0.01, ** p < 0.05, * p < 0.10
16 REMITTANCE TRANSFERS TO ARMENIA: PRELIMINARY SURVEY DATA ANALYSIS

E. PRELIMINARY SURVEY ESTIMATE OF REMITTANCES Estimates of remittance transfers depend on the method utilized and unit of analysis employed. In the first case, some studies use the propensity to remit or receive remittances as the estimating method, while others employ the actual amount sent or received. In the second case, some studies use the recipient household as a unit of analysis, others use the remitting individual.
There is little rationale as to why one choice is preferred over the other, but when the receiving household is used as the unit of analysis, the amounts reported and estimated are significantly lower. Choosing a method often depends on the underlying assumptions of analysts. However, one practical validation procedure consists of looking at the average amount transferred by migrants, as reported by the originator or the distribution business, and the number of migrants. This number often coincides more with the individual as the unit of analysis rather than the household.
Using the household as the unit of analysis often leaves out the true number of recipients because often, those surveyed are not fully aware of how many members receive money in the household. In other cases, one household receives money from more than one migrant. When looking at migrant households in the country of destination, the problem most noticed is that very often more than two or three migrants who remit live in the same household. This is particularly acute in cases of explicit labor migration, where four migrants share an apartment to deal with the costs of living in major global cities.
Here we present different estimates of remittance flows to Armenia where we apply several methods. Although there is no chosen method, a preferred and recommended procedure consists of estimating the flow by using: 1) the percent of migrant remitters as the unit of analysis, 2) the annual amount transferred as reported by them or their families, and 3) the number of households they remit to in Armenia. One important reason is that migration from Armenia is predominantly economic and oriented to increase earnings to remit back home. These migrants, in the majority, remit to their families and are significantly engaged on a regular basis as individual remitters to different households in their country of origin.
The amount of remittances received annually reported by the Central Bank of Armenia (CBA) predominantly comes from data provided by banks and money transfer agencies, and less from informal networks. However, using survey data, the CBA estimates that 219,695 households receive remittances. Moreover, data on migrants shows that there are 603,530 Armenians working abroad and estimated to remit from a total of 780,509 migrants.4
TABLE 22: UNITS OF ANALYSIS AND ITS SIZE FOR THE ARMENIAN CASE Sender Recipient
Household 151,000 219,695 Individual 600,000 Source: CBA Survey of remittance recipients and senders. Data on migrants comes from GMOD database and takes 80% from all migrants, as those who remit. The methods displayed below describe the different procedures to estimate remittances:
a) Annual average by method and number of households receiving or migrants sending
4 GMOD database.
REMITTANCE TRANSFERS TO ARMENIA: PRELIMINARY SURVEY DATA ANALYSIS 17

R =Annual average from specific method X Percent sending through that method X Number of households receiving remittances;
R =Annual average from specific method X Percent sending through that method X Number of migrants sending remittances;
b) The average annual amount received as a share of income and weighted to the number of migrants:
Remittances = Annual average household income X Percent of remittances in household income X Number of households receiving remittances
c) Average annual amount received by the number of migrants sending to the number of households receiving (1.35)
Remittances = annual inflow received X migrants senders X households receiving
According to the survey, the annual average reported by remittance recipient households amounts to $1,600
Using the first two estimation procedures, the results show that when the household is the unit of analysis, the aggregate volume amounts to less than US$400 million received, while if the migrant is the unit of analysis, nearly US$ 1 billion is received. Table 23 shows these results by method sent, and Table 24 shows the estimate of remittances using income as a variable.
A third estimate we used includes the coefficient of households receiving remittances from more than one migrant, as well as the coefficient of a migrant remitting to more than one household. The survey shows that 63 percent of people say they receive from one migrant and that their relative only remits to that household.
TABLE 23: PRELIMINARY ESTIMATES: REMITTANCES BY HOUSEHOLD OR MIGRANTS
Method Annual average (%) Estimate 1 (603,530)
Estimate 2 (219,696)
bank account 3700 0.87 19,533,424 7,434,178 by providing passport 1973. 7.87 93,760,434 35,684,053 MTO 1743 68 714,079,464 271,769,749 brokerage offices 1140 5.5 37,800,026 14,386,219 authorized used card 5000 0.035 1,055,861 401,847 cash 1018 17.00 104,530,213 39,782,897 postal wire transfer 563 0.28 950,275 361,663 other 2344 0.56 7,918,956 3,013,856 Total 1623 100 979,628,652 372,834,462
Estimate 1: migrants; Estimate 2: households
18 REMITTANCE TRANSFERS TO ARMENIA: PRELIMINARY SURVEY DATA ANALYSIS
REMITTANCE TRANSFERS TO ARMENIA: PRELIMINARY SURVEY DATA ANALYSIS 19
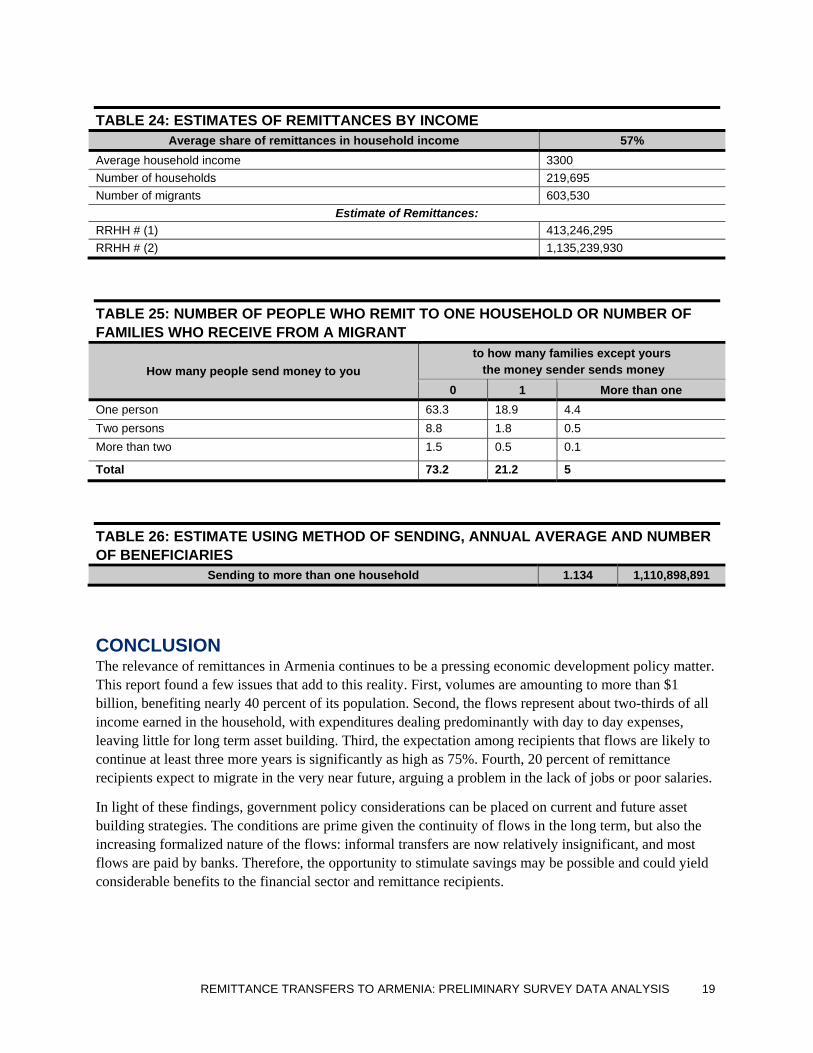
TABLE 24: ESTIMATES OF REMITTANCES BY INCOME Average share of remittances in household income 57%
Average household income 3300 Number of households 219,695 Number of migrants 603,530
Estimate of Remittances: RRHH # (1) 413,246,295 RRHH # (2) 1,135,239,930
TABLE 25: NUMBER OF PEOPLE WHO REMIT TO ONE HOUSEHOLD OR NUMBER OF FAMILIES WHO RECEIVE FROM A MIGRANT
How many people send money to you to how many families except yours the money sender sends money
0 1 More than one One person 63.3 18.9 4.4 Two persons 8.8 1.8 0.5 More than two 1.5 0.5 0.1
Total 73.2 21.2 5
TABLE 26: ESTIMATE USING METHOD OF SENDING, ANNUAL AVERAGE AND NUMBER OF BENEFICIARIES
Sending to more than one household 1.134 1,110,898,891
CONCLUSION The relevance of remittances in Armenia continues to be a pressing economic development policy matter. This report found a few issues that add to this reality. First, volumes are amounting to more than $1 billion, benefiting nearly 40 percent of its population. Second, the flows represent about two-thirds of all income earned in the household, with expenditures dealing predominantly with day to day expenses, leaving little for long term asset building. Third, the expectation among recipients that flows are likely to continue at least three more years is significantly as high as 75%. Fourth, 20 percent of remittance recipients expect to migrate in the very near future, arguing a problem in the lack of jobs or poor salaries.
In light of these findings, government policy considerations can be placed on current and future asset building strategies. The conditions are prime given the continuity of flows in the long term, but also the increasing formalized nature of the flows: informal transfers are now relatively insignificant, and most flows are paid by banks. Therefore, the opportunity to stimulate savings may be possible and could yield considerable benefits to the financial sector and remittance recipients.