Remedial Systems Optimization - Omer Uppal Presentation at Langan Remediation Summit Oct 2014
38
Omer Uppal Senior Project Manager / Engineer - Remediation Technology REMEDIAL SYSTEM OPTIMIZATION
-
Upload
omer-uppal -
Category
Documents
-
view
87 -
download
1
Transcript of Remedial Systems Optimization - Omer Uppal Presentation at Langan Remediation Summit Oct 2014

Omer Uppal
Senior Project Manager / Engineer - Remediation Technology
REMEDIAL SYSTEM
OPTIMIZATION
PRESENTATION OUTLINE:
Remedial Optimization Concepts
Air Sparge Implementation for Treatment of VOCs, SVOCs, and Arsenic
Integrated SVE and VM for Complex Building Foundations
Pump and Treat Implementation for Containment of a PCE Plume in Bedrock
Implementation of Hydraulic Optimization for Groundwater Recovery System
ISCO of TCE-Impacted Groundwater in Bedrock Through an Enhanced Fracture Network

OPTIMIZATION – WHAT DOES IT MEAN?
Efforts vs. Time with Remedial Optimization
(U.S. Navy 2003, ITRC 2004)
Efforts vs. Time in Typical Remedial Actions
(U.S. Navy 2003, ITRC 2004)
Goal: “Reduce the cost as well as time to meet remedial objectives and remain protective of
human health and the environment”

WHY OPTIMIZE?
OBJECTIVES Reduce Capital Costs
Reduce OM&M Costs
Reduce Remedial Timeframe
Increase Remedial Efficiency
Increase Performance
Increase Protectiveness – Reduce Risk
Improve Sustainability
Improve Quality
All or a Combination of Above Multi-Objective Decision Making

OPTIMIZE WHEN?
REMEDY OPTIMIZATION PROCESS Track 1 - Optimize During Planning
Track 2 - Optimize During Implementation Planning
Phase
Implementation Phase
Long-Term
Optimization
(NAVFAC Optimization Workgroup Website: https://www.navfac.navy.mil/navfac_worldwide/specialty_centers/exwc/products_and_services/ev/erb/wg/opt.html)

OPTIMIZE HOW?
PROCESS ELEMENTS
Review and evaluate RA objectives and conceptual site
model (CSM)
Evaluate remediation effectiveness
Evaluate cost efficiency
Evaluate remediation alternatives
Evaluate technology alternatives
Develop and prioritize optimization strategies
Prepare optimization report
Implement optimization strategy

TRACK 1 - OPTIMIZE DURING PLANNING
PLAN
Upfront planning for the life-cycle of remedy
STRATEGIZE
Concurrent or sequential use of multiple remedial technologies targeting various sections of a source / plume
Use of several different unit processes within a single treatment system
Integrated / hybrid remedial technology use
DESIGN
Design for the entire life of the cleanup, not just the initial conditions
Allow room for future upgrades or upgrade now for future needs
(NAVFAC Optimization Workgroup, November 2012)

DESIGN CONSIDERATIONS
Evaluate pulsing
Use mass flux calculations
Use F&T models for better prediction of remedy
performance
Use pneumatic models
Lease/purchase equipment
Design mobile systems
Use of passive delivery systems
Use standard designs and parts
Plan for intermittent operation
Evaluate process control options
Consider sustainability during design phase
Apply multiple remedial technologies, where
applicable

TRACK 2 - OPTIMIZE DURING IMPLEMENTATION
EVALUATE
Evaluate remedy performance
Determine the need for system optimization or remedial approach
Optimization alternatives analysis
Perform cost/benefit analysis
IMPLEMENT
Optimize the exit strategy, or
Optimize the remedial system, or
Optimize the monitoring program, or
All of above
MONITOR
Track improved performance
Track cost benefits
Track time to completion
Typical Remedial Progress Curve
(NAVFAC Optimization Workgroup, November 2012)

OPTIMIZE LONG-TERM MANAGEMENT
PROCESS ELEMENTS
Program goals
Monitoring point locations
Monitoring frequency
Monitoring parameters
Sample collection methods
Data evaluation and presentation
Regulatory acceptance
(NAVFAC Optimization Workgroup, November 2012)

AIR SPARGE
IMPLEMENTATION
FOR TREATMENT OF
VOCs, SVOCs,
AND ARSENIC

SITE BACKGROUND
Former manufacturing facility with active lagoon operations through 1954 and backfilled between 1967 and 1970
Benzene, VOCs, SVOCs, and heavy metals (i.e., Arsenic) in soil and groundwater
Former biosparge system operation from 2002 through 2012 - Model predicted cleanup time frames >> 50 years
GW Flow Direction
AIR SPARGE TARGET AREA

REMEDIAL OPTIMIZATION STRATEGY
EXCAVATION
Removal and off-site disposal of approximately 2,200 tons of NAPL impacted soil - October 2012
PULSED AIR SPARGE SYSTEM
VOCs / BTEX
Volatilization / Stripping
Aerobic biodegradation
PHARMACEUTICALS (Phenol) and ALCOHOLS (Ethanol)
Aerobic biodegradation
METALS (Arsenic)
Co-precipitation with dissolved minerals (i.e., iron and calcium)
Sorption on metal / iron oxy-hydroxides SEM images of Fe-Al-Si oxy-hydroxide
precipitate formed in
groundwater
(EDS analytical spectra)
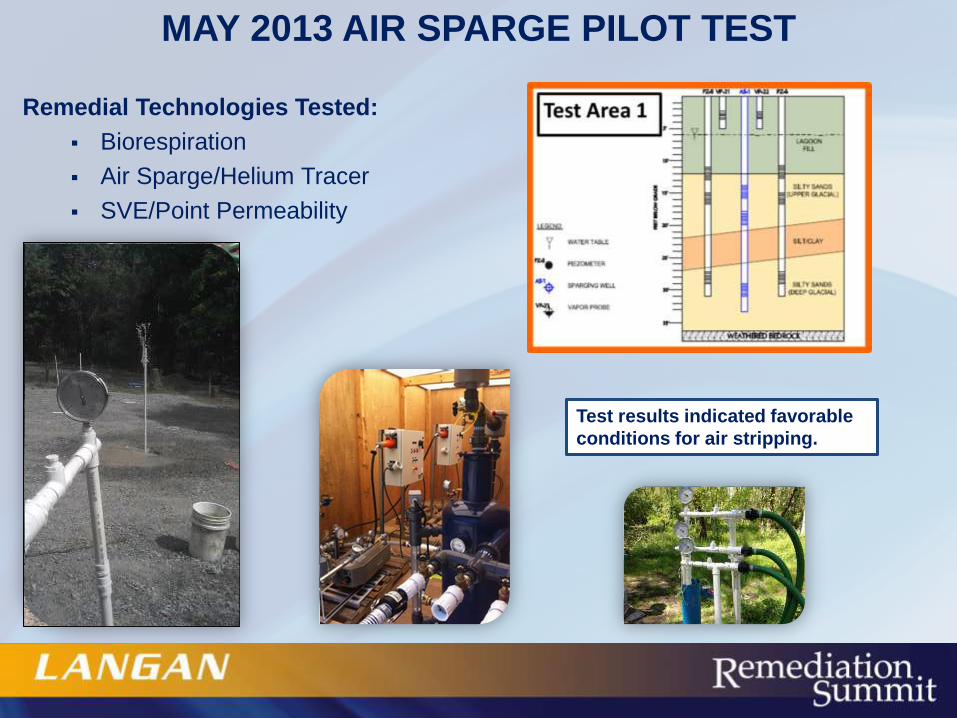
MAY 2013 AIR SPARGE PILOT TEST
Remedial Technologies Tested:
Biorespiration
Air Sparge/Helium Tracer
SVE/Point Permeability
Test results indicated favorable
conditions for air stripping.

PNEUMATIC MODELING
Modeling resulted in a more cost-
effective optimization strategy.

OPTIMIZATION DESIGN STRATEGY
DESIGN COMPONENTS
53 multi-level air sparge wells
41 horizontal vapor collection wells
17 vapor vent wells
11 chimney wells
2 dry wells
3-ft Clean Fill Cap
Pulsing Strategy

OPTIMIZATION BENEFITS
System Construction Ongoing
Startup planned for January 2015
Anticipated Cleanup Timeframe - 3 to 5 years
• Reduced Cleanup Timeframe
• Cost Savings
• More innovative, cost effective, and sustainable in-situ
remediation technology than excavation

INTEGRATED SVE AND VM FOR COMPLEX
BUILDING FOUNDATIONS

INTEGRATED SVE AND VM, MANHATTAN, NYC
SITE BACKGROUND
Active dry cleaning facility through June 2013
Residential dwellings located on floors two through five
Indoor air assessment - PCE and TCE in exceedance of
NYSDOH Vapor Intrusion Guidance Matrix
2-6 inch thick concrete slab with granite bedrock beneath
Limited space/access constraints
Possible demolition of building during operation period
OPTIMIZATION STRATEGY
Pilot test and pneumatic modeling
Integrated SVE and VM approach
Equipment was sized so that the system can be
expanded in the future, if warranted.
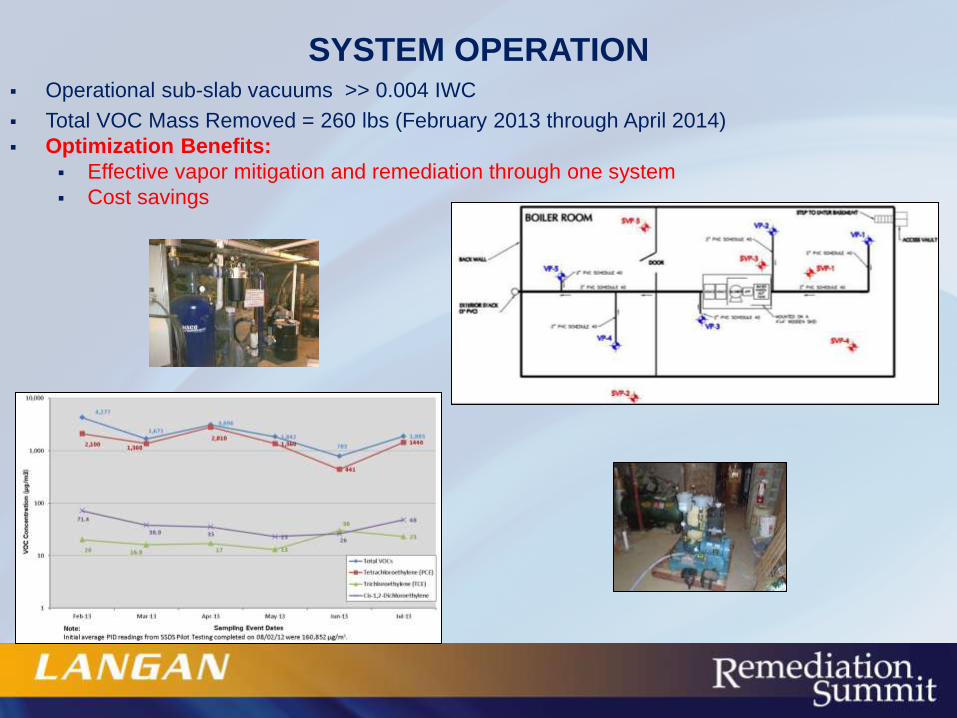
Operational sub-slab vacuums >> 0.004 IWC
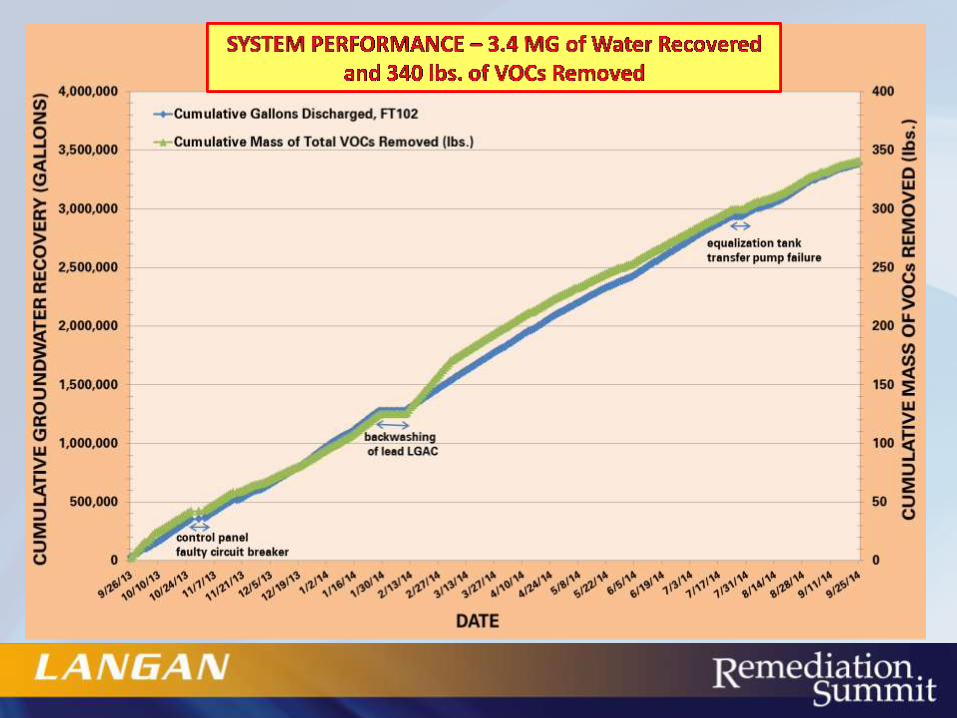
Total VOC Mass Removed = 260 lbs (February 2013 through April 2014)
Optimization Benefits:
Effective vapor mitigation and remediation through one system
Cost savings
SYSTEM OPERATION

INTEGRATED SVE AND VM, NORTHERN NJ

SYSTEM IMPLEMENTATION
Pilot test and pneumatic modeling
Equipment sizing for potential system expansion
System activated in September 2014
Operational sub-slab vacuums >> 0.004 IWC
Initial VOC mass removal rate = 0.25 lbs/day
OPTIMIZATION BENEFITS
Effective Vapor Intrusion Mitigation
Source Mass Removal
Cost Savings
Reduced Remedial Timeframes

PUMP AND TREAT
IMPLEMENTATION FOR
CONTAINMENT OF A
PCE PLUME IN
BEDROCK

Municipal Well
RW-1
RW-2
RW-3
RW-4
RW-5
RW-6
SITE BACKGROUND

SYSTEM DESIGN
OPTIMIZATION STRATEGY PCE plume containment in a complex
geology – Interbedded Shale and
Sandstone lenses
Mass Removal
Equipment sizing for potential future
expansion
Vapor Pressure > 1.0 mm Hg
PCE 14 TCE 58
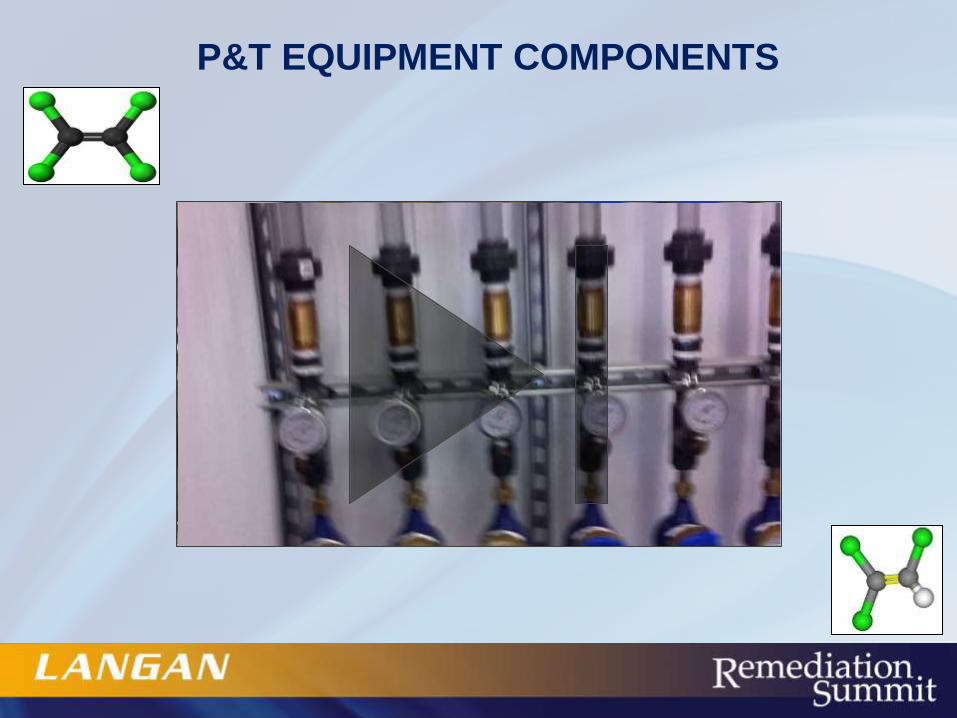
P&T EQUIPMENT COMPONENTS

IMPLEMENTATION OF HYDRAULIC
OPTIMIZATION FOR GROUNDWATER
RECOVERY SYSTEM

GROUNDWATER MODEL CONSTRUCTION
Regional Groundwater Model Grid
(Nine model layers encompassing
an area of 130 square miles)
Close-up of refinery property
NORTH
River
50x vertical exaggeration
River
1 Mile
Refinery
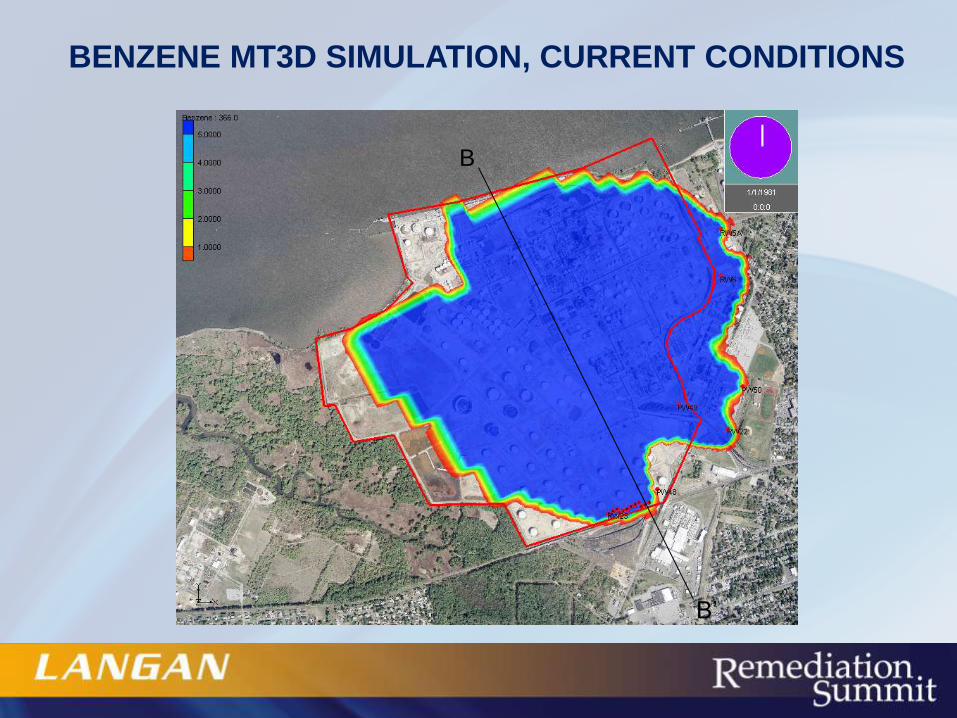
BENZENE MT3D SIMULATION, CURRENT CONDITIONS
B
B’

OPTIMIZED SYSTEM PUMPING RATES
PW-52
PW-51
RW-28
RW-6
RW-22
PW-49
PW-48
PW-50
RW-23
RW-5A
OPTIMIZATION BENEFITS
Effective Containment
Reduced Pumping Rates
Reduced OM&M Costs

ISCO OF TCE-IMPACTED GROUNDWATER IN
BEDROCK THROUGH AN ENHANCED FRACTURE
NETWORK

SITE BACKGROUND
TCE plume occupies an area of approximately 3 million ft2.
Poorly connected fractures form a complex network with low hydraulic connectivity
DNAPL Source Zone Pilot Tests
Implementation of SVE Pilot Test – 2003
Implementation of ISCO Pilot Test – 2003
9 blast fracture trenches and 327 blast/injection
boreholes totaling approximately 21,400 linear
feet installed to facilitate chemical oxidant
injections – 2006
NOVEMBER 2005
JANUARY 2008
51,024 GALLONS (31,320 LBS.) OF 2.5% POTASSIUM PERMANGANATE & 10% SODIUM PERMANGANATE SOLUTION
INJECTED FROM 2003 TO 2009
SEPTEMBER 2011

REMEDIAL OPTIMIZATION IMPLEMENTATION
Additional injections October through November 2011
Mitigate the residual “source” of TCE groundwater plume with
concentrations greater than 1,000 ppb
43,200 gallons (9,151 lbs.) 2.5% Potassium Permanganate solution
injected into 32 intermediate injection wells and 8 deep injection wells
6 deep injection wells and 1 intermediate injection well were hydro-
fractured to facilitate chemical oxidant injections.
Overnight gravity feed to facilitate improved injection rates.
OPTIMIZATION BENEFITS
Source Treatment
Reduction in size of groundwater
plume
Reduction in average TCE
concentrations by 88%
Technical Impracticability
Waiver
Substantial Cost Savings

REMEDIAL ACTION RESULTS:
INTERMEDIATE ZONE

CONCLUSIONS
Upfront planning for the life-cycle of remedy is critical: Design for the entire life of the
cleanup, not just the initial conditions.
Establish performance objectives for each component of treatment train.
Define effective operational range of technology: Identify when to discontinue use of
a specific technology once it’s no longer operating within its pre-determined cost
effective range.
Pulsing of Air Sparge / SVE / MPE / P&T systems can result in improved remedial
efficiency and sustainability under mass transfer limiting conditions.
Cost-effective remediation will likely require transitioning between multiple treatment
technologies.
Optimization can result in substantial cost savings, reduce cleanup timeframe, and
increase protectiveness of a remedial system.

QUESTIONS??