Remedial Action Progress Report - Lockheed Martin
97
Remedial Action Progress Report Former Lockheed Electronics Company 1301 Route 22 West Watchung, New Jersey ISRA Case No. 90038 Prepared by: TRC 57 East Willow Street Millburn, New Jersey 07041 October 2006
Transcript of Remedial Action Progress Report - Lockheed Martin
Remedial Action Progress Report
Former Lockheed Electronics Company 1301 Route 22 West
Watchung, New Jersey
ISRA Case No. 90038
Prepared by:
TRC 57 East Willow Street
Millburn, New Jersey 07041
October 2006

Remedial Action Progress Report Former LEC Site
\\Millburn-fp1\JobFolders\2501-3000\2542\Documents (WIP)\Reports (WIP)\March 2006 Annual Report\RAPR throughMarch2006.doc
October 2006 Page i
TABLE OF CONTENTS Section No. Title Page No.
1.0 INTRODUCTION 1
2.0 GROUND WATER MONITORING AND SAMPLING ACTIVITIES 2 2.1 September/October 2005 Ground Water Sampling Event 2
2.1.1 Water-Level Measurements (September/October 2005) 2 2.1.2 Ground Water Sample Collection (September/October 2005) 2 2.1.3 Summary of Ground Water Results (September/October 2005) 3
2.2 March 2006 Ground Water Sampling Event 4 2.2.1 Water-Level Measurements (March 2006) 4 2.2.2 Ground Water Sample Collection (March 2006) 4 2.2.3 Summary of Ground Water Results (March 2006) 4
3.0 SURFACE WATER MONITORING AND SAMPLING ACTIVITIES 5 3.1 Surface Water Monitoring and Sampling 5 3.2 Summary of Surface Water Results 5
4.0 SYSTEM PERFORMANCE MONITORING AND SAMPLING 6
5.0 CONCLUSIONS 7

Remedial Action Progress Report Former LEC Site
\\Millburn-fp1\JobFolders\2501-3000\2542\Documents (WIP)\Reports (WIP)\March 2006 Annual Report\RAPR throughMarch2006.doc
October 2006 Page ii
LIST OF FIGURES Figure No. Title
1 Site Location Map 2 Site Plan 3 Shallow Zone Contour Map (9/7/05) 4 Intermediate Zone Contour Map (9/7/05) 5 Deep Zone Contour Map (9/7/05) 6 Shallow Zone Contour Map (3/6/06) 7 Intermediate Zone Contour Map (3/6/06) 8 Deep Zone Contour Map (3/6/06) 9 Quarterly Ground Water Sampling Results September 2003 – March 2006 10 Surface Water Sampling Results July 2003 – March 2006
LIST OF TABLES
Table No. Title
1 Revised Water Monitoring & Sampling Schedule 2 Ground Water Elevation Data 3 Hydrostratigraphic Classification 4 Ground Water Analytical Results-September/October 2005 and March 2006 5 Historical TCE Concentrations in Ground Water 6 Surface Water Analytical Results-July 2005 through March 2006 7 Historical TCE Concentrations at Stream Locations 8 System Performance Summary

Remedial Action Progress Report Former LEC Site
\\Millburn-fp1\JobFolders\2501-3000\2542\Documents (WIP)\Reports (WIP)\March 2006 Annual Report\RAPR throughMarch2006.doc
October 2006 Page iii
LIST OF APPENDICES Appendix Title
A Contour Map Reporting Forms
B Plots of TCE Concentrations Versus Time for Selected Monitoring Wells
C Stream Sampling Field Measurements
D Plots of TCE Concentrations Versus Time for Stream Locations

Remedial Action Progress Report Former LEC Site
\\Millburn-fp1\JobFolders\2501-3000\2542\Documents (WIP)\Reports (WIP)\March 2006 Annual Report\RAPR throughMarch2006.doc
October 2006 Page iv
LIST OF ATTACHMENTS
Surface Water Laboratory Data Package (STL Job C196)-July 2005 Surface Water Laboratory Data Package (STL Job D781)-August 2005
Ground Water and Surface Water Laboratory Data Package (STL Job F147)-September 2005
Ground Water and Surface Water Laboratory Data Package (STL Job H260)-October 2005 Surface Water Laboratory Data Package (STL Job J388)-November 2005 Ground Water and Surface Water Laboratory Data Package (STL Job O318)-March 2006 Ground Water Laboratory Data Package (STL Job O861)-March 2006

Remedial Action Progress Report Former LEC Site
\\Millburn-fp1\JobFolders\2501-3000\2542\Documents (WIP)\Reports (WIP)\March 2006 Annual Report\RAPR throughMarch2006.doc
October 2006 Page v
CERTIFICATION The following certification shall be signed as follows:
1. For a corporation, by a principal executive officer of at least the level of vice president;
2. For a partnership or sole proprietorship, by a general partner or the proprietor, respectively, or;
3. For a municipality, State, Federal or other public agency, by either a principal executive officer or ranking elected official.
4. For persons other than 1 through 3 above, by the person with legal responsibility for the site.
“I certify under penalty of law that I have personally examined and am familiar with the information submitted herein and all attached documents, and that based on my inquiry o f those individuals immediately responsible for obtaining the information, to the best of my knowledge, I believe that the submitted information is true, accurate and complete. I am aware that there are significant civil penalties for knowingly submitting false, inaccurate or incomplete information and that I am committing a crime of the fourth degree if I make a written false statement which I do not believe to be true. I am aware that if I knowingly direct or authorize the violation of any statute, I am personally liable for the penalties.” Type/Printed Name Title Signature Company Sworn to and subscribed before me on this ______________ day of October 2006. Notary [seal]

Remedial Action Progress Report Former LEC Site
\\Millburn-fp1\JobFolders\2501-3000\2542\Documents (WIP)\Reports (WIP)\March 2006 Annual Report\RAPR throughMarch2006.doc
October 2006 Page 1
1.0 INTRODUCTION
TRC Environmental Corporation (TRC) has prepared this Remedial Action Progress Report (RAPR) for the former Lockheed Electronics Company (LEC) site in Watchung, New Jersey (The site is now operating as the Watchung Square Mall). Figure 1 is a portion of the USGS Chatham, NJ 7.5 Minute Quadrangle depicting the site location, local topography, surface drainage, and cultural patterns. A ground water extraction system (GWES) was activated on July 17, 2003. Ground water is pumped from extraction well RW-1, located on North Drive in North Plainfield, at an approximate rate of 130 gallons per minute (gpm). In addition, shallow ground water is extracted intermittently from an interceptor trench located on New Jersey Department of Transportation (NJDOT)-owned land on the northeast corner of Route 22 and North Drive. Extracted ground water is treated by granular activated carbon in a treatment plant located on the NJDOT-owned land adjacent to North Drive, and discharged to Crab Brook in accordance with NJPDES permit No. NJ0105899G. The GWES has worked almost continuously from start-up and has functioned as designed. An extensive monitoring well network has delineated a ground water plume comprised primarily of TCE in the local bedrock aquifer and shallow unconsolidated sediments in certain locations. There are currently 42 active monitoring wells and piezometers associated with this project in the Boroughs of Watchung and North Plainfield, all of which are installed as either well couplets or triplets to evaluate the vertical distribution of contaminants. A site plan has been provided (Figure 2) to show the location of the monitoring wells, piezometers, extraction well, interceptor trench, and treatment plant, along with other area features. The last progress report, submitted in October 2005, presented data collected through June 2005. Several sampling activities have occurred since the last report submittal. Quarterly ground water sampling and monthly stream sampling were reduced to semi-annually as approved by the NJDEP in December 2005. The approved sampling schedule is provided as Table 1. Section 2 of this report presents the results of the semiannual ground water sampling events conducted in September/October 2005 and March 2006. Results from the July through November 2005 and March 2006 stream sampling events are presented in Section 3. Section 4 contains monthly system performance results and provides an overview of the GWES.

Remedial Action Progress Report Former LEC Site
\\Millburn-fp1\JobFolders\2501-3000\2542\Documents (WIP)\Reports (WIP)\March 2006 Annual Report\RAPR throughMarch2006.doc
October 2006 Page 2
2.0 GROUND WATER MONITORING AND SAMPLING ACTIVITIES
2.1 September/October 2005 Ground Water Sampling Event
A ground water monitoring and sampling event was conducted in September 2005 in accordance with the sampling schedule presented in Table 1. Several wells (MW-549A, MW-549B, and MW-506B) could not be sampled during the September 2005 event due to obstructions and were sampled in October 2005. Results for the sampling events are presented in the sections below.
2.1.1 Water-Level Measurements (September/October 2005)
Water level measurements were collected on September 7, 2005 in selected monitoring wells associated with the Site. Table 2 provides depth to water (DTW) measurements and water level elevations for this sampling event. The water level elevations were used to prepare ground water contour maps. Ground water flow directions for the water table (overburden/shallow bedrock) zone, the intermediate bedrock zone, and the deeper bedrock zone are depicted on Figures 3 through 5, using the hydrostratigraphic classification presented in Table 3. The ground water elevation for extraction well RW-1 was included on both the shallow and intermediate zone contour maps. These figures indicate that ground water in the bedrock enters the former LEC site from the east, flows across the site to the southwest, and then trends in a more southerly direction toward Crab Brook and beyond. Ground water flow in the shallow and intermediate zones has been altered significantly since the continuous pumping at extraction well RW-1 began in July 2003. A cone of depression is apparent around extraction well RW-1 in both of these zones. In the deeper zone, the effect of pumping is less pronounced and ground water flows south towards Crab Brook and beyond. Contour Map Reporting Forms are presented in Appendix A.
2.1.2 Ground Water Sample Collection (September/October 2005)
Analytical results for the ground water samples collected during this quarterly event are provided in Table 4, and a summary table of historical results for contaminants of concern is provided in Table 5. Concentrations that exceed NJDEP Ground Water Quality Criteria (New Jersey Administrative Code 7:9-6) are highlighted in Table 4. The complete ground water laboratory data packages are included as separate attachments along with the required NJDEP electronic deliverables. Sampling results for the monitoring event are discussed in Section 2.3. At each sampled well location, TRC collected the samples from the passive diffusion bags (PDBs) at selected intervals in the wells and filled the appropriate bottleware for analysis of volatile organic
Remedial Action Progress Report Former LEC Site
\\Millburn-fp1\JobFolders\2501-3000\2542\Documents (WIP)\Reports (WIP)\March 2006 Annual Report\RAPR throughMarch2006.doc
October 2006 Page 3
compounds (VOC+10) using EPA Method 624+10. The samples were submitted to STL Edison (STL) for analysis.
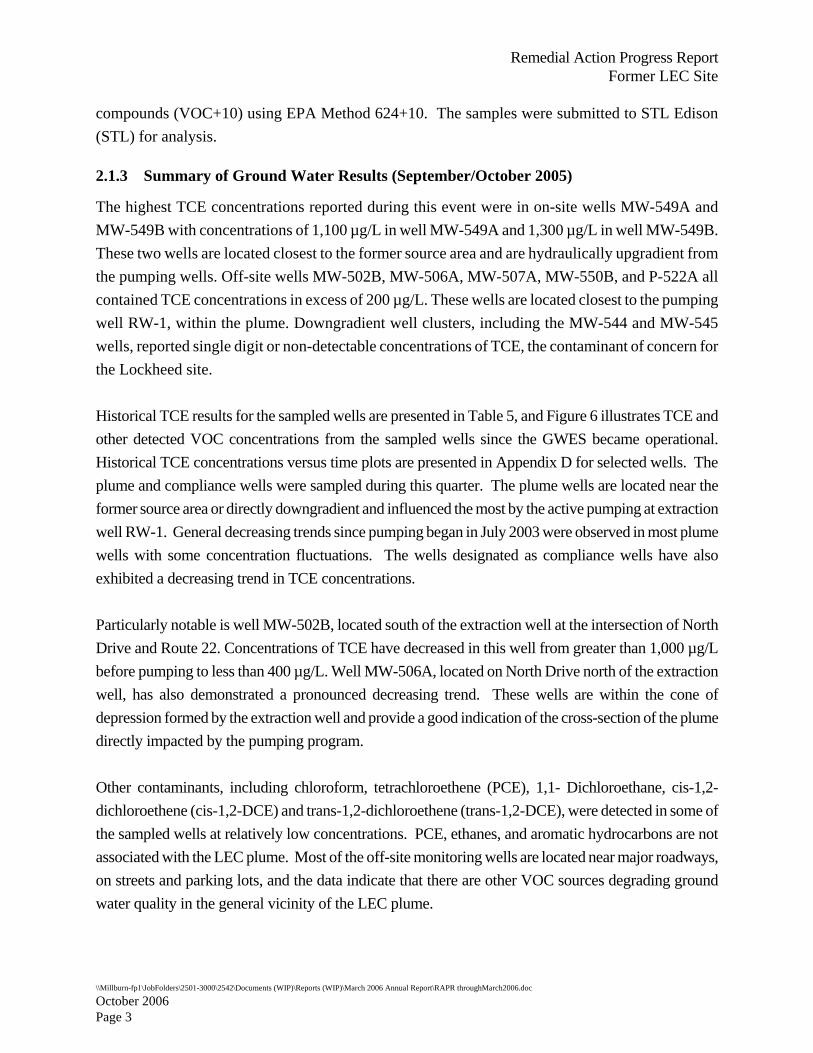
2.1.3 Summary of Ground Water Results (September/October 2005)
The highest TCE concentrations reported during this event were in on-site wells MW-549A and MW-549B with concentrations of 1,100 µg/L in well MW-549A and 1,300 µg/L in well MW-549B. These two wells are located closest to the former source area and are hydraulically upgradient from the pumping wells. Off-site wells MW-502B, MW-506A, MW-507A, MW-550B, and P-522A all contained TCE concentrations in excess of 200 µg/L. These wells are located closest to the pumping well RW-1, within the plume. Downgradient well clusters, including the MW-544 and MW-545 wells, reported single digit or non-detectable concentrations of TCE, the contaminant of concern for the Lockheed site. Historical TCE results for the sampled wells are presented in Table 5, and Figure 6 illustrates TCE and other detected VOC concentrations from the sampled wells since the GWES became operational. Historical TCE concentrations versus time plots are presented in Appendix D for selected wells. The plume and compliance wells were sampled during this quarter. The plume wells are located near the former source area or directly downgradient and influenced the most by the active pumping at extraction well RW-1. General decreasing trends since pumping began in July 2003 were observed in most plume wells with some concentration fluctuations. The wells designated as compliance wells have also exhibited a decreasing trend in TCE concentrations. Particularly notable is well MW-502B, located south of the extraction well at the intersection of North Drive and Route 22. Concentrations of TCE have decreased in this well from greater than 1,000 µg/L before pumping to less than 400 µg/L. Well MW-506A, located on North Drive north of the extraction well, has also demonstrated a pronounced decreasing trend. These wells are within the cone of depression formed by the extraction well and provide a good indication of the cross-section of the plume directly impacted by the pumping program. Other contaminants, including chloroform, tetrachloroethene (PCE), 1,1- Dichloroethane, cis-1,2-dichloroethene (cis-1,2-DCE) and trans-1,2-dichloroethene (trans-1,2-DCE), were detected in some of the sampled wells at relatively low concentrations. PCE, ethanes, and aromatic hydrocarbons are not associated with the LEC plume. Most of the off-site monitoring wells are located near major roadways, on streets and parking lots, and the data indicate that there are other VOC sources degrading ground water quality in the general vicinity of the LEC plume.

Remedial Action Progress Report Former LEC Site
\\Millburn-fp1\JobFolders\2501-3000\2542\Documents (WIP)\Reports (WIP)\March 2006 Annual Report\RAPR throughMarch2006.doc
October 2006 Page 4
2.2 March 2006 Ground Water Sampling Event
A ground water monitoring and sampling event was conducted in March 2006 in accordance with the sampling schedule presented in Table 1. This event included wells sampled on an annual basis. Results for the sampling events are presented in the sections below.
2.2.1 Water-Level Measurements (March 2006)
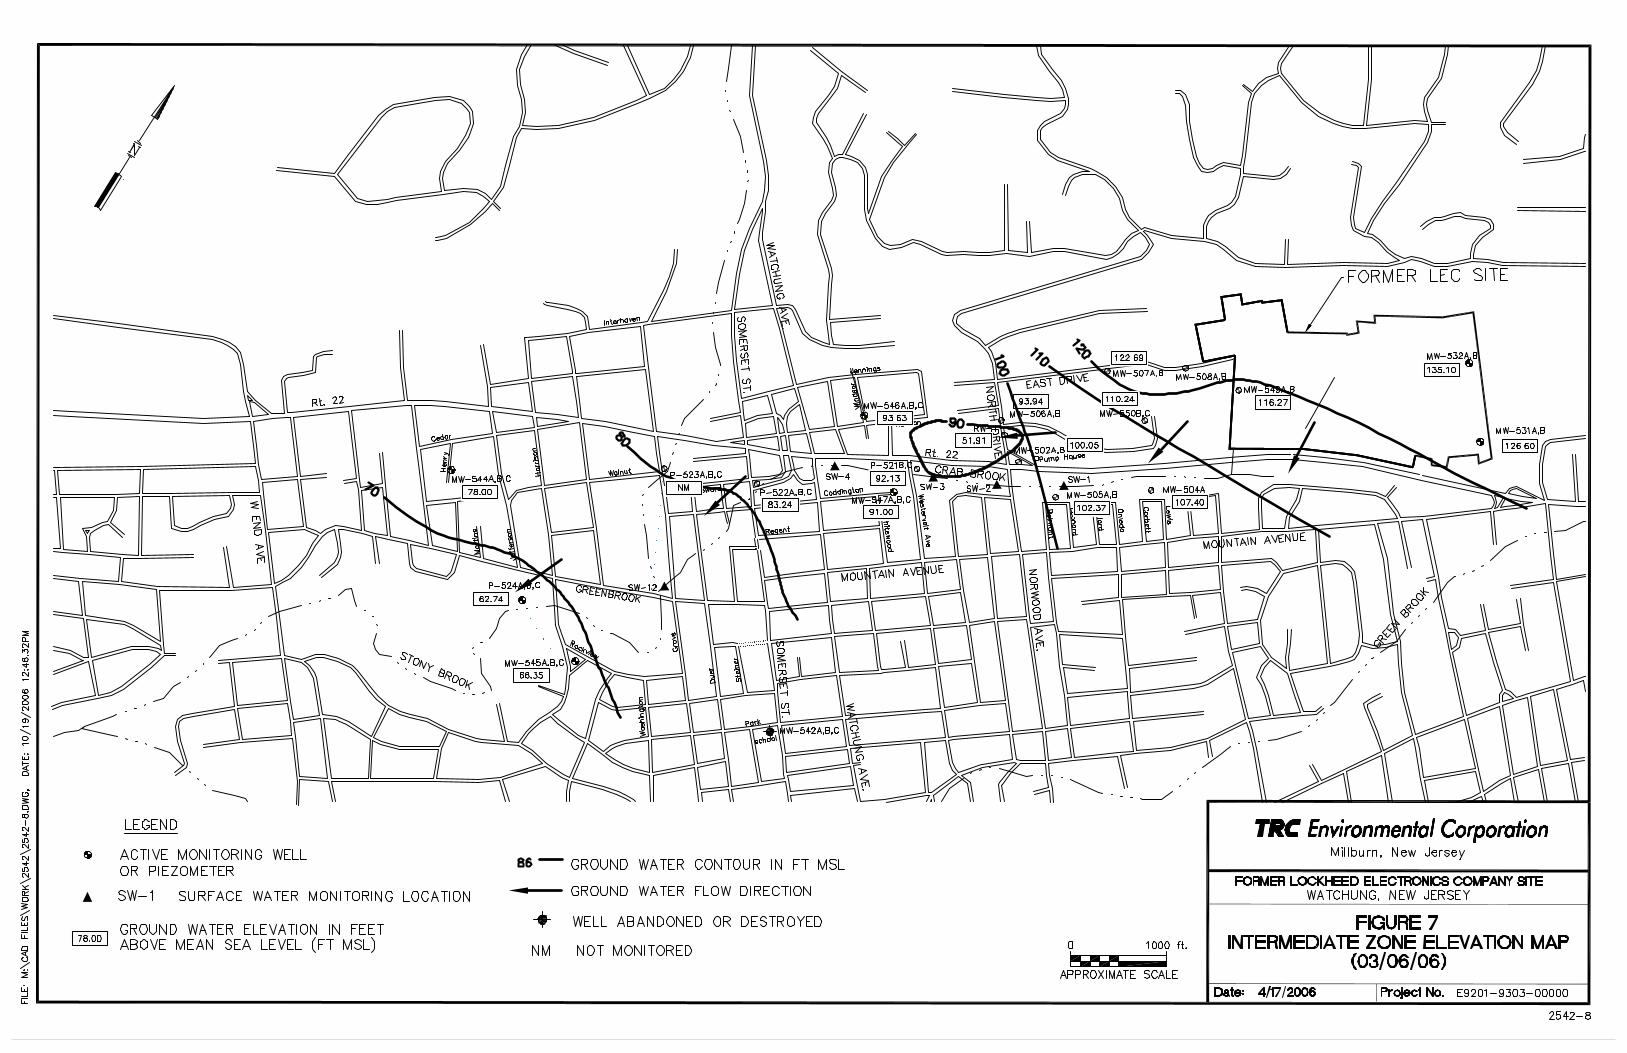
Water level measurements were collected on March 6, 2006 in selected monitoring wells associated with the Site. Table 2 provides depth to water (DTW) measurements and water level elevations for this sampling event. Ground water elevation maps are provided in Figures 6, 7 and 8. The Contour Map Reporting Forms are presented in Appendix A. The ground water flow pattern for the March event is similar to the September event, and is consistent with the last several years of ground water elevation data. Aside from elevation differences associated with precipitation patterns, the ground water flow regime is strongly influenced by the pumping well and has not changed over the last several years of system operation.
2.2.2 Ground Water Sample Collection (March 2006)
Analytical results for the ground water samples collected during this quarterly event are provided in Table 4, and a summary table of historical results for contaminants of concern is provided in Table 5. Concentrations that exceed NJDEP Ground Water Quality Criteria (New Jersey Administrative Code 7:9-6) are highlighted in Table 4. The complete ground water laboratory data packages are included as separate attachments along with the required NJDEP electronic deliverables. Sampling results for the monitoring event are discussed in Section 2.2.3.
2.2.3 Summary of Ground Water Results (March 2006)
The highest TCE concentrations reported during this event were in source wells MW-549A (990 µg/L) and MW-549B (1,400 µg/L). Concentrations of contaminants in the other sampled wells are consistent with the September results.

Remedial Action Progress Report Former LEC Site
\\Millburn-fp1\JobFolders\2501-3000\2542\Documents (WIP)\Reports (WIP)\March 2006 Annual Report\RAPR throughMarch2006.doc
October 2006 Page 5
3.0 SURFACE WATER MONITORING AND SAMPLING ACTIVITIES
3.1 Surface Water Monitoring and Sampling
From July 2005 through November 2005, surface water samples were collected monthly from five locations: SW-1, SW-2, SW-3, SW-4, and SW-12. However, during the August and September events, no sample was collected from location SW-1 since there was no running water. The locations are presented on Figure 2. During each sampling event, stream flow measurements were collected at these locations to estimate stream discharge volume. Field measurements and calculations for stream flow are presented in Appendix C. The surface water samples were submitted to STL and analyzed for VOC+10 using EPA Method 624+10. The surface water analytical results are presented in Table 6 and on Figure 7. The monthly laboratory data packages for the surface water samples are included as separate attachments to this report, along with the required NJDEP electronic deliverables.
3.2 Summary of Surface Water Results
Historical TCE results for the five surface water locations are presented in Table 7 and on Figure 7. After the GWES was activated in July 2003, significant decreases in TCE concentrations at sampling locations SW-2, SW-3 and SW-4 were observed as shown on graphs of historical TCE concentrations versus time (Appendix D). The most significant decrease in TCE concentrations occurred at location SW-2, which illustrates that pumping at extraction RW-1 well is controlling discharge of ground water containing TCE to Crab Brook. TCE concentrations in surface water locations SW-2, SW-3, and SW-4 were non-detect during this monitoring period. These stream locations are all directly downgradient of the pumping well, and within the cone of depression formed by the pumping well along bedrock strike. The sample collected at location SW-12 is at the confluence of Crab Brook and Green Brook, almost 4,000 feet southwest of the pumping well. In addition to TCE, other contaminants such as PCE, cis-1,2-DCE, and cis-1,3-Dichloropropene have been detected at this location; none of these contaminants have been associated with the LEC site. The PCE/TCE ratios reported in samples collected from location SW-12 have been generally consistent since sampling began, and suggest the presence of a PCE source in this area. The approved revised monitoring plan eliminates this sampling point due to the presence of other sources and the distance from the Lockheed site.

Remedial Action Progress Report Former LEC Site
\\Millburn-fp1\JobFolders\2501-3000\2542\Documents (WIP)\Reports (WIP)\March 2006 Annual Report\RAPR throughMarch2006.doc
October 2006 Page 6
4.0 SYSTEM PERFORMANCE MONITORING AND SAMPLING
Ground water is pumped continuously from extraction well RW-1 at an average rate of approximately 130 gpm. The interceptor trench has a sump with a pump which is controlled by a level sensor. When the water level in the trench rises, the pump is started and remains on until the level declines. Normally, the cone of depression formed by the extraction well maintains a low water level and the pump in the interceptor trench is off; heavy precipitation is generally the trigger for this pump. The discharge to Crab Brook is monitored pursuant to NJPDES permit No. J0105899G. The original permit was an individual permit which required monthly effluent samples, to be analyzed for VOC+10, lead, chemical oxygen demand (COD) and total suspended solids (TSS). In addition, the NJPDES permit also required quarterly sampling for whole effluent toxicity testing (conducted by Aquatic Laboratory Services, Inc.). In June 2005 the individual NJPDES permit was revoked and reissued as a General Remediation Permit; as a result, the effluent sampling requirements have been reduced from monthly to quarterly. The whole effluent toxicity testing has also been reduced from two species to one species. In addition to the quarterly NJPDES sampling, TRC continues to collect monthly performance samples to evaluate system performance and ensure compliance with discharge requirements. No effluent sample has ever reported an exceedance for any permit requirement. Performance sampling results are presented in Table 8. Influent TCE concentrations for this reporting period ranged from 180 µg/L in February 2006 to 360 µg/L in June and July 2005. Initial concentrations during the pumping test on the extraction well were nearly 1,000 µg/L. Effluent TCE concentrations have never exceeded 1.0 µg/L during the reporting period , which is well below the NJPDES permit limit for TCE of 5.4 µg/L.
Remedial Action Progress Report Former LEC Site
\\Millburn-fp1\JobFolders\2501-3000\2542\Documents (WIP)\Reports (WIP)\March 2006 Annual Report\RAPR throughMarch2006.doc
October 2006 Page 7
5.0 CONCLUSIONS
Based upon the information provided in this progress report, the ground water extraction system at the former Lockheed site continues to function as designed. The discharge of contaminated ground water to Crab Brook is negligible, the ground water plume is being captured by the treatment system, and concentrations of contaminants are generally continuing to decline. The treatment plant is operating efficiently and no discharge permit limits have been exceeded. The next annual report will be submitted in May 2007, and will cover monitoring and remedial activities through March 2007.

FIGURES

N0 1000 2000
SCALE IN FEET
Site Location Map
Former Lockheed Electronics Company, Inc.
New JerseyWatchung
FIGURENUMBER
PROJECTNUMBER
1 2542
Scale as Shown
RW-1DEP Well Permit No. 25-56281
SOURCE: U.S.G.S. CHATHAM, NJ7.5 MINUTE QUADRANGLE


TABLES

SAMPLING MONTH ANALYTICAL PARAMETERSSurface Water: SW-1, SW-2, SW-3, SW-4 March/September VOC+10
Background Wells: 505A,B; 507B; 508A; 532A MarchPlume Wells: 502A,B; 506A,B; 507A; 508B; 546A; 549B,C; 550B,C March/September VOC+10Compliance Wells: P522A,B,C; 544A,B,C; 545A,B,C March/September
PROPOSED SAMPLING LOCATIONS
TABLE 1WATER MONITORING & SAMPLING SCHEDULE
FORMER LEC SITEWATCHUNG, NEW JERSEY
Table-1samplingschedule.xls

TABLE 2GROUND WATER ELEVATION DATA
FORMER LEC SITEWATCHUNG, NEW JERSEY
Monitoring Well
Well Depths ft. (bgs)
TOC Elevation ft. (MSL)
Depth to Water GW Elevation ft. (MSL)
Depth to Water GW Elevation ft. (MSL)
MW-501A 75.5 120.90 MISSING NA MISSING NA
MW-501B 19 121.07 MISSING NA MISSING NA
MW-502A 75.5 103.89 6.60 97.29 3.84 100.05
MW-502B 19 103.85 5.52 98.33 2.8 101.05
MW-503A 73 110.26 MISSING NA MISSING NA
MW-503B 24.4 110.58 MISSING NA MISSING NA
MW-504A 76.5 112.10 MISSING NA 4.70 107.40
MW-504B 19.8 112.09 MISSING NA MISSING NA
MW-505A 75 103.85/108.27 NM NA 5.40 102.87
MW-505B 20 103.73/107.73 NM NA 6.05 101.68
MW-506A 96.3 122.22 31.07 91.15 28.28 93.94
MW-506B 25 121.28 NM NA 7.90 113.38
MW-507A 151 176.39 56.92 119.47 53.70 122.69
MW-507B 60 176.39 59.60 116.79 48.95 127.44
MW-508A 263 186.85 68.35 118.50 65.22 121.63
MW-508B 68 187.13 59.60 127.53 57.25 129.88
MW-509A 423 231.30 MISSING NA MISSING NA
MW-509B 84 230.77 MISSING NA MISSING NA
MW-510A 201 182.22 MISSING NA MISSING NA
MW-510B 70 182.17 MISSING NA MISSING NA
PZ-521B 100.26 99.84 NM NA 7.71 92.13
PZ-521C 15.5 100.07 NM NA 7.72 92.35
PZ-522A 197 93.85 12.45 81.40 11.63 82.22
PZ-522B 100 93.78 11.30 82.48 10.54 83.24
PZ-522C 17.5 93.78 8.25 85.53 7.37 86.41
PZ-523A 199 94.13 NM NA NM NA
PZ-523B 103 94.05 NM NA 12.1 81.95
PZ-523C 14 93.91 NM NA NM NA
PZ-524A 199 68.12/68.33 NM NA 4.35 63.98
PZ-524B 99 67.86/68.39 NM NA 5.65 62.74
PZ-524C 15 67.78/67.29 NM NA 4.95 62.34
MW-531A 142.2 138.43 NM NA 11.83 126.60
MW-531B 47.9 138.46 NM NA 9.11 129.35
MW-532A 250 186.55 NM NA 53.98 132.57
MW-532B 102.7 185.35 NM NA 50.25 135.10
MW-542A 200 99.65 MISSING NA MISSING NA
MW-542B 100 99.71 MISSING NA MISSING NA
MW-542C 33 99.57 MISSING NA MISSING NA
March 6, 2006September 7, 2005
Page 1 of 2

TABLE 2GROUND WATER ELEVATION DATA
FORMER LEC SITEWATCHUNG, NEW JERSEY
Monitoring Well
Well Depths ft. (bgs)
TOC Elevation ft. (MSL)
Depth to Water GW Elevation ft. (MSL)
Depth to Water GW Elevation ft. (MSL)
March 6, 2006September 7, 2005
MW-544A 197 85.81 11.73 74.08 10.55 75.26
MW-544B 100 86.00 9.40 76.60 8.00 78.00
MW-544C 23 86.04 4.86 81.18 3.5 82.54
MW-545A 197 85.69 19.75 65.94 18.7 66.99
MW-545B 92 85.80 20.42 65.38 19.45 66.35
MW-545C 35 85.75 14.78 70.97 13.45 72.30
MW-546A 200 106.55 NM NA 18.70 87.85
MW-546B 100 107.06 NM NA 19.45 87.61
MW-546C 31 108.16 NM NA 13.45 94.71
MW-547A 200 98.33/98.17 NM NA 7.27 90.90
MW-547B 100 98.46/98.25 NM NA 7.25 91.00
MW-547C 22 98.32 NM NA 6.55 91.77
MW-549A 215 179.31 NM NA 55.32 123.99
MW-549B 115 179.77 NM NA 63.50 116.27
MW-549C 73.5 179.41 NM NA NM NA
MW-550B 101 132.56 25.61 106.95 22.32 110.24
MW-550C 50 132.13 24.41 107.72 21.04 111.09
RW-1 150 110.91 67.5 43.41 59.00 51.91
LEGEND PZ - Piezometerbgs - Below Ground Surface
TOC - Top of Casing RW- Extraction Well
MISSING- Well has been destroyed and unable to be locatedNM-Not Measured
Note: Wells MW-505A and B, PZ-524A, B, and C, and MW-547A and B were resurveyed on September 7, 2004 after they were repaired. Top of casing
Page 2 of 2

Shallow Intermediate Deep Wells Wells Wells501 B 501 A 508 A502 B 502 A P 522 A503 B 503 A P 523 A504 B 504 A P 524 A505 B 505 A 532 A506 B 506 A 542 A507 B 507 A 544 A508 B 510 A 545 A509 B P 521 B 546 A510 B P 522 B 547 A
P 521 C P 523 B 548 A*P 522 C P 524 B 549 AP 523 C 531 AP 524 C 532 B531 B 542 B542 C 544 B544 C 545 B545 C 546 B546 C 547 B547 C 548 B*548 C* 549 B549 C 549 B550 C 550 B
NOTES:strike-through indicates well is missing or abandoned.*Monitoring well cluster 548 was abandoned in September 1999
Watchung, New Jersey
TABLE 3HYDROSTRATIGRAPHIC WELL CLASSIFICATION
Former LEC Site
esi-v1/sampling update report/table 3 - hydrostratigraphic well classification
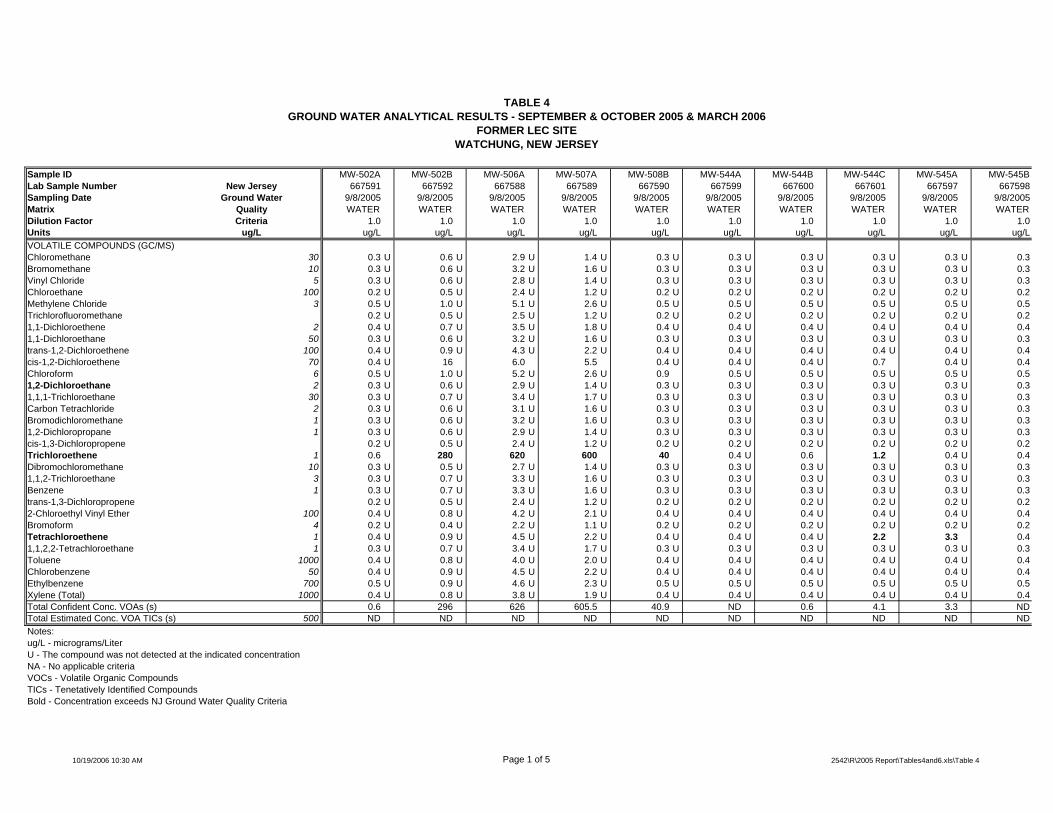
TABLE 4GROUND WATER ANALYTICAL RESULTS - SEPTEMBER & OCTOBER 2005 & MARCH 2006
FORMER LEC SITEWATCHUNG, NEW JERSEY
Sample ID MW-502A MW-502B MW-506A MW-507A MW-508B MW-544A MW-544B MW-544C MW-545A MW-545BLab Sample Number New Jersey 667591 667592 667588 667589 667590 667599 667600 667601 667597 667598Sampling Date Ground Water 9/8/2005 9/8/2005 9/8/2005 9/8/2005 9/8/2005 9/8/2005 9/8/2005 9/8/2005 9/8/2005 9/8/2005Matrix Quality WATER WATER WATER WATER WATER WATER WATER WATER WATER WATERDilution Factor Criteria 1.0 1.0 1.0 1.0 1.0 1.0 1.0 1.0 1.0 1.0Units ug/L ug/L ug/L ug/L ug/L ug/L ug/L ug/L ug/L ug/L ug/LVOLATILE COMPOUNDS (GC/MS)Chloromethane 30 0.3 U 0.6 U 2.9 U 1.4 U 0.3 U 0.3 U 0.3 U 0.3 U 0.3 U 0.3Bromomethane 10 0.3 U 0.6 U 3.2 U 1.6 U 0.3 U 0.3 U 0.3 U 0.3 U 0.3 U 0.3Vinyl Chloride 5 0.3 U 0.6 U 2.8 U 1.4 U 0.3 U 0.3 U 0.3 U 0.3 U 0.3 U 0.3Chloroethane 100 0.2 U 0.5 U 2.4 U 1.2 U 0.2 U 0.2 U 0.2 U 0.2 U 0.2 U 0.2Methylene Chloride 3 0.5 U 1.0 U 5.1 U 2.6 U 0.5 U 0.5 U 0.5 U 0.5 U 0.5 U 0.5Trichlorofluoromethane 0.2 U 0.5 U 2.5 U 1.2 U 0.2 U 0.2 U 0.2 U 0.2 U 0.2 U 0.21,1-Dichloroethene 2 0.4 U 0.7 U 3.5 U 1.8 U 0.4 U 0.4 U 0.4 U 0.4 U 0.4 U 0.41,1-Dichloroethane 50 0.3 U 0.6 U 3.2 U 1.6 U 0.3 U 0.3 U 0.3 U 0.3 U 0.3 U 0.3trans-1,2-Dichloroethene 100 0.4 U 0.9 U 4.3 U 2.2 U 0.4 U 0.4 U 0.4 U 0.4 U 0.4 U 0.4cis-1,2-Dichloroethene 70 0.4 U 16 6.0 5.5 0.4 U 0.4 U 0.4 U 0.7 0.4 U 0.4Chloroform 6 0.5 U 1.0 U 5.2 U 2.6 U 0.9 0.5 U 0.5 U 0.5 U 0.5 U 0.51,2-Dichloroethane 2 0.3 U 0.6 U 2.9 U 1.4 U 0.3 U 0.3 U 0.3 U 0.3 U 0.3 U 0.31,1,1-Trichloroethane 30 0.3 U 0.7 U 3.4 U 1.7 U 0.3 U 0.3 U 0.3 U 0.3 U 0.3 U 0.3Carbon Tetrachloride 2 0.3 U 0.6 U 3.1 U 1.6 U 0.3 U 0.3 U 0.3 U 0.3 U 0.3 U 0.3Bromodichloromethane 1 0.3 U 0.6 U 3.2 U 1.6 U 0.3 U 0.3 U 0.3 U 0.3 U 0.3 U 0.31,2-Dichloropropane 1 0.3 U 0.6 U 2.9 U 1.4 U 0.3 U 0.3 U 0.3 U 0.3 U 0.3 U 0.3cis-1,3-Dichloropropene 0.2 U 0.5 U 2.4 U 1.2 U 0.2 U 0.2 U 0.2 U 0.2 U 0.2 U 0.2Trichloroethene 1 0.6 280 620 600 40 0.4 U 0.6 1.2 0.4 U 0.4Dibromochloromethane 10 0.3 U 0.5 U 2.7 U 1.4 U 0.3 U 0.3 U 0.3 U 0.3 U 0.3 U 0.31,1,2-Trichloroethane 3 0.3 U 0.7 U 3.3 U 1.6 U 0.3 U 0.3 U 0.3 U 0.3 U 0.3 U 0.3Benzene 1 0.3 U 0.7 U 3.3 U 1.6 U 0.3 U 0.3 U 0.3 U 0.3 U 0.3 U 0.3trans-1,3-Dichloropropene 0.2 U 0.5 U 2.4 U 1.2 U 0.2 U 0.2 U 0.2 U 0.2 U 0.2 U 0.22-Chloroethyl Vinyl Ether 100 0.4 U 0.8 U 4.2 U 2.1 U 0.4 U 0.4 U 0.4 U 0.4 U 0.4 U 0.4Bromoform 4 0.2 U 0.4 U 2.2 U 1.1 U 0.2 U 0.2 U 0.2 U 0.2 U 0.2 U 0.2Tetrachloroethene 1 0.4 U 0.9 U 4.5 U 2.2 U 0.4 U 0.4 U 0.4 U 2.2 3.3 0.41,1,2,2-Tetrachloroethane 1 0.3 U 0.7 U 3.4 U 1.7 U 0.3 U 0.3 U 0.3 U 0.3 U 0.3 U 0.3Toluene 1000 0.4 U 0.8 U 4.0 U 2.0 U 0.4 U 0.4 U 0.4 U 0.4 U 0.4 U 0.4Chlorobenzene 50 0.4 U 0.9 U 4.5 U 2.2 U 0.4 U 0.4 U 0.4 U 0.4 U 0.4 U 0.4Ethylbenzene 700 0.5 U 0.9 U 4.6 U 2.3 U 0.5 U 0.5 U 0.5 U 0.5 U 0.5 U 0.5Xylene (Total) 1000 0.4 U 0.8 U 3.8 U 1.9 U 0.4 U 0.4 U 0.4 U 0.4 U 0.4 U 0.4Total Confident Conc. VOAs (s) 0.6 296 626 605.5 40.9 ND 0.6 4.1 3.3 NDTotal Estimated Conc. VOA TICs (s) 500 ND ND ND ND ND ND ND ND ND NDNotes:ug/L - micrograms/LiterU - The compound was not detected at the indicated concentrationNA - No applicable criteriaVOCs - Volatile Organic CompoundsTICs - Tenetatively Identified CompoundsBold - Concentration exceeds NJ Ground Water Quality Criteria
10/19/2006 10:30 AM Page 1 of 5 2542\R\2005 Report\Tables4and6.xls\Table 4

TABLE 4GROUND WATER ANALYTICAL RESULTS - SEPTEMBER & OCTOBER 2005 & MARCH 2006
FORMER LEC SITEWATCHUNG, NEW JERSEY
Sample IDLab Sample Number New JerseySampling Date Ground WaterMatrix QualityDilution Factor CriteriaUnits ug/LVOLATILE COMPOUNDS (GC/MS)Chloromethane 30Bromomethane 10Vinyl Chloride 5Chloroethane 100Methylene Chloride 3Trichlorofluoromethane1,1-Dichloroethene 21,1-Dichloroethane 50trans-1,2-Dichloroethene 100cis-1,2-Dichloroethene 70Chloroform 61,2-Dichloroethane 21,1,1-Trichloroethane 30Carbon Tetrachloride 2Bromodichloromethane 11,2-Dichloropropane 1cis-1,3-DichloropropeneTrichloroethene 1Dibromochloromethane 101,1,2-Trichloroethane 3Benzene 1trans-1,3-Dichloropropene2-Chloroethyl Vinyl Ether 100Bromoform 4Tetrachloroethene 11,1,2,2-Tetrachloroethane 1Toluene 1000Chlorobenzene 50Ethylbenzene 700Xylene (Total) 1000Total Confident Conc. VOAs (s)Total Estimated Conc. VOA TICs (s) 500Notes:ug/L - micrograms/LiterU - The compound was not detected at the indicated concentrationNA - No applicable criteriaVOCs - Volatile Organic CompoundsTICs - Tenetatively Identified CompoundsBold - Concentration exceeds NJ Ground Water Quality Criteria
MW-545C MW-546A MW-550B MW-550C P-522A P-522B P-522C MW549A MW549B667599 667593 667587 667586 667594 667595 667596 677752 677753
9/8/2005 9/8/2005 9/8/2005 9/8/2005 9/8/2005 9/8/2005 9/8/2005 10/14/2005 10/14/2005WATER WATER WATER WATER WATER WATER WATER WATER WATER
1.0 1.0 1.0 1.0 1.0 1.0 1.0 10.0 10.0ug/L ug/L ug/L ug/L ug/L ug/L ug/L ug/L ug/L
U 0.3 U 0.3 U 1.4 U 0.3 U 0.3 U 0.6 U 0.3 U 2.9 U 2.9 UU 0.3 U 0.3 U 1.6 U 0.3 U 0.3 U 0.6 U 0.3 U 3.2 U 3.2 UU 0.3 U 0.3 U 1.4 U 0.3 U 0.3 U 0.6 U 0.3 U 2.8 U 2.8 UU 0.2 U 0.2 U 1.2 U 0.2 U 0.2 U 0.5 U 0.2 U 2.4 U 2.4 UU 0.5 U 0.5 U 2.6 U 0.5 U 0.5 U 1.0 U 0.5 U 5.1 U 5.1 UU 0.2 U 0.2 U 1.2 U 0.2 U 0.2 U 0.5 U 0.2 U 2.5 U 2.5 UU 0.4 U 0.4 U 1.8 U 0.4 U 0.4 U 0.7 U 0.4 U 3.5 U 3.5 UU 0.3 U 0.3 U 1.6 U 0.3 U 0.3 U 2.3 0.3 U 3.2 U 3.2 UU 0.4 U 0.4 U 2.2 U 0.4 U 0.4 U 0.9 U 0.4 U 4.3 U 4.3 UU 0.4 U 0.8 5.4 1.8 0.4 U 43 0.4 U 5.6 12 U 0.5 U 3.3 2.6 U 0.5 U 2.3 3.6 0.5 U 5.2 U 5.2 UU 0.3 U 0.3 U 1.4 U 0.3 U 0.3 U 0.6 U 0.3 U 2.9 U 2.9 UU 0.3 U 0.3 U 1.7 U 0.3 U 0.3 U 0.7 U 0.3 U 3.4 U 3.4 UU 0.3 U 0.3 U 1.6 U 0.3 U 0.3 U 0.6 U 0.3 U 3.1 U 3.1 UU 0.3 U 0.3 U 1.6 U 0.3 U 0.3 U 0.6 U 0.3 U 3.2 U 3.2 UU 0.3 U 0.3 U 1.4 U 0.3 U 0.3 U 0.6 U 0.3 U 2.9 U 2.9 UU 0.2 U 0.2 U 1.2 U 0.2 U 0.2 U 0.5 U 0.2 U 2.4 U 2.4 UU 0.4 U 130 740 160 3.0 210 0.4 U 1100 1300 U 0.3 U 0.3 U 1.4 U 0.3 U 0.3 U 0.5 U 0.3 U 2.7 U 2.7 UU 0.3 U 0.3 U 1.6 U 0.3 U 0.3 U 0.7 U 0.3 U 3.3 U 3.3 UU 0.3 U 0.3 U 1.6 U 0.3 U 0.3 U 0.7 U 0.3 U 3.3 U 3.3 UU 0.2 U 0.2 U 1.2 U 0.2 U 0.2 U 0.5 U 0.2 U 2.4 U 2.4 UU 0.4 U 0.4 U 2.1 U 0.4 U 0.4 U 0.8 U 0.4 U 4.2 U 4.2 UU 0.2 U 0.2 U 1.1 U 0.2 U 0.2 U 0.4 U 0.2 U 2.2 U 2.2 UU 0.4 U 0.4 U 2.9 0.4 U 0.4 U 1.4 0.4 U 4.5 U 6.6 U 0.3 U 0.3 U 1.7 U 0.3 U 0.3 U 0.7 U 0.3 U 3.4 U 3.4 UU 0.4 U 0.4 U 2.0 U 0.4 U 0.4 U 0.8 U 0.4 U 4 U 4 UU 0.4 U 0.4 U 2.2 U 0.4 U 0.4 U 0.9 U 0.4 U 4.5 U 4.5 UU 0.5 U 0.5 U 2.3 U 0.5 U 0.5 U 0.9 U 0.5 U 4.6 U 4.6 UU 0.4 U 0.4 U 1.9 U 0.4 U 0.4 U 0.8 U 0.4 U 3.8 U 3.8 U
ND 134.1 748.3 161.8 5.3 260.3 ND 1105.6 1318.6ND ND ND ND ND ND ND ND ND
10/19/2006 10:30 AM Page 2 of 5 2542\R\2005 Report\Tables4and6.xls\Table 4

TABLE 4GROUND WATER ANALYTICAL RESULTS - SEPTEMBER & OCTOBER 2005 & MARCH 2006
FORMER LEC SITEWATCHUNG, NEW JERSEY
Sample IDLab Sample Number New JerseySampling Date Ground WaterMatrix QualityDilution Factor CriteriaUnits ug/LVOLATILE COMPOUNDS (GC/MS)Chloromethane 30Bromomethane 10Vinyl Chloride 5Chloroethane 100Methylene Chloride 3Trichlorofluoromethane1,1-Dichloroethene 21,1-Dichloroethane 50trans-1,2-Dichloroethene 100cis-1,2-Dichloroethene 70Chloroform 61,2-Dichloroethane 21,1,1-Trichloroethane 30Carbon Tetrachloride 2Bromodichloromethane 11,2-Dichloropropane 1cis-1,3-DichloropropeneTrichloroethene 1Dibromochloromethane 101,1,2-Trichloroethane 3Benzene 1trans-1,3-Dichloropropene2-Chloroethyl Vinyl Ether 100Bromoform 4Tetrachloroethene 11,1,2,2-Tetrachloroethane 1Toluene 1000Chlorobenzene 50Ethylbenzene 700Xylene (Total) 1000Total Confident Conc. VOAs (s)Total Estimated Conc. VOA TICs (s) 500Notes:ug/L - micrograms/LiterU - The compound was not detected at the indicated concentrationNA - No applicable criteriaVOCs - Volatile Organic CompoundsTICs - Tenetatively Identified CompoundsBold - Concentration exceeds NJ Ground Water Quality Criteria
MW506B MW-506B MW-550C MW-550B MW-507A MW-507B FB030706 MW-508A MW-508B MW-549B677754 714112 714113 714114 714115 714116 714117 714118 714119 714120
10/14/2005 3/7/2006 3/7/2006 3/7/2006 3/7/2006 3/7/2006 3/7/2006 3/7/2006 3/7/2006 3/7/2006WATER WATER WATER WATER WATER WATER WATER WATER WATER WATER
1.0 1.0 1.0 10.0 5.0 1.0 1.0 1.0 1.0 10.0ug/L ug/L ug/L ug/L ug/L ug/L ug/L ug/L ug/L ug/L
0.3 U 0.3 U 0.3 U 2.9 U 1.4 U 0.3 U 0.3 U 0.3 U 0.3 U 2.90.3 U 0.3 U 0.3 U 3.2 U 1.6 U 0.3 U 0.3 U 0.3 U 0.3 U 3.20.3 U 0.3 U 0.3 U 2.8 U 1.4 U 0.3 U 0.3 U 0.3 U 0.3 U 2.80.2 U 0.2 U 0.2 U 2.4 U 1.2 U 0.2 U 0.2 U 0.2 U 0.2 U 2.40.5 U 0.5 U 0.5 U 5.1 U 2.6 U 0.5 U 0.5 U 0.5 U 0.5 U 5.10.2 U 0.2 U 0.2 U 2.5 U 1.2 U 0.2 U 0.2 U 0.2 U 0.2 U 2.50.4 U 0.4 U 0.4 U 3.5 U 1.8 U 0.4 U 0.4 U 0.4 U 0.4 U 3.50.3 U 0.3 U 0.3 U 3.2 U 1.6 U 0.3 U 0.3 U 0.3 U 0.3 U 3.20.4 U 0.4 U 0.4 U 4.3 U 2.2 U 0.4 U 0.4 U 0.4 U 0.4 U 4.30.4 U 0.4 U 1.4 4.3 U 6.8 0.4 U 0.4 U 20 0.4 U 8.90.5 U 0.7 0.5 U 5.2 U 2.6 U 0.6 0.5 U 0.5 U 0.9 5.20.3 U 0.3 U 0.3 U 2.9 U 1.4 U 0.3 U 0.3 U 0.3 U 0.3 U 2.90.3 U 0.3 U 0.3 U 3.4 U 1.7 U 0.3 U 0.3 U 0.3 U 0.3 U 3.40.3 U 0.3 U 0.3 U 3.1 U 1.6 U 0.3 U 0.3 U 0.3 U 0.3 U 3.10.3 U 0.3 U 0.3 U 3.2 U 1.6 U 0.3 U 0.3 U 0.3 U 0.3 U 3.20.3 U 0.3 U 0.3 U 2.9 U 1.4 U 0.3 U 0.3 U 0.3 U 0.3 U 2.90.2 U 0.2 U 0.2 U 2.4 U 1.2 U 0.2 U 0.2 U 0.2 U 0.2 U 2.436 12 140 730 600 19 0.4 U 0.5 31 14000.3 U 0.3 U 0.3 U 2.7 U 1.4 U 0.3 U 0.3 U 0.3 U 0.3 U 2.70.3 U 0.3 U 0.3 U 3.3 U 1.6 U 0.3 U 0.3 U 0.3 U 0.3 U 3.30.3 U 0.3 U 0.3 U 3.3 U 1.6 U 0.3 U 0.3 U 0.3 U 0.3 U 3.30.2 U 0.2 U 0.2 U 2.4 U 1.2 U 0.2 U 0.2 U 0.2 U 0.2 U 2.40.4 U 0.4 U 0.4 U 4.2 U 2.1 U 0.4 U 0.4 U 0.4 U 0.4 U 4.20.2 U 0.2 U 0.2 U 2.2 U 1.1 U 0.2 U 0.2 U 0.2 U 0.2 U 2.20.4 U 0.4 U 0.4 U 4.5 U 2.2 U 0.4 U 0.4 U 0.4 U 0.4 U 4.50.3 U 0.3 U 0.3 U 3.4 U 1.7 U 0.3 U 0.3 U 0.3 U 0.3 U 3.40.4 U 0.4 U 0.4 U 4.0 U 2.0 U 0.4 U 0.4 U 0.4 U 0.4 U 40.4 U 0.4 U 0.4 U 4.5 U 2.2 U 0.4 U 0.4 U 0.4 U 0.4 U 4.50.5 U 0.5 U 0.5 U 4.6 U 2.3 U 0.5 U 0.5 U 0.5 U 0.5 U 4.60.4 U 0.4 U 0.4 U 3.8 U 1.9 U 0.4 U 0.4 U 0.4 U 0.4 U 3.836 12.7 141.4 730 606.8 19.6 0 20.5 31.9 1408.9
ND 0 0 0 0 0 0 0 0 0
10/19/2006 10:30 AM Page 3 of 5 2542\R\2005 Report\Tables4and6.xls\Table 4
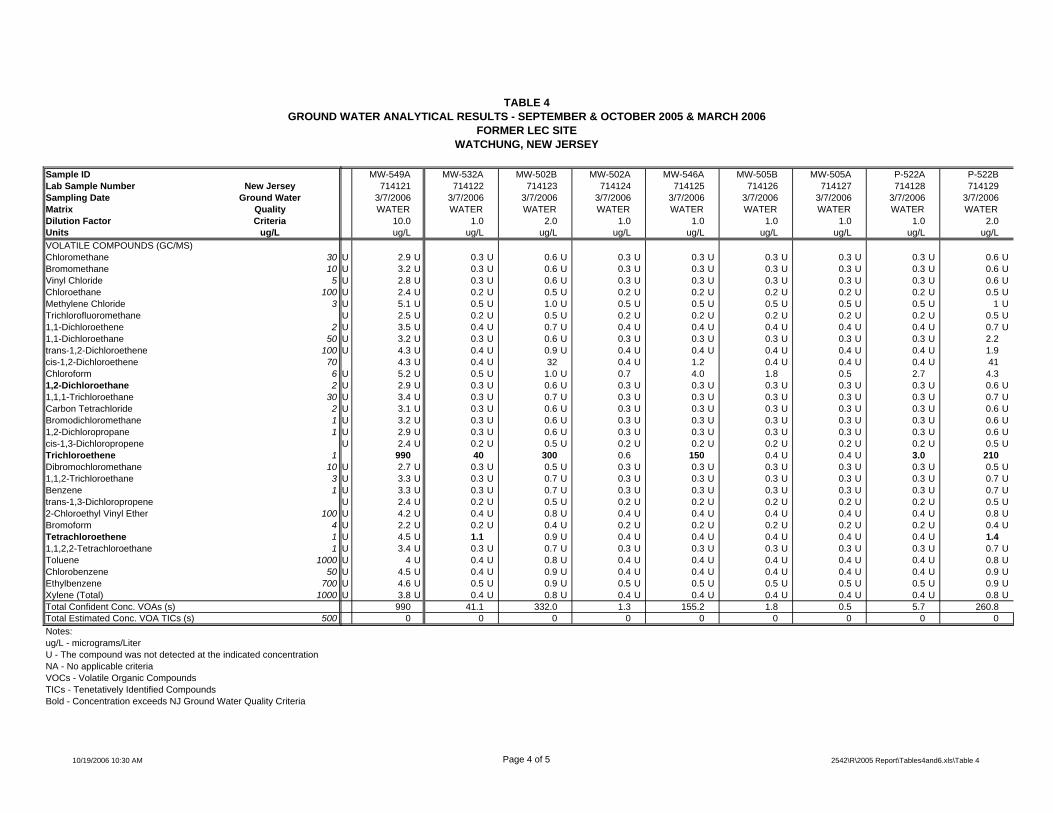
TABLE 4GROUND WATER ANALYTICAL RESULTS - SEPTEMBER & OCTOBER 2005 & MARCH 2006
FORMER LEC SITEWATCHUNG, NEW JERSEY
Sample IDLab Sample Number New JerseySampling Date Ground WaterMatrix QualityDilution Factor CriteriaUnits ug/LVOLATILE COMPOUNDS (GC/MS)Chloromethane 30Bromomethane 10Vinyl Chloride 5Chloroethane 100Methylene Chloride 3Trichlorofluoromethane1,1-Dichloroethene 21,1-Dichloroethane 50trans-1,2-Dichloroethene 100cis-1,2-Dichloroethene 70Chloroform 61,2-Dichloroethane 21,1,1-Trichloroethane 30Carbon Tetrachloride 2Bromodichloromethane 11,2-Dichloropropane 1cis-1,3-DichloropropeneTrichloroethene 1Dibromochloromethane 101,1,2-Trichloroethane 3Benzene 1trans-1,3-Dichloropropene2-Chloroethyl Vinyl Ether 100Bromoform 4Tetrachloroethene 11,1,2,2-Tetrachloroethane 1Toluene 1000Chlorobenzene 50Ethylbenzene 700Xylene (Total) 1000Total Confident Conc. VOAs (s)Total Estimated Conc. VOA TICs (s) 500Notes:ug/L - micrograms/LiterU - The compound was not detected at the indicated concentrationNA - No applicable criteriaVOCs - Volatile Organic CompoundsTICs - Tenetatively Identified CompoundsBold - Concentration exceeds NJ Ground Water Quality Criteria
MW-549A MW-532A MW-502B MW-502A MW-546A MW-505B MW-505A P-522A P-522B714121 714122 714123 714124 714125 714126 714127 714128 714129
3/7/2006 3/7/2006 3/7/2006 3/7/2006 3/7/2006 3/7/2006 3/7/2006 3/7/2006 3/7/2006WATER WATER WATER WATER WATER WATER WATER WATER WATER
10.0 1.0 2.0 1.0 1.0 1.0 1.0 1.0 2.0ug/L ug/L ug/L ug/L ug/L ug/L ug/L ug/L ug/L
U 2.9 U 0.3 U 0.6 U 0.3 U 0.3 U 0.3 U 0.3 U 0.3 U 0.6 UU 3.2 U 0.3 U 0.6 U 0.3 U 0.3 U 0.3 U 0.3 U 0.3 U 0.6 UU 2.8 U 0.3 U 0.6 U 0.3 U 0.3 U 0.3 U 0.3 U 0.3 U 0.6 UU 2.4 U 0.2 U 0.5 U 0.2 U 0.2 U 0.2 U 0.2 U 0.2 U 0.5 UU 5.1 U 0.5 U 1.0 U 0.5 U 0.5 U 0.5 U 0.5 U 0.5 U 1 UU 2.5 U 0.2 U 0.5 U 0.2 U 0.2 U 0.2 U 0.2 U 0.2 U 0.5 UU 3.5 U 0.4 U 0.7 U 0.4 U 0.4 U 0.4 U 0.4 U 0.4 U 0.7 UU 3.2 U 0.3 U 0.6 U 0.3 U 0.3 U 0.3 U 0.3 U 0.3 U 2.2 U 4.3 U 0.4 U 0.9 U 0.4 U 0.4 U 0.4 U 0.4 U 0.4 U 1.9 4.3 U 0.4 U 32 0.4 U 1.2 0.4 U 0.4 U 0.4 U 41 U 5.2 U 0.5 U 1.0 U 0.7 4.0 1.8 0.5 2.7 4.3 U 2.9 U 0.3 U 0.6 U 0.3 U 0.3 U 0.3 U 0.3 U 0.3 U 0.6 UU 3.4 U 0.3 U 0.7 U 0.3 U 0.3 U 0.3 U 0.3 U 0.3 U 0.7 UU 3.1 U 0.3 U 0.6 U 0.3 U 0.3 U 0.3 U 0.3 U 0.3 U 0.6 UU 3.2 U 0.3 U 0.6 U 0.3 U 0.3 U 0.3 U 0.3 U 0.3 U 0.6 UU 2.9 U 0.3 U 0.6 U 0.3 U 0.3 U 0.3 U 0.3 U 0.3 U 0.6 UU 2.4 U 0.2 U 0.5 U 0.2 U 0.2 U 0.2 U 0.2 U 0.2 U 0.5 U 990 40 300 0.6 150 0.4 U 0.4 U 3.0 210 U 2.7 U 0.3 U 0.5 U 0.3 U 0.3 U 0.3 U 0.3 U 0.3 U 0.5 UU 3.3 U 0.3 U 0.7 U 0.3 U 0.3 U 0.3 U 0.3 U 0.3 U 0.7 UU 3.3 U 0.3 U 0.7 U 0.3 U 0.3 U 0.3 U 0.3 U 0.3 U 0.7 UU 2.4 U 0.2 U 0.5 U 0.2 U 0.2 U 0.2 U 0.2 U 0.2 U 0.5 UU 4.2 U 0.4 U 0.8 U 0.4 U 0.4 U 0.4 U 0.4 U 0.4 U 0.8 UU 2.2 U 0.2 U 0.4 U 0.2 U 0.2 U 0.2 U 0.2 U 0.2 U 0.4 UU 4.5 U 1.1 0.9 U 0.4 U 0.4 U 0.4 U 0.4 U 0.4 U 1.4 U 3.4 U 0.3 U 0.7 U 0.3 U 0.3 U 0.3 U 0.3 U 0.3 U 0.7 UU 4 U 0.4 U 0.8 U 0.4 U 0.4 U 0.4 U 0.4 U 0.4 U 0.8 UU 4.5 U 0.4 U 0.9 U 0.4 U 0.4 U 0.4 U 0.4 U 0.4 U 0.9 UU 4.6 U 0.5 U 0.9 U 0.5 U 0.5 U 0.5 U 0.5 U 0.5 U 0.9 UU 3.8 U 0.4 U 0.8 U 0.4 U 0.4 U 0.4 U 0.4 U 0.4 U 0.8 U
990 41.1 332.0 1.3 155.2 1.8 0.5 5.7 260.80 0 0 0 0 0 0 0 0
10/19/2006 10:30 AM Page 4 of 5 2542\R\2005 Report\Tables4and6.xls\Table 4
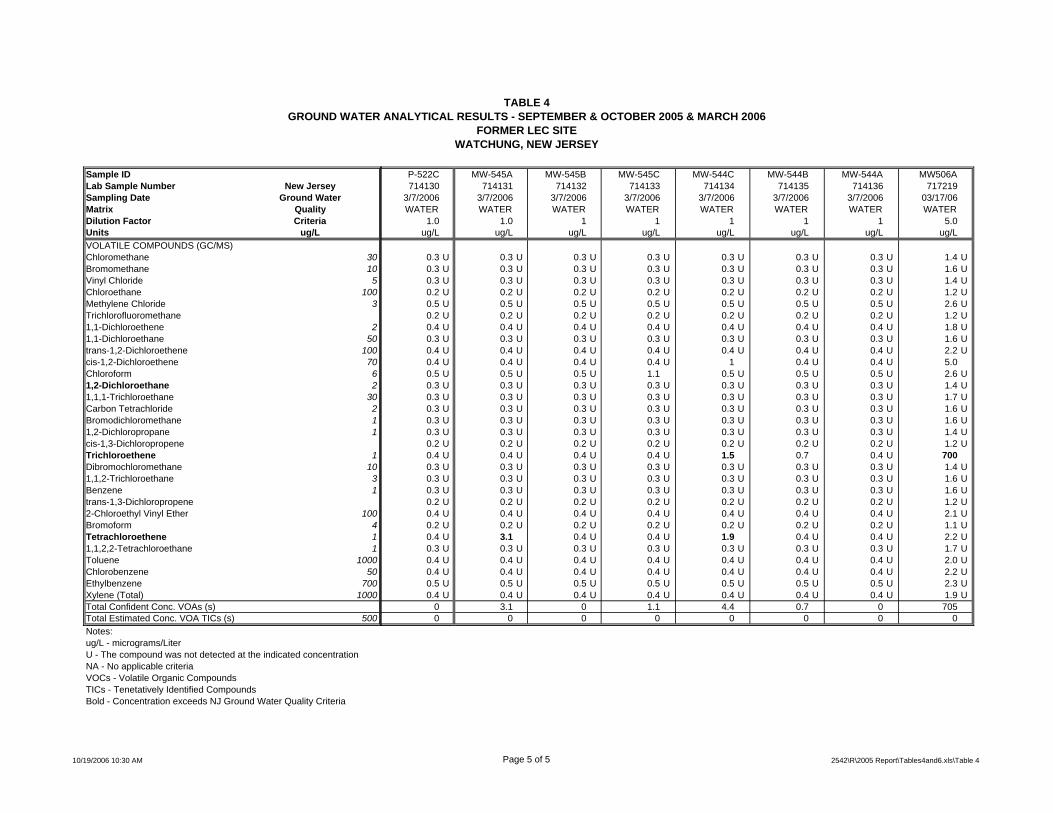
TABLE 4GROUND WATER ANALYTICAL RESULTS - SEPTEMBER & OCTOBER 2005 & MARCH 2006
FORMER LEC SITEWATCHUNG, NEW JERSEY
Sample IDLab Sample Number New JerseySampling Date Ground WaterMatrix QualityDilution Factor CriteriaUnits ug/LVOLATILE COMPOUNDS (GC/MS)Chloromethane 30Bromomethane 10Vinyl Chloride 5Chloroethane 100Methylene Chloride 3Trichlorofluoromethane1,1-Dichloroethene 21,1-Dichloroethane 50trans-1,2-Dichloroethene 100cis-1,2-Dichloroethene 70Chloroform 61,2-Dichloroethane 21,1,1-Trichloroethane 30Carbon Tetrachloride 2Bromodichloromethane 11,2-Dichloropropane 1cis-1,3-DichloropropeneTrichloroethene 1Dibromochloromethane 101,1,2-Trichloroethane 3Benzene 1trans-1,3-Dichloropropene2-Chloroethyl Vinyl Ether 100Bromoform 4Tetrachloroethene 11,1,2,2-Tetrachloroethane 1Toluene 1000Chlorobenzene 50Ethylbenzene 700Xylene (Total) 1000Total Confident Conc. VOAs (s)Total Estimated Conc. VOA TICs (s) 500Notes:ug/L - micrograms/LiterU - The compound was not detected at the indicated concentrationNA - No applicable criteriaVOCs - Volatile Organic CompoundsTICs - Tenetatively Identified CompoundsBold - Concentration exceeds NJ Ground Water Quality Criteria
P-522C MW-545A MW-545B MW-545C MW-544C MW-544B MW-544A MW506A714130 714131 714132 714133 714134 714135 714136 717219
3/7/2006 3/7/2006 3/7/2006 3/7/2006 3/7/2006 3/7/2006 3/7/2006 03/17/06WATER WATER WATER WATER WATER WATER WATER WATER
1.0 1.0 1 1 1 1 1 5.0ug/L ug/L ug/L ug/L ug/L ug/L ug/L ug/L
0.3 U 0.3 U 0.3 U 0.3 U 0.3 U 0.3 U 0.3 U 1.4 U0.3 U 0.3 U 0.3 U 0.3 U 0.3 U 0.3 U 0.3 U 1.6 U0.3 U 0.3 U 0.3 U 0.3 U 0.3 U 0.3 U 0.3 U 1.4 U0.2 U 0.2 U 0.2 U 0.2 U 0.2 U 0.2 U 0.2 U 1.2 U0.5 U 0.5 U 0.5 U 0.5 U 0.5 U 0.5 U 0.5 U 2.6 U0.2 U 0.2 U 0.2 U 0.2 U 0.2 U 0.2 U 0.2 U 1.2 U0.4 U 0.4 U 0.4 U 0.4 U 0.4 U 0.4 U 0.4 U 1.8 U0.3 U 0.3 U 0.3 U 0.3 U 0.3 U 0.3 U 0.3 U 1.6 U0.4 U 0.4 U 0.4 U 0.4 U 0.4 U 0.4 U 0.4 U 2.2 U0.4 U 0.4 U 0.4 U 0.4 U 1 0.4 U 0.4 U 5.00.5 U 0.5 U 0.5 U 1.1 0.5 U 0.5 U 0.5 U 2.6 U0.3 U 0.3 U 0.3 U 0.3 U 0.3 U 0.3 U 0.3 U 1.4 U0.3 U 0.3 U 0.3 U 0.3 U 0.3 U 0.3 U 0.3 U 1.7 U0.3 U 0.3 U 0.3 U 0.3 U 0.3 U 0.3 U 0.3 U 1.6 U0.3 U 0.3 U 0.3 U 0.3 U 0.3 U 0.3 U 0.3 U 1.6 U0.3 U 0.3 U 0.3 U 0.3 U 0.3 U 0.3 U 0.3 U 1.4 U0.2 U 0.2 U 0.2 U 0.2 U 0.2 U 0.2 U 0.2 U 1.2 U0.4 U 0.4 U 0.4 U 0.4 U 1.5 0.7 0.4 U 7000.3 U 0.3 U 0.3 U 0.3 U 0.3 U 0.3 U 0.3 U 1.4 U0.3 U 0.3 U 0.3 U 0.3 U 0.3 U 0.3 U 0.3 U 1.6 U0.3 U 0.3 U 0.3 U 0.3 U 0.3 U 0.3 U 0.3 U 1.6 U0.2 U 0.2 U 0.2 U 0.2 U 0.2 U 0.2 U 0.2 U 1.2 U0.4 U 0.4 U 0.4 U 0.4 U 0.4 U 0.4 U 0.4 U 2.1 U0.2 U 0.2 U 0.2 U 0.2 U 0.2 U 0.2 U 0.2 U 1.1 U0.4 U 3.1 0.4 U 0.4 U 1.9 0.4 U 0.4 U 2.2 U0.3 U 0.3 U 0.3 U 0.3 U 0.3 U 0.3 U 0.3 U 1.7 U0.4 U 0.4 U 0.4 U 0.4 U 0.4 U 0.4 U 0.4 U 2.0 U0.4 U 0.4 U 0.4 U 0.4 U 0.4 U 0.4 U 0.4 U 2.2 U0.5 U 0.5 U 0.5 U 0.5 U 0.5 U 0.5 U 0.5 U 2.3 U0.4 U 0.4 U 0.4 U 0.4 U 0.4 U 0.4 U 0.4 U 1.9 U
0 3.1 0 1.1 4.4 0.7 0 7050 0 0 0 0 0 0 0
10/19/2006 10:30 AM Page 5 of 5 2542\R\2005 Report\Tables4and6.xls\Table 4

TABLE 5HISTORICAL TCE CONCENTRATIONS IN GROUND WATER
FORMER LEC SITEWATCHUNG, NEW JERSEY
Sample Date Well # TCE Concentration Units Q Sample Date Well # TCE Concentration Units Q Sample Date Well # TCE Concentration Units Q Sample Date Well # TCE Concentration Units Q Sample Date Well # TCE Concentration Units Q Sample Date Well # TCE Concentration Units Q08/13/93 MW-502A 3 ug/L 08/11/93 MW-505B <GWQS ug/L U 10/21/93 MW-507A 730 ug/L 08/13/93 MW-508B 960 ug/L 11/09/99 MW-545B <GWQS ug/L U 11/21/02 MW-550C 77 ug/L10/22/93 MW-502A 5 ug/L 10/19/93 MW-505B <GWQS ug/L U 04/27/94 MW-507A 1200 ug/L 10/25/93 MW-508B 860 ug/L 11/18/02 MW-545B <GWQS ug/L U 03/26/03 MW-550C 130 ug/L04/27/94 MW-502A 1.6 ug/L 04/26/94 MW-505B <GWQS ug/L U 11/11/94 MW-507A 1210 ug/L 04/29/94 MW-508B 630 ug/L J 03/25/03 MW-545B <GWQS ug/L U 06/25/03 MW-550C 180 ug/L11/09/94 MW-502A 2.02 ug/L 11/08/94 MW-505B <GWQS ug/L U 06/01/95 MW-507A 1100 ug/L 04/29/94 MW-508B 640 ug/L J 09/23/03 MW-545B <GWQS ug/L U 09/23/03 MW-550C 140 ug/L06/01/95 MW-502A 2.3 ug/L 05/31/95 MW-505B <GWQS ug/L U 04/01/96 MW-507A 930 ug/L DJ 11/11/94 MW-508B 1120 ug/L 03/09/04 MW-545B <GWQS ug/L U 12/10/03 MW-550C 150 ug/L03/30/96 MW-502A 2.5 ug/L 04/02/96 MW-505B 1.1 ug/L 09/26/97 MW-507A 1200 ug/L 06/02/95 MW-508B 943 ug/L 09/24/04 MW-545B 0.4 ug/L U 03/09/04 MW-550C 170 ug/L03/30/96 MW-502A 2.9 ug/L 09/23/97 MW-505B <GWQS ug/L U 05/02/98 MW-507A 1100 ug/L 04/02/96 MW-508B 1600 ug/L J 03/03/05 MW-545B 0.4 ug/L U 06/04/04 MW-550C 140 ug/L09/27/97 MW-502A 7.8 ug/L 09/24/98 MW-505B <GWQS ug/L U 05/02/98 MW-507A 1100 ug/L 09/26/97 MW-508B 320 ug/L 09/08/05 MW-545B 0.4 ug/L U 09/23/04 MW-550C 140 ug/L05/02/98 MW-502A 5.2 ug/L 11/09/99 MW-505B <GWQS ug/L U 09/26/98 MW-507A 1200 ug/L 05/02/98 MW-508B 360 ug/L 11/09/99 MW-545C <GWQS ug/L U 12/09/04 MW-550C 130 ug/L09/25/98 MW-502A 7.9 ug/L 11/20/02 MW-505B <GWQS ug/L U 11/11/99 MW-507A 970 ug/L 09/25/98 MW-508B 210 ug/L 11/18/02 MW-545C <GWQS ug/L U 03/03/05 MW-550C 120 ug/L11/12/99 MW-502A 5.9 ug/L 03/25/03 MW-505B <GWQS ug/L U 11/21/02 MW-507A 140 ug/L 11/11/99 MW-508B 670 ug/L 03/25/03 MW-545C <GWQS ug/L U 06/03/05 MW-550C 140 ug/L11/21/02 MW-502A 3.1 ug/L 03/25/04 MW-505B <GWQS ug/L U 03/26/03 MW-507A 630 ug/L 11/21/02 MW-508B 120 ug/L 09/23/03 MW-545C <GWQS ug/L U 09/08/05 MW-550C 160 ug/L03/25/03 MW-502A 2.5 ug/L 03/03/05 MW-505B <GWQS ug/L U 06/25/03 MW-507A 770 ug/L 03/26/03 MW-508B 73 ug/L 03/09/04 MW-545C <GWQS ug/L U 11/10/94 P-522A 2.2 ug/L06/25/03 MW-502A 2.7 ug/L 03/07/06 MW-505B <GWQS ug/L U 09/23/03 MW-507A 860 ug/L 06/25/03 MW-508B 58 ug/L 09/24/04 MW-545C 0.4 ug/L U 12/14/94 P-522A 4.8 ug/L09/24/03 MW-502A 1.4 ug/L 08/11/93 MW-506A 1700 ug/L 12/11/03 MW-507A 740 ug/L 09/23/03 MW-508B 69 ug/L 03/03/05 MW-545C 0.4 ug/L U 03/31/96 P-522A 0.4 ug/L J12/11/03 MW-502A 1.0 ug/L 10/19/93 MW-506A 1800 ug/L 03/09/04 MW-507A 690 ug/L 12/11/03 MW-508B 40 ug/L 09/08/05 MW-545C 0.4 ug/L U 09/27/97 P-522A 0.8 ug/L J03/09/04 MW-502A 0.8 ug/L 04/26/94 MW-506A 1200 ug/L 06/04/04 MW-507A 450 ug/L 03/09/04 MW-508B 41 ug/L 11/09/99 MW-546A 130 ug/L 05/01/98 P-522A 1.8 ug/L06/04/04 MW-502A 0.6 ug/L 04/26/94 MW-506A 1300 ug/L 09/23/04 MW-507A 1100 ug/L 06/04/04 MW-508B 32 ug/L 11/19/02 MW-546A 120 ug/L 09/26/98 P-522A 1.1 ug/L09/23/04 MW-502A 0.6 ug/L 11/11/94 MW-506A 1990 ug/L 12/09/04 MW-507A 610 ug/L 09/23/04 MW-508B 30 ug/L 03/25/03 MW-546A 120 ug/L 11/10/99 P-522A 0.9 ug/L12/09/04 MW-502A 0.9 ug/L 11/11/94 MW-506A 2020 ug/L 03/04/05 MW-507A 540 ug/L 12/09/04 MW-508B 31 ug/L 06/25/03 MW-546A 150 ug/L 11/19/02 P-522A 1.6 ug/L03/03/05 MW-502A 1.2 ug/L 06/01/95 MW-506A 1650 ug/L 06/03/05 MW-507A 570 ug/L 03/04/05 MW-508B 26 ug/L 09/24/03 MW-546A 91 ug/L 03/25/03 P-522A 14 ug/L06/03/05 MW-502A 0.8 ug/L 06/01/95 MW-506A 1690 ug/L 09/08/05 MW-507A 600 ug/L 06/03/05 MW-508B 40 ug/L 12/11/03 MW-546A 88 ug/L 09/23/03 P-522A 3.8 ug/L09/08/05 MW-502A 0.6 ug/L 04/01/96 MW-506A 1800 ug/L DJ 03/07/06 MW-507A 600 ug/L 09/08/05 MW-508B 40 ug/L 03/09/04 MW-546A 90 ug/L 03/09/04 P-522A 3.0 ug/L03/07/06 MW-502A 0.6 ug/L 09/25/97 MW-506A 1600 ug/L 08/13/93 MW-507B 130 ug/L 03/07/06 MW-508B 31 ug/L 06/04/04 MW-546A 82 ug/L 09/24/04 P-522A 3.6 ug/L08/13/93 MW-502B 1200 ug/L 09/25/97 MW-506A 1700 ug/L 10/21/93 MW-507B 100 ug/L 11/28/95 MW-532A 30 ug/L 09/24/04 MW-546A 110 ug/L 03/03/05 P-522A 3.3 ug/L08/13/93 MW-502B 930 ug/L 04/30/98 MW-506A 1400 ug/L 05/02/94 MW-507B 79 ug/L 01/16/96 MW-532A 31 ug/L 12/09/04 MW-546A 110 ug/L 09/08/05 P-522A 3.0 ug/L10/22/93 MW-502B 1300 ug/L 09/24/98 MW-506A 1400 ug/L 11/11/94 MW-507B 145 ug/L 03/28/96 MW-532A 18 ug/L 03/04/05 MW-546A 110 ug/L 12/14/94 P-522B 157 ug/L10/22/93 MW-502B 1300 ug/L 11/08/99 MW-506A 1700 ug/L 06/02/95 MW-507B 115 ug/L 09/23/97 MW-532A 39 ug/L 06/03/05 MW-546A 120 ug/L 03/31/96 P-522B 230 ug/L04/27/94 MW-502B 1200 ug/L 11/19/02 MW-506A 1000 ug/L 04/01/96 MW-507B 70 ug/L DJ 04/28/98 MW-532A 34 ug/L 09/08/05 MW-546A 130 ug/L 09/27/97 P-522B 180 ug/L11/09/94 MW-502B 1700 ug/L 03/24/03 MW-506A 850 ug/L 09/26/97 MW-507B 80 ug/L 09/22/98 MW-532A 30 ug/L 11/21/02 MW-549A 760 ug/L 09/27/97 P-522B 190 ug/L06/01/95 MW-502B 1510 ug/L 06/25/03 MW-506A 1000 ug/L 05/02/98 MW-507B 64 ug/L 11/10/99 MW-532A 32 ug/L 03/26/03 MW-549A 760 ug/L 05/01/98 P-522B 140 ug/L04/02/96 MW-502B 1300 ug/L DJ 09/23/03 MW-506A 960 ug/L 09/26/98 MW-507B 43 ug/L 11/20/02 MW-532A 37 ug/L 06/25/03 MW-549A 1200 ug/L 09/27/98 P-522B 180 ug/L09/28/97 MW-502B 1400 ug/L 12/10/03 MW-506A 830 ug/L 11/11/99 MW-507B 93 ug/L 03/27/03 MW-532A 26 ug/L 09/24/03 MW-549A 1100 ug/L 11/10/99 P-522B 200 ug/L05/02/98 MW-502B 1300 ug/L 03/09/04 MW-506A 940 ug/L 11/21/02 MW-507B 45 ug/L 03/25/04 MW-532A 33 ug/L 12/10/03 MW-549A 900 ug/L 11/19/02 P-522B 120 ug/L09/25/98 MW-502B 1300 ug/L 06/04/04 MW-506A 710 ug/L 03/26/03 MW-507B 20 ug/L 03/03/05 MW-532A 37 ug/L 03/09/04 MW-549A 1000 ug/L 03/25/03 P-522B 160 ug/L09/25/98 MW-502B 1300 ug/L 09/23/04 MW-506A 1300 ug/L 03/25/04 MW-507B 16 ug/L 03/07/06 MW-532A 40 ug/L 06/04/04 MW-549A 880 ug/L 09/23/03 P-522B 220 ug/L11/12/99 MW-502B 1500 ug/L 12/09/04 MW-506A 710 ug/L 03/04/05 MW-507B 20 ug/L 11/09/99 MW-544A <GWQS ug/L U 09/23/04 MW-549A 820 ug/L 03/09/04 P-522B 220 ug/L11/21/02 MW-502B 1000 ug/L 03/03/05 MW-506A 650 ug/L 03/07/06 MW-507B 19 ug/L 11/18/02 MW-544A <GWQS ug/L U 12/09/04 MW-549A 850 ug/L 09/24/04 P-522B 200 ug/L03/25/03 MW-502B 920 ug/L 06/03/05 MW-506A 730 ug/L 10/25/93 MW-508A 30 ug/L 03/24/03 MW-544A 0.5 ug/L 03/03/05 MW-549A 820 ug/L 03/03/05 P-522B 190 ug/L06/25/03 MW-502B 1100 ug/L 09/08/05 MW-506A 620 ug/L 05/02/94 MW-508A 35 ug/L 09/23/03 MW-544A 0.8 * ug/L 06/03/05 MW-549A 98 ug/L 09/08/05 P-522B 210 ug/L09/24/03 MW-502B 1100 ug/L 03/17/06 MW-506A 700 ug/L 11/12/94 MW-508A 36.8 ug/L 03/09/04 MW-544A <GWQS ug/L U 10/14/05 MW-549A 1100 ug/L 11/10/94 P-522C 18.6 ug/L12/11/03 MW-502B 670 ug/L 08/11/93 MW-506B 18 ug/L 06/03/95 MW-508A 38.4 ug/L 09/24/04 MW-544A <GWQS ug/L U 11/21/02 MW-549B 1400 ug/L 12/13/94 P-522C 20.9 ug/L03/09/04 MW-502B 730 ug/L 10/20/93 MW-506B 48 ug/L J 04/02/96 MW-508A 32 ug/L J 03/03/05 MW-544A 0.4 ug/L U 03/26/03 MW-549B 1900 ug/L 03/31/96 P-522C 50 ug/L06/04/04 MW-502B 390 ug/L 04/26/94 MW-506B 18 ug/L 04/02/96 MW-508A 38 ug/L J 09/08/05 MW-544A 0.4 ug/L U 06/25/03 MW-549B 2800 ug/L 09/27/97 P-522C 6.1 ug/L09/23/04 MW-502B 350 ug/L 11/11/94 MW-506B 19 ug/L 09/26/97 MW-508A 35 ug/L 03/07/06 MW-544A 0.4 ug/L U 09/24/03 MW-549B 2300 ug/L 05/01/98 P-522C 67 ug/L12/09/04 MW-502B 290 ug/L 06/01/95 MW-506B 40.4 ug/L 05/02/98 MW-508A 34 ug/L 11/09/99 MW-544B 0.4 ug/L 12/10/03 MW-549B 1800 ug/L 09/27/98 P-522C 16 ug/L03/03/05 MW-502B 330 ug/L 04/01/96 MW-506B 25 ug/L J 09/25/98 MW-508A 33 ug/L 11/18/02 MW-544B 0.5 ug/L 03/09/04 MW-549B 1200 ug/L 11/10/99 P-522C 12 ug/L06/03/05 MW-502B 340 ug/L 09/25/97 MW-506B 34 ug/L 11/11/99 MW-508A 34 ug/L 03/24/03 MW-544B 0.8 ug/L 06/04/04 MW-549B 1400 ug/L 11/19/02 P-522C 17 ug/L09/08/05 MW-502B 280 ug/L 04/30/98 MW-506B 26 ug/L 11/21/02 MW-508A 13 ug/L 09/23/03 MW-544B 0.6 ug/L 09/23/04 MW-549B 1500 ug/L 03/25/03 P-522C 22 ug/L03/07/06 MW-502B 300 ug/L 04/30/98 MW-506B 27 ug/L 03/26/03 MW-508A 30 ug/L 03/09/04 MW-544B 0.8 ug/L 12/09/04 MW-549B 1200 ug/L 09/23/03 P-522C 16 ug/L08/11/93 MW-505A <GWQS ug/L U 09/24/98 MW-506B 32 ug/L 03/25/04 MW-508A 35 ug/L 09/24/04 MW-544B 0.6 ug/L 03/03/05 MW-549B 1200 ug/L 03/09/04 P-522C 0.2 ug/L U10/19/93 MW-505A <GWQS ug/L U 11/08/99 MW-506B 50 ug/L 03/04/05 MW-508A 1.2 ug/L 03/03/05 MW-544B 0.4 ug/L U 06/03/05 MW-549B 650 ug/L 09/24/04 P-522C 0.4 ug/L U04/26/94 MW-505A <GWQS ug/L U 11/19/02 MW-506B 74 ug/L 03/07/06 MW-508A 0.5 ug/L 09/08/05 MW-544B 0.4 ug/L U 10/14/05 MW-549B 1300 ug/L 03/03/05 P-522C 25 ug/L11/08/94 MW-505A <GWQS ug/L U 03/24/03 MW-506B 24 ug/L 03/07/06 MW-544B 0.6 ug/L 11/21/02 MW-549C 2600 ug/L 09/08/05 P-522C 0.4 ug/L U05/31/95 MW-505A <GWQS ug/L U 06/25/03 MW-506B 12 ug/L 11/09/99 MW-544C 4.9 ug/L Nov-02 MW-550B 440 ug/L04/02/96 MW-505A <GWQS ug/L J 09/23/03 MW-506B 14 ug/L 11/18/02 MW-544C 1.7 ug/L Mar-03 MW-550B 870 ug/L09/23/97 MW-505A <GWQS ug/L U 12/10/03 MW-506B 15 ug/L 03/24/03 MW-544C 0.4 ug/L Sep-03 MW-550B 800 ug/L09/24/98 MW-505A <GWQS ug/L U 03/09/04 MW-506B 16 ug/L 09/23/03 MW-544C 1.3 ug/L Dec-03 MW-550B 780 ug/L11/09/99 MW-505A <GWQS ug/L U 06/04/04 MW-506B 13 ug/L 03/09/04 MW-544C 1.8 ug/L Mar-04 MW-550B 750 ug/L11/20/02 MW-505A <GWQS ug/L U 09/23/04 MW-506B 12 ug/L 09/24/04 MW-544C 1.3 ug/L Jun-04 MW-550B 650 ug/L03/25/03 MW-505A <GWQS ug/L U 12/09/04 MW-506B 15 ug/L 03/03/05 MW-544C 1.8 ug/L Sep-04 MW-550B 1400 ug/L03/25/04 MW-505A <GWQS ug/L U 03/03/05 MW-506B 16 ug/L 09/08/05 MW-544C 1.2 ug/L Dec-04 MW-550B 720 ug/L03/03/05 MW-505A <GWQS ug/L U 06/03/05 MW-506B 14 ug/L 03/07/06 MW-544C 1.5 ug/L Mar-05 MW-550B 620 ug/L03/07/06 MW-505A <GWQS ug/L U 10/01/05 MW-506B 36 ug/L 11/09/99 MW-545A 0 ug/L U Jun-05 MW-550B 760 ug/L
03/07/06 MW-506B 12 ug/L 11/18/02 MW-545A 0.2 ug/L Sep-05 MW-550B 740 ug/L03/25/03 MW-545A 0.4 ug/L09/23/03 MW-545A 0 ug/L U03/09/04 MW-545A 0 ug/L U
GWQS for TCE= 1 09/24/04 MW-545A 0.4 ug/L UBold- Concentration exceeds NJ Ground Water Quality Criteria 03/03/05 MW-545A 0.4 ug/L U
Indicates that well has either been abandoned or destroyed 09/08/05 MW-545A 0.4 ug/L Uug/L - micrograms/Liter 03/07/06 MW-545A 0.4 ug/L U
D - Concentration reported at dilutionJ - Data indicates the presence of a compound that meets the identification criteria. The result is less than the quantitation limit but greater than zero.
The concentration given is an approximate value. - Represents the highest concentration of the bags sampled on that date.
Q - QualifiersU - The compound was not detected at the indicated concentration
10:37 AM10/19/2006Page 1 of 1 2542\R\2005 Report\Table 5-Historical TCE Concentration in GW.xls\Sheet1

TABLE 6SURFACE WATER ANALYTICAL RESULTS - JULY 2005 THROUGH MARCH 2006
FORMER LEC SITEWATCHUNG, NEW JERSEY
Sample ID New Jersey TB FB SW-1 SW-2 SW-3 SW-4 SW-12Lab Sample Number Fresh Water - 2 652533 652532 652529 652528 652527 652531 652530Sampling Date Quality 07/15/05 07/15/05 07/15/05 07/15/05 07/15/05 07/15/05 07/15/05Matrix Criteria WATER WATER WATER WATER WATER WATER WATERDilution Factor 1.0 1.0 1.0 1.0 1.0 1.0 1.0Units ug/L ug/L ug/L ug/L ug/L ug/L ug/L ug/LVOLATILE COMPOUNDS (GC/MS)Chloromethane NA 0.3 U 0.3 U 0.3 U 0.3 U 0.3 U 0.3 U 0.3 UBromomethane 48.4 0.3 U 0.3 U 0.3 U 0.3 U 0.3 U 0.3 U 0.3 UVinyl Chloride 0.083 0.3 U 0.3 U 0.3 U 0.3 U 0.3 U 0.3 U 0.3 UChloroethane NA 0.2 U 0.2 U 0.2 U 0.2 U 0.2 U 0.2 U 0.2 UMethylene Chloride 2.49 0.5 U 0.5 U 0.5 U 0.5 U 0.5 U 0.5 U 0.5 UTrichlorofluoromethane NA 0.2 U 0.2 U 0.2 U 0.2 U 0.2 U 0.2 U 0.2 U1,1-Dichloroethene 4.81 0.4 U 0.4 U 0.4 U 0.4 U 0.4 U 0.4 U 0.4 U1,1-Dichloroethane NA 0.3 U 0.3 U 0.3 U 0.3 U 0.3 U 0.3 U 0.3 Utrans-1,2-Dichloroethene 592 0.4 U 0.4 U 0.4 U 0.4 U 0.4 U 0.4 U 0.4 Ucis-1,2-Dichloroethene NA 0.4 U 0.4 U 0.4 U 0.5 0.4 U 0.5 1.1Chloroform 5.67 0.5 U 0.5 U 0.5 U 0.5 U 0.5 U 0.5 U 0.5 U1,2-Dichloroethane 0.291 0.3 U 0.3 U 0.3 U 0.3 U 0.3 U 0.3 U 0.3 U1,1,1-Trichloroethane 127 0.3 U 0.3 U 0.3 U 0.3 U 0.3 U 0.3 U 0.3 UCarbon Tetrachloride 0.363 0.3 U 0.3 U 0.3 U 0.3 U 0.3 U 0.3 U 0.3 UBromodichloromethane 0.266 0.3 U 0.3 U 0.3 U 0.3 U 0.3 U 0.3 U 0.3 U1,2-Dichloropropane NA 0.3 U 0.3 U 0.3 U 0.3 U 0.3 U 0.3 U 0.3 Ucis-1,3-Dichloropropene 0.193 0.2 U 0.2 U 0.2 U 0.2 U 0.2 U 0.2 U 0.2 UTrichloroethene 1.09 0.4 U 0.4 U 0.4 U 0.4 U 0.4 U 0.4 U 3.3Dibromochloromethane 72.6 0.3 U 0.3 U 0.3 U 0.3 U 0.3 U 0.3 U 0.3 U1,1,2-Trichloroethane 13.5 0.3 U 0.3 U 0.3 U 0.3 U 0.3 U 0.3 U 0.3 UBenzene 0.15 0.3 U 0.3 U 0.3 U 0.3 U 0.3 U 0.3 U 0.3 Utrans-1,3-Dichloropropene 0.193 0.2 U 0.2 U 0.2 U 0.2 U 0.2 U 0.2 U 0.2 U2-Chloroethyl Vinyl Ether NA 0.4 U 0.4 U 0.4 U 0.4 U 0.4 U 0.4 U 0.4 UBromoform 4.38 0.2 U 0.2 U 0.2 U 0.2 U 0.2 U 0.2 U 0.2 UTetrachloroethene 0.388 0.4 U 0.4 U 0.4 U 0.4 U 0.4 U 0.4 U 0.4 U1,1,2,2-Tetrachloroethane 1.72 0.3 U 0.3 U 0.3 U 0.3 U 0.3 U 0.3 U 0.3 UToluene 7440 0.4 U 0.4 U 0.4 U 0.4 U 0.4 U 0.4 U 0.4 UChlorobenzene 22.0 0.4 U 0.4 U 0.4 U 0.4 U 0.4 U 0.4 U 0.4 UEthylbenzene 3030 0.5 U 0.5 U 0.5 U 0.5 U 0.5 U 0.5 U 0.5 UXylene (Total) NA 0.4 U 0.4 U 0.4 U 0.4 U 0.4 U 0.4 U 0.4 UTotal Confident Conc. VOAs (s) ND ND ND 0.5 ND 0.5 4.4Total Estimated Conc. VOA TICs (s) ND ND ND ND ND ND ND
micrograms/LiterThe compound was not detected at the indicated concentrationNo applicable CriteriaVolatile Organic CompoundsTentatively Identified CompoundsConcentration exceeds Fresh Water Quality CriteriaThe numbers in italics are NJ Fresh Water Quality Criteria.
10/19/2006 10:32 AM Page 1 of 5 2542\R\2005 Report\Tables4and6.xls\Table 6

TABLE 6SURFACE WATER ANALYTICAL RESULTS - JULY 2005 THROUGH MARCH 2006
FORMER LEC SITEWATCHUNG, NEW JERSEY
Sample ID New JerseyLab Sample Number Fresh Water - 2Sampling Date QualityMatrix CriteriaDilution FactorUnits ug/LVOLATILE COMPOUNDS (GC/MS)Chloromethane NABromomethane 48.4Vinyl Chloride 0.083Chloroethane NAMethylene Chloride 2.49Trichlorofluoromethane NA1,1-Dichloroethene 4.811,1-Dichloroethane NAtrans-1,2-Dichloroethene 592cis-1,2-Dichloroethene NAChloroform 5.671,2-Dichloroethane 0.2911,1,1-Trichloroethane 127Carbon Tetrachloride 0.363Bromodichloromethane 0.2661,2-Dichloropropane NAcis-1,3-Dichloropropene 0.193Trichloroethene 1.09Dibromochloromethane 72.61,1,2-Trichloroethane 13.5Benzene 0.15trans-1,3-Dichloropropene 0.1932-Chloroethyl Vinyl Ether NABromoform 4.38Tetrachloroethene 0.3881,1,2,2-Tetrachloroethane 1.72Toluene 7440Chlorobenzene 22.0Ethylbenzene 3030Xylene (Total) NATotal Confident Conc. VOAs (s)Total Estimated Conc. VOA TICs (s)
micrograms/LiterThe compound was not detected at the indicated concentrationNo applicable CriteriaVolatile Organic CompoundsTentatively Identified CompoundsConcentration exceeds Fresh Water Quality CriteriaThe numbers in italics are NJ Fresh Water Quality Criteria.
TB FB SW-2 SW-3 SW-4 SW-12660290 660289 660294 660293 660291 660292
08/12/05 08/12/05 08/12/05 08/12/05 08/12/05 08/12/05WATER WATER WATER WATER WATER WATER
1.0 1.0 1.0 1.0 1.0 1.0ug/L ug/L ug/L ug/L ug/L ug/L
0.3 U 0.3 U 0.3 U 0.3 U 0.3 U 0.3 U0.3 U 0.3 U 0.3 U 0.3 U 0.3 U 0.3 U0.3 U 0.3 U 0.3 U 0.3 U 0.3 U 0.3 U0.2 U 0.2 U 0.2 U 0.2 U 0.2 U 0.2 U0.7 1.0 0.5 U 0.5 U 0.5 U 0.5 U0.2 U 0.2 U 0.2 U 0.2 U 0.2 U 0.2 U0.4 U 0.4 U 0.4 U 0.4 U 0.4 U 0.4 U0.3 U 0.3 U 0.3 U 0.3 U 0.3 U 0.3 U0.4 U 0.4 U 0.4 U 0.4 U 0.4 U 0.4 U0.4 U 0.4 U 0.4 U 0.4 U 0.4 U 0.80.5 U 0.5 U 0.5 U 0.5 U 0.5 U 0.5 U0.3 U 0.3 U 0.3 U 0.3 U 0.3 U 0.3 U0.3 U 0.3 U 0.3 U 0.3 U 0.3 U 0.3 U0.3 U 0.3 U 0.3 U 0.3 U 0.3 U 0.3 U0.3 U 0.3 U 0.3 U 0.3 U 0.3 U 0.3 U0.3 U 0.3 U 0.3 U 0.3 U 0.3 U 0.3 U0.2 U 0.2 U 0.2 U 0.2 U 0.2 U 0.2 U0.4 U 0.4 U 0.4 U 0.4 U 0.4 U 3.00.3 U 0.3 U 0.3 U 0.3 U 0.3 U 0.3 U0.3 U 0.3 U 0.3 U 0.3 U 0.3 U 0.3 U0.3 U 0.3 U 0.3 U 0.3 U 0.3 U 0.3 U0.2 U 0.2 U 0.2 U 0.2 U 0.2 U 0.2 U0.4 U 0.4 U 0.4 U 0.4 U 0.4 U 0.4 U0.2 U 0.2 U 0.2 U 0.2 U 0.2 U 0.2 U0.4 U 0.4 U 0.4 U 0.4 U 0.4 U 0.4 U0.3 U 0.3 U 0.3 U 0.3 U 0.3 U 0.3 U0.4 U 0.4 U 0.4 U 0.4 U 0.4 U 0.4 U0.4 U 0.4 U 0.4 U 0.4 U 0.4 U 0.4 U0.5 U 0.5 U 0.5 U 0.5 U 0.5 U 0.5 U0.4 U 0.4 U 0.4 U 0.4 U 0.4 U 0.4 U0.7 1.0 ND ND ND 3.8ND ND ND ND ND ND
10/19/2006 10:32 AM Page 2 of 5 2542\R\2005 Report\Tables4and6.xls\Table 6
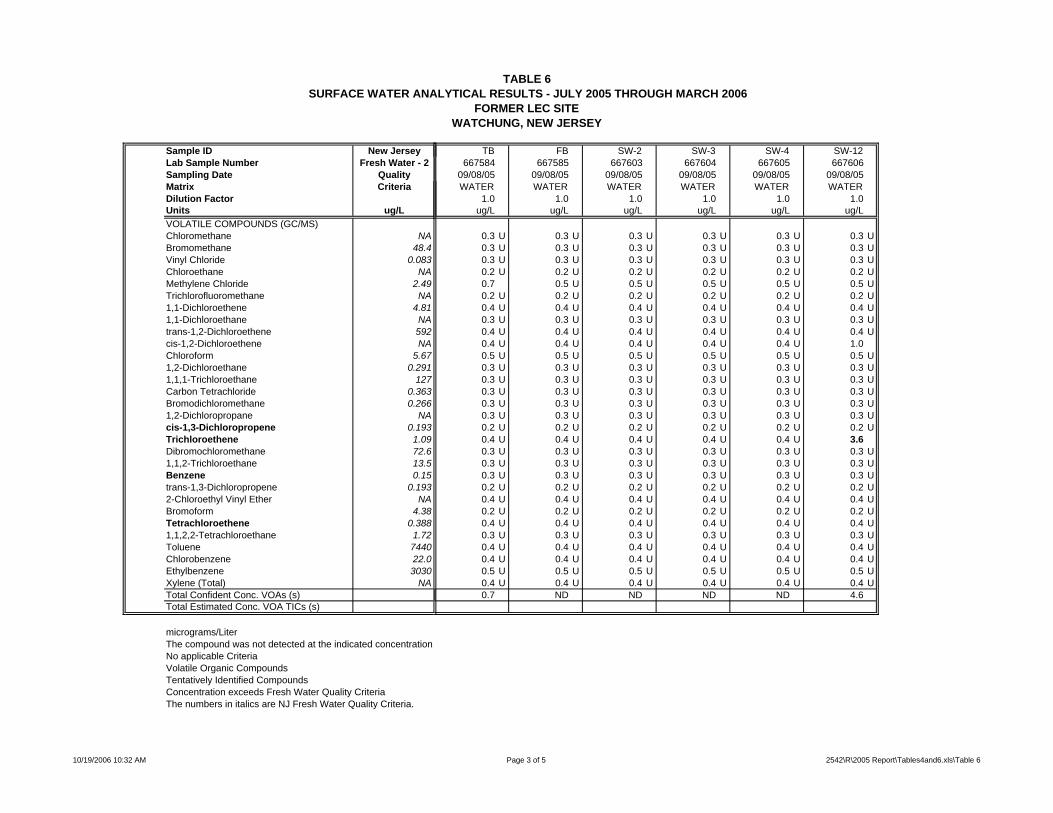
TABLE 6SURFACE WATER ANALYTICAL RESULTS - JULY 2005 THROUGH MARCH 2006
FORMER LEC SITEWATCHUNG, NEW JERSEY
Sample ID New JerseyLab Sample Number Fresh Water - 2Sampling Date QualityMatrix CriteriaDilution FactorUnits ug/LVOLATILE COMPOUNDS (GC/MS)Chloromethane NABromomethane 48.4Vinyl Chloride 0.083Chloroethane NAMethylene Chloride 2.49Trichlorofluoromethane NA1,1-Dichloroethene 4.811,1-Dichloroethane NAtrans-1,2-Dichloroethene 592cis-1,2-Dichloroethene NAChloroform 5.671,2-Dichloroethane 0.2911,1,1-Trichloroethane 127Carbon Tetrachloride 0.363Bromodichloromethane 0.2661,2-Dichloropropane NAcis-1,3-Dichloropropene 0.193Trichloroethene 1.09Dibromochloromethane 72.61,1,2-Trichloroethane 13.5Benzene 0.15trans-1,3-Dichloropropene 0.1932-Chloroethyl Vinyl Ether NABromoform 4.38Tetrachloroethene 0.3881,1,2,2-Tetrachloroethane 1.72Toluene 7440Chlorobenzene 22.0Ethylbenzene 3030Xylene (Total) NATotal Confident Conc. VOAs (s)Total Estimated Conc. VOA TICs (s)
micrograms/LiterThe compound was not detected at the indicated concentrationNo applicable CriteriaVolatile Organic CompoundsTentatively Identified CompoundsConcentration exceeds Fresh Water Quality CriteriaThe numbers in italics are NJ Fresh Water Quality Criteria.
TB FB SW-2 SW-3 SW-4 SW-12667584 667585 667603 667604 667605 667606
09/08/05 09/08/05 09/08/05 09/08/05 09/08/05 09/08/05WATER WATER WATER WATER WATER WATER
1.0 1.0 1.0 1.0 1.0 1.0ug/L ug/L ug/L ug/L ug/L ug/L
0.3 U 0.3 U 0.3 U 0.3 U 0.3 U 0.3 U0.3 U 0.3 U 0.3 U 0.3 U 0.3 U 0.3 U0.3 U 0.3 U 0.3 U 0.3 U 0.3 U 0.3 U0.2 U 0.2 U 0.2 U 0.2 U 0.2 U 0.2 U0.7 0.5 U 0.5 U 0.5 U 0.5 U 0.5 U0.2 U 0.2 U 0.2 U 0.2 U 0.2 U 0.2 U0.4 U 0.4 U 0.4 U 0.4 U 0.4 U 0.4 U0.3 U 0.3 U 0.3 U 0.3 U 0.3 U 0.3 U0.4 U 0.4 U 0.4 U 0.4 U 0.4 U 0.4 U0.4 U 0.4 U 0.4 U 0.4 U 0.4 U 1.00.5 U 0.5 U 0.5 U 0.5 U 0.5 U 0.5 U0.3 U 0.3 U 0.3 U 0.3 U 0.3 U 0.3 U0.3 U 0.3 U 0.3 U 0.3 U 0.3 U 0.3 U0.3 U 0.3 U 0.3 U 0.3 U 0.3 U 0.3 U0.3 U 0.3 U 0.3 U 0.3 U 0.3 U 0.3 U0.3 U 0.3 U 0.3 U 0.3 U 0.3 U 0.3 U0.2 U 0.2 U 0.2 U 0.2 U 0.2 U 0.2 U0.4 U 0.4 U 0.4 U 0.4 U 0.4 U 3.60.3 U 0.3 U 0.3 U 0.3 U 0.3 U 0.3 U0.3 U 0.3 U 0.3 U 0.3 U 0.3 U 0.3 U0.3 U 0.3 U 0.3 U 0.3 U 0.3 U 0.3 U0.2 U 0.2 U 0.2 U 0.2 U 0.2 U 0.2 U0.4 U 0.4 U 0.4 U 0.4 U 0.4 U 0.4 U0.2 U 0.2 U 0.2 U 0.2 U 0.2 U 0.2 U0.4 U 0.4 U 0.4 U 0.4 U 0.4 U 0.4 U0.3 U 0.3 U 0.3 U 0.3 U 0.3 U 0.3 U0.4 U 0.4 U 0.4 U 0.4 U 0.4 U 0.4 U0.4 U 0.4 U 0.4 U 0.4 U 0.4 U 0.4 U0.5 U 0.5 U 0.5 U 0.5 U 0.5 U 0.5 U0.4 U 0.4 U 0.4 U 0.4 U 0.4 U 0.4 U0.7 ND ND ND ND 4.6
10/19/2006 10:32 AM Page 3 of 5 2542\R\2005 Report\Tables4and6.xls\Table 6

TABLE 6SURFACE WATER ANALYTICAL RESULTS - JULY 2005 THROUGH MARCH 2006
FORMER LEC SITEWATCHUNG, NEW JERSEY
Sample ID New JerseyLab Sample Number Fresh Water - 2Sampling Date QualityMatrix CriteriaDilution FactorUnits ug/LVOLATILE COMPOUNDS (GC/MS)Chloromethane NABromomethane 48.4Vinyl Chloride 0.083Chloroethane NAMethylene Chloride 2.49Trichlorofluoromethane NA1,1-Dichloroethene 4.811,1-Dichloroethane NAtrans-1,2-Dichloroethene 592cis-1,2-Dichloroethene NAChloroform 5.671,2-Dichloroethane 0.2911,1,1-Trichloroethane 127Carbon Tetrachloride 0.363Bromodichloromethane 0.2661,2-Dichloropropane NAcis-1,3-Dichloropropene 0.193Trichloroethene 1.09Dibromochloromethane 72.61,1,2-Trichloroethane 13.5Benzene 0.15trans-1,3-Dichloropropene 0.1932-Chloroethyl Vinyl Ether NABromoform 4.38Tetrachloroethene 0.3881,1,2,2-Tetrachloroethane 1.72Toluene 7440Chlorobenzene 22.0Ethylbenzene 3030Xylene (Total) NATotal Confident Conc. VOAs (s)Total Estimated Conc. VOA TICs (s)
micrograms/LiterThe compound was not detected at the indicated concentrationNo applicable CriteriaVolatile Organic CompoundsTentatively Identified CompoundsConcentration exceeds Fresh Water Quality CriteriaThe numbers in italics are NJ Fresh Water Quality Criteria.
SW-12 SW-4 SW-3 SW-2 SW-1 SW-12 SW-4677750 677751 677744 677748 677749 689254 689255
10/14/05 10/14/05 10/14/05 10/14/05 10/14/05 11/22/05 11/22/05WATER WATER WATER WATER WATER WATER WATER
1.0 1.0 1.0 1.0 1.0 1.0 1.0ug/L ug/L ug/L ug/L ug/L ug/L ug/L
0.3 U 0.3 U 0.3 U 0.3 U 0.3 U 0.3 U 0.3 U0.3 U 0.3 U 0.3 U 0.3 U 0.3 U 0.3 U 0.3 U0.3 U 0.3 U 0.3 U 0.3 U 0.3 U 0.3 U 0.3 U0.2 U 0.2 U 0.2 U 0.2 U 0.2 U 0.2 U 0.2 U0.5 U 0.5 U 0.5 U 0.5 U 0.5 U 0.5 U 0.5 U0.2 U 0.2 U 0.2 U 0.2 U 0.2 U 0.2 U 0.2 U0.4 U 0.4 U 0.4 U 0.4 U 0.4 U 0.4 U 0.4 U0.3 U 0.3 U 0.3 U 0.3 U 0.3 U 0.3 U 0.3 U0.4 U 0.4 U 0.4 U 0.4 U 0.4 U 0.4 U 0.4 U0.4 U 0.4 U 0.4 U 0.4 U 0.4 U 0.4 U 0.4 U0.5 U 0.5 U 0.5 U 0.5 U 0.5 U 0.5 U 0.5 U0.3 U 0.3 U 0.3 U 0.3 U 0.3 U 0.3 U 0.3 U0.3 U 0.3 U 0.3 U 0.3 U 0.3 U 0.3 U 0.3 U0.3 U 0.3 U 0.3 U 0.3 U 0.3 U 0.3 U 0.3 U0.3 U 0.3 U 0.3 U 0.3 U 0.3 U 0.3 U 0.3 U0.3 U 0.3 U 0.3 U 0.3 U 0.3 U 0.3 U 0.3 U0.2 U 0.2 U 0.2 U 0.2 U 0.2 U 0.2 U 0.2 U0.4 U 0.4 U 0.4 U 0.4 U 0.4 U 0.4 U 0.4 U0.3 U 0.3 U 0.3 U 0.3 U 0.3 U 0.3 U 0.3 U0.3 U 0.3 U 0.3 U 0.3 U 0.3 U 0.3 U 0.3 U0.3 U 0.3 U 0.3 U 0.3 U 0.3 U 0.3 U 0.3 U0.2 U 0.2 U 0.2 U 0.2 U 0.2 U 0.2 U 0.2 U0.4 U 0.4 U 0.4 U 0.4 U 0.4 U 0.4 U 0.4 U0.2 U 0.2 U 0.2 U 0.2 U 0.2 U 0.2 U 0.2 U0.4 U 0.4 U 0.4 U 0.4 U 0.4 U 0.4 U 0.4 U0.3 U 0.3 U 0.3 U 0.3 U 0.3 U 0.3 U 0.3 U0.4 U 0.4 U 0.4 U 0.4 U 0.4 U 0.4 U 0.4 U0.4 U 0.4 U 0.4 U 0.4 U 0.4 U 0.4 U 0.4 U0.5 U 0.5 U 0.5 U 0.5 U 0.5 U 0.5 U 0.5 U0.4 U 0.4 U 0.4 U 0.4 U 0.4 U 0.4 U 0.4 U
0 0 0 0 0 0 00 0 0 0 0 0 0
10/19/2006 10:32 AM Page 4 of 5 2542\R\2005 Report\Tables4and6.xls\Table 6

TABLE 6SURFACE WATER ANALYTICAL RESULTS - JULY 2005 THROUGH MARCH 2006
FORMER LEC SITEWATCHUNG, NEW JERSEY
Sample ID New JerseyLab Sample Number Fresh Water - 2Sampling Date QualityMatrix CriteriaDilution FactorUnits ug/LVOLATILE COMPOUNDS (GC/MS)Chloromethane NABromomethane 48.4Vinyl Chloride 0.083Chloroethane NAMethylene Chloride 2.49Trichlorofluoromethane NA1,1-Dichloroethene 4.811,1-Dichloroethane NAtrans-1,2-Dichloroethene 592cis-1,2-Dichloroethene NAChloroform 5.671,2-Dichloroethane 0.2911,1,1-Trichloroethane 127Carbon Tetrachloride 0.363Bromodichloromethane 0.2661,2-Dichloropropane NAcis-1,3-Dichloropropene 0.193Trichloroethene 1.09Dibromochloromethane 72.61,1,2-Trichloroethane 13.5Benzene 0.15trans-1,3-Dichloropropene 0.1932-Chloroethyl Vinyl Ether NABromoform 4.38Tetrachloroethene 0.3881,1,2,2-Tetrachloroethane 1.72Toluene 7440Chlorobenzene 22.0Ethylbenzene 3030Xylene (Total) NATotal Confident Conc. VOAs (s)Total Estimated Conc. VOA TICs (s)
micrograms/LiterThe compound was not detected at the indicated concentrationNo applicable CriteriaVolatile Organic CompoundsTentatively Identified CompoundsConcentration exceeds Fresh Water Quality CriteriaThe numbers in italics are NJ Fresh Water Quality Criteria.
SW-3 SW-2 SW-1 SW-4 SW-3 SW-2 SW-1 FB030306689256 689257 689258 714107 714108 714109 714110 714111
11/22/05 11/22/05 11/22/05 03/06/06 03/06/06 03/06/06 03/06/06 03/06/06WATER WATER WATER WATER WATER WATER WATER WATER
1.0 1.0 1.0 1.0 1.0 1.0 1.0 1.0ug/L ug/L ug/L ug/L ug/L ug/L ug/L ug/L
0.3 U 0.3 U 0.3 U 0.3 U 0.3 U 0.3 U 0.3 U 0.3 U0.3 U 0.3 U 0.3 U 0.3 U 0.3 U 0.3 U 0.3 U 0.3 U0.3 U 0.3 U 0.3 U 0.3 U 0.3 U 0.3 U 0.3 U 0.3 U0.2 U 0.2 U 0.2 U 0.2 U 0.2 U 0.2 U 0.2 U 0.2 U0.5 U 0.5 U 0.5 U 0.5 U 0.5 U 0.5 U 0.5 U 0.5 U0.2 U 0.2 U 0.2 U 0.2 U 0.2 U 0.2 U 0.2 U 0.2 U0.4 U 0.4 U 0.4 U 0.4 U 0.4 U 0.4 U 0.4 U 0.4 U0.3 U 0.3 U 0.3 U 0.3 U 0.3 U 0.3 U 0.3 U 0.3 U0.4 U 0.4 U 0.4 U 0.4 U 0.4 U 0.4 U 0.4 U 0.4 U0.4 U 0.4 U 0.4 U 0.4 U 0.4 U 0.4 U 0.4 U 0.4 U0.5 U 0.5 U 0.5 U 0.5 U 0.5 U 0.5 U 0.5 U 0.5 U0.3 U 0.3 U 0.3 U 0.3 U 0.3 U 0.3 U 0.3 U 0.3 U0.3 U 0.3 U 0.3 U 0.3 U 0.3 U 0.3 U 0.3 U 0.3 U0.3 U 0.3 U 0.3 U 0.3 U 0.3 U 0.3 U 0.3 U 0.3 U0.3 U 0.3 U 0.3 U 0.3 U 0.3 U 0.3 U 0.3 U 0.3 U0.3 U 0.3 U 0.3 U 0.3 U 0.3 U 0.3 U 0.3 U 0.3 U0.2 U 0.2 U 0.2 U 0.2 U 0.2 U 0.2 U 0.2 U 0.2 U0.4 U 0.4 U 0.4 U 0.4 U 0.6 1.2 0.4 U 0.4 U0.3 U 0.3 U 0.3 U 0.3 U 0.3 U 0.3 U 0.3 U 0.3 U0.3 U 0.3 U 0.3 U 0.3 U 0.3 U 0.3 U 0.3 U 0.3 U0.3 U 0.3 U 0.3 U 0.3 U 0.3 U 0.3 U 0.3 U 0.3 U0.2 U 0.2 U 0.2 U 0.2 U 0.2 U 0.2 U 0.2 U 0.2 U0.4 U 0.4 U 0.4 U 0.4 U 0.4 U 0.4 U 0.4 U 0.4 U0.2 U 0.2 U 0.2 U 0.2 U 0.2 U 0.2 U 0.2 U 0.2 U0.4 U 0.4 U 0.4 U 0.4 U 0.4 U 0.4 U 0.4 U 0.4 U0.3 U 0.3 U 0.3 U 0.3 U 0.3 U 0.3 U 0.3 U 0.3 U0.4 U 0.4 U 0.4 U 0.4 U 0.4 U 0.4 U 0.4 U 0.4 U0.4 U 0.4 U 0.4 U 0.4 U 0.4 U 0.4 U 0.4 U 0.4 U0.5 U 0.5 U 0.5 U 0.5 U 0.5 U 0.5 U 0.5 U 0.5 U0.4 U 0.4 U 0.4 U 0.4 U 0.4 U 0.4 U 0.4 U 0.4 U
0 0 0 0 0.6 1.2 0 00 0 0 0 0 0 0 0
10/19/2006 10:32 AM Page 5 of 5 2542\R\2005 Report\Tables4and6.xls\Table 6

TABLE 7HISTORICAL TCE CONCENTRATIONS IN STREAM LOCATIONS
FORMER LEC SITEWATCHUNG, NEW JERSEY
Location Sample Date Analyte Conc Result Unit QualifiersSW-1 May-94 Trichloroethene 0.5 ug/LSW-1 Jun-94 Trichloroethene 0.81 ug/LSW-1 Jun-94 Trichloroethene 0.88 ug/LSW-1 Jul-94 Trichloroethene 0.29 ug/L JSW-1 Aug-94 Trichloroethene 0.12 ug/L JSW-1 Feb-95 Trichloroethene 0.84 ug/LSW-1 Apr-96 Trichloroethene 0.6 ug/LSW-1 Apr-98 Trichloroethene 0.9 ug/LSW-1 Nov-99 Trichloroethene 0.4 ug/LSW-1 Dec-02 Trichloroethene 0 ug/LSW-1 Mar-03 Trichloroethene 0 ug/LSW-1 Jul-03 Trichloroethene 0.7 ug/LSW-1 Aug-03 Trichloroethene 0.2 ug/L USW-1 Sep-03 Trichloroethene 0.3 ug/L USW-1 Oct-03 Trichloroethene 0.2 ug/L USW-1 Nov-03 Trichloroethene 0.2 ug/L USW-1 Dec-03 Trichloroethene 0.2 ug/L USW-1 Jan-04 Trichloroethene 0.2 ug/L USW-1 Feb-04 Trichloroethene 0.2 ug/L USW-1 Mar-04 Trichloroethene 0.2 ug/L USW-1 Apr-04 Trichloroethene 0.2 ug/L USW-1 May-04 Trichloroethene 0.2 ug/L USW-1 Jun-04 Trichloroethene 0.2 ug/L USW-1 Jul-04 Trichloroethene 0.4 ug/L USW-1 Aug-04 Trichloroethene 0.4 ug/L USW-1 Sep-04 Trichloroethene 0.4 ug/L USW-1 Oct-04 Trichloroethene 0.4 ug/L USW-1 Nov-04 Trichloroethene 0.4 ug/L USW-1 Dec-04 Trichloroethene 0.4 ug/L USW-1 Jan-05 Trichloroethene 0.4 ug/L USW-1 Feb-05 Trichloroethene 0.4 ug/L USW-1 Mar-05 Trichloroethene 0.4 ug/L USW-1 Apr-05 Trichloroethene 0.4 ug/L USW-1 May-05 Trichloroethene 0.4 ug/L USW-1 Jun-05 Trichloroethene 0.4 ug/L USW-1 Jul-05 Trichloroethene 0.4 ug/L USW-1 Aug-05 Trichloroethene NS NS NSSW-1 Sep-05 Trichloroethene NS NS NSSW-1 Oct-05 Trichloroethene 0.4 ug/L USW-1 Nov-05 Trichloroethene 0.4 ug/L USW-1 Mar-06 Trichloroethene 0.4 ug/L USW-2 Aug-93 Trichloroethene 39 ug/LSW-2 Aug-93 Trichloroethene 41 ug/LSW-2 Oct-93 Trichloroethene 160 ug/LSW-2 May-94 Trichloroethene 72 ug/LSW-2 Jun-94 Trichloroethene 55 ug/LSW-2 Jun-94 Trichloroethene 59 ug/LSW-2 Jun-94 Trichloroethene 63 ug/LSW-2 Jul-94 Trichloroethene 53 ug/LSW-2 Jul-94 Trichloroethene 42 ug/LSW-2 Aug-94 Trichloroethene 69 ug/L DSW-2 Oct-94 Trichloroethene 47 ug/LSW-2 Nov-94 Trichloroethene 71.2 ug/L JSW-2 Dec-94 Trichloroethene 75.5 ug/LSW-2 Jan-95 Trichloroethene 42 ug/LSW-2 Feb-95 Trichloroethene 81.1 ug/LSW-2 Apr-95 Trichloroethene 108 ug/L
10/19/2006 10:41 AM Page 1 of 5 2542\R\2005 Report\Table 7-historical TCE Concentrations in SW.xls\Data_Sheet1

TABLE 7HISTORICAL TCE CONCENTRATIONS IN STREAM LOCATIONS
FORMER LEC SITEWATCHUNG, NEW JERSEY
Location Sample Date Analyte Conc Result Unit QualifiersSW-2 Jun-95 Trichloroethene 67.7 ug/LSW-2 Jun-95 Trichloroethene 70.9 ug/LSW-2 Jun-95 Trichloroethene 98.7 ug/LSW-2 Aug-95 Trichloroethene 127 ug/LSW-2 Apr-96 Trichloroethene 26 ug/LSW-2 Apr-96 Trichloroethene 27 ug/LSW-2 Sep-97 Trichloroethene 36.8 ug/LSW-2 Sep-97 Trichloroethene 41.9 ug/LSW-2 Apr-98 Trichloroethene 45.4 ug/LSW-2 Apr-98 Trichloroethene 48 ug/LSW-2 Sep-98 Trichloroethene 68.7 ug/LSW-2 Nov-99 Trichloroethene 80.1 ug/LSW-2 Mar-00 Trichloroethene 80 ug/LSW-2 Dec-02 Trichloroethene 57 ug/LSW-2 Mar-03 Trichloroethene 33 ug/LSW-2 Jul-03 Trichloroethene 3.6 ug/LSW-2 Aug-03 Trichloroethene 2.2 ug/LSW-2 Sep-03 Trichloroethene 0.3 ug/L USW-2 Oct-03 Trichloroethene 0.2 ug/L USW-2 Nov-03 Trichloroethene 0.2 ug/L USW-2 Dec-03 Trichloroethene 0.2 ug/L USW-2 Jan-04 Trichloroethene 2.1 ug/LSW-2 Feb-04 Trichloroethene 1.4 ug/LSW-2 Mar-04 Trichloroethene 0.2 ug/L USW-2 Apr-04 Trichloroethene 0.4 ug/LSW-2 May-04 Trichloroethene 2.2 ug/LSW-2 Jun-04 Trichloroethene 0.2 ug/L USW-2 Jul-04 Trichloroethene 0.4 ug/L USW-2 Aug-04 Trichloroethene 0.6 ug/LSW-2 Sep-04 Trichloroethene 0.4 ug/L USW-2 Oct-04 Trichloroethene 1.7 ug/LSW-2 Nov-04 Trichloroethene 0.4 ug/L USW-2 Dec-04 Trichloroethene 0.5 ug/LSW-2 Jan-05 Trichloroethene 0.5 ug/LSW-2 Feb-05 Trichloroethene 0.8 ug/LSW-2 Mar-05 Trichloroethene 2.6 ug/LSW-2 Apr-05 Trichloroethene 0.8 ug/LSW-2 May-05 Trichloroethene 0.4 ug/L USW-2 Jun-05 Trichloroethene 0.5 ug/LSW-2 Jul-05 Trichloroethene 0.4 ug/L USW-2 Aug-05 Trichloroethene 0.4 ug/L USW-2 Sep-05 Trichloroethene 0.4 ug/L USW-2 Oct-05 Trichloroethene 0.4 ug/L USW-2 Nov-05 Trichloroethene 0.4 ug/L USW-2 Mar-06 Trichloroethene 1.2 ug/LSW-3 Jun-94 Trichloroethene 34.00 ug/LSW-3 Jun-94 Trichloroethene 36.00 ug/LSW-3 Jul-94 Trichloroethene 29.00 ug/LSW-3 Jul-94 Trichloroethene 26.00 ug/LSW-3 Aug-94 Trichloroethene 32.00 ug/LSW-3 Oct-94 Trichloroethene 14.5 ug/LSW-3 Nov-94 Trichloroethene 26.6 ug/L JSW-3 Dec-94 Trichloroethene 48.4 ug/LSW-3 Jan-95 Trichloroethene 31.7 ug/LSW-3 Feb-95 Trichloroethene 63.2 ug/LSW-3 Apr-95 Trichloroethene 48 ug/LSW-3 Apr-95 Trichloroethene 51.4 ug/L
10/19/2006 10:41 AM Page 2 of 5 2542\R\2005 Report\Table 7-historical TCE Concentrations in SW.xls\Data_Sheet1

TABLE 7HISTORICAL TCE CONCENTRATIONS IN STREAM LOCATIONS
FORMER LEC SITEWATCHUNG, NEW JERSEY
Location Sample Date Analyte Conc Result Unit QualifiersSW-3 Jun-95 Trichloroethene 29 ug/LSW-3 Jun-95 Trichloroethene 7.51 ug/LSW-3 Aug-95 Trichloroethene 32 ug/LSW-3 Apr-96 Trichloroethene 24 ug/LSW-3 Sep-97 Trichloroethene 43.7 ug/LSW-3 Apr-98 Trichloroethene 47 ug/LSW-3 Sep-98 Trichloroethene 26.6 ug/LSW-3 Sep-98 Trichloroethene 27.8 ug/LSW-3 Nov-99 Trichloroethene 41.4 ug/LSW-3 Mar-00 Trichloroethene 60 ug/LSW-3 Dec-02 Trichloroethene 44 ug/LSW-3 Mar-03 Trichloroethene 28 ug/LSW-3 Jul-03 Trichloroethene 2.6 ug/LSW-3 Aug-03 Trichloroethene 1.2 ug/LSW-3 Sep-03 Trichloroethene 0.3 ug/L USW-3 Oct-03 Trichloroethene 0.2 ug/L USW-3 Nov-03 Trichloroethene 0.2 ug/L USW-3 Dec-03 Trichloroethene 0.2 ug/L USW-3 Jan-04 Trichloroethene 1.1 ug/LSW-3 Feb-04 Trichloroethene 0.8 ug/LSW-3 Mar-04 Trichloroethene 0.2 ug/L USW-3 Apr-04 Trichloroethene 0.3 ug/LSW-3 May-04 Trichloroethene 1.2 ug/LSW-3 Jun-04 Trichloroethene 0.2 ug/L USW-3 Jul-04 Trichloroethene 0.4 ug/L USW-3 Aug-04 Trichloroethene 0.4 ug/L USW-3 Sep-04 Trichloroethene 0.4 ug/L USW-3 Oct-04 Trichloroethene 0.7 ug/LSW-3 Nov-04 Trichloroethene 0.4 ug/L USW-3 Dec-04 Trichloroethene 0.4 ug/L USW-3 Jan-05 Trichloroethene 0.4 ug/L USW-3 Feb-05 Trichloroethene 0.4 ug/LSW-3 Mar-05 Trichloroethene 1.6 ug/LSW-3 Apr-05 Trichloroethene 0.4 ug/L USW-3 May-05 Trichloroethene 0.4 ug/L USW-3 Jun-05 Trichloroethene 0.4 ug/L USW-3 Jul-05 Trichloroethene 0.4 ug/L USW-3 Aug-05 Trichloroethene 0.4 ug/L USW-3 Sep-05 Trichloroethene 0.4 ug/L USW-3 Oct-05 Trichloroethene 0.4 ug/L USW-3 Nov-05 Trichloroethene 0.4 ug/L USW-3 Mar-06 Trichloroethene 0.6 ug/LSW-4 May-94 Trichloroethene 14 ug/LSW-4 Jun-94 Trichloroethene 14 ug/LSW-4 Jun-94 Trichloroethene 6.9 ug/LSW-4 Jul-94 Trichloroethene 6.5 ug/LSW-4 Jul-94 Trichloroethene 6.6 ug/LSW-4 Jul-94 Trichloroethene 9.4 ug/LSW-4 Aug-94 Trichloroethene 11 ug/LSW-4 Oct-94 Trichloroethene 2.08 ug/LSW-4 Nov-94 Trichloroethene 4.31 ug/L JSW-4 Dec-94 Trichloroethene 19.5 ug/LSW-4 Jan-95 Trichloroethene 16.1 ug/LSW-4 Jan-95 Trichloroethene 17 ug/LSW-4 Feb-95 Trichloroethene 53.7 ug/LSW-4 Feb-95 Trichloroethene 54.4 ug/LSW-4 Apr-95 Trichloroethene 19.3 ug/L
10/19/2006 10:41 AM Page 3 of 5 2542\R\2005 Report\Table 7-historical TCE Concentrations in SW.xls\Data_Sheet1

TABLE 7HISTORICAL TCE CONCENTRATIONS IN STREAM LOCATIONS
FORMER LEC SITEWATCHUNG, NEW JERSEY
Location Sample Date Analyte Conc Result Unit QualifiersSW-4 Jun-95 Trichloroethene 6.29 ug/LSW-4 Aug-95 Trichloroethene 2.62 ug/LSW-4 Aug-95 Trichloroethene 2.83 ug/LSW-4 Apr-96 Trichloroethene 16 ug/LSW-4 Sep-97 Trichloroethene 3.9 ug/LSW-4 Apr-98 Trichloroethene 30.4 ug/LSW-4 Sep-98 Trichloroethene 1.4 ug/LSW-4 Nov-99 Trichloroethene 19.2 ug/LSW-4 Mar-00 Trichloroethene 36 ug/LSW-4 Dec-02 Trichloroethene 30 ug/LSW-4 Mar-03 Trichloroethene 18 ug/LSW-4 Jul-03 Trichloroethene 1.7 ug/LSW-4 Aug-03 Trichloroethene 0.2 ug/L USW-4 Sep-03 Trichloroethene 0.3 ug/L USW-4 Oct-03 Trichloroethene 0.2 ug/L USW-4 Nov-03 Trichloroethene 0.2 ug/L USW-4 Dec-03 Trichloroethene 0.2 ug/L USW-4 Jan-04 Trichloroethene 0.6 ug/LSW-4 Feb-04 Trichloroethene 0.6 ug/LSW-4 Mar-04 Trichloroethene 0.2 ug/L USW-4 Apr-04 Trichloroethene 0.2 ug/L USW-4 May-04 Trichloroethene 0.7 ug/LSW-4 Jun-04 Trichloroethene 0.2 ug/L USW-4 Jul-04 Trichloroethene 0.4 ug/L USW-4 Aug-04 Trichloroethene 0.4 ug/L USW-4 Sep-04 Trichloroethene 0.4 ug/L USW-4 Oct-04 Trichloroethene 0.4 ug/LSW-4 Nov-04 Trichloroethene 0.4 ug/L USW-4 Dec-04 Trichloroethene 0.4 ug/LSW-4 Jan-05 Trichloroethene 0.4 ug/L USW-4 Feb-05 Trichloroethene 0.4 ug/L USW-4 Mar-05 Trichloroethene 1.1 ug/LSW-4 Apr-05 Trichloroethene 0.4 ug/L USW-4 May-05 Trichloroethene 0.4 ug/L USW-4 Jun-05 Trichloroethene 0.4 ug/L USW-4 Jul-05 Trichloroethene 0.4 ug/L USW-4 Aug-05 Trichloroethene 0.4 ug/L USW-4 Sep-05 Trichloroethene 0.4 ug/L USW-4 Oct-05 Trichloroethene 0.4 ug/L USW-4 Nov-05 Trichloroethene 0.4 ug/L USW-4 Mar-06 Trichloroethene 0.4 ug/L USW-12 Dec-02 Trichloroethene 7.8 ug/LSW-12 Mar-03 Trichloroethene 5 ug/LSW-12 Mar-03 Trichloroethene 3 ug/LSW-12 Jul-03 Trichloroethene 1.7 ug/LSW-12 Aug-03 Trichloroethene 2.2 ug/LSW-12 Sep-03 Trichloroethene 3 ug/LSW-12 Oct-03 Trichloroethene 3.4 ug/L USW-12 Nov-03 Trichloroethene 3.2 ug/LSW-12 Dec-03 Trichloroethene 1.1 ug/LSW-12 Jan-04 Trichloroethene 2.1 ug/LSW-12 Feb-04 Trichloroethene 1.4 ug/LSW-12 Mar-04 Trichloroethene 0.2 ug/L USW-12 Apr-04 Trichloroethene 2.3 ug/LSW-12 May-04 Trichloroethene 2.4 ug/LSW-12 Jun-04 Trichloroethene 1.3 ug/LSW-12 Jul-04 Trichloroethene 2.5 ug/L
10/19/2006 10:41 AM Page 4 of 5 2542\R\2005 Report\Table 7-historical TCE Concentrations in SW.xls\Data_Sheet1

TABLE 7HISTORICAL TCE CONCENTRATIONS IN STREAM LOCATIONS
FORMER LEC SITEWATCHUNG, NEW JERSEY
Location Sample Date Analyte Conc Result Unit QualifiersSW-12 Aug-04 Trichloroethene 2.4 ug/LSW-12 Sep-04 Trichloroethene 2.1 ug/LSW-12 Oct-04 Trichloroethene 2.2 ug/LSW-12 Nov-04 Trichloroethene 2.4 ug/LSW-12 Dec-04 Trichloroethene 1.1 ug/LSW-12 Jan-05 Trichloroethene 1.0 ug/LSW-12 Feb-05 Trichloroethene 2.3 ug/LSW-12 Mar-05 Trichloroethene 1.0 ug/LSW-12 Apr-05 Trichloroethene 1.2 ug/LSW-12 May-05 Trichloroethene 0.4 ug/L USW-12 Jun-05 Trichloroethene 2.9 ug/LSW-12 Jul-05 Trichloroethene 3.3 ug/LSW-12 Aug-05 Trichloroethene 3.0 ug/LSW-12 Sep-05 Trichloroethene 3.6 ug/LSW-12 Oct-05 Trichloroethene 0.4 ug/L USW-12 Nov-05 Trichloroethene 0.4 ug/L U
ug/L micrograms/LiterU The compound was not detected above method detection limitJD Concentration was reported from a diluted analysis. The value is approximate.
Data indicates the presence of a compound detected at less than the quantitation limit. The value is approximate.
10/19/2006 10:41 AM Page 5 of 5 2542\R\2005 Report\Table 7-historical TCE Concentrations in SW.xls\Data_Sheet1

TABLE 8SYSTEM PERFORMANCE SUMMARY
FORMER LEC SITEWATCHUNG, NEW JERSEY
Sample Influent TCE Mid TCE Effluent TCE
Average Pumping
RateMonthly Pumpage
RW-1 Water Level
Month (ug/L) (ug/L) (ug/L) (gpm) (MGM) (feet)July 2003 62 ND ND 133.4 2.31 43.8
August 2003 470 ND ND 128.0 5.53 44.9September 2003 62 ND ND 127.5 5.51 44.6
October 2003 470 ND ND 122.8 5.31 41.8November 2003 510 58 ND 124.2 5.36 44.1December 2003 650 160 ND 138.2 5.97 50.3
January 2004 430 310 1.2 138.8 6.00 51.5February 2004 450 460 ND 135.5 5.85 52.5March 2004 480 190 2.8 132.3 5.72 54April 2004 370 340 2.0 129.6 5.57 49.9May 2004 350 320 2.0 134.9 6.02 53.7June 2004 370 3.3 0.8 100.1 4.32 55.8July 2004 420 3.9 1 132.7 5.73 45.01
August 2004 390 53 0.6 132.3 5.72 53.73September 2004 480 200 0.7 128.5 5.55 58.63
October 2004 400 1.2 0.5 104.5 4.52 56.06November 2004 400 16 0.4 136.3 5.89 41.79December 2004 360 73 0.4 118.8 5.13 55.19
January 2005 330 180 0.5 135.6 5.86 54.42February 2005 380 260 ND 125.0 5.40 47.06March 2005 370 47 ND 121.5 5.25 60.19April 2005 350 130 0.4 144.2 6.23 52.3May 2005 330 190 ND 127.8 5.52 60.8June 2005 360 1.8 0.5 118.1 5.10 62.6July 2005 360 5.1 0.5 129.1 5.58 61
August 2005 270 76 0.6 126.6 5.47 66.3September 2005 240 120 NS 125.6 5.43 62.4
October 2005 320 2.9 0.5 82.7 3.57 49.9November 2005 280 9 NS 126.5 5.47 58.9December 2005 280 67 NS 126.9 5.48 56.5
January 2006 210 100 NS 126.3 5.46 60February 2006 180 1.6 1.0 119.6 5.17 58.8March 2006 260 4.1 NS 126.5 5.47 59.2
NS Not sampled, only need to sample effluent one time per quarter as per NJPDES PermitND The compound was not detected at the indicated concentration.ug/L micrograms/Litergpm gallons per minuteMGM million gallons per month
Page 1 of 1 Table8-System performance summary.xls

APPENDIX A
Contour Map Reporting Forms

CONTOUR MAP REPORTING FORM – Shallow Zone
September 7, 2005 This reporting form shall accompany each ground water contour map submittal. Use additional sheets as necessary. 1. Did any surveyed well casing elevations change from the previous sampling event? Yes No X. If yes, attach new "Well Certification - Form B" and identify the reason
for the elevation change (damage to casing, installation of recovery system in monitoring well, etc.).
2. Are there any monitoring wells in unconfined aquifers in which in which the water table
elevation is higher than the top of the well screen? Yes X No . If yes, identify these wells. All the wells used in the construction of contours are for monitoring a chlorinated solvent plume. The well screens are typically below static water level.
3. Are there any monitoring wells present at the site but omitted from the contour map? Yes No X . Unless the omission of the well(s) has been previously
approved by the Department, justify the omissions. 4. Are there any monitoring wells containing separate phase product during this measuring
event? Yes No X. Were any of the monitoring wells with separate phase product included in the ground water contour map? Yes _ No . If yes, show the formula used to correct the water table elevation.
5. Has the ground water flow direction changed more than 45° from the previous ground water
contour map? Yes No X . If yes, discuss the reasons for the change. 6. Has ground water mounding and/or depressions been identified in the ground water contour
map? Yes X No Unless the ground water mounds and/or depressions are caused by the ground water remediation system, discuss the reasons for this occurrence.
7. Are all the wells used in the contour map screened in the same water-bearing zone? Yes X No . If no, justify inclusion of those wells. See Table 3-includes the
wells listed in shallow zone which are included on the contour map. 8. Were the ground water contours computer generated , computer aided , or hand-drawn
X ? If computer aided or generated, identify the interpolation method(s) used.

CONTOUR MAP REPORTING FORM – Intermediate Zone September 7, 2005
This reporting form shall accompany each ground water contour map submittal. Use additional sheets as necessary. 1. Did any surveyed well casing elevations change from the previous sampling event? Yes No X. If yes, attach new "Well Certification - Form B" and identify the reason
for the elevation change (damage to casing, installation of recovery system in monitoring well, etc.).
2. Are there any monitoring wells in unconfined aquifers in which in which the water table
elevation is higher than the top of the well screen? Yes No X . If yes, identify these wells. The wells used in this contour map are screened within an intermediate bedrock zone.
3. Are there any monitoring wells present at the site but omitted from the contour map? Yes No X . Unless the omission of the well(s) has been previously
approved by the Department, justify the omissions. 4. Are there any monitoring wells containing separate phase product during this measuring
event? Yes No X. Were any of the monitoring wells with separate phase product included in the ground water contour map? Yes _ No . If yes, show the formula used to correct the water table elevation.
5. Has the ground water flow direction changed more than 45° from the previous ground water
contour map? Yes No X . If yes, discuss the reasons for the change. 6. Has ground water mounding and/or depressions been identified in the ground water contour
map? Yes X No Unless the ground water mounds and/or depressions are caused by the ground water remediation system, discuss the reasons for this occurrence.
7. Are all the wells used in the contour map screened in the same water-bearing zone? Yes X No . If no, justify inclusion of those wells. See Table 3 for the wells
used in the intermediate zone contour map 8. Were the ground water contours computer generated , computer aided , or hand-drawn
X ? If computer aided or generated, identify the interpolation method(s) used.

CONTOUR MAP REPORTING FORM – Deep Zone
September 7, 2005 This reporting form shall accompany each ground water contour map submittal. Use additional sheets as necessary. 1. Did any surveyed well casing elevations change from the previous sampling event? Yes No X. If yes, attach new "Well Certification - Form B" and identify the reason
for the elevation change (damage to casing, installation of recovery system in monitoring well, etc.).
2. Are there any monitoring wells in unconfined aquifers in which in which the water table
elevation is higher than the top of the well screen? Yes No X . If yes, identify these wells. The wells used in this contour map are screened within the deep bedrock zone.
3. Are there any monitoring wells present at the site but omitted from the contour map? Yes No X . Unless the omission of the well(s) has been previously
approved by the Department, justify the omissions. 4. Are there any monitoring wells containing separate phase product during this measuring
event? Yes No X. Were any of the monitoring wells with separate phase product included in the ground water contour map? Yes _ No . If yes, show the formula used to correct the water table elevation.
5. Has the ground water flow direction changed more than 45° from the previous ground water
contour map? Yes No X . If yes, discuss the reasons for the change. 6. Has ground water mounding and/or depressions been identified in the ground water contour
map? Yes No X Unless the ground water mounds and/or depressions are caused by the ground water remediation system, discuss the reasons for this occurrence.
7. Are all the wells used in the contour map screened in the same water-bearing zone? Yes X No . If no, justify inclusion of those wells. See Table 3 for the wells
used in the deep zone contour map 8. Were the ground water contours computer generated , computer aided , or hand-drawn
X ? If computer aided or generated, identify the interpolation method(s) used.
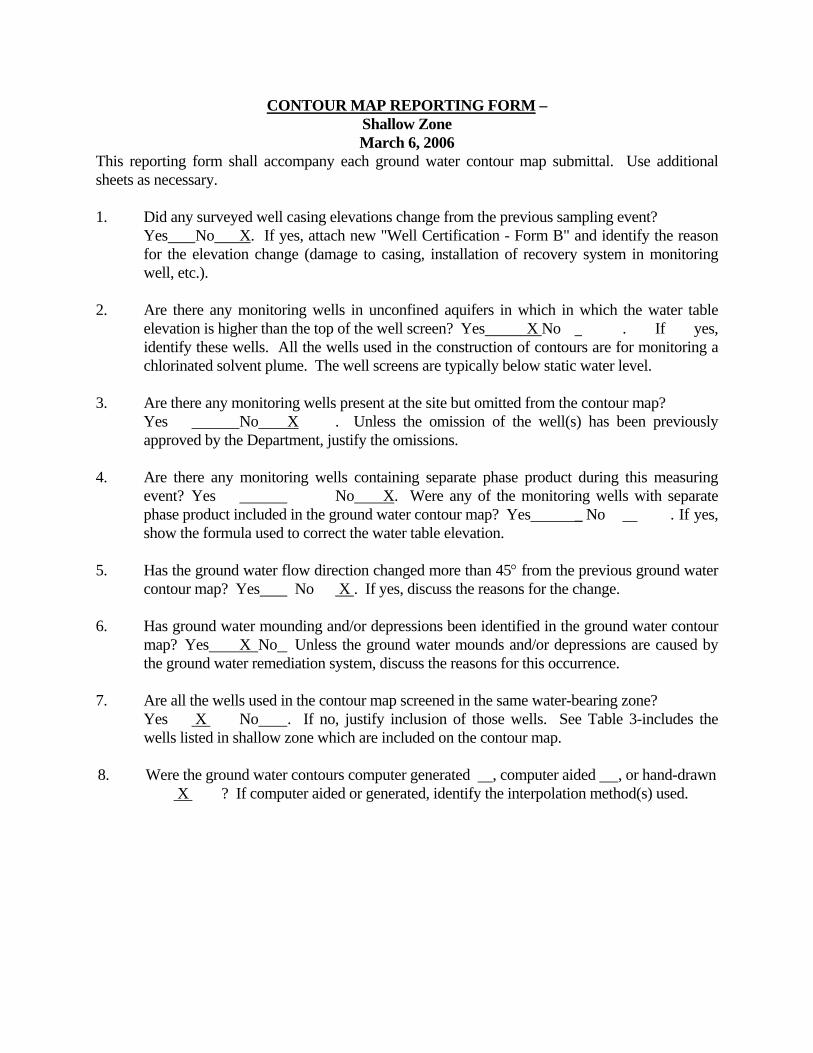
CONTOUR MAP REPORTING FORM – Shallow Zone March 6, 2006
This reporting form shall accompany each ground water contour map submittal. Use additional sheets as necessary. 1. Did any surveyed well casing elevations change from the previous sampling event? Yes No X. If yes, attach new "Well Certification - Form B" and identify the reason
for the elevation change (damage to casing, installation of recovery system in monitoring well, etc.).
2. Are there any monitoring wells in unconfined aquifers in which in which the water table
elevation is higher than the top of the well screen? Yes X No . If yes, identify these wells. All the wells used in the construction of contours are for monitoring a chlorinated solvent plume. The well screens are typically below static water level.
3. Are there any monitoring wells present at the site but omitted from the contour map? Yes No X . Unless the omission of the well(s) has been previously
approved by the Department, justify the omissions. 4. Are there any monitoring wells containing separate phase product during this measuring
event? Yes No X. Were any of the monitoring wells with separate phase product included in the ground water contour map? Yes _ No . If yes, show the formula used to correct the water table elevation.
5. Has the ground water flow direction changed more than 45° from the previous ground water
contour map? Yes No X . If yes, discuss the reasons for the change. 6. Has ground water mounding and/or depressions been identified in the ground water contour
map? Yes X No Unless the ground water mounds and/or depressions are caused by the ground water remediation system, discuss the reasons for this occurrence.
7. Are all the wells used in the contour map screened in the same water-bearing zone? Yes X No . If no, justify inclusion of those wells. See Table 3-includes the
wells listed in shallow zone which are included on the contour map. 8. Were the ground water contours computer generated , computer aided , or hand-drawn
X ? If computer aided or generated, identify the interpolation method(s) used.

CONTOUR MAP REPORTING FORM – Intermediate Zone
March 6, 2006 This reporting form shall accompany each ground water contour map submittal. Use additional sheets as necessary. 1. Did any surveyed well casing elevations change from the previous sampling event? Yes No X. If yes, attach new "Well Certification - Form B" and identify the reason
for the elevation change (damage to casing, installation of recovery system in monitoring well, etc.).
2. Are there any monitoring wells in unconfined aquifers in which in which the water table
elevation is higher than the top of the well screen? Yes No X . If yes, identify these wells. The wells used in this contour map are screened within an intermediate bedrock zone.
3. Are there any monitoring wells present at the site but omitted from the contour map? Yes No X . Unless the omission of the well(s) has been previously
approved by the Department, justify the omissions. 4. Are there any monitoring wells containing separate phase product during this measuring
event? Yes No X. Were any of the monitoring wells with separate phase product included in the ground water contour map? Yes _ No . If yes, show the formula used to correct the water table elevation.
5. Has the ground water flow direction changed more than 45° from the previous ground water
contour map? Yes No X . If yes, discuss the reasons for the change. 6. Has ground water mounding and/or depressions been identified in the ground water contour
map? Yes X No Unless the ground water mounds and/or depressions are caused by the ground water remediation system, discuss the reasons for this occurrence.
7. Are all the wells used in the contour map screened in the same water-bearing zone? Yes X No . If no, justify inclusion of those wells. See Table 3 for the wells
used in the intermediate zone contour map 8. Were the ground water contours computer generated , computer aided , or hand-drawn
X ? If computer aided or generated, identify the interpolation method(s) used.

CONTOUR MAP REPORTING FORM – Deep Zone
March 6, 2006 This reporting form shall accompany each ground water contour map submittal. Use additional sheets as necessary. 1. Did any surveyed well casing elevations change from the previous sampling event? Yes No X. If yes, attach new "Well Certification - Form B" and identify the reason
for the elevation change (damage to casing, installation of recovery system in monitoring well, etc.).
2. Are there any monitoring wells in unconfined aquifers in which in which the water table
elevation is higher than the top of the well screen? Yes No X . If yes, identify these wells. The wells used in this contour map are screened within the deep bedrock zone.
3. Are there any monitoring wells present at the site but omitted from the contour map? Yes No X . Unless the omission of the well(s) has been previously
approved by the Department, justify the omissions. 4. Are there any monitoring wells containing separate phase product during this measuring
event? Yes No X. Were any of the monitoring wells with separate phase product included in the ground water contour map? Yes _ No . If yes, show the formula used to correct the water table elevation.
5. Has the ground water flow direction changed more than 45° from the previous ground water
contour map? Yes No X . If yes, discuss the reasons for the change. 6. Has ground water mounding and/or depressions been identified in the ground water contour
map? Yes No X Unless the ground water mounds and/or depressions are caused by the ground water remediation system, discuss the reasons for this occurrence.
7. Are all the wells used in the contour map screened in the same water-bearing zone? Yes X No . If no, justify inclusion of those wells. See Table 3 for the wells
used in the deep zone contour map 8. Were the ground water contours computer generated , computer aided , or hand-drawn
X ? If computer aided or generated, identify the interpolation method(s) used.

APPENDIX B
Plots of TCE Concentrations Versus Time for Selected Monitoring Wells

Well MW-502A Historical TCE Concentrations
0
1
2
3
4
5
6
7
8
9
Aug-93 Aug-94 Aug-95 Aug-96 Aug-97 Aug-98 Aug-99 Aug-00 Aug-01 Aug-02 Aug-03 Aug-04 Aug-05
TCE
Con
cent
ratio
n (u
g/L)
TCE Concentration

Well MW-502BHistorical TCE Concentrations
0
200
400
600
800
1000
1200
1400
1600
1800
Aug-93 Aug-94 Aug-95 Aug-96 Aug-97 Aug-98 Aug-99 Aug-00 Aug-01 Aug-02 Aug-03 Aug-04 Aug-05
TCE
Con
cent
ratio
n (u
g/L)
TCE Concentrations

Well MW-506AHistorical TCE Concentrations
0
500
1000
1500
2000
2500
Aug-93 Aug-94 Aug-95 Aug-96 Aug-97 Aug-98 Aug-99 Aug-00 Aug-01 Aug-02 Aug-03 Aug-04 Aug-05
TCE
Con
cent
ratio
n (u
g/L)
TCE Concentrations

Well MW-506BHistorical TCE Concentrations
0
10
20
30
40
50
60
70
80
Aug-93 Aug-94 Aug-95 Aug-96 Aug-97 Aug-98 Aug-99 Aug-00 Aug-01 Aug-02 Aug-03 Aug-04 Aug-05
TCE
Con
cent
ratio
n (u
g/L)
TCE Concentrations

Well MW-507AHistorical TCE Concentrations
0
200
400
600
800
1000
1200
1400
Oct-93 Oct-94 Oct-95 Oct-96 Oct-97 Oct-98 Oct-99 Oct-00 Oct-01 Oct-02 Oct-03 Oct-04 Oct-05
TCE
Con
cent
ratio
n (u
g/L)
TCE Concentrations

Well MW-507BHistorical TCE Concentrations
0
20
40
60
80
100
120
140
160
Aug-93 Aug-94 Aug-95 Aug-96 Aug-97 Aug-98 Aug-99 Aug-00 Aug-01 Aug-02 Aug-03 Aug-04 Aug-05
TCE
Con
cent
ratio
n (u
g/L)
TCE Concentrations

Well MW-508AHistorical TCE Concentrations
0
5
10
15
20
25
30
35
40
45
Oct-93 Oct-94 Oct-95 Oct-96 Oct-97 Oct-98 Oct-99 Oct-00 Oct-01 Oct-02 Oct-03 Oct-04 Oct-05
TCE
Con
cent
ratio
n (u
g/L)
TCE Concentrations

Well MW-508BHistorical TCE Concentrations
0
200
400
600
800
1000
1200
1400
1600
1800
Aug-93 Aug-94 Aug-95 Aug-96 Aug-97 Aug-98 Aug-99 Aug-00 Aug-01 Aug-02 Aug-03 Aug-04 Aug-05
TCE
Con
cent
ratio
n (u
g/L)
TCE Concentrations

Well MW-532AHistorical TCE Concentrations
0
5
10
15
20
25
30
35
40
45
Nov-95 Nov-96 Nov-97 Nov-98 Nov-99 Nov-00 Nov-01 Nov-02 Nov-03 Nov-04 Nov-05
TCE
Con
cent
ratio
n (u
g/L)
TCE Concentrations

Well MW-546AHistorical TCE Concentrations
0
20
40
60
80
100
120
140
160
Nov-99 May-00 Nov-00 May-01 Nov-01 May-02 Nov-02 May-03 Nov-03 May-04 Nov-04 May-05
TCE
Con
cent
ratio
n (u
g/L)
TCE Concentrations

Well MW-549AHistorical TCE Concentrations
0
200
400
600
800
1000
1200
1400
Nov-02 May-03 Nov-03 May-04 Nov-04 May-05
TCE
Con
cent
ratio
n (u
g/L)
TCE Concentrations

Well MW-549BHistorical TCE Concentrations
0
500
1000
1500
2000
2500
3000
Nov-02 May-03 Nov-03 May-04 Nov-04 May-05
TCE
Con
cent
ratio
n (u
g/L)
TCE Concentrations

Well MW-550BHistorical TCE Concentrations
0
200
400
600
800
1000
1200
1400
1600
Nov-02 May-03 Nov-03 May-04 Nov-04 May-05
TCE
Con
cent
ratio
n (u
g/L)
TCE Concentrations

Well MW-550CHistorical TCE Concentrations
0
20
40
60
80
100
120
140
160
180
200
Nov-02 May-03 Nov-03 May-04 Nov-04 May-05
TCE
Con
cent
ratio
n (u
g/L)
TCE Concentrations

Well P-522AHistorical TCE Concentrations
0
2
4
6
8
10
12
14
16
Nov-94 Nov-95 Nov-96 Nov-97 Nov-98 Nov-99 Nov-00 Nov-01 Nov-02 Nov-03 Nov-04
TCE
Con
cent
ratio
n (u
g/L)
TCE Concentrations

Well P-522BHistorical TCE Concentrations
0
50
100
150
200
250
Dec-94 Dec-95 Dec-96 Dec-97 Dec-98 Dec-99 Dec-00 Dec-01 Dec-02 Dec-03 Dec-04
TCE
Con
cent
ratio
n (u
g/L)
TCE Concentrations

Well P-522CHistorical TCE Concentrations
0
10
20
30
40
50
60
70
80
Nov-94 Nov-95 Nov-96 Nov-97 Nov-98 Nov-99 Nov-00 Nov-01 Nov-02 Nov-03 Nov-04
TCE
Con
cent
ratio
n (u
g/L)
TCE Concentrations

APPENDIX C
Stream Field Measurements
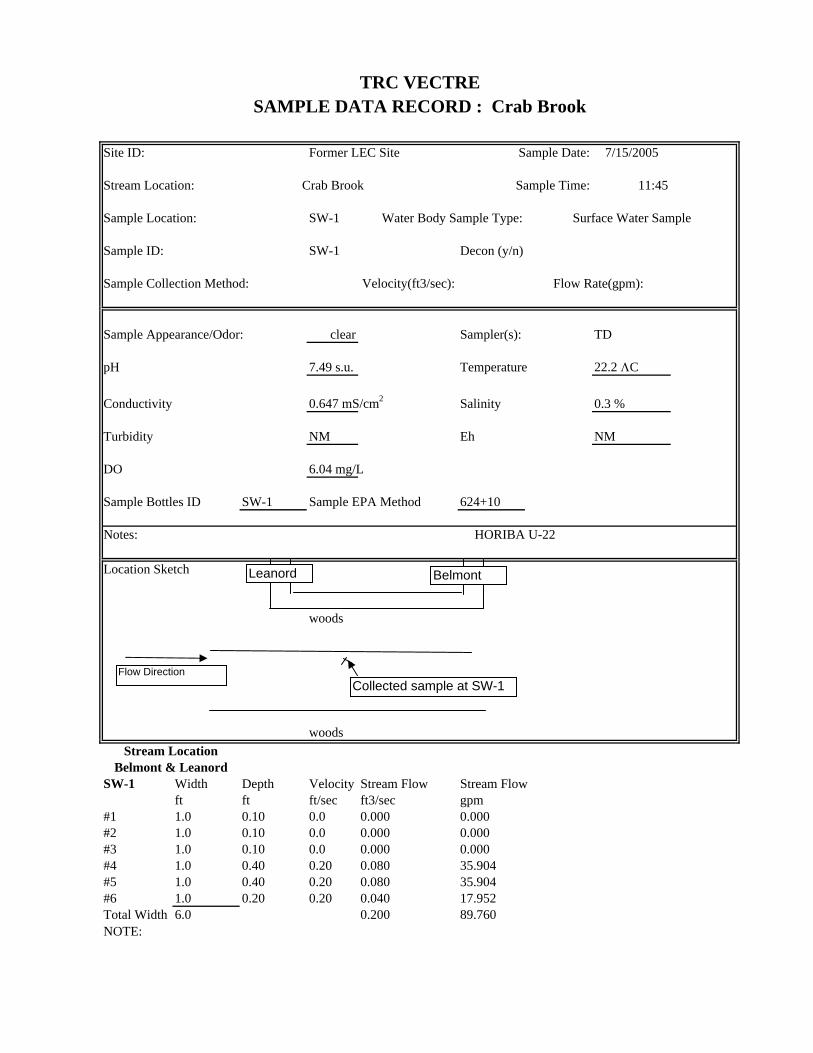
Former LEC Site Sample Date: 7/15/2005
Crab Brook Sample Time: 11:45
SW-1 Water Body Sample Type:
Sample ID: SW-1 Decon (y/n)
Sample Collection Method: Velocity(ft3/sec):
Sample Appearance/Odor: clear Sampler(s): TD
pH 7.49 s.u. Temperature 22.2 ΛC
Conductivity 0.647 mS/cm2 Salinity 0.3 %
Turbidity NM Eh NM
DO 6.04 mg/L
Sample Bottles ID SW-1 Sample EPA Method 624+10
Notes:
Location Sketch
woods
woods
SW-1 Width Depth Velocity Stream Flow Stream Flowft ft ft/sec ft3/sec gpm
#1 1.0 0.10 0.0 0.000 0.000#2 1.0 0.10 0.0 0.000 0.000#3 1.0 0.10 0.0 0.000 0.000#4 1.0 0.40 0.20 0.080 35.904#5 1.0 0.40 0.20 0.080 35.904#6 1.0 0.20 0.20 0.040 17.952Total Width 6.0 0.200 89.760
TRC VECTRESAMPLE DATA RECORD : Crab Brook
Surface Water Sample
Stream Location:
Sample Location:
Site ID:
NOTE:
Flow Rate(gpm):
Belmont & LeanordStream Location
HORIBA U-22
Flow DirectionCollected sample at SW-1
BelmontLeanord

Former LEC Site Sample Date: 7/15/2005
Crab Brook Sample Time: 11:00
SW-2 Water Body Sample Type:
Sample ID: SW-2 Decon (y/n)
Sample Collection Method: Velocity(ft3/sec):
Sample Appearance/Odor: clear Sampler(s): TD
pH 7.50 s.u. Temperature 20.2 ΛC
Conductivity 0.648 mS/cm2 Salinity 0.3%
Turbidity NM Eh NM
DO 7.06 mg/L
Sample Bottles ID SW-2 Sample EPA Method 624+10
Notes:
Location Sketch
SW-2 Width Depth Velocity Stream FlowStream Flowft ft ft/sec ft3/sec gpm
#1 1.0 0.20 0.10 0.0 8.976#2 1.0 0.20 0.10 0.0 8.976#3 1.0 0.30 0.27 0.081 36.353#4 1.0 0.40 0.27 0.108 48.470#5 1.0 0.20 0.10 0.02 8.976Total Width 6.0 0.25 111.75
Sample Location: Surface Water Sample
Flow Rate(gpm):
North DriveStream Location
HORIBA U-22
TRC VECTRESAMPLE DATA RECORD : Crab brook
Site ID:
Stream Location:
Flow Direction
Collected surface water sample SW-2
North Drive

Former LEC Site Sample Date: 7/15/2005
Crab Brook Sample Time: 10:00
SW-3 Water Body Sample Type:
Sample ID: SW-3 Decon (y/n)
Sample Collection Method: Velocity(ft3/sec):
Sample Appearance/Odor: clear/none Sampler(s): TD
pH 7.39 s.u. Temperature 18.9 ΛC
Conductivity 0.641 mS/cm2 Salinity 0.3%
Turbidity NM Eh NM
DO 7.54 mg/L
Sample Bottles ID SW-3 Sample EPA Method 624+10
Notes:
Location Sketch
SW-3 Width Depth Velocity Stream FlowStream Flowft ft ft/sec ft3/sec gpm
#1 1.0 0.05 0.40 0.020 8.976#2 1.0 0.05 0.44 0.022 9.8736#3 1.0 0.05 0.44 0.022 9.8736#4 1.0 0.01 0.44 0.004 1.97#5 1.0 0.05 0.59 0.0295 13.2396Total Width 6.0 0.098 43.93752
HORIBA U-22
Flow Rate(gpm):
Stream LocationWestervelt Avenue
TRC VECTRESAMPLE DATA RECORD : Crab Brook
Surface Water Sample
Site ID:
Stream Location:
Sample Location:
Flow Direction
Westervelt AvenueCollected surface water
sample SW-3

Former LEC Site Sample Date: 7/15/2005
Crab Brook Sample Time: 13:45
SW-4 Water Body Sample Type:
Sample ID: SW-4 Decon (y/n)
Sample Collection Method: Velocity(ft3/sec):
Sample Appearance/Odor: clear Sampler(s): TD
pH 6.99 s.u Temperature 21.0 ΛC
Conductivity 6.30 mS/cm2 Salinity 0.3 %
Turbidity NM Eh NM
DO 6.45 mg/L
Sample Bottles ID SW-4 624+10
Notes:
Location Sketch
SW-4 Width Depth Velocity Stream FlowStream Flowft ft ft/sec ft3/sec gpm
#1 1.0 0.30 0.1 0.03 13.464#2 1.0 0.20 0.1 0.02 8.976#3 1.0 0.20 0.2 0.04 17.952#4 1.0 0.10 0.3 0.025 11.22Total Width 5.0 0.115 51.612
Watcung Avenue
Sample Location: Surface Water Sample
Flow Rate(gpm):
Stream Location
HORIBA U-22
TRC VECTRESAMPLE DATA RECORD : Crab Brook
Site ID:
Stream Location:
Flow Direction
WatchungAvenueCollected surface water
sample SW-4 location.

Former LEC Site Sample Date: 7/15/2005
Crab Brook Sample Time: 12:45
SW-12 Water Body Sample Type:
Sample ID: SW-12 Decon (y/n) yes
Sample Collection Method: Velocity(ft3/sec):
Sample Appearance/Odor: clear Sampler(s): TD
pH 7.64 s.u. Temperature 20.5 ΛC
Conductivity 0.680 mS/cm2 Salinity 0.3 %
Turbidity NM Eh NM
DO 6.40 mg/L
Sample Bottles ID SW-12 Sample EPA Method 624+10
Notes:
Location Sketch
SW-12 Width Depth Velocity Stream FlowStream Flowft ft ft/sec ft3/sec gpm
#1 1.0 0.20 0.2 0.04 17.952#2 1.0 0.20 0.2 0.04 17.952#3 1.0 0.35 0.7 0.245 109.9560#4 1.0 0.35 0.7 0.245 109.956Total Width 5.0 0.57 255.816
Greenbrook Road & Grove St
Sample Location: Surface Water Sample
Flow Rate(gpm):
Stream Location
HORIBA U-22
TRC VECTRESAMPLE DATA RECORD : Crab Brook
Site ID:
Stream Location:
Stony Brook Flow Direction
Crab Brook Flow Direction
Collected surface water sample SW-12

Former LEC Site Sample Date: 8/12/2005
Crab Brook Sample Time:
SW-1 Water Body Sample Type:
Sample ID: SW-1 Decon (y/n)
Sample Collection Method: Velocity(ft3/sec):
Sample Appearance/Odor: no water in stream Sampler(s): TD
pH no water in stream Temperature no water in stream
Conductivity no water in stream Salinity no water in stream
Turbidity no water in stream Eh no water in stream
DO no water in stream
Sample Bottles ID Sample EPA Method
Notes:
Location Sketch
woods
woods
SW-1 Width Depth Velocity Stream Flow Stream Flowft ft ft/sec ft3/sec gpm
#1 no water in streamTotal Width 0.0
TRC VECTRESAMPLE DATA RECORD : Crab Brook
Surface Water Sample
Stream Location:
Sample Location:
Site ID:
NOTE:
Flow Rate(gpm):
Belmont & LeanordStream Location
HORIBA U-22
Flow DirectionCollected sample at SW-1
BelmontLeanord

Former LEC Site Sample Date: 8/12/2005
Crab Brook Sample Time: 12:15
SW-2 Water Body Sample Type:
Sample ID: SW-2 Decon (y/n)
Sample Collection Method: Velocity(ft3/sec):
Sample Appearance/Odor: Sampler(s): TD
pH 7.54 s.u. Temperature 18.7 ΛC
Conductivity 0.640 mS/cm2 Salinity 0.3%
Turbidity NM Eh NM
DO 7.9 mg/L
Sample Bottles ID SW-2 Sample EPA Method 624+10
Notes:
Location Sketch
SW-2 Width Depth Velocity Stream FlowStream Flowft ft ft/sec ft3/sec gpm
#1 1.0 0.10 0.10 0.0 4.488#2 1.0 0.10 0.10 0.0 4.488#3 1.0 0.20 0.20 0.04 17.952#4 1.0 0.40 0.60 0.24 107.712Total Width 6.0 0.30 134.64
Sample Location: Surface Water Sample
Flow Rate(gpm):
North DriveStream Location
HORIBA U-22
TRC VECTRESAMPLE DATA RECORD : Crab brook
Site ID:
Stream Location:
Flow Direction
Collected surface water sample SW-2
North Drive

Former LEC Site Sample Date: 8/12/2005
Crab Brook Sample Time: 11:30
SW-3 Water Body Sample Type:
Sample ID: SW-3 Decon (y/n)
Sample Collection Method: Velocity(ft3/sec):
Sample Appearance/Odor: Sampler(s): TD
pH 7.70 s.u. Temperature 19.8 ΛC
Conductivity 0.620 mS/cm2 Salinity 0.3%
Turbidity NM Eh NM
DO 6.9 mg/L
Sample Bottles ID SW-3 Sample EPA Method 624+10
Notes:
Location Sketch
SW-3 Width Depth Velocity Stream FlowStream Flowft ft ft/sec ft3/sec gpm
#1 1.0 0.10 0.10 0.010 4.488#2 1.0 0.10 0.10 0.010 4.488#3 1.0 0.20 0.40 0.08 35.904#4 1.0 0.20 0.60 0.12 53.856Total Width 6.0 0.220 98.736
HORIBA U-22
Flow Rate(gpm):
Stream LocationWestervelt Avenue
TRC VECTRESAMPLE DATA RECORD : Crab Brook
Surface Water Sample
Site ID:
Stream Location:
Sample Location:
Flow Direction
Westervelt AvenueCollected surface water
sample SW-3

Former LEC Site Sample Date: 8/12/2005
Crab Brook Sample Time: 10:00
SW-4 Water Body Sample Type:
Sample ID: SW-4 Decon (y/n)
Sample Collection Method: Velocity(ft3/sec):
Sample Appearance/Odor: Sampler(s): TD
pH 7.88 s.u Temperature 22.8 ΛC
Conductivity 0.600 mS/cm2 Salinity 0.3 %
Turbidity NM Eh NM
DO 9.00 mg/L
Sample Bottles ID SW-4 624+10
Notes:
Location Sketch
SW-4 Width Depth Velocity Stream FlowStream Flowft ft ft/sec ft3/sec gpm
#1 1.0 0.30 0.6 0.18 80.784#2 1.0 0.30 0.4 0.12 53.856#3 1.0 0.20 0.5 0.1 44.880#4 1.0 0.20 0.2 0.04 17.952Total Width 5.0 0.44 197.472
Watcung Avenue
Sample Location: Surface Water Sample
Flow Rate(gpm):
Stream Location
HORIBA U-22
TRC VECTRESAMPLE DATA RECORD : Crab Brook
Site ID:
Stream Location:
Flow Direction
WatchungAvenueCollected surface water
sample SW-4 location.

Former LEC Site Sample Date: 8/12/2005
Crab Brook Sample Time: 11:00
SW-12 Water Body Sample Type:
Sample ID: SW-12 Decon (y/n) yes
Sample Collection Method: Velocity(ft3/sec):
Sample Appearance/Odor: Sampler(s): TD
pH 7.71 s.u. Temperature 23.1 ΛC
Conductivity 0.650 mS/cm2 Salinity 0.3 %
Turbidity NM Eh NM
DO 6.0 mg/L
Sample Bottles ID SW-12 Sample EPA Method 624+10
Notes:
Location Sketch
SW-12 Width Depth Velocity Stream FlowStream Flowft ft ft/sec ft3/sec gpm
#1 1.0 0.10 0.2 0.02 8.976#2 1.0 0.30 0.2 0.06 26.928#3 1.0 0.30 0.3 0.09 40.392Total Width 4.0 0.17 76.296
Greenbrook Road & Grove St
Sample Location: Surface Water Sample
Flow Rate(gpm):
Stream Location
HORIBA U-22
TRC VECTRESAMPLE DATA RECORD : Crab Brook
Site ID:
Stream Location:
Stony Brook Flow Direction
Crab Brook Flow Direction
Collected surface water sample SW-12

Former LEC Site Sample Date: 9/8/2005
Crab Brook Sample Time:
SW-1 Water Body Sample Type:
Sample ID: SW-1 Decon (y/n)
Sample Collection Method: Velocity(ft3/sec):
Sample Appearance/Odor: no water in stream Sampler(s): TD
pH no water in stream Temperature no water in stream
Conductivity no water in stream Salinity no water in stream
Turbidity no water in stream Eh no water in stream
DO no water in stream
Sample Bottles ID Sample EPA Method
Notes:
Location Sketch
woods
woods
SW-1 Width Depth Velocity Stream Flow Stream Flowft ft ft/sec ft3/sec gpm
#1 no water in streamTotal Width 0.0
TRC VECTRESAMPLE DATA RECORD : Crab Brook
Surface Water Sample
Stream Location:
Sample Location:
Site ID:
NOTE:
Flow Rate(gpm):
Belmont & LeanordStream Location
HORIBA U-22
Flow DirectionCollected sample at SW-1
BelmontLeanord

Former LEC Site Sample Date: 9/8/2005
Crab Brook Sample Time: 15:30
SW-2 Water Body Sample Type:
Sample ID: SW-2 Decon (y/n)
Sample Collection Method: Velocity(ft3/sec):
Sample Appearance/Odor: Sampler(s): TD
pH 7.20 s.u. Temperature 18.9 ΛC
Conductivity 0.600 mS/cm2 Salinity NM
Turbidity NM Eh +300 mV
DO 10.0 mg/L
Sample Bottles ID SW-2 Sample EPA Method 624+10
Notes:
Location Sketch
SW-2 Width Depth Velocity Stream FlowStream Flowft ft ft/sec ft3/sec gpm
#1 1.0 0.20 0.20 0.040 17.952#2 1.0 0.20 0.20 0.040 17.952#3 1.0 0.35 0.00 0 0.000Total Width 6.0 0.08 35.90
Sample Location: Surface Water Sample
Flow Rate(gpm):
North DriveStream Location
HORIBA U-22
TRC VECTRESAMPLE DATA RECORD : Crab brook
Site ID:
Stream Location:
Flow Direction
Collected surface water sample SW-2
North Drive

Former LEC Site Sample Date: 9/8/2005
Crab Brook Sample Time: 15:00
SW-3 Water Body Sample Type:
Sample ID: SW-3 Decon (y/n)
Sample Collection Method: Velocity(ft3/sec):
Sample Appearance/Odor: Sampler(s): TD
pH 7.13 s.u. Temperature 17.7 ΛC
Conductivity 0.440 mS/cm2 Salinity NM
Turbidity NM Eh +220 mV
DO 8.9 mg/L
Sample Bottles ID SW-3 Sample EPA Method 624+10
Notes:
Location Sketch
SW-3 Width Depth Velocity Stream FlowStream Flowft ft ft/sec ft3/sec gpm
#1 1.0 0.10 0.20 0.020 8.976#2 1.0 0.10 0.20 0.020 8.976#3 1.0 0.10 0.00 0 0#4 1.0 0.15 0.00 0 0Total Width 5.0 0.040 17.952
HORIBA U-22
Flow Rate(gpm):
Stream LocationWestervelt Avenue
TRC VECTRESAMPLE DATA RECORD : Crab Brook
Surface Water Sample
Site ID:
Stream Location:
Sample Location:
Flow Direction
Westervelt AvenueCollected surface water
sample SW-3

Former LEC Site Sample Date: 9/8/2005
Crab Brook Sample Time: 14:30
SW-4 Water Body Sample Type:
Sample ID: SW-4 Decon (y/n)
Sample Collection Method: Velocity(ft3/sec):
Sample Appearance/Odor: Sampler(s): TD
pH 8.0 s.u Temperature 17.8 ΛC
Conductivity 0.620 mS/cm2 Salinity NM
Turbidity NM Eh +250 mV
DO 14.55 mg/L
Sample Bottles ID SW-4 624+10
Notes:
Location Sketch
SW-4 Width Depth Velocity Stream FlowStream Flowft ft ft/sec ft3/sec gpm
#1 1.0 0.25 0.4 0.100 44.88#2 1.0 0.25 0.5 0.125 56.1#3 1.0 0.15 0.7 0.105 47.124Total Width 4.0 0.33 148.104
Watcung Avenue
Sample Location: Surface Water Sample
Flow Rate(gpm):
Stream Location
HORIBA U-22
TRC VECTRESAMPLE DATA RECORD : Crab Brook
Site ID:
Stream Location:
Flow Direction
WatchungAvenueCollected surface water
sample SW-4 location.

Former LEC Site Sample Date: 9/8/2005
Crab Brook Sample Time: 14:00
SW-12 Water Body Sample Type:
Sample ID: SW-12 Decon (y/n) yes
Sample Collection Method: Velocity(ft3/sec):
Sample Appearance/Odor: Sampler(s): TD
pH 7.70 s.u. Temperature 18.0 ΛC
Conductivity 0.680 mS/cm2 Salinity NM
Turbidity NM Eh +140 mV
DO 11.00 mg/L
Sample Bottles ID SW-12 Sample EPA Method 624+10
Notes:
Location Sketch
SW-12 Width Depth Velocity Stream FlowStream Flowft ft ft/sec ft3/sec gpm
#1 1.0 0.15 0.4 0.060 26.928#2 1.0 0.10 0.4 0.040 17.952#3 1.0 0.10 0.5 0.050 22.440#4 1.0 0.15 0.4 0.060 26.928Total Width 5.0 0.21 94.248
Greenbrook Road & Grove St
Sample Location: Surface Water Sample
Flow Rate(gpm):
Stream Location
HORIBA U-22
TRC VECTRESAMPLE DATA RECORD : Crab Brook
Site ID:
Stream Location:
Stony Brook Flow Direction
Crab Brook Flow Direction
Collected surface water sample SW-12

Former LEC Site Sample Date: 3/6/2006
Crab Brook Sample Time: 12:30
SW-1 Water Body Sample Type:
Sample ID: SW-1 Decon (y/n)
Sample Collection Method: Velocity(ft3/sec):
Sample Appearance/Odor: Clear Sampler(s): JR/TD
pH 5.90 Temperature 8.4
Conductivity 2.21 mS/cm Salinity NA
Turbidity 9 Eh 161
DO 13.26
Sample Bottles ID SW-1 Sample EPA Method 624+10
Notes:
Location Sketch
woods
woods
SW-1 Width Depth Velocity Stream FlowStream Flowft ft ft/sec ft3/sec gpm
#1 1.0 0.20 0.00 0.0 0.000#2 1.0 0.20 0.00 0.0 0.000#3 1.0 0.30 0.20 0.06 26.928#4 1.0 0.20 0.20 0.04 17.952Total Width 5.0 0.10 44.88
Flow Rate(gpm):
Belmont & LeanordStream Location
HORIBA U-22
TRC RavivSAMPLE DATA RECORD : Crab Brook
Surface Water Sample
Stream Location:
Sample Location:
Site ID:
Flow DirectionCollected sample at SW-1
BelmontLeanord

Former LEC Site Sample Date: 3/6/2006
Crab Brook Sample Time: 12:16
SW-2 Water Body Sample Type:
Sample ID: SW-2 Decon (y/n)
Sample Collection Method: Velocity(ft3/sec):
Sample Appearance/Odor: Clear Sampler(s): JR/TD
pH 6.52 Temperature 11.4
Conductivity 1.5 mS/cm Salinity NA
Turbidity 6.9 Eh 128
DO 13.1
Sample Bottles ID SW-2 Sample EPA Method 624+10
Notes:
Location Sketch
SW-2 Width Depth Velocity Stream FlowStream Flowft ft ft/sec ft3/sec gpm
#1 1.0 0.20 0.00 0.0 0.000#2 1.0 0.30 0.40 0.1 53.856#3 1.0 0.40 0.70 0.28 125.664
Total Width 5.0 0.40 179.52
TRC RavivSAMPLE DATA RECORD : Crab brook
Site ID:
Stream Location:
Sample Location: Surface Water Sample
Flow Rate(gpm):
North DriveStream Location
HORIBA U-22
Flow Direction
Collected surface water sample SW-2
North Drive

Former LEC Site Sample Date: 3/6/2006
Crab Brook Sample Time: 12:05
SW-3 Water Body Sample Type:
Sample ID: SW-3 Decon (y/n)
Sample Collection Method: Velocity(ft3/sec):
Sample Appearance/Odor: Clear Sampler(s): JR/TD
pH 6.86 Temperature 10.6
Conductivity 1.56 mS/cm Salinity NA
Turbidity 3.3 Eh 119
DO 10.01
Sample Bottles ID SW-3 Sample EPA Method 624+10
Notes:
Location Sketch
SW-3 Width Depth Velocity Stream FlowStream Flowft ft ft/sec ft3/sec gpm
#1 1.0 0.10 0.00 0.000 0#2 1.0 0.30 1.10 0.330 148.104#3 1.0 0.30 1.20 0.36 161.568
Total Width 4.0 0.690 309.672
TRC RavivSAMPLE DATA RECORD : Crab Brook
Surface Water Sample
Site ID:
Stream Location:
Sample Location:
HORIBA U-22
Flow Rate(gpm):
Stream LocationWestervelt Avenue
Flow Direction
Westervelt AvenueCollected surface water
sample SW-3

Former LEC Site Sample Date: 3/6/2006
Crab Brook Sample Time: 11:49
SW-4 Water Body Sample Type:
Sample ID: SW-4 Decon (y/n)
Sample Collection Method: Velocity(ft3/sec):
Sample Appearance/Odor: Clear Sampler(s): JR/TD
pH 7.09 Temperature 10.36
Conductivity 1.52 mS/cm Salinity NA
Turbidity 4.1 Eh 112
DO 9.41
Sample Bottles ID SW-4 624+10
Notes:
Location Sketch
SW-4 Width Depth Velocity Stream FlowStream Flowft ft ft/sec ft3/sec gpm
#1 1.0 0.30 0.1 0.03 13.464#2 1.0 0.30 0.9 0.27 121.176#3 1.0 0.20 0.2 0.04 17.952#4 1.0 0.30 0.5 0.15 67.32Total Width 5.0 0.49 219.912
TRC RavivSAMPLE DATA RECORD : Crab Brook
Site ID:
Stream Location:
Watcung Avenue
Sample Location: Surface Water Sample
Flow Rate(gpm):
Stream Location
HORIBA U-22
Flow Direction
WatchungAvenueCollected surface water
sample SW-4 location.

APPENDIX D
Plots of TCE Concentrations Versus Time for Stream Locations

Historical TCE concentrations at Stream Location SW-1
0.0
0.2
0.4
0.6
0.8
1.0
1.2
1.4
1.6
1.8
2.0
May-94 Apr-96 Aug-03 Feb-04 Aug-04 Feb-05 Aug-05
Con
cent
ratio
n (u
g/L)
TCE concentrations

Historical TCE concentrations at Stream Location SW-2
0
20
40
60
80
100
120
140
160
180
Aug-93 Jun-94 Dec-94 Jun-95 Apr-98 Mar-03 Dec-03 Jun-04 Dec-04 Jun-05 Mar-06
Con
cent
ratio
n (u
g/L)
TCE

Historical TCE concentrations at Stream Location SW-3
0
10
20
30
40
50
60
70
Jun-94 Nov-94 Jun-95 Sep-98 Jul-03 Jan-04 Jul-04 Jan-05 Jul-05
Con
cent
ratio
n (u
g/L)
TCE concentrations

Historical TCE concentrations at Stream Location SW-4
0
10
20
30
40
50
60
May-94 Aug-94 Feb-95 Apr-96 Dec-02 Nov-03 May-04 Nov-04 May-05
Con
cent
ratio
n (u
g/L)
TCE concentrations

Historical TCE Concentrations at Stream Location SW-12
0.0
1.0
2.0
3.0
4.0
5.0
6.0
7.0
8.0
9.0
Dec-02 Oct-03 Apr-04 Oct-04 Apr-05
TCE
Con
cent
ratio
n (u
g/L)
TCE