Remedial Action Completion Report Mid-Coast Marine Remedial Action Completion Report Mid-Coast...
294
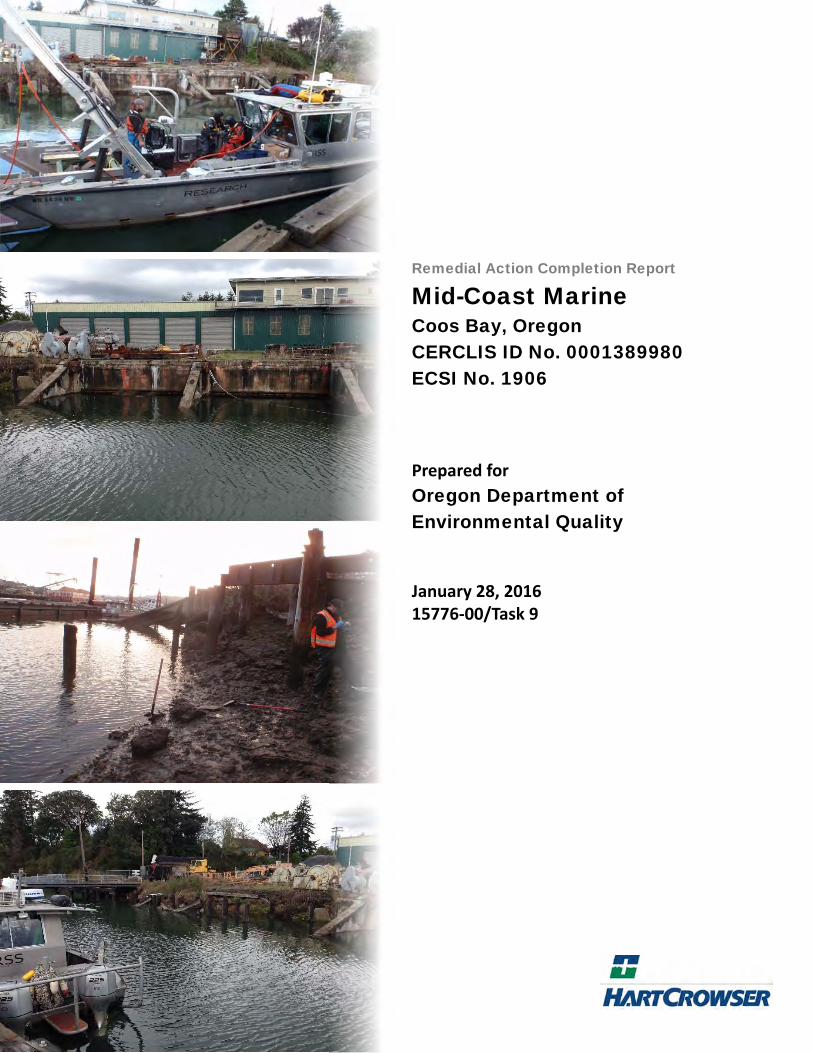
Remedial Action Completion Report Mid-Coast Marine Coos Bay, Oregon CERCLIS ID No. 0001389980 ECSI No. 1906 Prepared for Oregon Department of Environmental Quality January 28, 2016 15776-00/Task 9
Transcript of Remedial Action Completion Report Mid-Coast Marine Remedial Action Completion Report Mid-Coast...
Remedial Action Completion Report
Mid-Coast Marine Coos Bay, Oregon CERCLIS ID No. 0001389980 ECSI No. 1906
Prepared for
Oregon Department of Environmental Quality January 28, 2016 15776-00/Task 9
15776‐00/Task 9 January 28, 2016
Remedial Action Completion Report
Mid-Coast Marine Coos Bay, Oregon CERCLIS ID No. 0001389980 ECSI No. 1906
Prepared for
Oregon Department of Environmental Quality
January 28, 2016 15776-00/Task 9
Prepared by
Hart Crowser, Inc.
Phil Cordell, RG Richard D. Ernst, RG Task Order Manager Program Manager
ii | Contents
15776‐00/Task 9 January 28, 2016
Contents
EXECUTIVE SUMMARY 1
1.0 INTRODUCTION 2
1.1 Site Location and Description 3 1.2 Operational History 4 1.3 Site Environmental History 4
2.0 REMEDIAL ACTION OBJECTIVES 5
3.0 REMEDIAL INVESTIGATIONS AND CLEANUP ACTIONS 6
3.1 Remedial Investigations Summary 6 3.2 Removal Action Summary 7 3.3 Post-Dredging Sediment Sampling 9 3.4 Remedial Action Conclusions 10
4.0 UPDATED RISK-BASED SCREENING LEVELS 10
5.0 SUMMARY OF RECENT SEDIMENT INVESTIGATIONS 11
5.1 Sediment Investigation – October 2014 11 5.2 Sediment Bioassay Investigation – May 2015 13
6.0 RISK EVALUATION 15
6.1 Human Health Risk Evaluation 15 6.2 Ecological Risk Evaluation 17
7.0 SUMMARY OF PROSPECTIVE PURCHASER AGREEMENT AND FUTURE OPERATIONS AND MAINTENANCE 20
8.0 SUMMARY OF PROJECT COSTS 20
9.0 CONCLUSION 20
10.0 REFERENCES 21
Contents | iii
15776‐00/Task 9 January 28, 2016
TABLES 1 Chronology of Events Associated with the MCM Remedial Investigations and Cleanup Actions
2 Screening Criteria Used for TBT Concentrations in Sediment and Pore Water at the MCM Site
3 Screening Criteria Used for Metals and Total PCB Concentrations in Sediment at the MCM Site
4 2014‐2015 Sediment Sample Details
5 2014‐2015 Sediment and Pore Water TBT Analytical Data
6 2014‐2015 Sediment Metals and PCBs Analytical Data
7 2014 Tissue Analytical Data 8 Grain Size Distibution and Total Organic Carbon 9 Biological Testing Results
FIGURES 1 Site Location Map
2 2014 ‐2015 Site Plan and Sampling Locations
3 2014‐2015 Background Sampling Locations
4 2014‐2015 Tributyltin Concentrations in Sediment
5 2014‐2015 Metals Concentrations in Sediment
6 2014‐2015 Chromium Concentrations in Sediment
7 2014‐2015 Copper Concentrations in Sediment
8 2014‐2015 Nickel Concentrations in Sediment
9 2014‐2015 Zinc Concentrations in Sediment
10 Conceptual Site Model
APPENDIX A EPA and DEQ Deferral Agreement (dated December 2, 1998)
APPENDIX B Analytical Laboratory Testing Program and Documentation
APPENDIX C Marine Sediment Bioassay Report (August 2015) and Preliminary Neanthes Bioassay Results in Support of the Mid-Coast Marine Sediment Investigation (June 2015)
APPENDIX D Historical Reports Tables
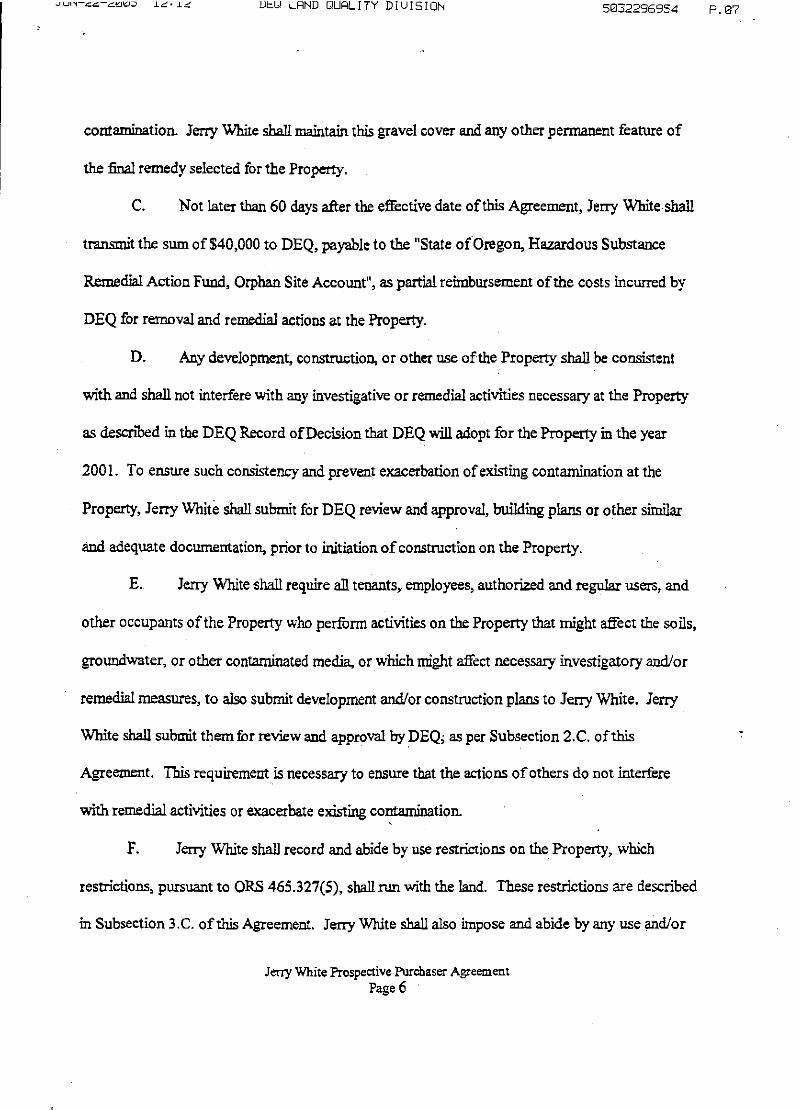
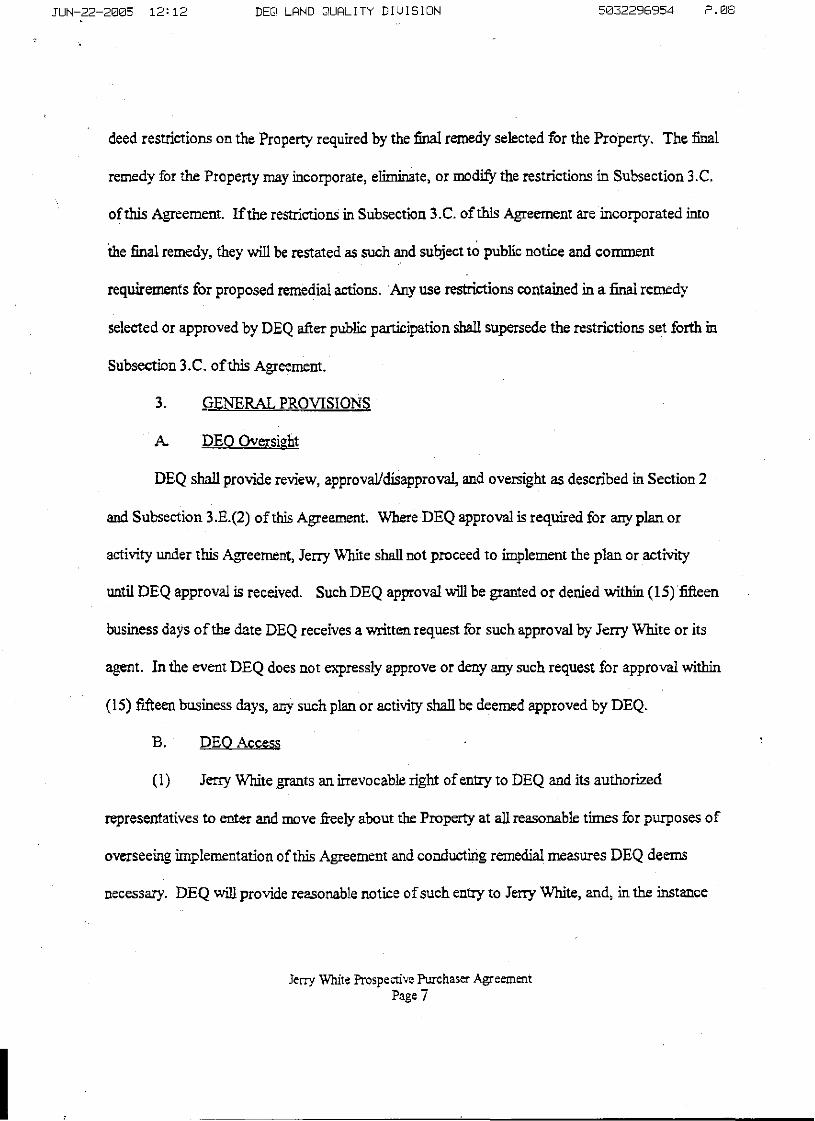
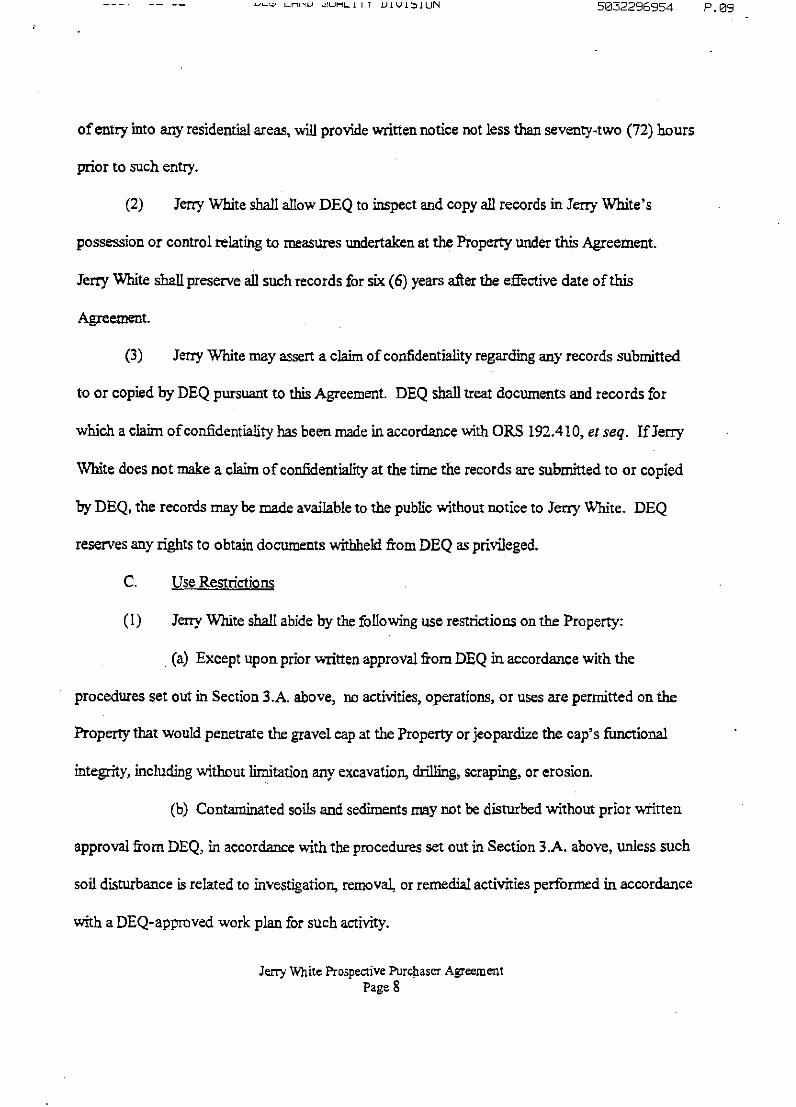
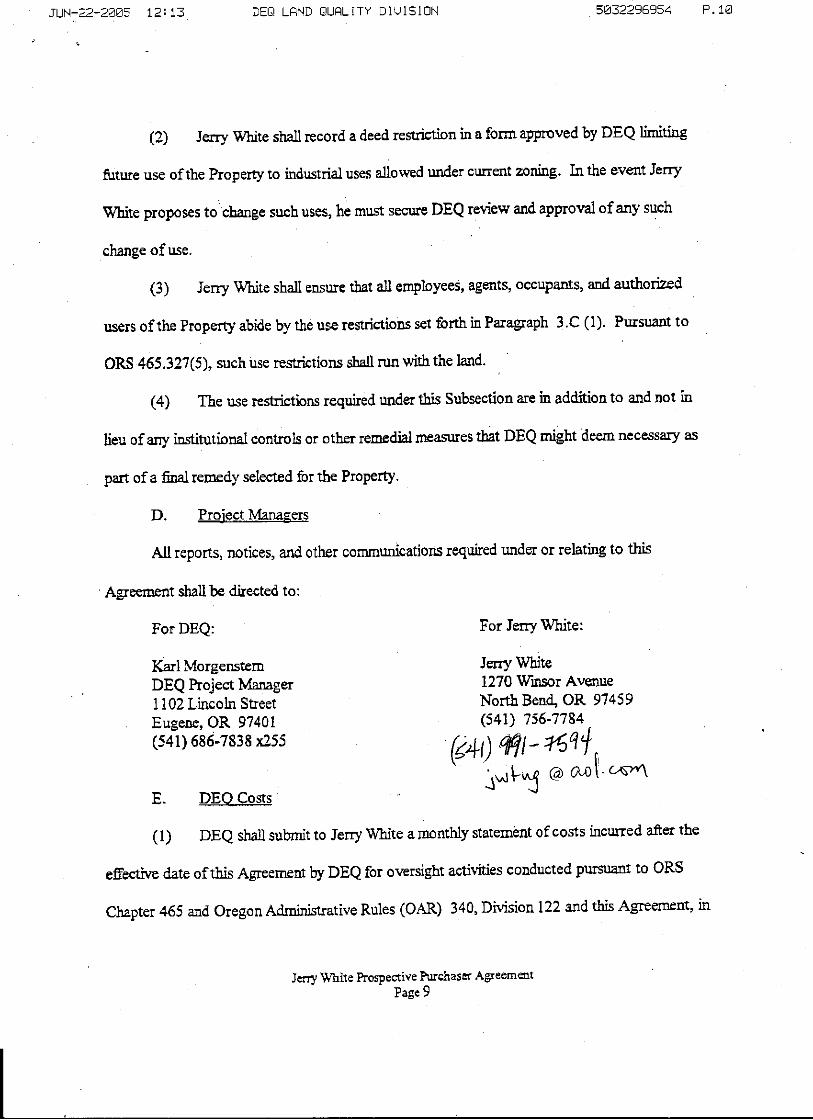
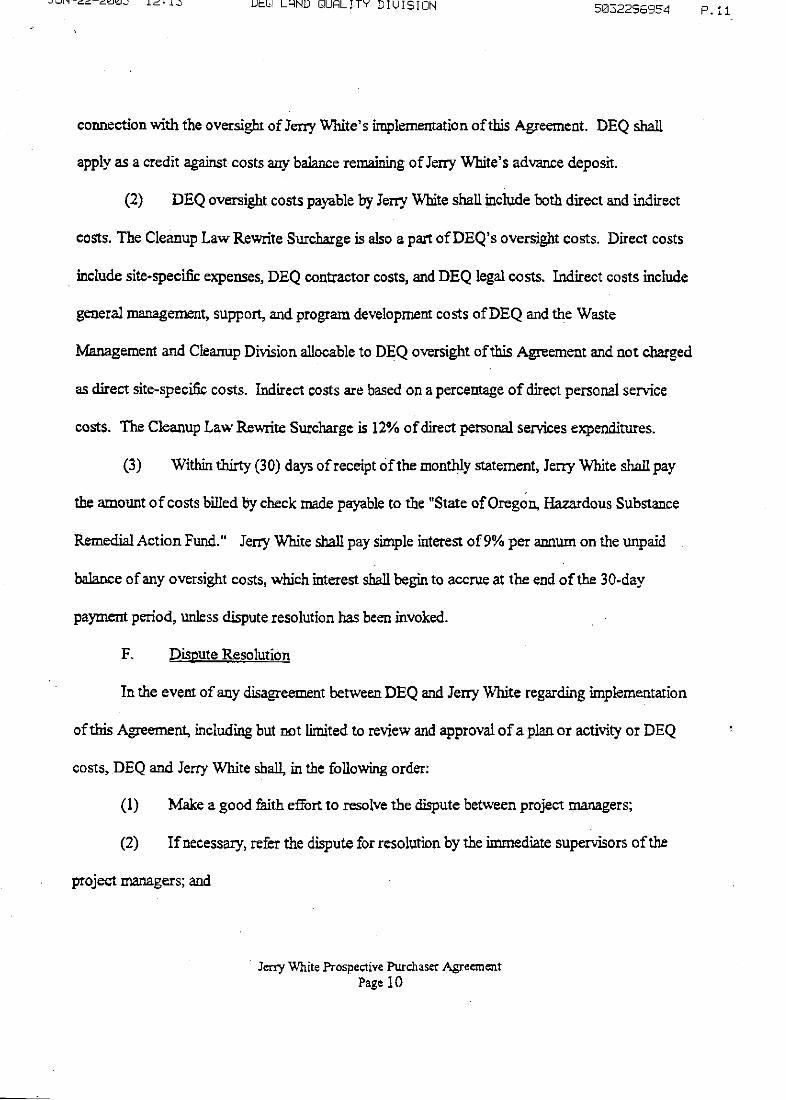
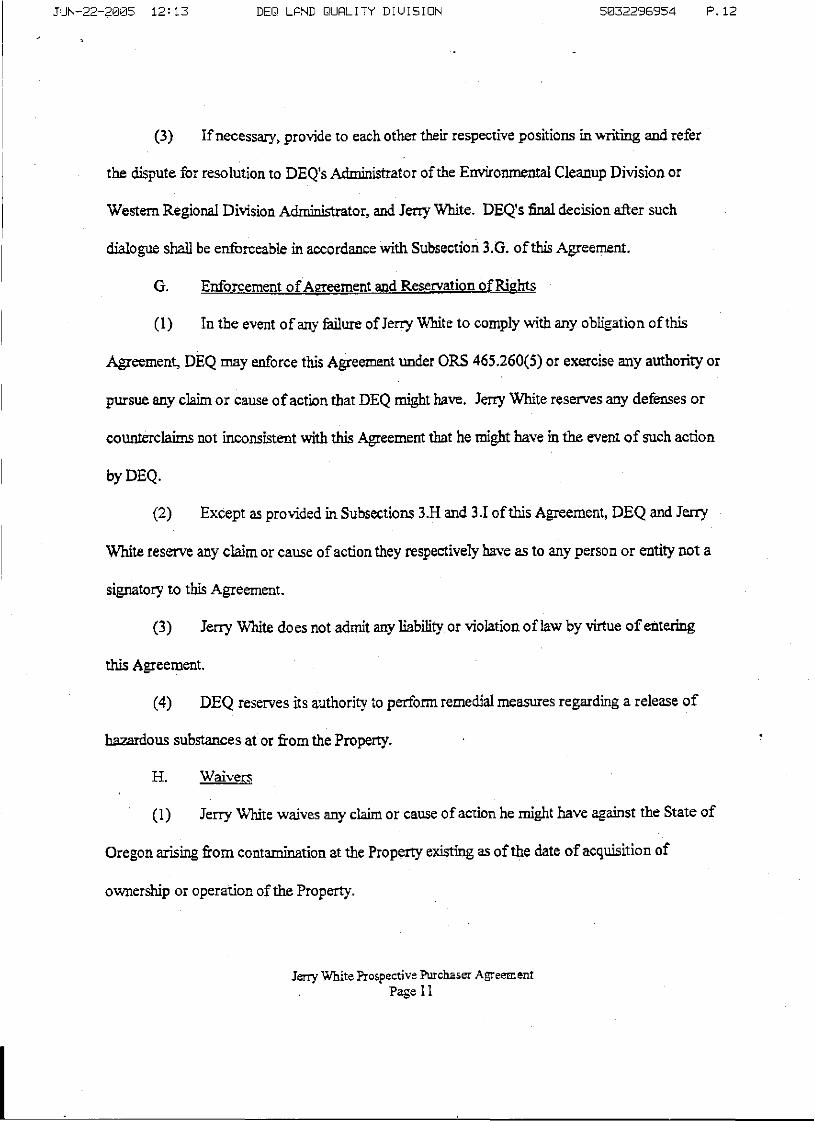
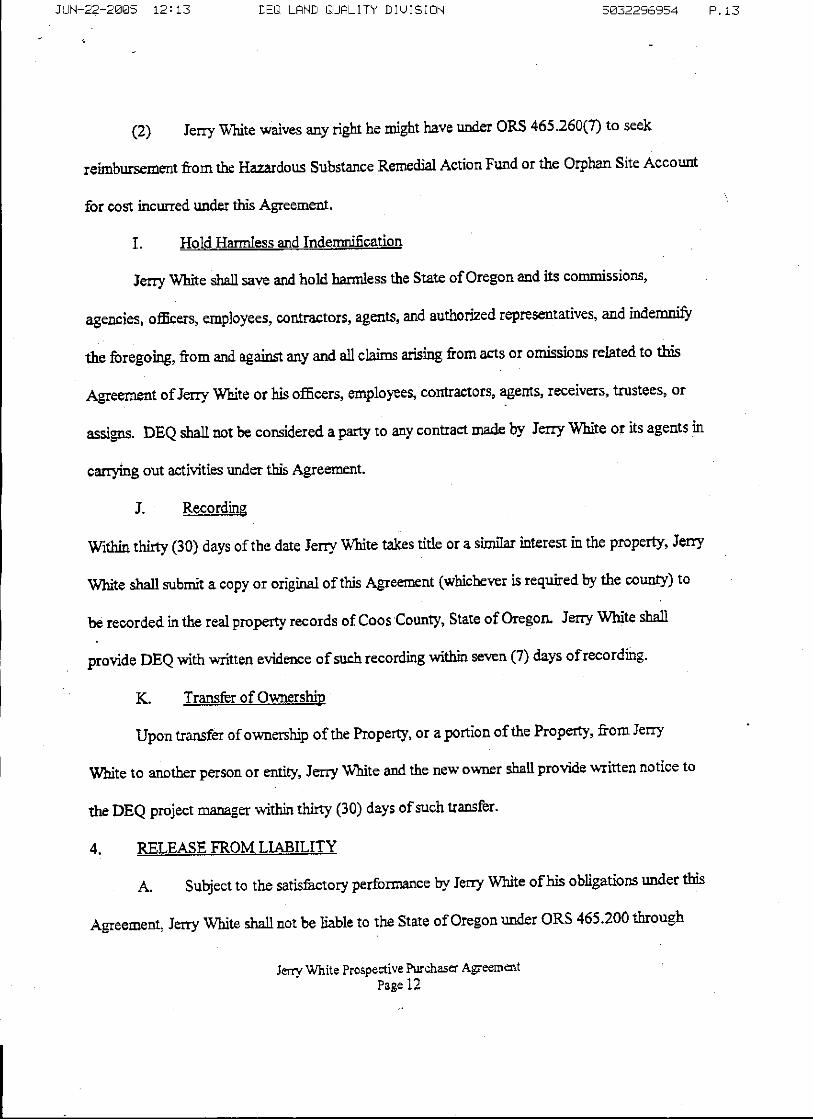
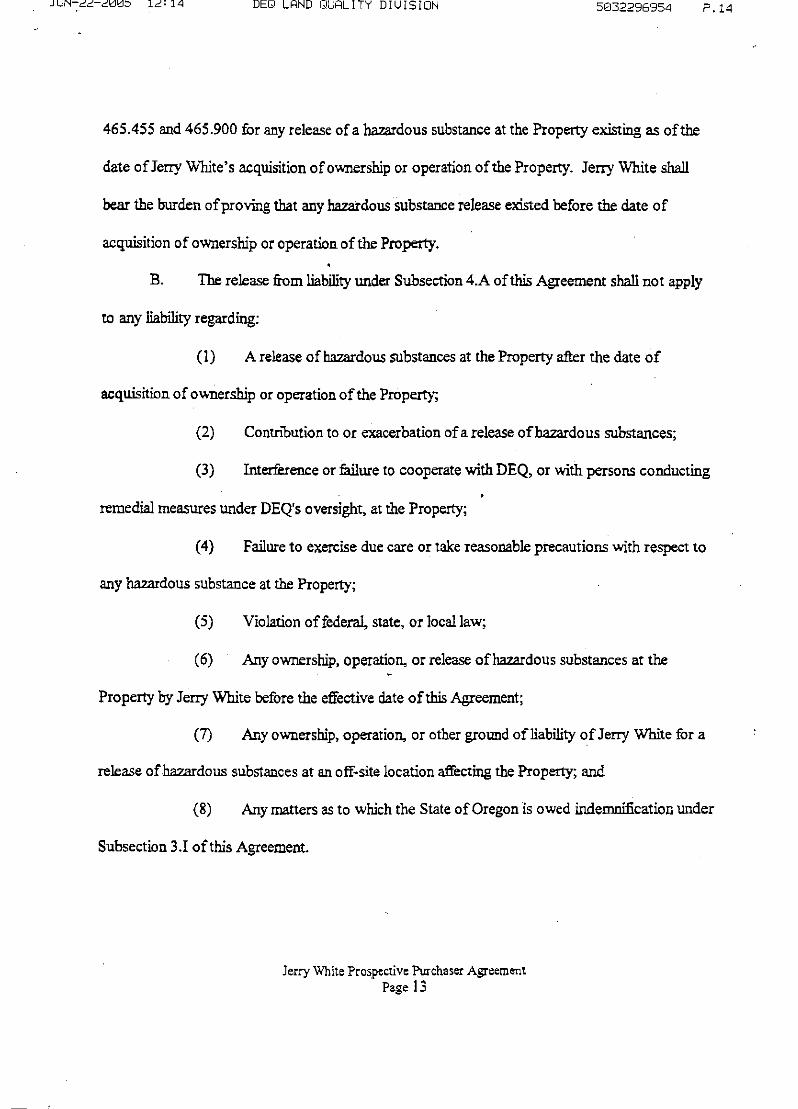
APPENDIX E Prospective Purchaser Agreement (DEQ No. 01-01, dated February 21, 2001)
iv | Contents
15776‐00/Task 9 January 28, 2016
ACRONYMS
ATLs Acceptable Tissue Levels
bgs below ground surface
CCC criterion continuous concentration
CERCLIS Comprehensive Environmental Response, Compensation and Liability Information System
CERCLA Comprehensive Environmental Response, Compensation, and Liability Act of 1980
COCs contaminants of concern
COPCs contaminants of potential concern
CPECs contaminants of potential ecological concern
CSL cleanup screening level
CSM conceptual site model
cy cubic yards
DEQ Oregon Department of Environmental Quality
DMMP Dredged Material Management Program
E&E Ecology and Environment, Inc.
Ecology Washington State Department of Ecology
ELCR excess lifetime cancer risks
EPA United States Environmental Protection Agency
EPCs exposure point concentrations
ERA Ecological Risk Assessment
ESC ESC Lab Sciences
Foss Foss Environmental
GDC gross dewatering cell
HH human health
HHRA human health risk assessment
HQ hazard quotient
ICs institutional controls
LCS/LCSD laboratory control sample/laboratory control sample duplicate
LCRMA Lower Columbia River Management Act
µg/L micrograms per liter
mg/kg milligrams per kilogram
MCM Mid‐Coast Marine
MDL method detection limit
MLLW mean lower low water
MS/MSD matrix spike/matrix spike duplicate
NMFS National Marine Fisheries Service
NOAA National Oceanic and Atmospheric Administration
NOAEL No Observed Adverse Effect Level
NPL National Priorities List
NWAS Northwestern Aquatic Sciences
OSWER Office of Solid Waste and Emergency Response
Contents | v
15776‐00/Task 9 January 28, 2016
ACRONYMS CONTINUED
PA Preliminary Assessment
PELs permissible exposure limits
PAHs polycyclic aromatic hydrocarbons
PCBs polychlorinated biphenyls
PPA Prospective Purchaser Agreement
PSEP Puget Sound Estuary Protocols
QA quality assurance
QAPP Quality Assurance Project Plan
QC quality control
RACR Remedial Action Completion Report
RAO remedial action objectives
RBCs risk‐based concentrations
RDLs reporting detection limits
RI Remedial Investigation
RM River mile
RPD relative percent difference
SCO sediment cleanup objective
SEF Sediment Evaluation Framework
SI Sediment Investigation
SLVs screening level values
SMS Sediment Management Standards
TAS TestAmerica‐Seattle
TBT tributyltin
TOC total organic carbon
USACE United States Army Corps of Engineers WGS World Geodetic System
15776‐00/Task 9 January 28, 2016
Remedial Action Completion Report
Mid-Coast Marine Coos Bay, Oregon CERCLIS ID No. 0001389980 ECSI No. 1906
EXECUTIVE SUMMARY In May 2015, Hart Crowser completed a sediment investigation (SI) at the Mid‐Coast Marine (MCM)
site (the “site”) in Coos Bay, Oregon. The purpose of this report is to present the SI data and
demonstrate that remedial activities completed at the site have met the requirements of the 1998
deferral agreement between the United States Environmental Protection Agency (EPA) and the
Oregon Department of Environmental Quality (DEQ) (EPA and DEQ 1998). A summary of this report is
presented below. Please refer to the main text of this report for a detailed discussion of the
completed remedial actions, SI activities, and results of our risk evaluation.
The MCM property is located along the Isthmus Slough at 530 Whitty Street in a residential
neighborhood of Coos Bay, Oregon (Figure 1). Historical site use included marine vessel
manufacturing and repairs. The owner went bankrupt and the facility was shut down in 1997.
Many of the old buildings have been demolished and a caretaker currently lives on the site.
Previous environmental characterization activities at the site were completed by the EPA and the
DEQ from 1996 to 1999 to address metals (i.e., nickel, copper, chromium, and zinc), tributyltin
(TBT); and polychlorinated biphenyls (PCBs) found in upland soil and sediment. Contaminant
deposition likely occurred during marine craft manufacturing and maintenance activities at the
site from 1953 to 1997. From 1999 to 2000, remedial actions were performed at the site and
included removal of 1,800 tons of spent sandblast grit and contaminated soil, installation of an
upland cap, and removal of 2,800 cubic yards (cy) of sediment. In 2001, the property was
purchased by Jerry White.
To assess the current extent and magnitude of residual contamination and identify if any
unacceptable risks to human health and the environment were present, we completed SI activities
in October 2014 and May 2015 that included collecting 31 sediment grab samples, 2 shellfish
tissue samples, measuring sediment thickness at specific locations at the site, and submitting four
sediment samples for biological testing (Figures 2 through 3 and Table 1). Chemical analyses
focused on TBT; the metals chromium, copper, nickel, and zinc; and PCBs; and tissue samples were
analyzed for TBT and PCBs. Three bioassay tests were conducted on four sediment samples.
The SI found elevated levels of metals and TBT within and outside of the remedial action dredge
prism. The highest concentrations were located around the former concrete launch way, adjacent
to the former paint sheds, and outside the dredge prism near the former floating dry dock
2 | Mid‐Coast Marine
15776‐00/Task 9 January 28, 2016
(Figure 2). Concentrations of TBT and metals were consistently elevated across the study area;
however, concentrations generally decreased at downriver sample locations. No TBT was
detected in pore water or shellfish tissue samples, and PCBs were not detected in sediment or
shellfish tissue. Despite finding residual elevated levels of metals and TBT in sediment, bioassay
testing indicates that the risk to benthic receptors is low, with only one of the seven bioassay tests
not meeting the Sediment Evaluation Framework (SEF) for the Pacific Northwest marine
interpretative criteria (United States Army Corps of Engineers [USACE], et al. 2009).
A review of previous environmental data and the results of our SI found that contaminants in site
soil and sediment do not pose an unacceptable risk to human health and the environment.
Factors supporting this include:
Sediment conditions near the site do not appear to support harvestable shellfish populations
due to a lack of fine‐grained sediment and abundant debris;
Limited public access to upland and intertidal areas at the site;
Low bioavailability of TBT;
No detectable levels of TBT or PCBs in shellfish samples;
Bioassay test results indicate that sediment posing the greatest risk to benthic organisms is
located in an intertidal area where sediments are being deposited, therefore reducing the
long‐term risk; and
Risk of exposure to impacted upland soil is low as long as the material remains capped.
Based on the recent SI data and our updated risk evaluation, we concluded that there is not an
unacceptable risk to human health and the environment, and obligations detailed in the 1998
deferral agreement have been completed. Assuming the upland cap is maintained and shoreline
stabilization activities are completed in accordance with the 2001 Prospective Purchaser
Agreement (PPA) between the DEQ and the property owner (DEQ and White 2001), no further
cleanup actions are necessary.
1.0 INTRODUCTION This Remedial Action Completion Report (RACR) summarizes the remedial investigations cleanup
actions and risk evaluation that have been completed by the DEQ for the MCM site in Coos Bay,
Oregon. Hart Crowser prepared this RACR for the DEQ for submittal to the EPA to fulfill requirements
of a 1998 Deferral Agreement (EPA and DEQ 1998). Under terms of the agreement, EPA would not list
the MCM site on the National Priorities List (a.k.a. Superfund), provided DEQ completed investigative
and cleanup actions. Results of our SI and an evaluation of current upland soil and groundwater
conditions indicate that the DEQ‐implemented remedial actions have removed impacted sediment to
the extent practical, reduced contaminant concentrations in sediment to levels that do not present an
unacceptable risk to human health and the environment, and meet substantive requirements of the
Mid‐Coast Marine | 3
15776‐00/Task 9 January 28, 2016
Deferral Agreement. This report is required to obtain a certificate of completion from the EPA, thus
satisfying the EPA/DEQ Deferral Agreement. Per the Deferral Agreement, the RACR was prepared in
general accordance with the outline described in the Office of Solid Waste and Emergency Response
(OSWER) directive "Remedial Action Report, Documentation for Operable Unit Completion" (OSWER
Directive 9355.0‐39FS [EPA 1992]). This report represents the fifth official correspondence from DEQ
to EPA on the MCM site. Previous correspondence includes the 1998 deferral agreement (EPA and
DEQ 1998) and deferral status reports in December 1999, December 2000, and February 2006. This
work was performed for the DEQ under Task 9 of Task Order 22‐13‐7.
1.1 Site Location and Description The MCM site is located at 530 Whitty Street in a residential neighborhood of Coos Bay, Oregon
(Figure 1). The site encompasses approximately 2.1 acres and is located at river mile (RM) 15 on the
north bank of the Isthmus Slough of Coos Bay (DEQ 2015). It is located within Sections 35 and 36,
Township 25 South, Range 13 West, Willamette Meridian. The site is a former shipyard and includes
structures that were once used for office space, a machine shop, and fabrication. The former machine
shop has been subdivided into a residence and storage area. Two smaller structures on the eastern
portion of the site are currently used as offices and storage, with two floating docks on the waterfront
being used for vessel moorage (Hart Crowser 2014a).
Isthmus Slough is part of the Coos Bay estuary system and subject to diurnal tidal fluctuations. Because
it is located in the upper portion of Coos Bay, it contains brackish water produced by the mixing of sea
water and fresh water of the Coos River. The USACE maintains a 37‐foot‐deep shipping channel from
the mouth of Coos Bay to the site’s western property boundary. The channel is approximately 200 feet
from the shoreline. The area has been dredged up to RM 15 twice since 2000, and most recently in
2009 (Groth 2014). Observations during recent sediment investigations indicate sediment
accumulation, although limited, is occurring within portions of the Isthmus Slough adjacent to the site
(Hart Crowser 2014b).
According to the Oregon Department of Fish and Wildlife, the nearest routinely used shellfish
harvest areas or commercial oyster beds are in Coos Bay, over a mile downstream of the site.
Historically, oysters and mussels were present on in‐water structures at the MCM site. In‐water
structures were not surveyed during recent investigations, but oyster and mussel shells were
occasionally observed during sampling and appeared to be concentrated near current in‐water
structures. Relatively few living shellfish (Macoma clams and oysters) were observed in site
sediment during recent investigations, and were primarily located in subtidal areas of the site. No
harvestable shellfish were observed at intertidal sampling locations. It is conceivable that there is
some harvesting and consumption of these shellfish in the site area, but given the lack of access to
the general public and limited populations, consumption rates are likely very low in the vicinity of
the site.
4 | Mid‐Coast Marine
15776‐00/Task 9 January 28, 2016
1.2 Operational History From 1953 to 1971, the MCM site was owned and operated by Nelson Log Bronc, a small marine craft
manufacturer that may have used metal‐containing paints or solvents. The Mid‐Coast Marine Oregon
Corporation began commercial marine vessel construction and repair operations, including
sandblasting and painting, at the site in 1972. Sandblasting and painting were conducted in the upland
sheds and spent grit was collected into piles in, and adjacent to, the sheds. The paint sheds were used
to store solvents and paints. Sandblasting occasionally occurred at the floating dry dock, and
reportedly spent sandblast grit and paint were not removed from the dry dock before flooding the dry
dock, resulting in releases to surface water and sediment. The sandblast grit contained nickel and
other heavy metals, and paints contained TBT and cuprous oxide. MCM went bankrupt, ceased
operations, and abandoned the site in 1997 (E&E 2000b).
In February 2001, Mr. Jerry White purchased the site under a PPA with the DEQ. The PPA stipulated
that the new owner would stabilize the shoreline and place a protective cap on contaminated
sediment in the former marine way. Based on recent testing results DEQ is not requiring a sediment
cap. Mr. White is currently in the process of obtaining a permit for restoration of the seawall and
shoreline area from the USACE and the Oregon Division of State Lands.
The former machine shop has been subdivided and is currently being used as a residence (northern
half) and for storage. The space north of the current residence is an office, and the two buildings on
the eastern portion of the site are used for offices and storage. On the southern area of the site along
the waterfront are a concrete launch way, two floating docks and gangways, and remnants of a
wooden dock. The floating docks are used for vessel moorage, but the concrete launch way is not
currently used. Historical features that have been removed from the site include: a sandblasting and
paint shed south of the small office; a fabricating shop and several small paint sheds adjacent to, and
extending over, the slough on piers; several timber piles and wood docks; a floating dock; and a
floating dry dock.
1.3 Site Environmental History A summary of the major events associated with the project is provided in Table 1 and additional details
of on‐site environmental investigations and cleanup actions are presented in Section 3. In the early
1990s, surface water and sediment samples were collected in portions of Coos Bay after thickened, ball‐
shaped pacific oysters were observed in the bay in the late 1980s. The deformities were attributed to
TBT, a biocide that was added to paint used on ship hulls to prevent the growth of organisms. Significant
concentrations of TBT were found in sediments near five shipyard repair and maintenance facilities,
including the MCM site (DEQ 2015). In January 1996, the MCM site was added to the EPA’s
Comprehensive Environmental Response, Compensation and Liability Information System (CERCLIS)
database (#0001389980). In 1996 and 1997, a Preliminary Assessment (DEQ 1996) and site Inspection
(EPA 1997) were conducted at the MCM site. These investigations found elevated concentrations of
TBT, PCBs, and various metals (i.e., chromium, copper, nickel, and zinc) within upland surface soil,
sediment, and pore water samples that exceeded risk‐based screening criteria. The site was
Mid‐Coast Marine | 5
15776‐00/Task 9 January 28, 2016
subsequently abandoned by Mid‐Coast Marine Oregon Corp., and the DEQ completed a time‐critical
removal action to remove waste materials from the site (ibid.).
In July 1998, the DEQ added the MCM site to the Orphan Site Program, which enabled the DEQ to use
the State’s Orphan Site Account to fund cleanup work at the site. In December 1998, the EPA signed a
deferral agreement with the DEQ, which deferred EPA consideration of the site for listing on the
Superfund National Priorities List (NPL) while the DEQ completed the necessary investigations and
response actions at the site. From 1999 to 2000, remedial actions were performed at the property,
which included sediment and soil removal, and installation of an upland cap.
During the series of assessment and removal actions completed between 1998 and 2000, the DEQ
involved the local public in several ways (DEQ 2006). The DEQ distributed fact sheets, issued press
releases for significant project milestones, purchased display advertisements in local newspapers,
created a local document repository for project reports, and held an open public meeting to discuss
the EPA‐deferred shipyard sites, including MCM. The public was invited to participate in the cleanup
process and solicit the concerns of the affected public.
Natural resource trustees were involved during the cleanup actions undertaken by DEQ in 1999 (DEQ
2006). This included the involvement or solicitation for involvement of the National Marine Fisheries
Service (NMFS); U.S. Fish and Wildlife Service; Oregon Department of Fish and Wildlife; National
Oceanic and Atmospheric Administration (NOAA); U.S. Department of the Interior; Oregon
Department of State Lands; Coquille Indian Tribe; and the Confederated Tribes of the Coos, Lower
Umpqua, and Siuslaw. Several modifications to the sediment removal action were made in response
to input from the natural resource trustees.
Due to DEQ budget limitations, further site investigations were postponed until 2014. In June 2014,
Hart Crowser completed a data gap assessment report that included an updated risk screening
evaluation and recommendations for additional investigation (Hart Crowser 2014a). A sediment and
shellfish sampling investigation was conducted in October 2014, followed by bioassay sediment tests
detailed in this report that were conducted in May 2015.
2.0 REMEDIAL ACTION OBJECTIVES In their 1998 Deferral Agreement, the EPA authorized the DEQ to “implement a hazardous waste
cleanup program [at the MCM site] to ensure that response actions at the site are carried out and that
these actions are protective of human health and the environment” (EPA and DEQ 1998 [Appendix A]).
As such, the DEQ’s remedial action strategy involved investigating and remediating contaminated
upland soils and sediments at the MCM site. The EPA and DEQ agreed upon the following cleanup
requirements for the site. These requirements were deemed appropriate for future use of the site for
residential or industrial purposes:
The State will pursue a protective cleanup of the site substantially similar to a Comprehensive
Environmental Response, Compensation, and Liability Act of 1980 (CERCLA or Superfund) response.
6 | Mid‐Coast Marine
15776‐00/Task 9 January 28, 2016
The response action will be protective of human health and the environment, as generally defined
by a 10‐4 to 10‐6 risk range for carcinogens and a hazard index of 1 or less for non‐carcinogens1 for
human receptors, and a hazard quotient of 1 or less for ecological receptors.
The response action will treat hot spots of contamination to the extent feasible.
The State will consider giving preference to solutions that will be reliable over the long‐term,
and will ensure that any remedy selected at the site will comply with all applicable Federal and
State requirements.
Additionally, the State will generally select a remedy that provides a level of protectiveness
comparable to relevant and appropriate Federal and State requirements for the site.
As part of their agreement, the EPA deferred consideration of the site for listing on the NPL while the
DEQ completed the necessary investigations and response actions (EPA and DEQ 1998). It was agreed
that once the required response actions were successfully completed, the EPA would have no further
interest in considering the site for listing, unless there is a release or potential release that poses an
imminent threat to human health or the environment. In addition, when the response actions are
completed, it was agreed that the site would be removed from the CERCLIS inventory.
3.0 REMEDIAL INVESTIGATIONS AND CLEANUP ACTIONS Numerous environmental investigations and remedial actions have occurred at the site since the
1980s. These activities are detailed in our 2014 Data Gaps Assessment Report (Hart Crowser 2014a)
and summarized in Table 1 and in this section.
3.1 Remedial Investigations Summary In the late 1980s, oyster deformities were found in Coos Bay that were consistent with effects from
exposure to TBT. As a result, the DEQ conducted sediment sampling from 1991 to 1993 as part of an
area‐wide investigation of ship repair and maintenance facilities. Elevated concentrations of a number
of metals, TBT, and PCBs were reported during the investigation (EPA 1997).
In 1996, the DEQ conducted a Preliminary Assessment (PA) that concluded additional assessment was
necessary to evaluate the impact of MCM’s operations on bay sediment. The EPA conducted an SI in
1997 that included sampling of upland surface soil, sediment, and sediment pore water. Metals at
elevated concentrations (chromium, copper, nickel, and zinc) and TBT were detected at the site in
sediment and pore water samples. Polycyclic aromatic hydrocarbons (PAHs) and PCBs also were
detected in sediment samples. The highest contaminant concentrations in sediment were found near
in‐water structures and near the shoreline, consistent with uncontrolled releases from sandblasting
and ship repair operations. The extent of aerial contamination was approximately 31,000 square feet.
1 The DEQ has undertaken extensive cleanup at the site based on Oregon cleanup levels, which are generally more protective than those outlined in the deferral agreement. These cleanup levels are further described in Section 4.
Mid‐Coast Marine | 7
15776‐00/Task 9 January 28, 2016
Native bedrock was found approximately 3 feet on average below the mud line across the impacted
area. Based on this information, DEQ estimated a total quantity of 3,500 cy of sediment for removal.
Soil sampling was completed in the upland and at residential locations adjacent to, and near, the site.
On‐site samples were collected following the 1999 soil removal action and found elevated levels of
PCBs, PAHs, and chromium concentrations 1 to 4 feet below the gravel cap placed following the
excavation. Off‐site samples collected during the 1999 remedial investigation (RI) contained
concentrations of arsenic that were elevated, but within the range of expected naturally occurring
background levels.
During an April 1998 site visit, DEQ staff observed solvents, paints, and oils in numerous drums and
other containers being stored in dilapidated sheds or on the docks. The DEQ also observed piles of
spent sandblasting grit and several waste oil tanks. The DEQ performed a time‐critical removal action
in June and July 1998 to remove the hazardous materials and sandblast grit, and demolish and remove
five sheds. Subsequent removal actions are described below.
3.2 Removal Action Summary Upland soil and sediment removal actions were performed in 1999 and 2000 by DEQ and are
summarized below.
3.2.1 Upland Removal Action
A removal action was conducted at the MCM site from July 26 to August 13, 1999, which consisted of
removing approximately 370 tons of debris, 12 drums of contaminated liquids, and approximately
1,800 tons of surface soil impacted by sandblast grit (E&E 2000b). The site was then capped with 1 to
4 feet of clean fill. Maintenance of the cap is required under the terms of the PPA.
The excavated area was located southeast of the office building structure. A total of 1,753 tons of soil
was excavated and transported off‐site for disposal in the Rogue Disposal facility, a lined Subtitle D
landfill facility in Medford, Oregon. The depth of the excavation was generally 1‐foot across the site
with three exceptions: an area north of the concrete dock required excavation to 2 feet below ground
surface (bgs), a small area along the southwest corner of the large fabrication shop also required
excavation to 2 feet bgs, and the area east of the loading dock required excavation to approximately
4 feet bgs. Concentrations of arsenic and chromium in samples collected from the excavation east of
the loading dock remained above soil action levels. Additional excavation was not performed because
the elevation of the excavation base was approaching the mean high‐high tidal elevation.
At the completion of soil removal activities, Ecology and Environment, Inc. (E&E) collected 10 samples
from the base of the excavated areas to document residual contamination levels in soils for risk
assessment purposes. Clean fill was then imported and placed on top of the remaining soils to restore
the site grade. A discussion of the sampling results and an updated upland soil risk assessment is
included in our 2014 Data Gaps Assessment Report (Hart Crowser 2014a).
8 | Mid‐Coast Marine
15776‐00/Task 9 January 28, 2016
3.2.2 Sediment Removal Action
In January and February 2000, E&E, Foss Environmental (Foss), and several subcontractors performed
the sediment removal action at the MCM site. Most of the docks and floating walkways associated
with the site were removed by the DEQ before the removal action. A summary of the sediment
remedial action is presented below. Please refer to the MCM site Sediment Removal Action Summary
Report (E&E 2000a) for complete details on the removal action, including daily construction reports;
sediment and wastewater sample analytical data; and details on individual change orders and costs.
Pre-Removal Action Sampling. Prior to dredging, sediment samples were collected around the
perimeter of the proposed dredge prism, at one location within the dredge prism, and at three
reference sites. Based on the sampling results, reach limitations of the dredging equipment, and in‐
water obstructions, the dredge prism was adjusted to the extent shown on Figure 2.
Mobilization and Setup. On January 10, 2000, Foss began to mobilize equipment to the site. The
gross dewatering cell (GDC) was constructed adjacent to the south wall of the former fabrication shop.
The interior of the GDC was lined with geotextile and 30‐mil polyvinylchloride liner. Additional site
preparation activities included installation of 400 linear feet of silt curtain and installation of the
wastewater collection and treatment system. The silt curtain was installed just beyond the original
west and south dredge prism boundaries. The curtain extended approximately 14 feet below the
water surface and was held in place with three anchors and tie‐offs to several fixed points (e.g.,
pilings). However, the curtain had trouble staying in place due to strong tidal currents.
Equipment for the wastewater collection and treatment system was installed within the former
fabrication shop building. The system consisted of one 5,000‐gallon dewatering container, two bag
filters (plumbed in parallel), and two 6,500‐gallon poly Baker tanks. The dewatering container had a
300‐micron mesh filter in the bottom and was lined with an 8‐ounce nonwoven geotextile to provide
additional filtration of sediment particles. The bag filter system utilized 50‐micron filters.
Dredging Activities. Dredging was performed with a land‐based crane equipped with a 1.25‐cy
clamshell bucket. The crane had a reach of approximately 100 feet. Approximately 2,790 cy of
sediment was removed from the dredge prism over a 20‐day period from January 17 to February 11,
2000. Dredging operations were initially performed during slack tide periods, but this restriction was
lifted since turbidity did not exceed federal or state criteria during the duration of the project. An
excavator was used to remove exposed sediments at two locations, which included the east half of the
east beach (beyond the reach of the crane), and adjacent to the sheet pile bulkhead between the
concrete ways (too hard for the clamshell bucket to penetrate). The approximate boundary of the final
dredge prism is shown on Figure 2. Dredging operations were hindered by significant quantities of
debris (mainly metal with some concrete debris), pilings that were not previously removed by the DEQ's
dock demolition contractor, and hard‐pack grit conditions. The hard‐pack grit conditions were
encountered mainly between the concrete ways south of the concrete dock. The clamshell bucket had
difficulty penetrating the hard‐pack grit, which had formed a crust of partially cemented grit particles in
these areas.
Mid‐Coast Marine | 9
15776‐00/Task 9 January 28, 2016
Sediments that were excavated under submerged conditions were placed in the GDC for dewatering.
Sediments that were excavated in the dry were stockpiled on fabric outside the GDC. These dry
sediments were subsequently loaded onto trucks for transport to the designated disposal facility.
Material Handling and Disposal. Sediment dewatering was performed by removing free water from
the GDC during and after daily dredging operations. A total of 32,672 gallons of water were generated
from sediment dewatering activities. Although significant quantities of water were removed from
dredged sediments placed in the GDC, Foss experienced difficulty dewatering the sediments to the
levels specified by the designated landfill. As a result, Foss elected to augment dewatering activities
using solidification. A total of 135.75 tons of cement were used to solidify dredged materials before
transport. A total of 118 truck and trailer loads were transported to Douglas County Landfill in
Roseburg, Oregon for off‐site disposal. Some of the waste materials were shipped to Riverbend
Landfill in McMinnville, Oregon, because the Douglas County Landfill was only open three days a week.
The total quantity of material disposed of at the landfills totaled 3,535.44 tons. Accounting for the
cement and the quantity of cross‐contaminated gravel that also was disposed of at the landfill, the
estimated weight of the dredged sediments was 3,347.47 tons.
Debris were encountered throughout the dredging operation, and included numerous types of metal
(e.g., pipes, sheet metal, ship ladders, and cables), treated wood (typically creosote‐treated pilings),
solid waste (e.g., tires and tarps), and concrete. Most of the smaller‐sized debris were not segregated
from the dredged sediments and was disposed of in the Subtitle D landfills. Two oversize pieces of
concrete debris were left on‐site with DEQ approval. The total quantity of debris that was segregated
and hauled off‐site totaled 16.25 tons. A small quantity of metal debris (5.36 tons) was disposed of
off‐site at a local metal scrap yard. Untreated wood debris (10.89 tons) generated from dock
demolition activities were transported off‐site to a local debris landfill.
Site Restoration and Demobilization. Foss initiated site restoration and demobilization activities on
February 17, 2000 and continued those activities until completion of the project on February 23, 2000.
Site restoration activities included dismantling the GDC, excavating cross‐contaminated gravel,
installing imported rock to restore the site, and repairing the site fence. Cross‐contaminated gravel
was generated during site operations when dry sediments were stockpiled on geotextile rather than
directly loading the sediments into trucks. Foss agreed to excavate and dispose of the cross‐
contaminated gravel, and to restore the site grade by importing and placing new gravel. A visual
assessment determined whether the areas were contaminated or clean. Foss excavated
approximately 33.5 cy of cross‐contaminated gravel and transported it off‐site to Douglas County
Landfill for disposal. Gravel was replaced with imported, 3‐inch‐diameter rock. Demobilization
activities included removal of all remaining construction equipment and materials from the MCM site.
3.3 Post-Dredging Sediment Sampling Post‐dredging sediment sampling was conducted on February 22 and 23, 2000, at eight locations (SD
suffix on samples in Figure 2) (E&E 2000b). Four post‐dredge samples were collected within the
boundaries of the dredge prism to assess residual contaminant concentrations in sediment, and one
sample was collected outside the final dredge prism to further assess the lateral extent of
10 | Mid‐Coast Marine
15776‐00/Task 9 January 28, 2016
contamination. Three samples were collected across the slough channel from the MCM site to
confirm that dredging operations did not impact sediment quality across the channel. All samples
were submitted to the project laboratory for metals (arsenic, chromium, copper, nickel, and zinc) and
pore water TBT analyses. Four sediment samples also were submitted for PCB analysis.
Analytical results on the four post‐dredge samples showed a significant reduction of metals
concentrations from previous results. Arsenic, copper, and zinc were below cleanup goals, but there
was still at least one metal (chromium and/or nickel) in each sample over its respective cleanup goal.
Sample 029‐SD, at the concrete launch way, had the highest TBT and PCB detection (Arclor1254). The
highest residual chromium and nickel concentration was in sample 026‐SD at the east end of the
dredge prism. TBT concentrations exceeded cleanup goals in samples 029‐SD and 031‐SD, located in
the western portion of the dredge prism. Samples outside the dredge prism and across the slough had
metals concentrations below cleanup goals. The slough samples were also consistent with pre‐dredge
samples taken in the same area, indicating containment during the sediment removal action was
successful in limiting contaminant mobilization and re‐deposition.
3.4 Remedial Action Conclusions The contaminated surface soil in the upland was removed, and remaining isolated areas of
contamination were capped with 1 to 4 feet of clean fill. Provided that the cap is maintained in
accordance with the PPA, the residual contamination below the cap does not present direct contact risk.
The sediment removal resulted in a significant reduction in contaminant concentrations. However,
some areas of the site could not be dredged because of obstructions and due to the inherent
difficulties with the clam shell bucket dredge. The shallow depth to bedrock, which prevented over‐
excavation of impacted sediments, also hampered a comprehensive removal. Post‐dredge sampling
indicated contaminant concentrations were reduced but remained above cleanup goals across the
removal area, with no discernible pattern to the distribution (Hart Crowser 2014b). It was concluded
that impacted sediment was removed to the extent practical. Preparation of a formal closeout report
was deferred due to funding limitations. Upon review of the site information in 2014, DEQ
determined additional investigation was needed to assess current conditions.
As discussed in Sections 5 and 6, the recent investigations found that sediment does not pose an
unacceptable risk to human health and the environment.
4.0 UPDATED RISK-BASED SCREENING LEVELS To evaluate for potential risk at the site, data were evaluated against current risk‐based screening
levels discussed in this section.
Soil. MCM contaminants of concern (COCs) in soil were compared to EPA regional soil screening levels
(EPA 2014), DEQ risk‐based concentrations (RBCs) (DEQ 2012), regional background metals
concentrations (DEQ 2013), and maximum background concentrations presented in the 1997 EPA Site
Inspection Report (EPA 1997). These screening levels were used in a detailed risk assessment included
Mid‐Coast Marine | 11
15776‐00/Task 9 January 28, 2016
in the 2014 Data Gaps Assessment Report (Hart Crowser 2014a). Risk assessment findings are
included in Section 6.
Sediment. Current risk‐based screening level criteria for sediment are shown in Tables 2 and 3. These
criteria are based on the best available science to protect humans and sensitive ecological receptors.
Screening values are tools for evaluating and cleaning up contaminated sites. They are RBCs that are
intended to assist risk assessors and others in initial screening‐level evaluations of environmental
measurements. The screening values should be viewed as guidelines and are not legally enforceable.
The criteria were developed for the 2014 Sediment Investigation Work Plan (Hart Crowser 2014b) and
are more protective than those issued in the original deferral agreement.
Tissue. The MCM bioaccumulative COCs TBT and PCBs were compared to the DEQ’s human and
ecological acceptable tissue levels (ATLs) (DEQ 2007), and target tissue levels in the SEF (USACE, et al.
2009). The screening levels were used for risk screening in our 2015 Sediment Investigation Report
(Hart Crowser 2015a) and are presented in Table 7.
Biological Testing. Based on residual, elevated contaminant levels in sediment above screening
criteria, bioassay testing was completed to more directly assess effects on benthic organisms. The
bioassay results were compared to the SEF for the Pacific Northwest marine interpretative criteria
(USACE, et al. 2009).
5.0 SUMMARY OF RECENT SEDIMENT INVESTIGATIONS In 2014, the DEQ tasked Hart Crowser to re‐evaluate the site for potential human health and ecological
risks and identify any data gaps. Our Data Gaps Assessment Report (Hart Crowser 2014a) identified
potential risk from sediment with these COCs: PCBs, TBT, and the metals chromium, copper, nickel, and
zinc. To obtain empirical data to assess site risks, Hart Crowser completed sediment investigations in
October 2014 and May 2015, which included sediment, shellfish tissue, and biological testing. Sediment
sampling procedures were generally conducted as described in the Sediment Investigation Work Plan
(Hart Crowser 2014b), with some modifications implemented during field activities. Hart Crowser also
implemented Quality Assurance (QA)/Quality Control (QC) procedures to ensure sample integrity and
data quality, per the Quality Assurance Project Plan (QAPP) found in the SI Work Plan (ibid.).
5.1 Sediment Investigation – October 2014 From October 20 to 22, 2014, SI activities were performed to assess the current extent of COCs in site
sediment, the presence and concentrations of these contaminants in shellfish, and the risks posed to
human health and the environment by these contaminants (Hart Crowser 2014b). To characterize
sediment conditions at the site, Hart Crowser collected 27 sediment grab samples and submitted them
for the analyses below.
PCBs by EPA Method 8082;
TBT (dry weight) by Krone, et al. (1989);
12 | Mid‐Coast Marine
15776‐00/Task 9 January 28, 2016
TBT (Pore water) by Krone, et al. (1989);
Total Organic Carbon (TOC) by USDA loss‐on‐ignition; and
Metals (Chromium, Copper, Nickel, and Zinc) by EPA Method 6020A.
Two shellfish tissue samples were analyzed for PCBs, TBT, and total lipids. Sediment thickness
measurements were taken by divers at specific locations at the site. Details of this investigation can be
found in our 2015 Sediment Investigation Report (Hart Crowser 2015a). Sample locations are
presented on Figures 2 and 3 and sample details can be found in Table 4.
Elevated levels of metals and TBT were detected within, and outside of, the 2000 dredge prism, with
the highest concentrations located around the former concrete launch way adjacent to the former
paint sheds and outside the dredge prism near the former floating dry dock. Concentrations of TBT
and metals were consistently elevated across the study area; however, concentrations generally
decreased at downriver sample locations. TBT was not detected in pore water or in shellfish tissue
samples. PCBs were not detected in sediment or shellfish tissue at the site. Chemical results from the
above analyses and screening criteria are presented in the attached summary tables. Data for pore
water TBT and sediment samples are listed in Table 5; sediment metals, PCB, and TOC data are listed in
Table 6; and shellfish tissue data are listed in Table 7. Sediment concentrations are presented on
Figures 4 through 9.
A Conceptual Site Model (CSM) was developed to assist in identifying potential receptors at risk of
exposure to site COCs (Figure 10). Chemical data from the SI were then compared to screening levels
protective of human and ecological receptors. The risk screening identified unacceptable risks for
benthic receptors from TBT and metals via contact with sediment. Unacceptable risks were not
identified for human and terrestrial ecological receptors through direct contact to sediment and
consumption of shellfish. Factors supporting this finding include:
COC concentrations in sediment are below DEQ residential direct contact RBCs;
Limited public access to intertidal areas at the site;
Low apparent bioavailability of TBT based on its absence in pore water;
Shellfish samples with no detectable levels of TBT or PCBs; and
Sediment conditions near the site do not appear to support harvestable shellfish populations due
to a lack of fine‐grained sediment and abundant debris.
Based on this investigation, it was concluded that residual contaminated sediment may present
unacceptable risks to benthic organisms through direct contact. Additional biological testing using site
sediment (e.g., bioassay testing) was selected as the next step in better understanding ecological risk
and contaminant effects on local benthic organisms.
Mid‐Coast Marine | 13
15776‐00/Task 9 January 28, 2016
5.2 Sediment Bioassay Investigation – May 2015 On May 4 and 5, 2015, Hart Crowser collected additional sediments at the MCM site for biological
testing. This work was performed to definitively assess whether concentrations of TBT and metals
within site sediments would result in observed negative effects to sensitive benthic organisms.
5.2.1 Investigation Scope Three sediment samples were collected adjacent to the property where the DEQ’s ecological screening
criteria were exceeded. One upstream reference sample was also collected. The sample locations are
shown on Figure 2. Sample details are presented in Table 4. The three sediment samples collected
adjacent to the site were analyzed for TBT (dry weight) by Krone, et al. (1989), and the metals
chromium, copper, nickel, and zinc by EPA Method 6020A. To assess the comparability of site
sediments to the upstream reference location, one site sample and the reference sample was analyzed
for grain size distribution by ASTM D 422 and TOC by the USDA loss‐on‐ignition method.
Three marine sediment bioassays were conducted on all samples by Northwestern Aquatic Sciences
(NWAS) of Newport, Oregon, as part of the investigation. Bioassays were conducted in accordance
with the Puget Sound Estuary Protocols (PSEP) as indicated in the SEF (USACE, et al. 2009) and
included the following:
48‐Hour Mussel (Mytilus galloprovincialis) Larval Test;
10‐Day Amphipod (Eohaustorius estuarius) Survival Test; and
20‐Day Polychaete (Neanthes arenaceodentata) Survival and Growth Test.
This investigation followed sediment sampling procedures detailed in our 2014 Work Plan (Hart
Crowser 2014b) and followed the sampling plan detailed in our March 2014 Revised Budget and
Assumptions Proposal (Hart Crowser 2015b).
5.2.2 Chemical Analysis Results
Chemical analysis was performed on the sediment samples to compare with 2014 results and correlate
with bioassay results. The on‐site sampling locations were generally collected from areas with the
highest COC concentrations, representing a worst case scenario for bioassay interpretation. Sampling
results from the 2014 and 2015 investigations are in Table 5 (TBT) and Table 6 (metals). TBT data are
presented on Figure 4 and metals data on Figures 5 through 9. Appendix B documents the QA review
of analytical data for samples collected during the May 2015 investigation at the MCM site. Results of
the 2015 investigation are discussed below.
TBT. In general, TBT concentrations were similar to levels measured during the 2014 investigation. All
site samples exceeded DEQ’s Bioaccumulative screening level values (SLVs) for fish and human health,
DEQ’s Level II Ecological Risk SLV, and the Puget Sound Lower Screening Level. No samples exceeded
the Puget Sound Upper Screening Level. TBT results and screening levels are presented in Table 5.
14 | Mid‐Coast Marine
15776‐00/Task 9 January 28, 2016
Metals. In general, chromium, copper, nickel, and zinc concentrations were similar to levels measured
during the 2014 investigation. Chromium concentrations exceeded ecological screening criteria and
the 2000 Remedial Action Objectives (RAO) level (260 milligrams per kilogram [mg/kg]) at intertidal
sampling locations (MCM‐G29 and MCM‐G30). Copper concentrations exceeded the DEQ’s Level II
Ecological Risk SLVs (19 mg/kg) in all site samples, but concentrations were below the 2000 RAO level
(390 mg/kg). Nickel concentrations in all site samples exceeded the DEQ’s Level II Ecological Risk SLV
(16 mg/kg), and exceeded the 2000 RAO level (140 mg/kg) in sample MCM‐G29. All three site samples
exceeded the DEQ’s Zinc Level II Ecological Risk SLV (124 mg/kg), but no samples exceeded the 2000
RAO (410 mg/kg).
5.2.3 Grain Size Characteristics The TOC and grain size results on sediment samples MCM‐G29 and the reference sample (MCM‐G31)
are presented in Table 8. Both samples are primarily comprised of grain sizes from clay‐sized particles
to gravel. Sediments were essentially the same, consisting of a sand and slightly gravelly, slightly silty
sand, with a total of 94.8 (MCM‐G29) and 78.1 (MCM‐G31) percent sand, respectively. This is within
the 25 percent difference suggested by the State of Washington Dredged Material Management
Program (DMMP 2008). TOC was measured at 4,000 mg/kg in MCM‐G29 and 12,000 mg/kg in
reference sample MCM‐G31. This is within the 1 percent difference suggested in DMMP (ibid.).
5.2.4 Bioassay Results The three test sediments were compared to the reference sediment to assess sediment toxicity and to
interpret organism response under the one‐hit/two‐hit rules described in the SEF. In general, a one‐hit
failure is a marked response in comparison to the level of response from a reference and control in any
one biological test. A two‐hit failure exhibits a lower intensity response that must be present in two or
more biological tests. In the event of one hit under the single‐hit rule or two hits under the two‐hit
rule, the sediment is judged to be unsuitable for unconfined open‐water disposal (USACE, et al. 2009).
These criteria provide a quantitative basis to assess in‐place sediment.
The results of the individual bioassay tests are summarized below and presented in Table 9, and grain
size distributions and TOC are presented in Table 8. Please refer to the bioassay report (Appendix C)
for more details on the testing methods, interpretation criteria, and bioassay results.
Mussel, Mytilus galloprovincialis, Larval Test
o Sample MCM‐G29 failed under the single‐hit rule for dispersive (open‐water) disposal
sites. It did not fail the single‐hit rule for non‐dispersive (confined) disposal sites.
o The two other test sediments passed the DMMP guidelines for open water disposal.
Amphipod, Eohaustorius, 10-Day Survival Test
o Test sediment mortality did not fail under the one‐hit rule for any of the samples.
o Sediments passed the DMMP guidelines for open water disposal.
Mid‐Coast Marine | 15
15776‐00/Task 9 January 28, 2016
Neanthes 20-Day Survival and Growth Test
o This test was run twice because the bioassay control sample failed to meet test
acceptability criteria on the first test (866‐2). The Neanthes bioassay was repeated
(866‐4) on only two test sediment samples, MCM‐G29 and MCM‐G31 (reference
sediment) as the other two test samples had insufficient volume to repeat the test.
o Sample MCM‐G29 did not fail the single‐hit criteria for the dispersive or non‐
dispersive rules under these guidelines.
Although the first Neanthes test acceptability failure prevented complete testing of two of the sample
sediments, it should be noted that the preliminary data from the failed test indicated that all three test
sediments passed SEF criteria for open water disposal. Results of the first Neanthes test are presented
at the end of Appendix C.
Overall, the results showed that toxic effects to benthic invertebrates were limited to one of three
samples (i.e., MCM‐G29 in the larval test) in one of the three tests. Sample MCM‐G29 failed under the
single‐hit rule for dispersive (open‐water) disposal sites, but did not fail the single‐hit rule for non‐
dispersive (confined) disposal sites. However, as discussed in Section 6.2, these effects are not
expected to result in significant effects to benthic receptors. No test sediments failed under the two
hit rule.
6.0 RISK EVALUATION Following the removal action, E&E completed a human health risk assessment (HHRA) and a Level II
Screening Ecological Risk Assessment (Level II ERA) that were included in the RI report (E&E 2000b).
The risk assessment was revaluated in 2014 and presented in our Data Gaps Assessment Report (Hart
Crowser 2014a). Additional human health and ecological risk evaluations were conducted following
the collection of new sediment and tissue data in 2014. A summary of the updated risk evaluation,
incorporating the new sediment data, is presented in this section. Screening criteria are presented in
Section 2 and in Tables 2, 3, 7 and 9.
6.1 Human Health Risk Evaluation Our human health risk evaluation is organized by receptor and each potentially complete pathway
identified in the HHRA and our data gaps assessment is evaluated. Unacceptable risks to human
health from exposure to site soil, sediment, and groundwater were not identified.
6.1.1 Residents Contact with On-site Soil. The HHRA in the RI did not evaluate residential exposure scenarios for
contaminants in on‐site soils. Based on recent observations of residential site use, this pathway was
included in the recent risk evaluation. Our comparison of contaminants of potential concern (COPC)
and exposure point concentrations [as presented in the HHRA] to residential RBCs in our Data Gaps
Assessment Report (Hart Crowser 2014a) indicated unacceptable excess lifetime cancer risks (ELCR) of
greater than 1 x 10‐6 for individual contaminants for PCB Aroclor 1254 (4.6x10‐6), hexavalent chromium
(3x10‐5), benzo(a)pyrene (2.8x10‐5), and dibenz(a,h)anthracene (1.1x10‐5). The ELCR of 7.4x10‐5 also
16 | Mid‐Coast Marine
15776‐00/Task 9 January 28, 2016
exceeds the DEQ’s 1x10‐5 risk threshold for cumulative risk from multiple chemicals. This evaluation
assumes the contaminated soils are present at the ground surface. However, the sample data used in
the HHRA were post‐soil excavation samples from a soil surface that is currently covered with 1 to
4 feet of clean fill. This clean fill cap, as required under the PPA, prevents residential receptors from
being exposed to contaminants in the underlying soil. If future trenching exposes contaminated soil,
institutional controls (ICs) requiring appropriate soil management and cap repair will continue to
prevent contact with underlying contaminated soil. As such, an unacceptable risk of residential
exposure to capped contaminated soil was not identified.
Contact with Off-site Soil. Arsenic was the only compound identified in the HHRA as a COC in the off‐
site surface soil. However, the HHRA concluded the arsenic concentrations are not significantly
different than natural background conditions. Therefore, arsenic risk may not be associated with
historical site activities. Most of the arsenic concentrations are also below the current regional default
background concentration for arsenic (Appendix D; Tables 4 and 5 [Hart Crowser 2014a]). As such, an
unacceptable risk was not identified to residential receptors from contact with off‐site arsenic
impacted soil.
Contact with Sediment. Access to the site is limited and metals concentrations are below DEQ RBCs.
As such, there is not an unacceptable risk of exposure to residential receptors.
Groundwater Use and Vapor Intrusion Pathways. A groundwater beneficial use survey was
completed during the HHRA and found that groundwater was not used in the site vicinity. Risk of
volatiles inhalation activities is not a concern given the non‐volatile nature of the COPCs. As such,
there is no current risk to current or future residents.
6.1.2 Occupational Workers
Contact with On-site Soil. The HHRA did not identify unacceptable risks to occupational or trench
workers (with the exclusion of background arsenic). We compared the exposure point concentrations
(EPCs) in the HHRA to current DEQ and EPA screening levels in our Data Gaps Assessment Report (Hart
Crowser 2014a), and found the EPC for PCB Aroclor 1254 would exceed the current DEQ RBC for total
PCBs for occupational workers, resulting in an unacceptable risk level of 1.6x10‐6, and the EPC for
hexavalent chromium would exceed the current DEQ RBC, resulting in an unacceptable ELCR of
1.5x10‐6. Benzo(a)pyrene would also have an unacceptable ELCR of 1.6x10‐6. This evaluation assumes
the contaminated soils are present at the ground surface. However, sample data used in the HHRA
was post‐soil excavation samples from a soil surface that is currently covered with 1 to 4 feet of clean
fill. This clean fill cap, if maintained, will prevent occupational receptors from being exposed to
contaminants in the underlying soils. If future trenching exposes contaminated soil, ICs requiring
appropriate soil management and cap repair will continue to prevent contact with underlying
contaminated soil. As such, there is not an unacceptable risk to on‐site workers, provided the cap is
maintained and appropriate soil management procedures are in place during any future development
of the property.
Mid‐Coast Marine | 17
15776‐00/Task 9 January 28, 2016
Contact with Sediment. COPC concentrations are below DEQ occupational RBCs for soil. As such,
there is not an unacceptable risk of exposure to workers.
Groundwater Use and Vapor Intrusion Pathways. A groundwater beneficial use survey was completed
during the HHRA and found that groundwater was not used in the site vicinity. Risk of volatiles
inhalation during future excavation activities is not a concern given the non‐volatile nature of the
COPCs. As such, there is no current risk to on‐site workers, and no unacceptable risk to future workers.
6.1.3 Recreational Fishers Shellfish Consumption. The bioaccumulative COCs identified and evaluated in our data gaps
assessment included arsenic, cadmium, lead, mercury, PCB Aroclors, TBT, fluoranthene, and pyrene
(Hart Crowser 2014a). The assessment found arsenic and mercury concentrations in sediment
samples from the dredged area, and also those outside of the dredge prism, appear consistent with
measured background concentrations, indicating that associated tissue levels also reflect ambient
conditions (Appendix D; Table 9 [Hart Crowser 2014a]). The majority of lead concentrations measured
in sediment following the removal action were near or below its DEQ bioaccumulative SLV. Similarly,
cadmium concentrations in post‐removal sediment samples were significantly below DEQ
bioaccumulative SLVs. TBT and PCBs were not found at detectable levels in clam and oyster tissue
data collected in 2014.
Significant shellfish populations were not observed at the site during our SI, although our evaluation is
only based on limited visual observations. We concluded that shellfish harvesting at the site is unlikely
given the limited populations and restricted shoreline access.
We conclude that there is not an unacceptable risk to residential fishers from shellfish consumption
due to the lack of harvestable shellfish in the immediate site vicinity, limited site access, and
bioaccumulative concentrations of COCs in shellfish being near or below ambient levels.
Contact with Sediment. COC concentrations are below DEQ residential RBCs and access to the site
is limited. As such, there is not an unacceptable risk of exposure to fishers through direct contact
with sediment.
6.1.4 Subsistence Fishers It is not likely that the subsistence exposure pathway is complete given the lack of clamming beds at or
near the site and limited accessibility to shellfish in the site area to the general public.
6.2 Ecological Risk Evaluation The ecological risk evaluation is organized by receptor and each potentially complete pathway
identified in the HHRA and our data gaps assessment is evaluated. Unacceptable risks to ecological
receptors from exposure to site soil and sediment were not identified.
18 | Mid‐Coast Marine
15776‐00/Task 9 January 28, 2016
6.2.1 Terrestrial Receptors Contact with Soil. The HHRA included a Level I Scoping ERA focused on terrestrial receptors. The ERA
found there was no terrestrial habitat. The land use at the site has not changed, and contaminated
upland soil is capped with gravel. As such, there is no risk to terrestrial receptors from soil contact.
Ingestion of Shellfish. The potential adverse effects due to ingestion of shellfish by birds and mammals
were evaluated in the Level II ERA by using the great blue heron and river otter as surrogate ecological
receptors. All contaminants of potential ecological concern (CPEC) were compared to published toxicity
values for tissue concentrations (refer to Section 8.2.1.5.1 and Section 10 of the RI Report [E&E 2000b]
for specific citations and references). Zinc, with a hazard quotient (HQ) of 3.0 for the great blue heron,
was the only CPEC that exceeded the screening No Observed Adverse Effect Level (NOAEL) benchmark.
However, the Level II ERA noted that if the Lowest Observed Adverse Effect Level had been used, the
HQ for zinc would have been less than 1.0, and concluded the presence of zinc is not likely to result in
significant adverse effects to birds that feed in the area of the site.
As part of this data gap assessment, DEQ ATLs for the individual bird and mammal receptor scenarios
(DEQ 2007) were compared to maximum detected concentrations of CPECs in tissue (Appendix D;
Table 11 [Hart Crowser 2014a]). All CPECs, except for mercury, were below their respective ATLs.
Mercury was detected slightly above the individual bird ATL; however, on a population basis for birds,
the mercury concentrations were below the ATL. Because the mercury concentration was estimated,
the tissue data represent pre‐removal conditions and only one post‐removal sediment sample
contained mercury above DEQ’s ecological and bioaccumulative SLVs, it is likely there are currently no
potential risks to birds from consuming shellfish. The lack of significant shellfish populations available
for consumption further reduces the potential risk. As such, unacceptable risks to terrestrial receptors
from shellfish consumption were not identified.
6.2.2 Aquatic Organisms
Direct Contact and Ingestion of Surface Water. Surface water samples were collected prior to the
sediment removal action and evaluated in the HHRA. Copper was the only CPEC to exceed its EPA
criterion continuous concentration (CCC) listed in 1999 (E&E 2000b); however, it exceeded by less than
1.0 micrograms per liter (µg/L) and can be attributed to suspended sediment. Other detected CPECs
did not have CCCs or were detected at low levels, below their respective CCCs. Surface water sampling
data from HHRA is presented in Appendix D; Table 6‐22 (E&E 2000b). Water quality has likely
improved since the remedial action, so the pre‐sediment removal samples represent a worst case
scenario. As such, an unacceptable risk to aquatic organisms was not identified.
6.2.3 Benthic Organisms
Direct Contact and Ingestion of Sediment. The Level II ERA identified a potential for adverse effects to
the benthic community from site‐related CPECs in sediment. The 2014 data gaps assessment refined
the CPECs and narrowed them to arsenic, chromium, nickel, zinc, PCBs, and TBT. The 2014 SI found
that sediment metals CPECs concentrations exceeded DEQ Ecological Risk SLVs within and outside of
the 1999 sediment removal area (Hart Crowser 2014b). However, sediment pore water and tissue
Mid‐Coast Marine | 19
15776‐00/Task 9 January 28, 2016
analytical results suggested that TBT is likely not bioavailable, but direct contact was still identified as a
risk. Downriver COC concentrations were generally lower, indicating limited COC migration.
To better evaluate the on‐site risk, bioassay test results were compared to SEF criteria and
Washington’s Sediment Management Standards (SMS). According to the SEF, if the sediments were to
be dredged, the one‐hit (dispersive) larval test failure would qualify intertidal sediments near sample
location MCM‐G29 for placement at a non‐dispersive, managed disposal site without significant
currents or wave action. Based on sediment thickness measurements (Hart Crowser 2014a), sediment
deposition appears to be occurring at intertidal areas near MCM‐G29. The lack of sediment erosion at
this location makes the intertidal area similar to a non‐dispersive disposal site, where sediments are
accumulating and buried sediments would not be subject to significant wave action or tidal currents.
Over time, rather than migrating down river, the impacted sediment in the area will likely be capped
by river deposition reducing the direct contact risk to the benthic community.
As an alternative evaluation method, Washington’s SMS were also used to screen the bioassay test
results. In the State of Washington, the SMS are used to set standards for sediment quality and provide
a decision process for the cleanup of contaminated sediment sites (Chapter 173‐204 WAC). The goal of
the SMS rule is to reduce and ultimately eliminate adverse effects on biological resources and significant
threats to human health from surface sediment contamination. The SMS and SEF interpretive criteria
are similar. However, while SMS only considers percent mortality, the SEF uses mortality and
abnormality for evaluation of the larval test results. Although sample MCM‐G29 exceeded the SMS
larval test sediment cleanup objective (SCO) criteria (same as SEF one‐hit dispersive rule), it is below
cleanup screening level (CSL) criteria (same as SEF one‐hit non‐dispersive rule). The SCO establishes a
“no adverse effects” level and the CSL is the “minor adverse effects” level (WAC 173‐204‐563). Because
this sample is below the CSL, the site would be considered to be of “low concern,” which would likely not
require further cleanup action (WAC 173‐204‐510). As such, we believe that it would be acceptable to
leave the sediments at this site in place since there does not appear to be a significant exposure risk to
ecological receptors or risk of downstream migration into undisturbed areas.
Summary. Concentrations of metals and TBT exceed ecological screening criteria; however, follow‐up
bioassay testing indicates that the risk to benthic receptors from direct contact with sediment is low,
with only one of the seven bioassay tests not meeting the SEF one‐hit dispersive criteria and all tests
passing the two‐hit criteria. In the context of Washington State’s SMS, sediment in this area exceeds
the SCO (no effects level) but is below the CSL (minor effects level), making it an area of “low concern”.
Thus, given that sediment deposition appears to be occurring at the area exhibiting minor adverse
effects to the benthic community, with the exception of the PPA elements and monitoring program
described in Section 7, no further remedial action is necessary.
20 | Mid‐Coast Marine
15776‐00/Task 9 January 28, 2016
7.0 SUMMARY OF PROSPECTIVE PURCHASER AGREEMENT AND FUTURE OPERATIONS AND MAINTENANCE Since the DEQ has conducted investigation and cleanup activities at the site, in February 2001, the DEQ
entered into a PPA with the site purchaser (Mr. Jerry White [Appendix E]) to facilitate additional
cleanup and return the MCM site to productive use (DEQ and White 2001). For taking on these
responsibilities, the purchaser received release from liability for past contamination at the site. The
PPA stipulated that Mr. White shall:
Stabilize the shoreline adjacent to the property to minimize erosion;
Place a protective cap over contaminated sediments in the former marine way to prevent re‐
suspension of contaminated sediments due to prop wash from vessels;
Maintain the gravel cap placed by the DEQ; and
Record a deed restriction to help ensure maintenance of the engineering controls required by
the PPA.
The DEQ has determined that Jerry White's current activities at the site will not contribute to or
exacerbate existing contamination, increase health risks, or interfere with remedial measures
necessary at the property. The remedial activities and redevelopment of the property will result in a
"substantial public benefit" from the Agreement, pursuant to ORS 465.327 (l)(d). Based on recent
testing, the DEQ is not requiring an in‐water sediment cap. However, the DEQ will continue to work
with the owner to ensure the other elements of the PPA are properly implemented. The bank
stabilization plan is expected to be implemented in spring 2016. In addition, the DEQ proposes to
implement a five‐year monitoring program to confirm that the upland cap and bank stabilization have
prevented recontamination of site sediment.
8.0 SUMMARY OF PROJECT COSTS Based on information provided by the DEQ, DEQ’s project costs to date total approximately
$1,600,000.
9.0 CONCLUSION The DEQ completed a time‐critical removal in 1999 to address residual hazardous materials and
prevent future releases. DEQ completed upland soil and sediment removal actions in 1999 and 2000
to address elevated levels of COCs found in upland soil and sediment at the site. Analysis of recent
sediment, tissue, and biological testing results, and our updated risk evaluation, did not identify
unacceptable risks to human and ecological receptors as detailed in Section 7. Future risk will be
mitigated by ICs specified in the PPA that include maintaining the existing upland soil cap and
stabilizing the shoreline. As such, we conclude that the remedial action has complied with the
Mid‐Coast Marine | 21
15776‐00/Task 9 January 28, 2016
substantive requirements detailed in the 1998 deferral agreement (EPA and DEQ 1998), and no further
remedial actions at the site are warranted.
10.0 REFERENCES ASTM 2004. Standard test method for measuring the toxicity of sediment‐associated contaminants
with estuarine and marine invertebrates. ASTM Standard Method No. E1367‐03el. In: 2004 Annual
Book of ASTM Standards, volume 11 .05, Biological effects and environmental fate; biotechnology;
pesticides. ASTM International, West Conshohocken, P A.
Buchman, M.F. 2008. NOAA Screening Quick Reference Tables (SQuiRTs). NOAA OR&R Report 08‐1.
DEQ, 1996. Preliminary Assessment, Mid‐Coast Marine, Coos Bay, Oregon, Coos County, ECSI #1906. September 13, 1996.
DEQ 2000. Second Annual Report to EPA on the Deferral of Mid‐Coast Marine, Southern Oregon Marine, and the Charleston Boat Yard. State of Oregon. December 15, 2000.
DEQ 2001. Table 2 – Screening Level Values for Freshwater and Marine Sediment. Guidance for Ecological Risk Assessment: Levels I, II, III, and IV. Updated December 2001.
DEQ 2006. Report on the Deferral of Former Mid‐Coast Marine Site. Coos Bay, Oregon. CERCLIS ID No. 0001389980. February 27, 2006.
DEQ 2007. Guidance for Assessing Bioaccumulative Chemicals of Concern in Sediment. DEQ 07‐LQ‐023A Final, Updated April 3, 2007.
DEQ 2012. Table of Risk Based Concentrations for Individual Chemicals. Revision June 7, 2012.
DEQ 2013. Figure 1 and Table 1. Background Levels of Metals in Soil for Cleanup. DEQ Fact Sheet. March 20, 2013.
DEQ 2015. Environmental Cleanup Site Information (ECSI) Database Site Summary Report ‐ Details for Site ID 1906, Mid‐Coast Marine. Website: http://www.deq.state.or.us/lq/ECSI/ecsidetail.asp?seqnbr=1906
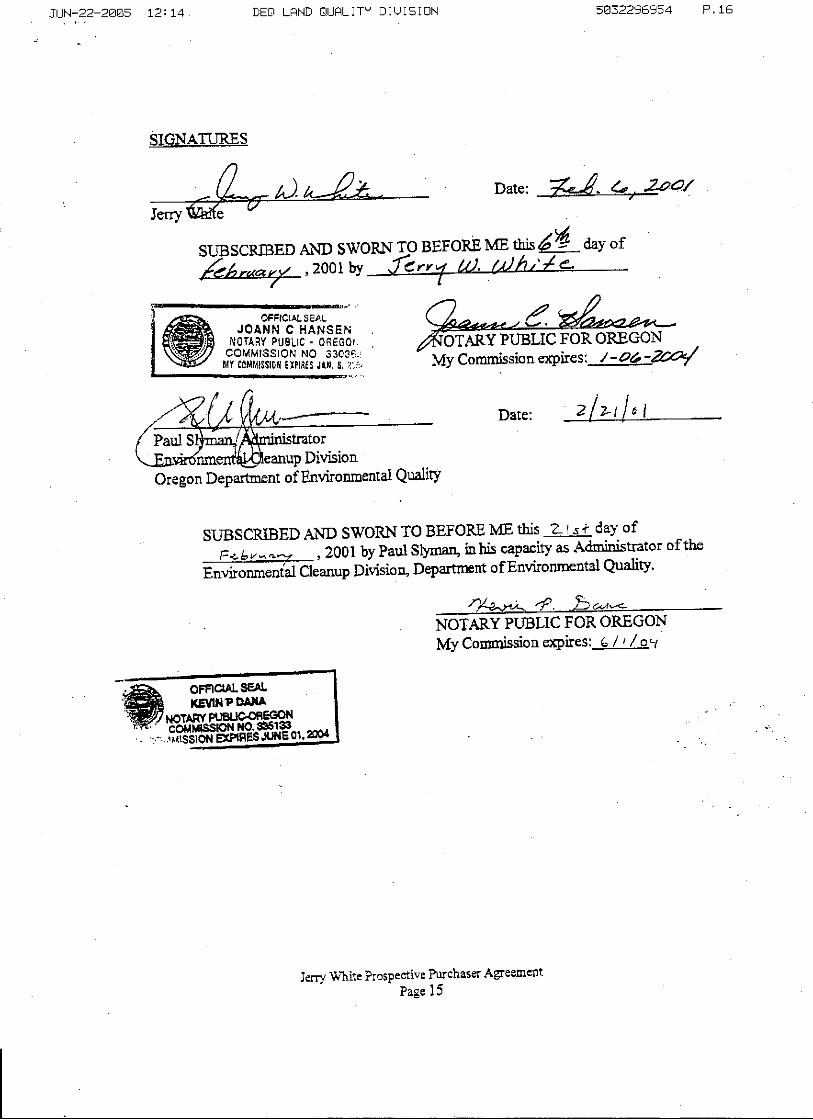
DEQ and White 2001. Prospective Purchaser Agreement between DEQ and Mr. Jerry White. DEQ No. 01‐01. Signed February 21, 2001.
DMMP 2008. Dredged Material Evaluation and Disposal Procedures (Users’ Manual). Prepared by the
U.S. Army Corps of Engineers, Seattle District, Environmental Protection Agency Region 10,
Washington State Department of Natural Resources, and Washington State Department of Ecology.
June 2008.
Ecology and Environment, Inc. (E&E) 2000a. Mid‐Coast Marine (MCM) Site: Sediment Removal Action Construction Summary Report. April 14, 2000.
E&E 2000b. Final Remedial Investigation Report, Mid‐Coast Marine, Coos Bay, Oregon. July 2000.
22 | Mid‐Coast Marine
15776‐00/Task 9 January 28, 2016
EPA 1992. Remedial Action Report, Documentation for Operable Unit Completion, Office of Solid Waste and Emergency Response Directive 9355.0‐39FS. June 1992.
EPA 1997. Mid‐Coast Marine Coos Bay Site Inspection, Coos Bay, Oregon. Prepared by Roy F. Weston, Inc. September 1997.
EPA 2014. Regional Screening Level (RSL) Summary Table. May 2014.
EPA and DEQ 1998. EPA/DEQ Deferral Agreement. Mid‐Coast Marine Oregon Corporation Site, Coos Bay, Oregon. December 2, 1998.
Groth 2014. Personal communication between Mark Pugh, DEQ project manager, and Kate Groth,
USACE. February. 4, 2014.
Hart Crowser 2014a. Data Gaps Assessment Report, Mid‐Coast Marine, Coos Bay, Oregon. June 2014.
Hart Crowser 2014b. Sediment Investigation Work Plan, Mid‐Coast Marine, Coos Bay, Oregon. October 2014.
Hart Crowser 2015a. Sediment Investigation Report, Mid‐Coast Marine, Coos Bay, Oregon. March 6, 2015.
Hart Crowser 2015b. Revised Budget and Assumptions Proposal for Task Order 22‐13‐7,
Mid‐Coast Marine Sediment Investigation
Krone, C.A., D.W. Brown, D.G. Burrows, R.G. Bogar, S.‐L. Chan, and U. Varanasi 1989. A method for
analysis of butyltin species and the measurement of butyltins in sediment and English sole livers from
Puget Sound. Mar. Environ. Res. 27:1‐18.
Northwestern Aquatic Sciences (NAS) 2015. Report of Test Nos. 866‐1, 3 & 4. Toxicity of Marine Sediments Using 10‐day Eohaustorius estuarius, Mytilus galloprovincialis Larval, and 20‐day Neanthes arenaceodentata Sediment Bioassays as Part of the Mid‐Coast Marine Sediment Investigation, Coos Bay, OR. August 12, 2015.
Puget Sound Dredged Disposal Analysis (PSDDA). 1989. Management plan report ‐ unconfined open‐
water disposal of dredged material, Phase II ‐ (north and south Puget Sound). Puget Sound Dredged
Disposal Analysis, Army Corps of Engineers, Seattle, WA. (and other modifications made through the
PSDDA process and Sediment Management Annual Review Meetings).
Puget Sound Estuary Program 1995. Recommended guidelines for conducting laboratory bioassays on
Puget Sound sediments. Prepared for U.S. Env. Prot. Agency, Region 10, Office of Puget Sound, Seattle,
WA and Puget Sound Water Quality Authority, P.O. Box 40900, Olympia, WA.
United States Army Corps of Engineers (USACE), Oregon Department of Environmental Quality, Washington State Department of Ecology, US Environmental Protection Agency Region 10, and Washington State Department of Natural Resources 1998. Dredged Material Evaluation Framework, Lower Columbia River Management Area. 1998.
Mid‐Coast Marine | 23
15776‐00/Task 9 January 28, 2016
USACE, Seattle District; U.S. EPA, Region 10; Washington Department of Natural Resources;
Washington Department of Ecology. 2000. Dredged material evaluation and disposal procedures: a
user's manual for the dredged disposal analysis (PSDDA) program.
USACE, Seattle District, Portland District, Walla Walla District, and Northwestern Division; U.S. EPA, Region 10; Washington Departments of Ecology and Natural Resources; Oregon Department of Environmental Quality; Idaho Department of Environmental Quality; National Marine Fisheries Service; and U.S., Fish and Wildlife Service 2009. Sediment Evaluation Framework for the Pacific Northwest. September 2009.
Washington State Department of Ecology (Ecology) 1996. Sediment Sampling and Analysis Plan.
September 1996.
Washington State Department of Ecology (Ecology) 2003. Sediment sampling and analysis plan
appendix. Publication no. 03‐09‐043, WDOE, Olympia, W A.
Weston 1996. Recommendations for Screening Values for Tributyltin in Sediments at Superfund Sites in
Puget Sound, Washington. October 1996.
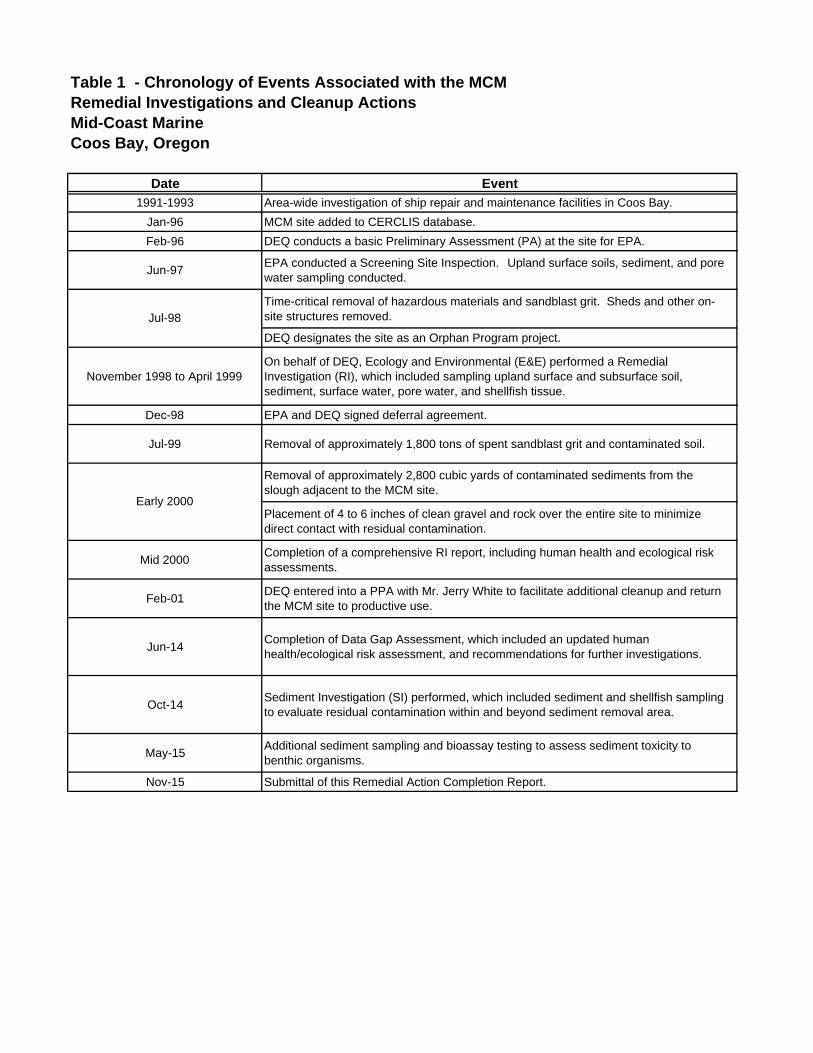
Table 1 - Chronology of Events Associated with the MCM Remedial Investigations and Cleanup Actions Mid-Coast MarineCoos Bay, Oregon
Date Event
1991-1993 Area-wide investigation of ship repair and maintenance facilities in Coos Bay.
Jan-96 MCM site added to CERCLIS database.
Feb-96 DEQ conducts a basic Preliminary Assessment (PA) at the site for EPA.
Jun-97EPA conducted a Screening Site Inspection. Upland surface soils, sediment, and pore water sampling conducted.
Time-critical removal of hazardous materials and sandblast grit. Sheds and other on-site structures removed.
DEQ designates the site as an Orphan Program project.
November 1998 to April 1999On behalf of DEQ, Ecology and Environmental (E&E) performed a Remedial Investigation (RI), which included sampling upland surface and subsurface soil, sediment, surface water, pore water, and shellfish tissue.
Dec-98 EPA and DEQ signed deferral agreement.
Jul-99 Removal of approximately 1,800 tons of spent sandblast grit and contaminated soil.
Removal of approximately 2,800 cubic yards of contaminated sediments from the slough adjacent to the MCM site.
Placement of 4 to 6 inches of clean gravel and rock over the entire site to minimize direct contact with residual contamination.
Mid 2000Completion of a comprehensive RI report, including human health and ecological risk assessments.
Feb-01DEQ entered into a PPA with Mr. Jerry White to facilitate additional cleanup and return the MCM site to productive use.
Jun-14Completion of Data Gap Assessment, which included an updated human health/ecological risk assessment, and recommendations for further investigations.
Oct-14Sediment Investigation (SI) performed, which included sediment and shellfish sampling to evaluate residual contamination within and beyond sediment removal area.
May-15Additional sediment sampling and bioassay testing to assess sediment toxicity to benthic organisms.
Nov-15 Submittal of this Remedial Action Completion Report.
Jul-98
Early 2000
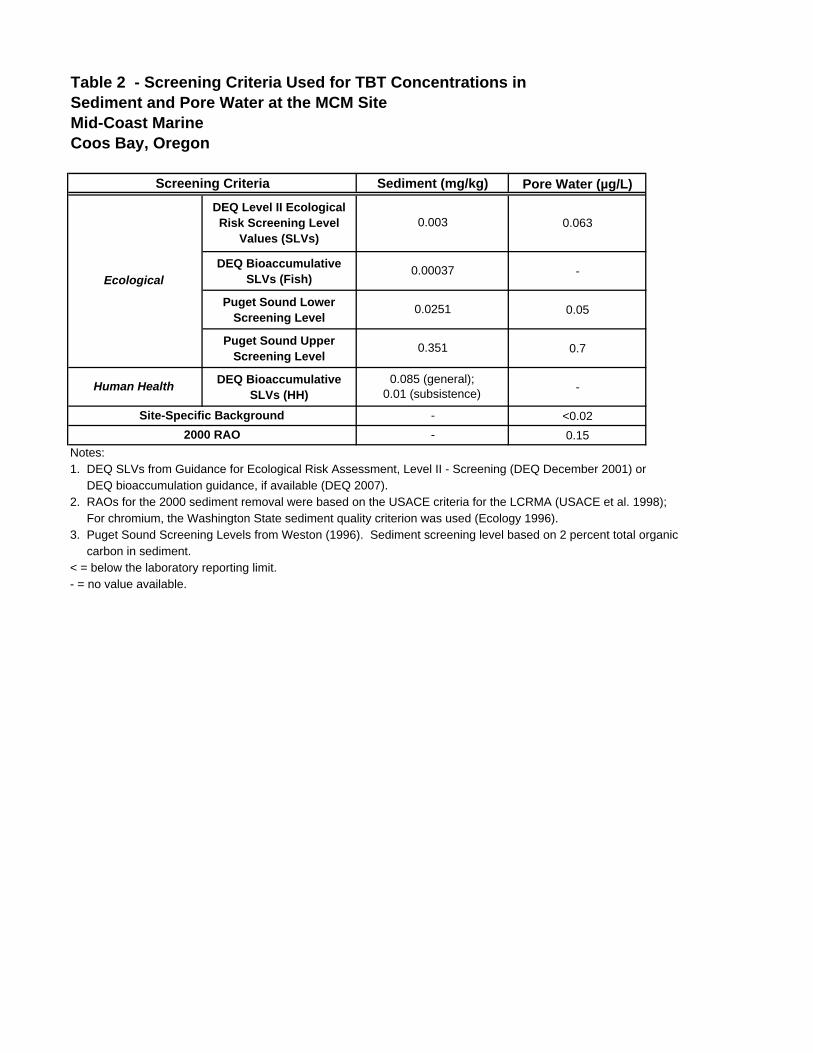
Table 2 - Screening Criteria Used for TBT Concentrations in Sediment and Pore Water at the MCM SiteMid-Coast MarineCoos Bay, Oregon
Pore Water (µg/L)
DEQ Level II Ecological Risk Screening Level
Values (SLVs)0.063
DEQ Bioaccumulative SLVs (Fish)
-
Puget Sound Lower Screening Level
0.05
Puget Sound Upper Screening Level
0.7
DEQ Bioaccumulative SLVs (HH)
-
<0.02
0.15
Screening Criteria Sediment (mg/kg)
Ecological
0.003
0.00037
0.0251
0.351
0.085 (general); 0.01 (subsistence)
2000 RAO -
Site-Specific Background -
Human Health
Notes:
< = below the laboratory reporting limit.- = no value available.
1. DEQ SLVs from Guidance for Ecological Risk Assessment, Level II - Screening (DEQ December 2001) or DEQ bioaccumulation guidance, if available (DEQ 2007).2. RAOs for the 2000 sediment removal were based on the USACE criteria for the LCRMA (USACE et al. 1998); For chromium, the Washington State sediment quality criterion was used (Ecology 1996).3. Puget Sound Screening Levels from Weston (1996). Sediment screening level based on 2 percent total organic carbon in sediment.
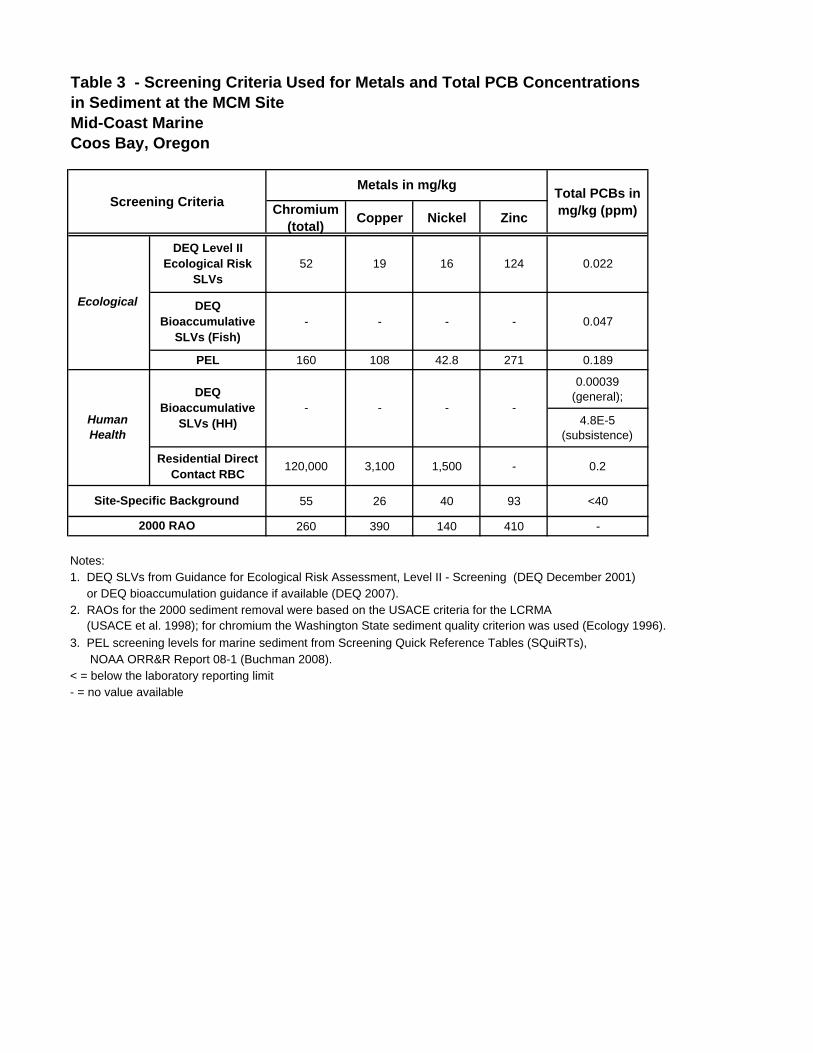
Table 3 - Screening Criteria Used for Metals and Total PCB Concentrations in Sediment at the MCM SiteMid-Coast MarineCoos Bay, Oregon
Chromium (total)
Copper Nickel Zinc
DEQ Level II Ecological Risk
SLVs52 19 16 124 0.022
DEQ Bioaccumulative
SLVs (Fish)- - - - 0.047
PEL 160 108 42.8 271 0.189
0.00039 (general);
4.8E-5 (subsistence)
Residential Direct Contact RBC
120,000 3,100 1,500 - 0.2
55 26 40 93 <40
260 390 140 410 -
Notes:1. DEQ SLVs from Guidance for Ecological Risk Assessment, Level II - Screening (DEQ December 2001) or DEQ bioaccumulation guidance if available (DEQ 2007).2. RAOs for the 2000 sediment removal were based on the USACE criteria for the LCRMA (USACE et al. 1998); for chromium the Washington State sediment quality criterion was used (Ecology 1996).
3. PEL screening levels for marine sediment from Screening Quick Reference Tables (SQuiRTs), NOAA ORR&R Report 08-1 (Buchman 2008).< = below the laboratory reporting limit- = no value available
Site-Specific Background
2000 RAO
Screening Criteria Metals in mg/kg
Total PCBs in mg/kg (ppm)
Ecological
Human Health
DEQ Bioaccumulative
SLVs (HH)- - - -
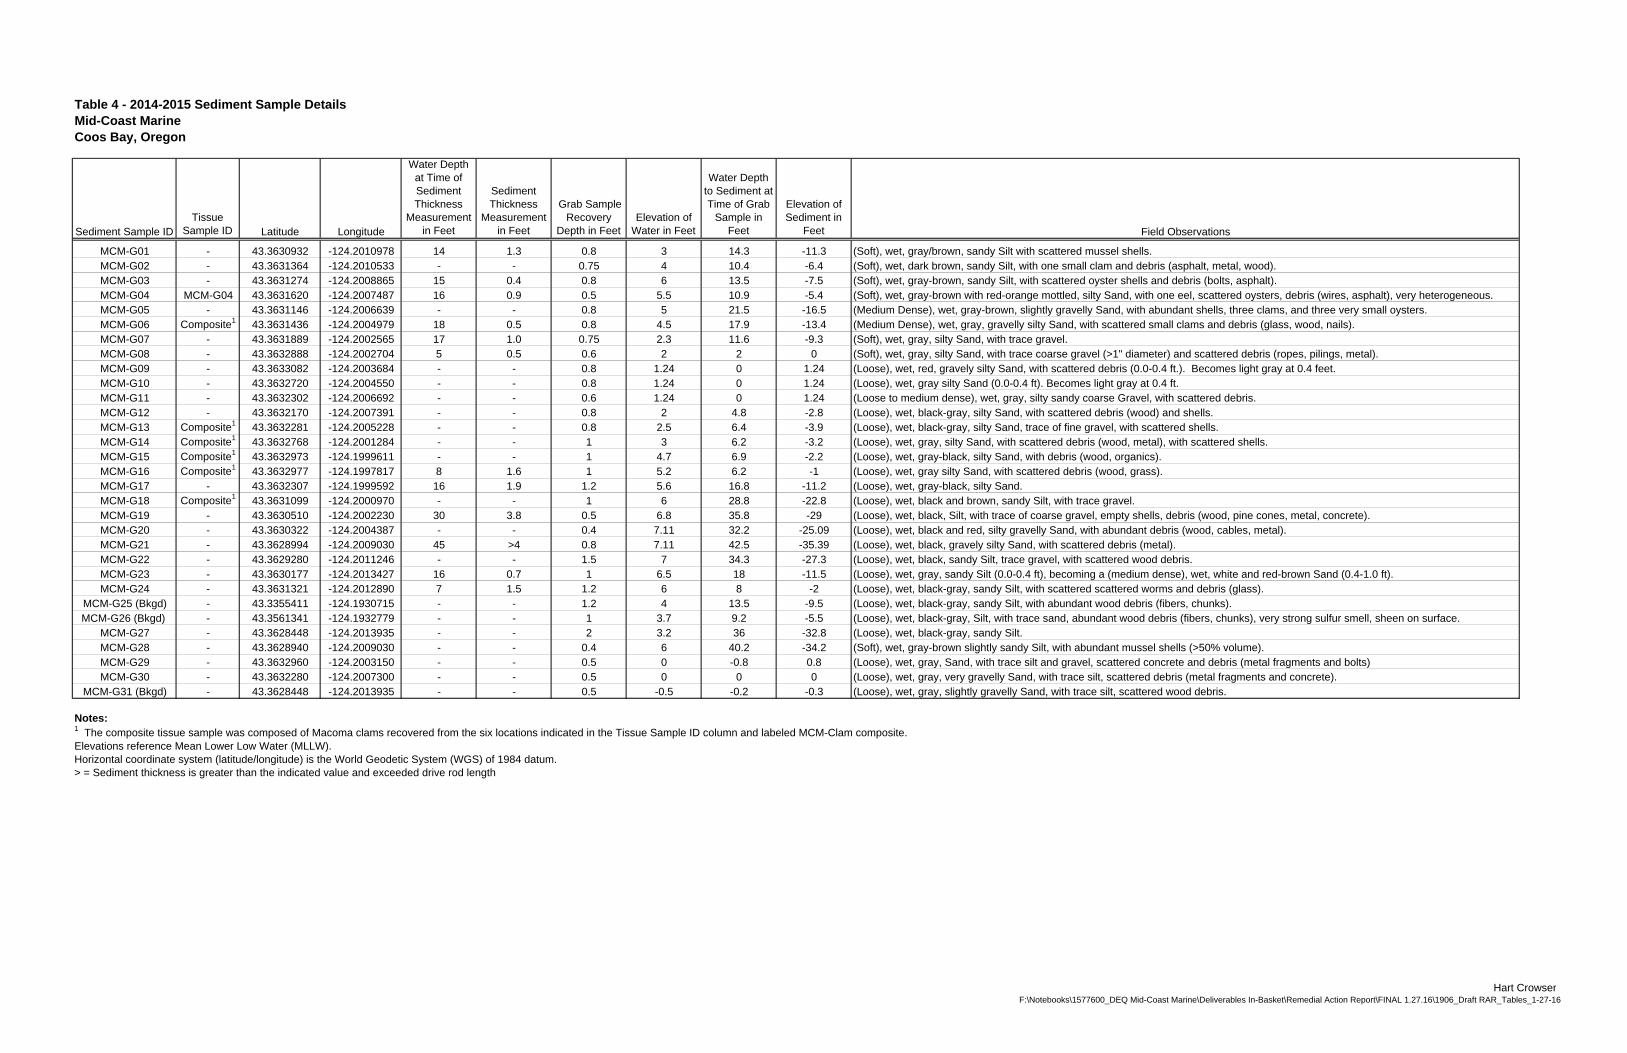
Table 4 - 2014-2015 Sediment Sample DetailsMid-Coast MarineCoos Bay, Oregon
Sediment Sample IDTissue
Sample ID Latitude Longitude
Water Depth at Time of Sediment Thickness
Measurement in Feet
Sediment Thickness
Measurement in Feet
Grab Sample Recovery
Depth in FeetElevation of
Water in Feet
Water Depth to Sediment at Time of Grab
Sample in Feet
Elevation of Sediment in
Feet Field Observations
MCM-G01 - 43.3630932 -124.2010978 14 1.3 0.8 3 14.3 -11.3 (Soft), wet, gray/brown, sandy Silt with scattered mussel shells.MCM-G02 - 43.3631364 -124.2010533 - - 0.75 4 10.4 -6.4 (Soft), wet, dark brown, sandy Silt, with one small clam and debris (asphalt, metal, wood).MCM-G03 - 43.3631274 -124.2008865 15 0.4 0.8 6 13.5 -7.5 (Soft), wet, gray-brown, sandy Silt, with scattered oyster shells and debris (bolts, asphalt).MCM-G04 MCM-G04 43.3631620 -124.2007487 16 0.9 0.5 5.5 10.9 -5.4 (Soft), wet, gray-brown with red-orange mottled, silty Sand, with one eel, scattered oysters, debris (wires, asphalt), very heterogeneous.MCM-G05 - 43.3631146 -124.2006639 - - 0.8 5 21.5 -16.5 (Medium Dense), wet, gray-brown, slightly gravelly Sand, with abundant shells, three clams, and three very small oysters.MCM-G06 Composite1 43.3631436 -124.2004979 18 0.5 0.8 4.5 17.9 -13.4 (Medium Dense), wet, gray, gravelly silty Sand, with scattered small clams and debris (glass, wood, nails).MCM-G07 - 43.3631889 -124.2002565 17 1.0 0.75 2.3 11.6 -9.3 (Soft), wet, gray, silty Sand, with trace gravel.MCM-G08 - 43.3632888 -124.2002704 5 0.5 0.6 2 2 0 (Soft), wet, gray, silty Sand, with trace coarse gravel (>1" diameter) and scattered debris (ropes, pilings, metal).MCM-G09 - 43.3633082 -124.2003684 - - 0.8 1.24 0 1.24 (Loose), wet, red, gravely silty Sand, with scattered debris (0.0-0.4 ft.). Becomes light gray at 0.4 feet.MCM-G10 - 43.3632720 -124.2004550 - - 0.8 1.24 0 1.24 (Loose), wet, gray silty Sand (0.0-0.4 ft). Becomes light gray at 0.4 ft. MCM-G11 - 43.3632302 -124.2006692 - - 0.6 1.24 0 1.24 (Loose to medium dense), wet, gray, silty sandy coarse Gravel, with scattered debris.MCM-G12 - 43.3632170 -124.2007391 - - 0.8 2 4.8 -2.8 (Loose), wet, black-gray, silty Sand, with scattered debris (wood) and shells.MCM-G13 Composite1 43.3632281 -124.2005228 - - 0.8 2.5 6.4 -3.9 (Loose), wet, black-gray, silty Sand, trace of fine gravel, with scattered shells.MCM-G14 Composite1 43.3632768 -124.2001284 - - 1 3 6.2 -3.2 (Loose), wet, gray, silty Sand, with scattered debris (wood, metal), with scattered shells.MCM-G15 Composite1 43.3632973 -124.1999611 - - 1 4.7 6.9 -2.2 (Loose), wet, gray-black, silty Sand, with debris (wood, organics).MCM-G16 Composite1 43.3632977 -124.1997817 8 1.6 1 5.2 6.2 -1 (Loose), wet, gray silty Sand, with scattered debris (wood, grass).MCM-G17 - 43.3632307 -124.1999592 16 1.9 1.2 5.6 16.8 -11.2 (Loose), wet, gray-black, silty Sand.MCM-G18 Composite1 43.3631099 -124.2000970 - - 1 6 28.8 -22.8 (Loose), wet, black and brown, sandy Silt, with trace gravel.MCM-G19 - 43.3630510 -124.2002230 30 3.8 0.5 6.8 35.8 -29 (Loose), wet, black, Silt, with trace of coarse gravel, empty shells, debris (wood, pine cones, metal, concrete).MCM-G20 - 43.3630322 -124.2004387 - - 0.4 7.11 32.2 -25.09 (Loose), wet, black and red, silty gravelly Sand, with abundant debris (wood, cables, metal).MCM-G21 - 43.3628994 -124.2009030 45 >4 0.8 7.11 42.5 -35.39 (Loose), wet, black, gravely silty Sand, with scattered debris (metal).MCM-G22 - 43.3629280 -124.2011246 - - 1.5 7 34.3 -27.3 (Loose), wet, black, sandy Silt, trace gravel, with scattered wood debris. MCM-G23 - 43.3630177 -124.2013427 16 0.7 1 6.5 18 -11.5 (Loose), wet, gray, sandy Silt (0.0-0.4 ft), becoming a (medium dense), wet, white and red-brown Sand (0.4-1.0 ft).MCM-G24 - 43.3631321 -124.2012890 7 1.5 1.2 6 8 -2 (Loose), wet, black-gray, sandy Silt, with scattered scattered worms and debris (glass).
MCM-G25 (Bkgd) - 43.3355411 -124.1930715 - - 1.2 4 13.5 -9.5 (Loose), wet, black-gray, sandy Silt, with abundant wood debris (fibers, chunks).MCM-G26 (Bkgd) - 43.3561341 -124.1932779 - - 1 3.7 9.2 -5.5 (Loose), wet, black-gray, Silt, with trace sand, abundant wood debris (fibers, chunks), very strong sulfur smell, sheen on surface.
MCM-G27 - 43.3628448 -124.2013935 - - 2 3.2 36 -32.8 (Loose), wet, black-gray, sandy Silt.MCM-G28 - 43.3628940 -124.2009030 - - 0.4 6 40.2 -34.2 (Soft), wet, gray-brown slightly sandy Silt, with abundant mussel shells (>50% volume). MCM-G29 - 43.3632960 -124.2003150 - - 0.5 0 -0.8 0.8 (Loose), wet, gray, Sand, with trace silt and gravel, scattered concrete and debris (metal fragments and bolts)MCM-G30 - 43.3632280 -124.2007300 - - 0.5 0 0 0 (Loose), wet, gray, very gravelly Sand, with trace silt, scattered debris (metal fragments and concrete).
MCM-G31 (Bkgd) - 43.3628448 -124.2013935 - - 0.5 -0.5 -0.2 -0.3 (Loose), wet, gray, slightly gravelly Sand, with trace silt, scattered wood debris.
Notes:1 The composite tissue sample was composed of Macoma clams recovered from the six locations indicated in the Tissue Sample ID column and labeled MCM-Clam composite. Elevations reference Mean Lower Low Water (MLLW).Horizontal coordinate system (latitude/longitude) is the World Geodetic System (WGS) of 1984 datum. > = Sediment thickness is greater than the indicated value and exceeded drive rod length
Hart CrowserF:\Notebooks\1577600_DEQ Mid-Coast Marine\Deliverables In-Basket\Remedial Action Report\FINAL 1.27.16\1906_Draft RAR_Tables_1-27-16
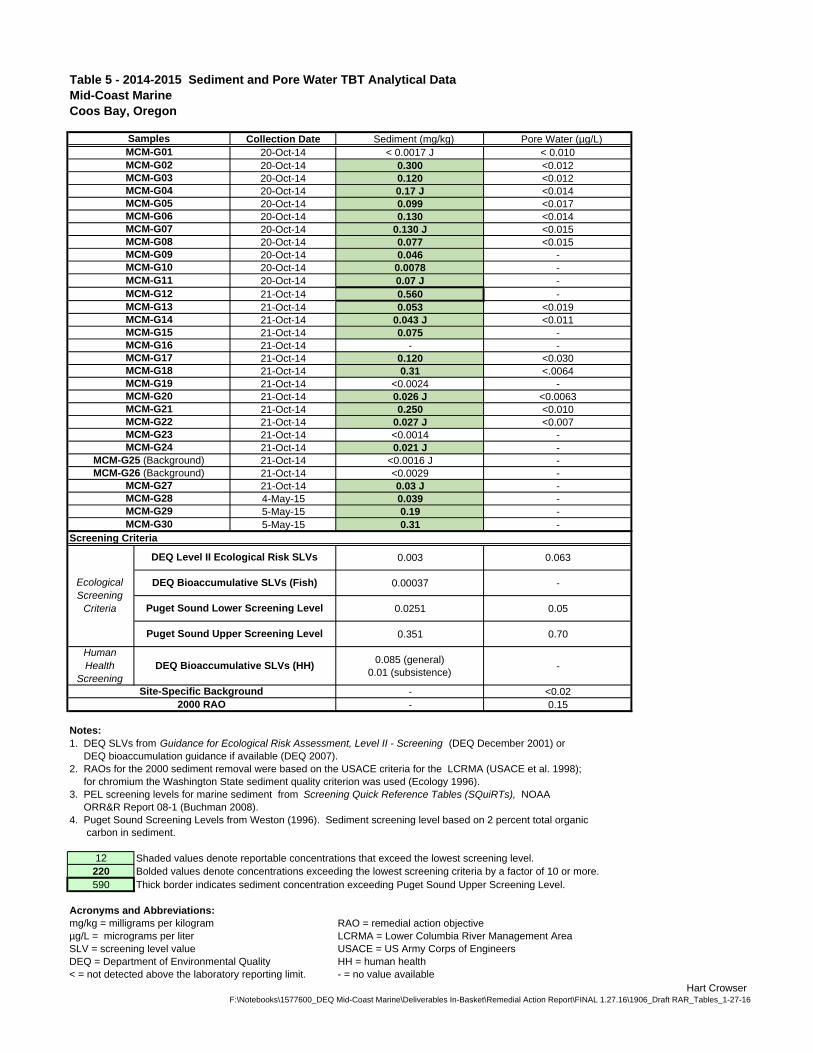
Table 5 - 2014-2015 Sediment and Pore Water TBT Analytical DataMid-Coast Marine Coos Bay, Oregon
Collection Date Sediment (mg/kg) Pore Water (µg/L)20-Oct-14 < 0.0017 J < 0.01020-Oct-14 0.300 <0.01220-Oct-14 0.120 <0.01220-Oct-14 0.17 J <0.01420-Oct-14 0.099 <0.01720-Oct-14 0.130 <0.01420-Oct-14 0.130 J <0.01520-Oct-14 0.077 <0.01520-Oct-14 0.046 -20-Oct-14 0.0078 -20-Oct-14 0.07 J -21-Oct-14 0.560 -21-Oct-14 0.053 <0.01921-Oct-14 0.043 J <0.01121-Oct-14 0.075 -21-Oct-14 - -21-Oct-14 0.120 <0.03021-Oct-14 0.31 <.006421-Oct-14 <0.0024 -21-Oct-14 0.026 J <0.006321-Oct-14 0.250 <0.01021-Oct-14 0.027 J <0.00721-Oct-14 <0.0014 -21-Oct-14 0.021 J -21-Oct-14 <0.0016 J -21-Oct-14 <0.0029 -21-Oct-14 0.03 J -4-May-15 0.039 -5-May-15 0.19 -5-May-15 0.31 -
Screening Criteria
0.003 0.063
0.00037 -
0.0251 0.05
0.351 0.70
Human Health
Screening
0.085 (general) 0.01 (subsistence)
-
- <0.02- 0.15
Notes:1. DEQ SLVs from Guidance for Ecological Risk Assessment, Level II - Screening (DEQ December 2001) or DEQ bioaccumulation guidance if available (DEQ 2007).2. RAOs for the 2000 sediment removal were based on the USACE criteria for the LCRMA (USACE et al. 1998); for chromium the Washington State sediment quality criterion was used (Ecology 1996). 3. PEL screening levels for marine sediment from Screening Quick Reference Tables (SQuiRTs), NOAA ORR&R Report 08-1 (Buchman 2008). 4. Puget Sound Screening Levels from Weston (1996). Sediment screening level based on 2 percent total organic carbon in sediment.
12 Shaded values denote reportable concentrations that exceed the lowest screening level.220 Bolded values denote concentrations exceeding the lowest screening criteria by a factor of 10 or more. 590 Thick border indicates sediment concentration exceeding Puget Sound Upper Screening Level.
Acronyms and Abbreviations:mg/kg = milligrams per kilogram RAO = remedial action objectiveµg/L = micrograms per liter LCRMA = Lower Columbia River Management AreaSLV = screening level value USACE = US Army Corps of EngineersDEQ = Department of Environmental Quality HH = human health< = not detected above the laboratory reporting limit. - = no value available
MCM-G11
SamplesMCM-G01MCM-G02MCM-G03MCM-G04MCM-G05MCM-G06MCM-G07MCM-G08MCM-G09MCM-G10
2000 RAOSite-Specific Background
MCM-G23
MCM-G12MCM-G13MCM-G14MCM-G15MCM-G16MCM-G17MCM-G18MCM-G19MCM-G20MCM-G21MCM-G22
MCM-G24MCM-G25 (Background)MCM-G26 (Background)
Ecological Screening
Criteria
MCM-G27MCM-G28MCM-G29MCM-G30
DEQ Bioaccumulative SLVs (HH)
Puget Sound Upper Screening Level
Puget Sound Lower Screening Level
DEQ Bioaccumulative SLVs (Fish)
DEQ Level II Ecological Risk SLVs
Hart CrowserF:\Notebooks\1577600_DEQ Mid-Coast Marine\Deliverables In-Basket\Remedial Action Report\FINAL 1.27.16\1906_Draft RAR_Tables_1-27-16
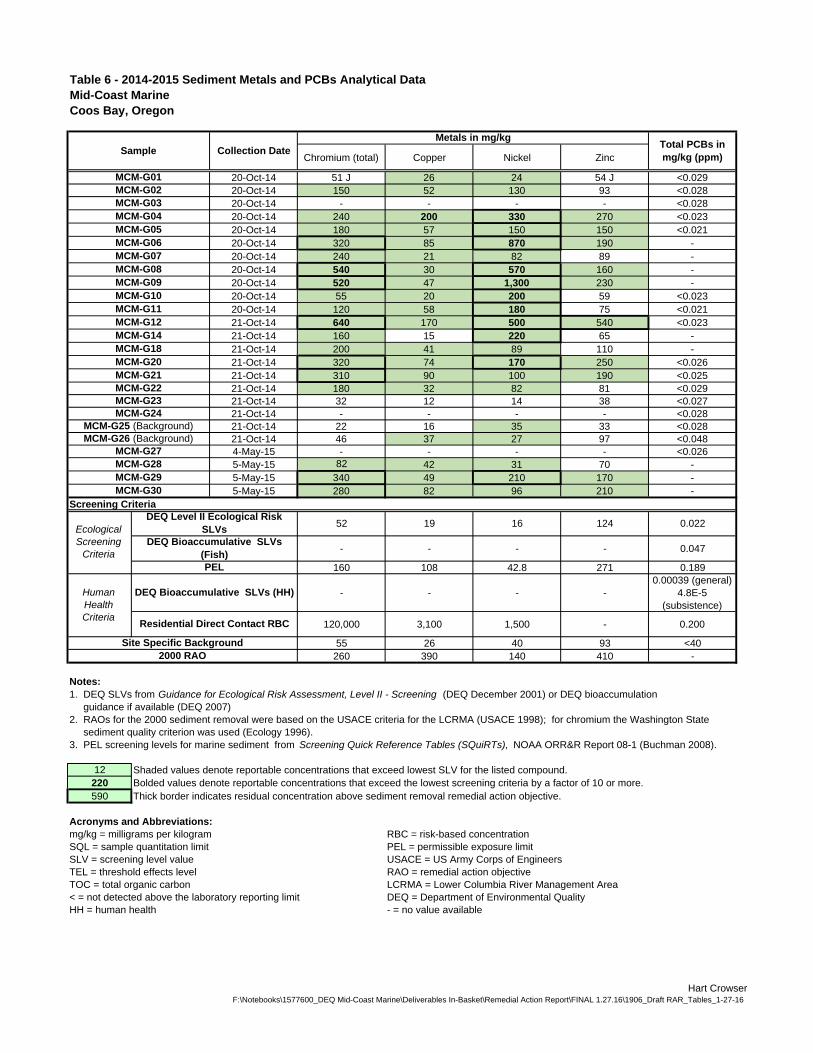
Table 6 - 2014-2015 Sediment Metals and PCBs Analytical Data Mid-Coast Marine Coos Bay, Oregon
Chromium (total) Copper Nickel Zinc
20-Oct-14 51 J 26 24 54 J <0.02920-Oct-14 150 52 130 93 <0.02820-Oct-14 - - - - <0.02820-Oct-14 240 200 330 270 <0.02320-Oct-14 180 57 150 150 <0.02120-Oct-14 320 85 870 190 -20-Oct-14 240 21 82 89 -20-Oct-14 540 30 570 160 -20-Oct-14 520 47 1,300 230 -20-Oct-14 55 20 200 59 <0.02320-Oct-14 120 58 180 75 <0.02121-Oct-14 640 170 500 540 <0.02321-Oct-14 160 15 220 65 -21-Oct-14 200 41 89 110 -21-Oct-14 320 74 170 250 <0.02621-Oct-14 310 90 100 190 <0.02521-Oct-14 180 32 82 81 <0.02921-Oct-14 32 12 14 38 <0.02721-Oct-14 - - - - <0.02821-Oct-14 22 16 35 33 <0.02821-Oct-14 46 37 27 97 <0.0484-May-15 - - - - <0.0265-May-15 82 42 31 70 -5-May-15 340 49 210 170 -5-May-15 280 82 96 210 -
Screening Criteria
52 19 16 124 0.022
- - - - 0.047
160 108 42.8 271 0.189
- - - -0.00039 (general)
4.8E-5 (subsistence)
120,000 3,100 1,500 - 0.200
55 26 40 93 <40260 390 140 410 -
Notes:1. DEQ SLVs from Guidance for Ecological Risk Assessment, Level II - Screening (DEQ December 2001) or DEQ bioaccumulation guidance if available (DEQ 2007)2. RAOs for the 2000 sediment removal were based on the USACE criteria for the LCRMA (USACE 1998); for chromium the Washington State sediment quality criterion was used (Ecology 1996). 3. PEL screening levels for marine sediment from Screening Quick Reference Tables (SQuiRTs), NOAA ORR&R Report 08-1 (Buchman 2008).
12 Shaded values denote reportable concentrations that exceed lowest SLV for the listed compound.220 Bolded values denote reportable concentrations that exceed the lowest screening criteria by a factor of 10 or more. 590 Thick border indicates residual concentration above sediment removal remedial action objective.
Acronyms and Abbreviations:mg/kg = milligrams per kilogram RBC = risk-based concentration SQL = sample quantitation limit PEL = permissible exposure limitSLV = screening level value USACE = US Army Corps of EngineersTEL = threshold effects level RAO = remedial action objectiveTOC = total organic carbon LCRMA = Lower Columbia River Management Area< = not detected above the laboratory reporting limit DEQ = Department of Environmental QualityHH = human health - = no value available
MCM-G08
SampleMetals in mg/kg
Total PCBs in mg/kg (ppm)
MCM-G01MCM-G02MCM-G03MCM-G04MCM-G05MCM-G06MCM-G07
Collection Date
MCM-G25 (Background)
MCM-G09MCM-G10MCM-G11MCM-G12MCM-G14MCM-G18MCM-G20MCM-G21MCM-G22MCM-G23MCM-G24
2000 RAOSite Specific Background
Residential Direct Contact RBC
DEQ Bioaccumulative SLVs (HH)
PEL
DEQ Level II Ecological Risk SLVs
MCM-G26 (Background)
Ecological Screening
Criteria
Human Health Criteria
MCM-G27
MCM-G29MCM-G30
MCM-G28
DEQ Bioaccumulative SLVs (Fish)
Hart CrowserF:\Notebooks\1577600_DEQ Mid-Coast Marine\Deliverables In-Basket\Remedial Action Report\FINAL 1.27.16\1906_Draft RAR_Tables_1-27-16
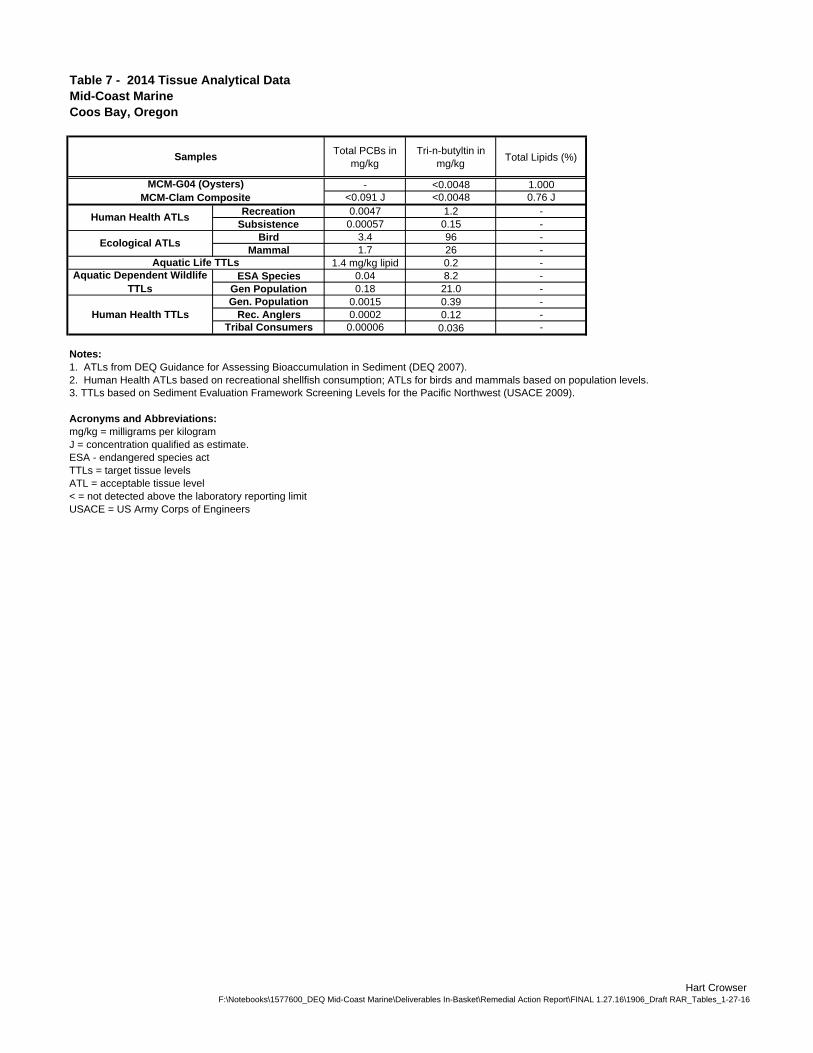
Table 7 - 2014 Tissue Analytical DataMid-Coast MarineCoos Bay, Oregon
Total PCBs in mg/kg
Tri-n-butyltin in mg/kg
Total Lipids (%)
- <0.0048 1.000<0.091 J <0.0048 0.76 J
Recreation 0.0047 1.2 -Subsistence 0.00057 0.15 -
Bird 3.4 96 -Mammal 1.7 26 -
1.4 mg/kg lipid 0.2 -ESA Species 0.04 8.2 -
Gen Population 0.18 21.0 -Gen. Population 0.0015 0.39 -
Rec. Anglers 0.0002 0.12 -Tribal Consumers 0.00006 0.036 -
Notes:1. ATLs from DEQ Guidance for Assessing Bioaccumulation in Sediment (DEQ 2007).2. Human Health ATLs based on recreational shellfish consumption; ATLs for birds and mammals based on population levels. 3. TTLs based on Sediment Evaluation Framework Screening Levels for the Pacific Northwest (USACE 2009).
Acronyms and Abbreviations:mg/kg = milligrams per kilogramJ = concentration qualified as estimate.ESA - endangered species actTTLs = target tissue levelsATL = acceptable tissue level< = not detected above the laboratory reporting limitUSACE = US Army Corps of Engineers
Aquatic Dependent Wildlife TTLs
Human Health TTLs
Samples
MCM-G04 (Oysters)MCM-Clam Composite
Human Health ATLs
Ecological ATLs
Aquatic Life TTLs
Hart CrowserF:\Notebooks\1577600_DEQ Mid-Coast Marine\Deliverables In-Basket\Remedial Action Report\FINAL 1.27.16\1906_Draft RAR_Tables_1-27-16
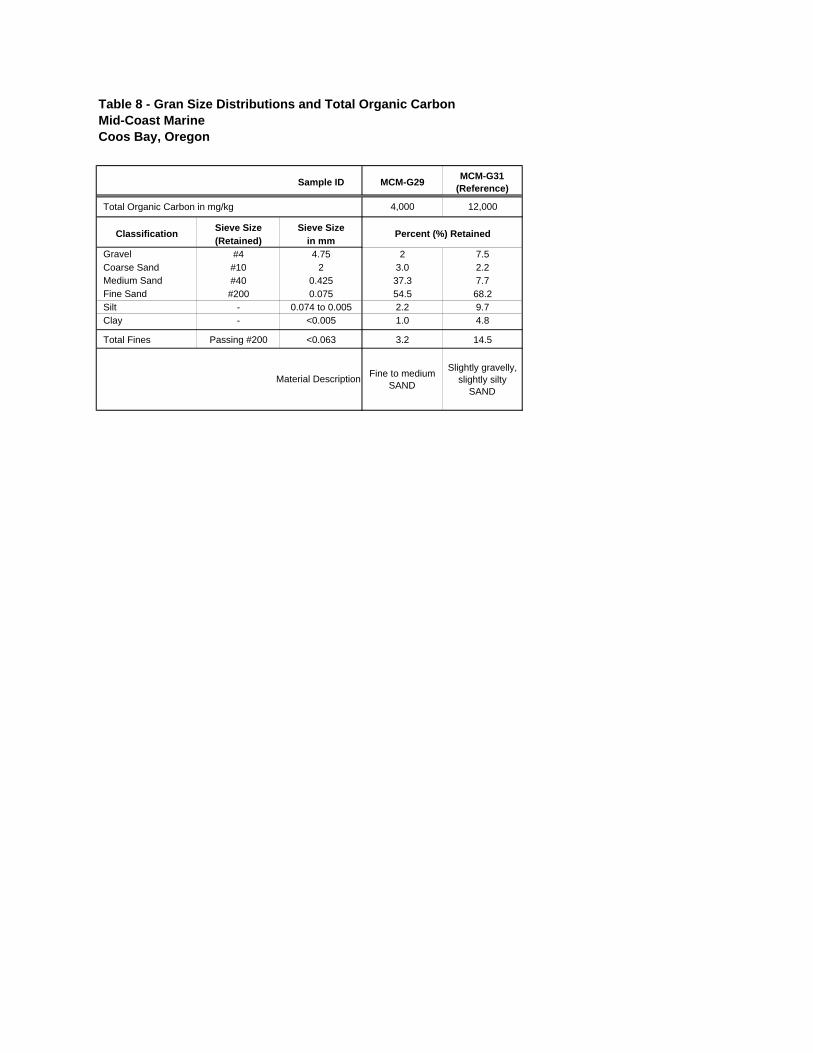
Table 8 - Gran Size Distributions and Total Organic CarbonMid-Coast MarineCoos Bay, Oregon
Sample ID MCM-G29MCM-G31
(Reference)
Total Organic Carbon in mg/kg 4,000 12,000
Sieve Size Sieve Size(Retained) in mm
Gravel #4 4.75 2 7.5Coarse Sand #10 2 3.0 2.2Medium Sand #40 0.425 37.3 7.7Fine Sand #200 0.075 54.5 68.2Silt - 0.074 to 0.005 2.2 9.7Clay - <0.005 1.0 4.8
Total Fines Passing #200 <0.063 3.2 14.5
Fine to medium SAND
Slightly gravelly, slightly silty
SANDMaterial Description
Classification Percent (%) Retained
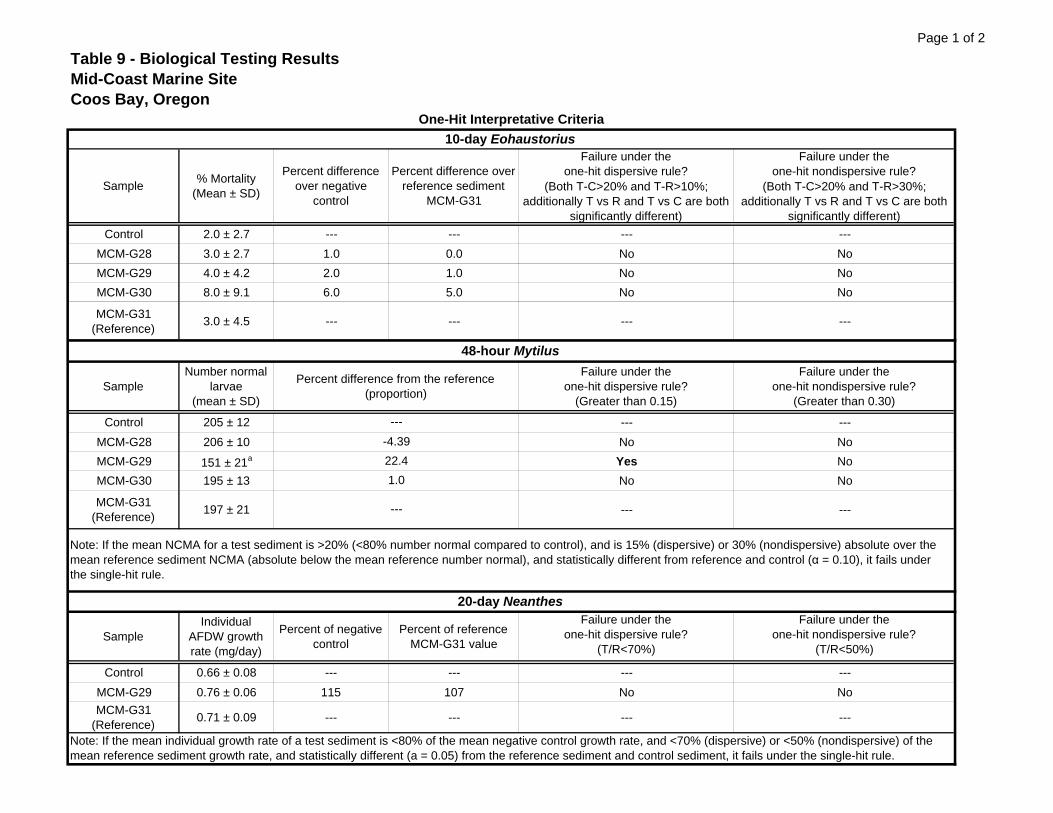
Page 1 of 2
Table 9 - Biological Testing ResultsMid-Coast Marine SiteCoos Bay, Oregon
Failure under the one-hit dispersive rule?
Failure under the one-hit nondispersive rule?
(Both T-C>20% and T-R>10%; additionally T vs R and T vs C are both
significantly different)
(Both T-C>20% and T-R>30%; additionally T vs R and T vs C are both
significantly different)
Control 2.0 ± 2.7 --- --- --- ---
MCM-G28 3.0 ± 2.7 1.0 0.0 No No
MCM-G29 4.0 ± 4.2 2.0 1.0 No No
MCM-G30 8.0 ± 9.1 6.0 5.0 No No
MCM-G31 (Reference)
3.0 ± 4.5 --- --- --- ---
Control 205 ± 12 --- ---
MCM-G28 206 ± 10 No No
MCM-G29 151 ± 21a Yes No
MCM-G30 195 ± 13 No No
MCM-G31 (Reference)
197 ± 21 --- ---
Failure under the one-hit dispersive rule?
Failure under the one-hit nondispersive rule?
(T/R<70%) (T/R<50%)
Control 0.66 ± 0.08 --- --- --- ---
MCM-G29 0.76 ± 0.06 115 107 No No
MCM-G31 (Reference)
0.71 ± 0.09 --- --- --- ---
Note: If the mean NCMA for a test sediment is >20% (<80% number normal compared to control), and is 15% (dispersive) or 30% (nondispersive) absolute over the mean reference sediment NCMA (absolute below the mean reference number normal), and statistically different from reference and control (α = 0.10), it fails under the single-hit rule.
Percent difference over reference sediment
MCM-G31Sample
% Mortality (Mean ± SD)
Sample
1.0
22.4
-4.39
---
Failure under the one-hit nondispersive rule?
(Greater than 0.30)
Individual AFDW growth rate (mg/day)
Percent of negative control
Percent of reference MCM-G31 value
One-Hit Interpretative Criteria
10-day Eohaustorius
Number normal larvae
(mean ± SD)
Note: If the mean individual growth rate of a test sediment is <80% of the mean negative control growth rate, and <70% (dispersive) or <50% (nondispersive) of the mean reference sediment growth rate, and statistically different (a = 0.05) from the reference sediment and control sediment, it fails under the single-hit rule.
Percent difference over negative
control
20-day Neanthes
Sample
Percent difference from the reference (proportion)
---
48-hour Mytilus
Failure under the one-hit dispersive rule?
(Greater than 0.15)
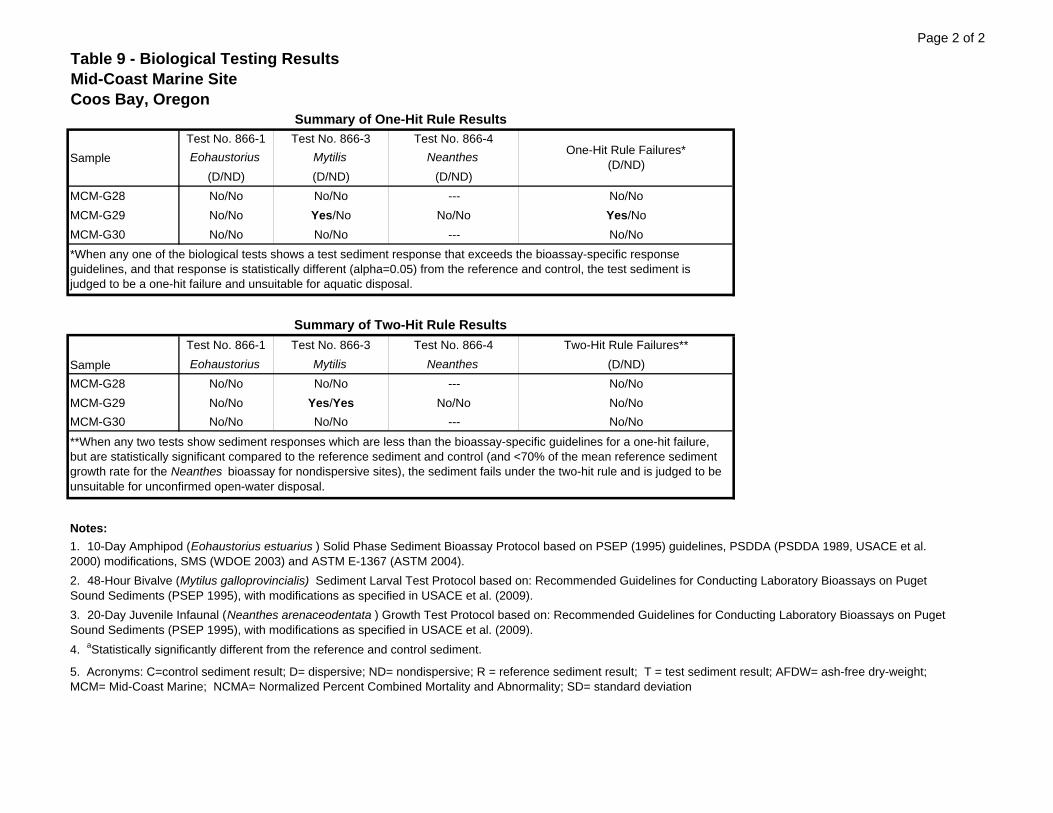
Page 2 of 2
Table 9 - Biological Testing ResultsMid-Coast Marine SiteCoos Bay, Oregon
Test No. 866-1 Test No. 866-3 Test No. 866-4
Eohaustorius Mytilis Neanthes
(D/ND) (D/ND) (D/ND)
MCM-G28 No/No No/No --- No/No
MCM-G29 No/No Yes/No No/No Yes/No
MCM-G30 No/No No/No --- No/No
Test No. 866-1 Test No. 866-3 Test No. 866-4 Two-Hit Rule Failures**
Eohaustorius Mytilis Neanthes (D/ND)
MCM-G28 No/No No/No --- No/No
MCM-G29 No/No Yes/Yes No/No No/No
MCM-G30 No/No No/No --- No/No
Notes:
1. 10-Day Amphipod (Eohaustorius estuarius ) Solid Phase Sediment Bioassay Protocol based on PSEP (1995) guidelines, PSDDA (PSDDA 1989, USACE et al. 2000) modifications, SMS (WDOE 2003) and ASTM E-1367 (ASTM 2004).
2. 48-Hour Bivalve (Mytilus galloprovincialis) Sediment Larval Test Protocol based on: Recommended Guidelines for Conducting Laboratory Bioassays on Puget Sound Sediments (PSEP 1995), with modifications as specified in USACE et al. (2009).
3. 20-Day Juvenile Infaunal (Neanthes arenaceodentata ) Growth Test Protocol based on: Recommended Guidelines for Conducting Laboratory Bioassays on Puget Sound Sediments (PSEP 1995), with modifications as specified in USACE et al. (2009).
5. Acronyms: C=control sediment result; D= dispersive; ND= nondispersive; R = reference sediment result; T = test sediment result; AFDW= ash-free dry-weight; MCM= Mid-Coast Marine; NCMA= Normalized Percent Combined Mortality and Abnormality; SD= standard deviation
Summary of One-Hit Rule Results
Sample
*When any one of the biological tests shows a test sediment response that exceeds the bioassay-specific response guidelines, and that response is statistically different (alpha=0.05) from the reference and control, the test sediment is judged to be a one-hit failure and unsuitable for aquatic disposal.
**When any two tests show sediment responses which are less than the bioassay-specific guidelines for a one-hit failure, but are statistically significant compared to the reference sediment and control (and <70% of the mean reference sediment growth rate for the Neanthes bioassay for nondispersive sites), the sediment fails under the two-hit rule and is judged to be unsuitable for unconfirmed open-water disposal.
4. aStatistically significantly different from the reference and control sediment.
Sample
Summary of Two-Hit Rule Results
One-Hit Rule Failures*(D/ND)
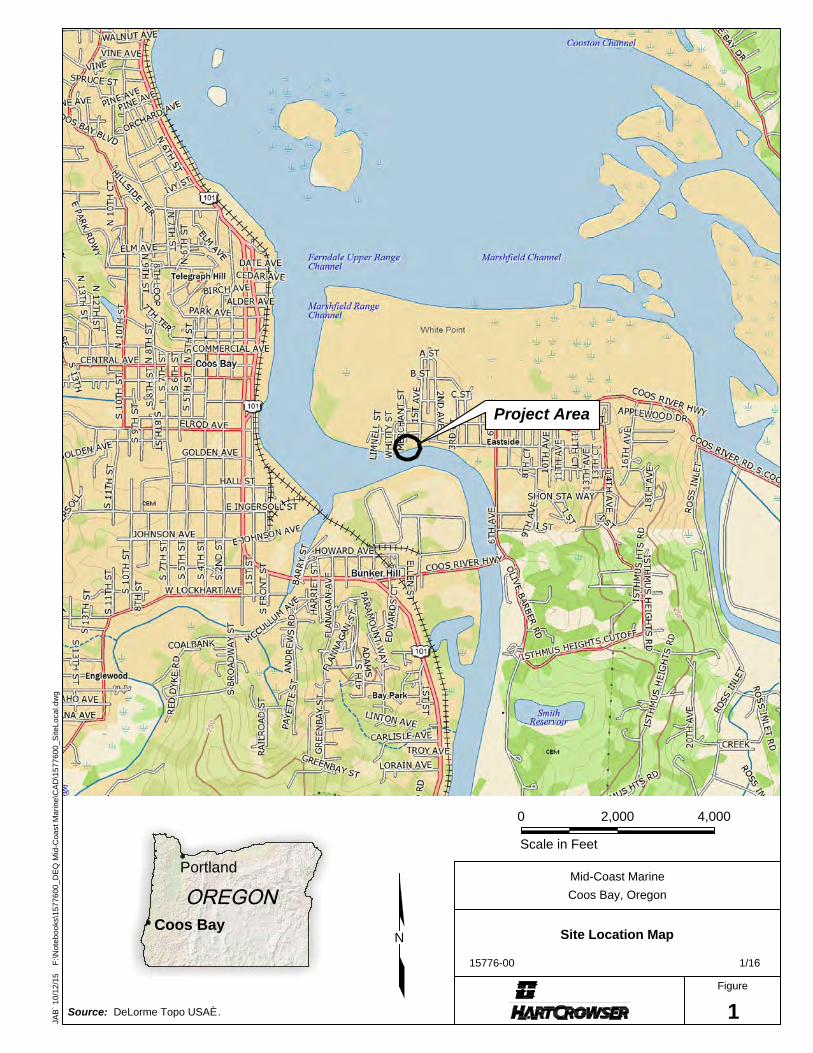
Source: DeLorme Topo USAÈ.
N
Figure
Scale in Feet
0 2,000 4,000
F:\N
otebooks\1577600_D
EQ
M
id-C
oast M
arine\C
AD
\1577600_S
iteLocal.dw
g
15776-00 1/16
Coos Bay, Oregon
Mid-Coast Marine
1
Site Location Map
10/12/15
JA
B`
Project Area
Portland
Coos Bay
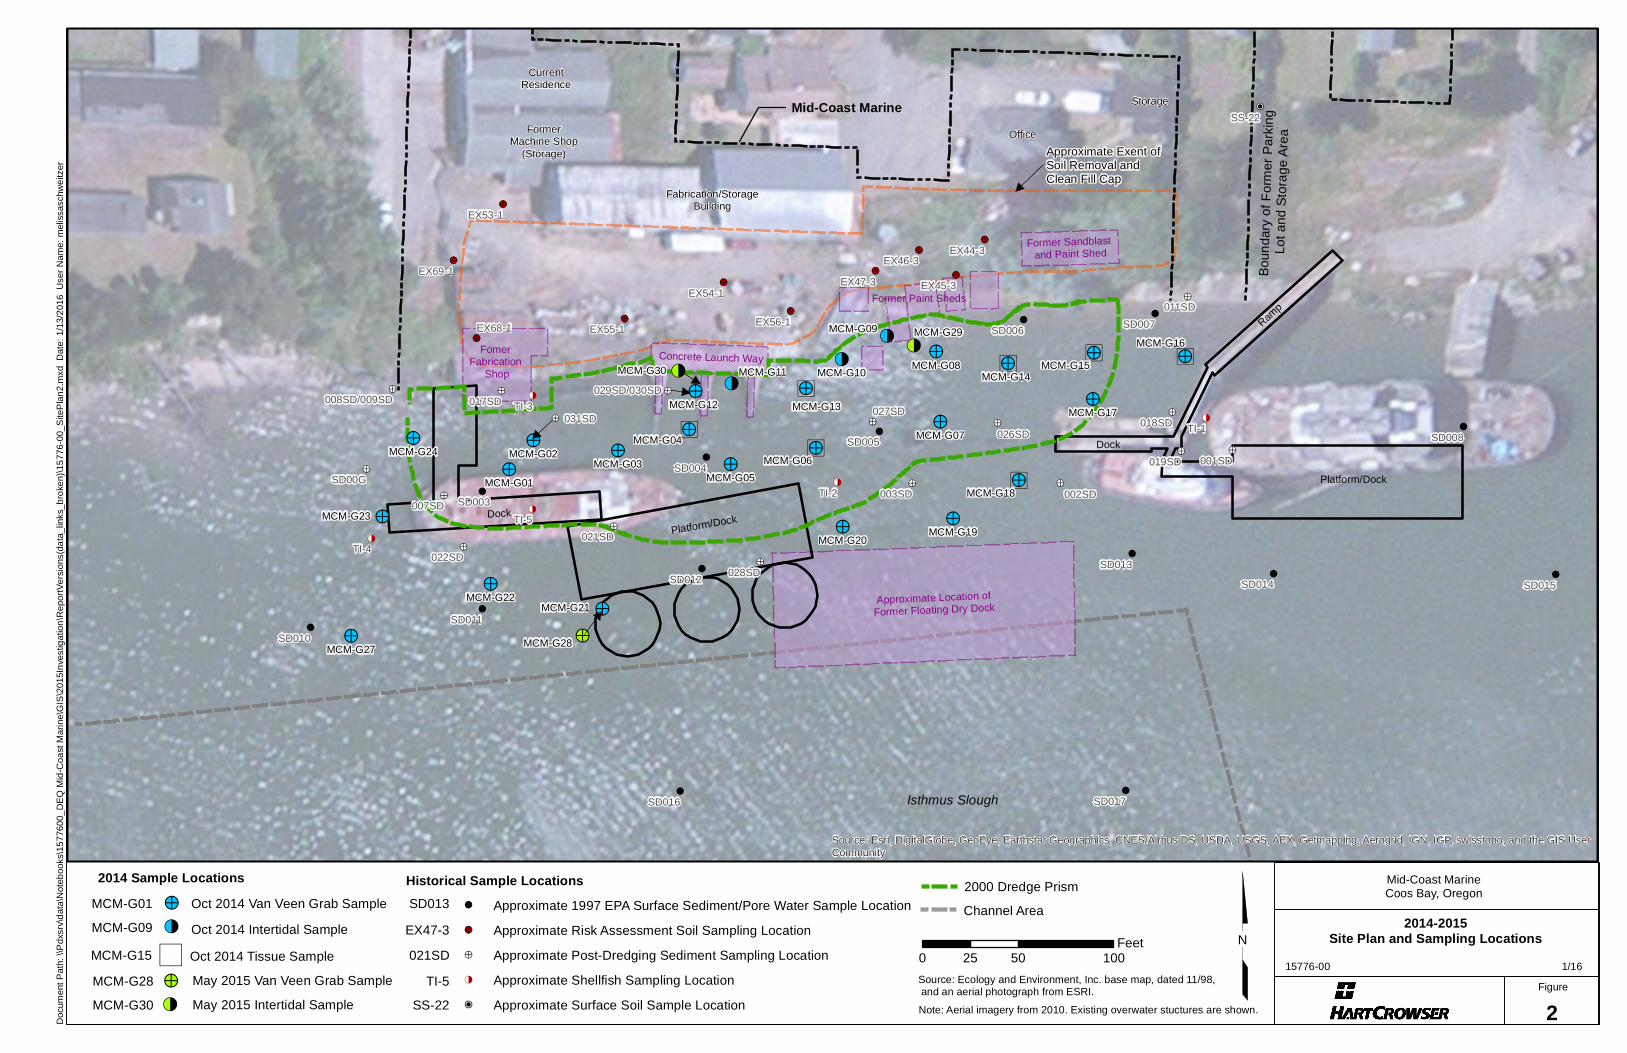
N2014-2015
Site Plan and Sampling Locations
Figure
2Doc
umen
t Pat
h: \\
Pdx
srv\
dat
a\N
oteb
ooks
\15
7760
0_D
EQ
Mid
-Coa
st M
arin
e\G
IS\2
015I
nve
stig
atio
n\R
epor
tVer
sion
s(da
ta_l
inks
_bro
ken)
\15
776-
00_S
iteP
lan
2.m
xd D
ate:
1/1
3/2
016
Use
r N
ame:
mel
issa
schw
eitz
er
!>
!>!>
!>
!>!>
!>
!>!<
!<
!<!> !>
!>!> !>
!>
!>
!>!>
!>
!>
!>
!>
!>
)))
)
))
)
Approximate Location of
Former Floating Dry Dock
Platform/DockDock
Fomer Fabrication
Shop
Concrete Launch Way
Former Paint Sheds
Former Sandblast and Paint Shed
Ramp
Dock
Platform/Dock
!<
!<
!>
MCM-G30
MCM-G29
MCM-G28
SD015
SD008
SD006SD007
SD014
SD013
SD017SD016
SD005
SD004
SD012
SD011
SD010
SD003
001SD
017SD
SD00G
022SD
TI-1
TI-2
TI-4
TI-5
TI-3
011SD
018SD
019SD
002SD003SD
021SD
007SD
008SD/009SD
026SD
027SD
029SD/030SD
031SD
028SD
EX45-3EX69-1
EX68-1
EX53-1
EX55-1
EX54-1
EX56-1
EX47-3
EX46-3EX44-3
SS-22
Approximate Exent ofSoil Removal and Clean Fill Cap
!
!
!!
!
!
!!
!
!
!
!
!
!
!>
!>
!>
!>
!<
!<
!<
!<
!<
!>
!>
!>
!>!>
!>
!>
!>
!>!>
!>
!>
!>
!>
!>
!>
!>
!>
!>
!>
!>
!>!>
!P
MCM-G01
MCM-G02MCM-G03
MCM-G04
MCM-G05
MCM-G06
MCM-G07
MCM-G08
MCM-G09
MCM-G10MCM-G11
MCM-G12 MCM-G13
MCM-G14MCM-G15
MCM-G16
MCM-G17
MCM-G18
MCM-G19MCM-G20
MCM-G21MCM-G22
MCM-G24
MCM-G27
MCM-G23
Storage
Office
Fabrication/StorageBuilding
FormerMachine Shop
(Storage)
CurrentResidence
Source: Esri, DigitalGlobe, GeoEye, Earthstar Geographics, CNES/Airbus DS, USDA, USGS, AEX, Getmapping, Aerogrid, IGN, IGP, swisstopo, and the GIS UserCommunity
Mid-Coast MarineCoos Bay, Oregon
15776-00 1/160 50 10025
Feet!> Approximate Risk Assessment Soil Sampling Location
Oct 2014 Van Veen Grab Sample
Oct 2014 Intertidal Sample
MCM-G01
MCM-G09
SD013
EX47-3
021SD
TI-5
Approximate Post-Dredging Sediment Sampling Location
SS-22
2014 Sample Locations Historical Sample Locations
!<
!P Approximate Surface Soil Sample Location
!< Approximate Shellfish Sampling Location
Channel Area
Mid-Coast Marine
Bo
un
da
ry o
f F
orm
er
Pa
rkin
g
Lo
t a
nd
Sto
rag
e A
rea
Source: Ecology and Environment, Inc. base map, dated 11/98, and an aerial photograph from ESRI.
! Approximate 1997 EPA Surface Sediment/Pore Water Sample Location
Isthmus Slough
2000 Dredge Prism
Note: Aerial imagery from 2010. Existing overwater stuctures are shown.
) Oct 2014 Tissue Sample !>
!> May 2015 Van Veen Grab Sample
!< May 2015 Intertidal Sample
!>
MCM-G28
MCM-G30
MCM-G15
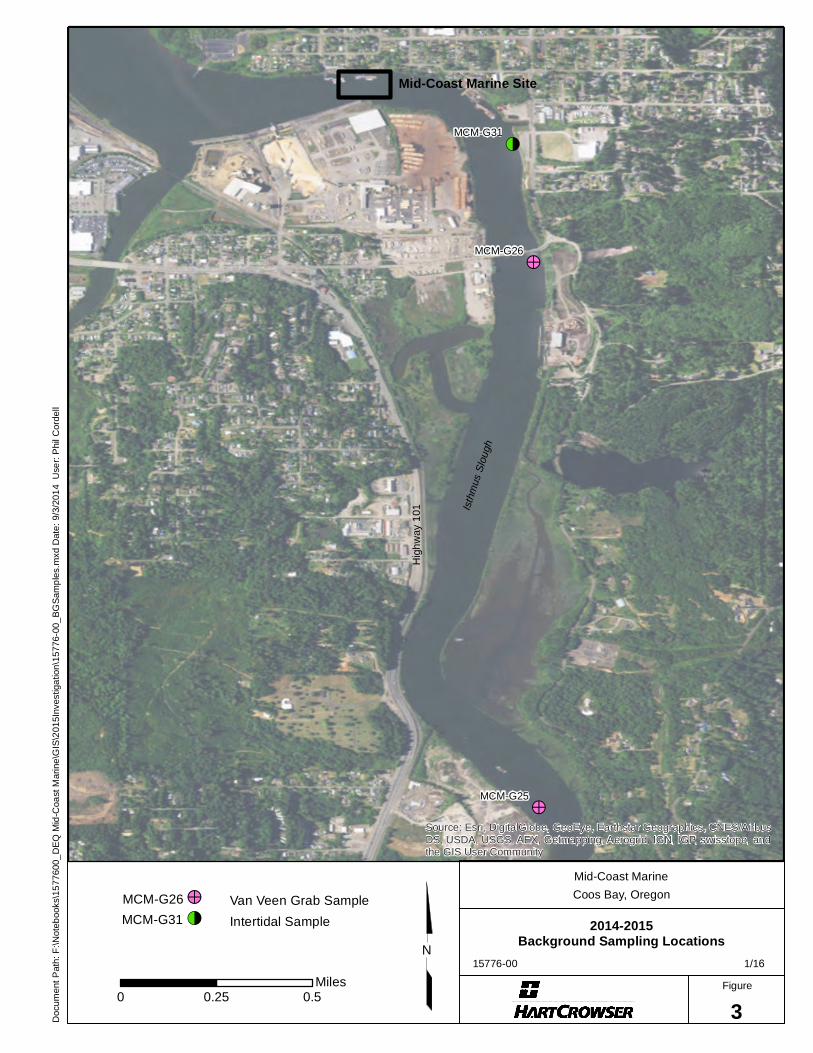
!>
!>
!<MCM-G31
MCM-G25
MCM-G26
Source: Esri, DigitalGlobe, GeoEye, Earthstar Geographics, CNES/AirbusDS, USDA, USGS, AEX, Getmapping, Aerogrid, IGN, IGP, swisstopo, andthe GIS User Community
N
Mid-Coast Marine
Coos Bay, Oregon
2014-2015Background Sampling Locations
15776-00 1/16
Figure
3
!> Van Veen Grab Sample
!< Intertidal Sample
Mid-Coast Marine Site
Hig
hw
ay 1
01 Isthm
us Sl
ough
MCM-G26
0 0.50.25Miles
Doc
umen
t Pat
h: F
:\Not
eboo
ks\1
577
600_
DE
Q M
id-C
oast
Mar
ine\
GIS
\201
5Inv
estig
atio
n\15
776-
00_
BG
Sam
ple
s.m
xd D
ate:
9/3
/201
4 U
ser:
Phi
l Cor
dell
MCM-G31
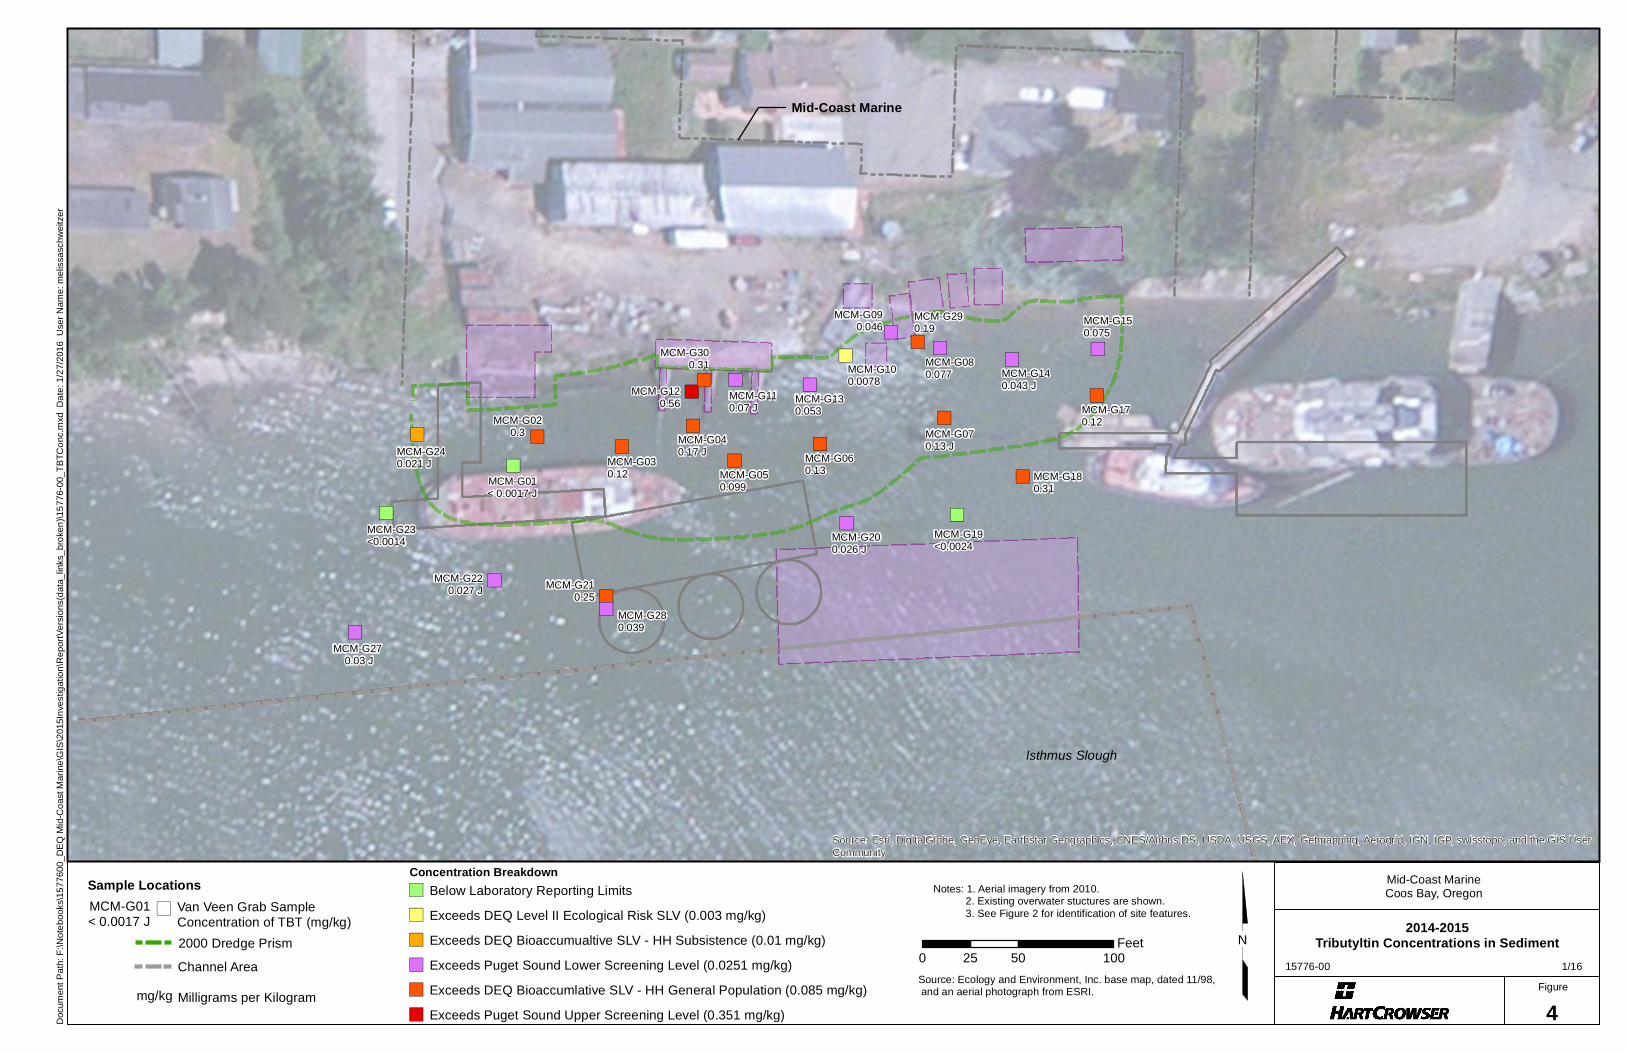
N2014-2015
Tributyltin Concentrations in Sediment
Figure
4Doc
umen
t Pat
h: F
:\Not
ebo
oks\
1577
600
_DE
Q M
id-C
oas
t Mar
ine\
GIS
\201
5In
vest
igat
ion\
Rep
ortV
ersi
ons(
dat
a_lin
ks_
bro
ken
)\15
776-
00_T
BT
Co
nc.m
xd D
ate
: 1/2
7/20
16 U
ser
Nam
e: m
elis
sasc
hwei
tzer
")
")")
")
")")
")
")")
")
")") ")
")")
")
")
")")
")")
")
")
")
")
")
")
MCM-G01< 0.0017 J
MCM-G020.3
MCM-G030.12
MCM-G040.17 J
MCM-G050.099
MCM-G060.13
MCM-G070.13 J
MCM-G080.077
MCM-G090.046
MCM-G100.0078
MCM-G110.07 J
MCM-G120.56 MCM-G13
0.053
MCM-G140.043 J
MCM-G150.075
MCM-G170.12
MCM-G180.31
MCM-G19<0.0024
MCM-G200.026 J
MCM-G210.25
MCM-G220.027 J
MCM-G240.021 J
MCM-G27 0.03 J
MCM-G23<0.0014
MCM-G300.31
MCM-G28 0.039
MCM-G290.19
Source: Esri, DigitalGlobe, GeoEye, Earthstar Geographics, CNES/Airbus DS, USDA, USGS, AEX, Getmapping, Aerogrid, IGN, IGP, swisstopo, and the GIS UserCommunity
Mid-Coast MarineCoos Bay, Oregon
15776-00 1/160 50 10025
Feet
Source: Ecology and Environment, Inc. base map, dated 11/98, and an aerial photograph from ESRI.
Isthmus Slough
Notes: 1. Aerial imagery from 2010. 2. Existing overwater stuctures are shown. 3. See Figure 2 for identification of site features.Van Veen Grab Sample
Concentration of TBT (mg/kg)MCM-G01< 0.0017 J
Sample Locations)
") Below Laboratory Reporting Limits
") Exceeds DEQ Level II Ecological Risk SLV (0.003 mg/kg)
") Exceeds DEQ Bioaccumualtive SLV - HH Subsistence (0.01 mg/kg)
") Exceeds Puget Sound Lower Screening Level (0.0251 mg/kg)
") Exceeds DEQ Bioaccumlative SLV - HH General Population (0.085 mg/kg)
") Exceeds Puget Sound Upper Screening Level (0.351 mg/kg)
Concentration Breakdown
Mid-Coast Marine
Channel Area
Milligrams per Kilogram
2000 Dredge Prism
mg/kg
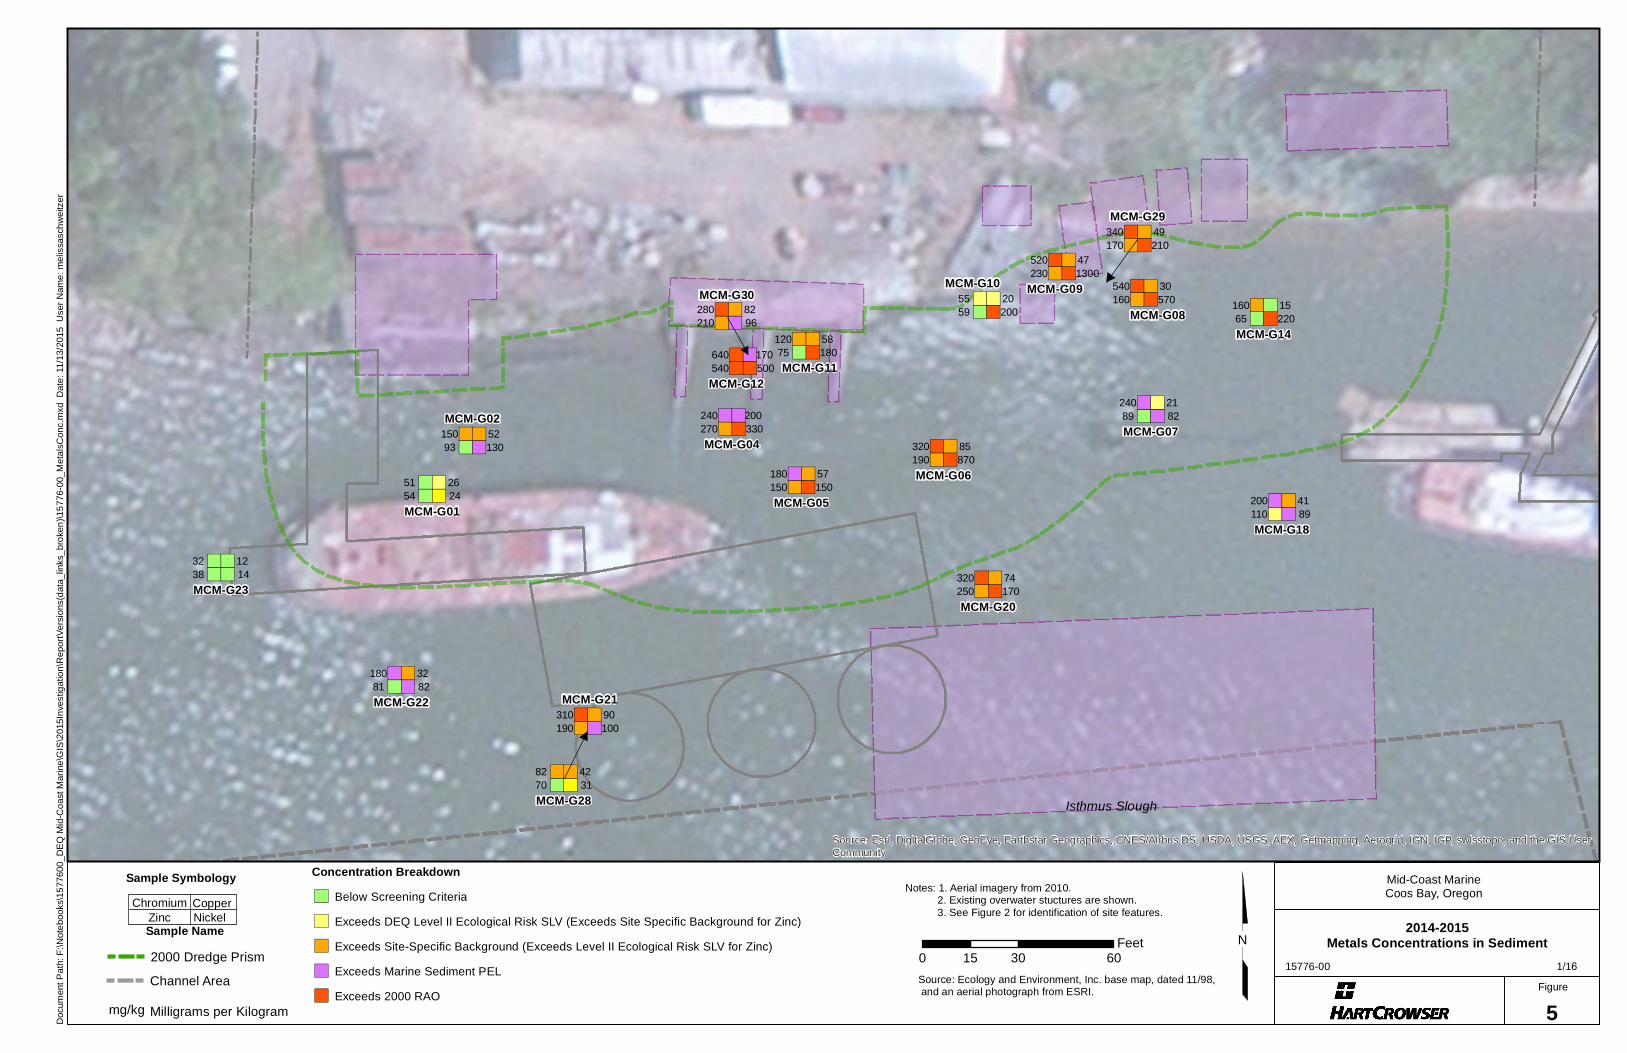
N2014-2015
Metals Concentrations in Sediment
Figure
5Doc
umen
t Pat
h: F
:\Not
ebo
oks\
1577
600
_DE
Q M
id-C
oas
t Mar
ine\
GIS
\201
5In
vest
igat
ion\
Rep
ortV
ersi
ons(
dat
a_lin
ks_
bro
ken
)\15
776-
00_M
etal
sCon
c.m
xd D
ate
: 11/
13/2
015
Use
r N
ame
: mel
issa
sch
wei
tzer
8296")")
")")280210
MCM-G30
MCM-G21
190") 100")310") 90")
")640540")")500
")170
MCM-G12
49210")
")")")170
MCM-G29340
MCM-G2831")")70
82 42")")
MCM-G01
MCM-G02MCM-G04
MCM-G05MCM-G06
MCM-G07
MCM-G08MCM-G09MCM-G10
MCM-G11
MCM-G14
MCM-G18
MCM-G20
MCM-G22
MCM-G23
54
93
270
150
190
89
160
230
59
75
65
110
250
81
38
")
")")
")
")
")
")
")
")
")
")
")
")
")
")
24
130
330
150
870
82
570
1300
200
180
220
89
170
82
14
")
")")
")
")
")
")
")
")
")
")
")
")
")
")
51
150
240
180
320
240
540
520
55
120
160
200
320
180
32
")
")")
")
")
")
")
")
")
")
")
")
")
")
")
26
52
200
57
85
21
30
47
20
58
15
41
74
32
12
")
")")
")
")
")
")
")
")
")
")
")
")
")
")
Source: Esri, DigitalGlobe, GeoEye, Earthstar Geographics, CNES/Airbus DS, USDA, USGS, AEX, Getmapping, Aerogrid, IGN, IGP, swisstopo, and the GIS UserCommunity
Mid-Coast MarineCoos Bay, Oregon
15776-00 1/160 30 6015
Feet
Source: Ecology and Environment, Inc. base map, dated 11/98, and an aerial photograph from ESRI.
Isthmus Slough
Notes: 1. Aerial imagery from 2010. 2. Existing overwater stuctures are shown.3. See Figure 2 for identification of site features.
Concentration Breakdown
Channel Area
Milligrams per Kilogram
2000 Dredge Prism
mg/kg
Zinc NickelChromium Copper
Sample Name
Sample Symbology") Below Screening Criteria
") Exceeds DEQ Level II Ecological Risk SLV (Exceeds Site Specific Background for Zinc)
") Exceeds Site-Specific Background (Exceeds Level II Ecological Risk SLV for Zinc)
") Exceeds Marine Sediment PEL
") Exceeds 2000 RAO
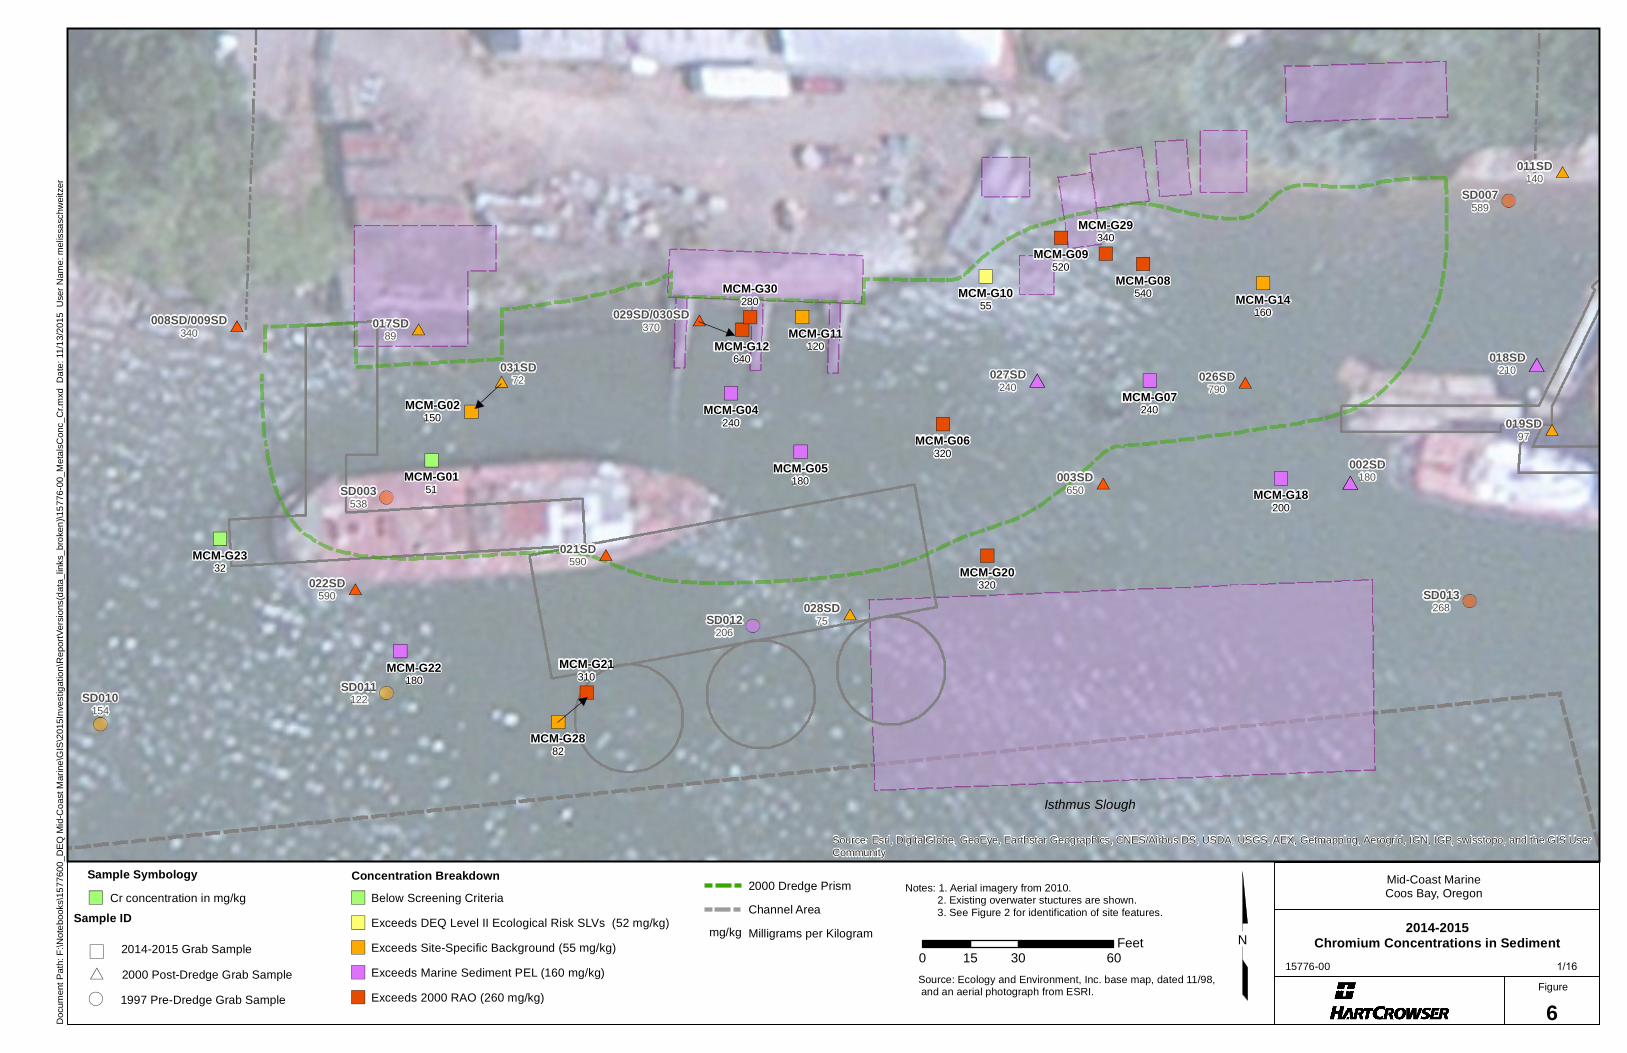
N2014-2015
Chromium Concentrations in Sediment
Figure
6Doc
umen
t Pat
h: F
:\Not
ebo
oks\
1577
600
_DE
Q M
id-C
oas
t Mar
ine\
GIS
\201
5In
vest
igat
ion\
Rep
ortV
ersi
ons(
dat
a_lin
ks_
bro
ken
)\15
776-
00_M
etal
sCon
c_C
r.mxd
Da
te: 1
1/1
3/20
15 U
ser
Nam
e: m
elis
sasc
hwei
tzer
031SD72#*
MCM-G02150 ")
029SD/030SD370 #*
")MCM-G28
82
")
MCM-G21310
017SD89
022SD590
011SD140
018SD210
019SD97
002SD180003SD
650
021SD590
008SD/009SD340
026SD790
027SD240
028SD75
#*
#*
#*
#*
#*
#*#*
#*
#*
#*#*
#*
MCM-G0151
MCM-G04240
MCM-G05180
MCM-G06320
MCM-G07240
MCM-G08540
MCM-G09520
MCM-G1055
MCM-G11120MCM-G12
640
MCM-G14160
MCM-G18200
MCM-G20320
MCM-G22180
MCM-G2332
MCM-G30280
MCM-G29340
")
")
")
")
")
")
")
")
")")
")
")
")
")
")
")
")
SD007589
SD013268
SD012206
SD011122SD010
154
SD003538
Source: Esri, DigitalGlobe, GeoEye, Earthstar Geographics, CNES/Airbus DS, USDA, USGS, AEX, Getmapping, Aerogrid, IGN, IGP, swisstopo, and the GIS UserCommunity
Mid-Coast MarineCoos Bay, Oregon
15776-00 1/160 30 6015
Feet
Source: Ecology and Environment, Inc. base map, dated 11/98, and an aerial photograph from ESRI.
Isthmus Slough
Notes: 1. Aerial imagery from 2010. 2. Existing overwater stuctures are shown.3. See Figure 2 for identification of site features.
Concentration BreakdownSample Symbology
)
(
*
2014-2015 Grab Sample
1997 Pre-Dredge Grab Sample
2000 Post-Dredge Grab Sample
") Cr concentration in mg/kg
Sample ID
2000 Dredge Prism
Channel Area
Milligrams per Kilogrammg/kg
") Below Screening Criteria
") Exceeds DEQ Level II Ecological Risk SLVs (52 mg/kg)
") Exceeds Site-Specific Background (55 mg/kg)
") Exceeds Marine Sediment PEL (160 mg/kg)
") Exceeds 2000 RAO (260 mg/kg)

N2014-2015
Copper Concentrations in Sediment
Figure
7Doc
umen
t Pat
h: F
:\Not
ebo
oks\
1577
600
_DE
Q M
id-C
oas
t Mar
ine\
GIS
\201
5In
vest
igat
ion\
Rep
ortV
ersi
ons(
dat
a_lin
ks_
bro
ken
)\15
776-
00_M
etal
sCon
c_C
u.m
xd
Dat
e: 1
1/1
3/20
15 U
ser
Nam
e: m
elis
sasc
hwei
tzer
MCM-G2190
")
MCM-G2842
")
031SD38
#*MCM-G02
52 ")
029SD/030SD300
#*017SD22
022SD26
011SD32
018SD83
019SD23
002SD120
003SD110
021SD220
008SD/009SD25
026SD64
027SD82
028SD25
#*
#*
#*
#*
#*
#*#*
#*
#*
#*#*
#*
MCM-G0126
MCM-G04200
MCM-G0557
MCM-G0685
MCM-G0721
MCM-G0830
MCM-G0947
MCM-G1020
MCM-G1158MCM-G12
170
MCM-G1415
MCM-G1841
MCM-G2074
MCM-G2232
MCM-G2312
MCM-G3082
MCM-G2949
")
")
")
")
")
")
")
")
")")
")
")
")
")
")
")
")
SD007311
SD013119
SD012159
SD01185SD010
63
SD003318
Source: Esri, DigitalGlobe, GeoEye, Earthstar Geographics, CNES/Airbus DS, USDA, USGS, AEX, Getmapping, Aerogrid, IGN, IGP, swisstopo, and the GIS UserCommunity
Mid-Coast MarineCoos Bay, Oregon
15776-00 1/160 30 6015
Feet
Source: Ecology and Environment, Inc. base map, dated 11/98, and an aerial photograph from ESRI.
Isthmus Slough
Notes: 1. Aerial imagery from 2010. 2. Existing overwater stuctures are shown.3. See Figure 2 for identification of site features.
Concentration BreakdownSample Symbology
)
(
*
2014-2015 Grab Sample
1997 Pre-Dredge Grab Sample
2000 Post-Dredge Grab Sample
") Cu concentration in mg/kg
Sample ID
2000 Dredge Prism
Channel Area
Milligrams per Kilogrammg/kg
") Below Screening Criteria
") Exceeds DEQ Level II Ecological Risk SLVs (19 mg/kg)
") Exceeds Site-Specific Background (26 mg/kg)
") Exceeds Marine Sediment PEL (108 mg/kg)
") Exceeds 2000 RAO (390 mg/kg)

N2014-2015
Nickel Concentrations in Sediment
Figure
8Doc
umen
t Pat
h: F
:\Not
ebo
oks\
1577
600
_DE
Q M
id-C
oas
t Mar
ine\
GIS
\201
5In
vest
igat
ion\
Rep
ortV
ersi
ons(
dat
a_lin
ks_
bro
ken
)\15
776-
00_M
etal
sCon
c_N
i.mxd
Dat
e: 1
1/1
3/20
15 U
ser
Nam
e: m
elis
sasc
hwei
tze
r
029SD/030SD150#*
MCM-G2831
")
031SD 36#*
")MCM-G02
130
017SD 46
022SD 250
011SD50
018SD72
019SD22
002SD260
021SD 180
008SD/009SD200
026SD400
027SD180
028SD35
#*
#*
#*
#*
#*
#*
#*
#*
#*#*
#*
MCM-G12500
MCM-G3096
MCM-G0124
MCM-G04 330
MCM-G05150
MCM-G06870
MCM-G0782
MCM-G08570
MCM-G091300
MCM-G10200
MCM-G11180
MCM-G14220
MCM-G1889
MCM-G20170
MCM-G21100
MCM-G2282
MCM-G2314
MCM-G29210
")
")
")
")
")
")
")
")
")")
")
")
")
")
")
")
")
")
SD007180
SD01394SD012
97
SD01160SD010
114
SD003339
Source: Esri, DigitalGlobe, GeoEye, Earthstar Geographics, CNES/Airbus DS, USDA, USGS, AEX, Getmapping, Aerogrid, IGN, IGP, swisstopo, and the GIS UserCommunity
Mid-Coast MarineCoos Bay, Oregon
15776-00 1/160 30 6015
Feet
Source: Ecology and Environment, Inc. base map, dated 11/98, and an aerial photograph from ESRI.
Isthmus Slough
Notes: 1. Aerial imagery from 2010. 2. Existing overwater stuctures are shown.3. See Figure 2 for identification of site features.
Concentration BreakdownSample Symbology
)
(
*
2014-2015 Grab Sample
1997 Pre-Dredge Grab Sample
2000 Post-Dredge Grab Sample
") Ni concentration in mg/kg
Sample ID
2000 Dredge Prism
Channel Area
Milligrams per Kilogrammg/kg
") Below Screening Criteria
") Exceeds DEQ Level II Ecological Risk SLVs (16 mg/kg)
") Exceeds Site-Specific Background (40 mg/kg)
") Exceeds Marine Sediment PEL (42.8 mg/kg)
") Exceeds 2000 RAO (140 mg/kg)
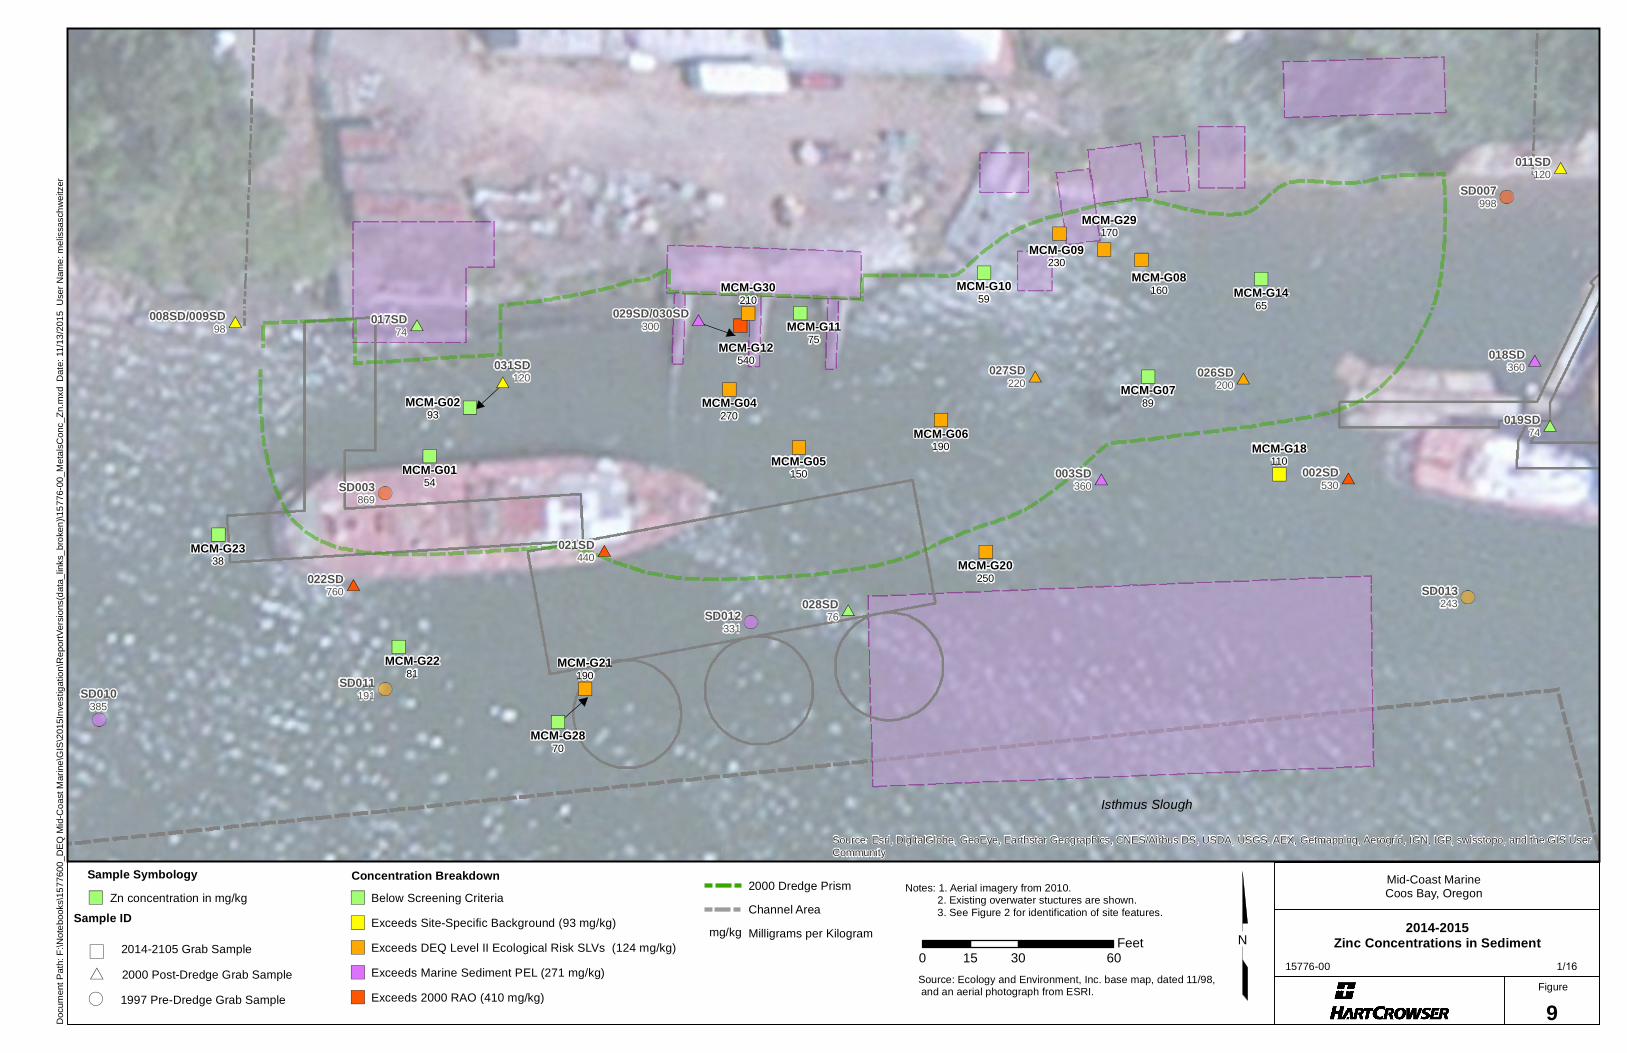
N2014-2015
Zinc Concentrations in Sediment
Figure
9Doc
umen
t Pat
h: F
:\Not
ebo
oks\
1577
600
_DE
Q M
id-C
oas
t Mar
ine\
GIS
\201
5In
vest
igat
ion\
Rep
ortV
ersi
ons(
dat
a_lin
ks_
bro
ken
)\15
776-
00_M
etal
sCon
c_Z
n.m
xd D
ate:
11/
13/2
015
Use
r N
ame
: mel
issa
sch
wei
tzer
017SD74
022SD760
011SD120
018SD360
019SD74
002SD530
003SD360
021SD440
008SD/009SD98
026SD200
027SD220
029SD/030SD300
031SD120
028SD76
#*
#*
#*
#*
#*
#*#*
#*
#*
#*#*
#*
#*
#*
MCM-G0154
MCM-G0293
MCM-G04270
MCM-G05150
MCM-G06190
MCM-G0789
MCM-G08160
MCM-G09230
MCM-G1059
MCM-G1175MCM-G12
540
MCM-G1465
MCM-G18110
MCM-G20250
MCM-G21190
MCM-G2281
MCM-G2338
MCM-G30210
MCM-G29170
MCM-G2870
")
")")
")
")
")
")
")
")
")")
")
")
")
")
")
")
")
")
")
SD007998
SD013243
SD012331
SD011191SD010
385
SD003869
Source: Esri, DigitalGlobe, GeoEye, Earthstar Geographics, CNES/Airbus DS, USDA, USGS, AEX, Getmapping, Aerogrid, IGN, IGP, swisstopo, and the GIS UserCommunity
Mid-Coast MarineCoos Bay, Oregon
15776-00 1/160 30 6015
Feet
Source: Ecology and Environment, Inc. base map, dated 11/98, and an aerial photograph from ESRI.
Isthmus Slough
Notes: 1. Aerial imagery from 2010. 2. Existing overwater stuctures are shown.3. See Figure 2 for identification of site features.
Concentration BreakdownSample Symbology
)
(
*
2014-2105 Grab Sample
1997 Pre-Dredge Grab Sample
2000 Post-Dredge Grab Sample
") Zn concentration in mg/kg
Sample ID
2000 Dredge Prism
Channel Area
Milligrams per Kilogrammg/kg
") Below Screening Criteria
") Exceeds Site-Specific Background (93 mg/kg)
") Exceeds DEQ Level II Ecological Risk SLVs (124 mg/kg)
") Exceeds Marine Sediment PEL (271 mg/kg)
") Exceeds 2000 RAO (410 mg/kg)
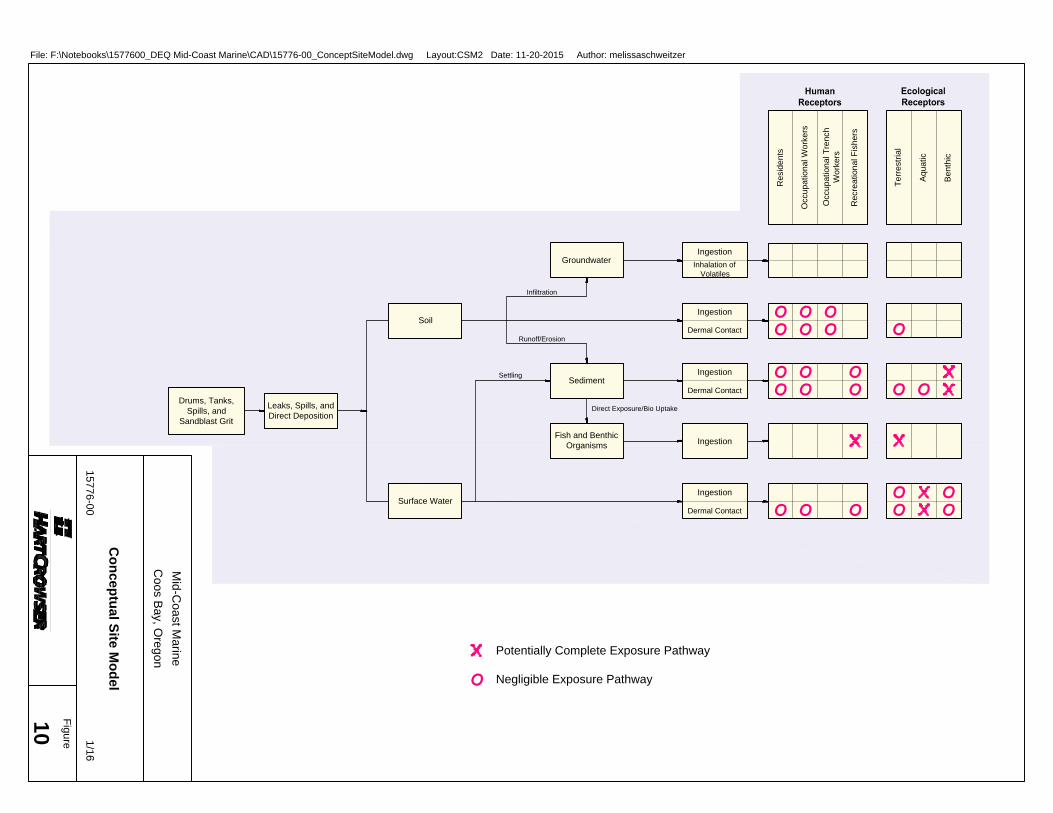
Figure
15776-00
1/16
Coos B
ay, O
regon
Mid-C
oast M
arine
10
Co
nce
ptu
al S
ite
M
od
el
File: F:\Notebooks\1577600_DEQ Mid-Coast Marine\CAD\15776-00_ConceptSiteModel.dwg Layout:CSM2 Date: 11-20-2015 Author: melissaschweitzer
Drums, Tanks,
Spills, and
Sandblast Grit
Leaks, Spills, and
Direct Deposition
Surface Water
Runoff/Erosion
Settling
Re
sid
en
ts
Occu
pa
tio
na
l W
orke
rs
Occu
pa
tio
na
l T
re
nch
Wo
rke
rs
Te
rre
stria
l
Aq
ua
tic
Soil
Sediment
Fish and Benthic
Organisms
Direct Exposure/Bio Uptake
Ingestion
Dermal Contact
Ingestion
Dermal Contact
Ingestion
Potentially Complete Exposure Pathway
Negligible Exposure PathwayO
Groundwater
Inhalation of
Volatiles
Ingestion
Infiltration
Dermal Contact
Ingestion
Re
cre
atio
na
l F
ish
ers
Be
nth
ic
O
O O
OO O
O O OO
O OO O O O
O O OO O O
15776‐00/Task 9 January 28, 2016
APPENDICES
15776‐00/Task 9 January 28, 2016
APPENDIX A EPA and DEQ Deferral Agreement (December 2, 1998)
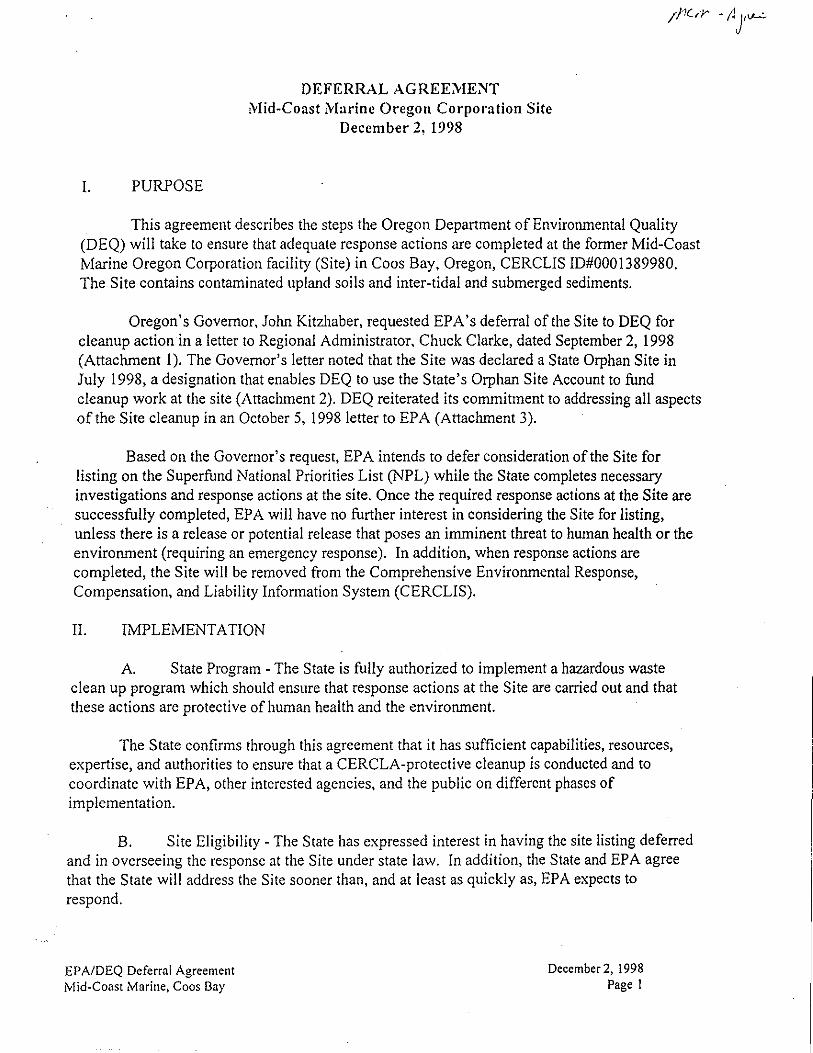
I. PURPOSE
DEFERRAL AGREEMENT Mid-Coast Marine Oregon Corporation Site
December 2, 1998
This agreement describes the steps the Oregon Department of Environmental Quality (DEQ) will take to ensure that adequate response actions are completed at the former Mid-Coast Marine Oregon Corporation facility (Site) in Coos Bay, Oregon, CERCLIS ID#0001389980. The Site contains contaminated upland soils and inter-tidal and submerged sediments.
Oregon's Governor, John Kitzhaber, requested EPA's deferral of the Site to DEQ for cleanup action in a letter to Regional Administrator, Chuck Clarke, dated September 2, 1998 (Attachment I). The Governor's letter noted that the Site was declared a State Orphan Site in July 1998, a designation that enables DEQ to use the State's Orphan Site Account to fund cleanup work at the site (Attachment 2). DEQ reiterated its commitment to addressing all aspects of the Site cleanup in an October 5, 1998 letter to EPA (Attachment 3).
Based on the Governor's request, EPA intends to defer consideration of the Site for listing on the Superfund National Priorities List (NPL) while the State completes necessary investigations and response actions at the site. Once the required response actions at the Site are successfully completed, EPA will have no further interest in considering the Site for listing, unless there is a release or potential release that poses an imminent threat to human health or the environment (requiring an emergency response). In addition, when response actions are completed, the Site will be removed from the Comprehensive Environmental Response, Compensation, and Liability Information System (CERCLIS).
II. IMPLEMENTATION
A. State Program - The State is fully authorized to implement a hazardous waste clean up program which should ensure that response actions at the Site are carried out and that these actions are protective of human health and the environment.
The State confirms through this agreement that it has sufficient capabilities, resources, expertise, and authorities to ensure that a CERCLA-protective cleanup is conducted and to coordinate with EPA, other interested agencies, and the public on different phases of implementation.
B. Site Eligibility - The State has expressed interest in having the site listing deferred and in overseeing the response at the Site under state law. In addition, the State and EPA agree that the State will address the Site sooner than, and at least as quickly as, EPA expects to respond.
EPA/DEQ Deferral Agreement Mid-Coast Marine, Coos Bay
December 2, 1998 Page 1
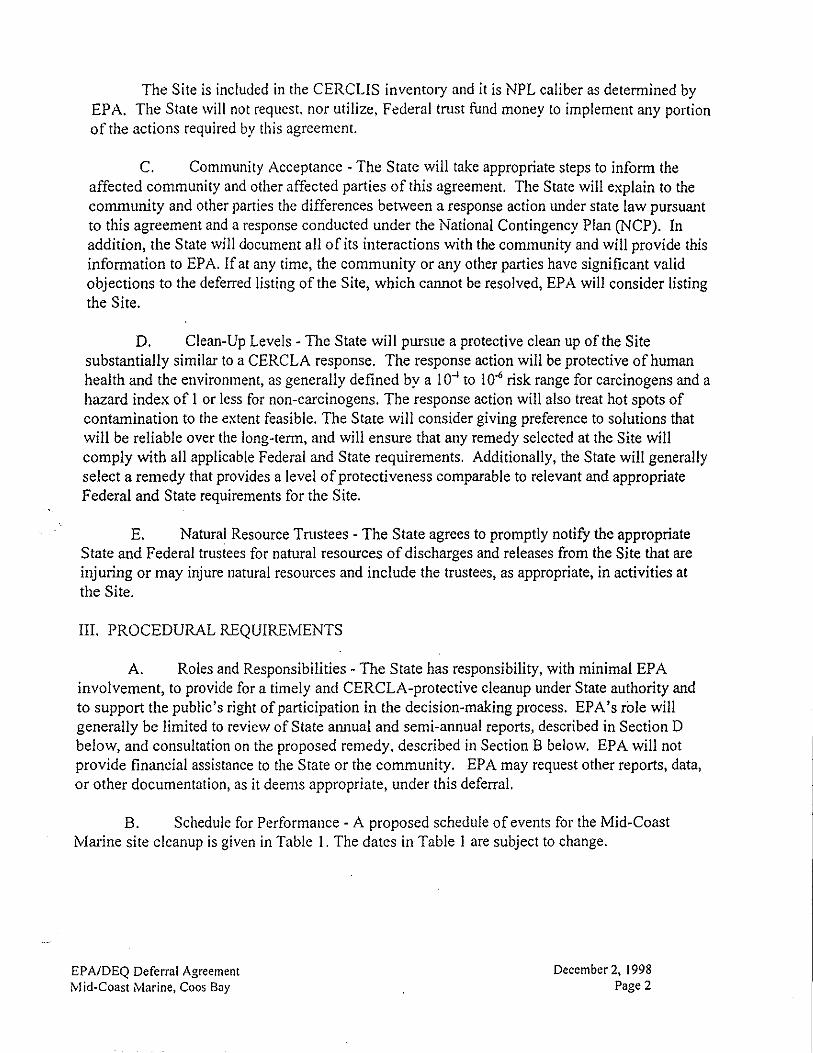
The Site is included in the CERCLIS inventory and it is NPL caliber as determined by EPA. The State will not request. nor utilize, Federal trust fund money to implement any portion of the actions required by this agreement.
C. Community Acceptance - The State will take appropriate steps to inform the affected community and other affected parties of this agreement. The State will explain to the community and other parties the differences between a response action under state law pursuant to this agreement and a response conducted under the National Contingency Plan (NCP). In addition, the State will document all of its interactions with the community and will provide this information to EPA. If at any time, the community or any other parties have significant valid objections to the deferred listing of the Site, which cannot be resolved, EPA will consider listing the Site.
D. Clean-Up Levels -The State will pursue a protective clean up of the Site substantially similar to a CERCLA response. The response action will be protective of human health and the environment, as generally defined by a IO"' to 1 O.,; risk range for carcinogens and a hazard index of I or less for non-carcinogens. The response action will also treat hot spots of contamination to the extent feasible. The State will consider giving preference to solutions that will be reliable over the long-term, and will ensure that any remedy selected at the Site will comply with all applicable Federal and State requirements. Additionally, the State will generally select a remedy that provides a level of protectiveness comparable to relevant and appropriate Federal and State requirements for the Site.
E. Natural Resource Trustees - The State agrees to promptly notify the appropriate State and Federal trustees for natural resources of discharges and releases from the Site that are injuring or may injure natural resources and include the trustees, as appropriate, in activities at the Site.
III. PROCEDURAL REQUIREMENTS
A. Roles and Responsibilities - The State has responsibility, with minimal EPA involvement, to provide for a timely and CERCLA-protective cleanup under State authority and to support the public's right of participation in the decision-making process. EPA's role will generally be limited to review of State annual and semi-annual reports, described in Section D below, and consultation on the proposed remedy, described in Section B below. EPA will not provide financial assistance to the State or the community. EPA may request other reports, data, or other documentation, as it deems appropriate, under this deferral.
B. Schedule for Performance - A proposed schedule of events for the Mid-Coast Marine site cleanup is given in Table I. The dates in Table I are subject to change.
EPA/DEQ Deferral Agreement Mid-Coast Marine, Coos Bay
December 2, 1998 Page2
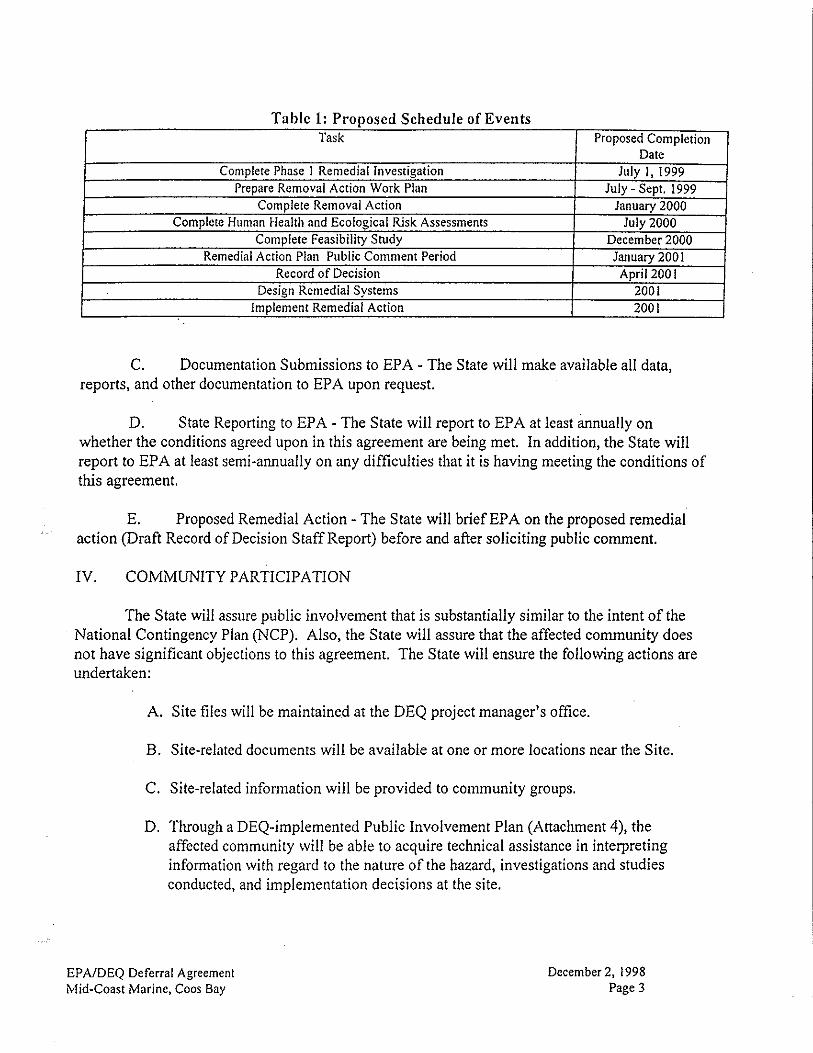
Table 1: Proposed Schedule of Events Task Proposed Completion
Date Complete Phase I Remedial Investigation July I, 1999
Prepare Removal Action Work Plan July - Sept. 1999 Complete Removal Action January 2000
Complete Human Health and Ecological Risk Assessments July 2000 Complete Feasibility Study December 2000
Remedial Action Plan Public Comment Period January 200 l Record of Decision April 200 l
Design Remedial Systems 2001 Implement Remedial Action 2001
C. Documentation Submissions to EPA - The State will make available all data, reports, and other documentation to EPA upon request.
D. State Reporting to EPA - The State will report to EPA at least annually on whether the conditions agreed upon in this agreement are being met. In addition, the State will report to EPA at least semi-annually on any difficulties that it is having meeting the conditions of this agreement.
E. Proposed Remedial Action - The State will brief EPA on the proposed remedial action (Draft Record of Decision Staff Report) before and after soliciting public comment.
IV. COMMUNITY PARTICIPATION
The State will assure public involvement that is substantially similar to the intent of the National Contingency Plan (NCP). Also, the State will assure that the affected community does not have significant objections to this agreement. The State will ensure the following actions are undertaken:
A. Site files will be maintained at the DEQ project manager's office.
B. Site-related documents will be available at one or more locations near the Site.
C. Site-related information will be provided to community groups.
D. Through a DEQ-implemented Public Involvement Plan (Attachment 4), the affected community will be able to acquire technical assistance in interpreting information with regard to the nature of the hazard, investigations and studies conducted, and implementation decisions at the site.
EPNDEQ Deferral Agreement Mid-Coast Marine, Coos Bay
December 2, 1998 Page 3
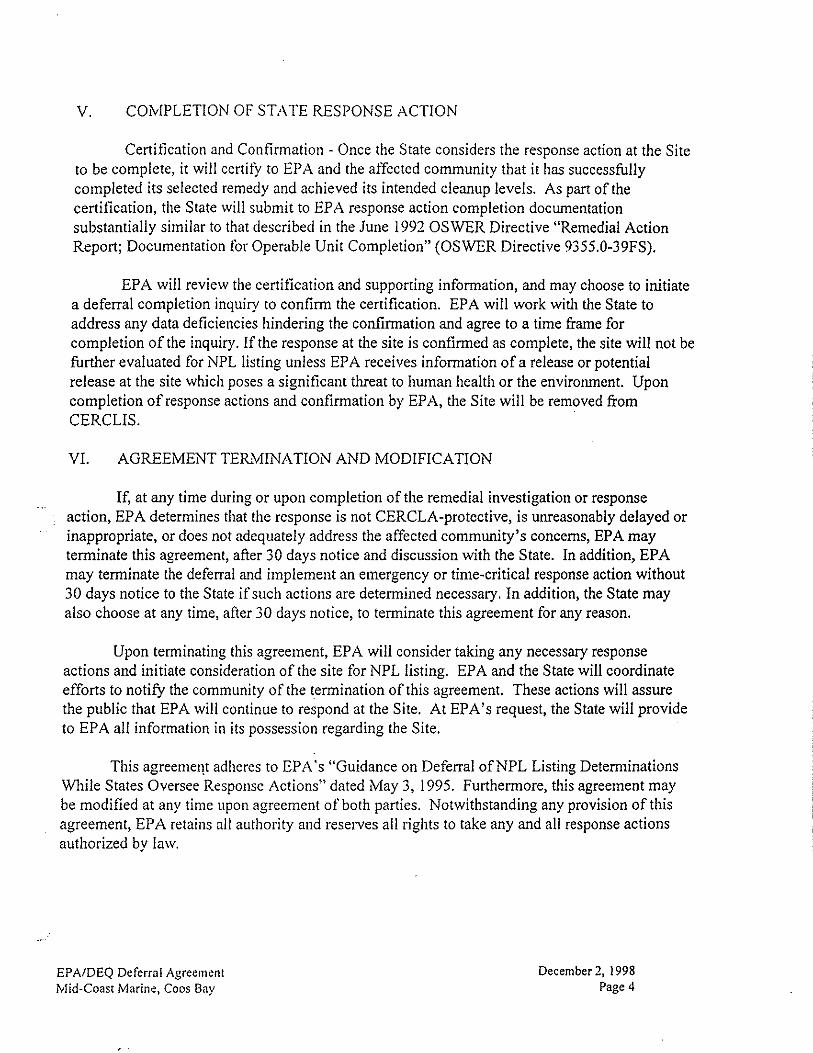
V. COMPLETION OF STA TE RESPONSE ACTION
Certification and Confirmation - Once the State considers the response action at the Site to be complete, it will certify to EPA and the affected community that it has successfully completed its selected remedy and achieved its intended cleanup levels. As part of the certification, the State will submit to EPA response action completion documentation substantially similar to that described in the June 1992 OSWER Directive "Remedial Action Report; Documentation for Operable Unit Completion" (OSWER Directive 9355.0-39FS).
EPA will review the certification and supporting information, and may choose to initiate a deferral completion inquiry to confirm the certification. EPA will work with the State to address any data deficiencies hindering the confirmation and agree to a time frame for completion of the inquiry. If the response at the site is confirmed as complete, the site will not be further evaluated for NPL listing unless EPA receives information of a release or potential release at the site which poses a significant threat to human health or the environment. Upon completion of response actions and confirmation by EPA, the Site will be removed from CERCLIS.
VI. AGREEMENT TE&\11NA TION AND MODIFICATION
If, at any time during or upon completion of the remedial investigation or response action, EPA determines that the response is not CERCLA-protective, is unreasonably delayed or inappropriate, or does not adequately address the affected community's concerns, EPA may terminate this agreement, after 30 days notice and discussion with the State. In addition, EPA may terminate the deferral and implement an emergency or time-critical response action without 30 days notice to the State if such actions are determined necessary. In addition, the State may also choose at any time, after 30 days notice, to terminate this agreement for any reason.
Upon terminating this agreement, EPA will consider taking any necessary response actions and initiate consideration of the site for NPL listing. EPA and the State will coordinate efforts to notify the community of the termination of this agreement. These actions will assure the public that EPA will continue to respond at the Site. At EPA's request, the State will provide to EPA all information in its possession regarding the Site.
This agreeme11t adheres to EPA 's "Guidance on Deferral ofNPL Listing Determinations While States Oversee Response Actions" dated May 3, 1995. Furthermore, this agreement may be modified at any time upon agreement of both parties. Notwithstanding any provision of this agreement, EPA retains all authority and reserves all rights to take any and all response actions authorized by law.
EPA/DEQ Deferral Agreement Mid-Coast Marine, Coos Bay
December 2, 1998 Page 4
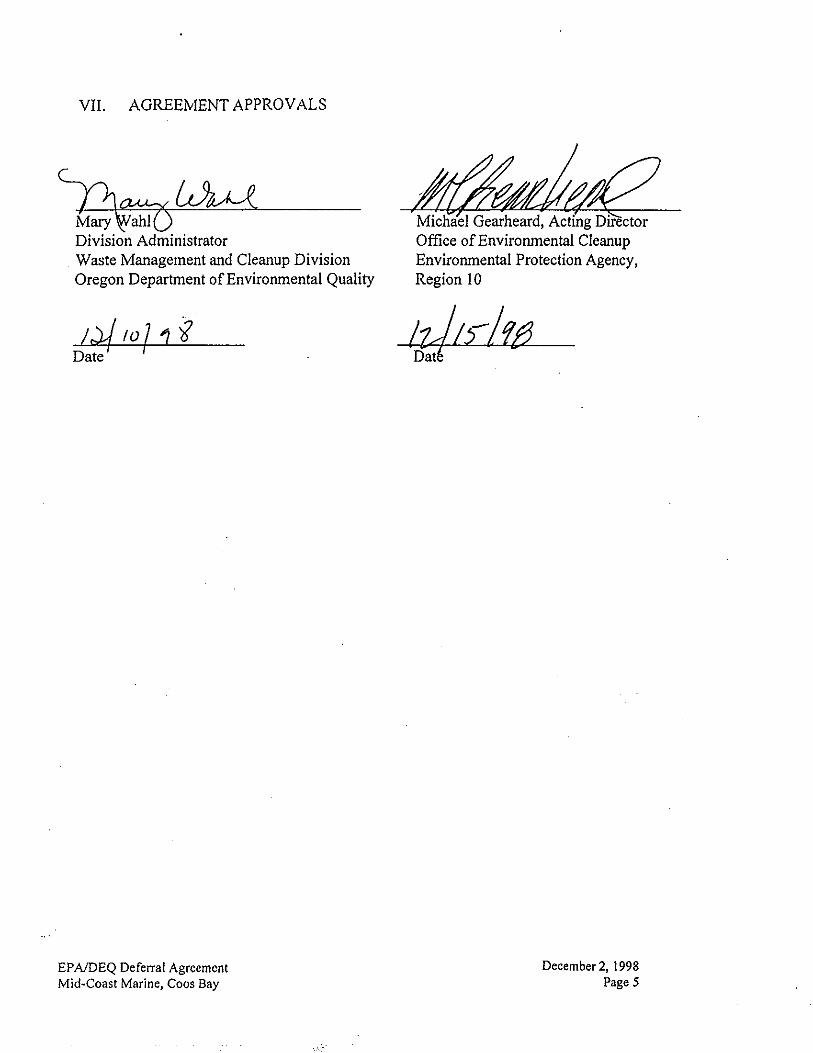
VII. AGREEMENT APPROVALS
Division Administrator Waste Management and Cleanup Division Oregon Department of Environmental Quality
EPA/DEQ Deferral Agreement Mid-Coast Marine, Coos Bay
~~ Michael Gearheard, Acting Director Office of Environmental Cleanup Environmental Protection Agency, Region 10
December 2, 1998 Page 5
15776‐00/Task 9 January 28, 2016
APPENDIX B Analytical Laboratory Testing Program
and Documentation
15776‐00/Task 9 January 28, 2016
APPENDIX B
Analytical Laboratory Testing Program and Documentation This appendix documents the results of a quality assurance (QA) review of the analytical data for
samples collected during the May 2015 investigation activities at the Mid‐Coast Marine site in Coos
Bay, Oregon. ESC Lab Sciences (ESC) of Mt. Juliet, Tennessee, under their Price Agreement with the
State of Oregon, analyzed sediment samples; and TestAmerica‐Seattle (TAS) of Tacoma, Washington,
analyzed sediment samples. Copies of the analytical laboratory reports are included in this appendix.
The QA review included examination and validation of the laboratory’s summary reports, including:
Analytical methods;
Detection limits;
Sample holding times;
Custody records;
Surrogates, spikes, and blanks; and
Duplicates.
The QA review did not include a review of raw data.
1.0 ANALYTICAL METHODS AND REPORTING LIMITS This section describes the analytical methods and detection/reporting limits for the chemical analyses.
1.1 Analytical Methods
Sediment Analyses. Chemical analyses on sediment samples consisted of one or more of the following:
Tributyltin (TBT) by Krone et al. method;
Total organic carbon (TOC) by USDA Loss‐on‐Ignition Method;
Total chromium, copper, nickel, and zinc by EPA Method 6020;
Grain size by ASTM D422;
Total solids by SM 2540G; and
Percent solids by ASTM D2216.
1.2 Method Reporting and Detection Limits
Reporting detection limits (RDLs) are set by the laboratory and are based on instrumentation abilities,
sample matrix, and suggested RDLs by the Environmental Protection Agency (EPA) or the Oregon
Department of Environmental Quality (DEQ). In some cases, the RDL is raised due to high analyte
concentrations in the samples, matrix interferences, or percent dry weight (sediment samples). RDLs
are generally consistent with industry standards and, where possible, below risk‐based concentrations
(RBCs) if not raised as discussed above. The method detection limit (MDL) represents the lowest
concentration that the instrumentation can detect a compound; however, the concentration between
the RDL and MDL can be only estimated and is J flagged in the report tables.
15776‐00/Task 9 January 28, 2016
2.0 DATA QUALITY ASSURANCE Data quality is indicated by assessing their completeness, representativeness, accuracy, precision, and
comparability. An evaluation of the data follows.
2.1 Completeness
Completeness is defined as the percentage of measurements made that are judged to be valid. The
completeness goal is essentially a sufficient amount of valid data that is generated to meet the
objectives of the data (i.e., assess subsurface conditions). Two laboratory reports were received and
are included in this appendix. No sample results were rejected based on the data validation. The data
completeness for all analyses is 100 percent.
2.2 Representativeness
Representativeness is a measure of how closely the results reflect the actual concentration of the
parameters in the medium sampled. It is not possible to measure this directly, so representativeness
is controlled and ensured by using standard protocols for sample handling and custody, analyzing
samples within prescribed holding times, and analyzing blank samples.
Sample Handling and Custody. Samples were collected in general accordance with industry
standards. These included requirements for collection, containers, labeling, packaging, shipping, and
storage. Copies of the chain of custody forms are included with the laboratory report. Compliance
with these procedures has been documented on chain of custody forms.
Holding Times. Collection dates for all samples submitted are documented on the chain of custody
form. Collection and analysis dates are indicated in the laboratory report. Holding times were met for
all samples.
Sample Quality. All samples were collected in general accordance with industry standards.
Method Blanks. Method blanks are prepared by the laboratory and analyzed to check for the
possibility that the sample may become contaminated during the analysis process. Blanks were
analyzed for all analytical tests as appropriate. All method blank data were acceptable.
2.3 Accuracy
Accuracy or bias measures the closeness of the measured value to the true value. Accuracy is the
agreement between a measured value and its true or accepted value. While it is not possible to
determine absolute accuracy for environmental samples, the analysis of standards and spiked samples
provides an indirect assessment of accuracy.
Surrogates. In a surrogate analysis, a known amount of a compound similar to the constituent of
interest is added to a sample and measured. The surrogate analysis assesses the accuracy of a
chemical measurement by comparing the measured value to the actual spiked value. Up to two
surrogates are added to each sample for organic analyses. Surrogate recoveries were all within
acceptable limits for TBT.
Appendix B | B-3
15776‐00/Task 9 January 28, 2016
Matrix Spike Samples. Matrix spike (MS) analyses are performed on samples submitted to the
laboratory that are of the same matrix as the actual sample. This is spiked with known levels of the
constituents of interest. These analyses are used to assess the potential for matrix interference with
recovery or detection of the constituents of interest and the accuracy of the determination. The
spiked sample results are compared to the expected result (i.e., sample concentration plus spike
amount) and are reported as percent recovery. Matrix spike analytical results were all within
acceptable ranges with the following exceptions.
Metals in sediment: The recoveries for chromium, copper, nickel, and zinc fell outside the
laboratory and method control limits in Batch QC MS/MSD. As the source sample was not a
project sample, no results were qualified.
Laboratory Control Samples. Laboratory control samples (LCS) were used by the laboratory to assess
the accuracy of the analytical equipment in analyzing all requested analytes. The sample is prepared
from the analyte‐free matrix, which is then spiked with known levels of the constituents of interest
(i.e., a standard). The concentrations are measured, and the results are compared to the known
spiked levels. This comparison is expressed as percent recovery. All LCS results were within
acceptable limits.
2.4 Precision
Precision is the degree of reproducibility or agreement between independent or repeated measurements.
Analytical variability is expressed as the relative percent difference (RPD) between field or laboratory
replicates and between the primary and duplicate MS and LCS analyses.
Laboratory Sample Duplicates. A laboratory duplicate is a second analysis of a sample. A second
bottle or aliquot of a sample is prepared along with the original. It is analyzed and compared to the
first to assess the precision of the analytical method. The laboratory duplicate sample RPDs were
within the acceptability criteria.
Matrix Spike Sample Duplicate. A second MS sample (a.k.a., the MS duplicate [MSD]) is prepared as
above and analyzed. This is compared to the initial matrix spike to assess the precision of the
analytical method by calculating the RPD. For this method, both a percent recovery and an RPD are
reported. The MSD RPDs were within the acceptability criteria.
Laboratory Control Sample Duplicates. A laboratory control sample duplicate (LCSD) is a second
analysis of an LCS. The duplicate is then prepared along with the original. It is analyzed and compared
to the first to assess the precision of the analytical method. The laboratory control sample RPDs were
within the acceptability criteria.
2.5 Comparability
All samples were analyzed in accordance with accepted methods of the ASTM, EPA, or DEQ, and
therefore the results are comparable.
15776‐00/Task 9 January 28, 2016
Laboratory Documentation
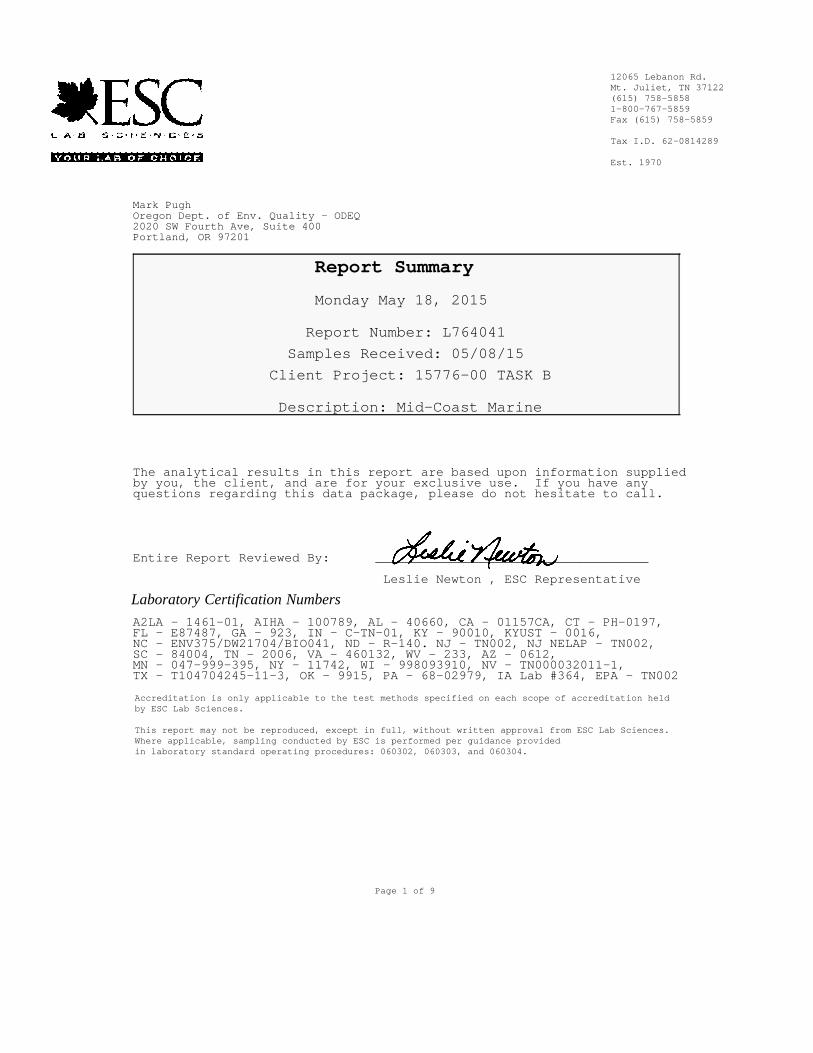
12065 Lebanon Rd.Mt. Juliet, TN 37122(615) 758-58581-800-767-5859Fax (615) 758-5859
Tax I.D. 62-0814289
Est. 1970
Mark PughOregon Dept. of Env. Quality - ODEQ2020 SW Fourth Ave, Suite 400Portland, OR 97201
Report Summary
Monday May 18, 2015
Report Number: L764041
Samples Received: 05/08/15
Client Project: 15776-00 TASK B
Description: Mid-Coast Marine
The analytical results in this report are based upon information suppliedby you, the client, and are for your exclusive use. If you have anyquestions regarding this data package, please do not hesitate to call.
Entire Report Reviewed By: ____________________________________
Leslie Newton , ESC Representative
Laboratory Certification NumbersA2LA - 1461-01, AIHA - 100789, AL - 40660, CA - 01157CA, CT - PH-0197,FL - E87487, GA - 923, IN - C-TN-01, KY - 90010, KYUST - 0016,NC - ENV375/DW21704/BIO041, ND - R-140. NJ - TN002, NJ NELAP - TN002,SC - 84004, TN - 2006, VA - 460132, WV - 233, AZ - 0612,MN - 047-999-395, NY - 11742, WI - 998093910, NV - TN000032011-1,TX - T104704245-11-3, OK - 9915, PA - 68-02979, IA Lab #364, EPA - TN002
Accreditation is only applicable to the test methods specified on each scope of accreditation heldby ESC Lab Sciences.
This report may not be reproduced, except in full, without written approval from ESC Lab Sciences.Where applicable, sampling conducted by ESC is performed per guidance providedin laboratory standard operating procedures: 060302, 060303, and 060304.
Page 1 of 9
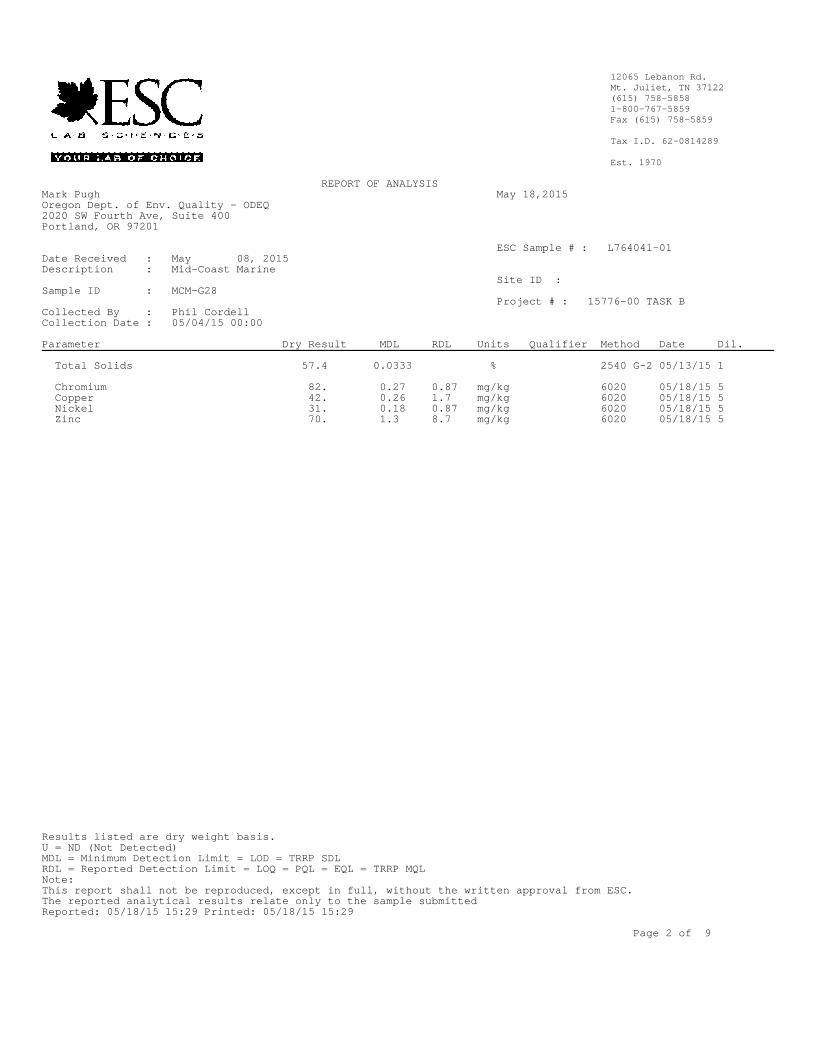
12065 Lebanon Rd.Mt. Juliet, TN 37122(615) 758-58581-800-767-5859Fax (615) 758-5859
Tax I.D. 62-0814289
Est. 1970
REPORT OF ANALYSIS Mark Pugh May 18,2015 Oregon Dept. of Env. Quality - ODEQ 2020 SW Fourth Ave, Suite 400 Portland, OR 97201
ESC Sample # : L764041-01 Date Received : May 08, 2015 Description : Mid-Coast Marine
Site ID : Sample ID : MCM-G28
Project # : 15776-00 TASK B Collected By : Phil Cordell Collection Date : 05/04/15 00:00
Parameter Dry Result MDL RDL Units Qualifier Method Date Dil.
Total Solids 57.4 0.0333 % 2540 G-2 05/13/15 1
Chromium 82. 0.27 0.87 mg/kg 6020 05/18/15 5 Copper 42. 0.26 1.7 mg/kg 6020 05/18/15 5 Nickel 31. 0.18 0.87 mg/kg 6020 05/18/15 5 Zinc 70. 1.3 8.7 mg/kg 6020 05/18/15 5
Results listed are dry weight basis. U = ND (Not Detected) MDL = Minimum Detection Limit = LOD = TRRP SDL RDL = Reported Detection Limit = LOQ = PQL = EQL = TRRP MQL Note: This report shall not be reproduced, except in full, without the written approval from ESC. The reported analytical results relate only to the sample submitted Reported: 05/18/15 15:29 Printed: 05/18/15 15:29
Page 2 of 9
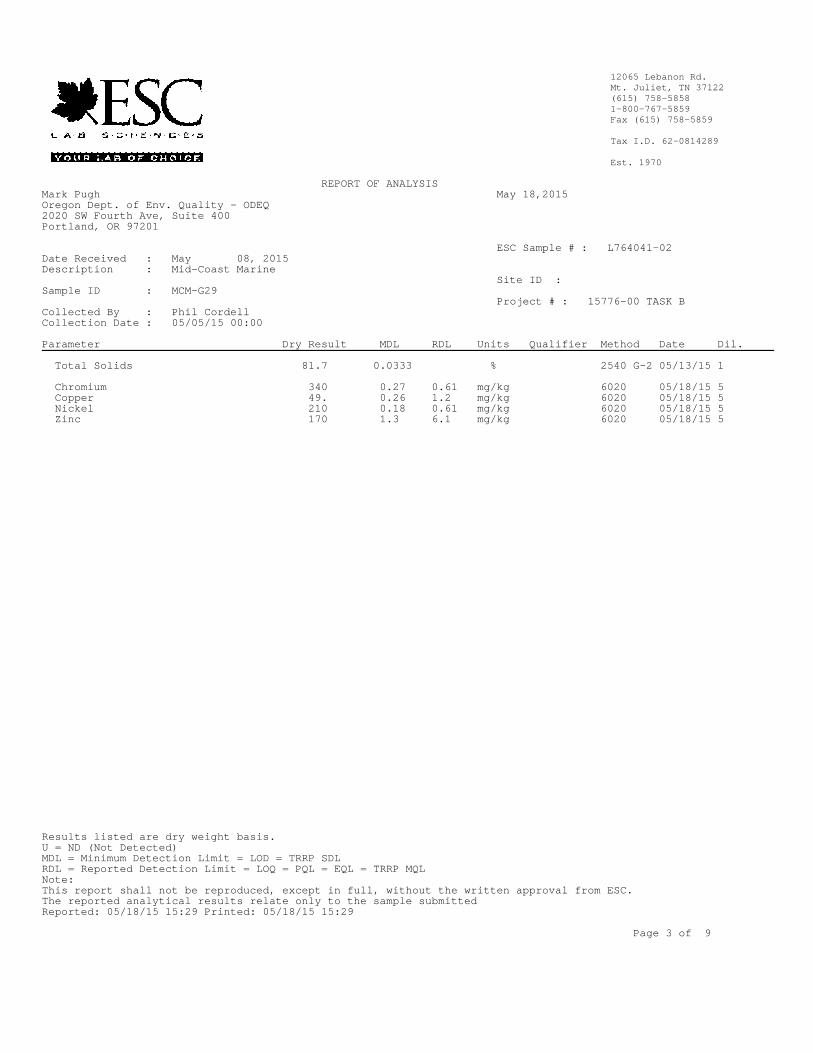
12065 Lebanon Rd.Mt. Juliet, TN 37122(615) 758-58581-800-767-5859Fax (615) 758-5859
Tax I.D. 62-0814289
Est. 1970
REPORT OF ANALYSIS Mark Pugh May 18,2015 Oregon Dept. of Env. Quality - ODEQ 2020 SW Fourth Ave, Suite 400 Portland, OR 97201
ESC Sample # : L764041-02 Date Received : May 08, 2015 Description : Mid-Coast Marine
Site ID : Sample ID : MCM-G29
Project # : 15776-00 TASK B Collected By : Phil Cordell Collection Date : 05/05/15 00:00
Parameter Dry Result MDL RDL Units Qualifier Method Date Dil.
Total Solids 81.7 0.0333 % 2540 G-2 05/13/15 1
Chromium 340 0.27 0.61 mg/kg 6020 05/18/15 5 Copper 49. 0.26 1.2 mg/kg 6020 05/18/15 5 Nickel 210 0.18 0.61 mg/kg 6020 05/18/15 5 Zinc 170 1.3 6.1 mg/kg 6020 05/18/15 5
Results listed are dry weight basis. U = ND (Not Detected) MDL = Minimum Detection Limit = LOD = TRRP SDL RDL = Reported Detection Limit = LOQ = PQL = EQL = TRRP MQL Note: This report shall not be reproduced, except in full, without the written approval from ESC. The reported analytical results relate only to the sample submitted Reported: 05/18/15 15:29 Printed: 05/18/15 15:29
Page 3 of 9

12065 Lebanon Rd.Mt. Juliet, TN 37122(615) 758-58581-800-767-5859Fax (615) 758-5859
Tax I.D. 62-0814289
Est. 1970
REPORT OF ANALYSIS Mark Pugh May 18, 2015 Oregon Dept. of Env. Quality - ODEQ 2020 SW Fourth Ave, Suite 400 Portland, OR 97201
ESC Sample # : L764041-03 Date Received : May 08, 2015 Description : Mid-Coast Marine
Site ID : Sample ID : MCM-G30
Project # : 15776-00 TASK B Collected By : Phil Cordell Collection Date : 05/05/15 00:00
Parameter Dry Result MDL RDL Units Qualifier Method Date Dil.
Total Solids 71.6 0.0333 % 2540 G-2 05/13/15 1
Chromium 280 0.27 0.70 mg/kg 6020 05/18/15 5 Copper 82. 0.26 1.4 mg/kg 6020 05/18/15 5 Nickel 96. 0.18 0.70 mg/kg 6020 05/18/15 5 Zinc 210 1.3 7.0 mg/kg 6020 05/18/15 5
Results listed are dry weight basis. U = ND (Not Detected) MDL = Minimum Detection Limit = LOD = TRRP SDL RDL = Reported Detection Limit = LOQ = PQL = EQL = TRRP MQL Note: This report shall not be reproduced, except in full, without the written approval from ESC. The reported analytical results relate only to the sample submitted Reported: 05/18/15 15:29 Printed: 05/18/15 15:29
Page 4 of 9
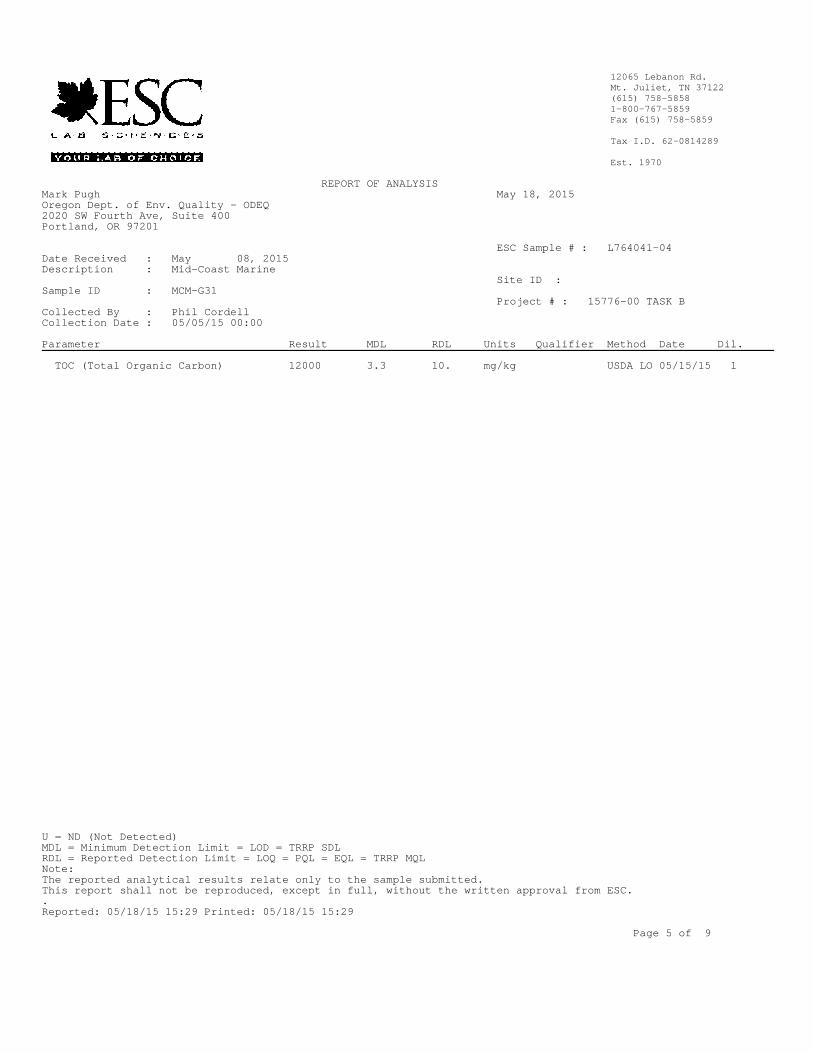
12065 Lebanon Rd.Mt. Juliet, TN 37122(615) 758-58581-800-767-5859Fax (615) 758-5859
Tax I.D. 62-0814289
Est. 1970
REPORT OF ANALYSIS Mark Pugh May 18, 2015 Oregon Dept. of Env. Quality - ODEQ 2020 SW Fourth Ave, Suite 400 Portland, OR 97201
ESC Sample # : L764041-04 Date Received : May 08, 2015 Description : Mid-Coast Marine
Site ID : Sample ID : MCM-G31
Project # : 15776-00 TASK B Collected By : Phil Cordell Collection Date : 05/05/15 00:00
Parameter Result MDL RDL Units Qualifier Method Date Dil.
TOC (Total Organic Carbon) 12000 3.3 10. mg/kg USDA LO 05/15/15 1
U = ND (Not Detected) MDL = Minimum Detection Limit = LOD = TRRP SDL RDL = Reported Detection Limit = LOQ = PQL = EQL = TRRP MQL Note: The reported analytical results relate only to the sample submitted. This report shall not be reproduced, except in full, without the written approval from ESC. . Reported: 05/18/15 15:29 Printed: 05/18/15 15:29
Page 5 of 9

12065 Lebanon Rd.Mt. Juliet, TN 37122(615) 758-58581-800-767-5859Fax (615) 758-5859
Tax I.D. 62-0814289
Est. 1970
REPORT OF ANALYSIS Mark Pugh May 18, 2015 Oregon Dept. of Env. Quality - ODEQ 2020 SW Fourth Ave, Suite 400 Portland, OR 97201
ESC Sample # : L764041-05 Date Received : May 08, 2015 Description : Mid-Coast Marine
Site ID : Sample ID : MCM-G29
Project # : 15776-00 TASK B Collected By : Phil Cordell Collection Date : 05/05/15 00:00
Parameter Result MDL RDL Units Qualifier Method Date Dil.
TOC (Total Organic Carbon) 4000 3.3 10. mg/kg USDA LO 05/15/15 1
U = ND (Not Detected) MDL = Minimum Detection Limit = LOD = TRRP SDL RDL = Reported Detection Limit = LOQ = PQL = EQL = TRRP MQL Note: The reported analytical results relate only to the sample submitted. This report shall not be reproduced, except in full, without the written approval from ESC. . Reported: 05/18/15 15:29 Printed: 05/18/15 15:29
Page 6 of 9
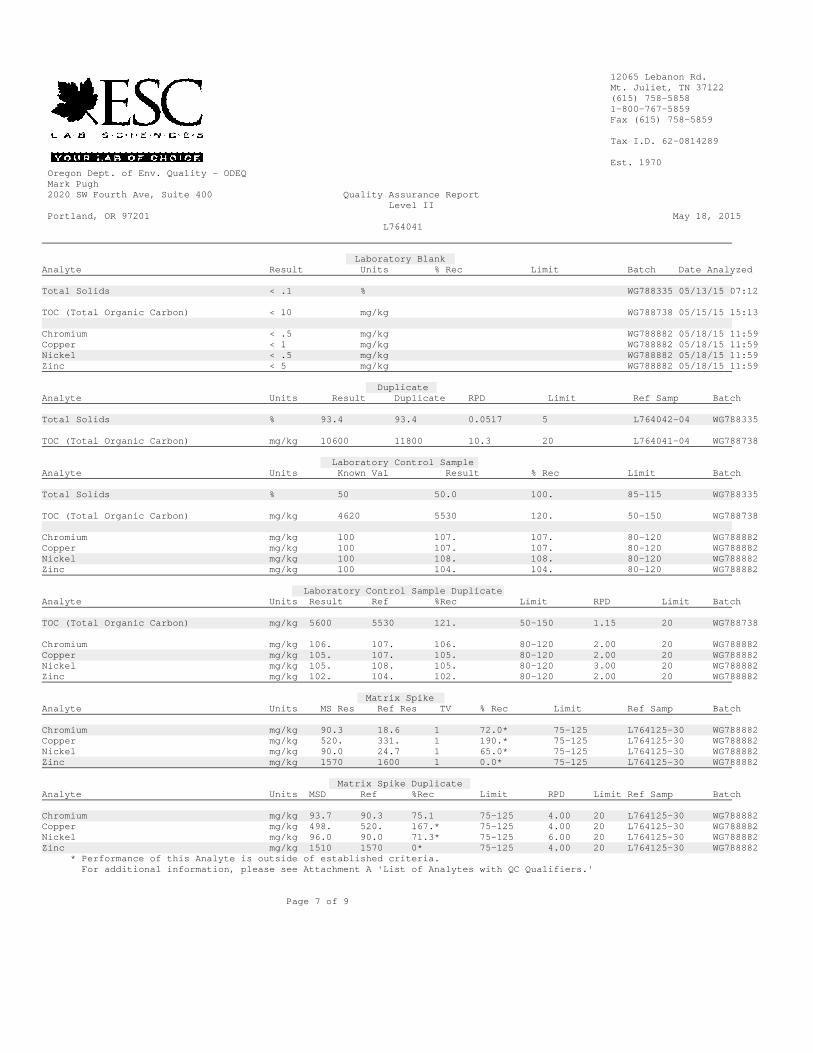
12065 Lebanon Rd.Mt. Juliet, TN 37122(615) 758-58581-800-767-5859Fax (615) 758-5859
Tax I.D. 62-0814289
Est. 1970Oregon Dept. of Env. Quality - ODEQ Mark Pugh 2020 SW Fourth Ave, Suite 400 Quality Assurance Report
Level IIPortland, OR 97201 May 18, 2015
L764041
Laboratory BlankAnalyte Result Units % Rec Limit Batch Date Analyzed
Total Solids < .1 % WG788335 05/13/15 07:12
TOC (Total Organic Carbon) < 10 mg/kg WG788738 05/15/15 15:13
Chromium < .5 mg/kg WG788882 05/18/15 11:59 Copper < 1 mg/kg WG788882 05/18/15 11:59 Nickel < .5 mg/kg WG788882 05/18/15 11:59 Zinc < 5 mg/kg WG788882 05/18/15 11:59
DuplicateAnalyte Units Result Duplicate RPD Limit Ref Samp Batch
Total Solids % 93.4 93.4 0.0517 5 L764042-04 WG788335
TOC (Total Organic Carbon) mg/kg 10600 11800 10.3 20 L764041-04 WG788738
Laboratory Control SampleAnalyte Units Known Val Result % Rec Limit Batch
Total Solids % 50 50.0 100. 85-115 WG788335
TOC (Total Organic Carbon) mg/kg 4620 5530 120. 50-150 WG788738
Chromium mg/kg 100 107. 107. 80-120 WG788882 Copper mg/kg 100 107. 107. 80-120 WG788882 Nickel mg/kg 100 108. 108. 80-120 WG788882 Zinc mg/kg 100 104. 104. 80-120 WG788882
Laboratory Control Sample DuplicateAnalyte Units Result Ref %Rec Limit RPD Limit Batch
TOC (Total Organic Carbon) mg/kg 5600 5530 121. 50-150 1.15 20 WG788738
Chromium mg/kg 106. 107. 106. 80-120 2.00 20 WG788882 Copper mg/kg 105. 107. 105. 80-120 2.00 20 WG788882 Nickel mg/kg 105. 108. 105. 80-120 3.00 20 WG788882 Zinc mg/kg 102. 104. 102. 80-120 2.00 20 WG788882
Matrix SpikeAnalyte Units MS Res Ref Res TV % Rec Limit Ref Samp Batch
Chromium mg/kg 90.3 18.6 1 72.0* 75-125 L764125-30 WG788882 Copper mg/kg 520. 331. 1 190.* 75-125 L764125-30 WG788882 Nickel mg/kg 90.0 24.7 1 65.0* 75-125 L764125-30 WG788882 Zinc mg/kg 1570 1600 1 0.0* 75-125 L764125-30 WG788882
Matrix Spike DuplicateAnalyte Units MSD Ref %Rec Limit RPD Limit Ref Samp Batch
Chromium mg/kg 93.7 90.3 75.1 75-125 4.00 20 L764125-30 WG788882 Copper mg/kg 498. 520. 167.* 75-125 4.00 20 L764125-30 WG788882 Nickel mg/kg 96.0 90.0 71.3* 75-125 6.00 20 L764125-30 WG788882 Zinc mg/kg 1510 1570 0* 75-125 4.00 20 L764125-30 WG788882
* Performance of this Analyte is outside of established criteria.For additional information, please see Attachment A 'List of Analytes with QC Qualifiers.'
Page 7 of 9
12065 Lebanon Rd.Mt. Juliet, TN 37122(615) 758-58581-800-767-5859Fax (615) 758-5859
Tax I.D. 62-0814289
Est. 1970Oregon Dept. of Env. Quality - ODEQ Mark Pugh 2020 SW Fourth Ave, Suite 400 Quality Assurance Report
Level IIPortland, OR 97201 May 18, 2015
L764041
Post Spike
Serial Dilution
Batch number /Run number / Sample number cross reference
WG788335: R3036550: L764041-01 02 03WG788738: R3037300: L764041-04 05WG788882: R3037622: L764041-01 02 03
* * Calculations are performed prior to rounding of reported values.* Performance of this Analyte is outside of established criteria.For additional information, please see Attachment A 'List of Analytes with QC Qualifiers.'
Page 8 of 9
12065 Lebanon Rd.Mt. Juliet, TN 37122(615) 758-58581-800-767-5859Fax (615) 758-5859
Tax I.D. 62-0814289
Est. 1970Oregon Dept. of Env. Quality - ODEQ Mark Pugh 2020 SW Fourth Ave, Suite 400 Quality Assurance Report
Level IIPortland, OR 97201 May 18, 2015
L764041
The data package includes a summary of the analytic results of the qualitycontrol samples required by the SW-846 or CWA methods. The quality controlsamples include a method blank, a laboratory control sample, and the matrixspike/matrix spike duplicate analysis. If a target parameter is outsidethe method limits, every sample that is effected is flagged with theappropriate qualifier in Appendix B of the analytic report.
Method Blank - an aliquot of reagent water carried through theentire analytic process. The method blank results indicate ifany possible contamination exposure during the sample handling,digestion or extraction process, and analysis. Concentrations oftarget analytes above the reporting limit in the method blank arequalified with the "B" qualifier.
Laboratory Control Sample - is a sample of known concentrationthat is carried through the digestion/extraction and analysisprocess. The percent recovery, expressed as a percentage of thetheoretical concentration, has statistical control limitsindicating that the analytic process is "in control". If atarget analyte is outside the control limits for the laboratorycontrol sample or any other control sample, the parameter isflagged with a "J4" qualifier for all effected samples.
Matrix Spike and Matrix Spike Duplicate - is two aliquots of anenvironmental sample that is spiked with known concentrations oftarget analytes. The percent recovery of the target analytesalso has statistical control limits. If any recoveries that areoutside the method control limits, the sample that was selectedfor matrix spike/matrix spike duplicate analysis is flagged witheither a "J5" or a "J6". The relative percent difference (%RPD)between the matrix spike and the matrix spike duplicaterecoveries is all calculated. If the RPD is above the methodlimit, the effected samples are flagged with a "J3" qualifier.
Page 9 of 9
ANALYTICAL REPORTTestAmerica Laboratories, Inc.TestAmerica Seattle5755 8th Street EastTacoma, WA 98424Tel: (253)922-2310
TestAmerica Job ID: 580-49693-1Client Project/Site: Mid-Coast Marine
For:Hart Crowser, Inc.8910 SW Gemini DriveBeaverton, Oregon 97008
Attn: Philip Cordell
Authorized for release by:5/27/2015 6:20:43 PM
Kristine Allen, Manager of Project Management(253)[email protected]
This report has been electronically signed and authorized by the signatory. Electronic signature isintended to be the legally binding equivalent of a traditionally handwritten signature.
Results relate only to the items tested and the sample(s) as received by the laboratory.
1
2
3
4
5
6
7
8
9
10
11
Table of Contents
Client: Hart Crowser, Inc.Project/Site: Mid-Coast Marine
TestAmerica Job ID: 580-49693-1
Page 2 of 16TestAmerica Seattle
5/27/2015
Cover Page . . . . . . . . . . . . . . . . . . . . . . . . . . . . . . . . . . . . . . . . . . . . . . 1
Table of Contents . . . . . . . . . . . . . . . . . . . . . . . . . . . . . . . . . . . . . . . . . 2
Case Narrative . . . . . . . . . . . . . . . . . . . . . . . . . . . . . . . . . . . . . . . . . . . 3
Definitions . . . . . . . . . . . . . . . . . . . . . . . . . . . . . . . . . . . . . . . . . . . . . . . 5
Client Sample Results . . . . . . . . . . . . . . . . . . . . . . . . . . . . . . . . . . . . . . 6
QC Sample Results . . . . . . . . . . . . . . . . . . . . . . . . . . . . . . . . . . . . . . . . 10
Chronicle . . . . . . . . . . . . . . . . . . . . . . . . . . . . . . . . . . . . . . . . . . . . . . . . 12
Certification Summary . . . . . . . . . . . . . . . . . . . . . . . . . . . . . . . . . . . . . . 13
Sample Summary . . . . . . . . . . . . . . . . . . . . . . . . . . . . . . . . . . . . . . . . . 14
Chain of Custody . . . . . . . . . . . . . . . . . . . . . . . . . . . . . . . . . . . . . . . . . . 15
Receipt Checklists . . . . . . . . . . . . . . . . . . . . . . . . . . . . . . . . . . . . . . . . . 16
1
2
3
4
5
6
7
8
9
10
11
Case NarrativeClient: Hart Crowser, Inc. TestAmerica Job ID: 580-49693-1Project/Site: Mid-Coast Marine
Job ID: 580-49693-1
Laboratory: TestAmerica Seattle
Narrative
CASE NARRATIVE
Client: Hart Crowser, Inc.Project: Mid-Coast Marine
Report Number: 580-49693-1
This case narrative is in the form of an exception report, where only the anomalies related to this report, method specific performance and/or QA/QC issues are discussed. If there are no issues to report, this narrative will include a statement that documents that there are
no relevant data issues.
It should be noted that samples with elevated Reporting Limits (RLs) resulting from a dilution may not be able to satisfy customer
reporting limits in some cases. Such increases in the RLs are an unavoidable but acceptable consequence of sample dilution that enables quantification of target analytes within the calibration range of the instrument or that reduces the interferences thereby enabling the quantification of target analytes.
Calculations are performed before rounding to avoid round-off errors in calculated results.
All holding times were met and proper preservation noted for the methods performed on these samples, unless otherwise detailed in the individual sections below.
RECEIPTThe samples were received on 05/08/2015; the samples arrived in good condition, properly preserved and on ice. The temperature of the coolers at receipt was 2.7 C.
Note: All samples which require thermal preservation are considered acceptable if the arrival temperature is within 2C of the required
temperature or method specified range. For samples with a specified temperature of 4C, samples with a temperature ranging from just above freezing temperature of water to 6C shall be acceptable. Samples that are hand delivered immediately following collection may not meet these criteria, however they will be deemed acceptable according to NELAC standards, if there is evidence that the chilling process has begun, such as arrival on ice, etc.
ORGANOTINS BY GC/MSSamples MCM-G28 (580-49693-1), MCM-G29 (580-49693-2) and MCM-G30 (580-49693-3) were analyzed for organotins by GC/MS in
accordance with the Krone Method. The samples were prepared on 05/11/2015 and analyzed on 05/15/2015 and 05/16/2015.
Samples MCM-G29 (580-49693-2)[5X] and MCM-G30 (580-49693-3)[5X] required dilution prior to analysis. The reporting limits have been adjusted accordingly.
No analytical or quality issues were noted, other than those described above or in the Definitions/Glossary page.
GRAIN SIZESamples MCM-G29 (580-49693-2) and MCM-G31 (580-49693-4) were analyzed for grain size in accordance with D422. The samples
were analyzed on 05/20/2015.
No analytical or quality issues were noted, other than those described above or in the Definitions/Glossary page.
PERCENT SOLIDS
Samples MCM-G28 (580-49693-1), MCM-G29 (580-49693-2) and MCM-G30 (580-49693-3) were analyzed for percent solids in
accordance with ASTM D2216. The samples were analyzed on 05/19/2015.
No analytical or quality issues were noted, other than those described above or in the Definitions/Glossary page.
TestAmerica SeattlePage 3 of 16 5/27/2015
1
2
3
4
5
6
7
8
9
10
11
Case NarrativeClient: Hart Crowser, Inc. TestAmerica Job ID: 580-49693-1Project/Site: Mid-Coast Marine
Job ID: 580-49693-1 (Continued)
Laboratory: TestAmerica Seattle (Continued)
TestAmerica SeattlePage 4 of 16 5/27/2015
1
2
3
4
5
6
7
8
9
10
11
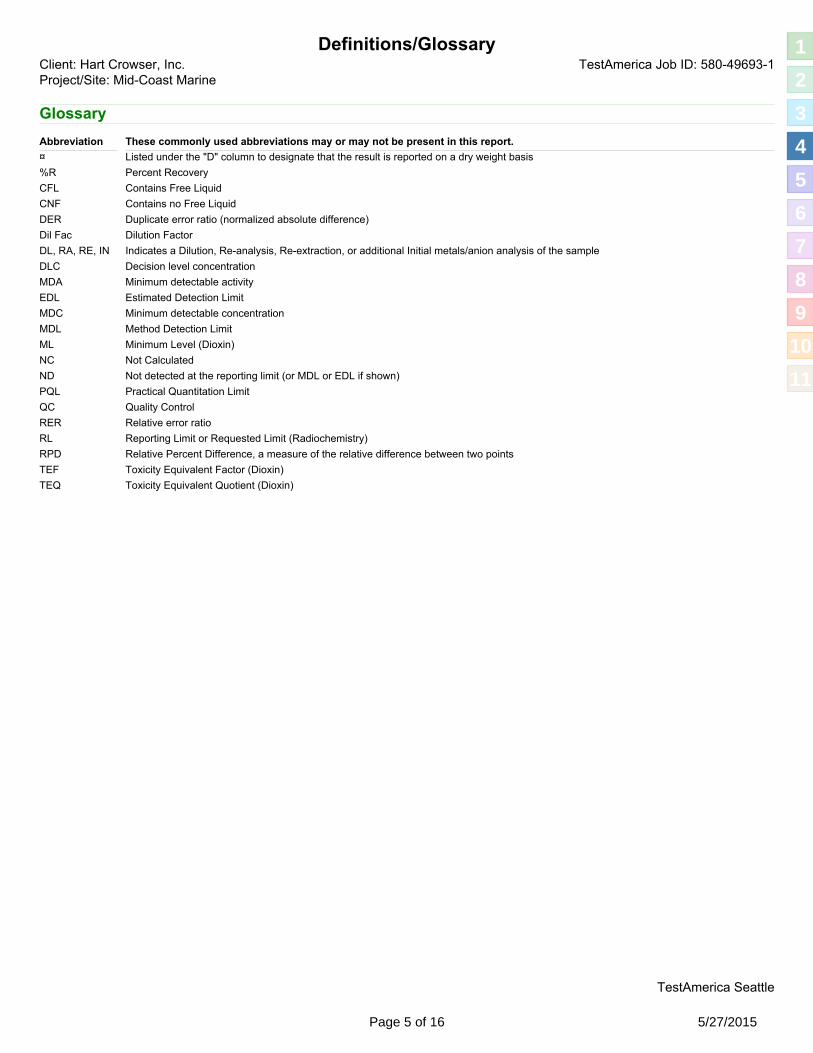
Definitions/GlossaryTestAmerica Job ID: 580-49693-1Client: Hart Crowser, Inc.
Project/Site: Mid-Coast Marine
Glossary
These commonly used abbreviations may or may not be present in this report.
¤ Listed under the "D" column to designate that the result is reported on a dry weight basis
Abbreviation
%R Percent Recovery
CFL Contains Free Liquid
CNF Contains no Free Liquid
DER Duplicate error ratio (normalized absolute difference)
Dil Fac Dilution Factor
DL, RA, RE, IN Indicates a Dilution, Re-analysis, Re-extraction, or additional Initial metals/anion analysis of the sample
DLC Decision level concentration
MDA Minimum detectable activity
EDL Estimated Detection Limit
MDC Minimum detectable concentration
MDL Method Detection Limit
ML Minimum Level (Dioxin)
NC Not Calculated
ND Not detected at the reporting limit (or MDL or EDL if shown)
PQL Practical Quantitation Limit
QC Quality Control
RER Relative error ratio
RL Reporting Limit or Requested Limit (Radiochemistry)
RPD Relative Percent Difference, a measure of the relative difference between two points
TEF Toxicity Equivalent Factor (Dioxin)
TEQ Toxicity Equivalent Quotient (Dioxin)
TestAmerica Seattle
Page 5 of 16 5/27/2015
1
2
3
4
5
6
7
8
9
10
11
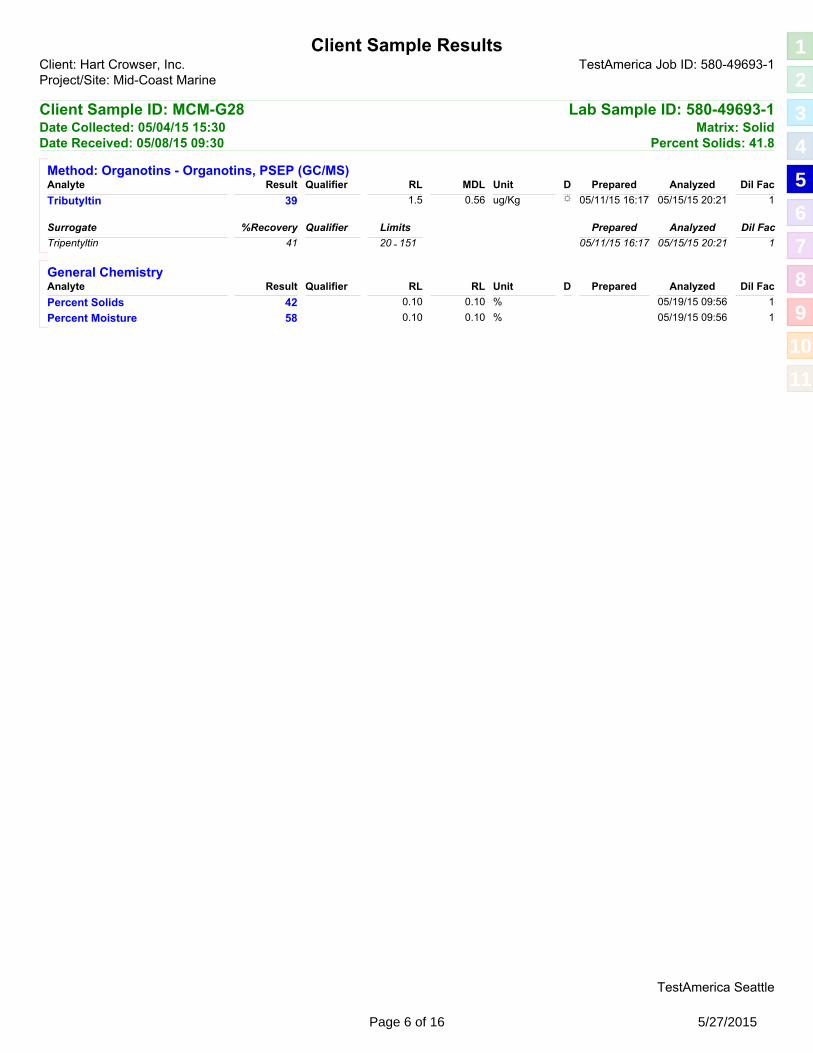
Client Sample ResultsTestAmerica Job ID: 580-49693-1Client: Hart Crowser, Inc.
Project/Site: Mid-Coast Marine
Lab Sample ID: 580-49693-1Client Sample ID: MCM-G28Matrix: SolidDate Collected: 05/04/15 15:30
Percent Solids: 41.8Date Received: 05/08/15 09:30
Method: Organotins - Organotins, PSEP (GC/MS)RL MDL
Tributyltin 39 1.5 0.56 ug/Kg ☼ 05/11/15 16:17 05/15/15 20:21 1
Analyte Dil FacAnalyzedPreparedUnit DResult Qualifier
Tripentyltin 41 20 - 151 05/11/15 16:17 05/15/15 20:21 1
Surrogate Dil FacAnalyzedPreparedQualifier Limits%Recovery
General ChemistryRL RL
Percent Solids 42 0.10 0.10 % 05/19/15 09:56 1
Analyte Dil FacAnalyzedPreparedUnit DResult Qualifier
0.10 0.10 % 05/19/15 09:56 1Percent Moisture 58
TestAmerica Seattle
Page 6 of 16 5/27/2015
1
2
3
4
5
6
7
8
9
10
11
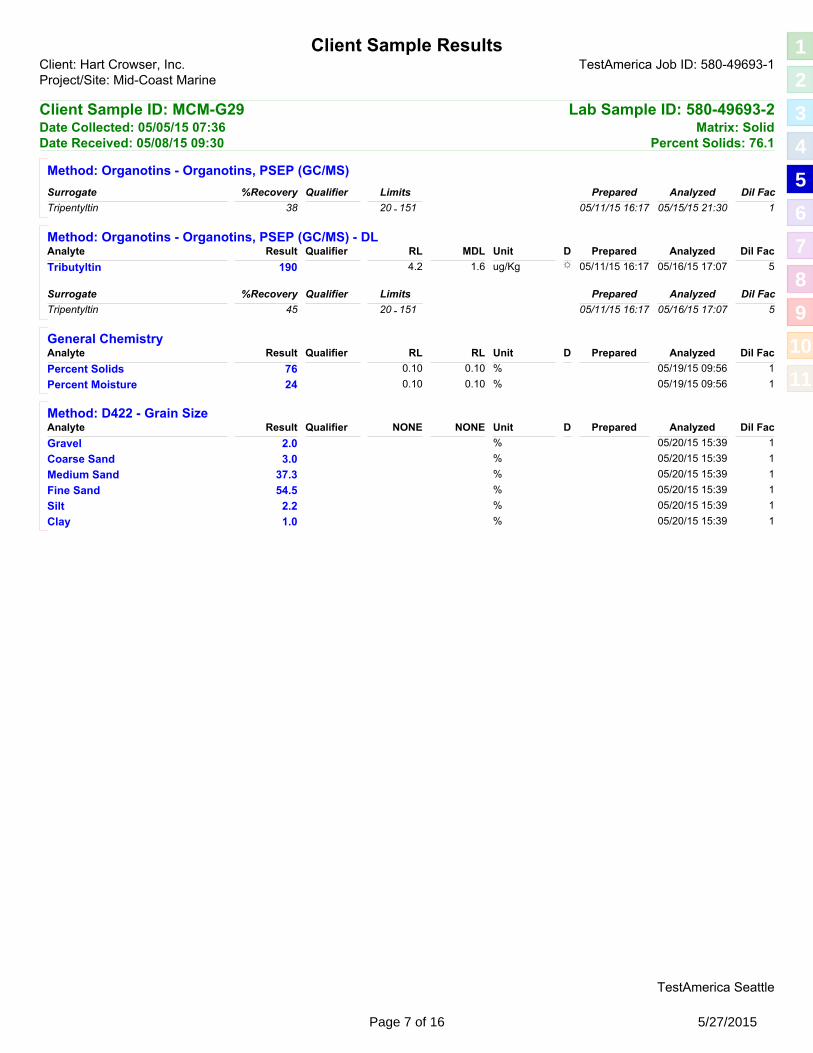
Client Sample ResultsTestAmerica Job ID: 580-49693-1Client: Hart Crowser, Inc.
Project/Site: Mid-Coast Marine
Lab Sample ID: 580-49693-2Client Sample ID: MCM-G29Matrix: SolidDate Collected: 05/05/15 07:36
Percent Solids: 76.1Date Received: 05/08/15 09:30
Method: Organotins - Organotins, PSEP (GC/MS)
Tripentyltin 38 20 - 151 05/11/15 16:17 05/15/15 21:30 1
Surrogate Dil FacAnalyzedPreparedQualifier Limits%Recovery
Method: Organotins - Organotins, PSEP (GC/MS) - DLRL MDL
Tributyltin 190 4.2 1.6 ug/Kg ☼ 05/11/15 16:17 05/16/15 17:07 5
Analyte Dil FacAnalyzedPreparedUnit DResult Qualifier
Tripentyltin 45 20 - 151 05/11/15 16:17 05/16/15 17:07 5
Surrogate Dil FacAnalyzedPreparedQualifier Limits%Recovery
General ChemistryRL RL
Percent Solids 76 0.10 0.10 % 05/19/15 09:56 1
Analyte Dil FacAnalyzedPreparedUnit DResult Qualifier
0.10 0.10 % 05/19/15 09:56 1Percent Moisture 24
Method: D422 - Grain SizeNONE NONE
Gravel 2.0 % 05/20/15 15:39 1
Analyte Dil FacAnalyzedPreparedUnit DResult Qualifier
% 05/20/15 15:39 1Coarse Sand 3.0
% 05/20/15 15:39 1Medium Sand 37.3
% 05/20/15 15:39 1Fine Sand 54.5
% 05/20/15 15:39 1Silt 2.2
% 05/20/15 15:39 1Clay 1.0
TestAmerica Seattle
Page 7 of 16 5/27/2015
1
2
3
4
5
6
7
8
9
10
11
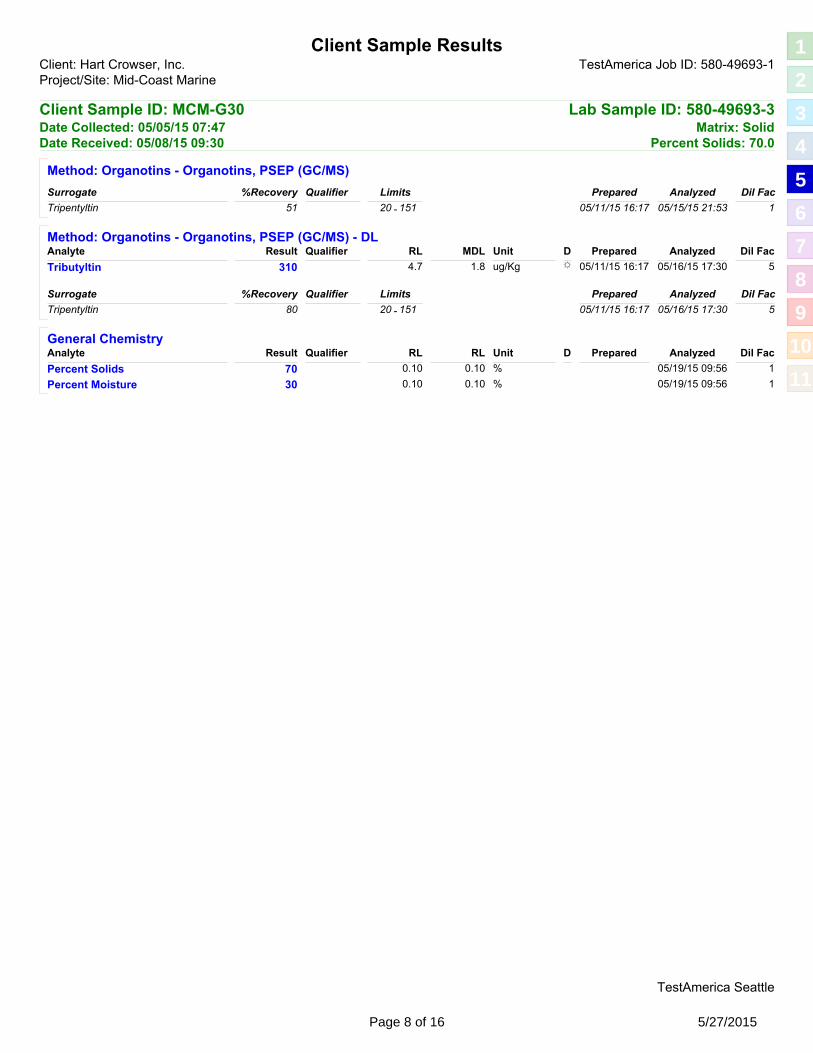
Client Sample ResultsTestAmerica Job ID: 580-49693-1Client: Hart Crowser, Inc.
Project/Site: Mid-Coast Marine
Lab Sample ID: 580-49693-3Client Sample ID: MCM-G30Matrix: SolidDate Collected: 05/05/15 07:47
Percent Solids: 70.0Date Received: 05/08/15 09:30
Method: Organotins - Organotins, PSEP (GC/MS)
Tripentyltin 51 20 - 151 05/11/15 16:17 05/15/15 21:53 1
Surrogate Dil FacAnalyzedPreparedQualifier Limits%Recovery
Method: Organotins - Organotins, PSEP (GC/MS) - DLRL MDL
Tributyltin 310 4.7 1.8 ug/Kg ☼ 05/11/15 16:17 05/16/15 17:30 5
Analyte Dil FacAnalyzedPreparedUnit DResult Qualifier
Tripentyltin 80 20 - 151 05/11/15 16:17 05/16/15 17:30 5
Surrogate Dil FacAnalyzedPreparedQualifier Limits%Recovery
General ChemistryRL RL
Percent Solids 70 0.10 0.10 % 05/19/15 09:56 1
Analyte Dil FacAnalyzedPreparedUnit DResult Qualifier
0.10 0.10 % 05/19/15 09:56 1Percent Moisture 30
TestAmerica Seattle
Page 8 of 16 5/27/2015
1
2
3
4
5
6
7
8
9
10
11
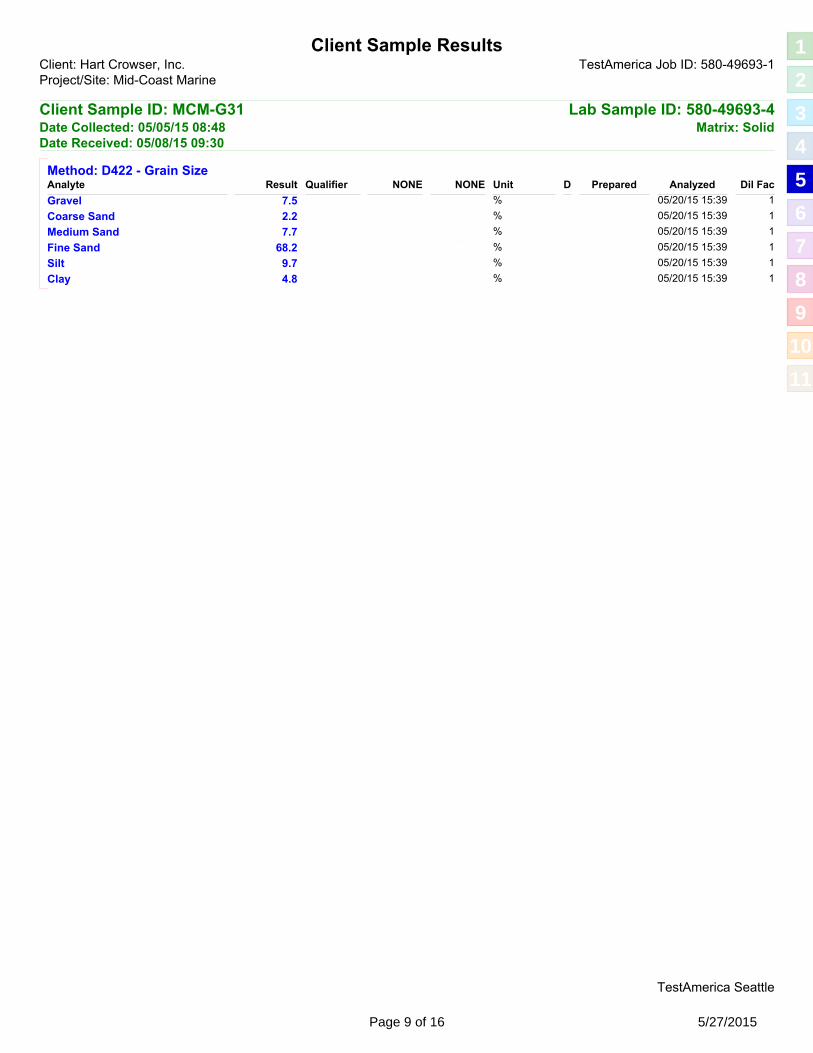
Client Sample ResultsTestAmerica Job ID: 580-49693-1Client: Hart Crowser, Inc.
Project/Site: Mid-Coast Marine
Lab Sample ID: 580-49693-4Client Sample ID: MCM-G31Matrix: SolidDate Collected: 05/05/15 08:48
Date Received: 05/08/15 09:30
Method: D422 - Grain SizeNONE NONE
Gravel 7.5 % 05/20/15 15:39 1
Analyte Dil FacAnalyzedPreparedUnit DResult Qualifier
% 05/20/15 15:39 1Coarse Sand 2.2
% 05/20/15 15:39 1Medium Sand 7.7
% 05/20/15 15:39 1Fine Sand 68.2
% 05/20/15 15:39 1Silt 9.7
% 05/20/15 15:39 1Clay 4.8
TestAmerica Seattle
Page 9 of 16 5/27/2015
1
2
3
4
5
6
7
8
9
10
11
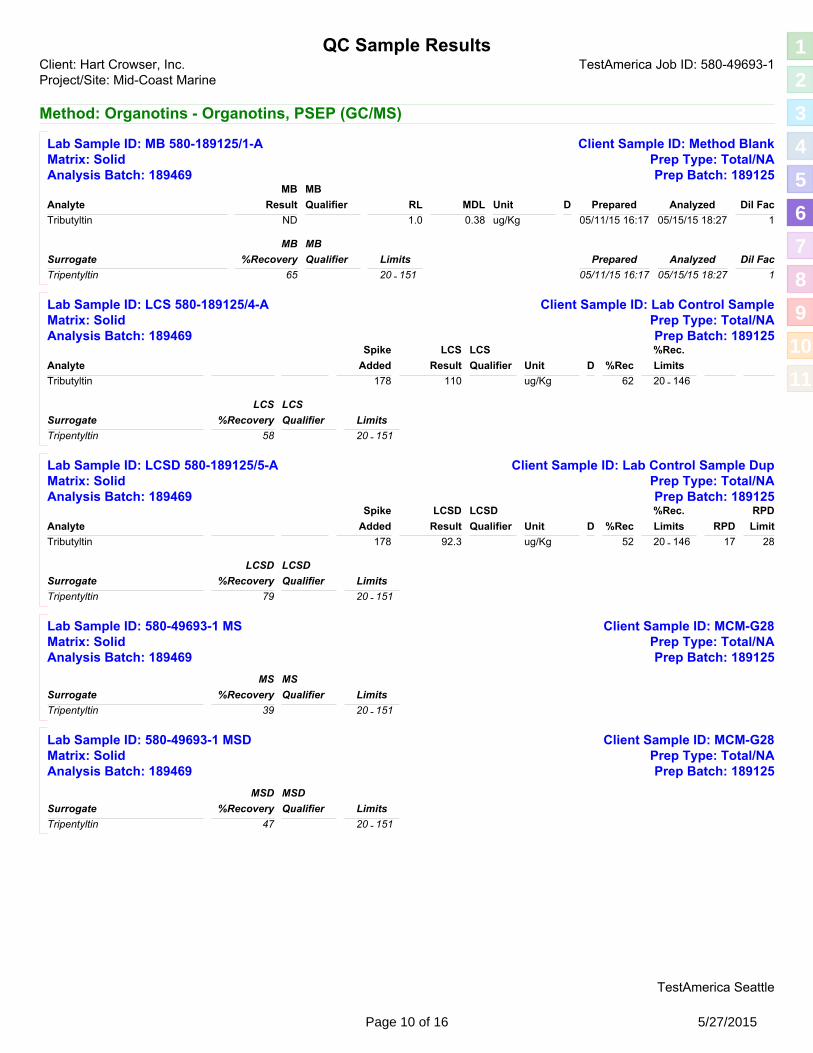
QC Sample ResultsTestAmerica Job ID: 580-49693-1Client: Hart Crowser, Inc.
Project/Site: Mid-Coast Marine
Method: Organotins - Organotins, PSEP (GC/MS)
Client Sample ID: Method BlankLab Sample ID: MB 580-189125/1-AMatrix: Solid Prep Type: Total/NAAnalysis Batch: 189469 Prep Batch: 189125
RL MDL
Tributyltin ND 1.0 0.38 ug/Kg 05/11/15 16:17 05/15/15 18:27 1
MB MB
Analyte Dil FacAnalyzedPreparedDUnitResult Qualifier
Tripentyltin 65 20 - 151 05/15/15 18:27 1
MB MB
Surrogate
05/11/15 16:17
Dil FacPrepared AnalyzedQualifier Limits%Recovery
Client Sample ID: Lab Control SampleLab Sample ID: LCS 580-189125/4-AMatrix: Solid Prep Type: Total/NAAnalysis Batch: 189469 Prep Batch: 189125
Tributyltin 178 110 ug/Kg 62 20 - 146
Analyte
LCS LCS
DUnitResult Qualifier %Rec
Spike
Added
%Rec.
Limits
Tripentyltin 20 - 151
Surrogate
58
LCS LCS
Qualifier Limits%Recovery
Client Sample ID: Lab Control Sample DupLab Sample ID: LCSD 580-189125/5-AMatrix: Solid Prep Type: Total/NAAnalysis Batch: 189469 Prep Batch: 189125
Tributyltin 178 92.3 ug/Kg 52 20 - 146 17 28
Analyte
LCSD LCSD
DUnitResult Qualifier %Rec
Spike
Added
%Rec.
Limits LimitRPD
RPD
Tripentyltin 20 - 151
Surrogate
79
LCSD LCSD
Qualifier Limits%Recovery
Client Sample ID: MCM-G28Lab Sample ID: 580-49693-1 MSMatrix: Solid Prep Type: Total/NAAnalysis Batch: 189469 Prep Batch: 189125
Tripentyltin 20 - 151
Surrogate
39
MS MS
Qualifier Limits%Recovery
Client Sample ID: MCM-G28Lab Sample ID: 580-49693-1 MSDMatrix: Solid Prep Type: Total/NAAnalysis Batch: 189469 Prep Batch: 189125
Tripentyltin 20 - 151
Surrogate
47
MSD MSD
Qualifier Limits%Recovery
TestAmerica Seattle
Page 10 of 16 5/27/2015
1
2
3
4
5
6
7
8
9
10
11
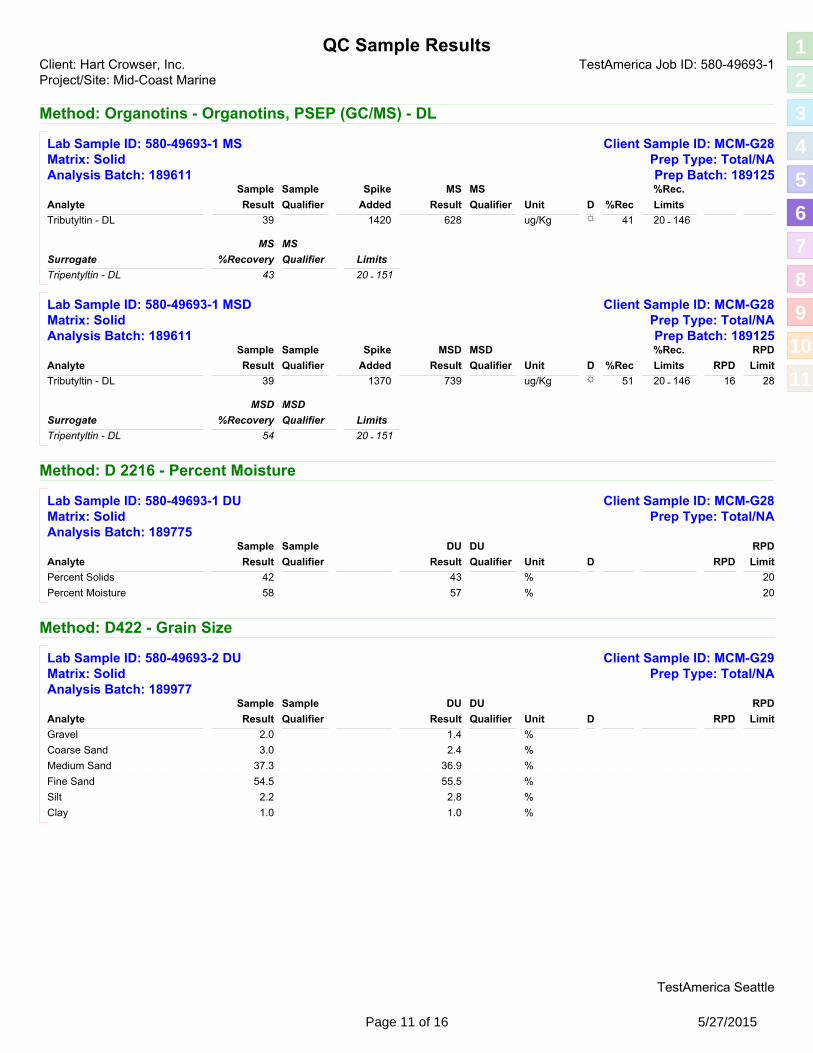
QC Sample ResultsTestAmerica Job ID: 580-49693-1Client: Hart Crowser, Inc.
Project/Site: Mid-Coast Marine
Method: Organotins - Organotins, PSEP (GC/MS) - DL
Client Sample ID: MCM-G28Lab Sample ID: 580-49693-1 MSMatrix: Solid Prep Type: Total/NAAnalysis Batch: 189611 Prep Batch: 189125
Tributyltin - DL 39 1420 628 ug/Kg 41 20 - 146☼
Analyte
MS MS
DUnitResult Qualifier %Rec
Spike
Added
Sample
Result
Sample
Qualifier
%Rec.
Limits
Tripentyltin - DL 20 - 151
Surrogate
43
MS MS
Qualifier Limits%Recovery
Client Sample ID: MCM-G28Lab Sample ID: 580-49693-1 MSDMatrix: Solid Prep Type: Total/NAAnalysis Batch: 189611 Prep Batch: 189125
Tributyltin - DL 39 1370 739 ug/Kg 51 20 - 146 16 28☼
Analyte
MSD MSD
DUnitResult Qualifier %Rec
Spike
Added
Sample
Result
Sample
Qualifier
%Rec.
Limits LimitRPD
RPD
Tripentyltin - DL 20 - 151
Surrogate
54
MSD MSD
Qualifier Limits%Recovery
Method: D 2216 - Percent Moisture
Client Sample ID: MCM-G28Lab Sample ID: 580-49693-1 DUMatrix: Solid Prep Type: Total/NAAnalysis Batch: 189775
Percent Solids 42 43 % 20
Analyte
DU DU
DUnitResult Qualifier
Sample
Result
Sample
Qualifier LimitRPD
RPD
Percent Moisture 58 57 % 20
Method: D422 - Grain Size
Client Sample ID: MCM-G29Lab Sample ID: 580-49693-2 DUMatrix: Solid Prep Type: Total/NAAnalysis Batch: 189977
Gravel 2.0 1.4 %
Analyte
DU DU
DUnitResult Qualifier
Sample
Result
Sample
Qualifier LimitRPD
RPD
Coarse Sand 3.0 2.4 %
Medium Sand 37.3 36.9 %
Fine Sand 54.5 55.5 %
Silt 2.2 2.8 %
Clay 1.0 1.0 %
TestAmerica Seattle
Page 11 of 16 5/27/2015
1
2
3
4
5
6
7
8
9
10
11
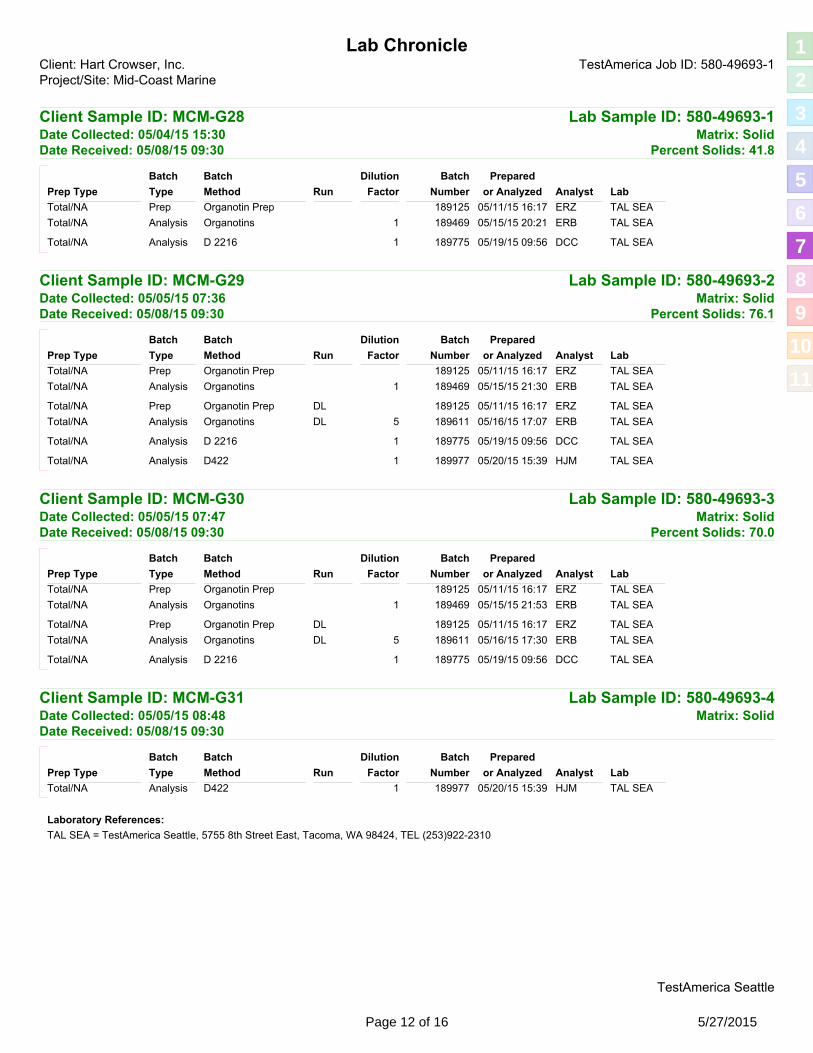
Lab ChronicleClient: Hart Crowser, Inc. TestAmerica Job ID: 580-49693-1Project/Site: Mid-Coast Marine
Client Sample ID: MCM-G28 Lab Sample ID: 580-49693-1Matrix: SolidDate Collected: 05/04/15 15:30
Percent Solids: 41.8Date Received: 05/08/15 09:30
Prep Organotin Prep 05/11/15 16:17 ERZ189125 TAL SEA
Type
Batch Batch
MethodPrep Type LabAnalystRun
Prepared
or Analyzed
Batch
Number
Dilution
Factor
Total/NA
Analysis Organotins 1 189469 05/15/15 20:21 ERB TAL SEATotal/NA
Analysis D 2216 1 189775 05/19/15 09:56 DCC TAL SEATotal/NA
Client Sample ID: MCM-G29 Lab Sample ID: 580-49693-2Matrix: SolidDate Collected: 05/05/15 07:36
Percent Solids: 76.1Date Received: 05/08/15 09:30
Prep Organotin Prep 05/11/15 16:17 ERZ189125 TAL SEA
Type
Batch Batch
MethodPrep Type LabAnalystRun
Prepared
or Analyzed
Batch
Number
Dilution
Factor
Total/NA
Analysis Organotins 1 189469 05/15/15 21:30 ERB TAL SEATotal/NA
Prep Organotin Prep DL 189125 05/11/15 16:17 ERZ TAL SEATotal/NA
Analysis Organotins DL 5 189611 05/16/15 17:07 ERB TAL SEATotal/NA
Analysis D 2216 1 189775 05/19/15 09:56 DCC TAL SEATotal/NA
Analysis D422 1 189977 05/20/15 15:39 HJM TAL SEATotal/NA
Client Sample ID: MCM-G30 Lab Sample ID: 580-49693-3Matrix: SolidDate Collected: 05/05/15 07:47
Percent Solids: 70.0Date Received: 05/08/15 09:30
Prep Organotin Prep 05/11/15 16:17 ERZ189125 TAL SEA
Type
Batch Batch
MethodPrep Type LabAnalystRun
Prepared
or Analyzed
Batch
Number
Dilution
Factor
Total/NA
Analysis Organotins 1 189469 05/15/15 21:53 ERB TAL SEATotal/NA
Prep Organotin Prep DL 189125 05/11/15 16:17 ERZ TAL SEATotal/NA
Analysis Organotins DL 5 189611 05/16/15 17:30 ERB TAL SEATotal/NA
Analysis D 2216 1 189775 05/19/15 09:56 DCC TAL SEATotal/NA
Client Sample ID: MCM-G31 Lab Sample ID: 580-49693-4Matrix: SolidDate Collected: 05/05/15 08:48
Date Received: 05/08/15 09:30
Analysis D422 05/20/15 15:39 HJM1 189977 TAL SEA
Type
Batch Batch
MethodPrep Type LabAnalystRun
Prepared
or Analyzed
Batch
Number
Dilution
Factor
Total/NA
Laboratory References:
TAL SEA = TestAmerica Seattle, 5755 8th Street East, Tacoma, WA 98424, TEL (253)922-2310
TestAmerica Seattle
Page 12 of 16 5/27/2015
1
2
3
4
5
6
7
8
9
10
11
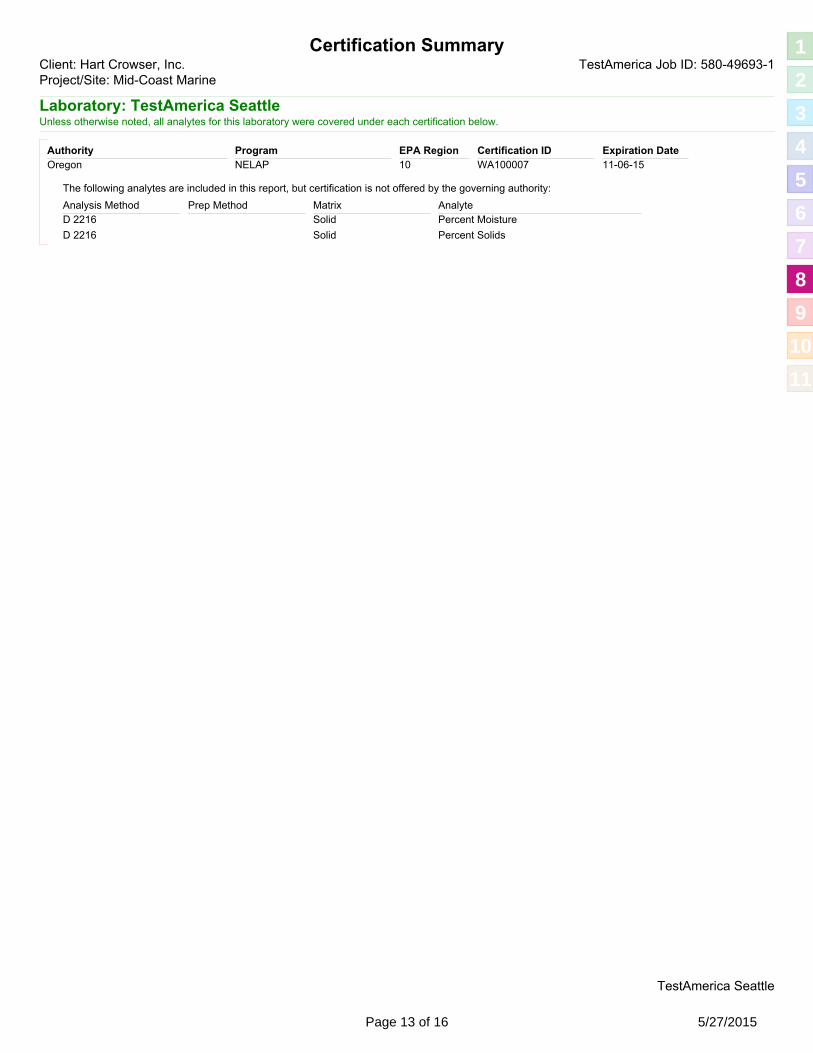
Certification SummaryClient: Hart Crowser, Inc. TestAmerica Job ID: 580-49693-1Project/Site: Mid-Coast Marine
Laboratory: TestAmerica SeattleUnless otherwise noted, all analytes for this laboratory were covered under each certification below.
Authority Program EPA Region Certification ID Expiration Date
Oregon WA10000710NELAP 11-06-15
Analysis Method Prep Method Matrix Analyte
The following analytes are included in this report, but certification is not offered by the governing authority:
D 2216 Solid Percent Moisture
D 2216 Solid Percent Solids
TestAmerica Seattle
Page 13 of 16 5/27/2015
1
2
3
4
5
6
7
8
9
10
11
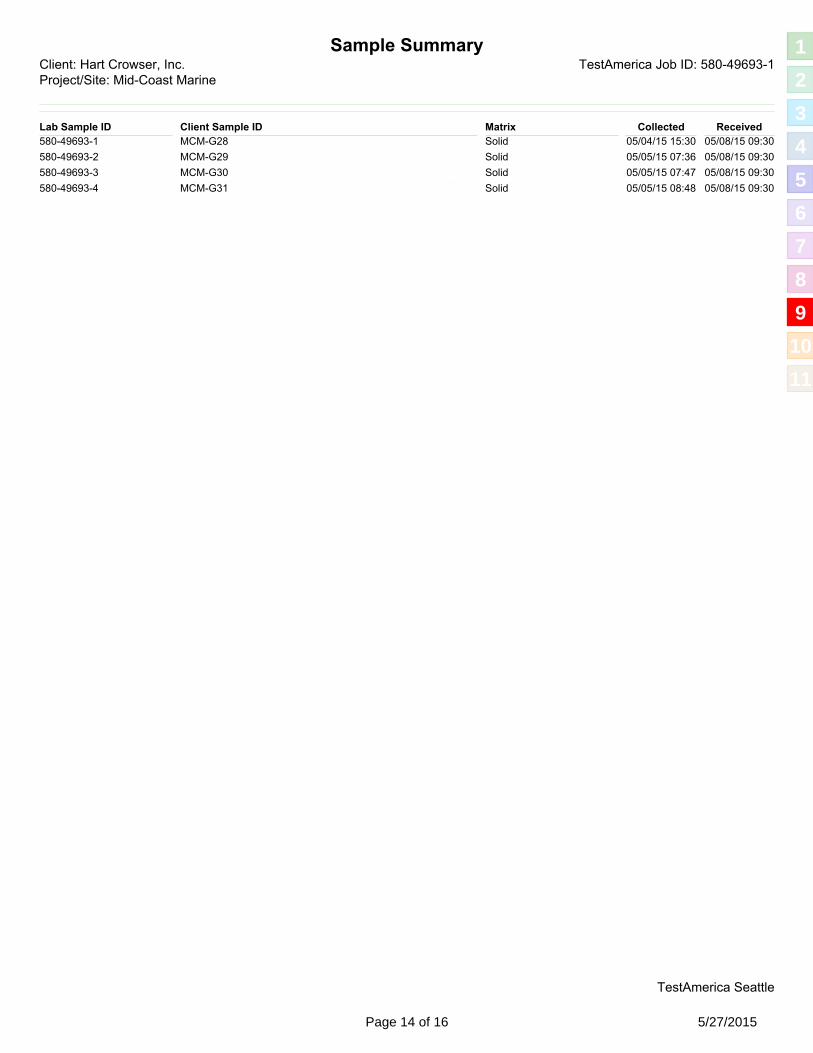
Sample SummaryTestAmerica Job ID: 580-49693-1Client: Hart Crowser, Inc.
Project/Site: Mid-Coast Marine
Lab Sample ID Client Sample ID ReceivedCollectedMatrix
580-49693-1 MCM-G28 Solid 05/04/15 15:30 05/08/15 09:30
580-49693-2 MCM-G29 Solid 05/05/15 07:36 05/08/15 09:30
580-49693-3 MCM-G30 Solid 05/05/15 07:47 05/08/15 09:30
580-49693-4 MCM-G31 Solid 05/05/15 08:48 05/08/15 09:30
TestAmerica Seattle
Page 14 of 16 5/27/2015
1
2
3
4
5
6
7
8
9
10
11
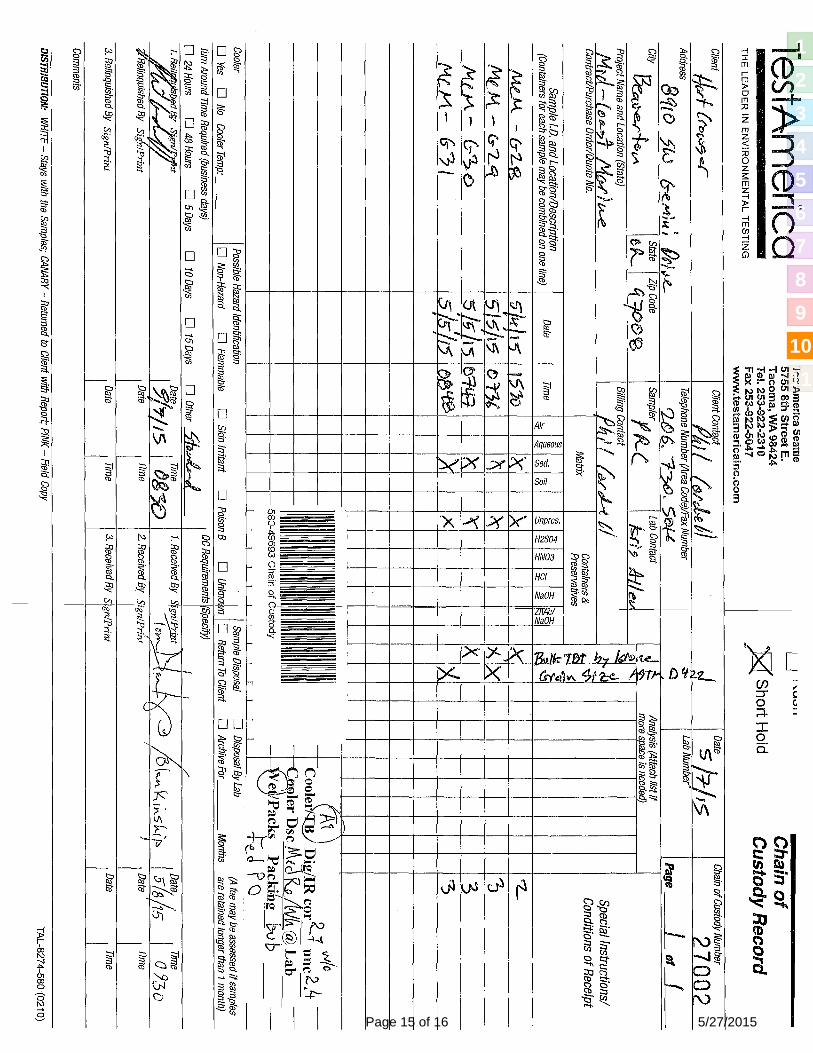
Page 15 of 16 5/27/2015
1
2
3
4
5
6
7
8
9
10
11
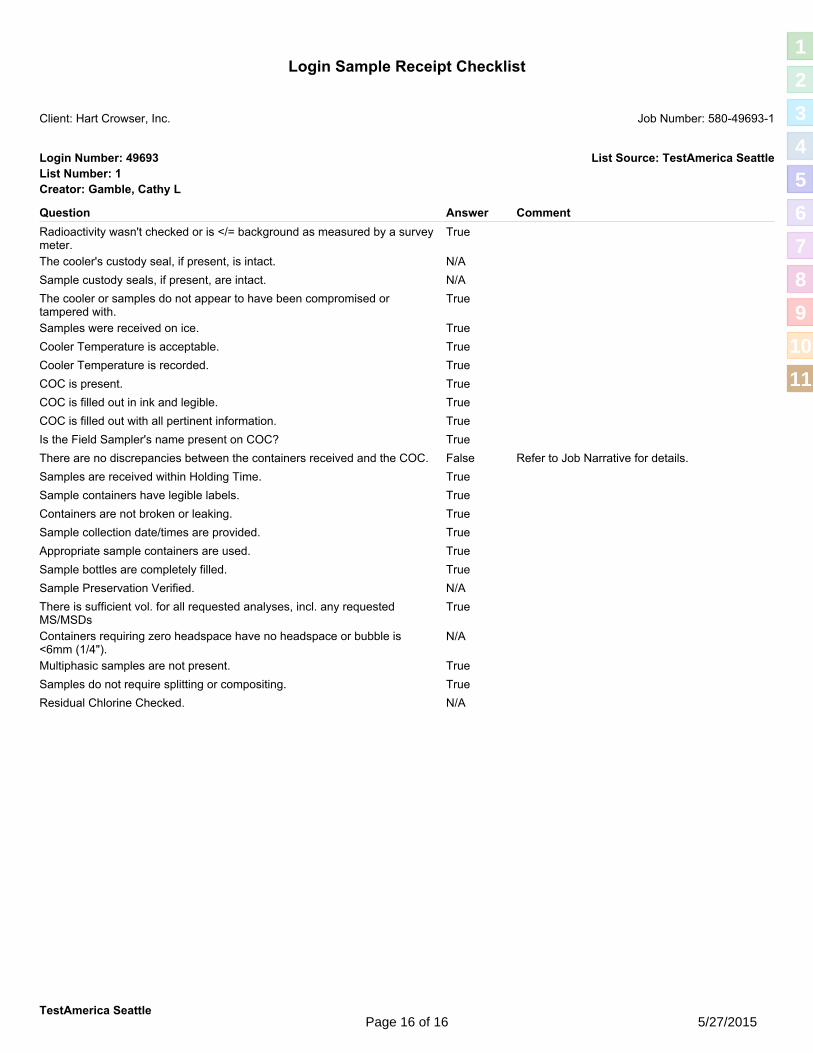
Login Sample Receipt Checklist
Client: Hart Crowser, Inc. Job Number: 580-49693-1
Login Number: 49693
Question Answer Comment
Creator: Gamble, Cathy L
List Source: TestAmerica Seattle
List Number: 1
TrueRadioactivity wasn't checked or is </= background as measured by a survey meter.
N/AThe cooler's custody seal, if present, is intact.
N/ASample custody seals, if present, are intact.
TrueThe cooler or samples do not appear to have been compromised or tampered with.
TrueSamples were received on ice.
TrueCooler Temperature is acceptable.
TrueCooler Temperature is recorded.
TrueCOC is present.
TrueCOC is filled out in ink and legible.
TrueCOC is filled out with all pertinent information.
TrueIs the Field Sampler's name present on COC?
FalseThere are no discrepancies between the containers received and the COC. Refer to Job Narrative for details.
TrueSamples are received within Holding Time.
TrueSample containers have legible labels.
TrueContainers are not broken or leaking.
TrueSample collection date/times are provided.
TrueAppropriate sample containers are used.
TrueSample bottles are completely filled.
N/ASample Preservation Verified.
TrueThere is sufficient vol. for all requested analyses, incl. any requested MS/MSDs
N/AContainers requiring zero headspace have no headspace or bubble is <6mm (1/4").
TrueMultiphasic samples are not present.
TrueSamples do not require splitting or compositing.
N/AResidual Chlorine Checked.
TestAmerica SeattlePage 16 of 16 5/27/2015
1
2
3
4
5
6
7
8
9
10
11
15776‐00/Task 9 January 28, 2016
APPENDIX C Marine Sediment Bioassay Report (August 2015) and
Preliminary Neanthes Bioassay Results in Support of the Mid-Coast Marine Sediment Investigation (June 2015)
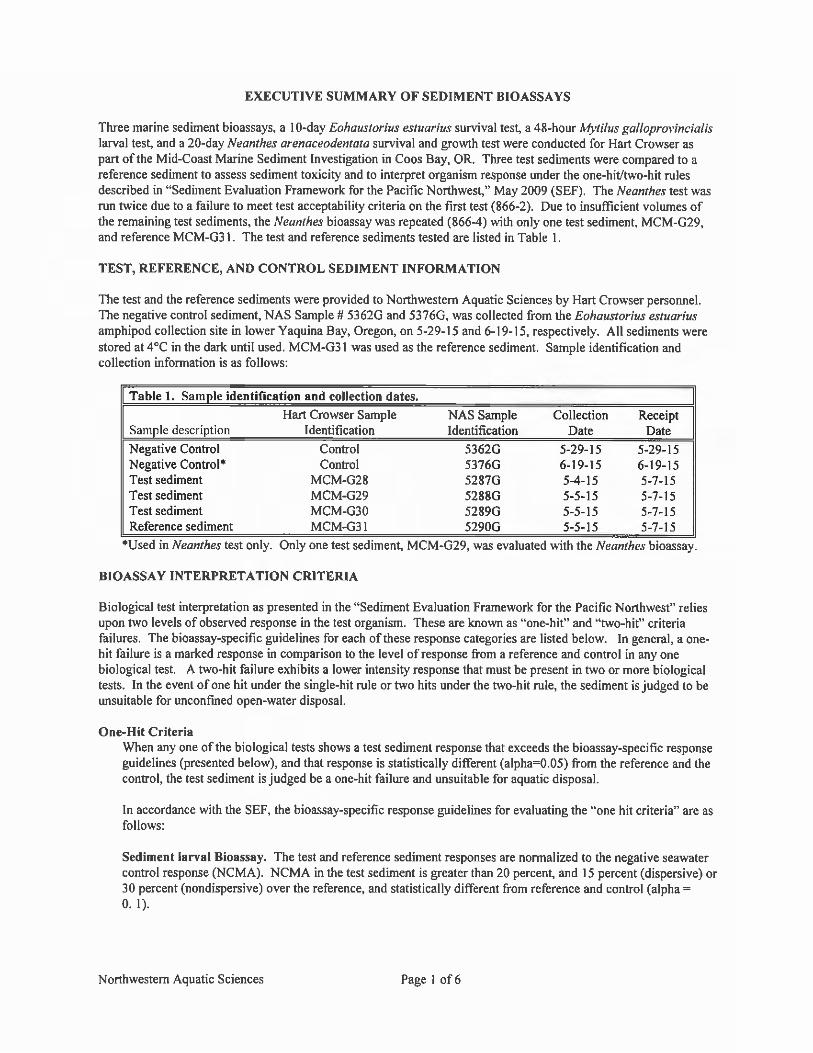
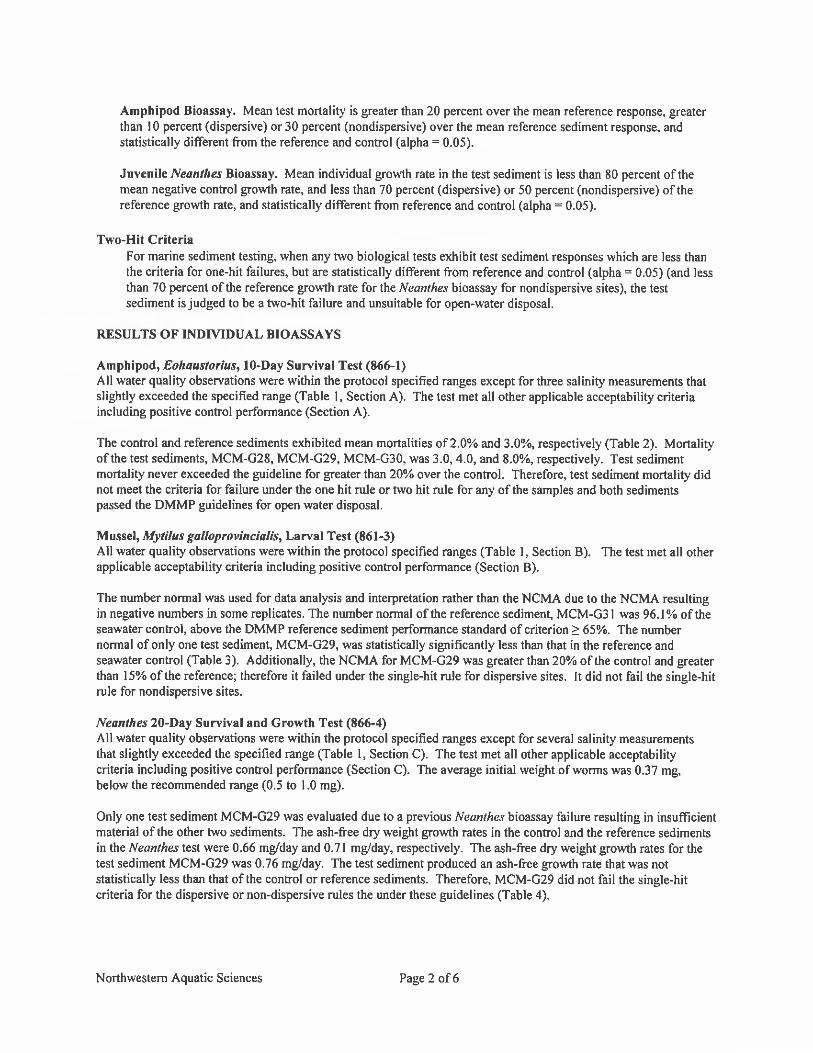
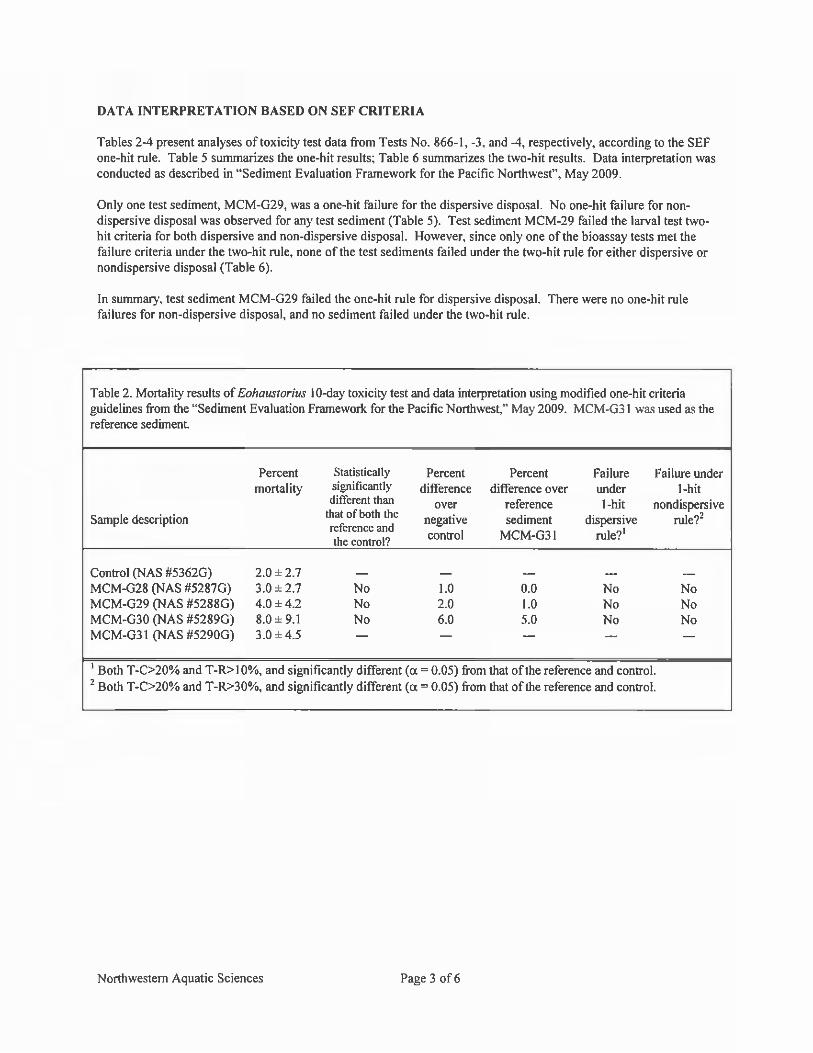
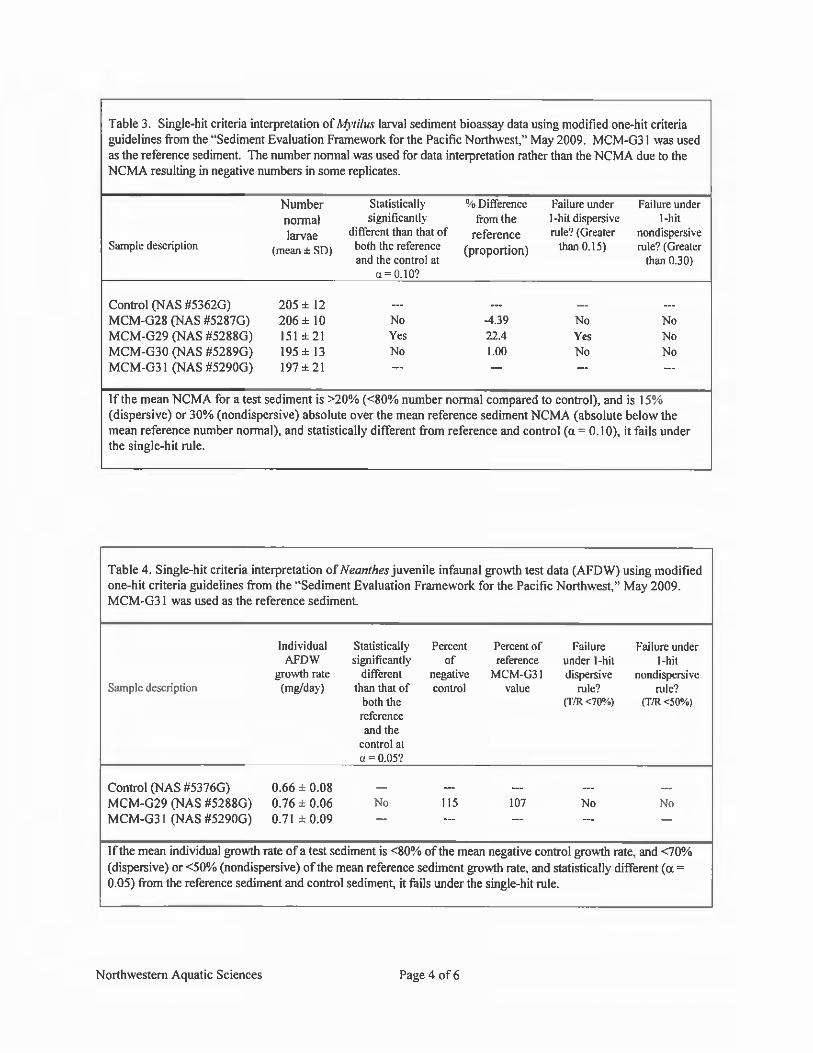
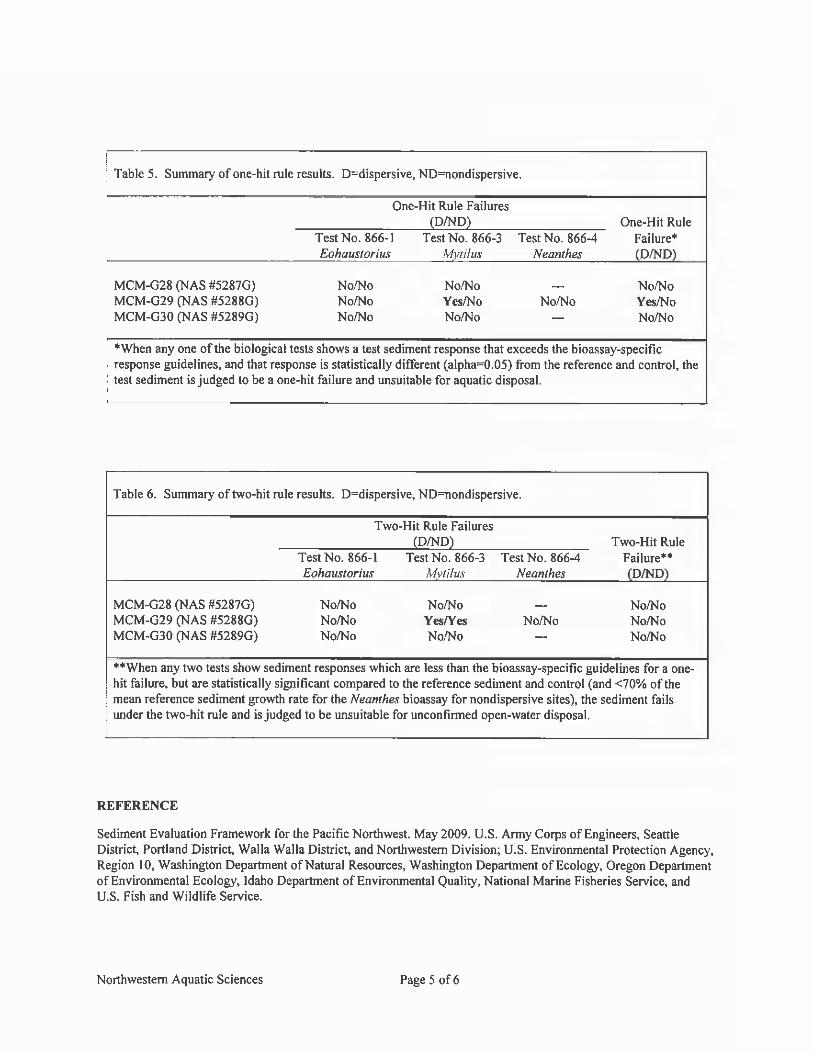
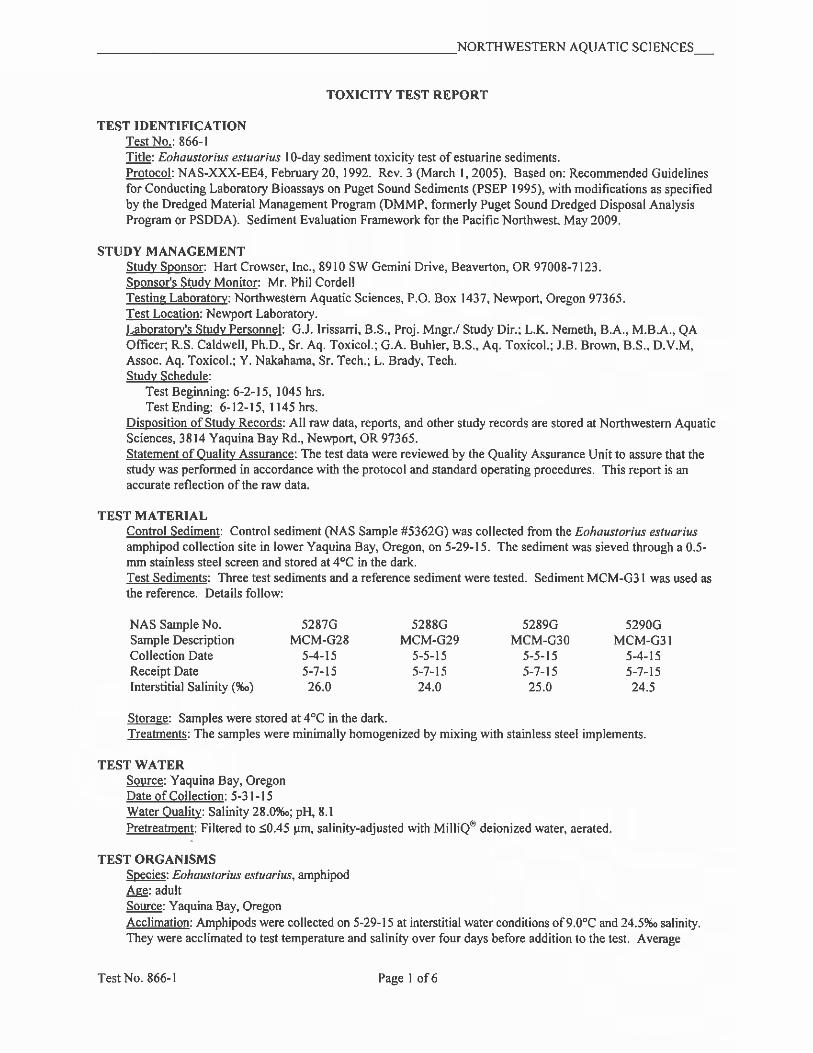
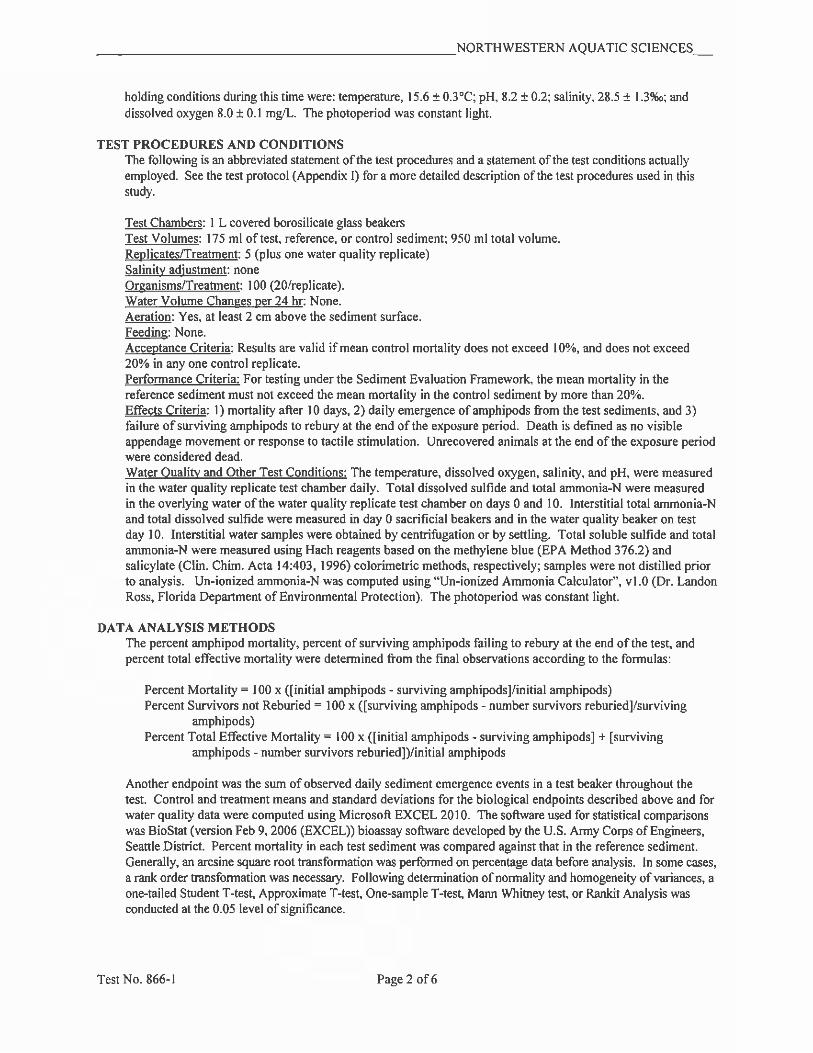
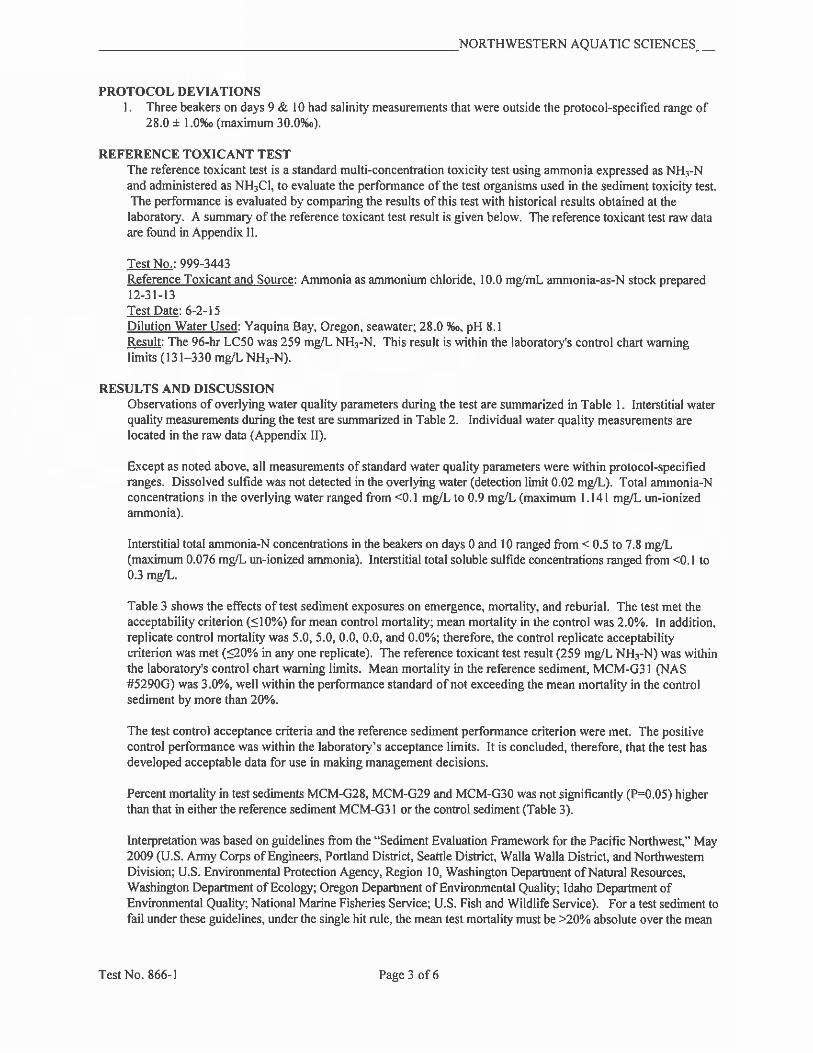
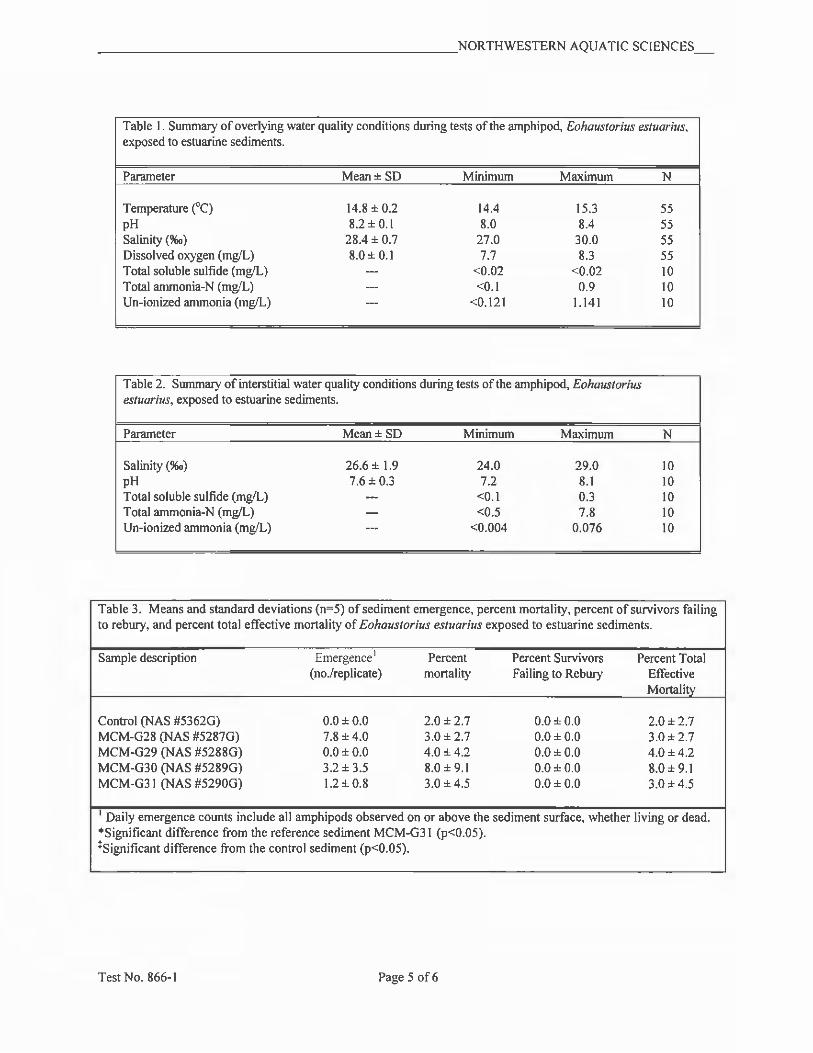
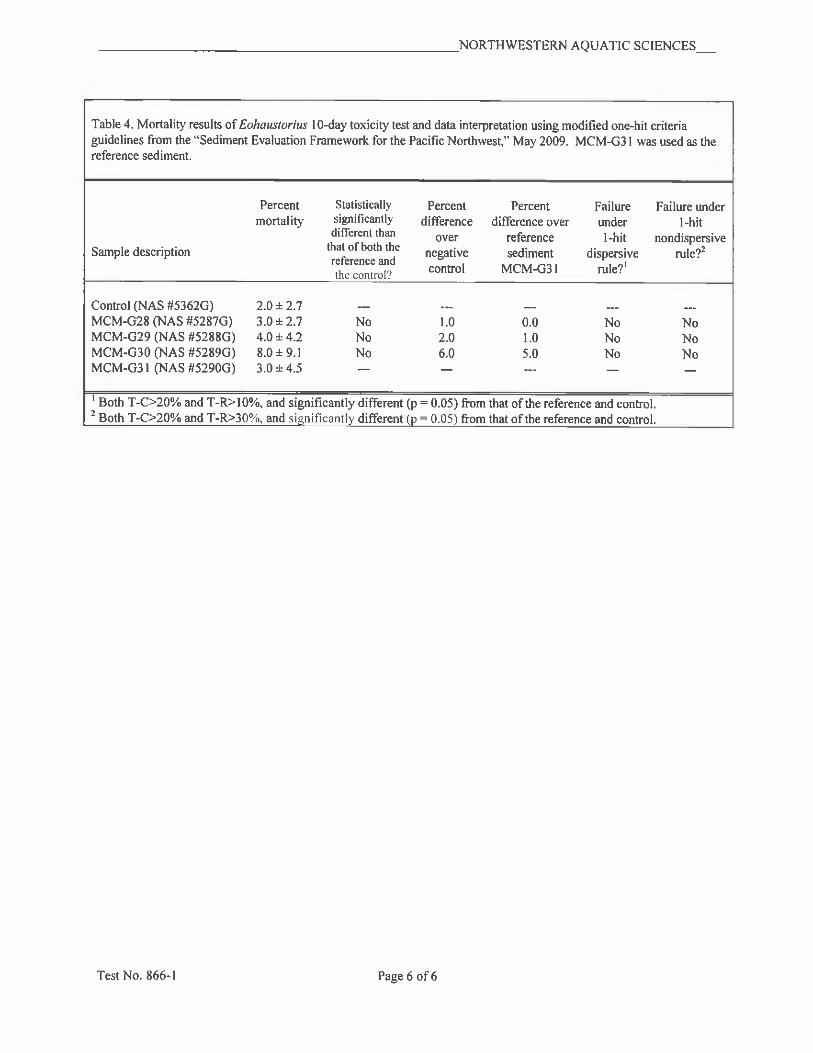
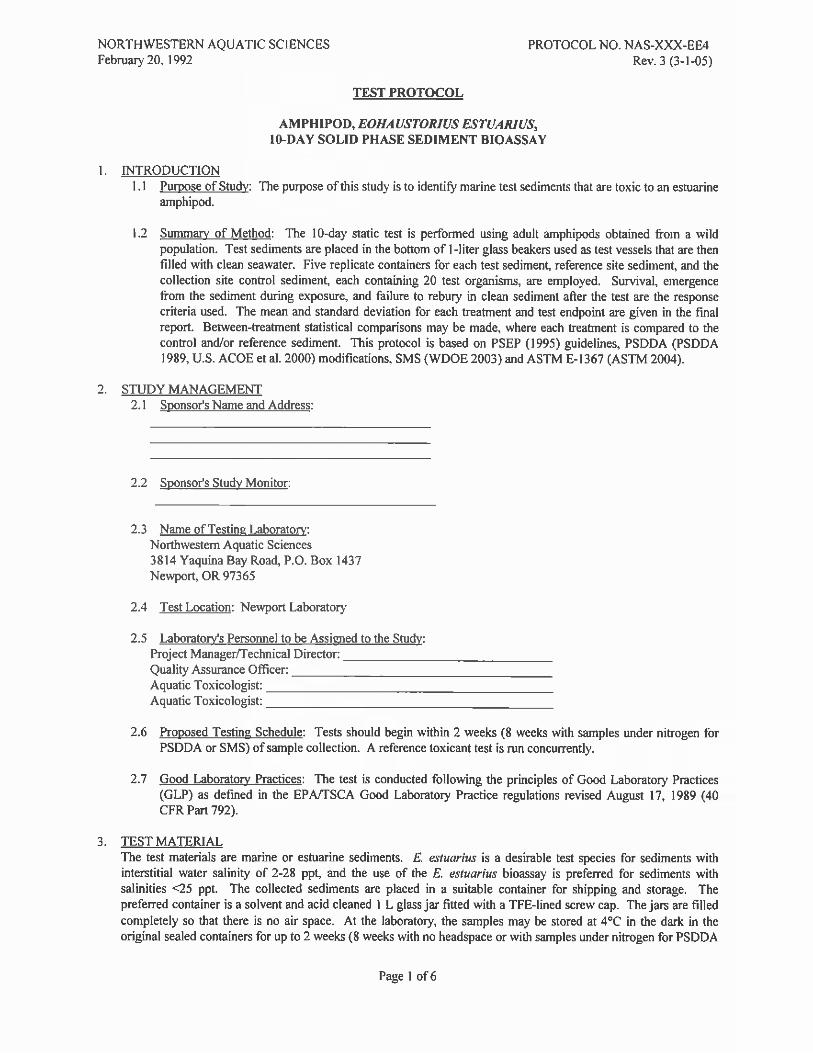
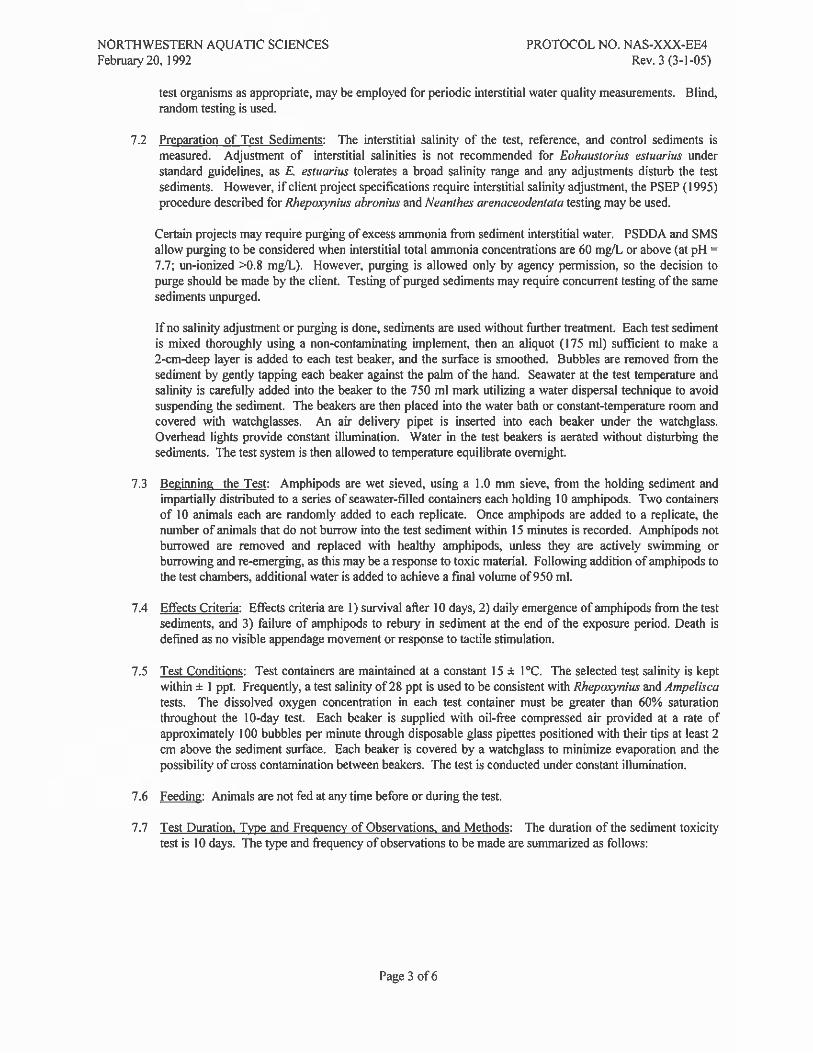
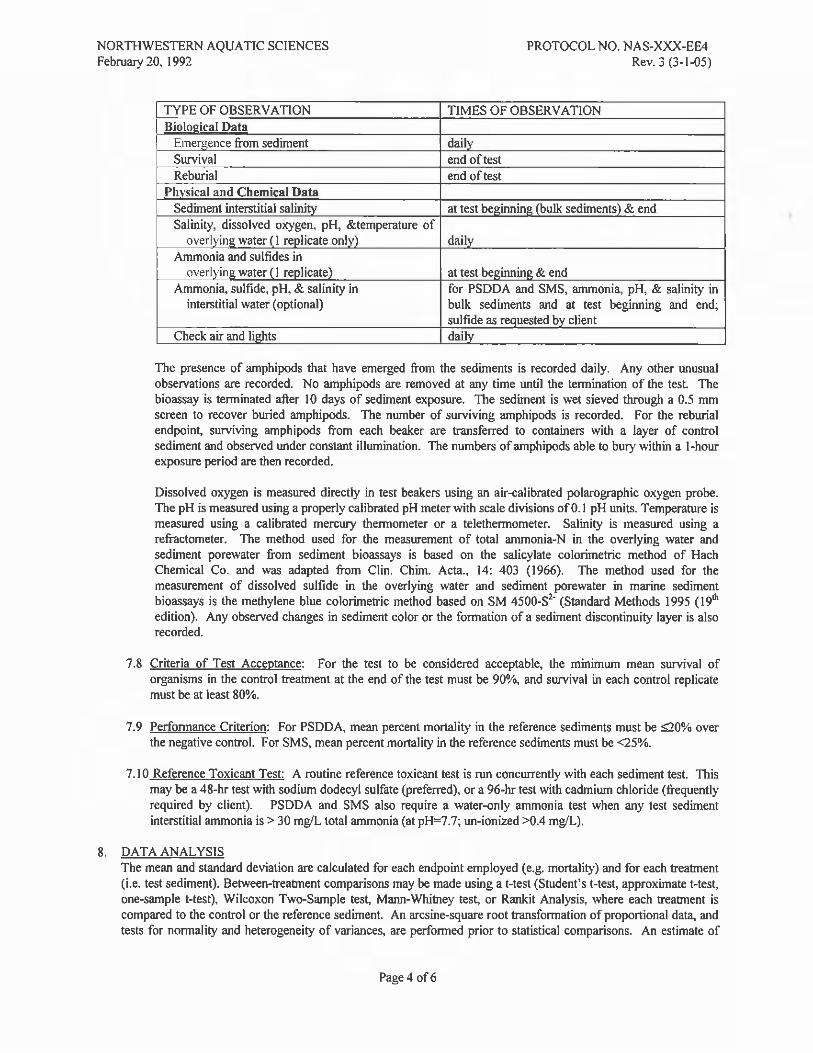
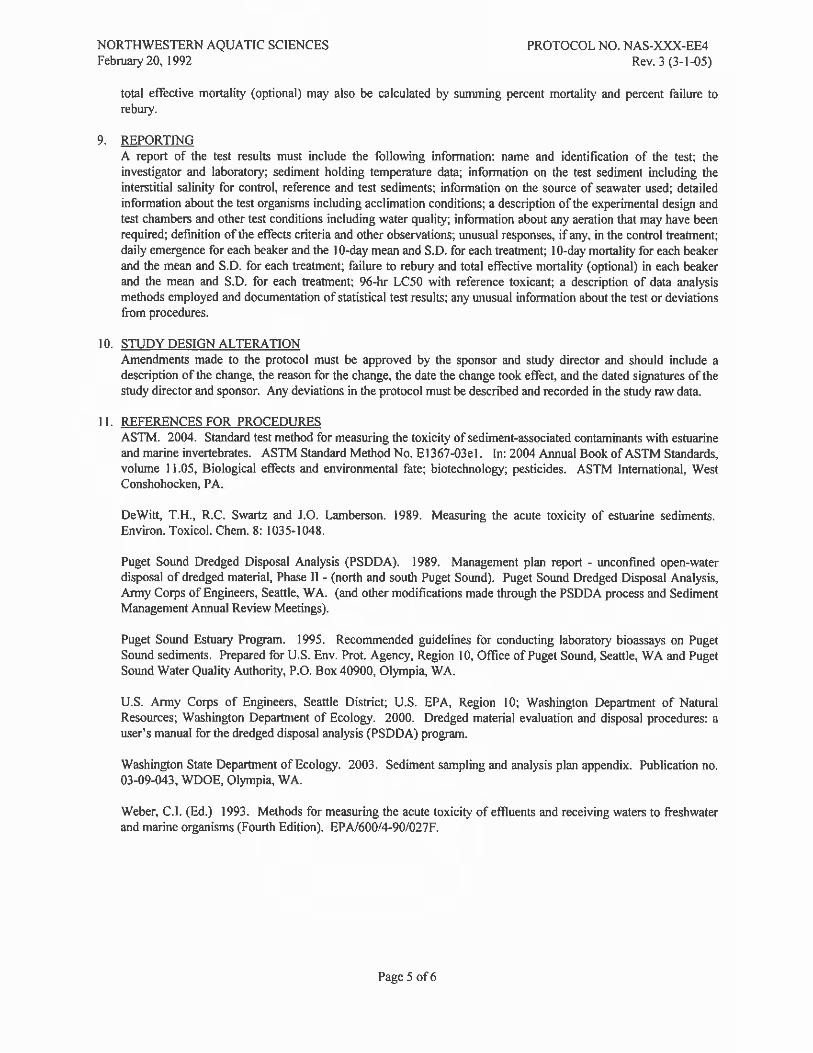
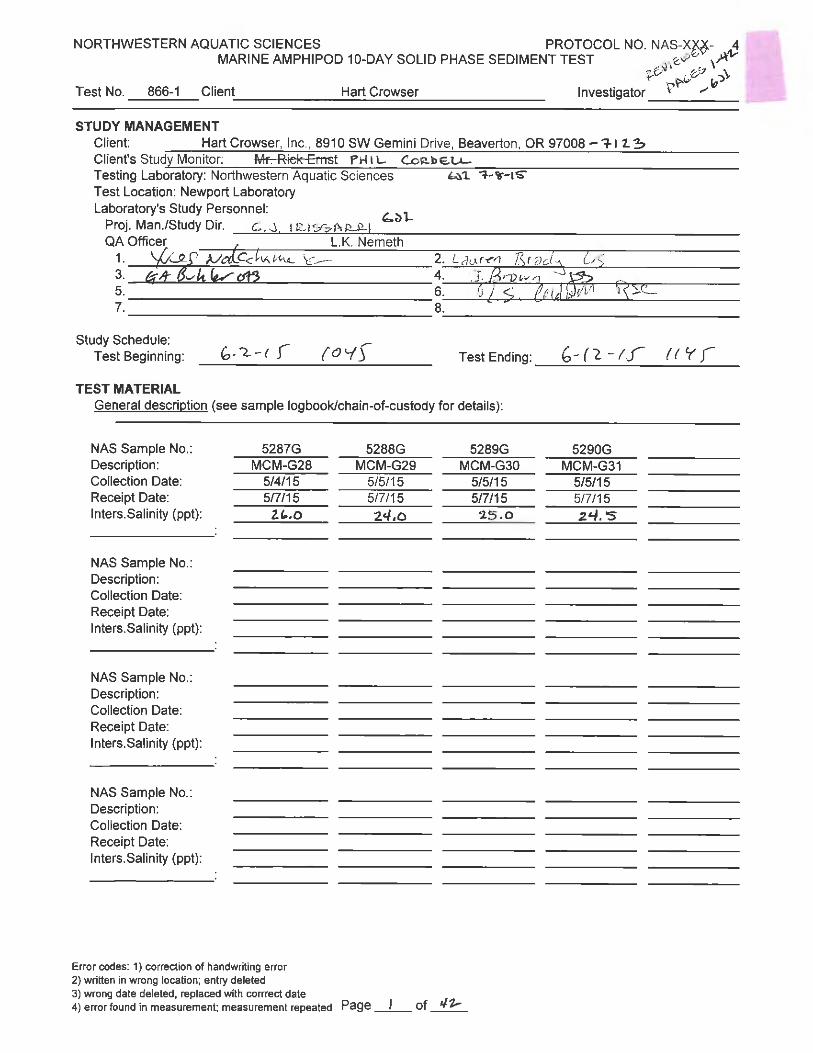
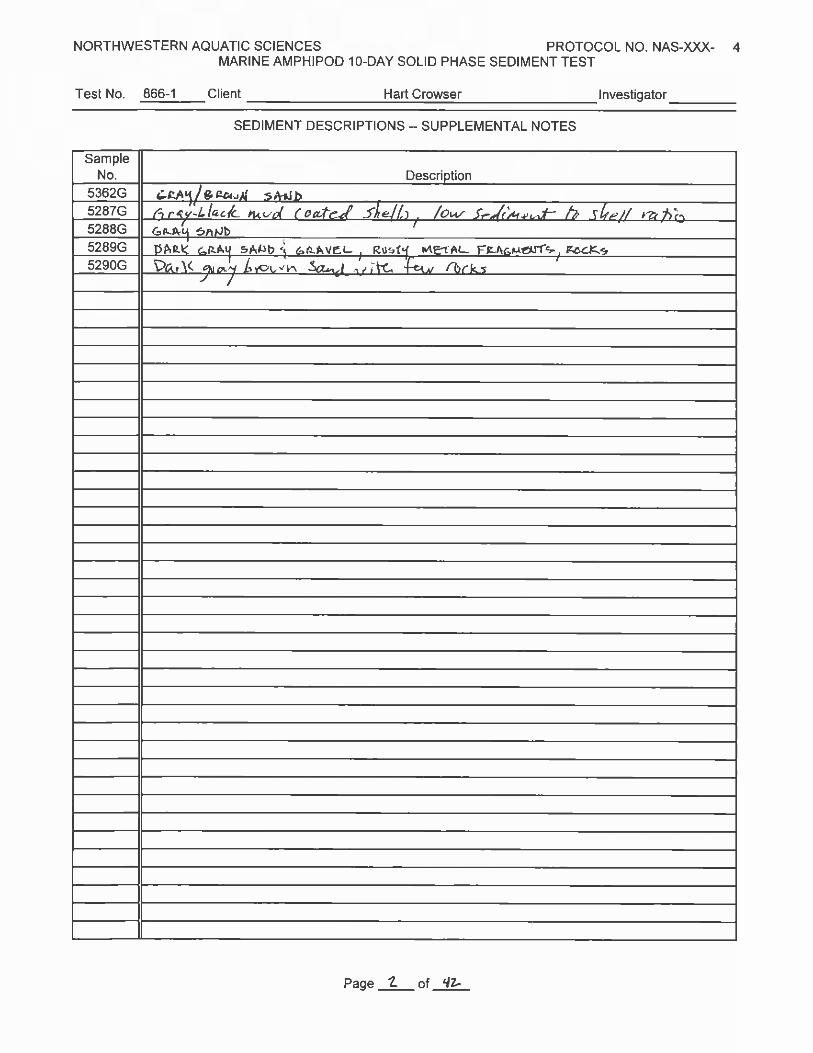
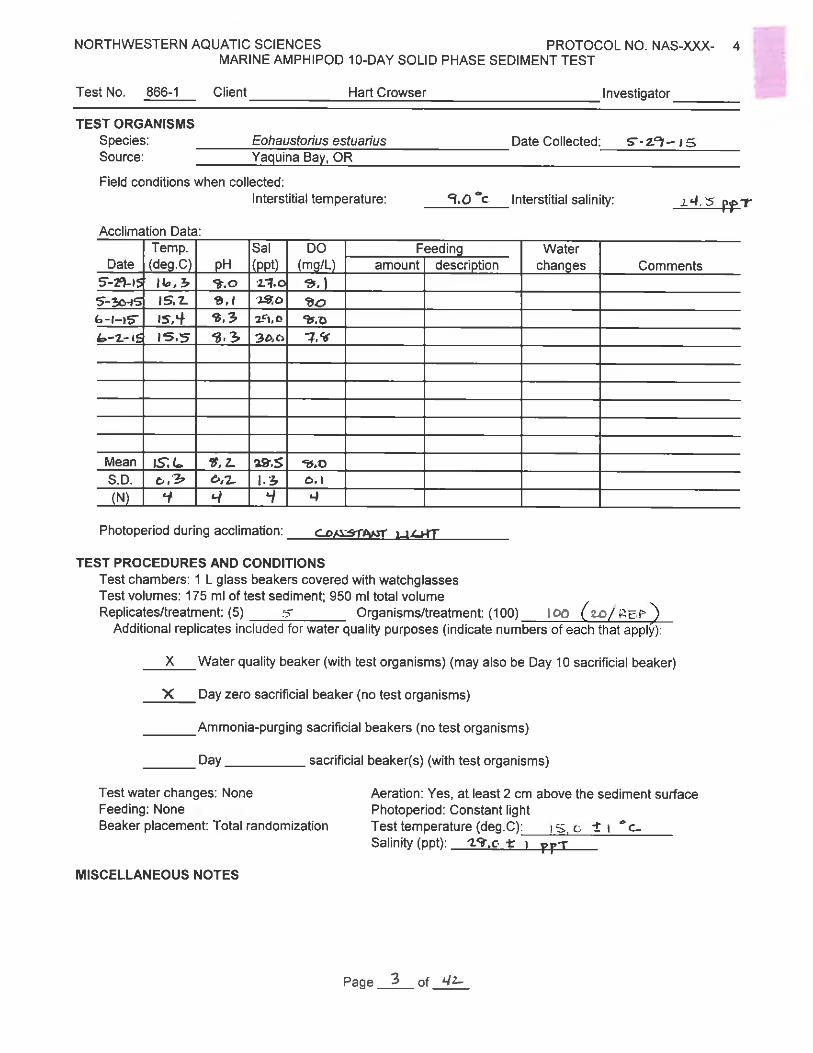
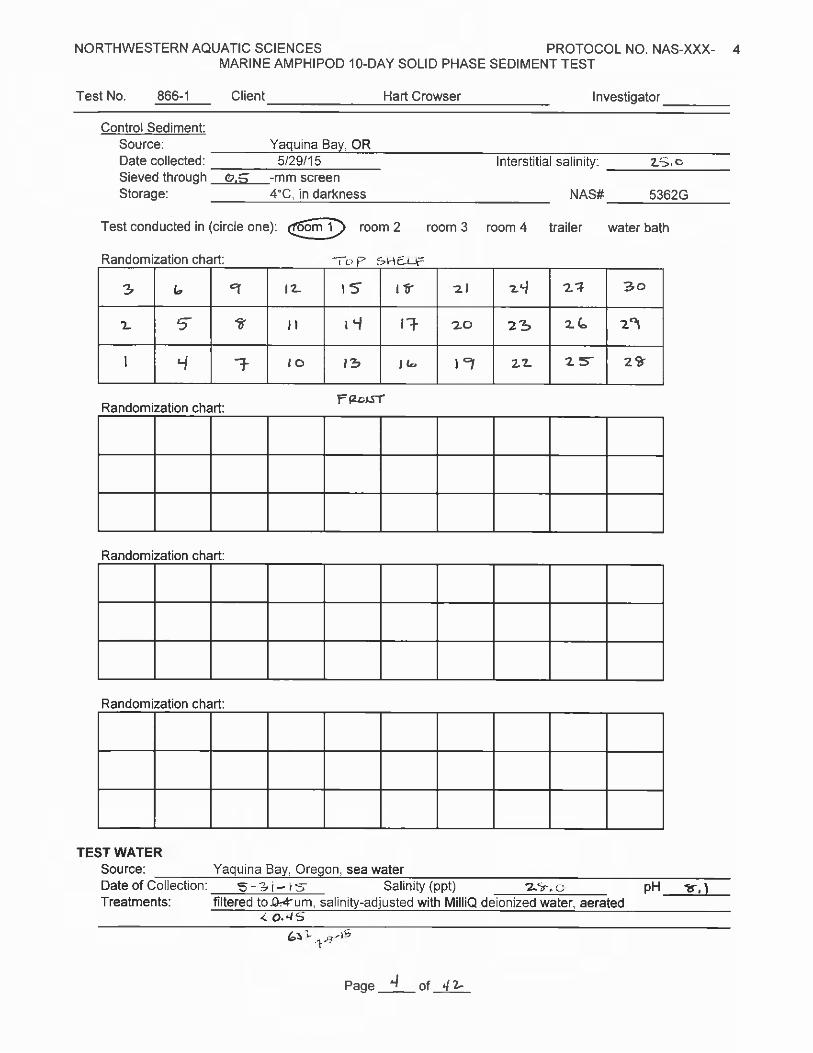
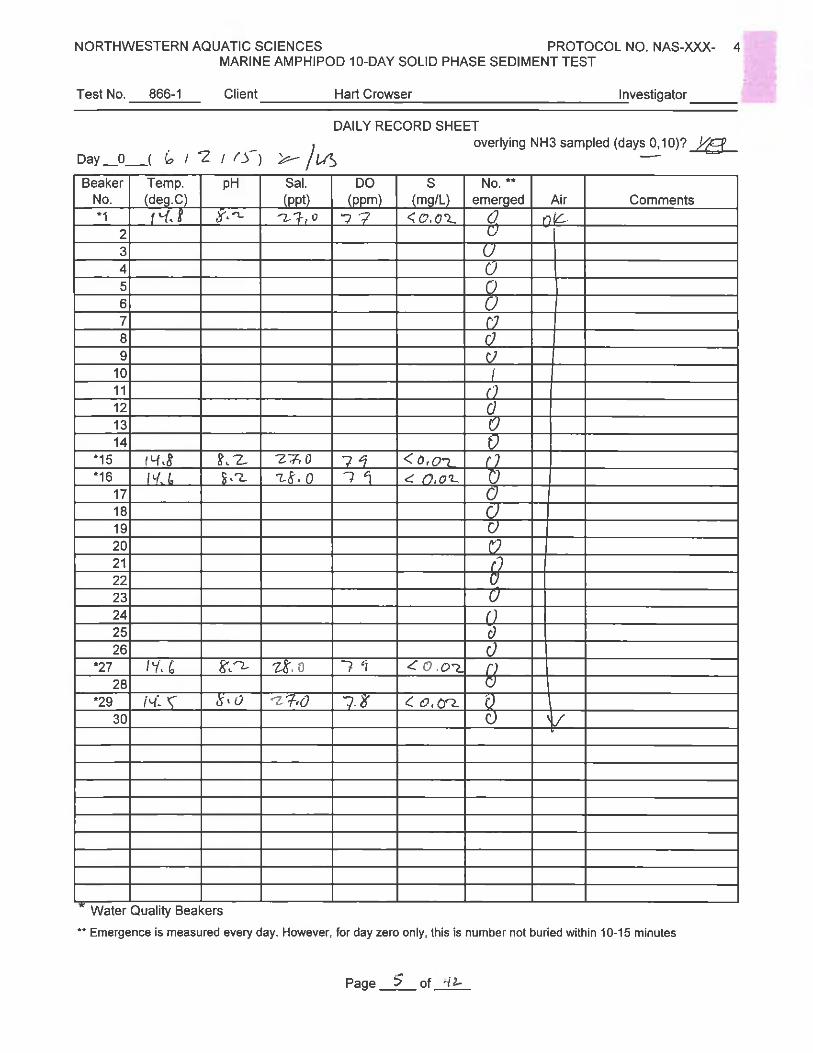

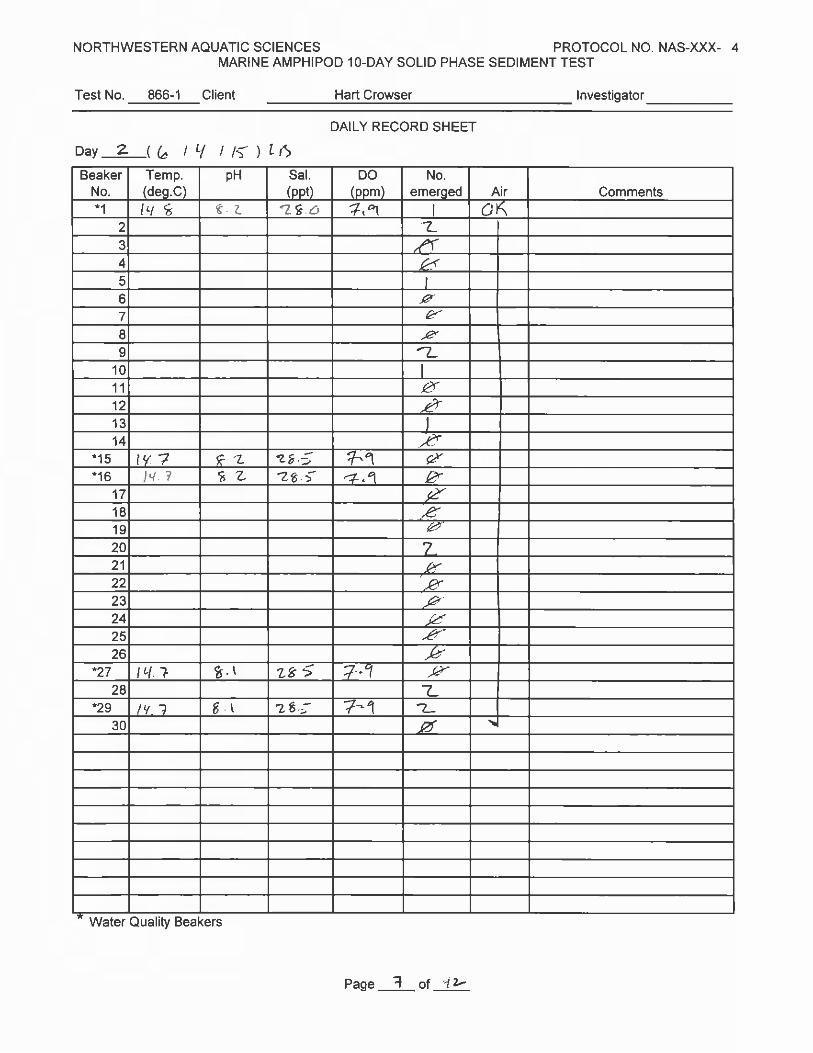
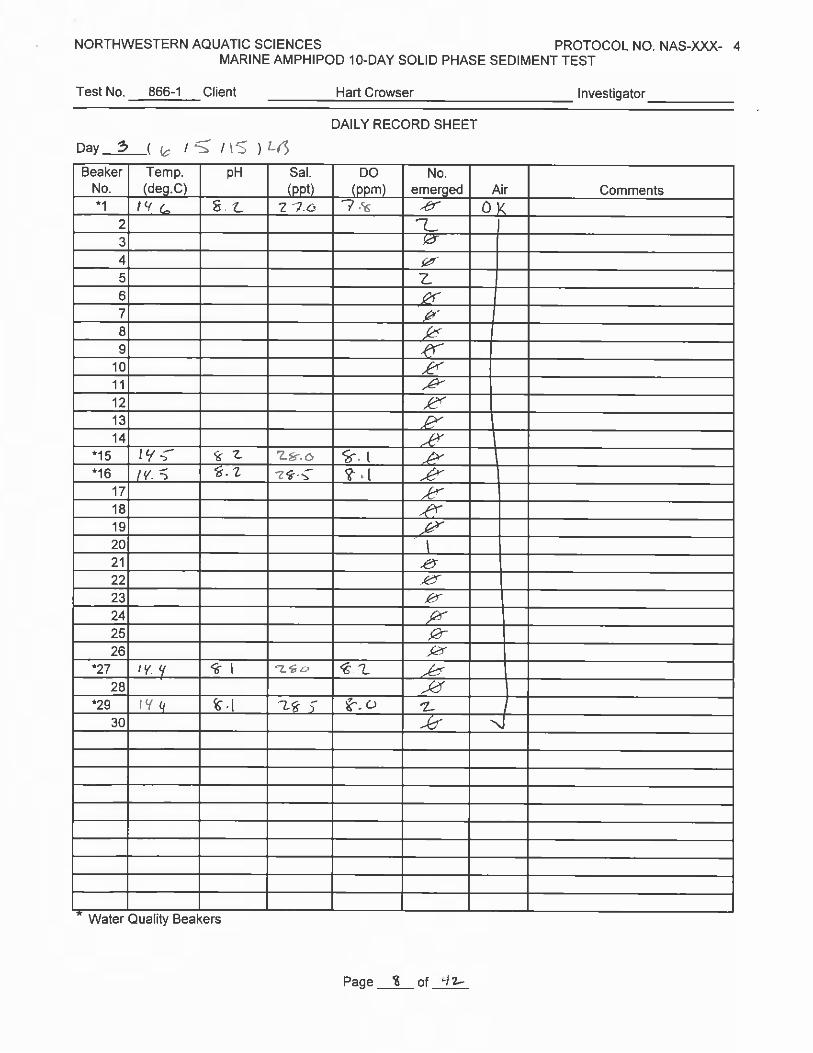
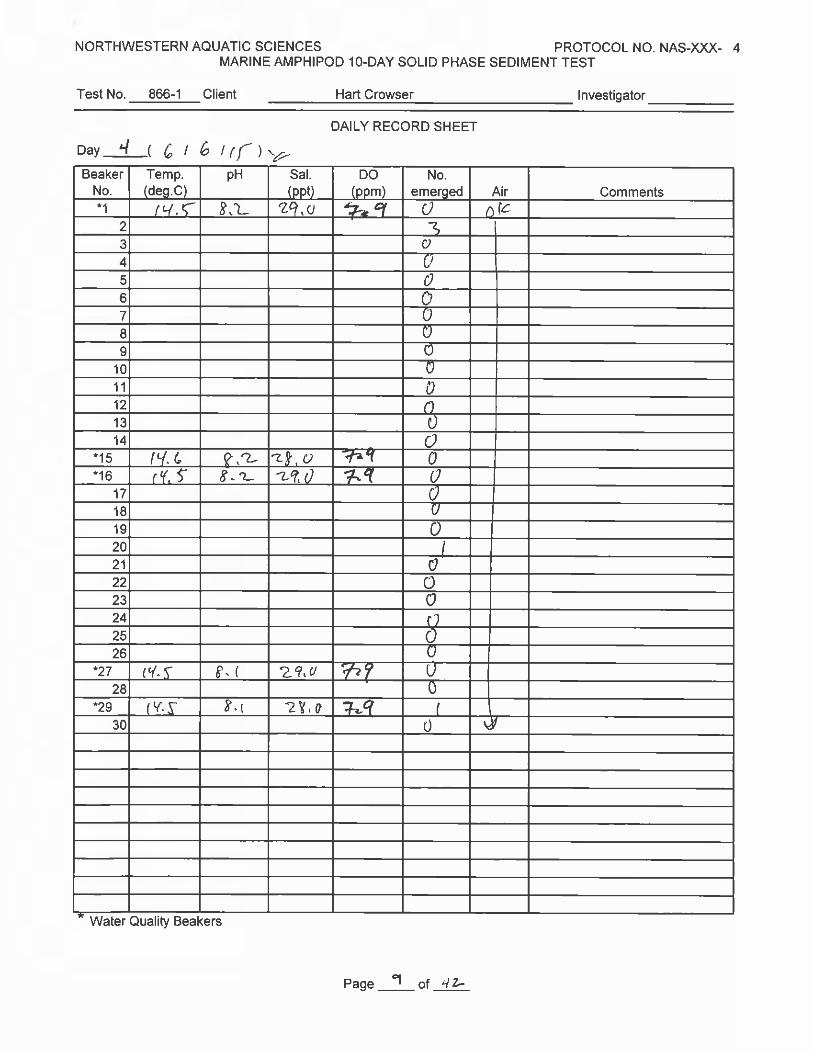
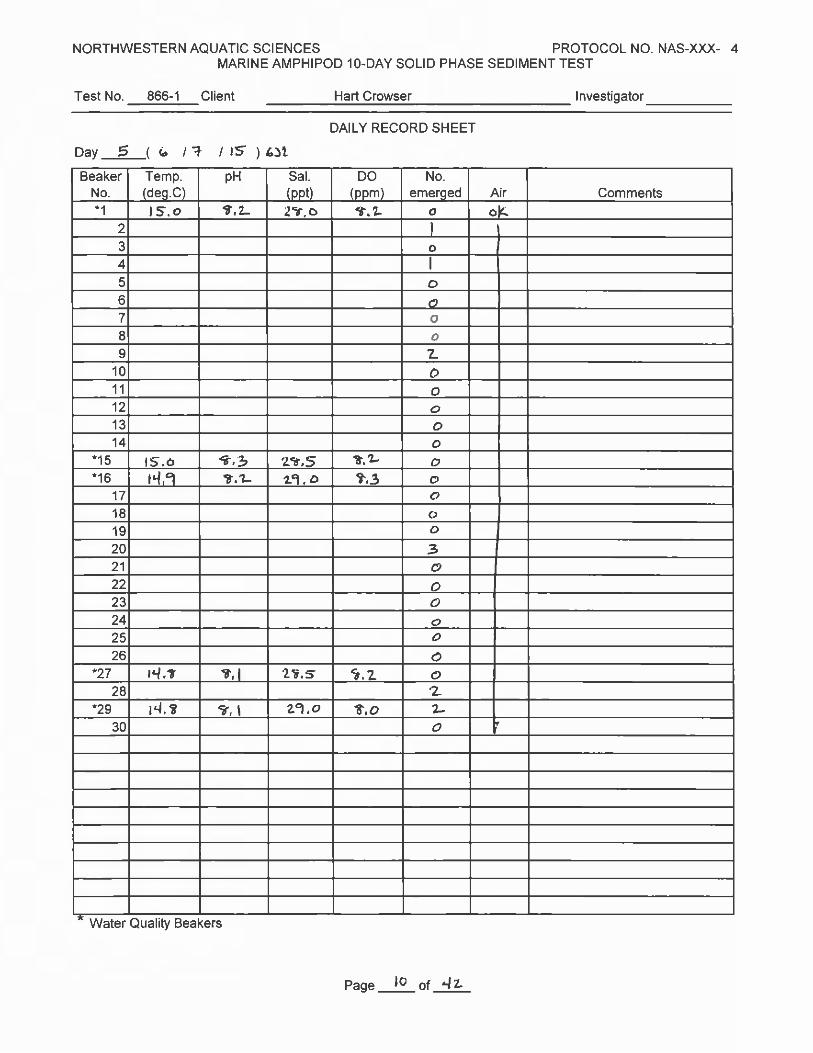
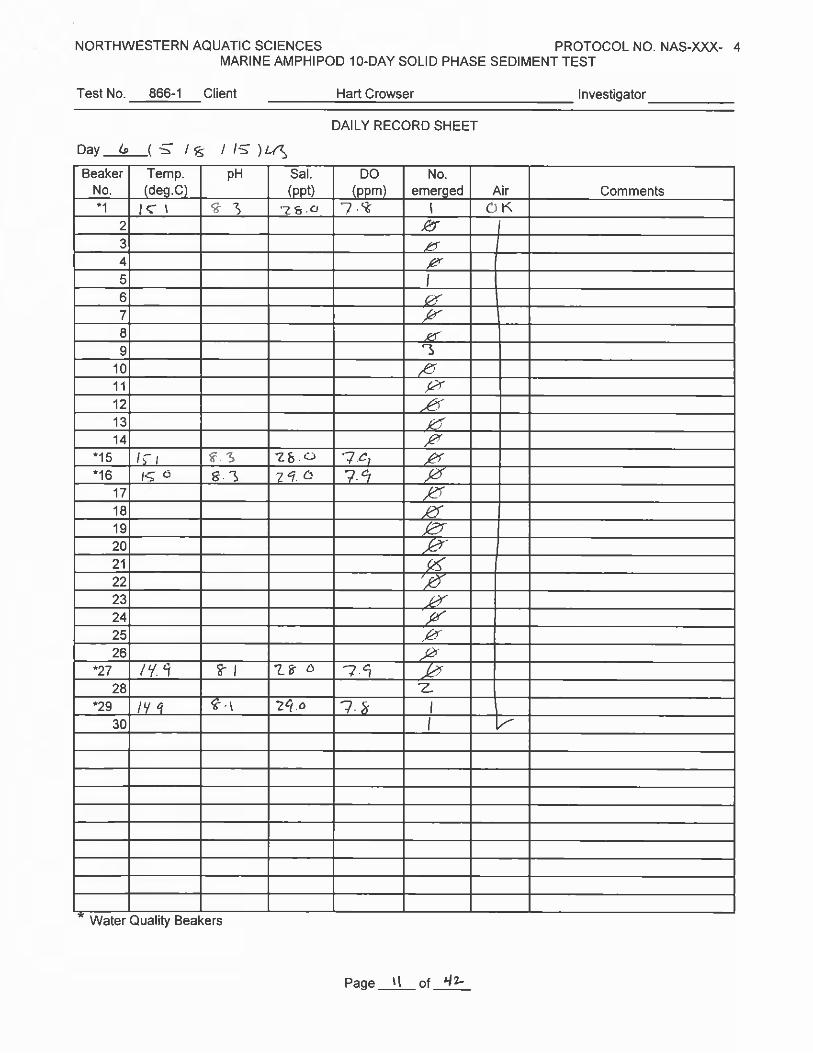
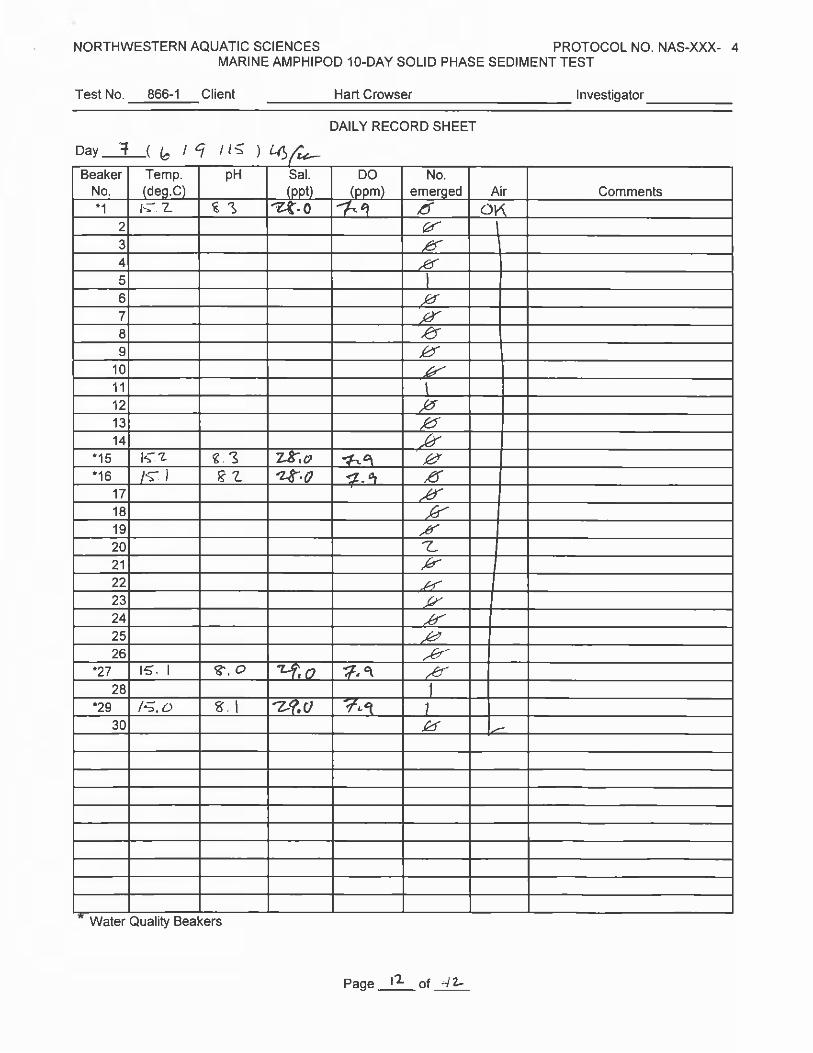
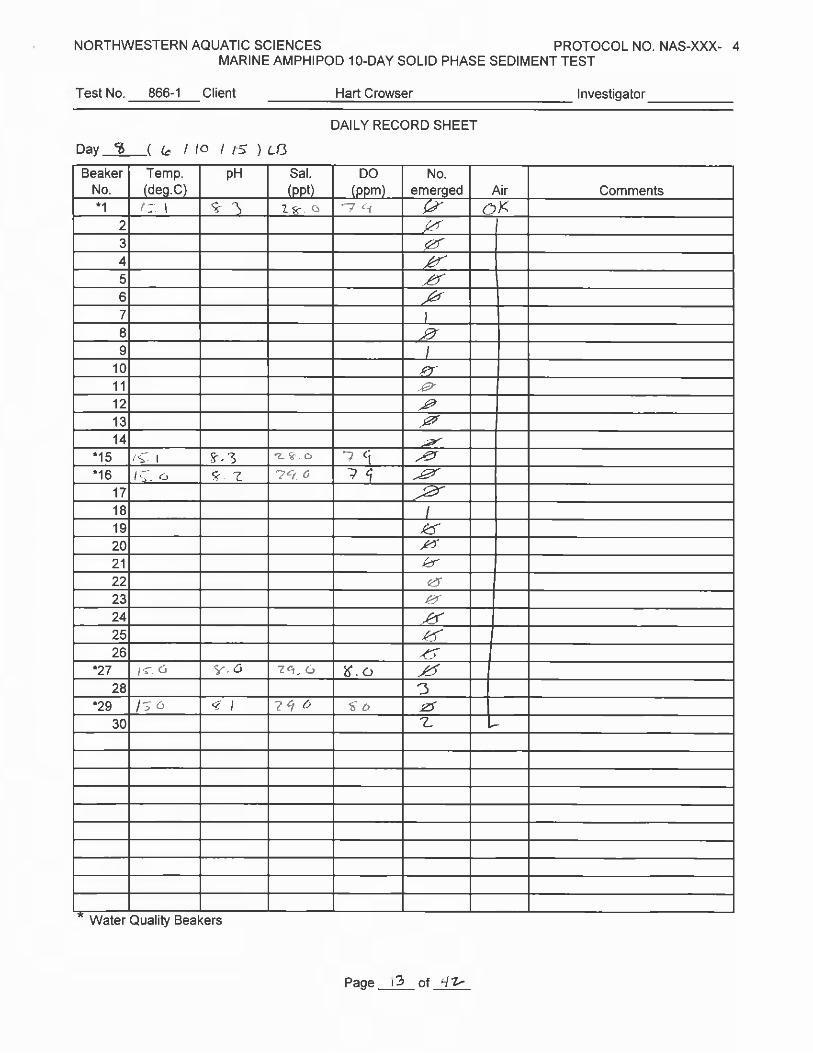
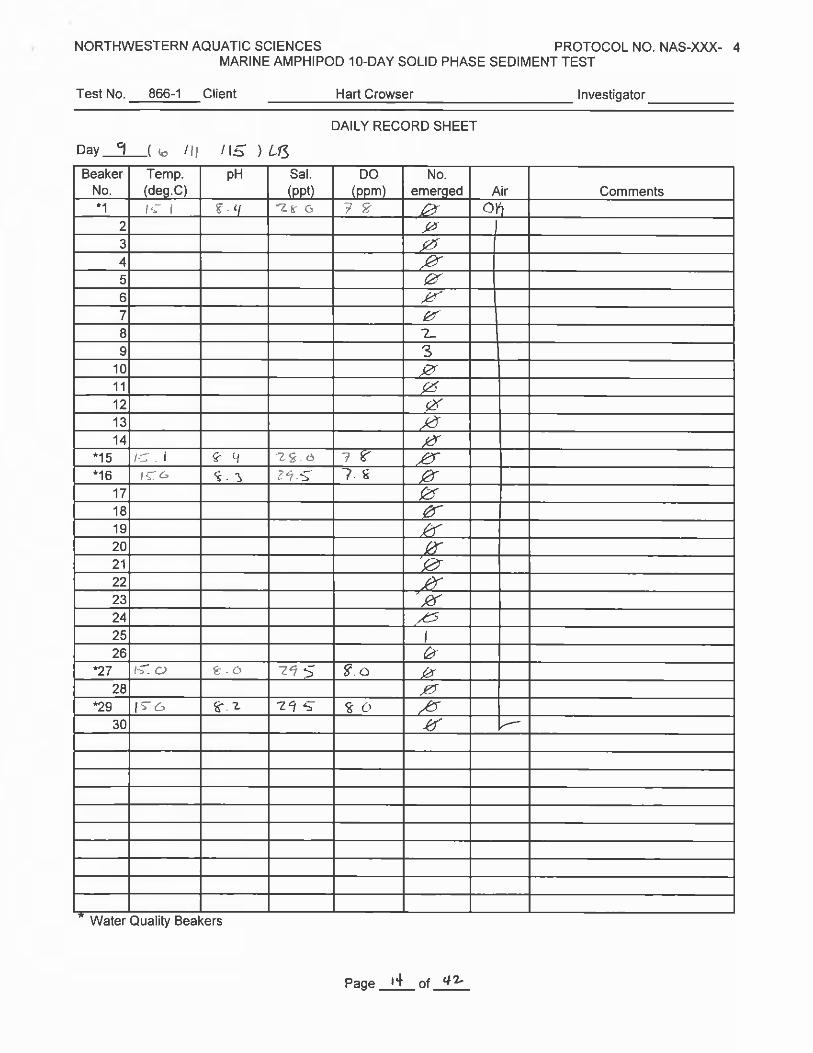
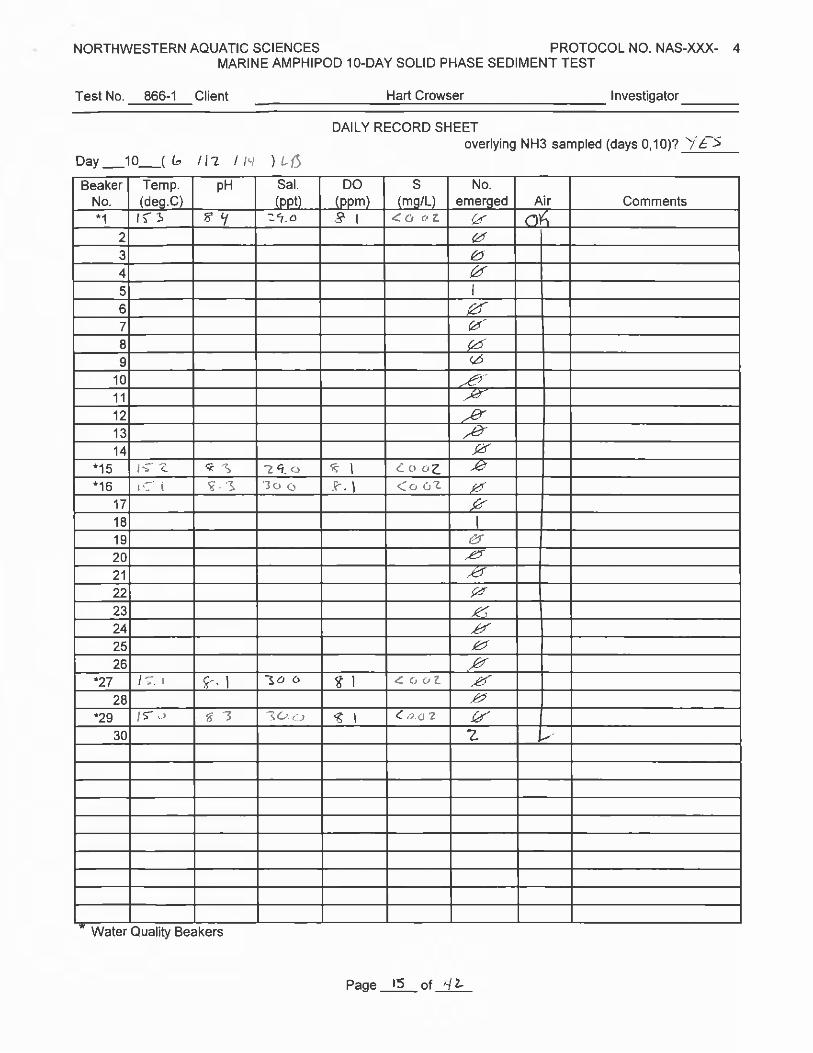
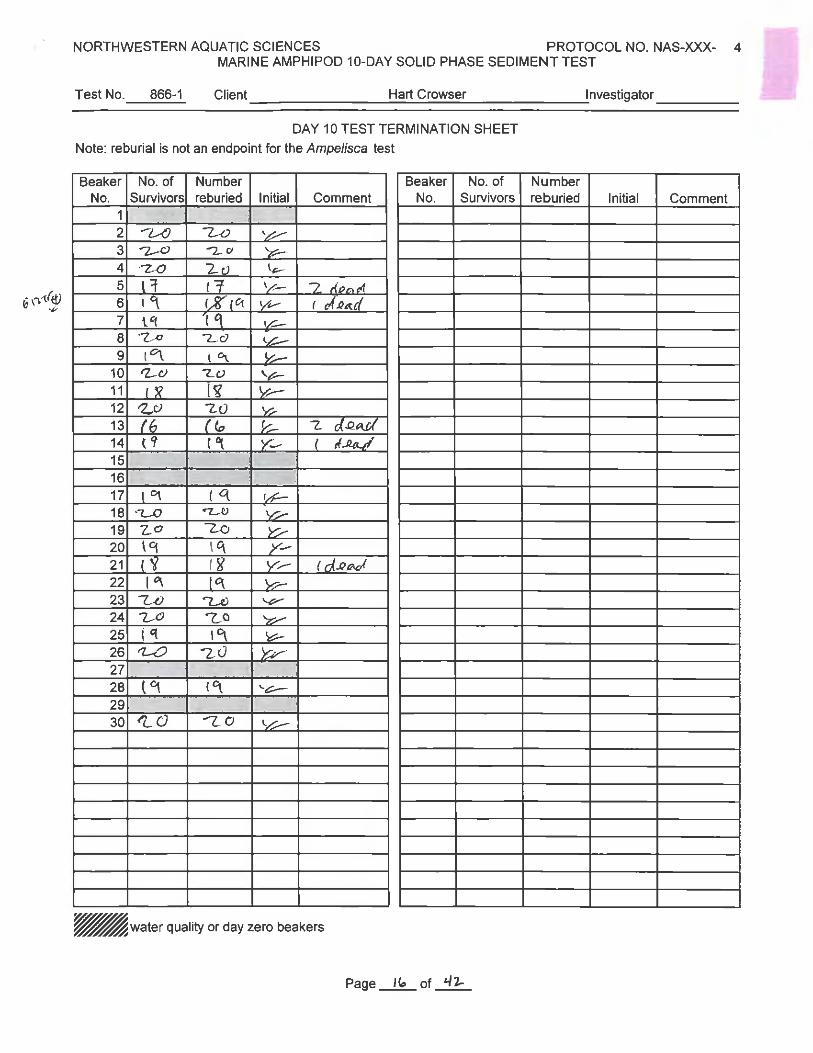
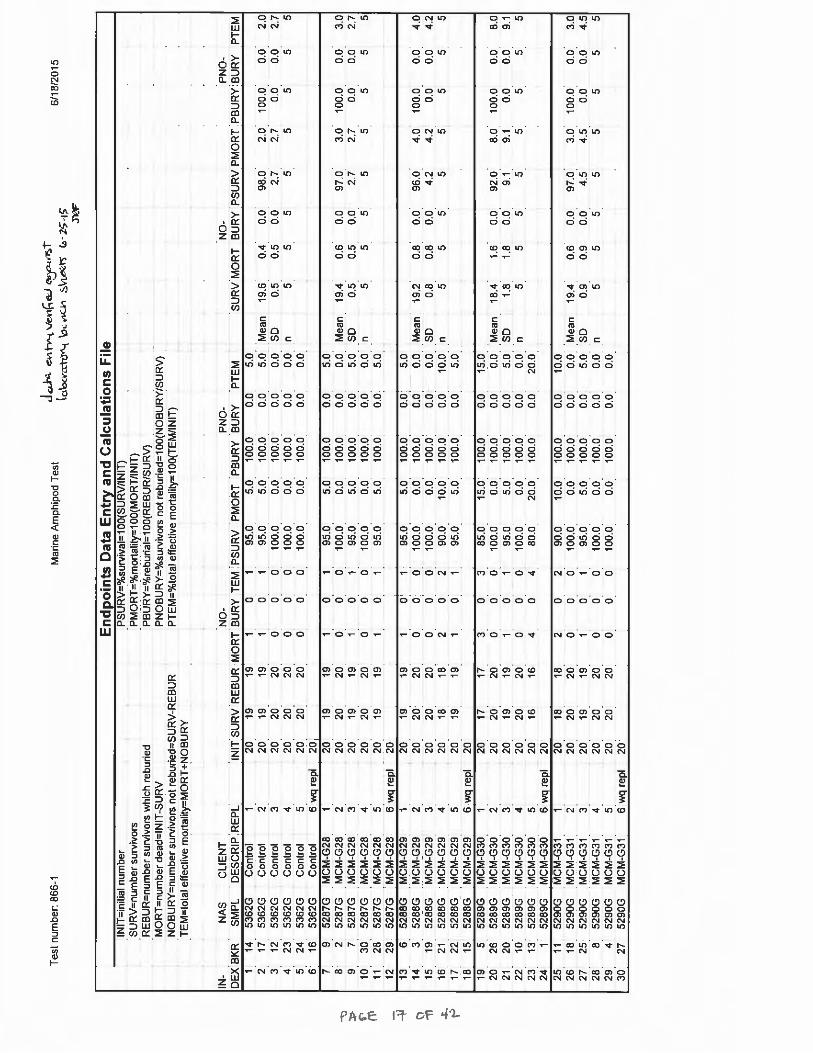
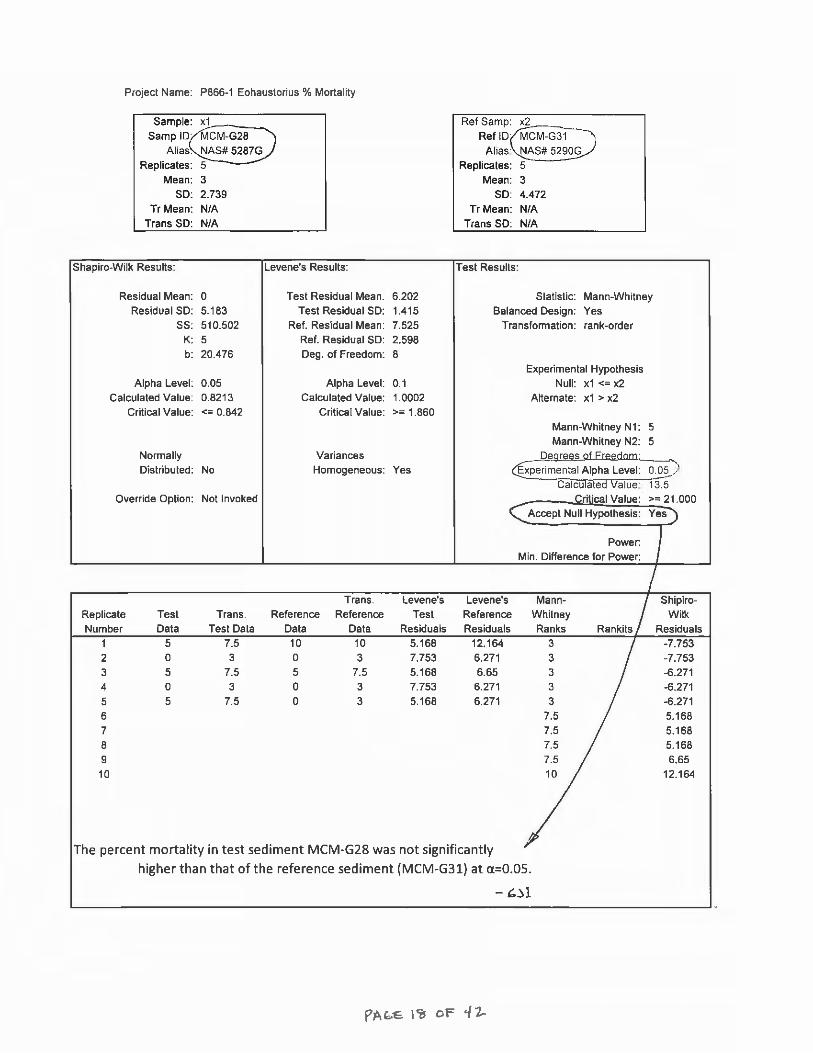
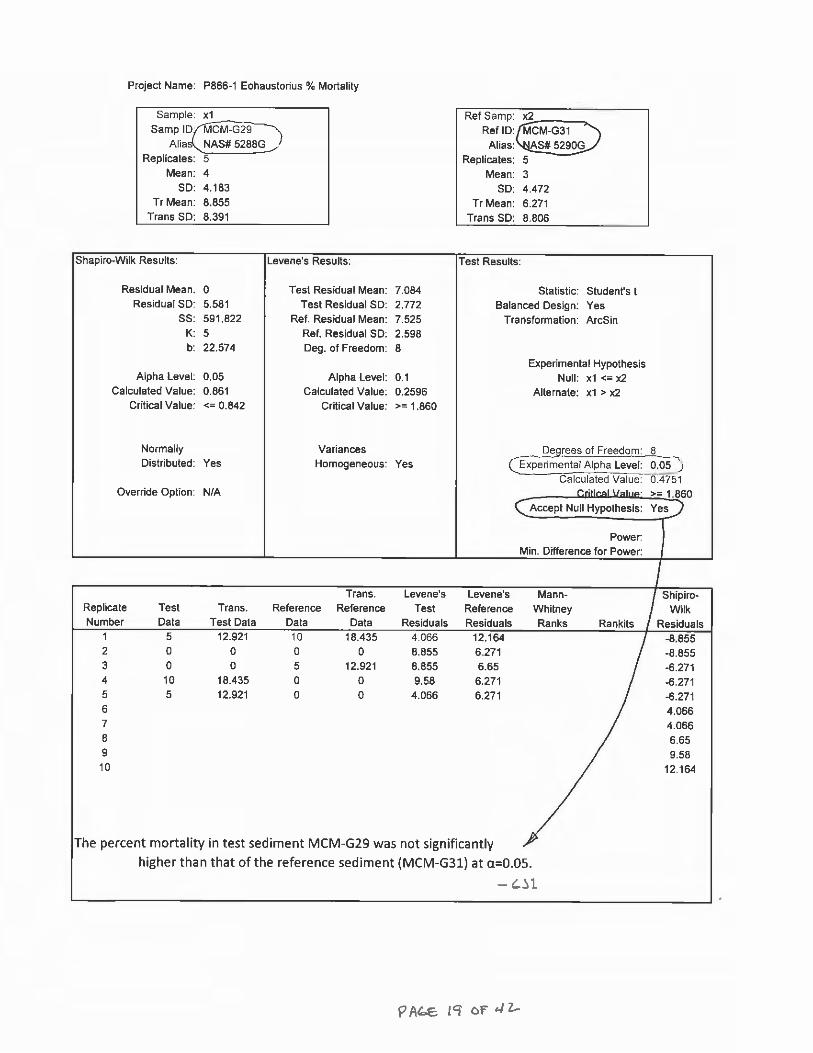
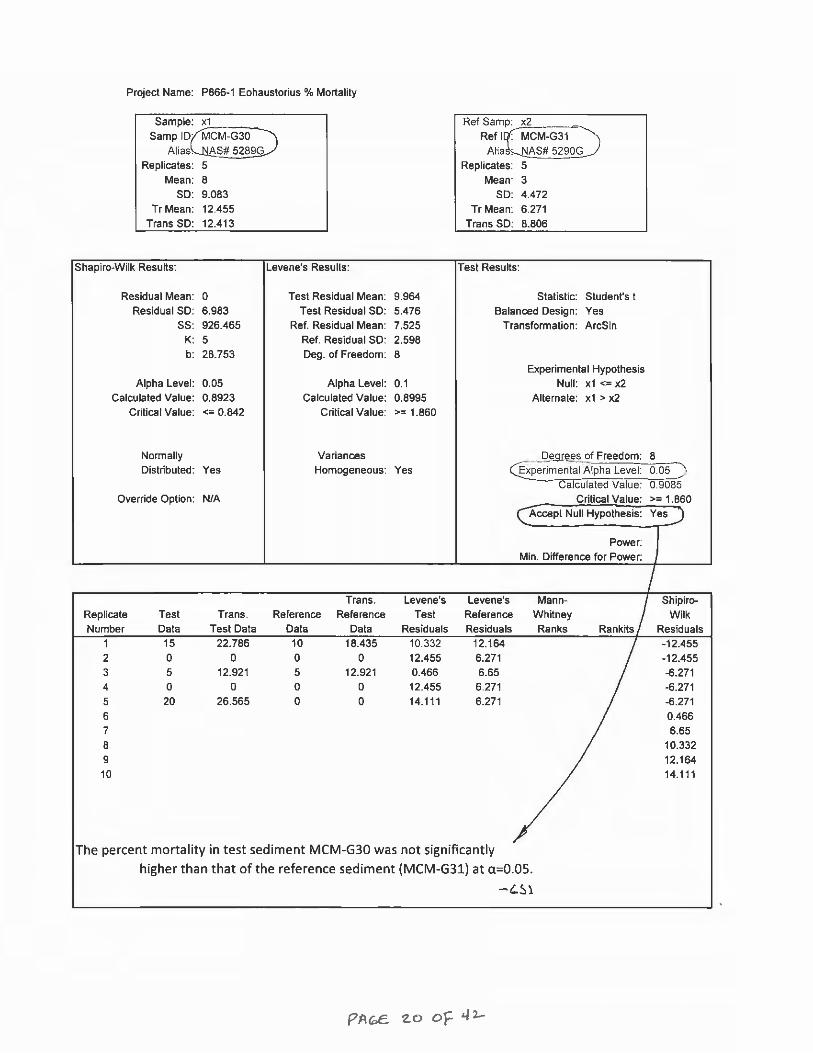
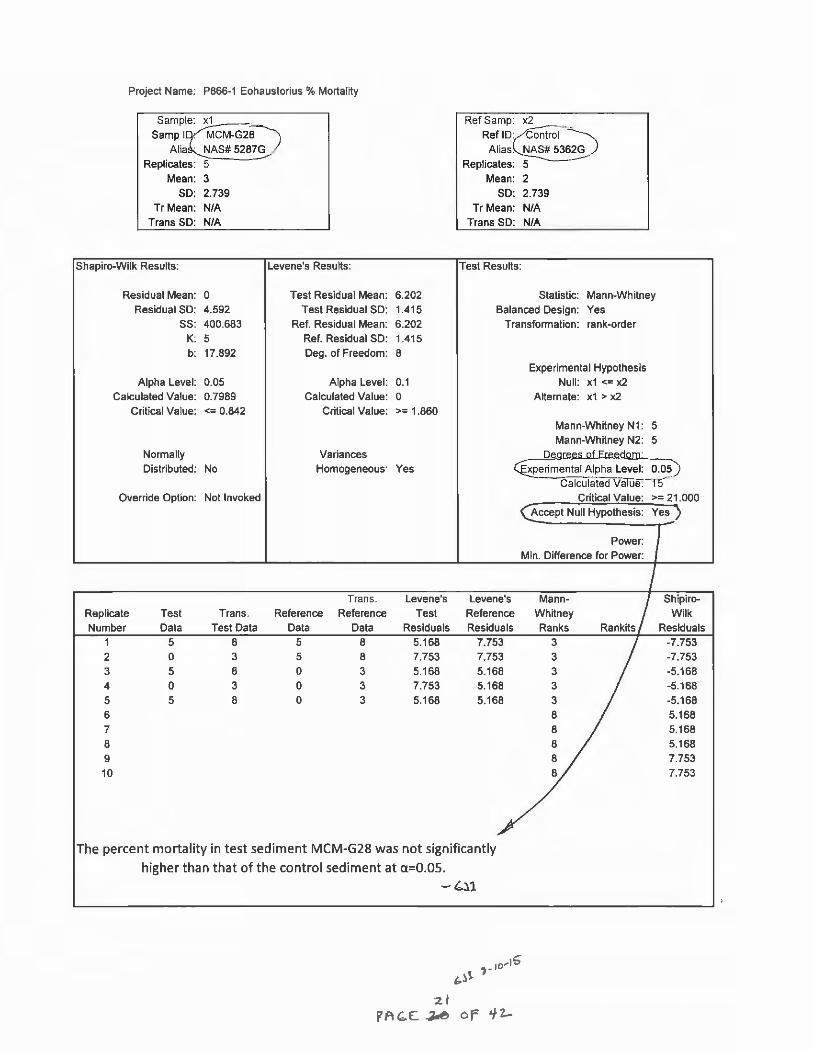
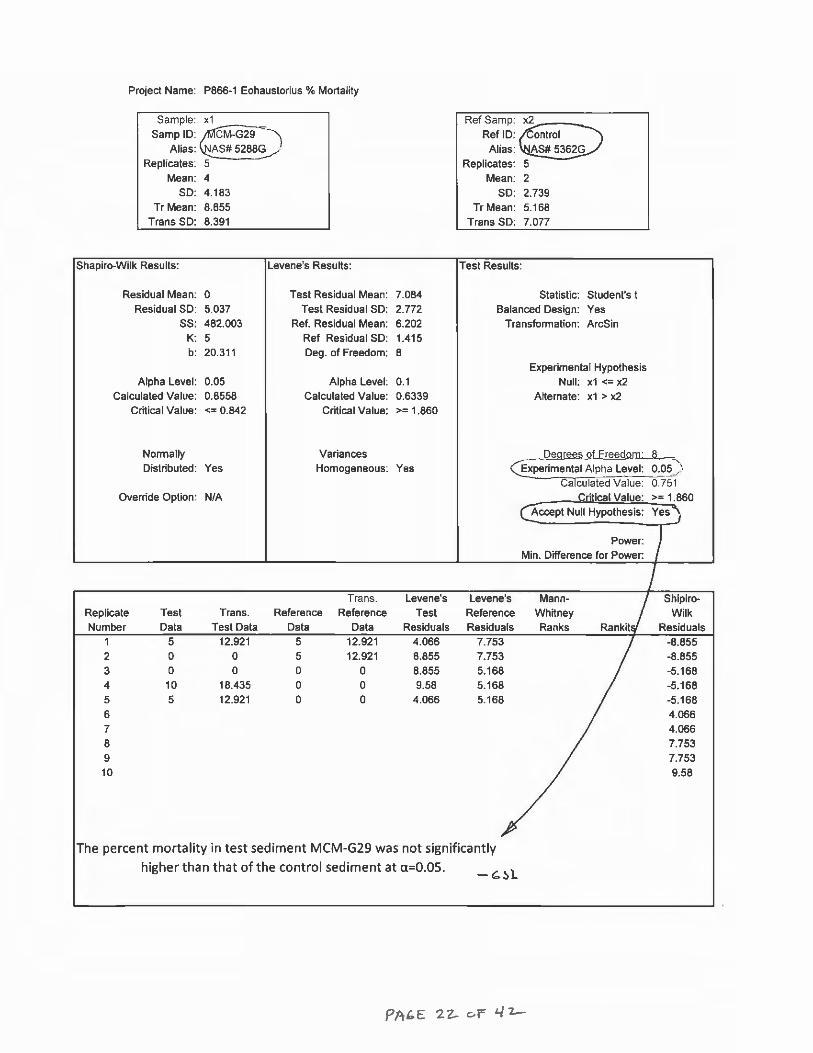

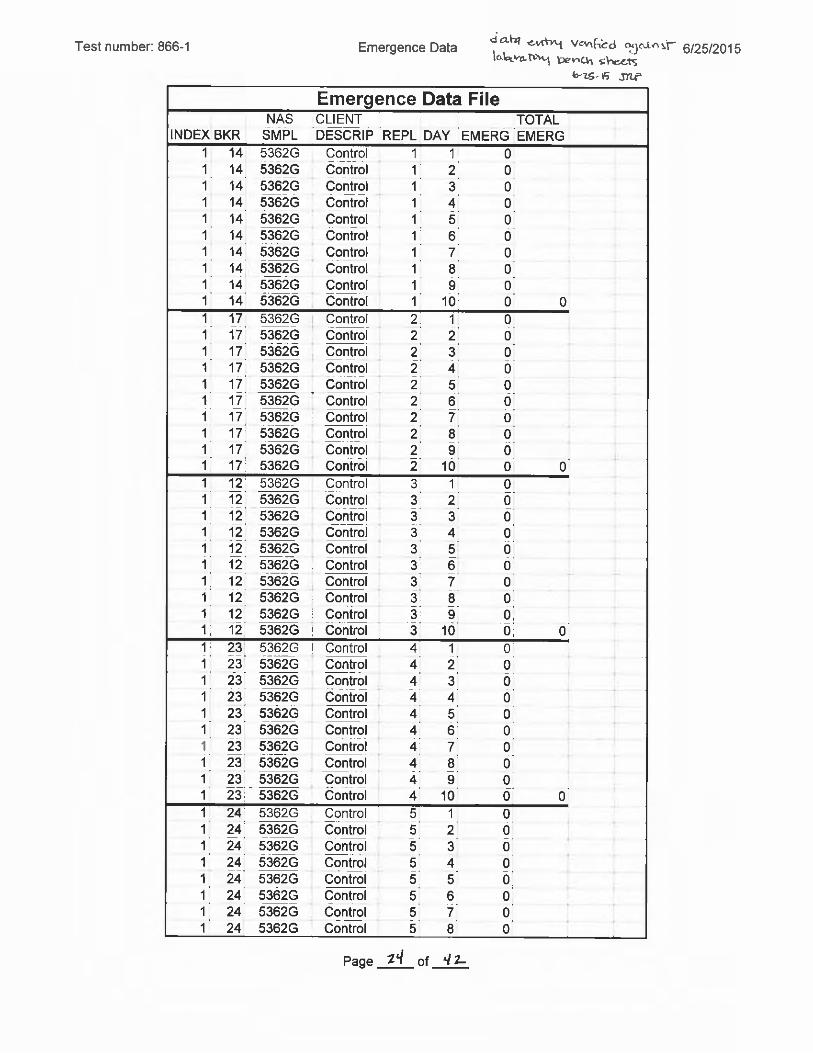
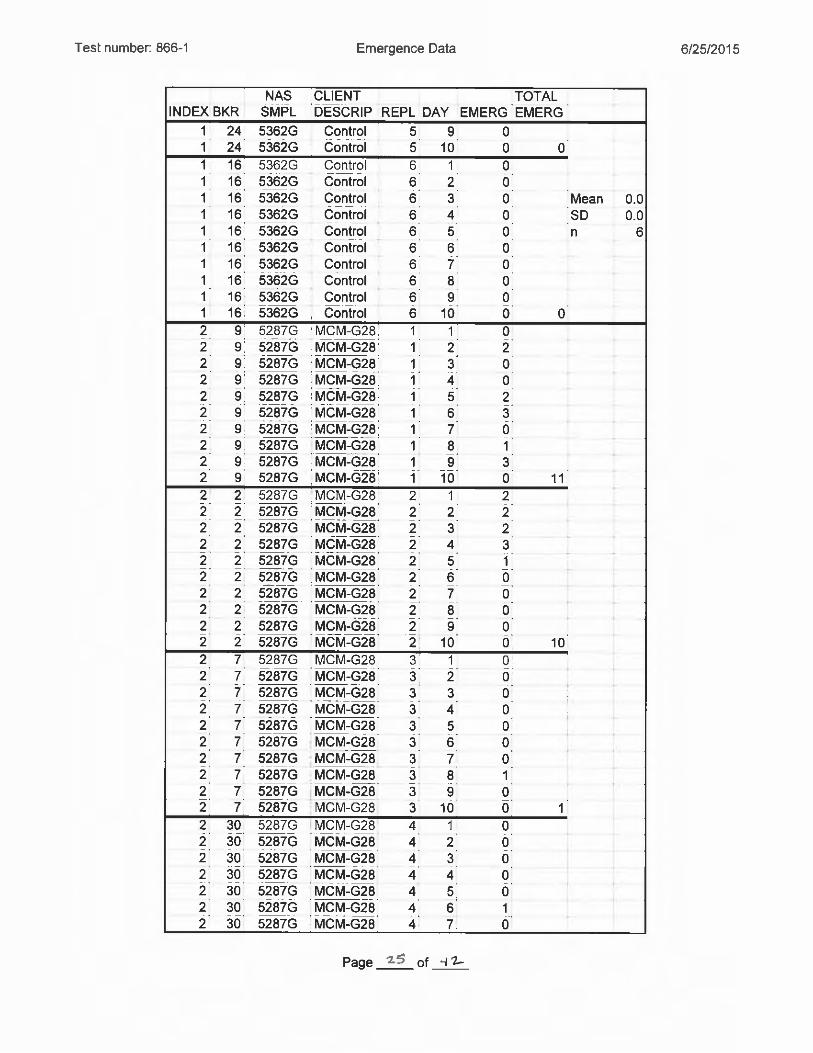
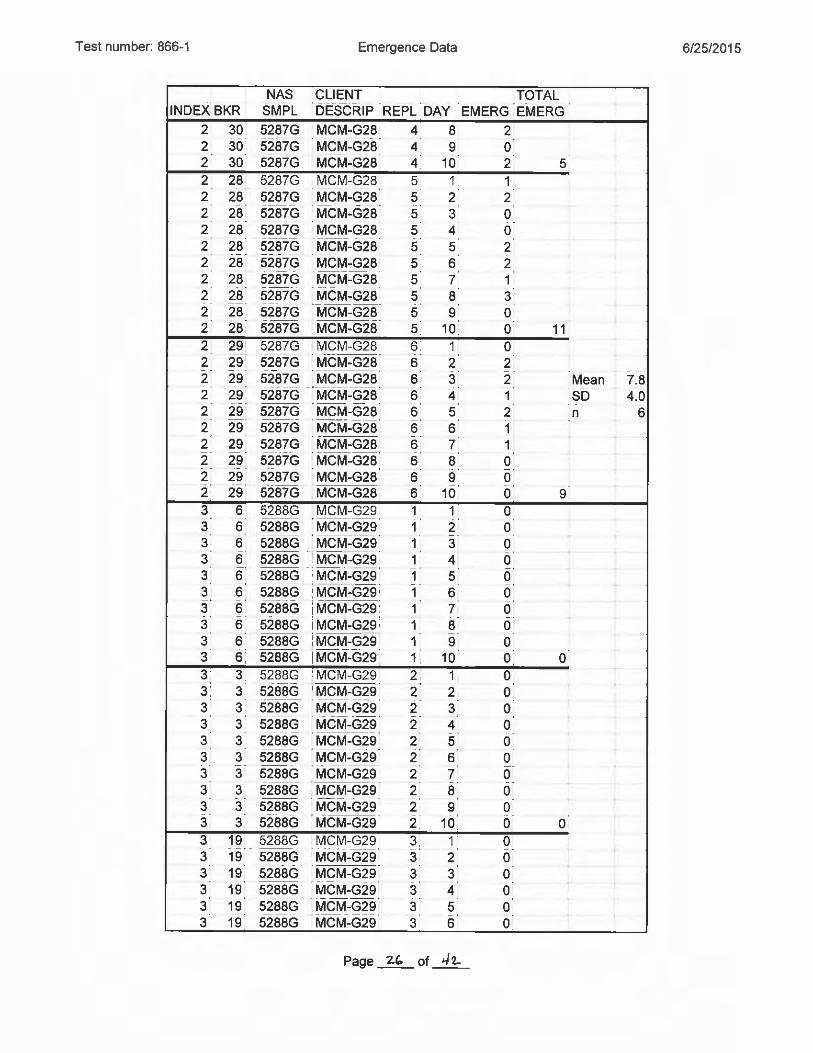
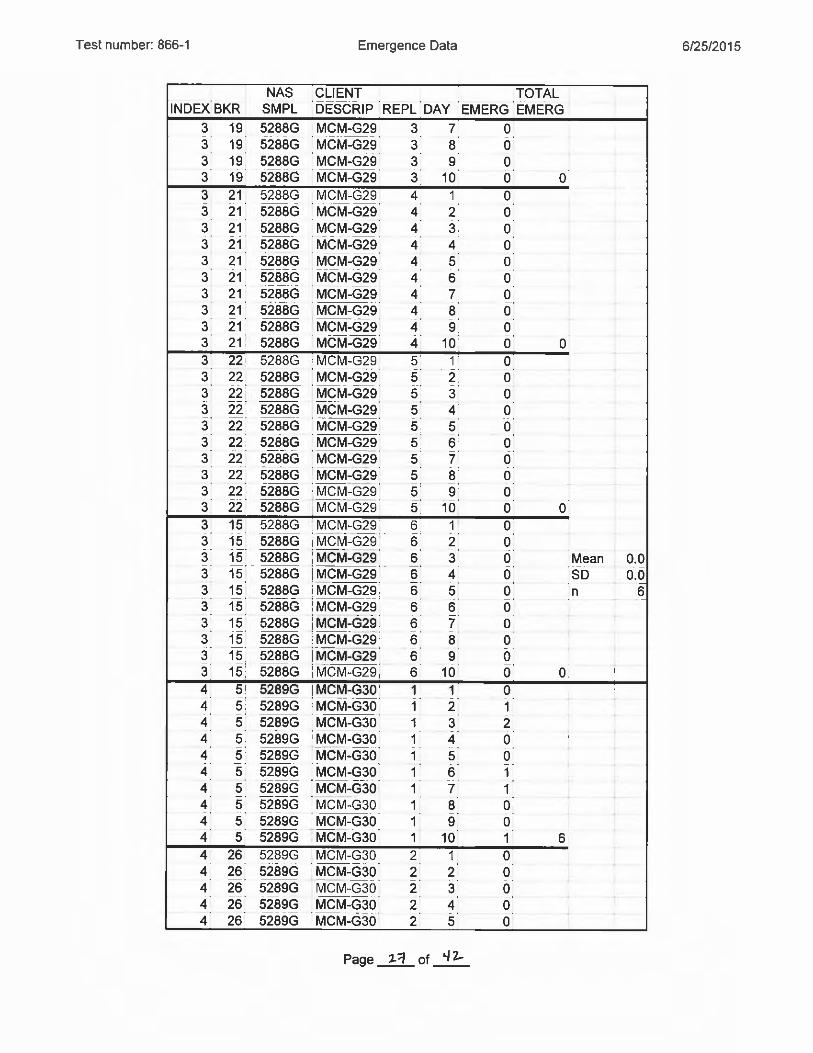
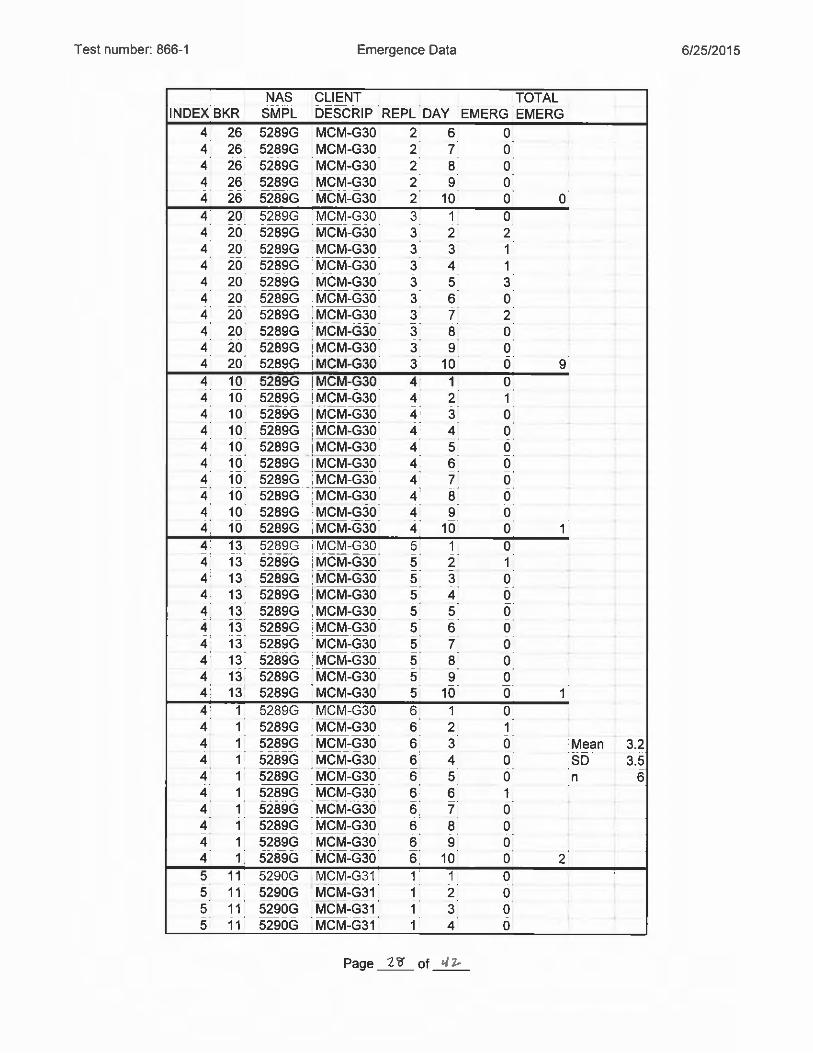
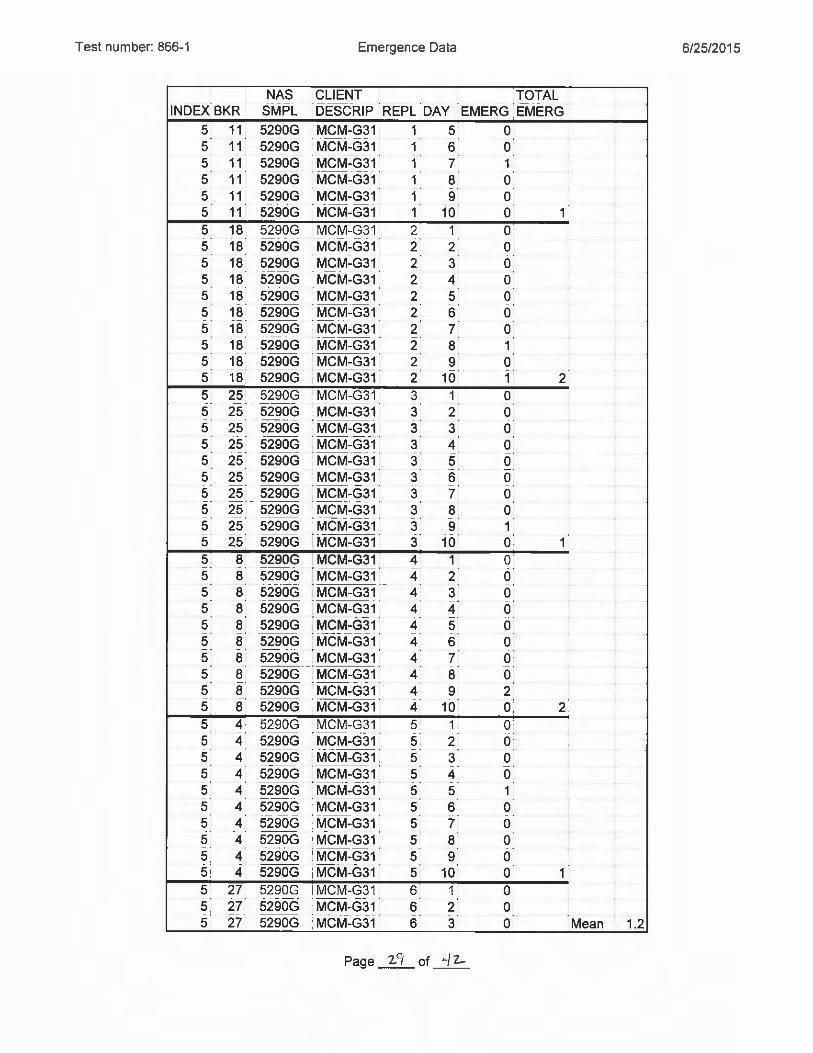
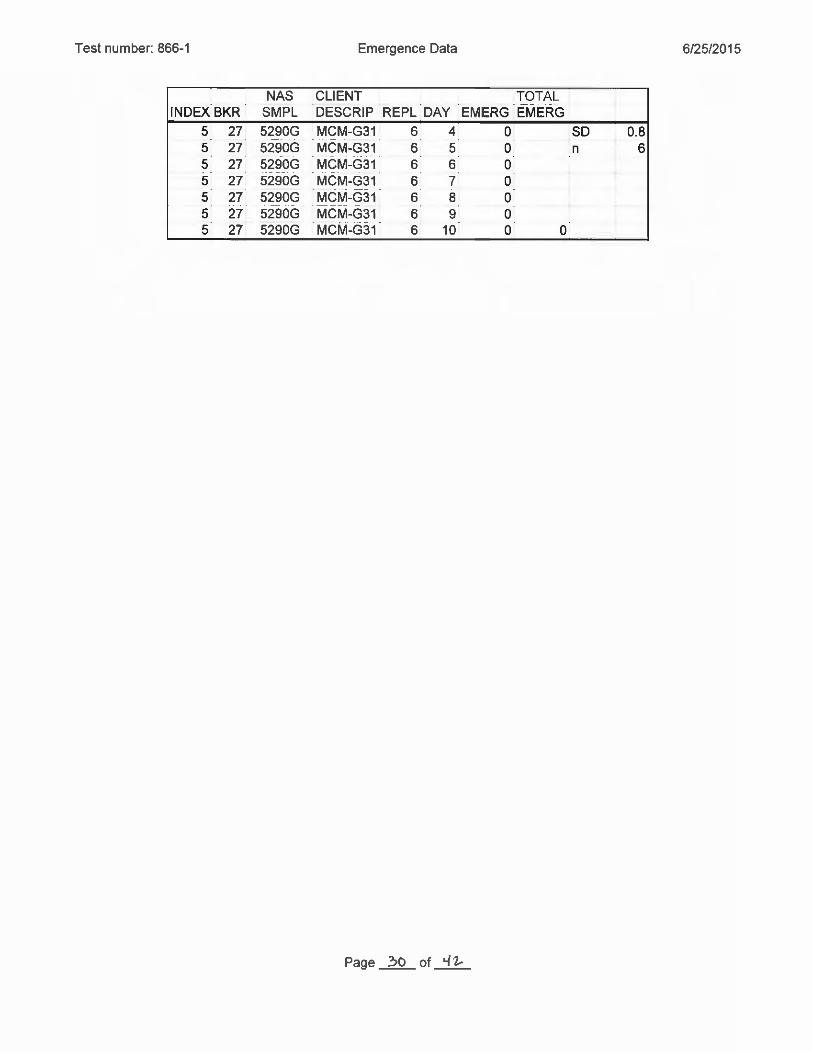
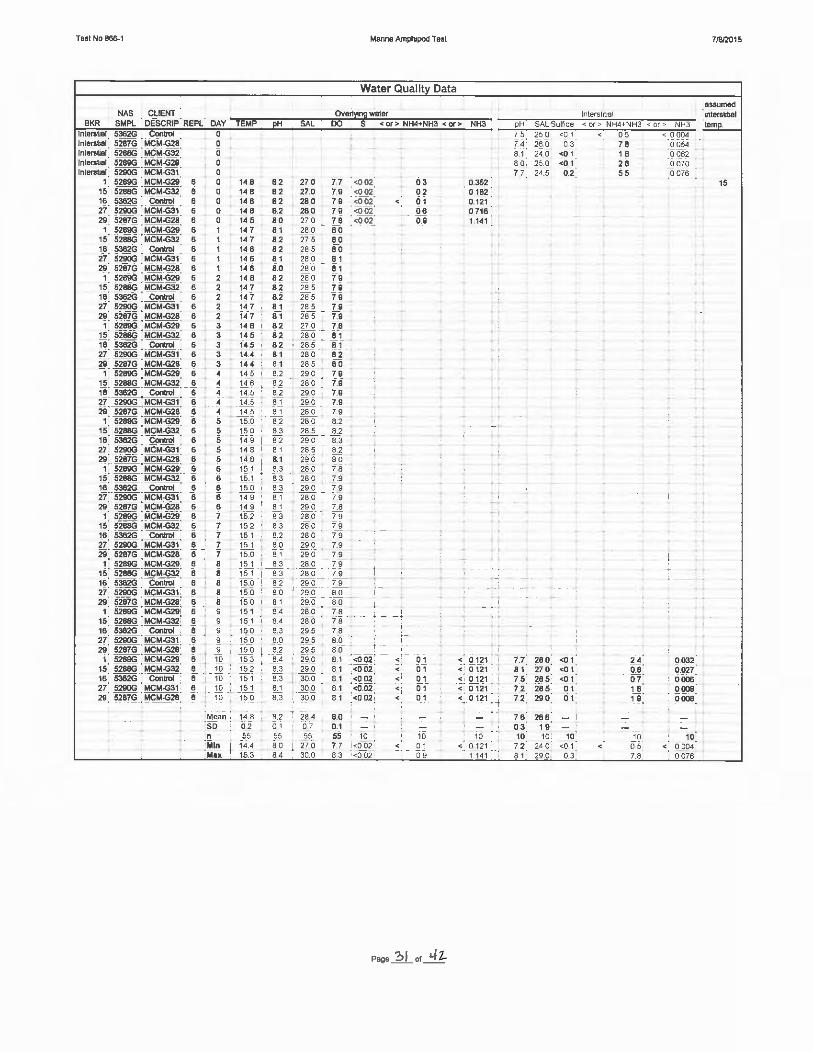
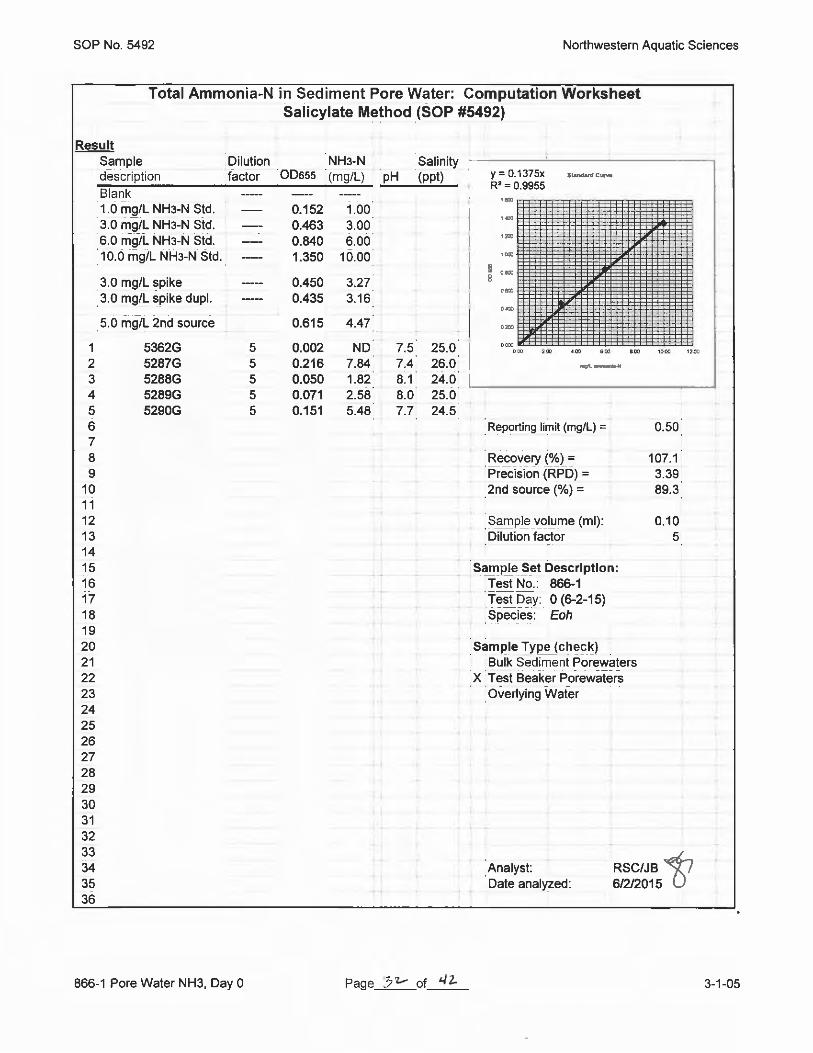
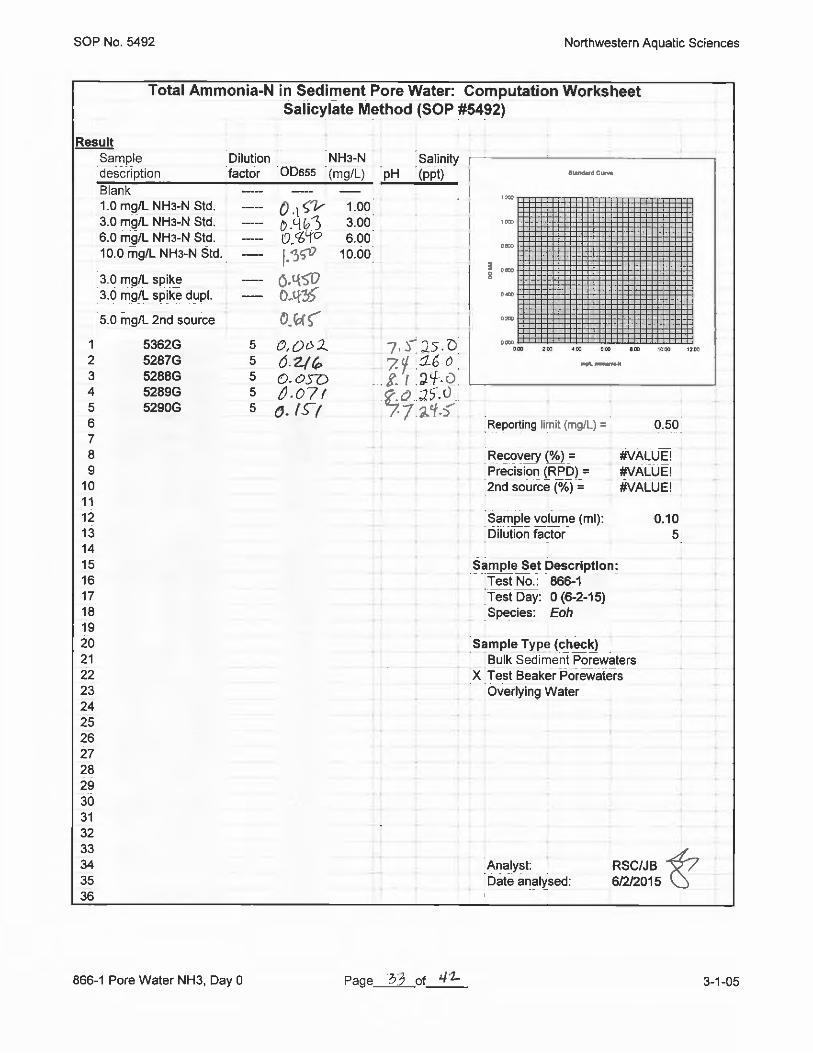

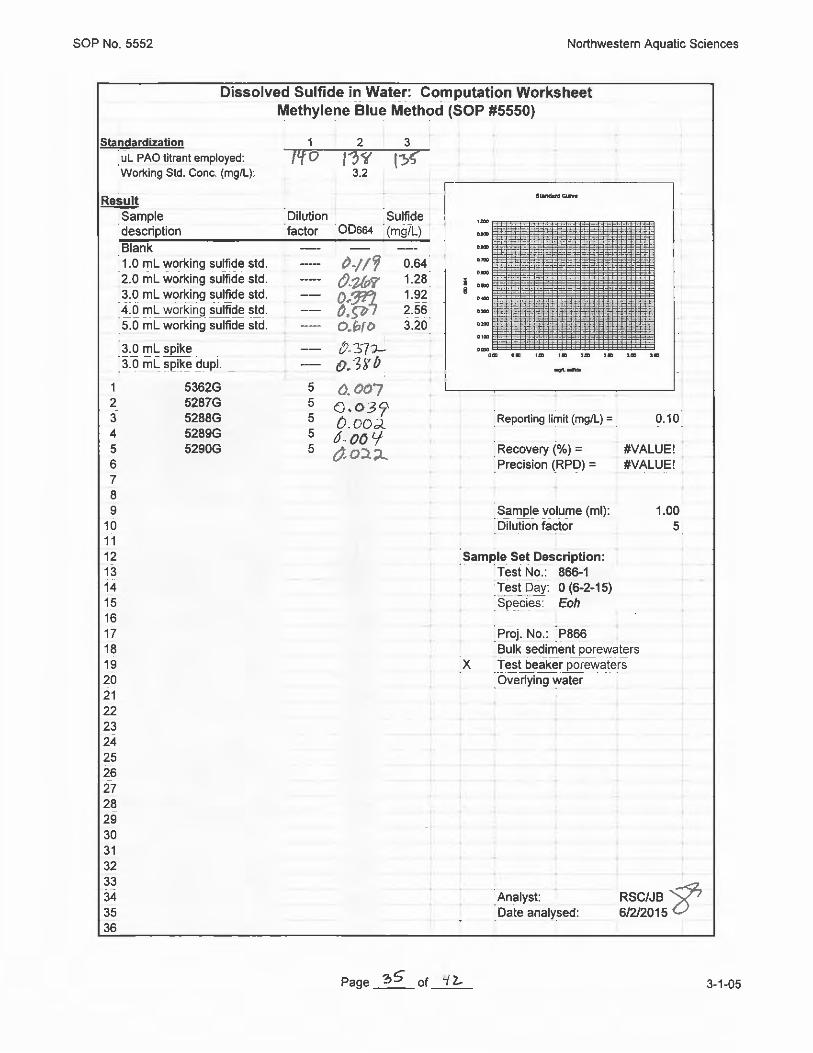
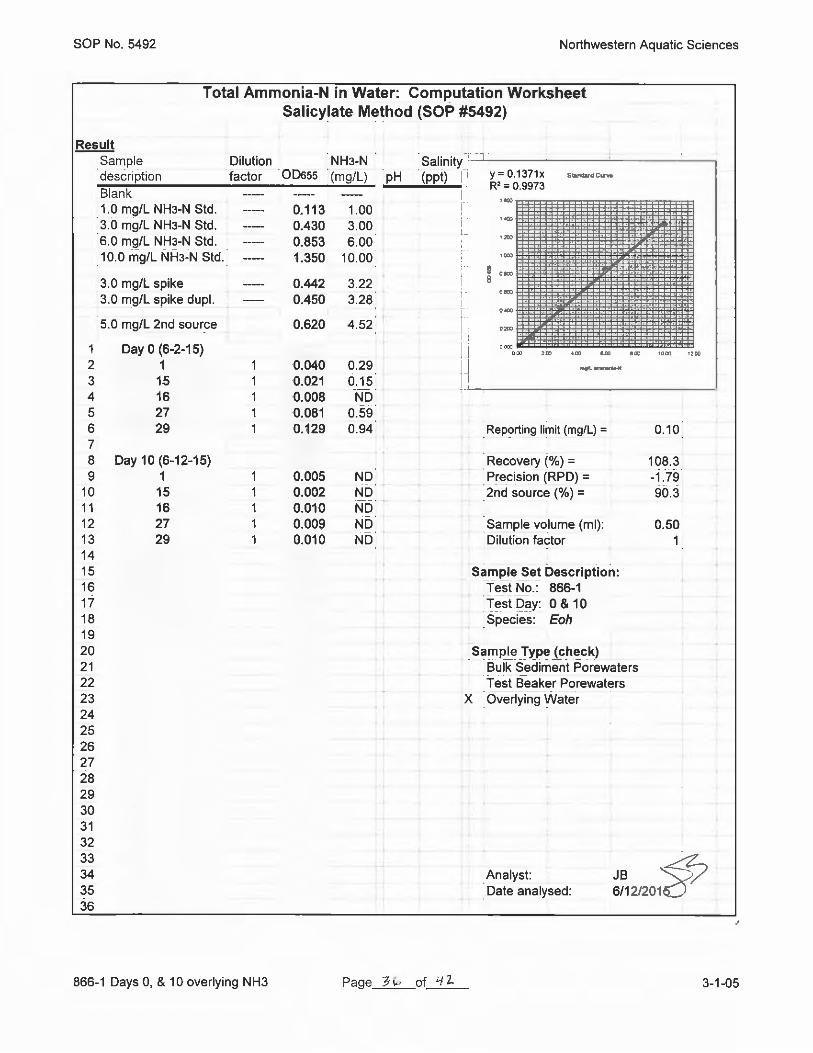
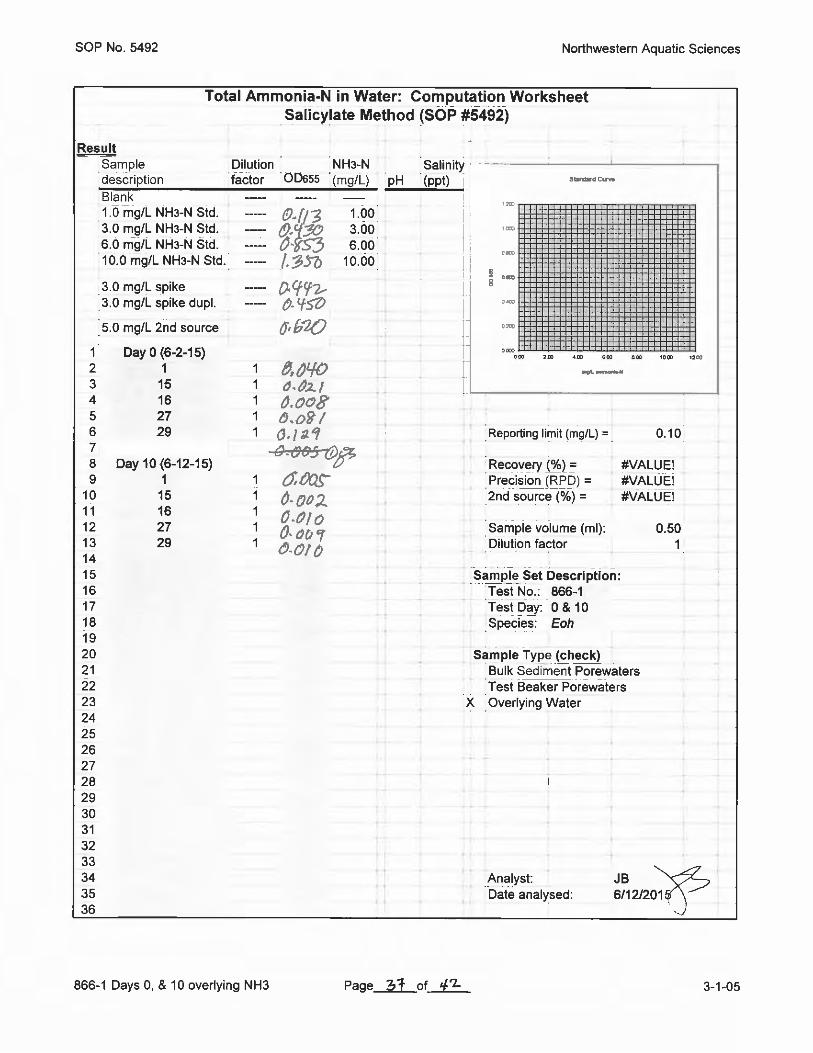
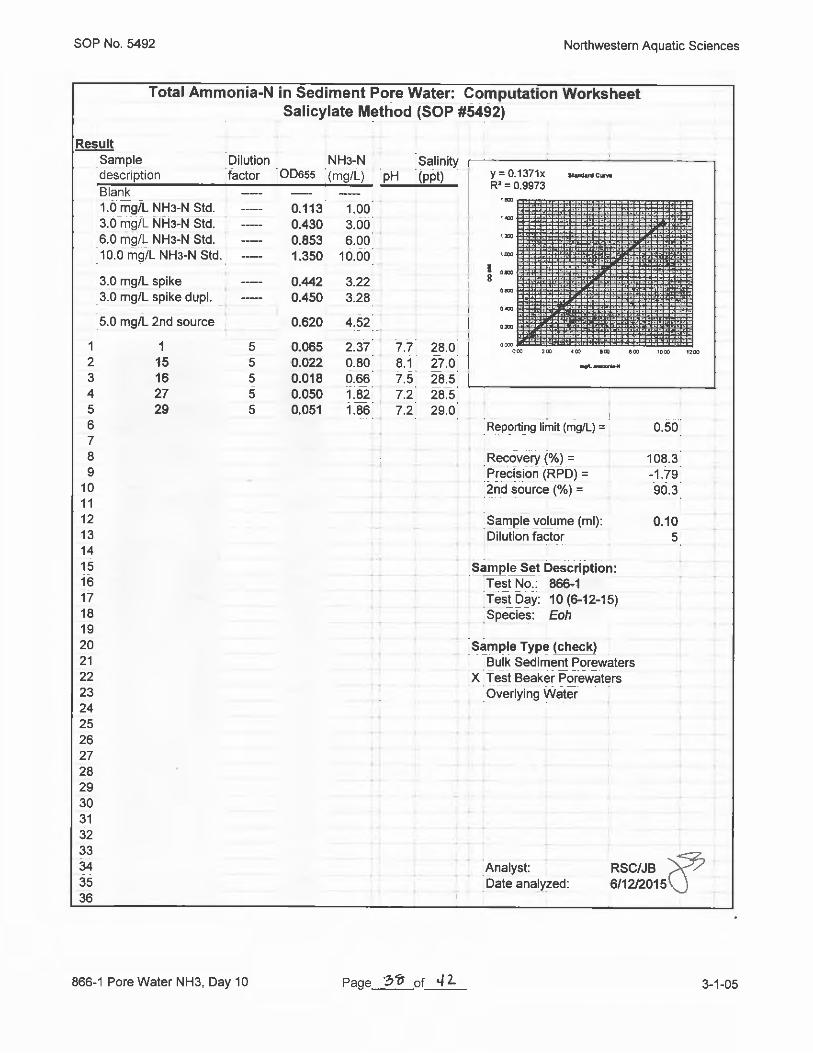

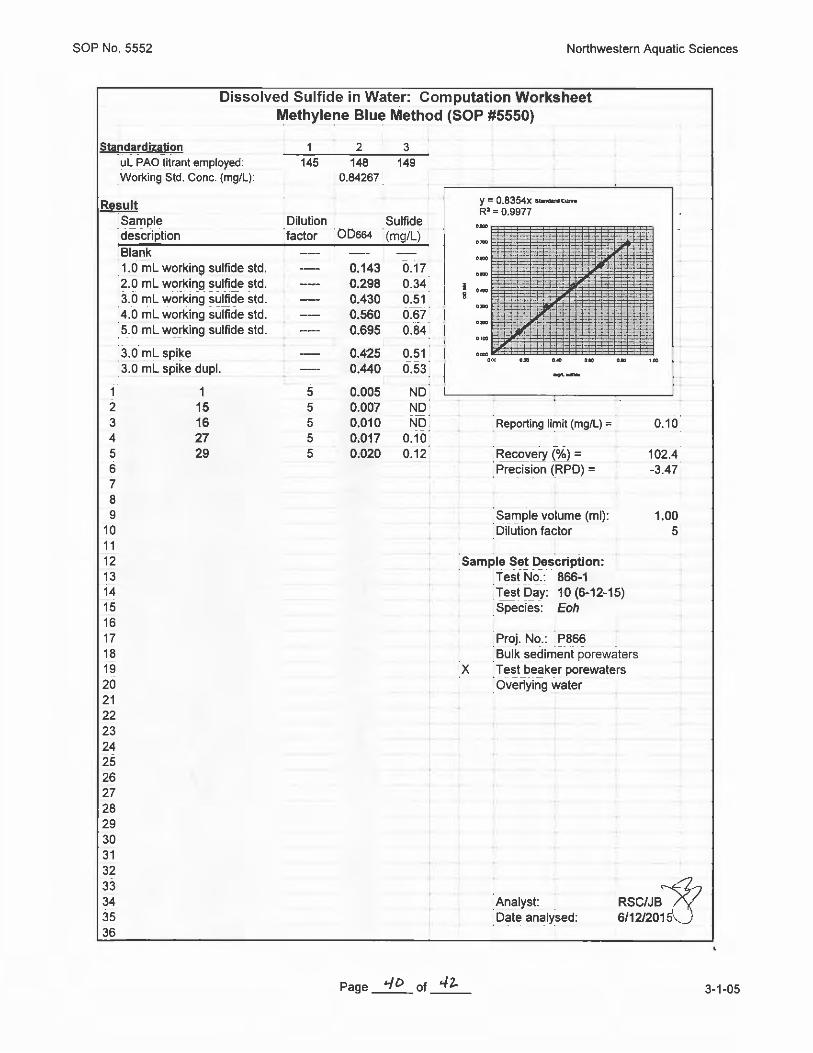
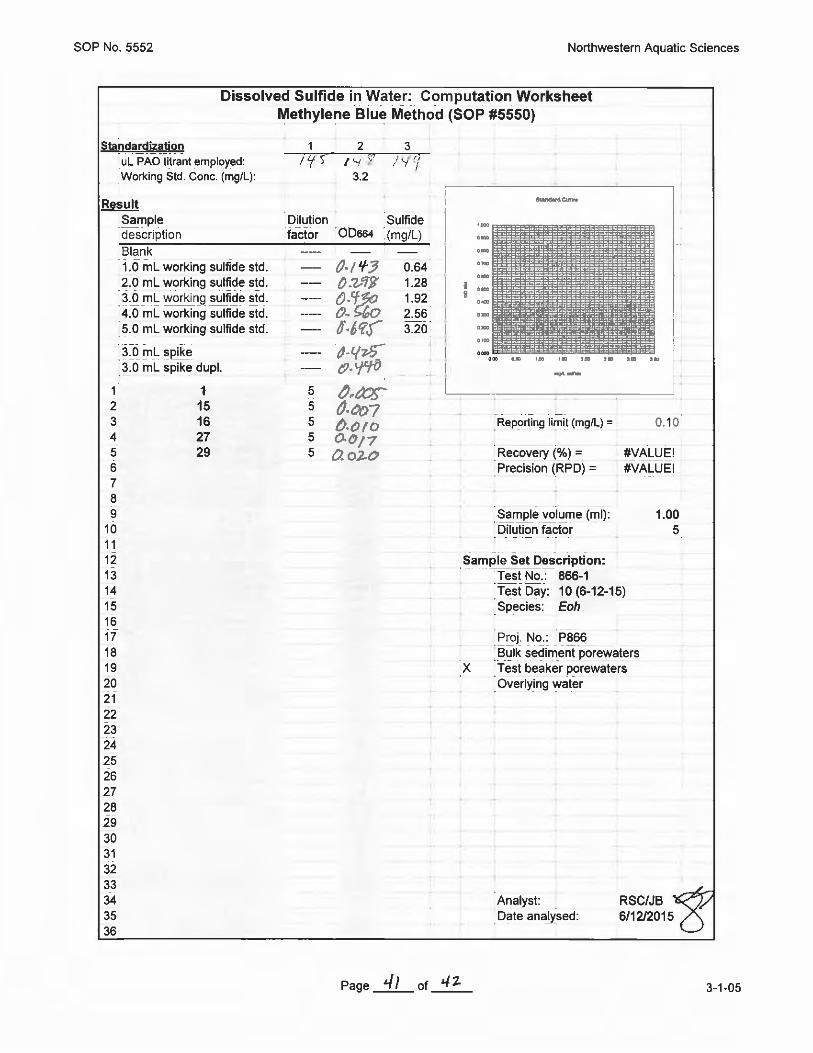

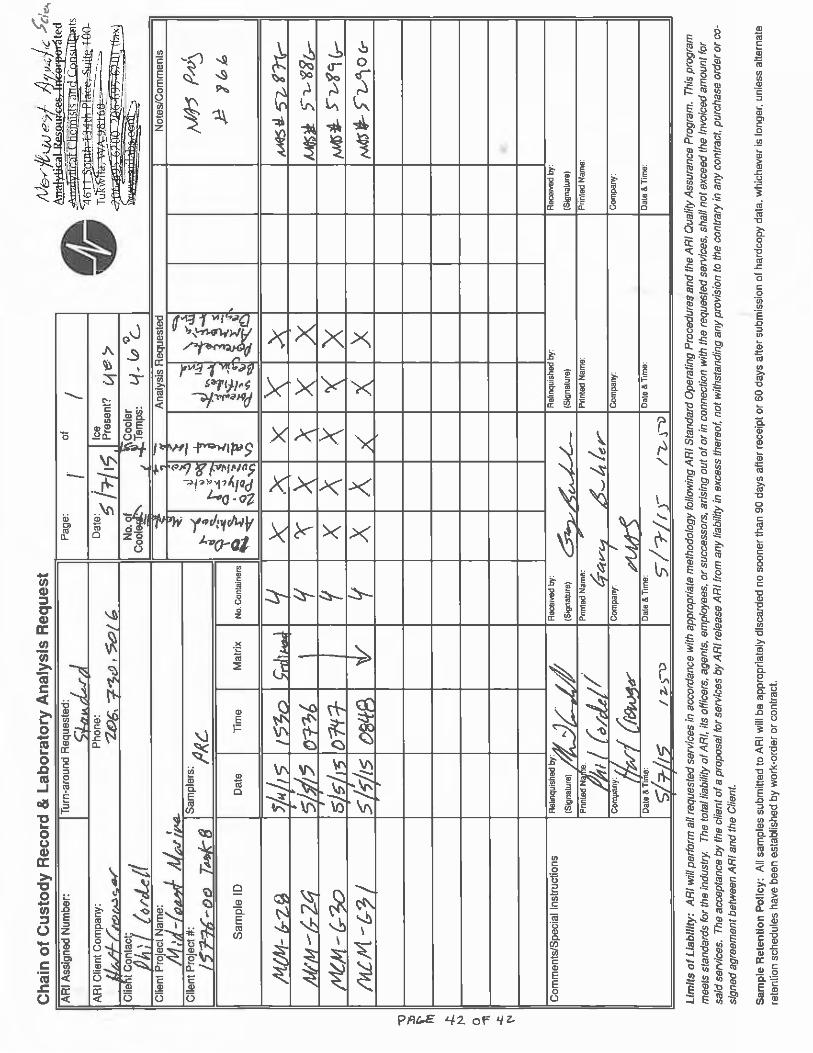
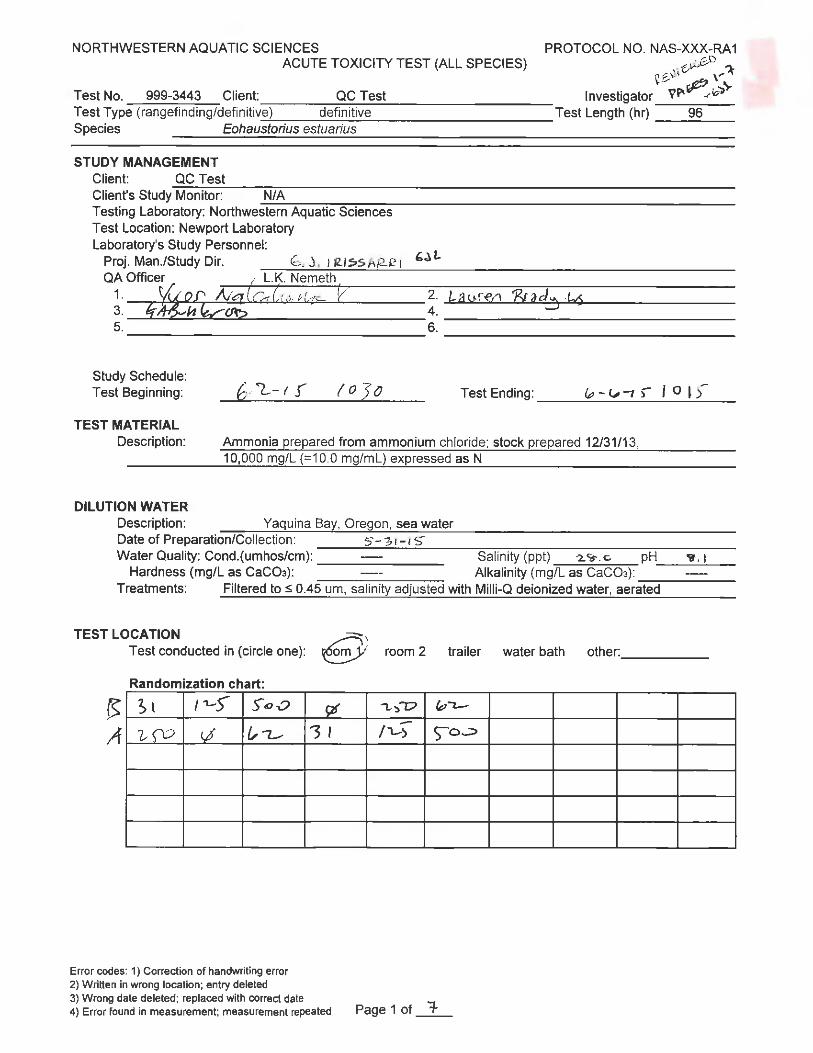
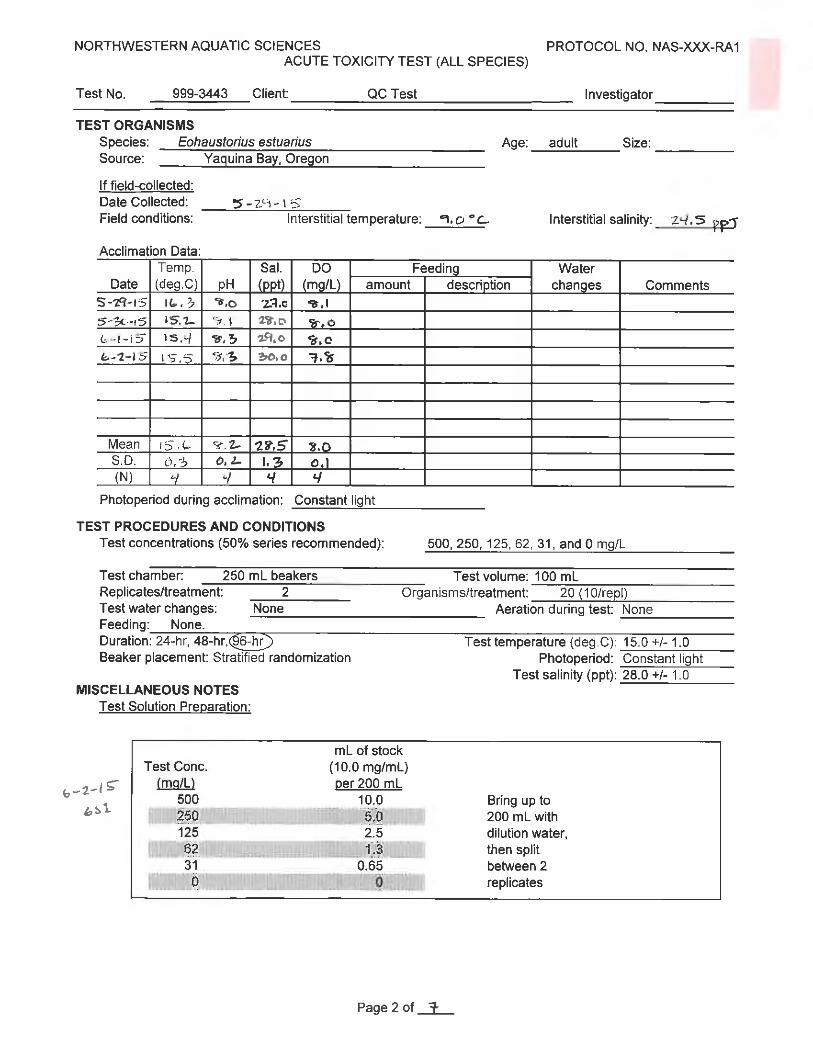
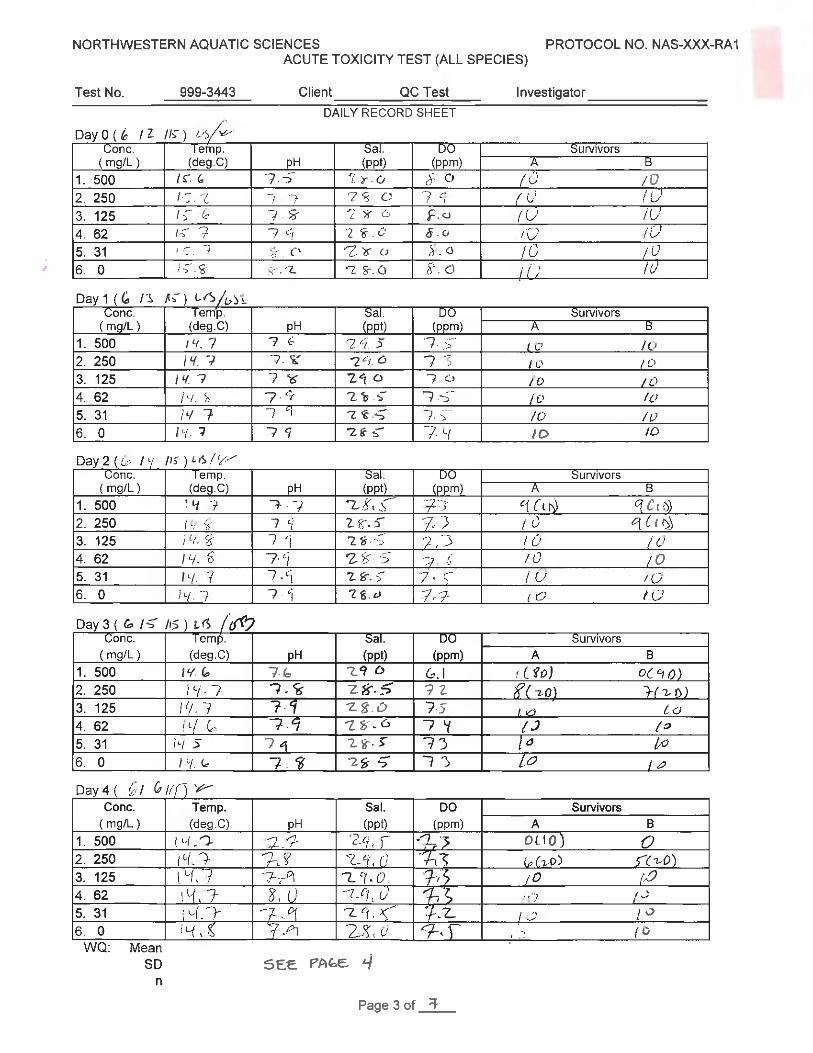
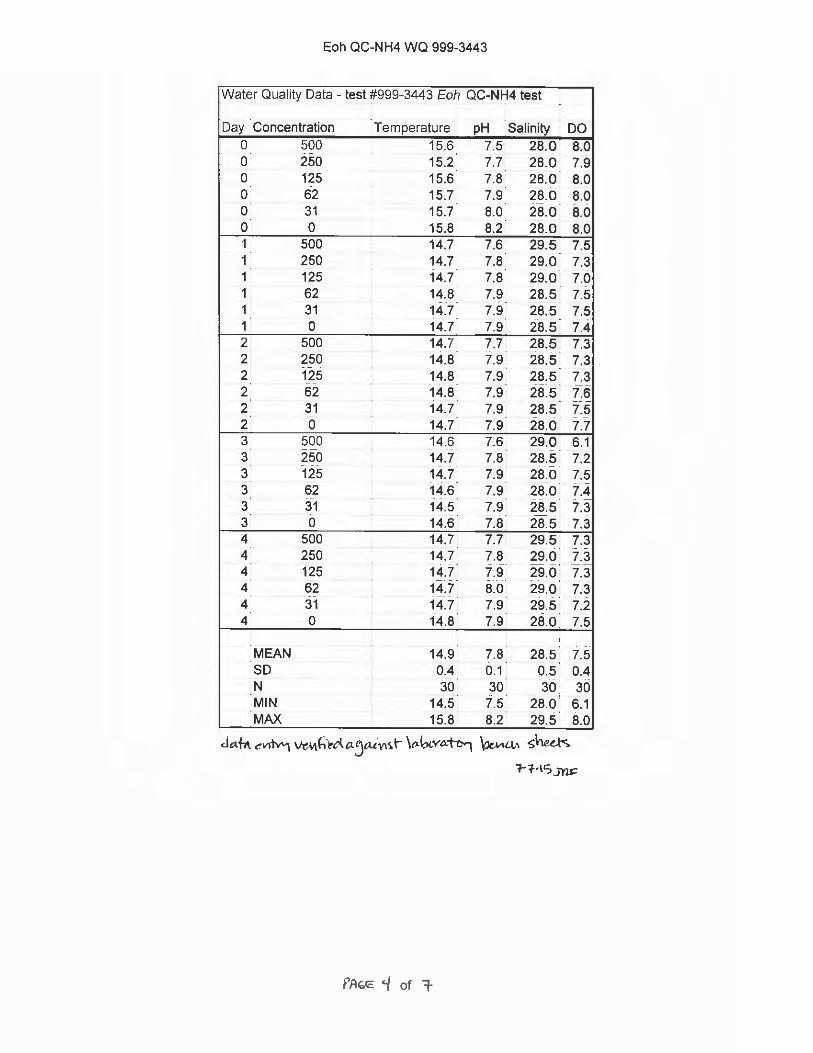
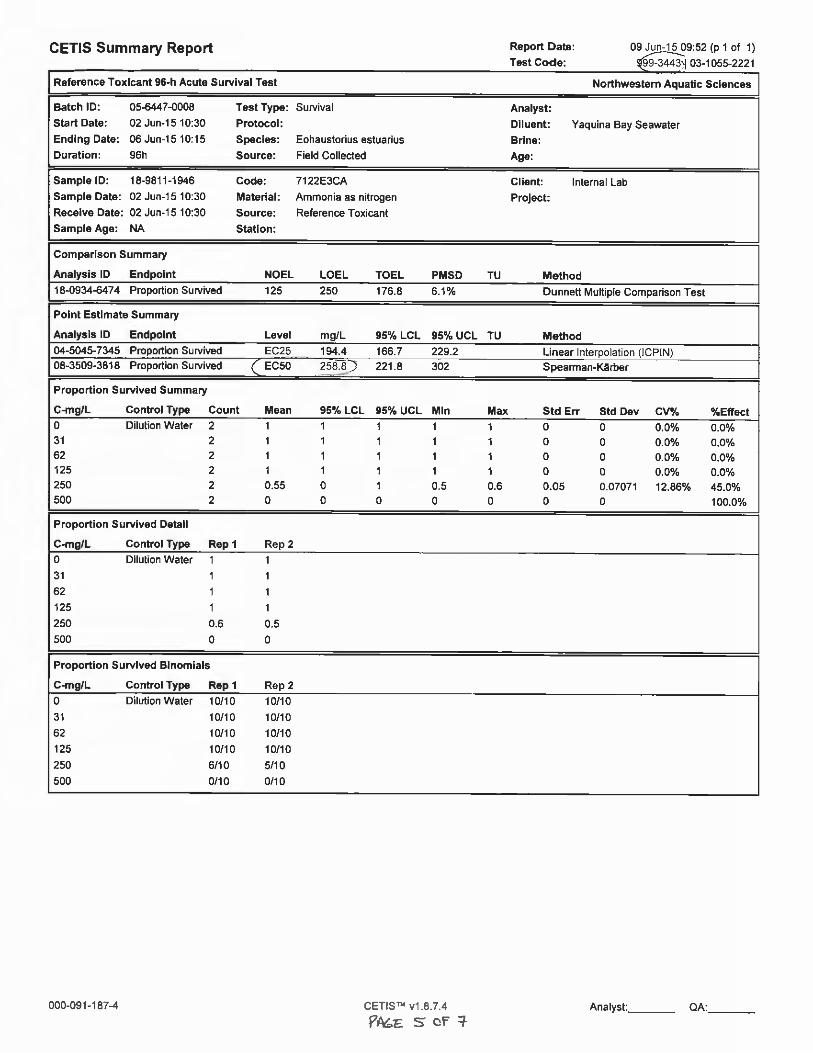
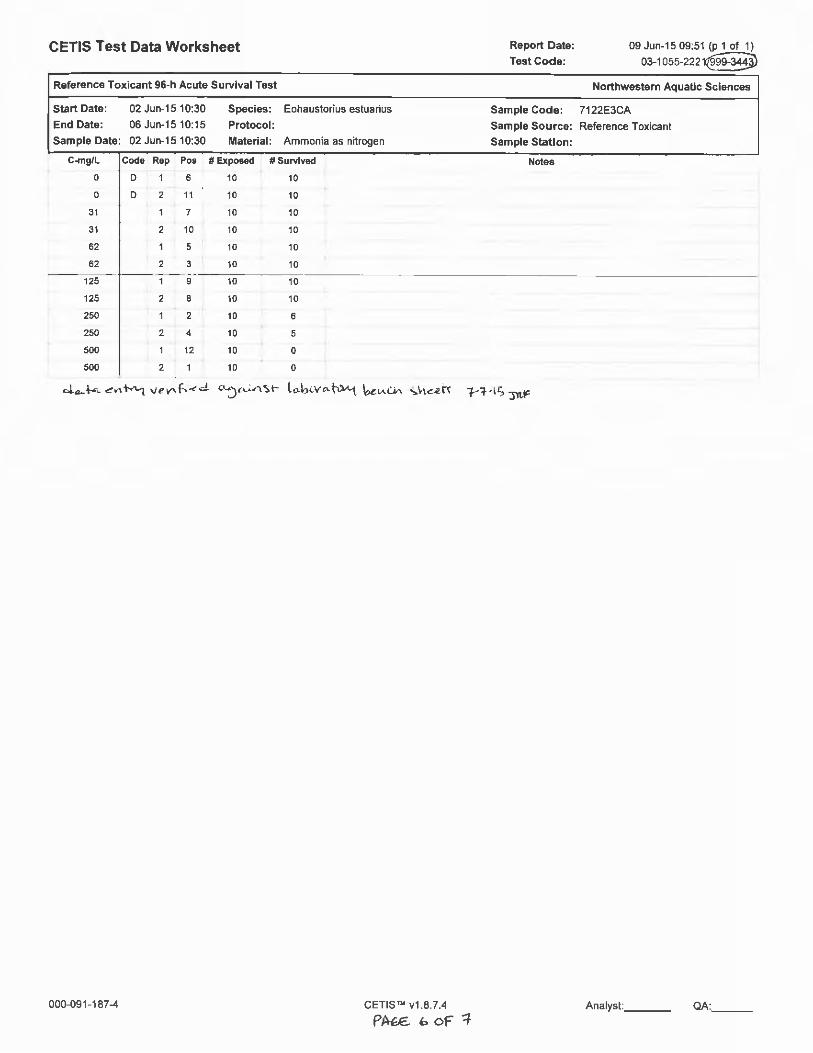
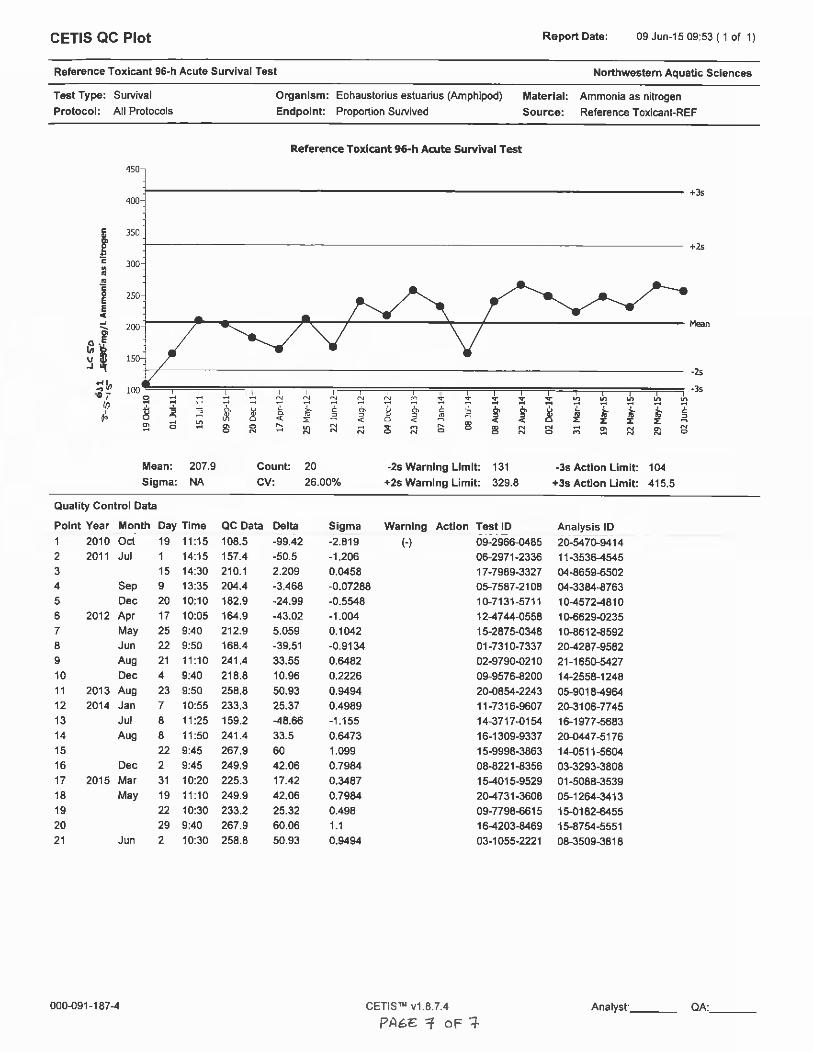
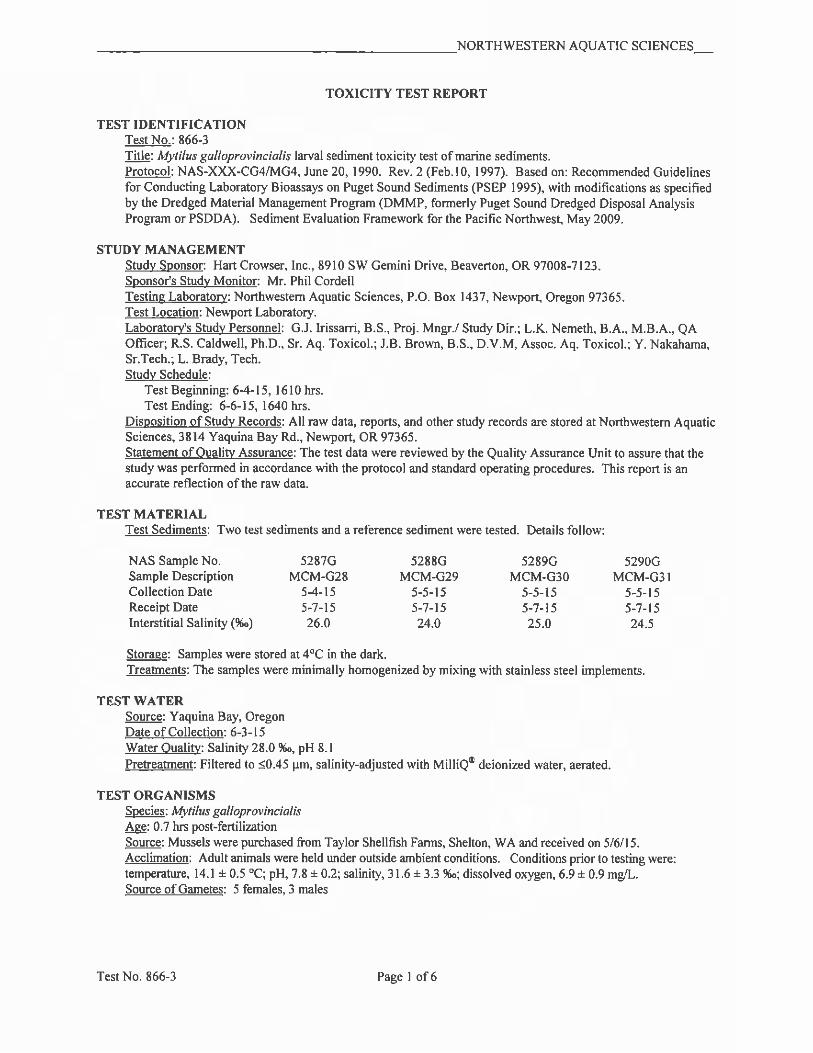
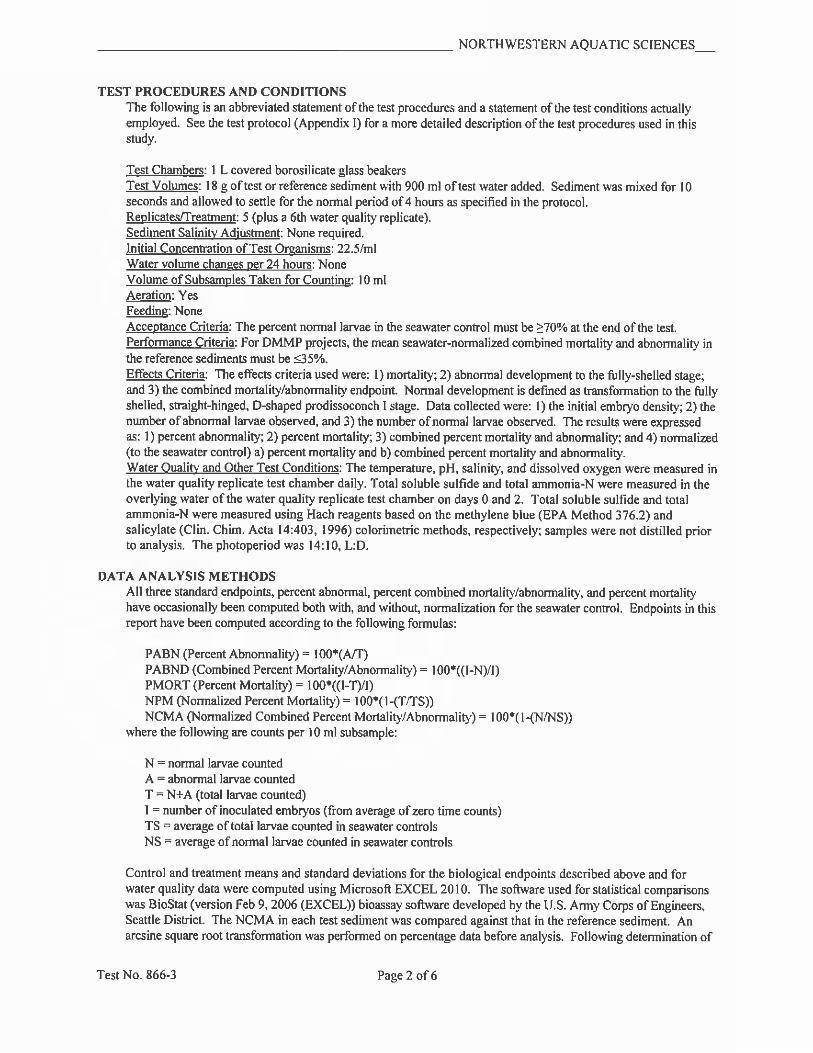
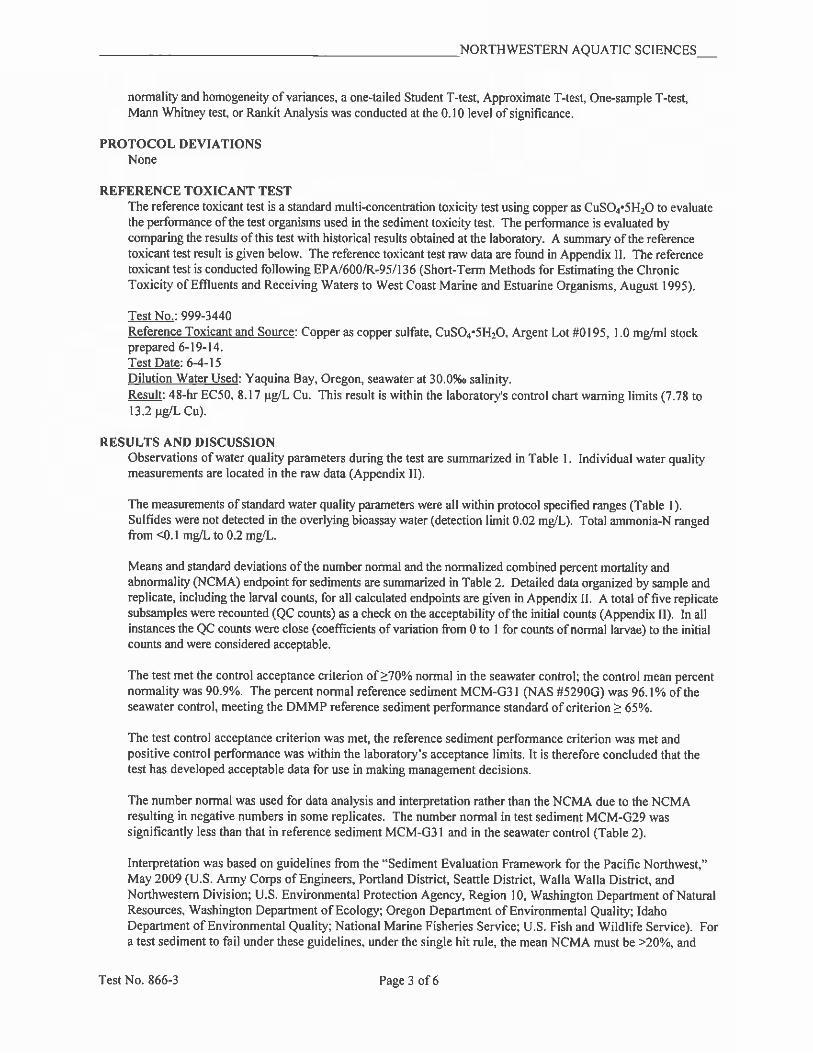
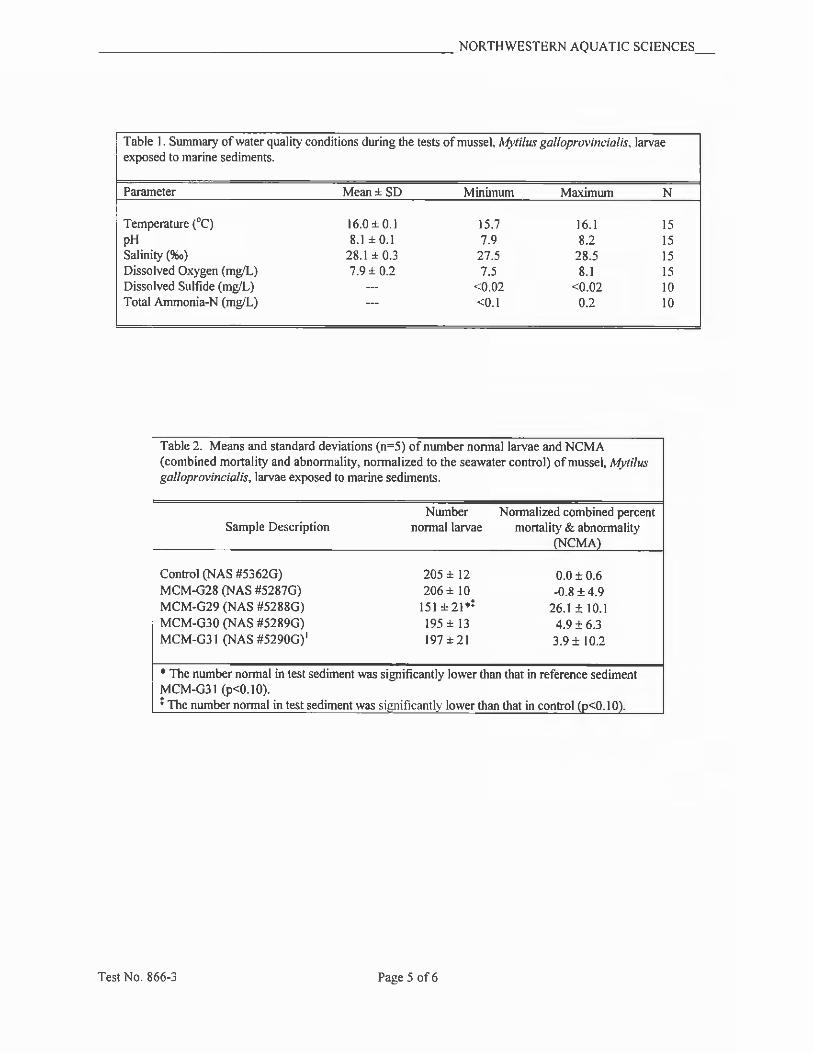
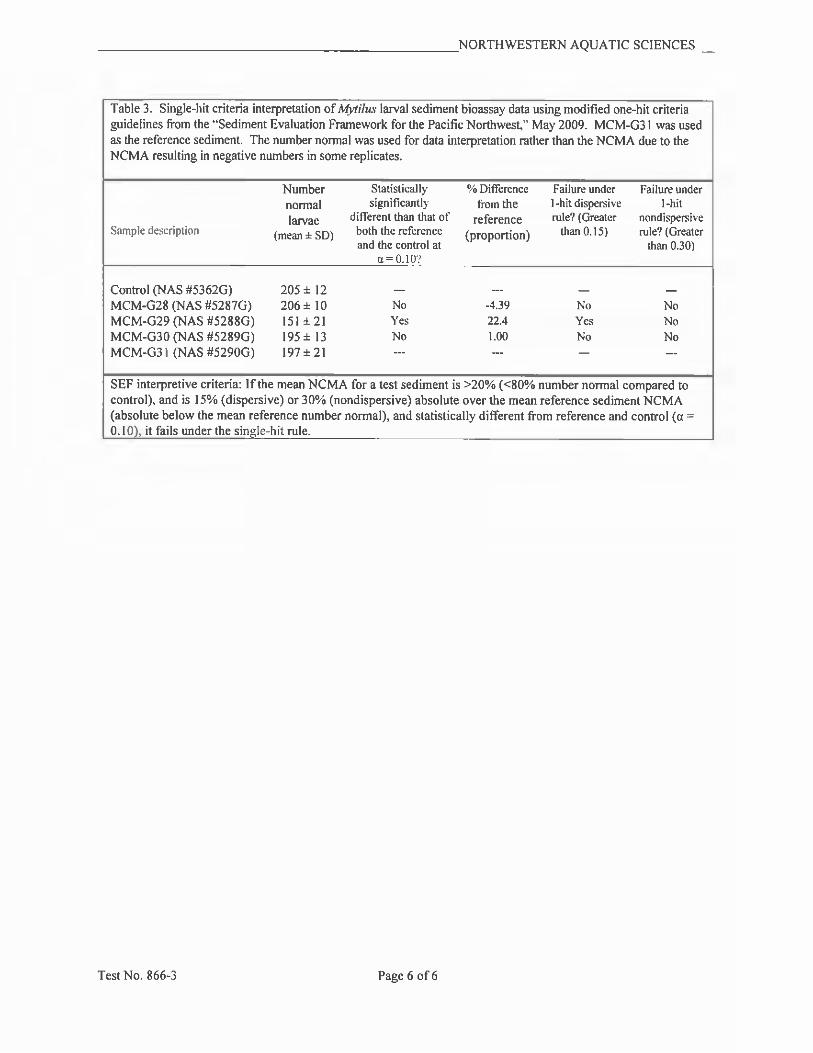
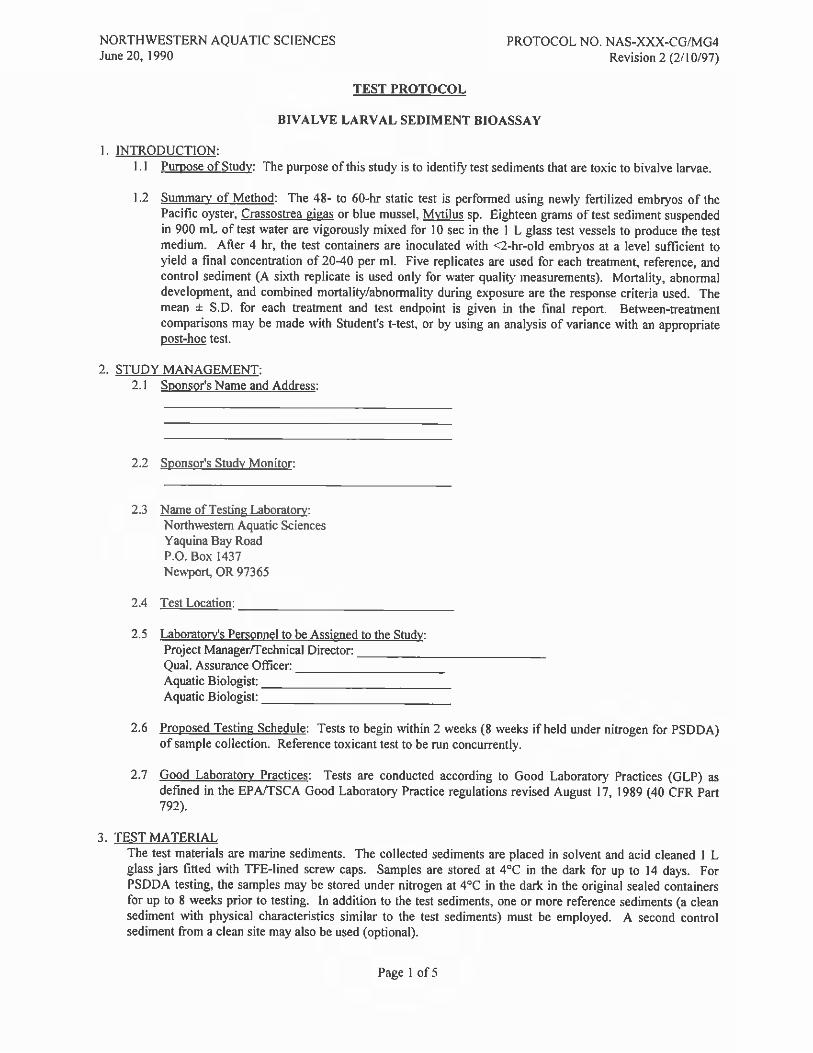
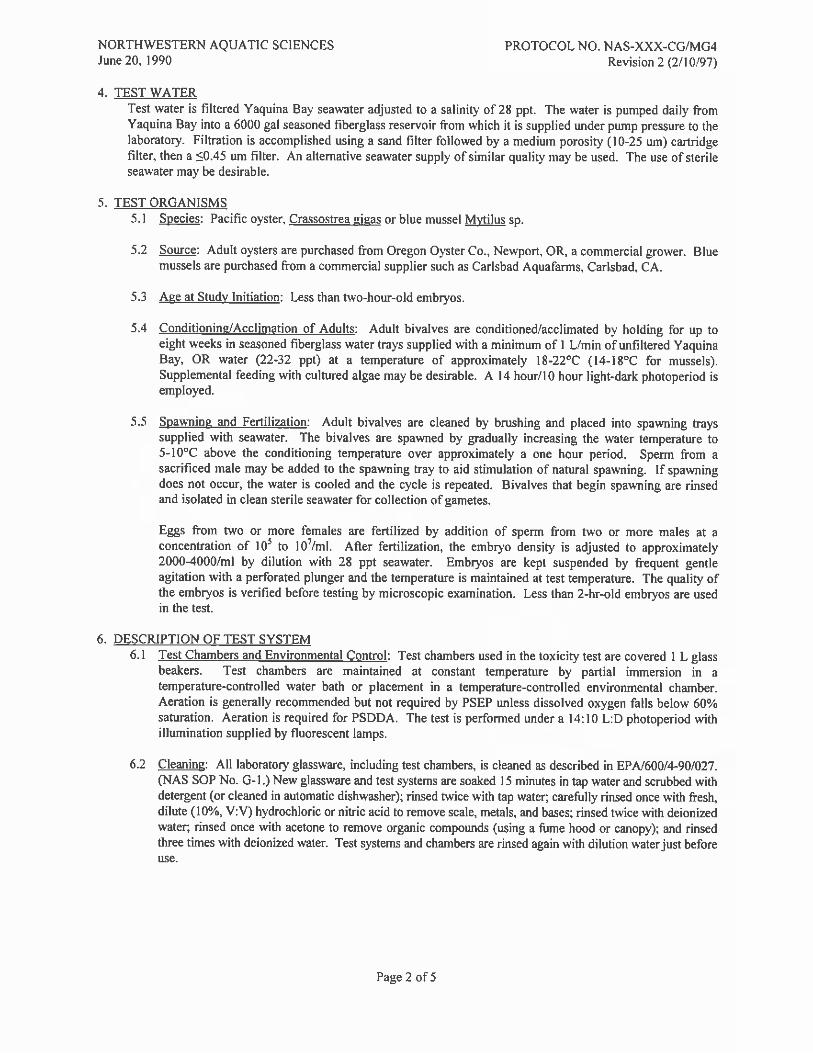
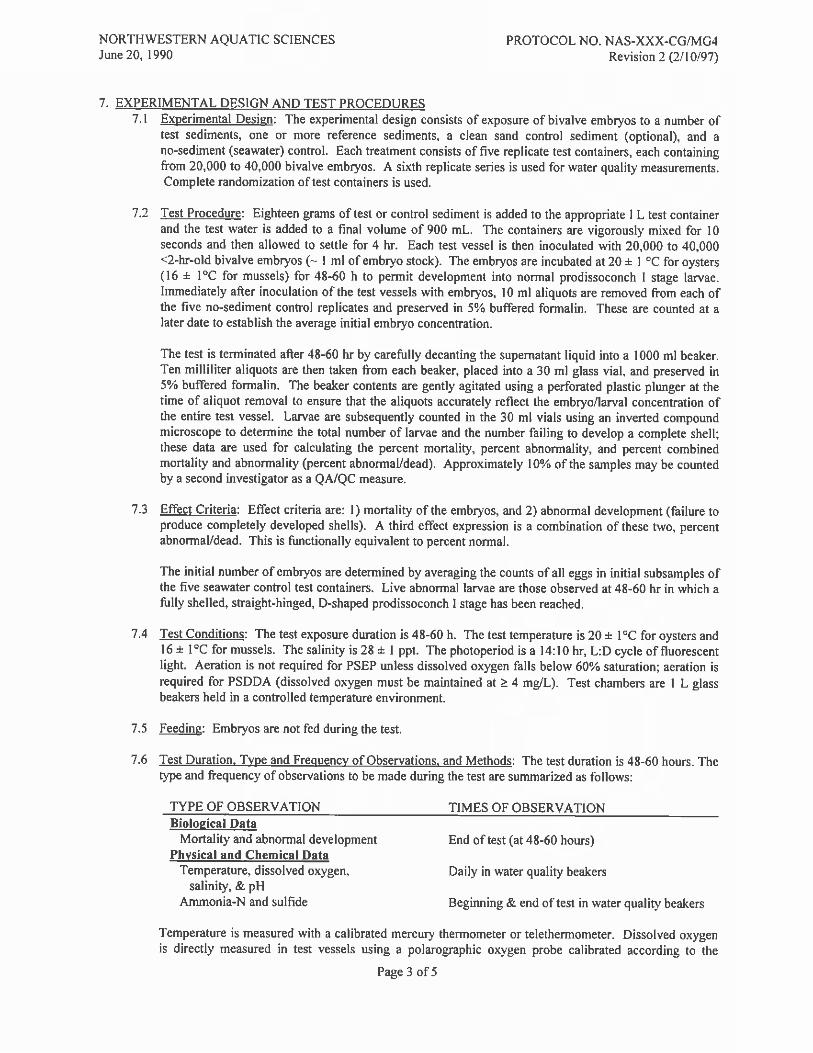
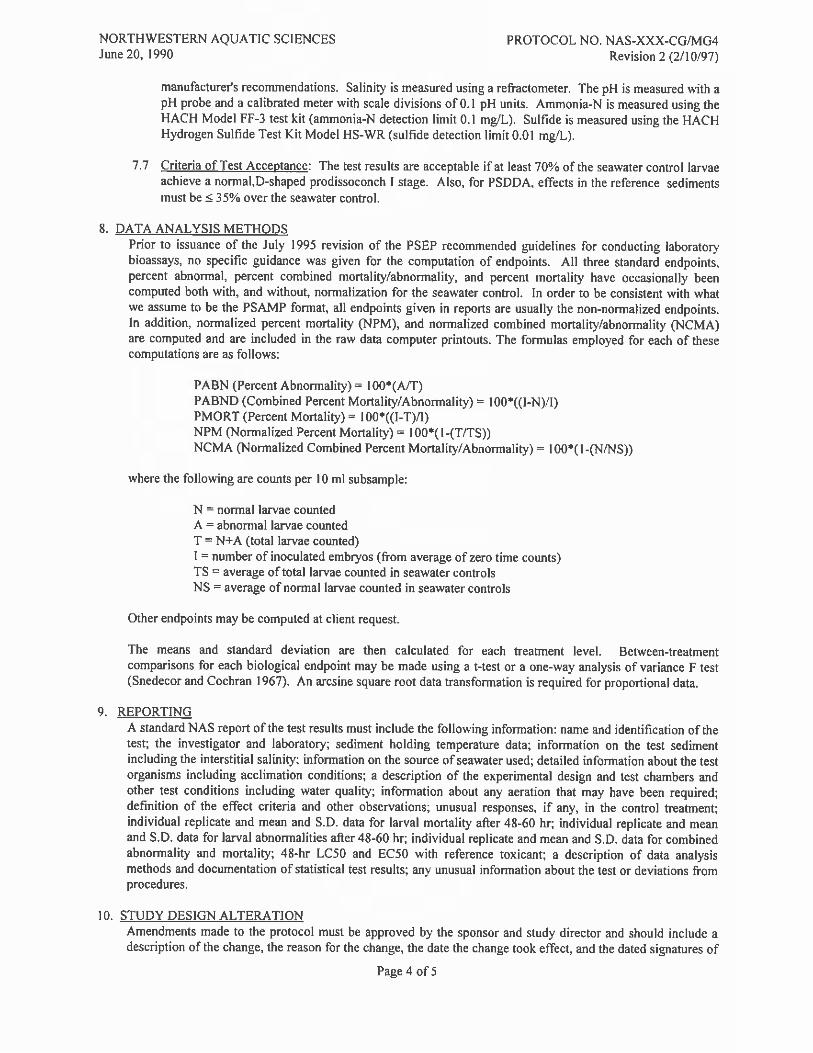

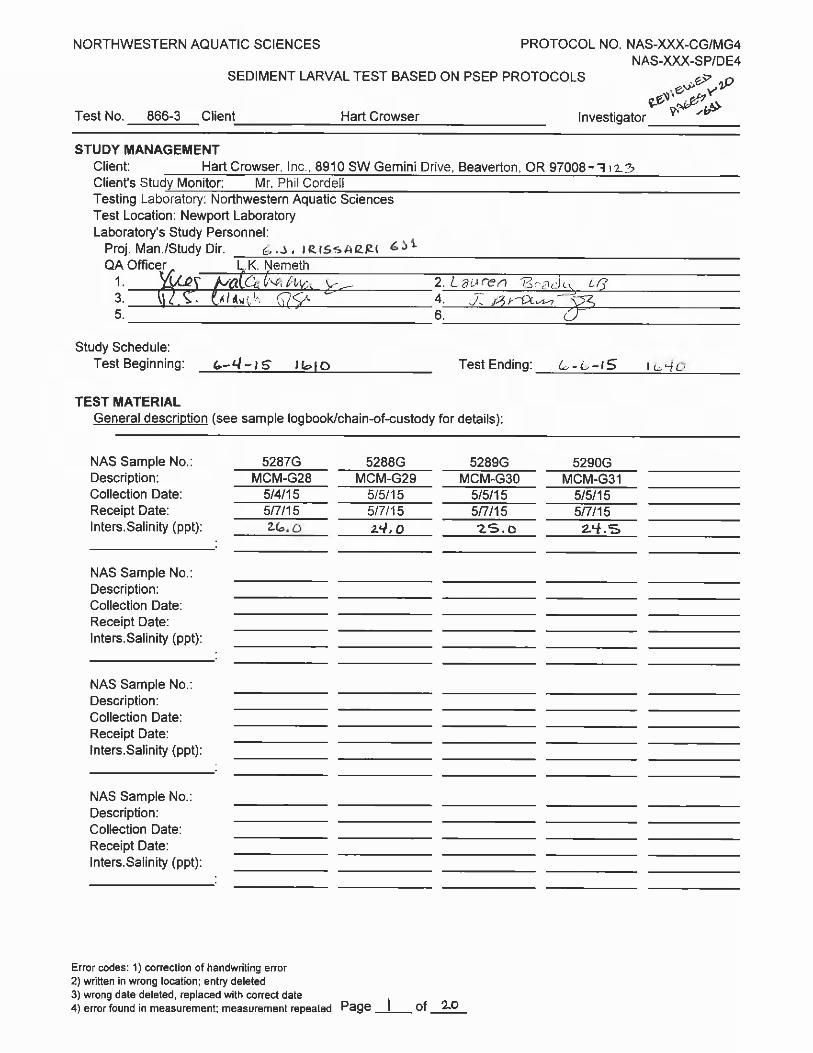
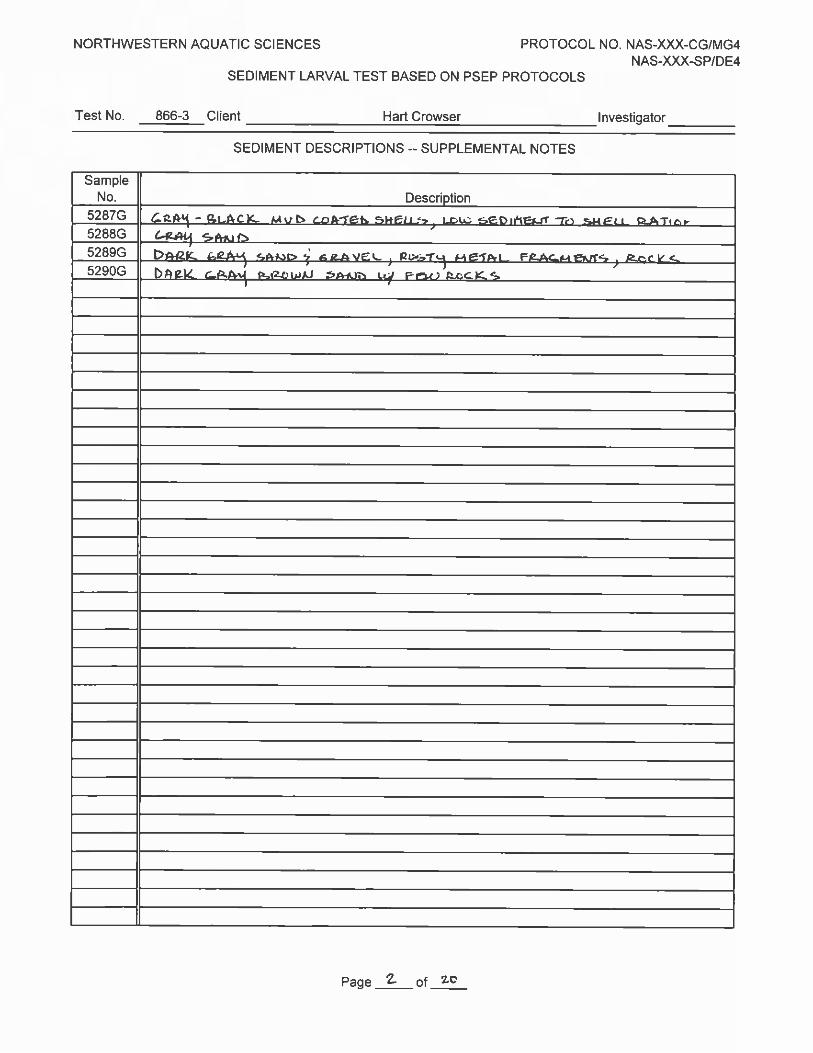
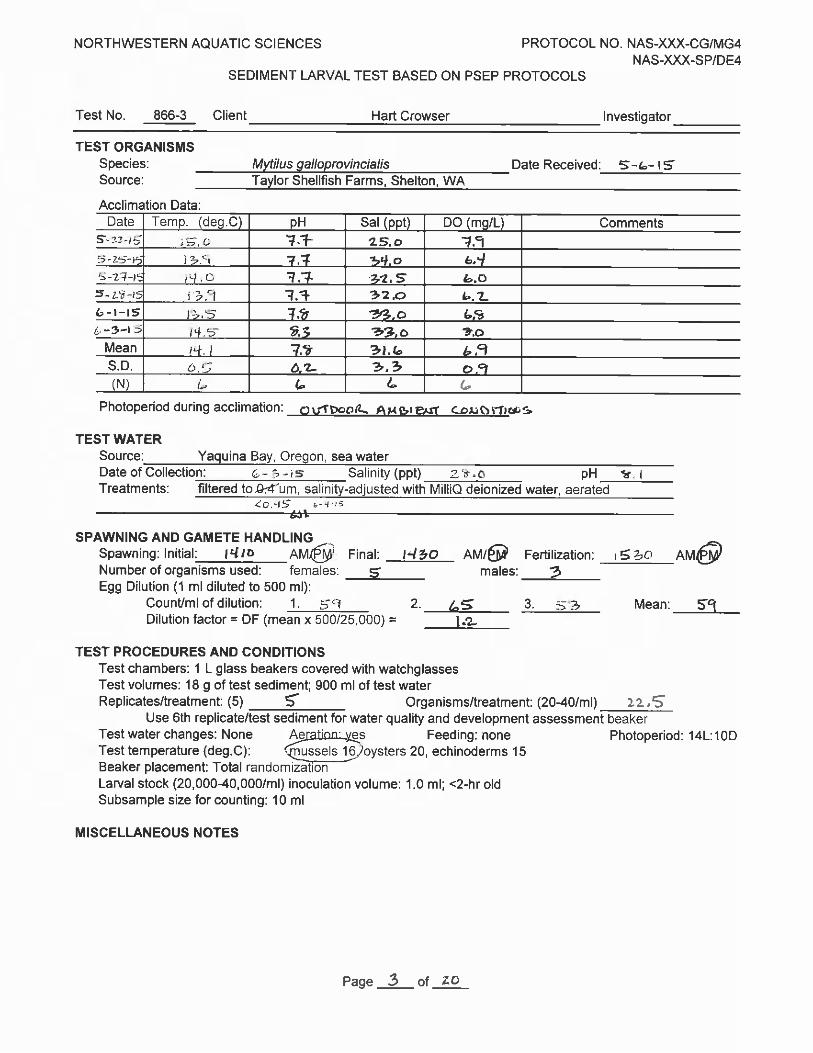
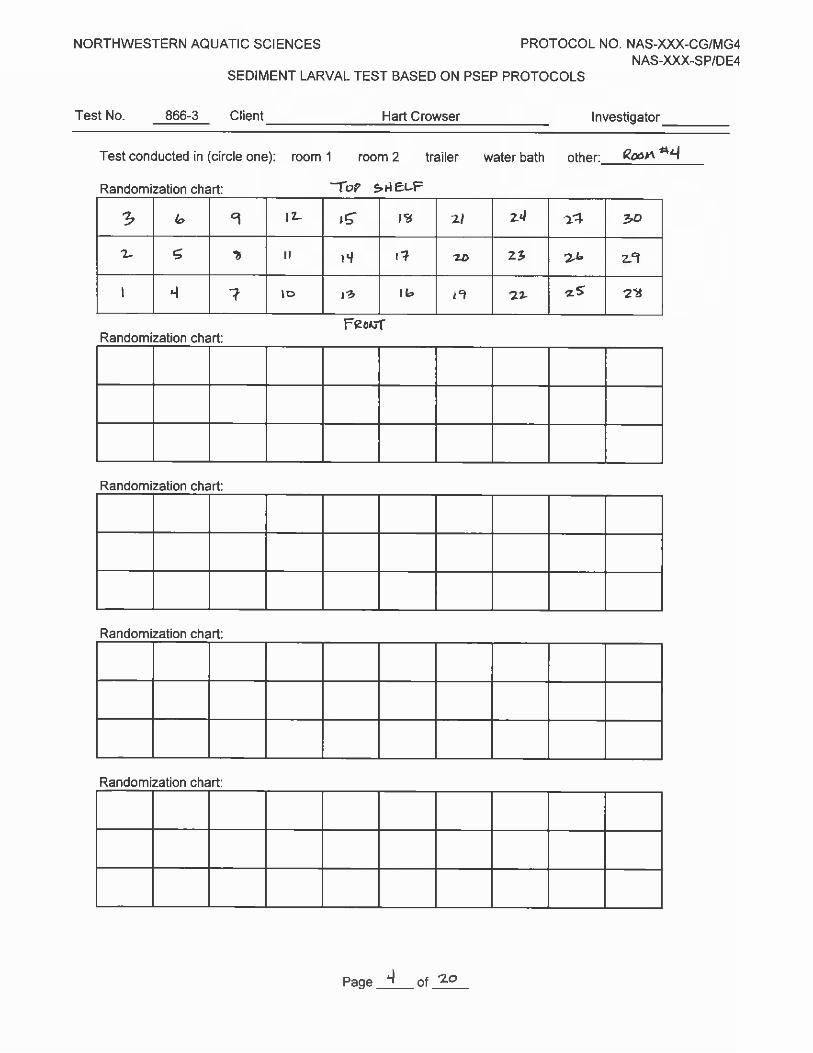
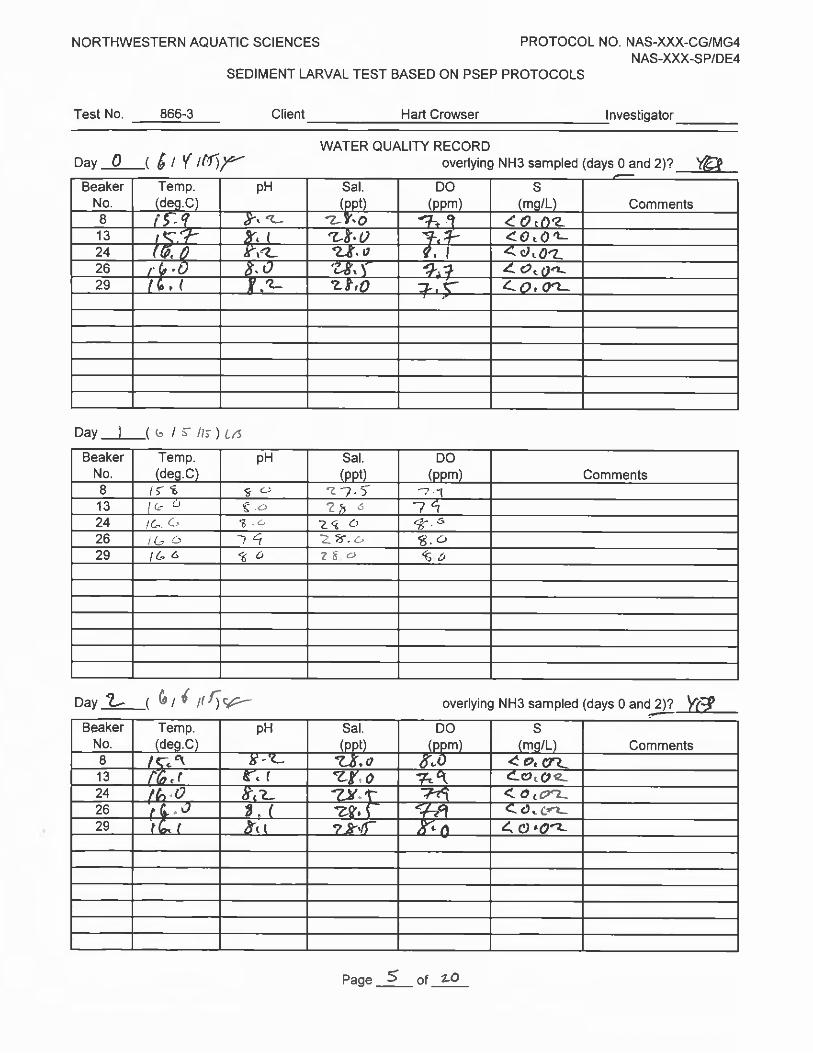
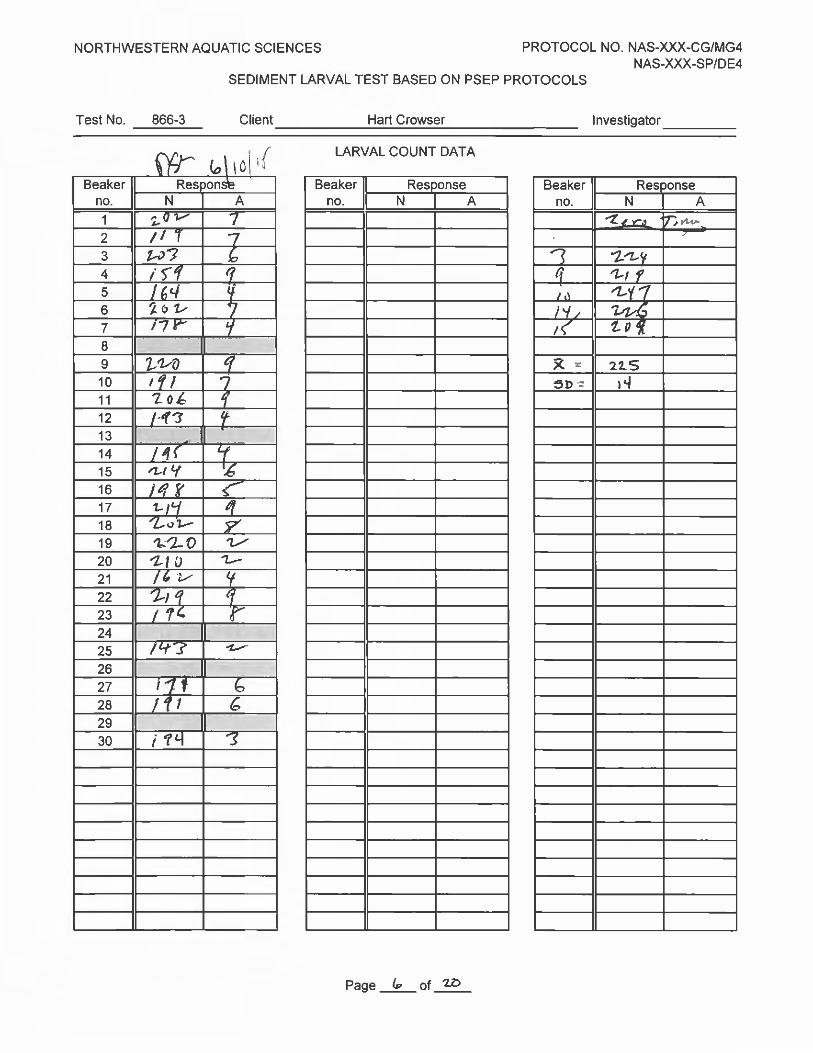
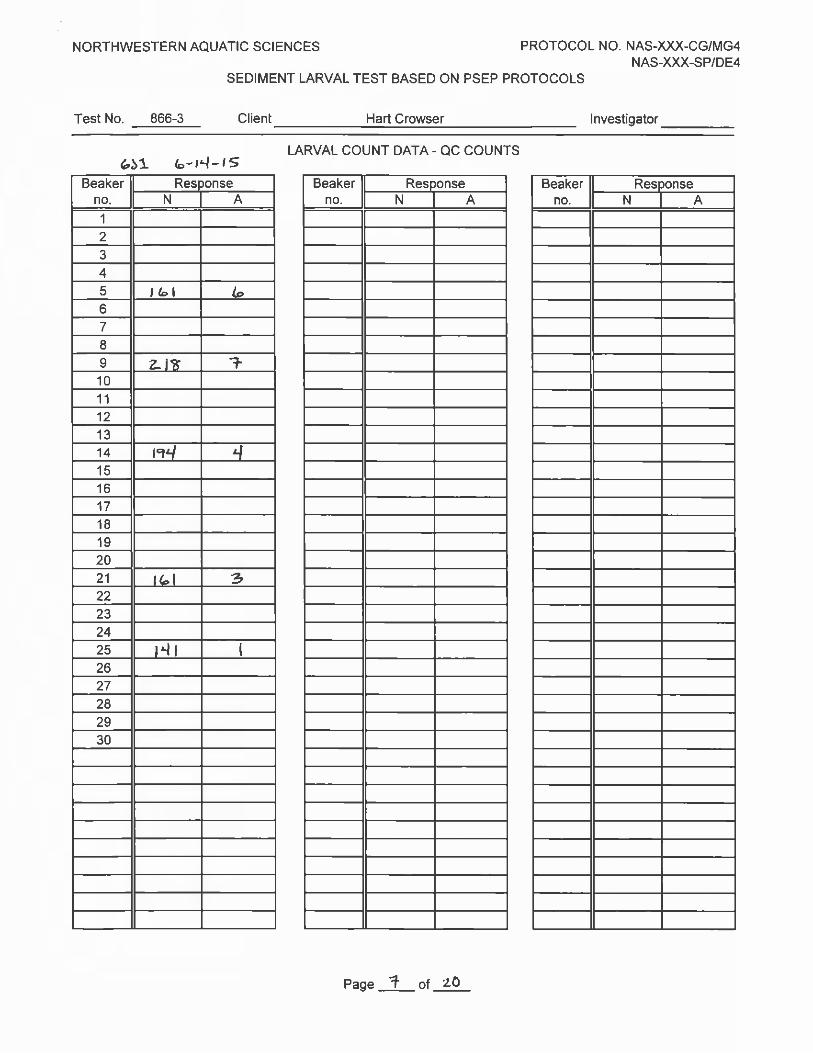
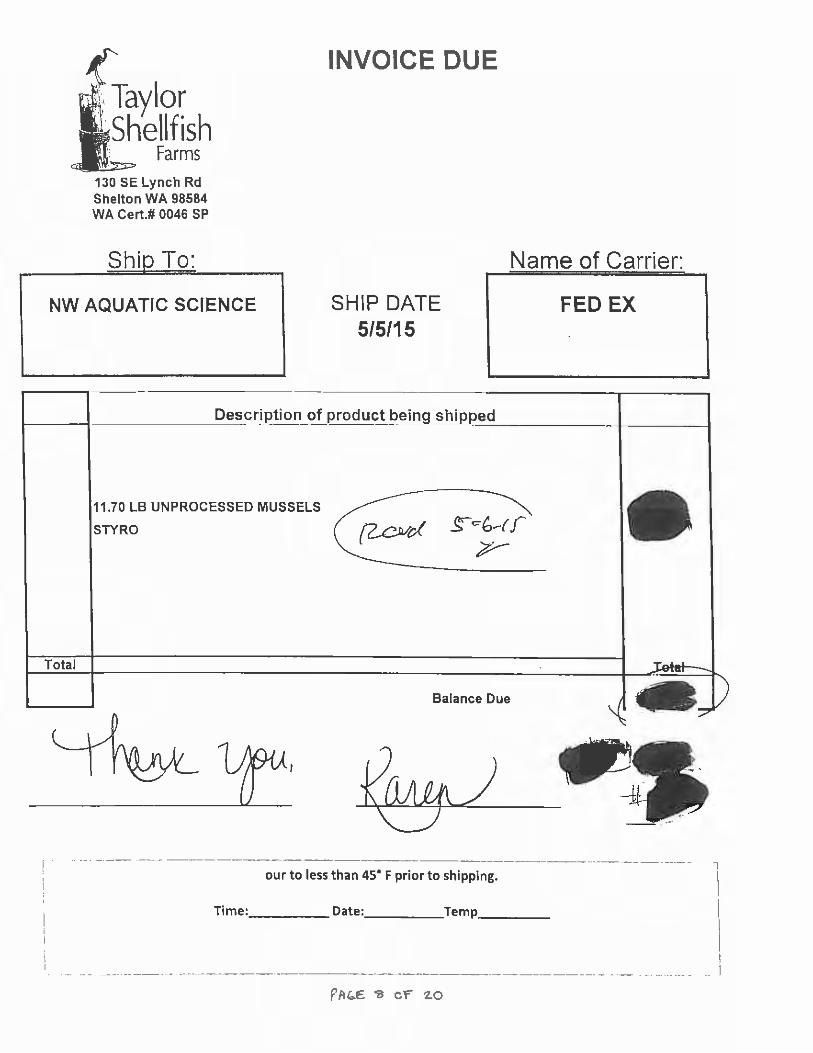
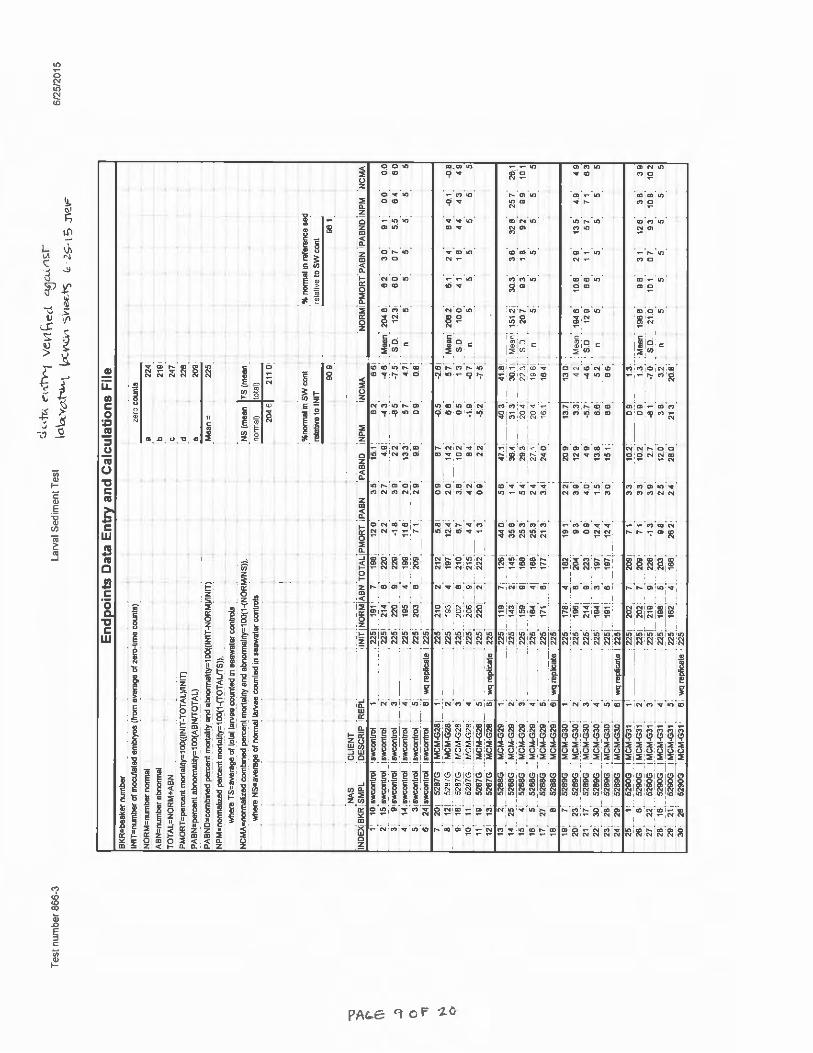

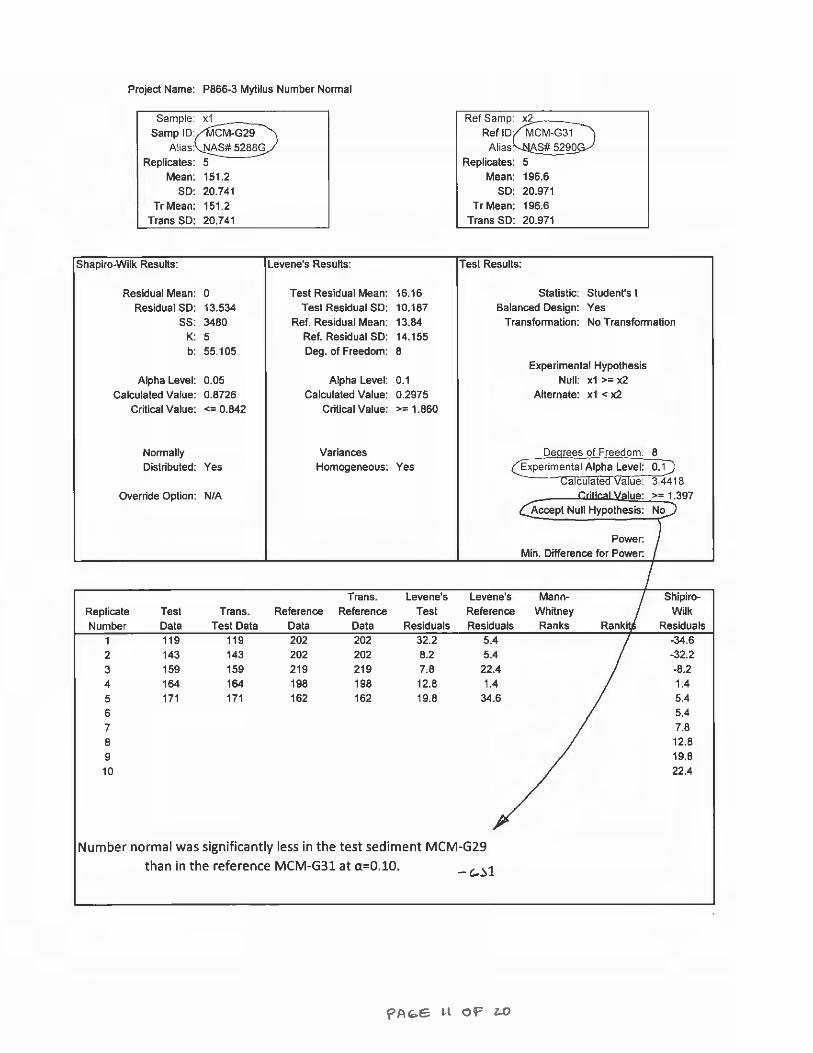
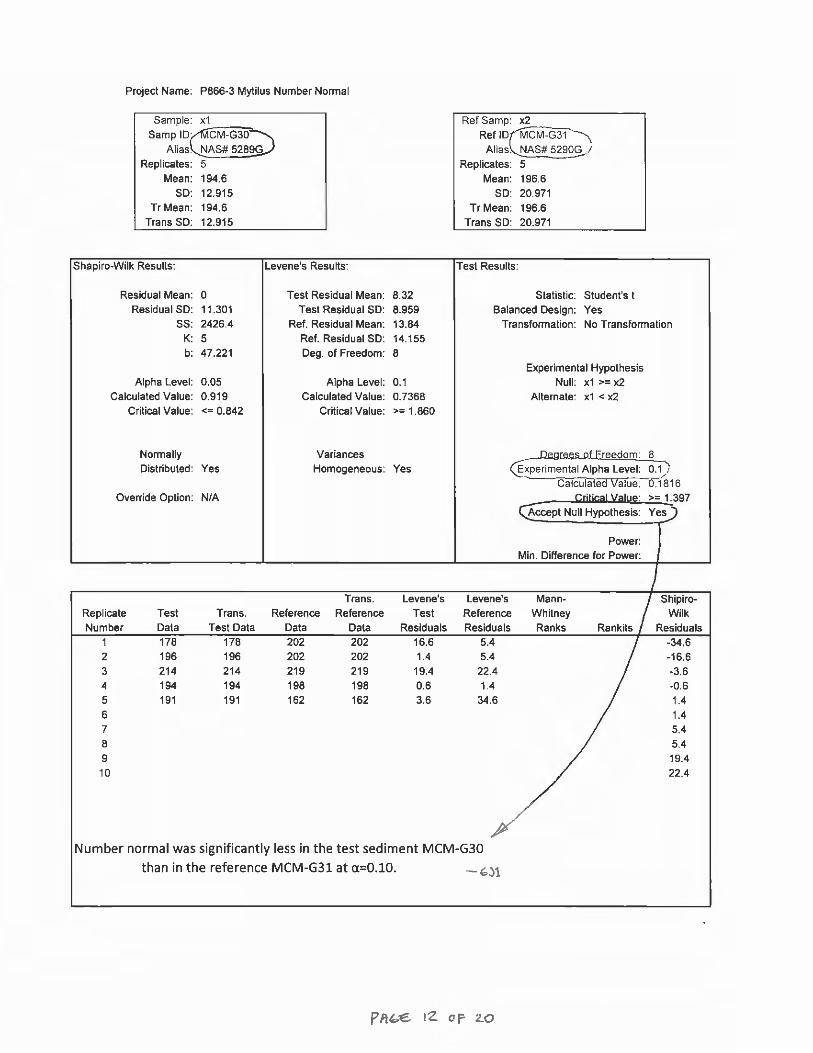

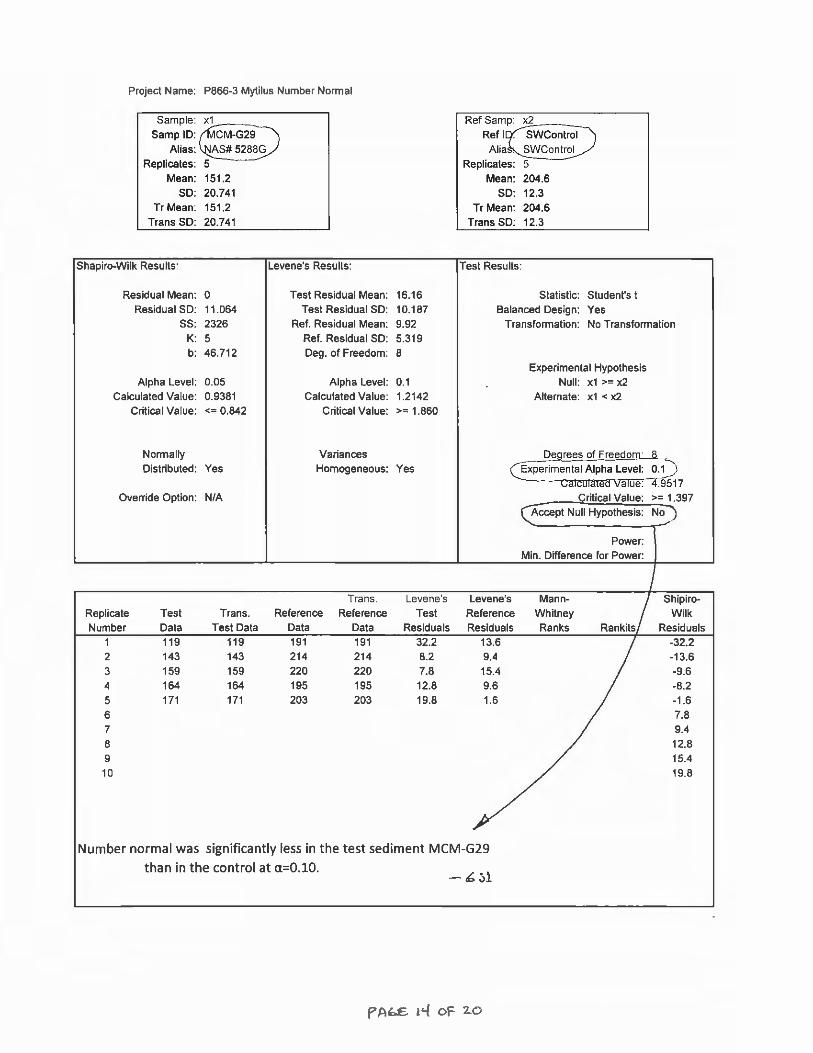

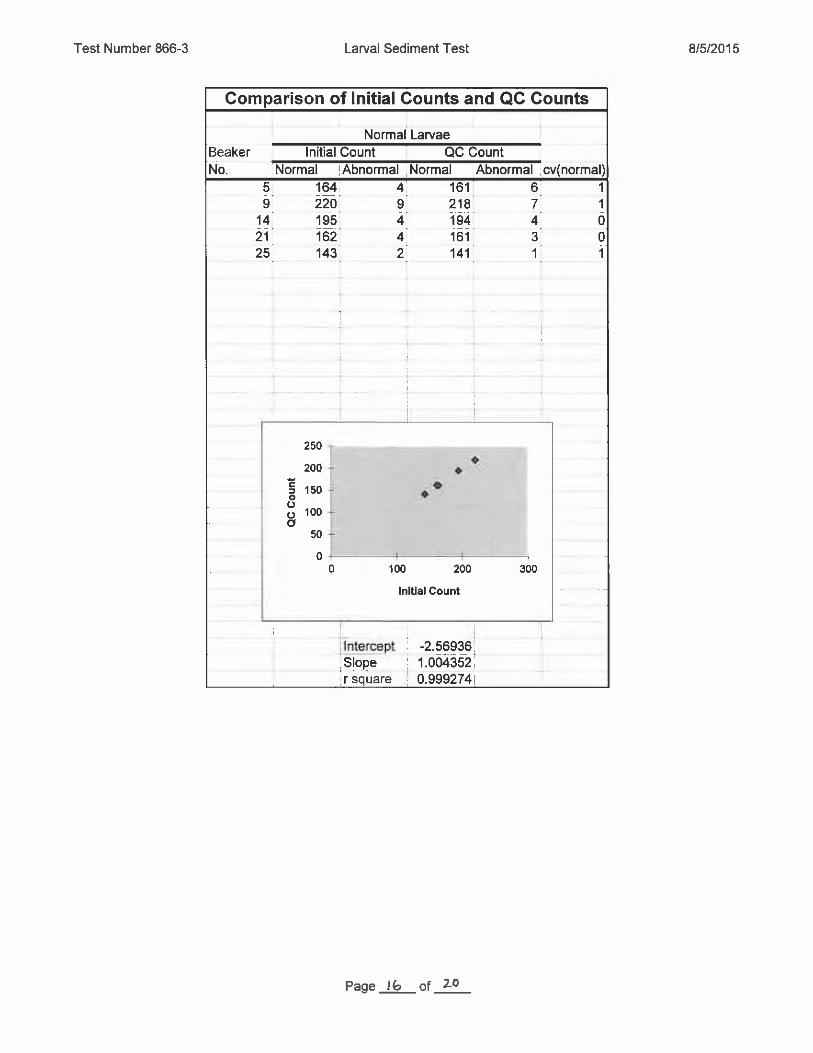
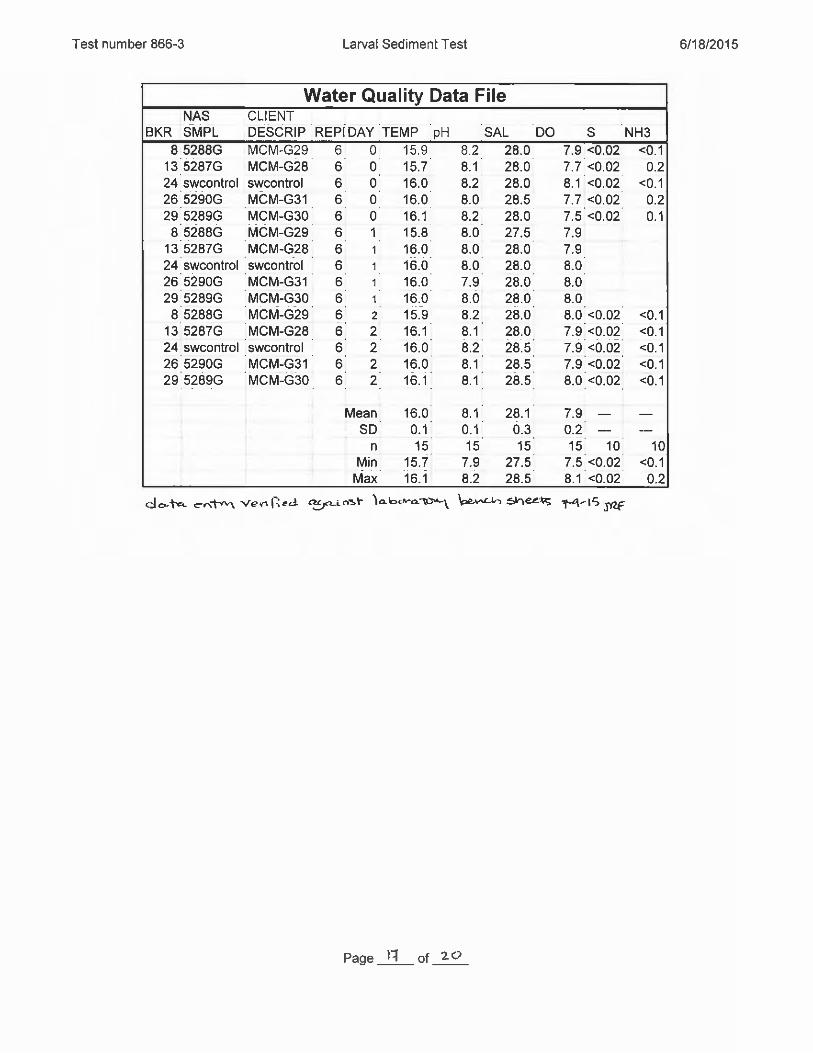

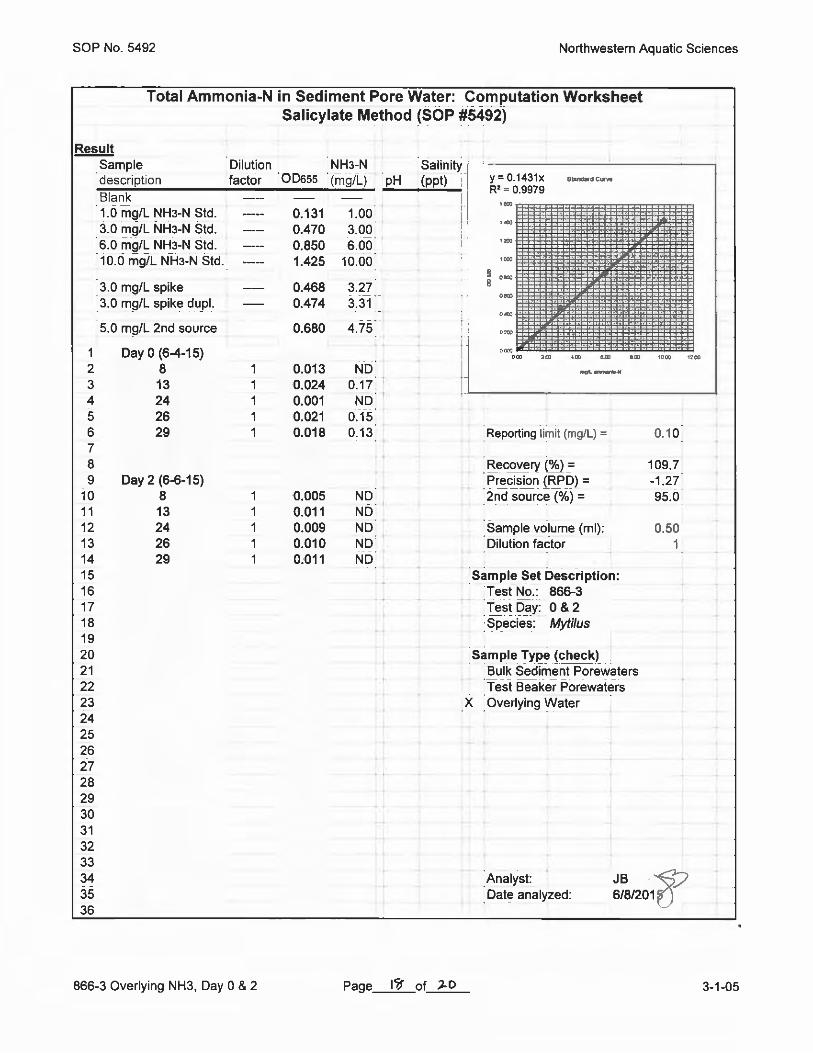
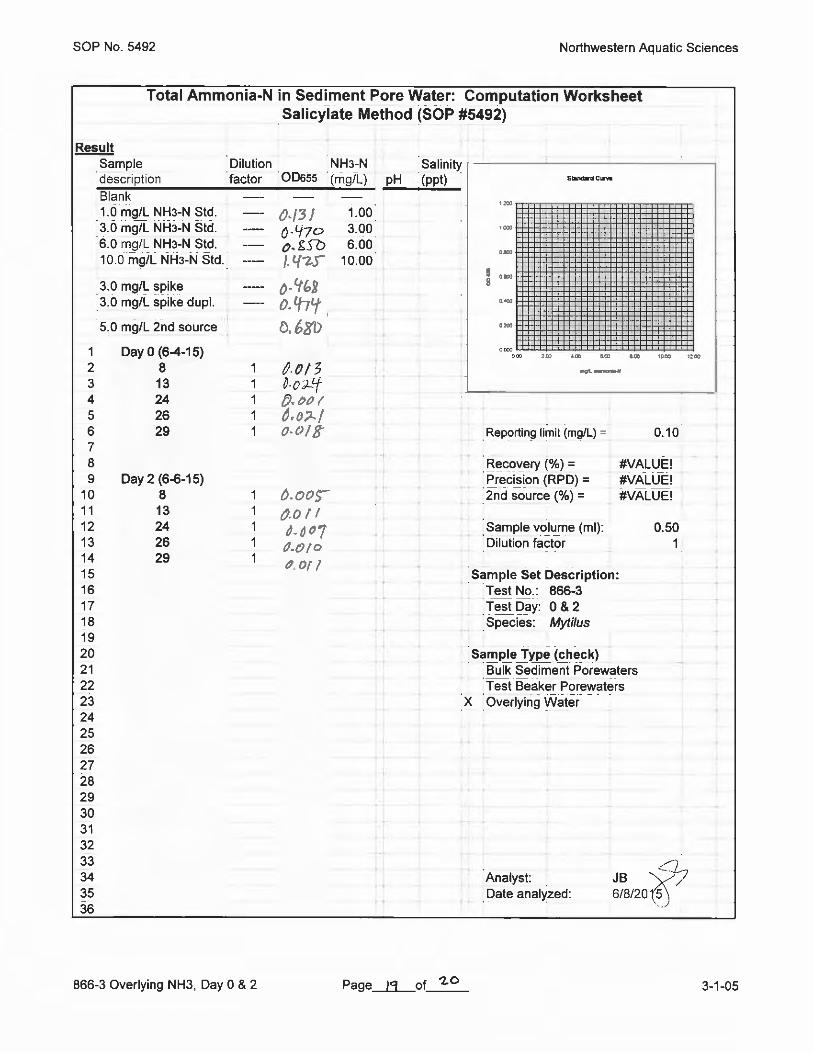

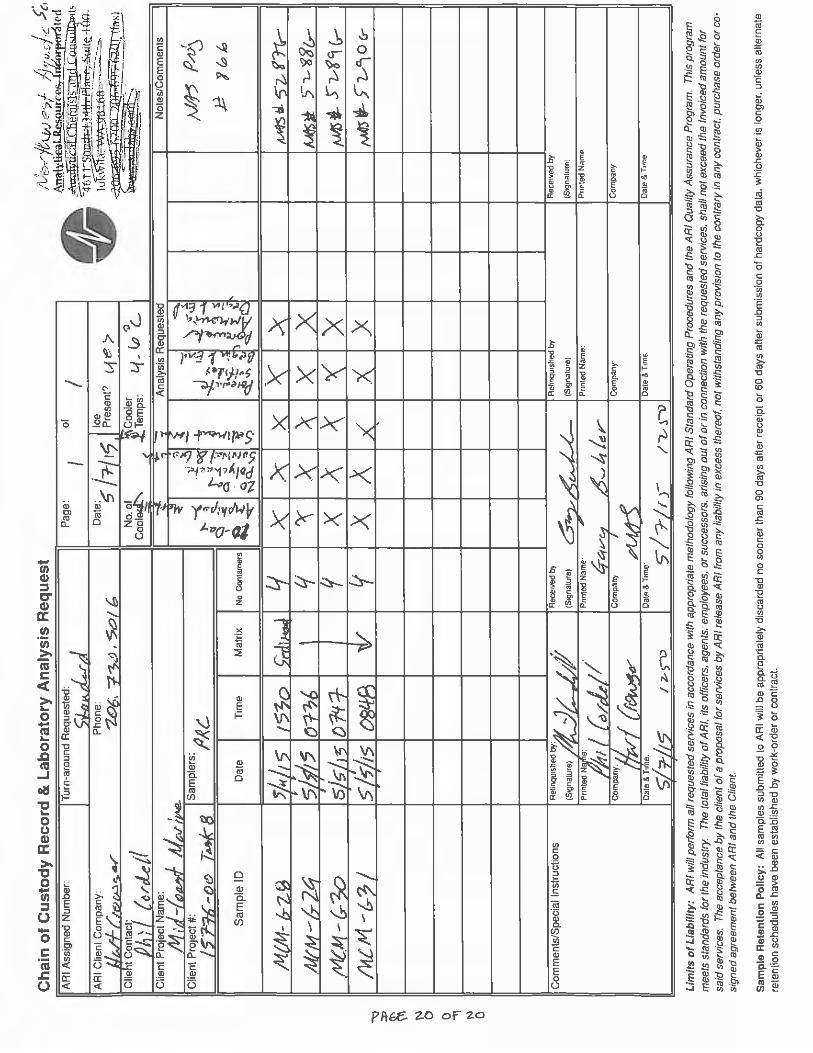
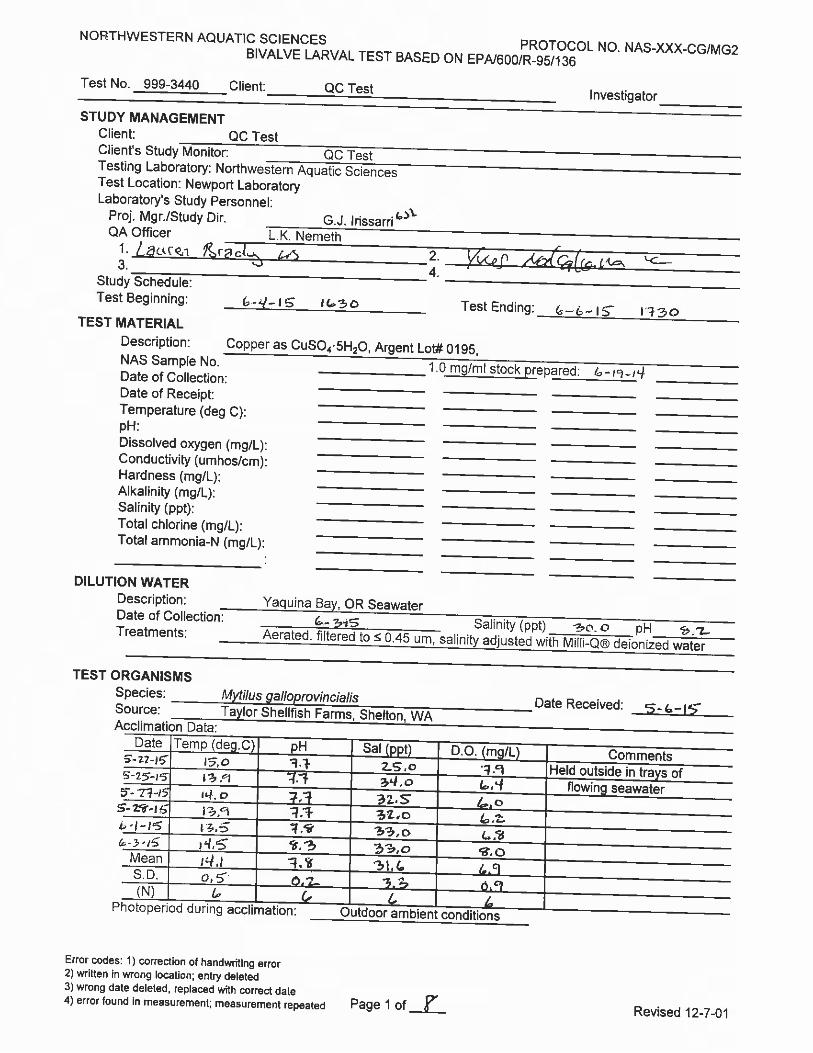
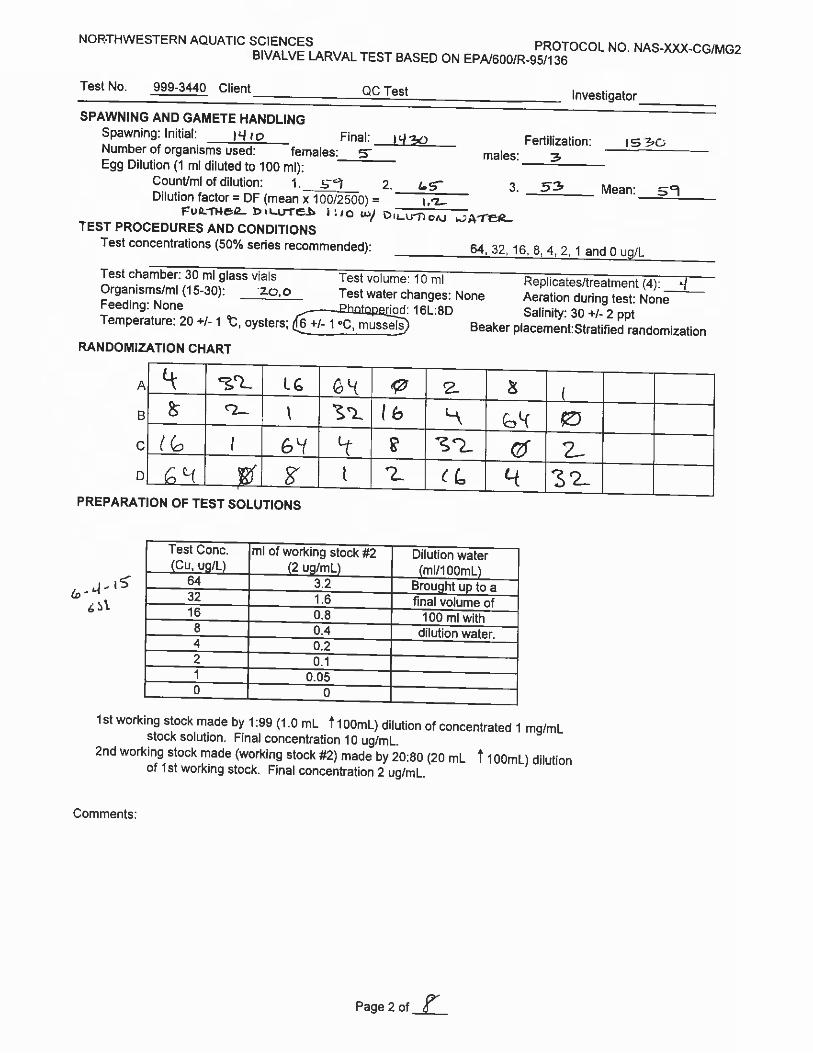
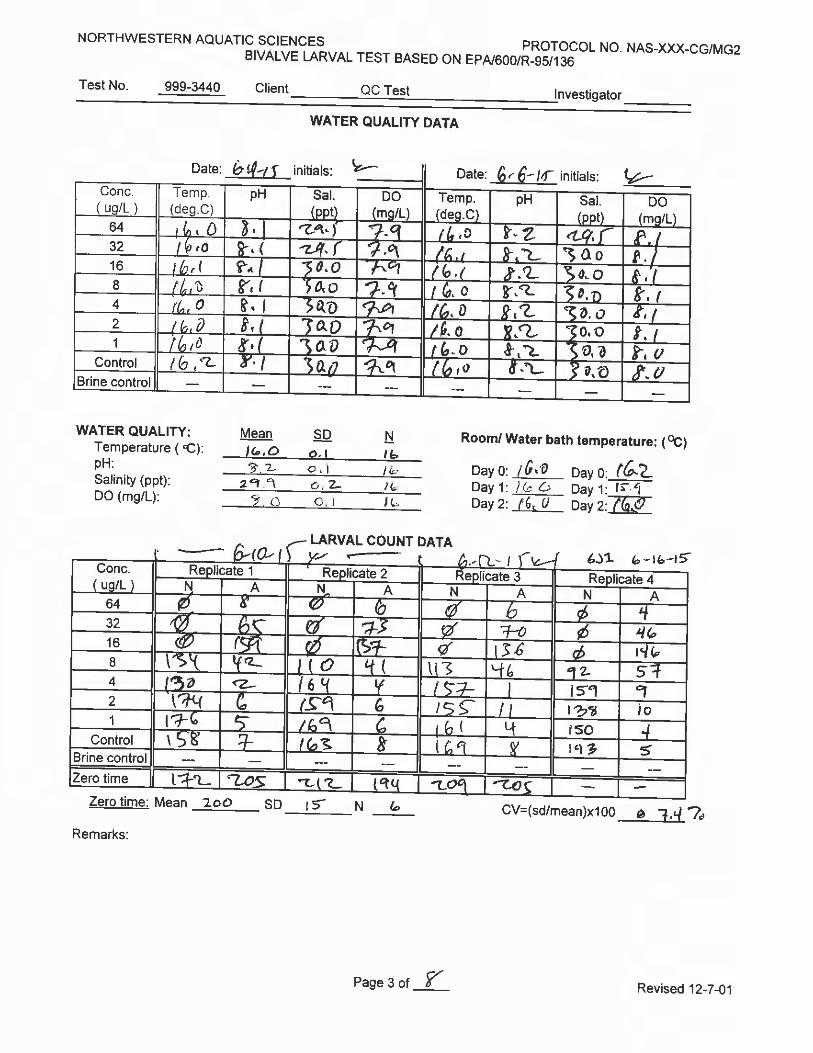
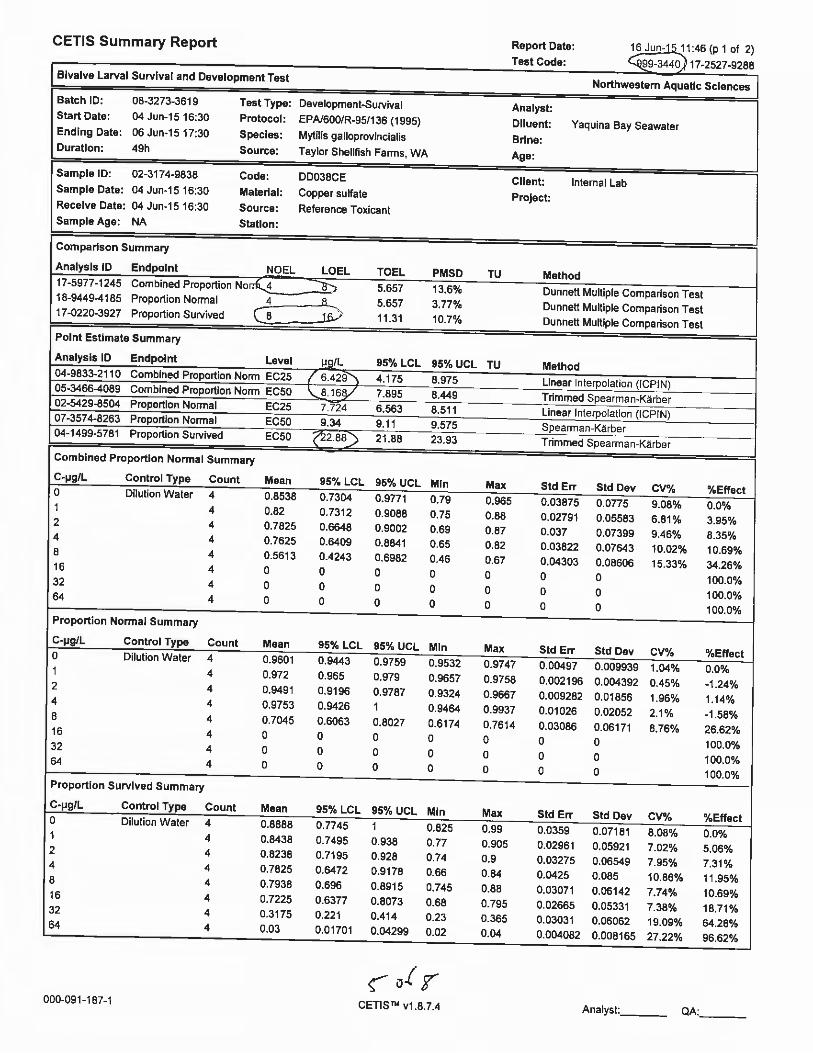
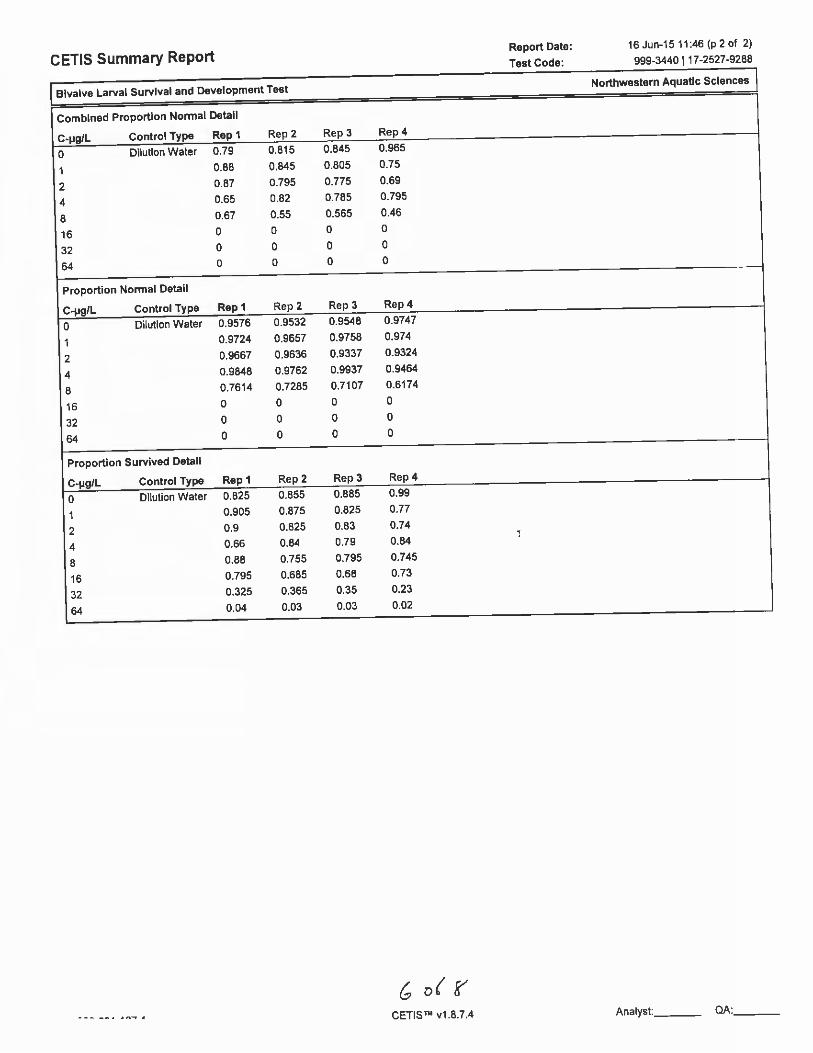
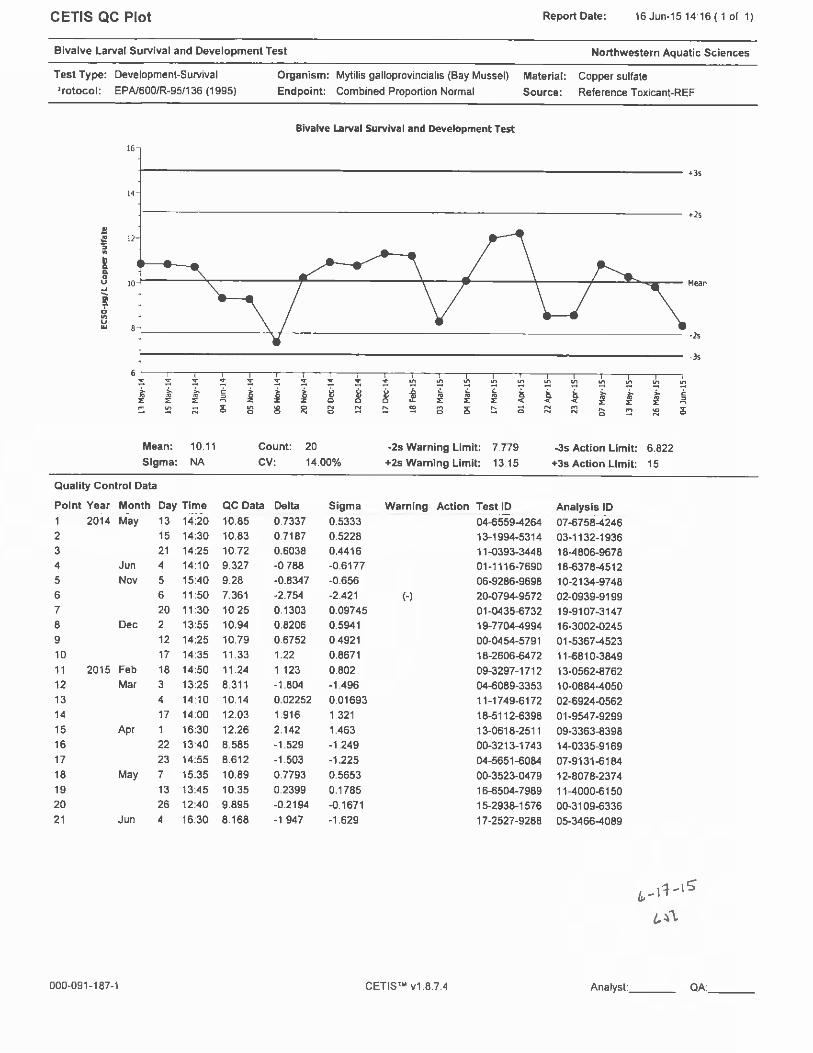
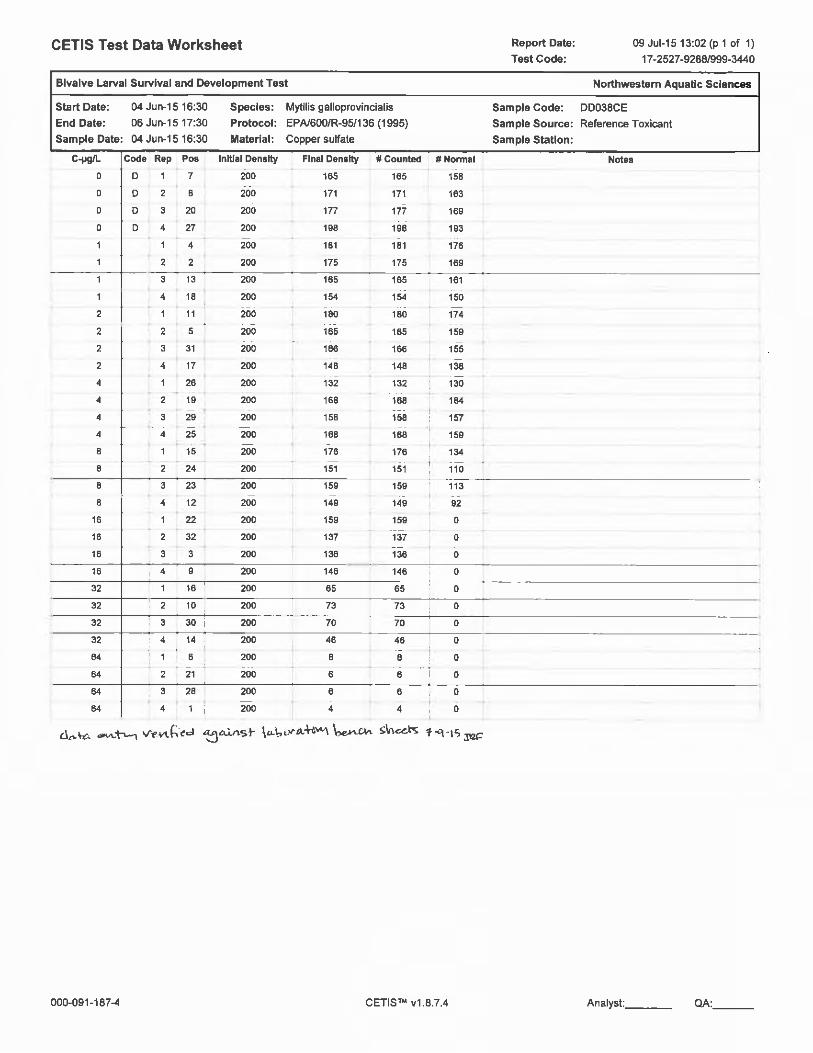
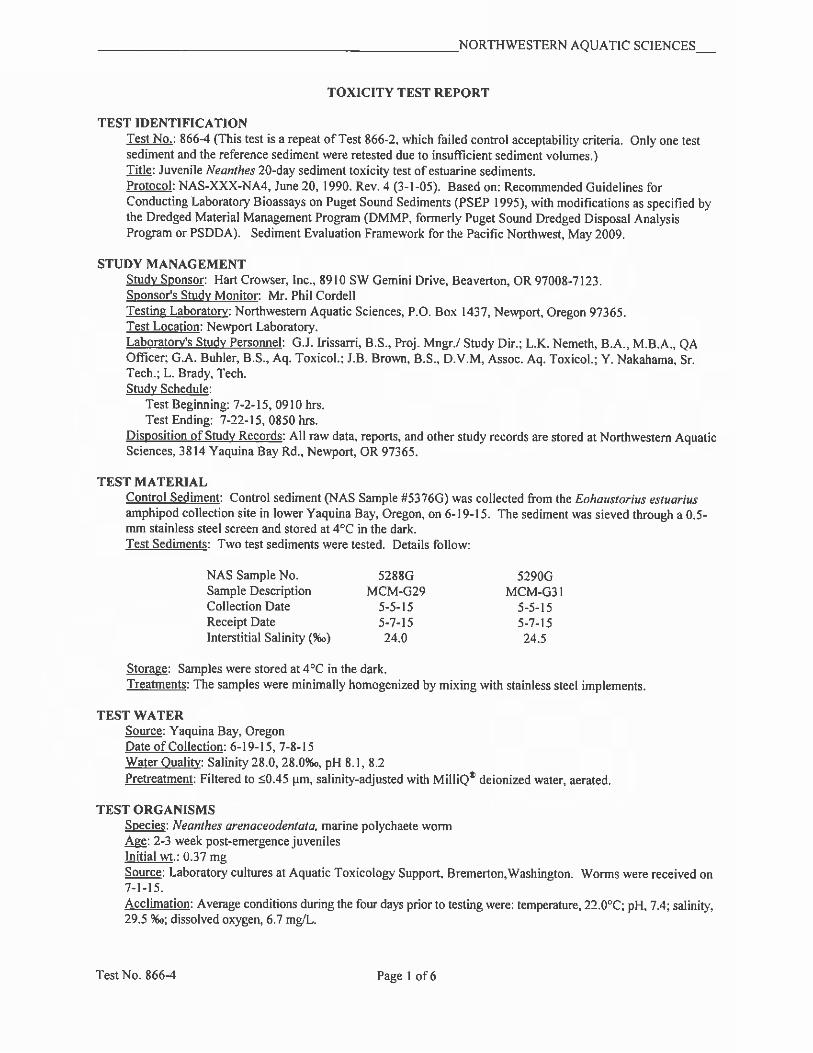
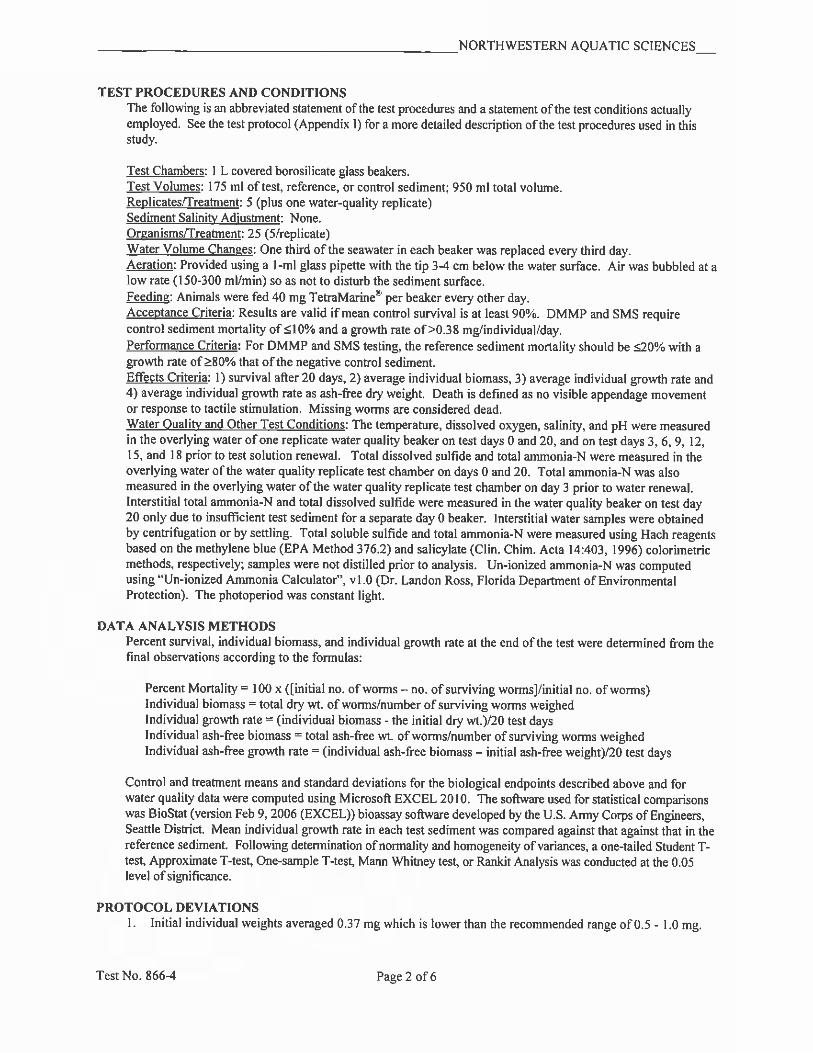
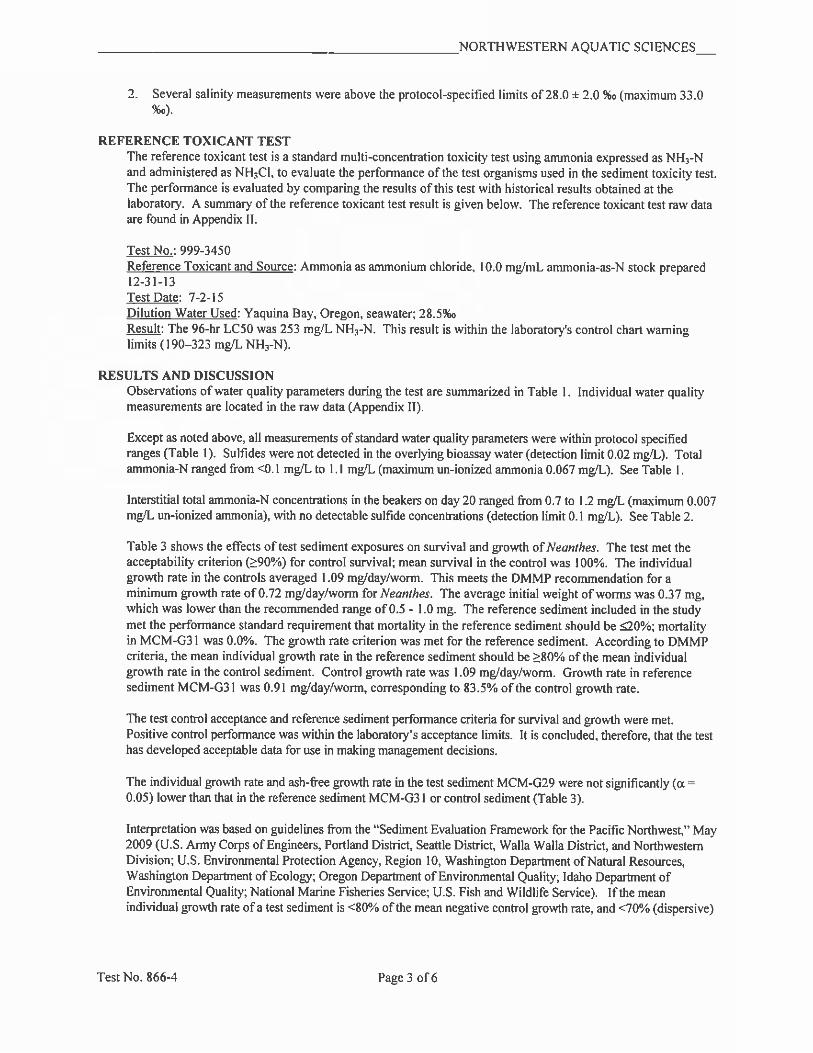
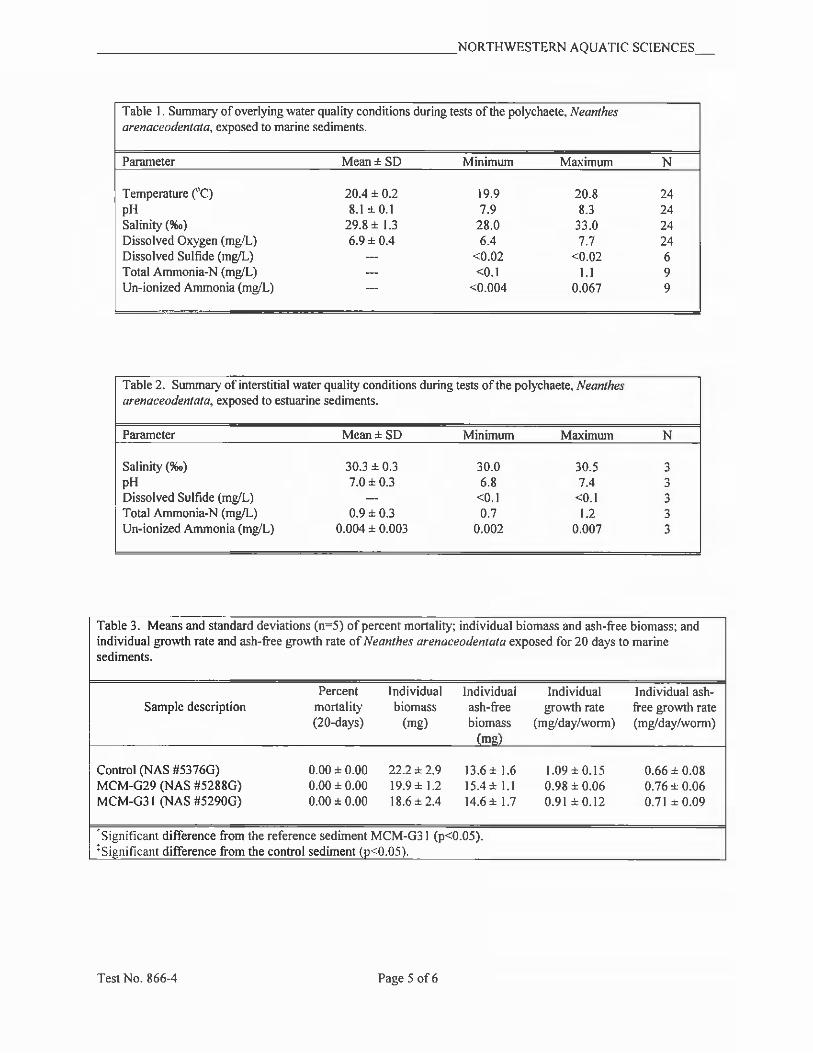
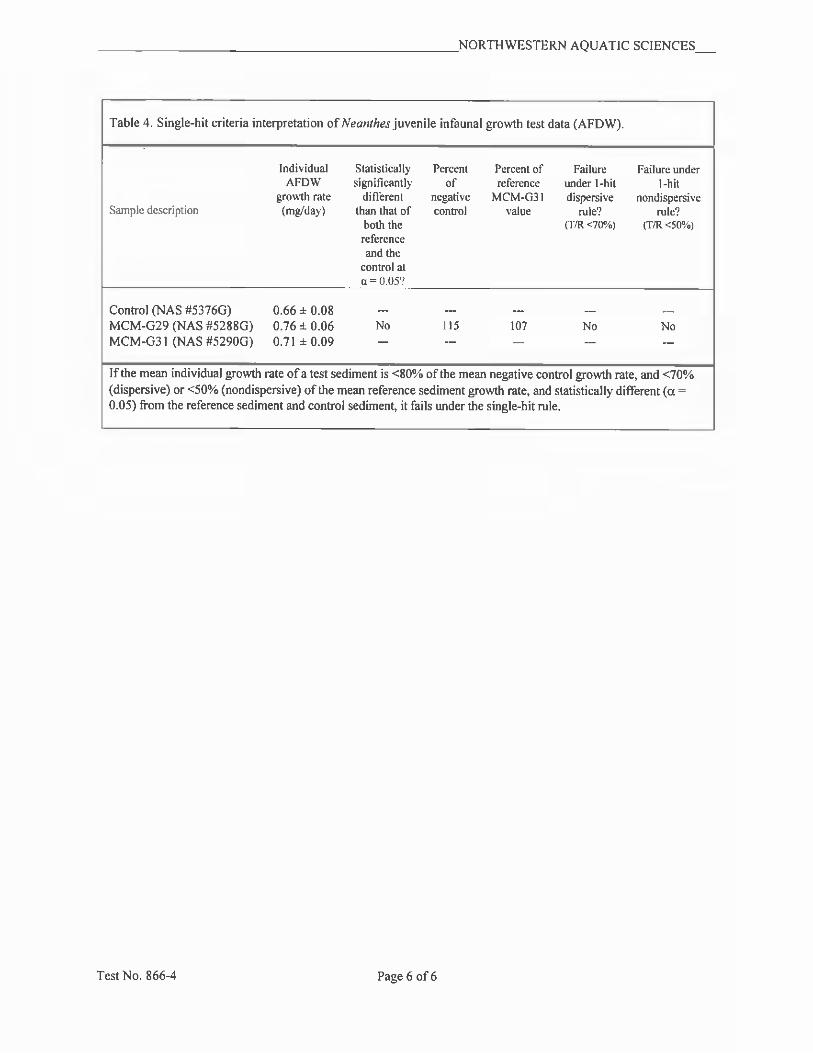
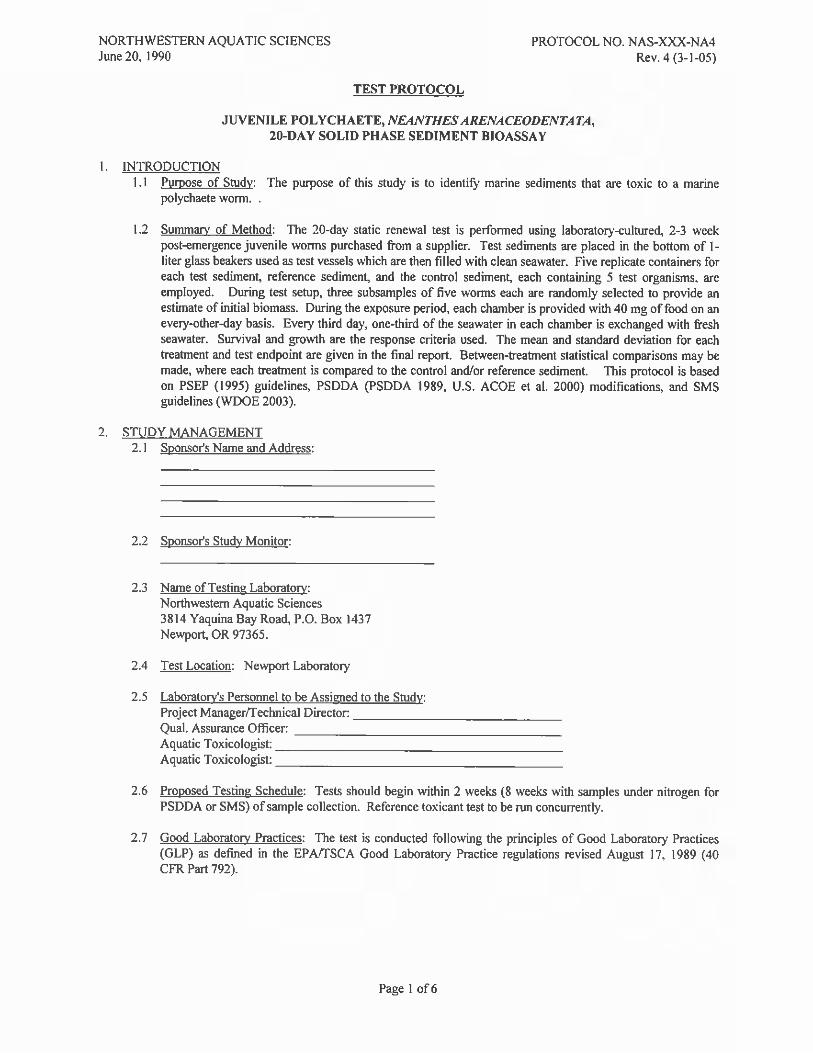
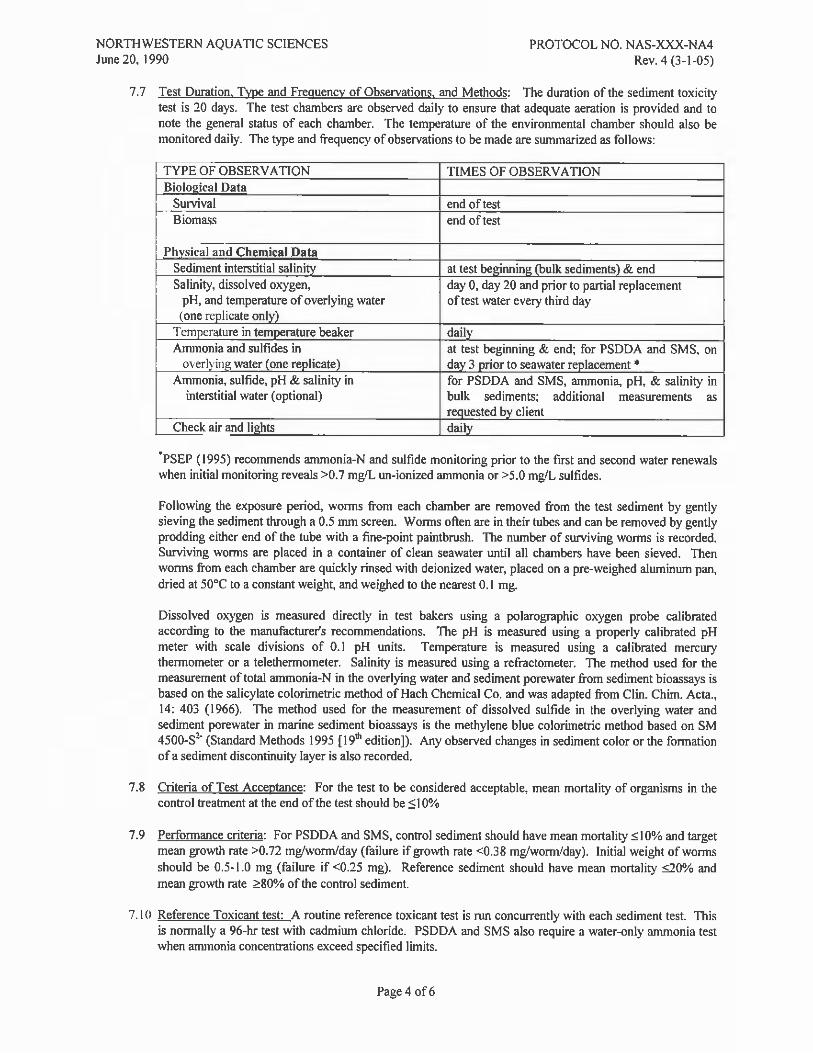
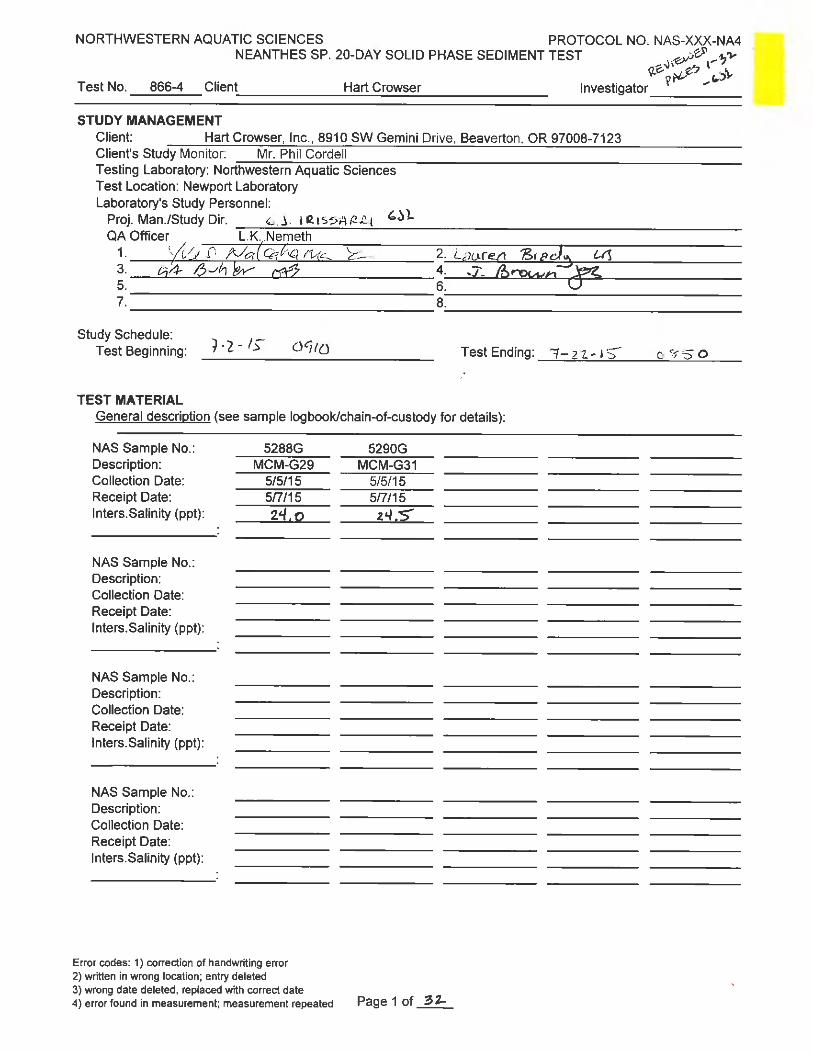
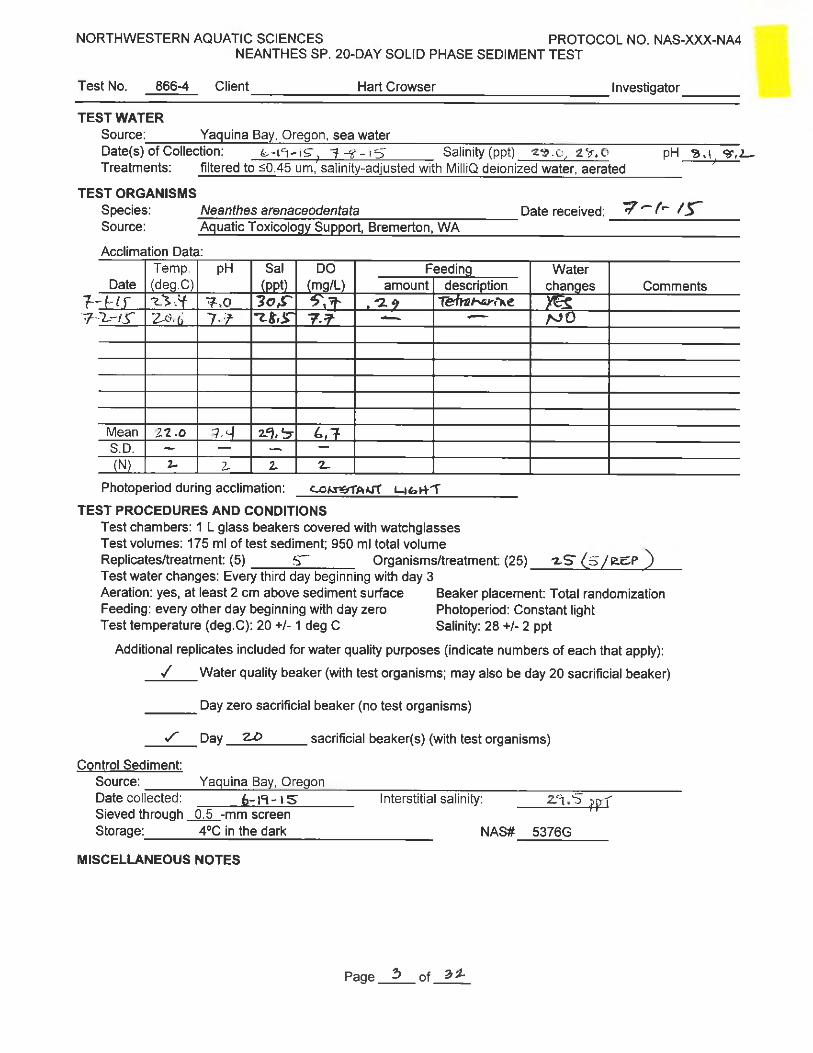
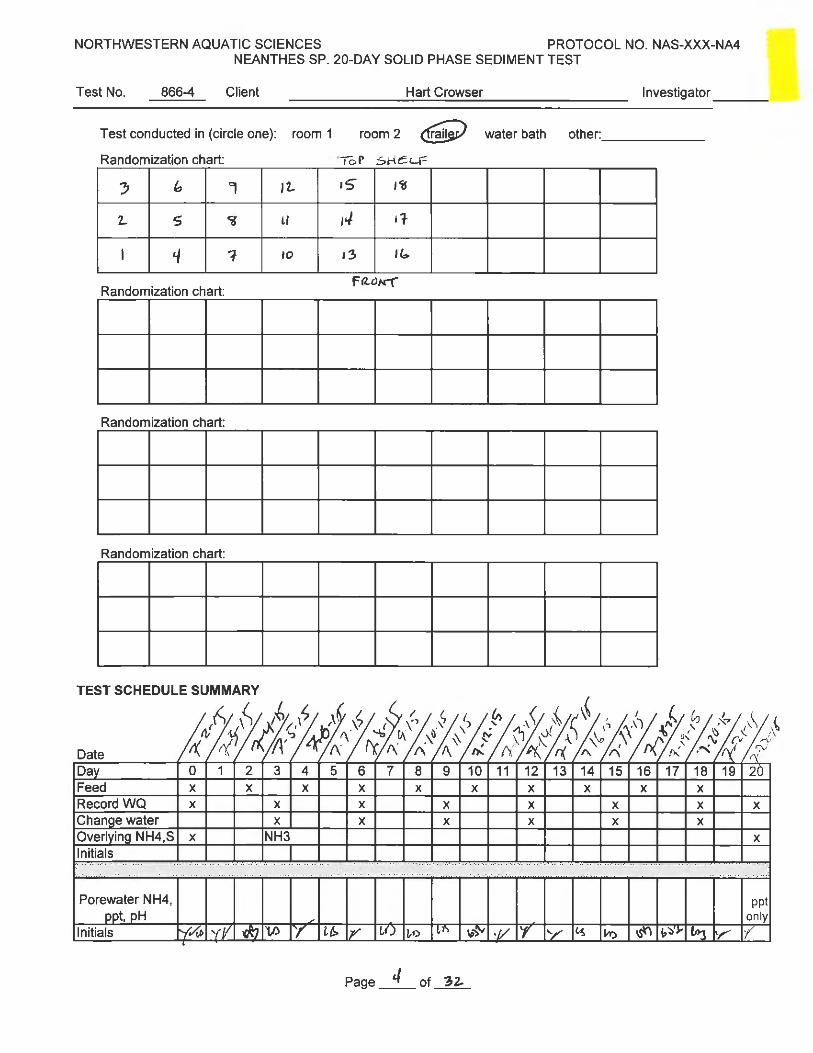
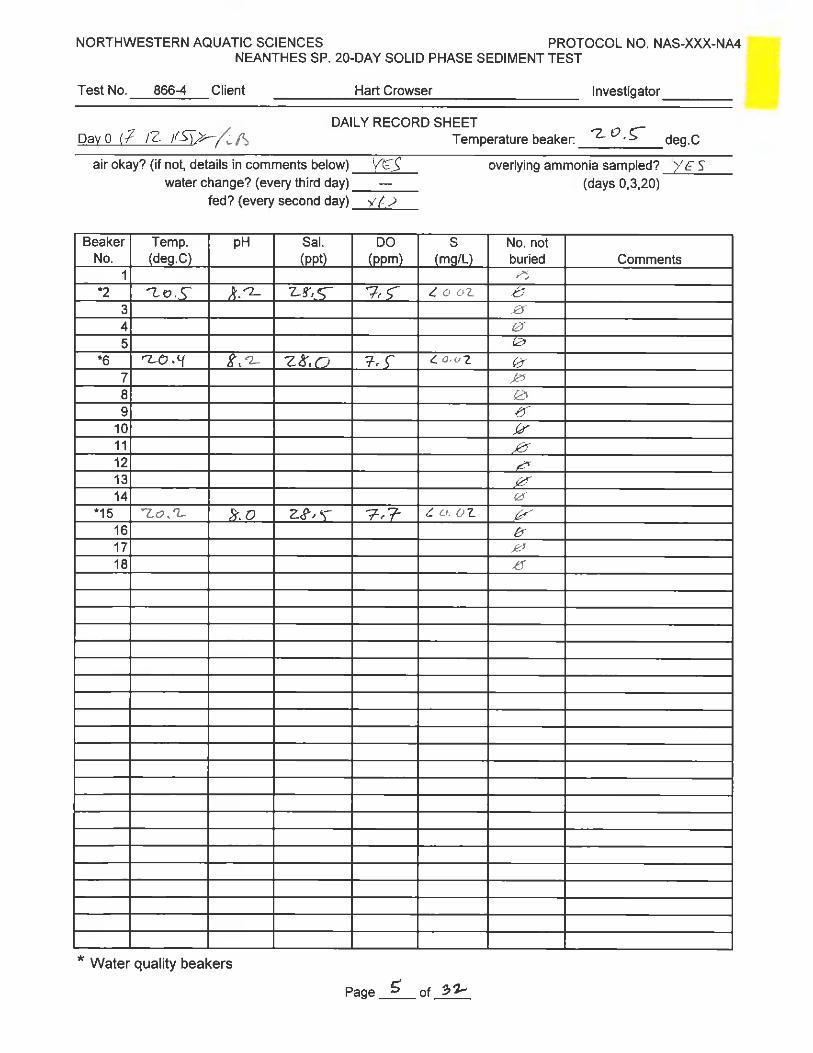
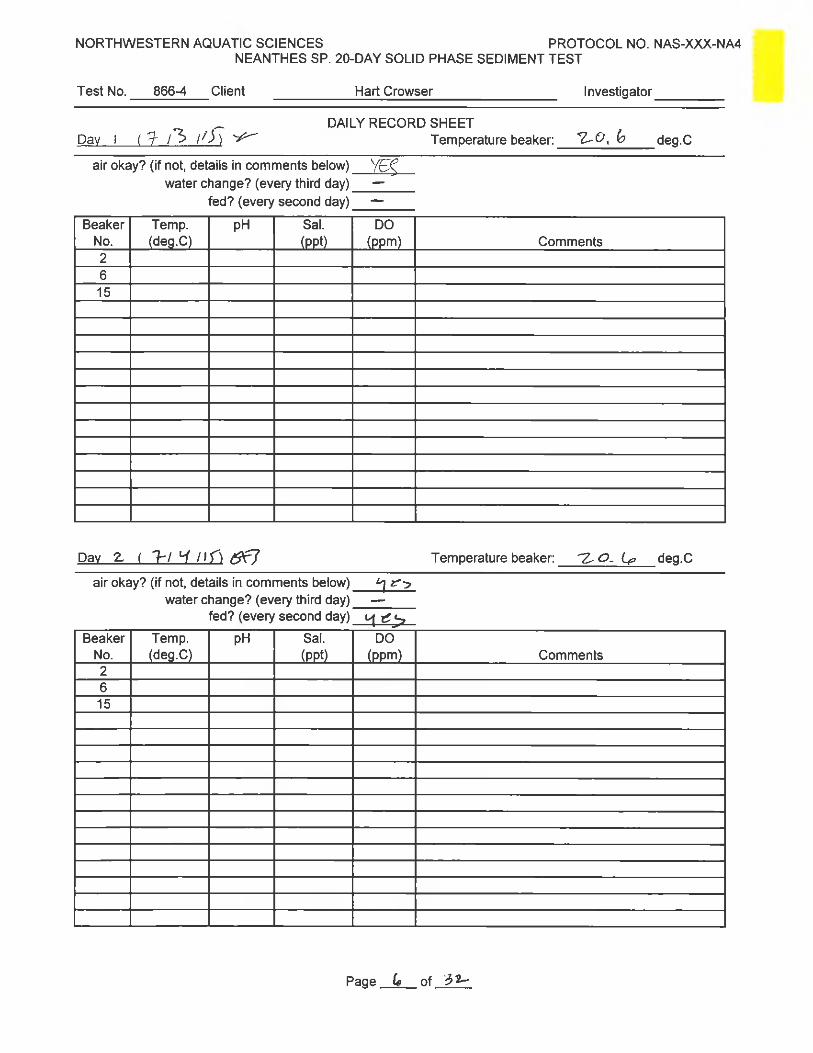
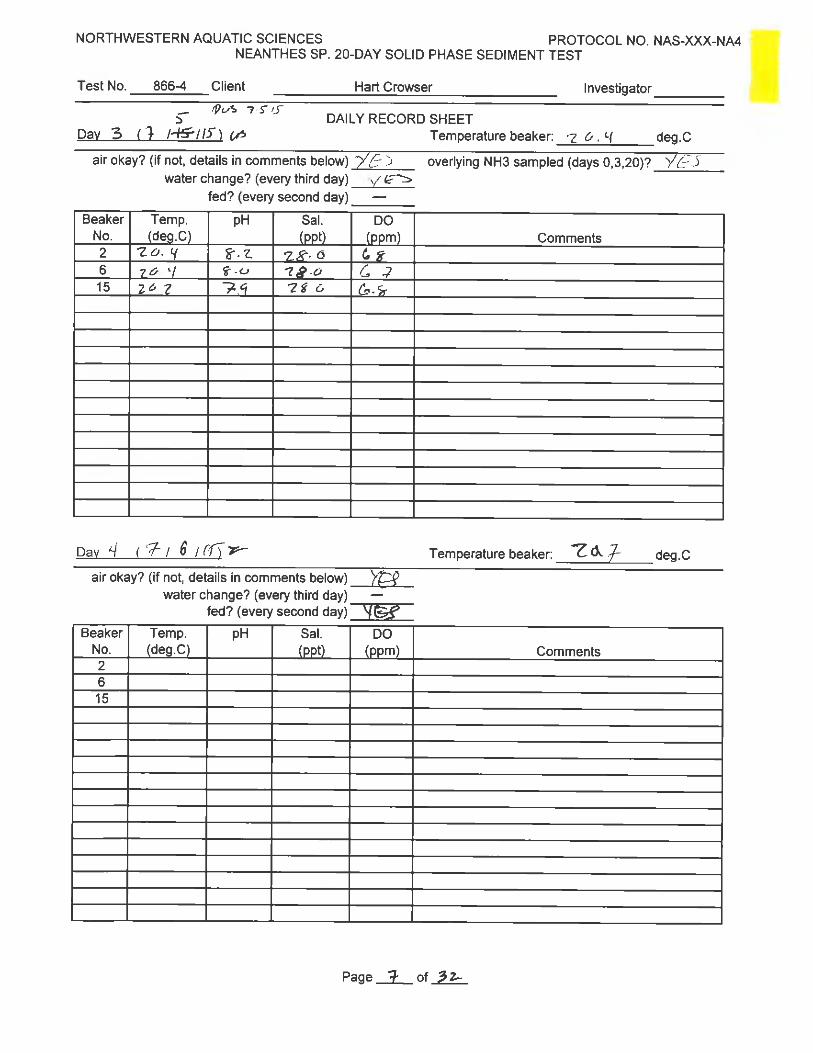
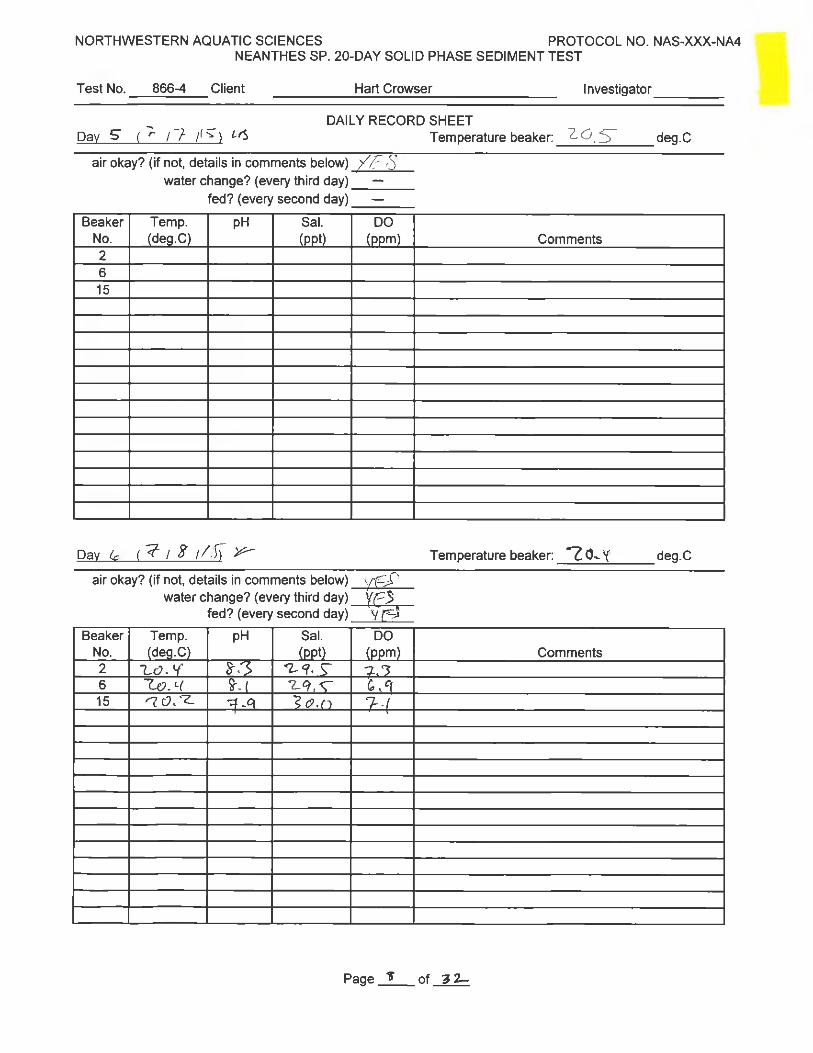
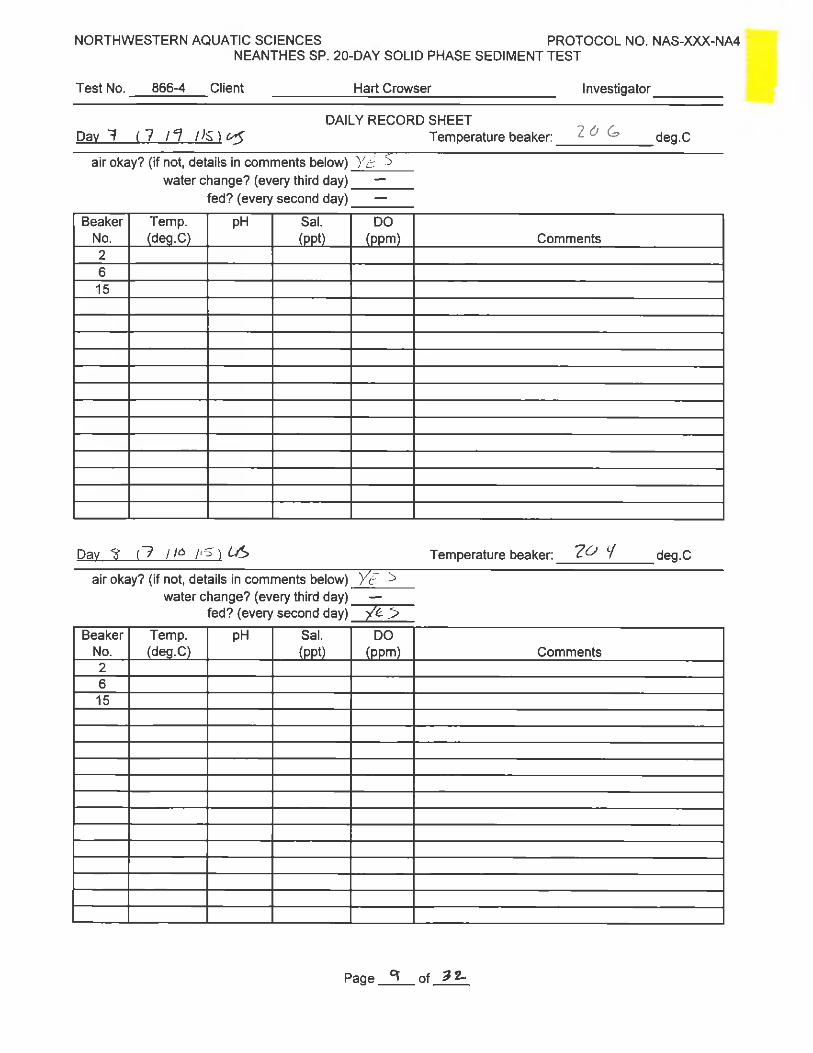
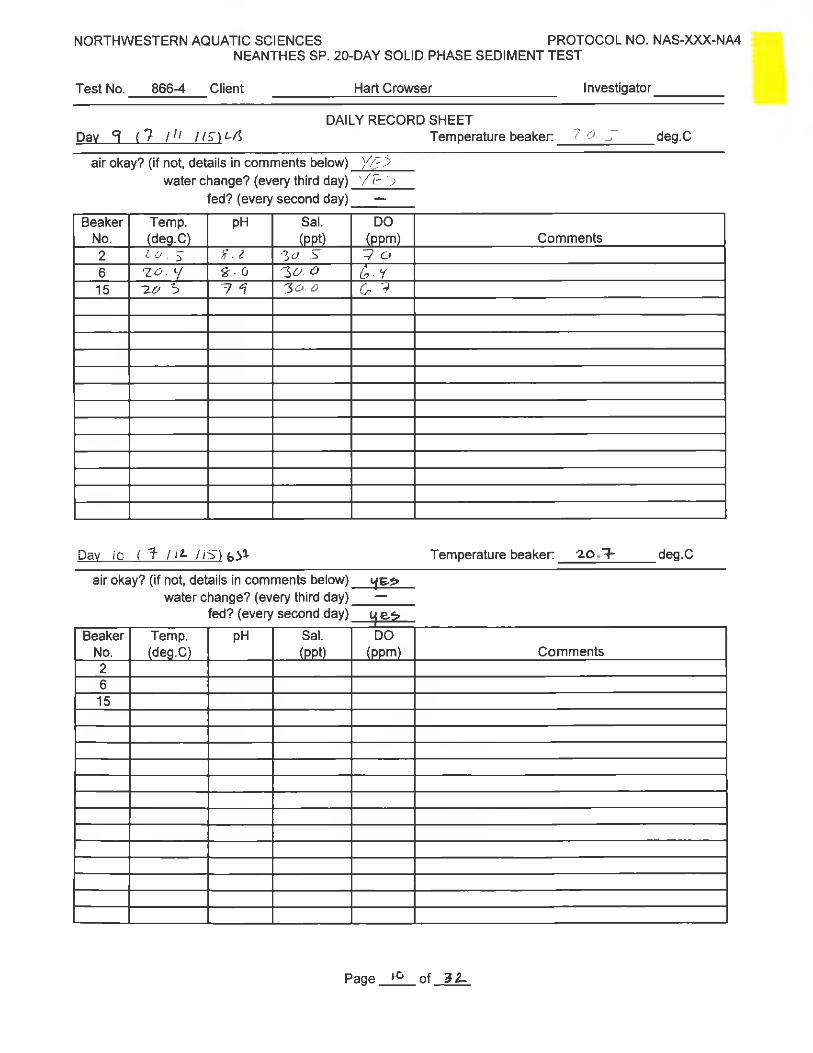
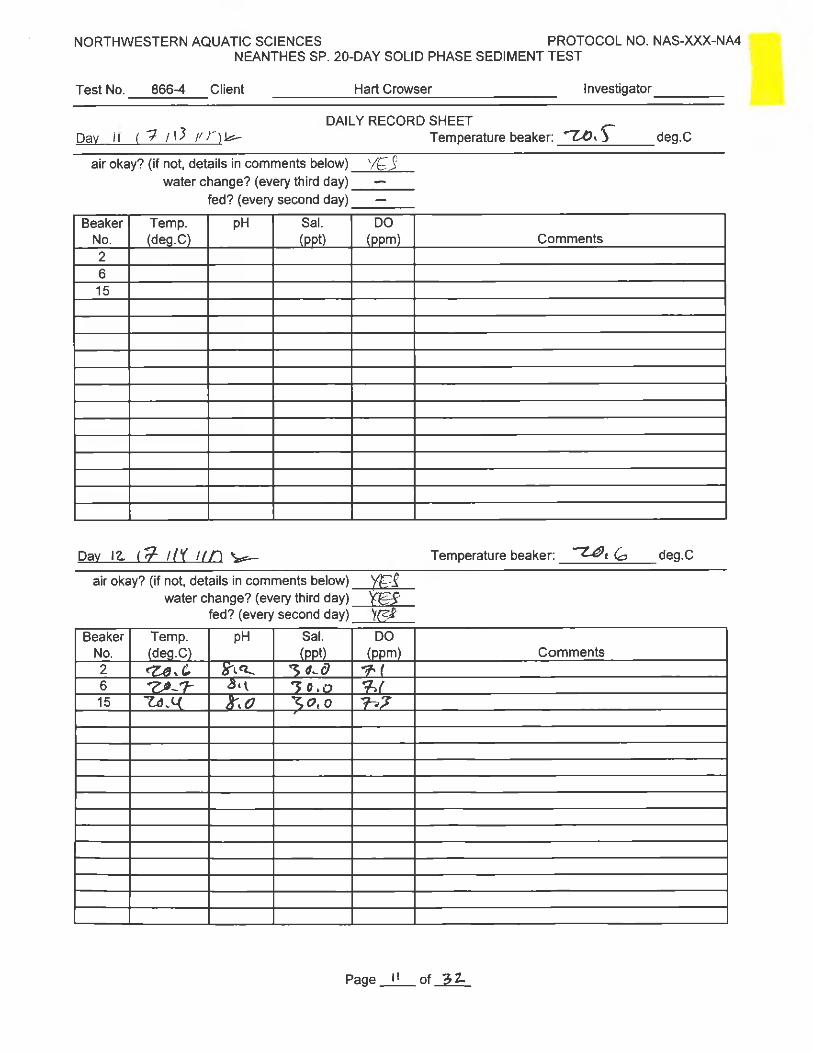
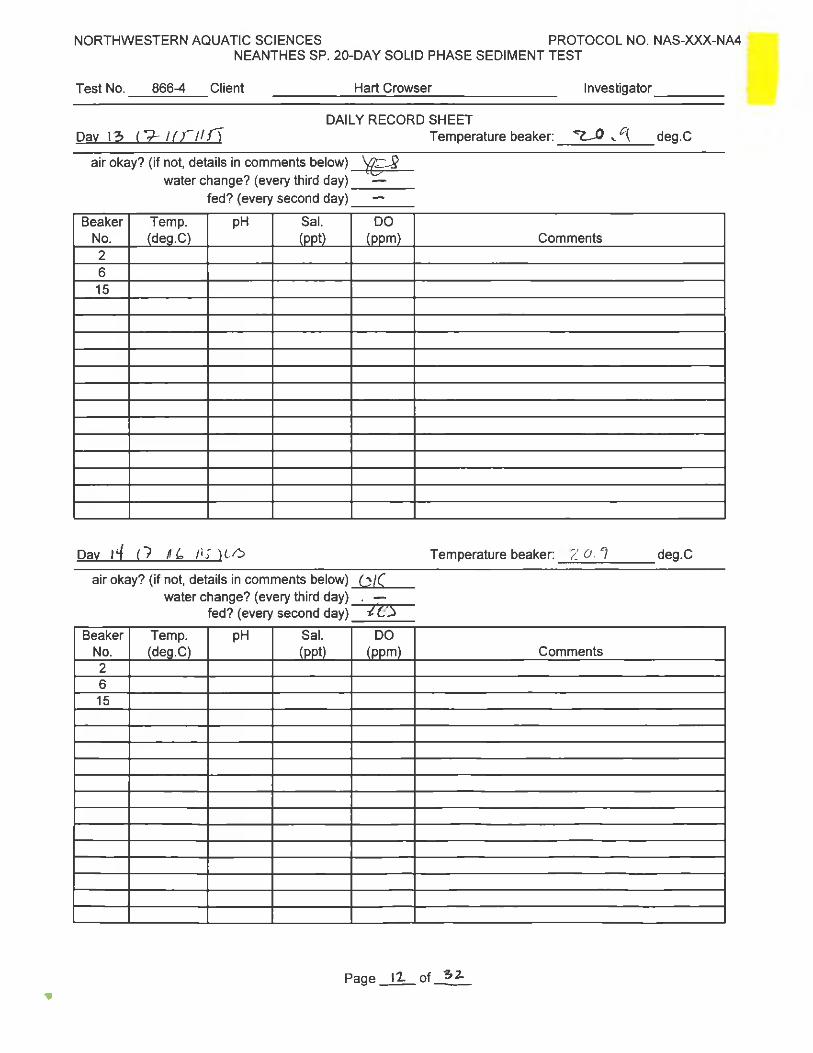
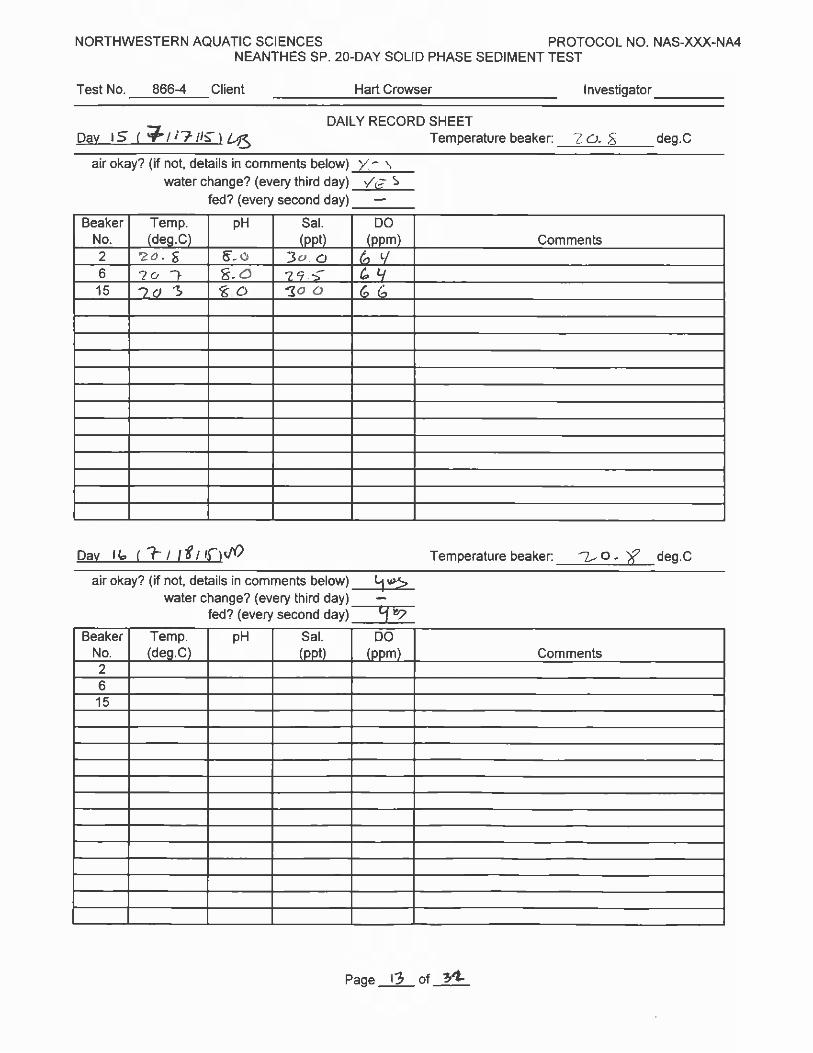
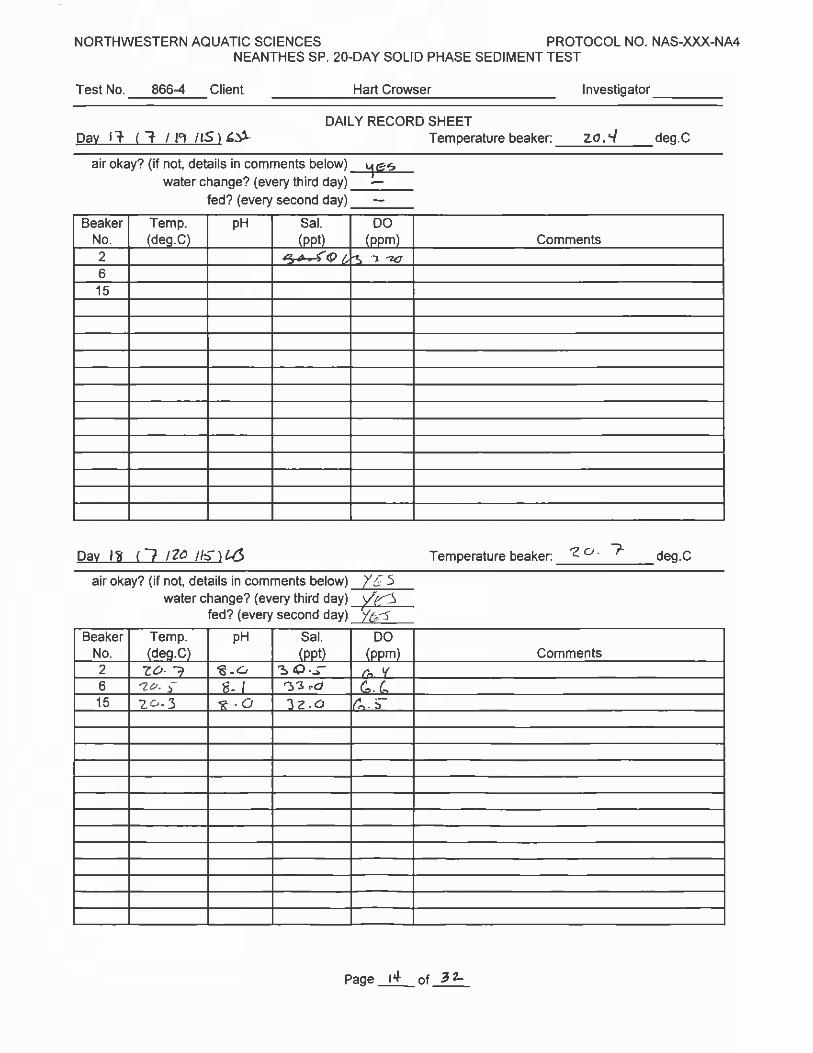
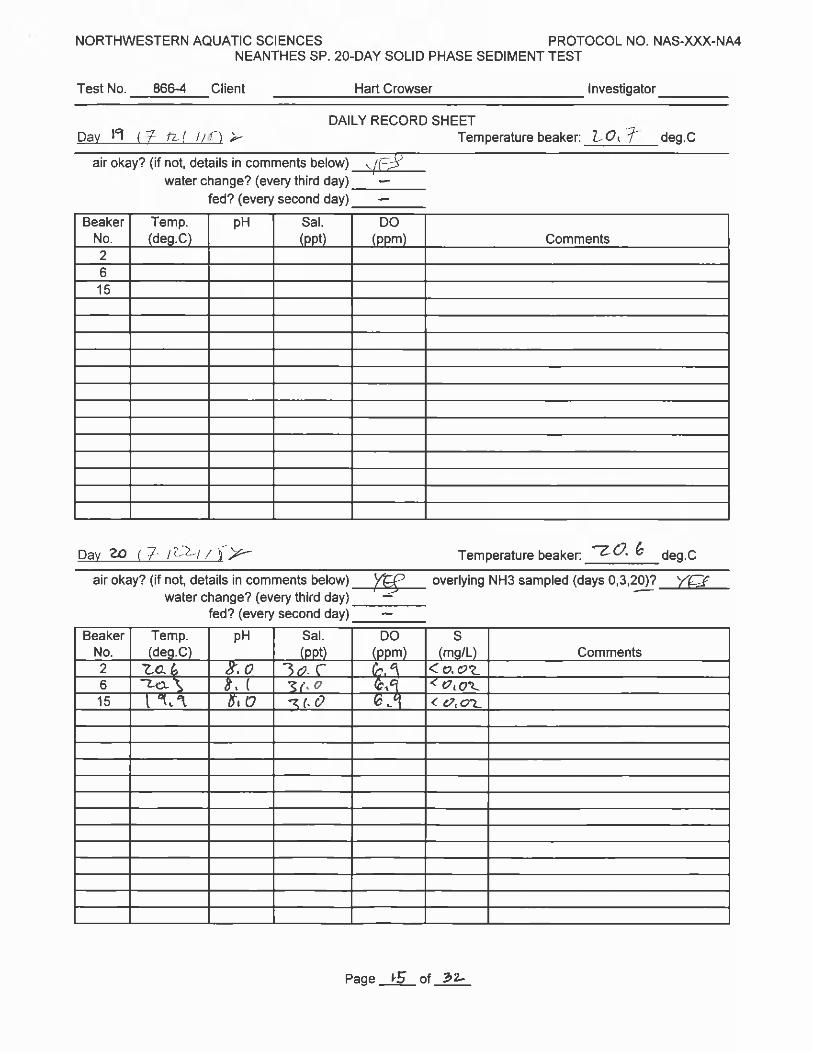
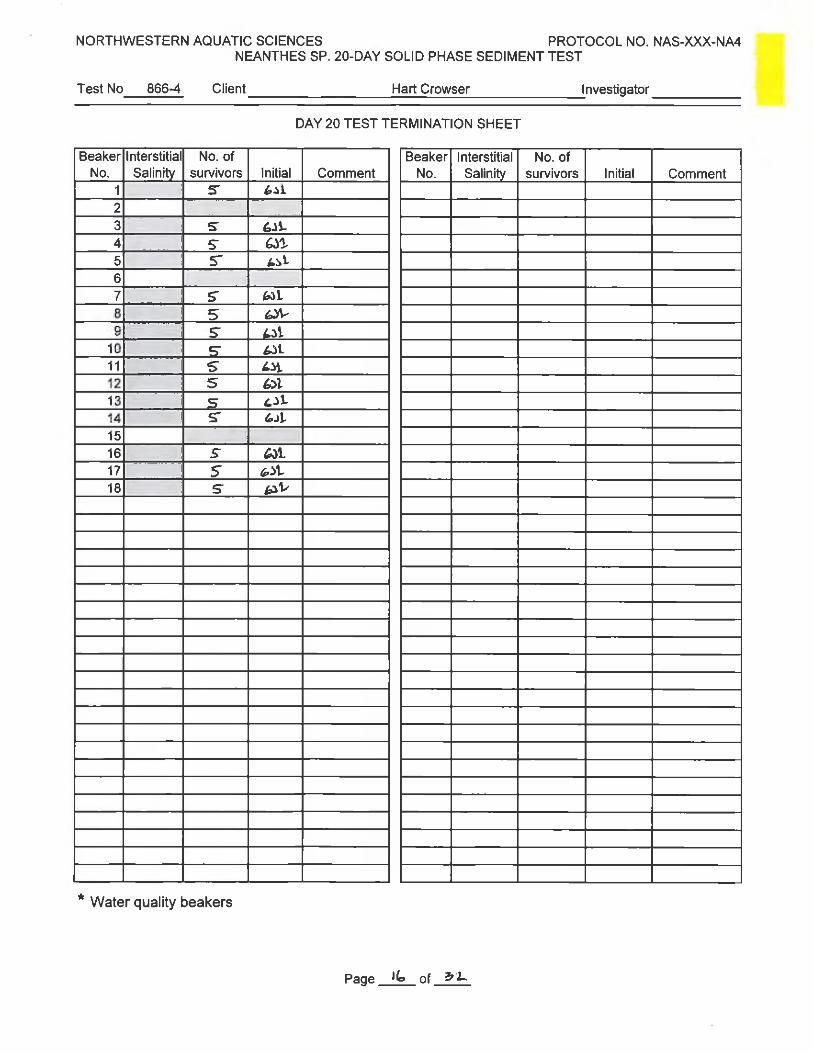
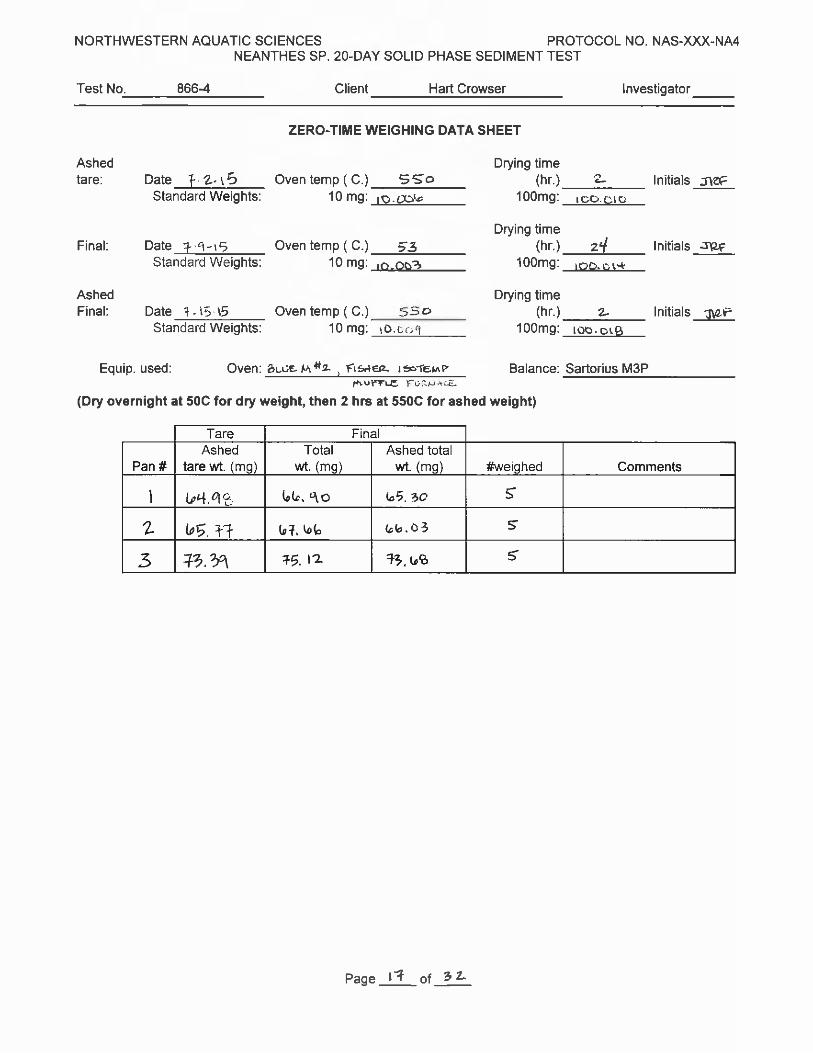
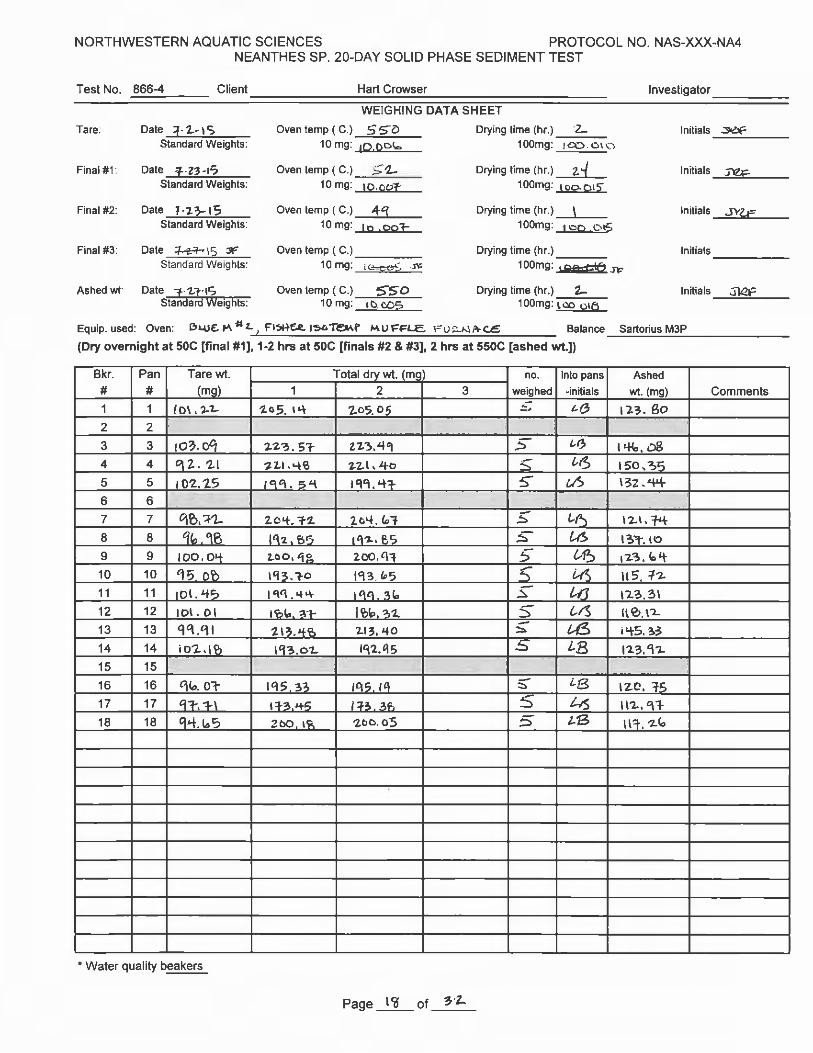
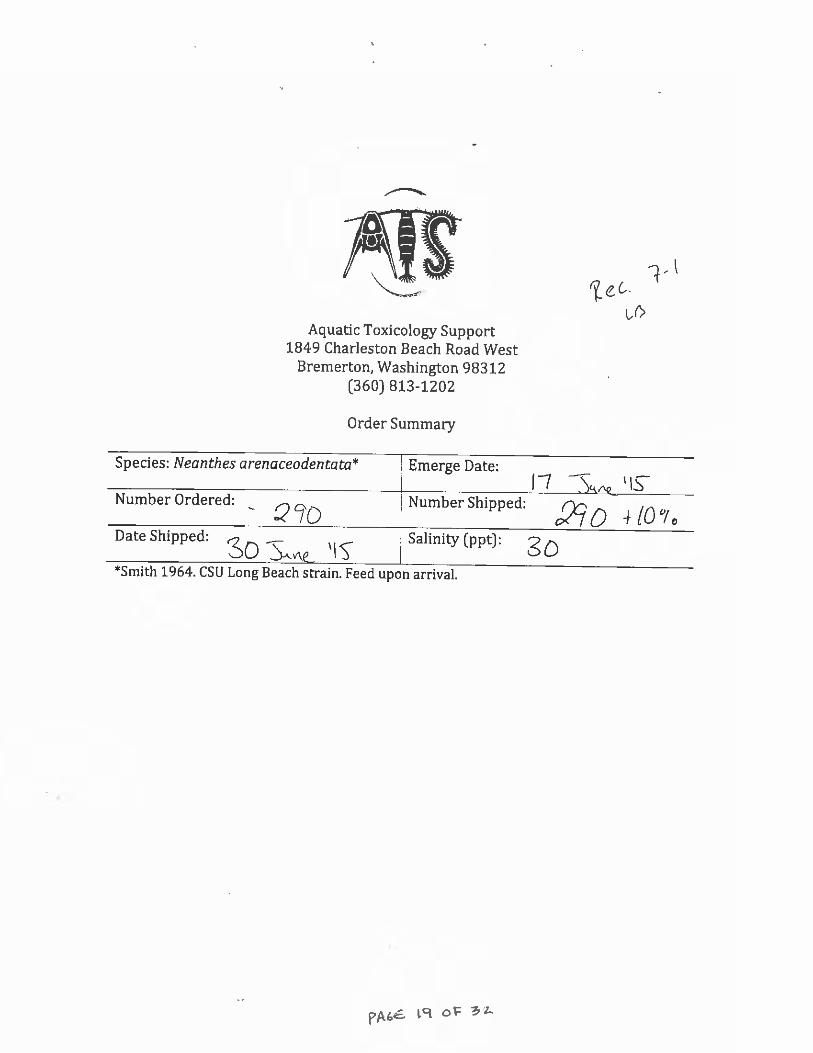
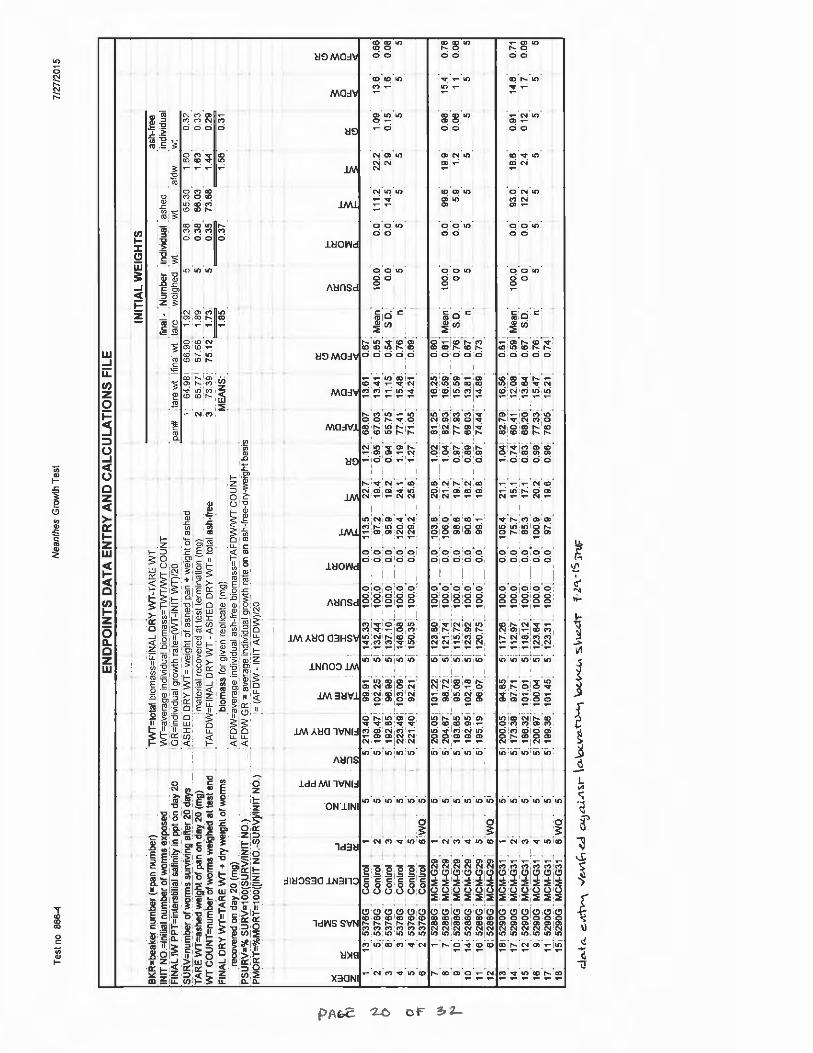


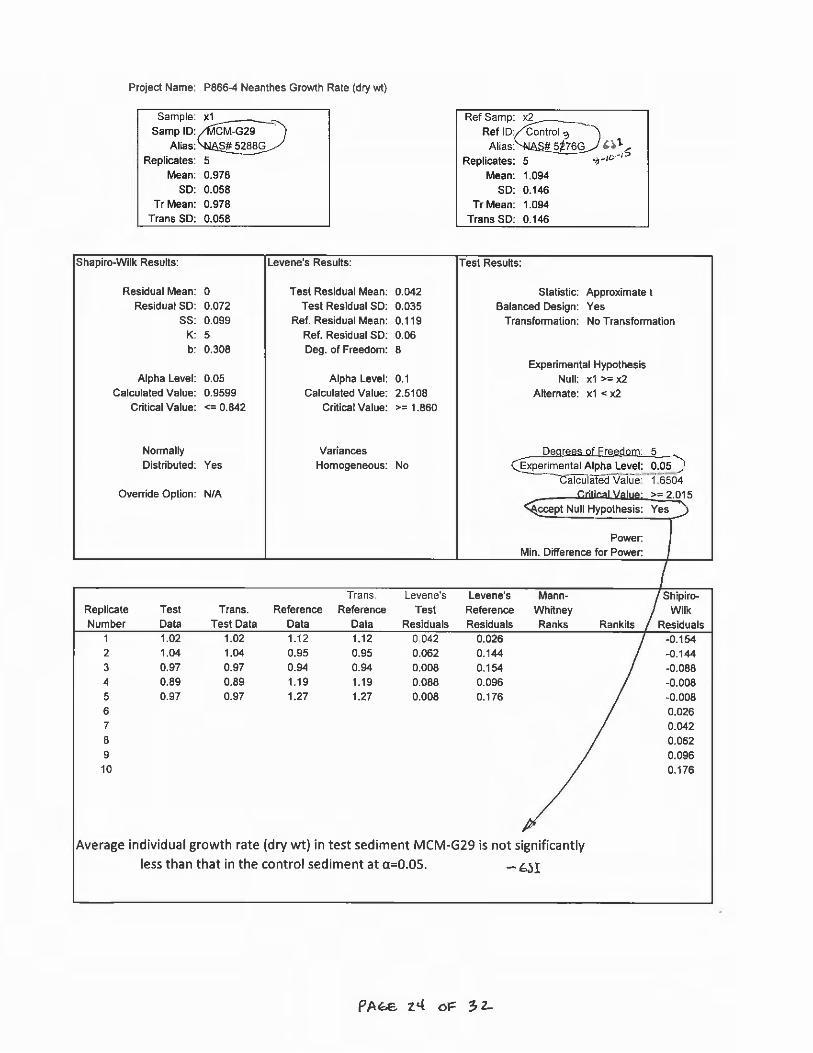
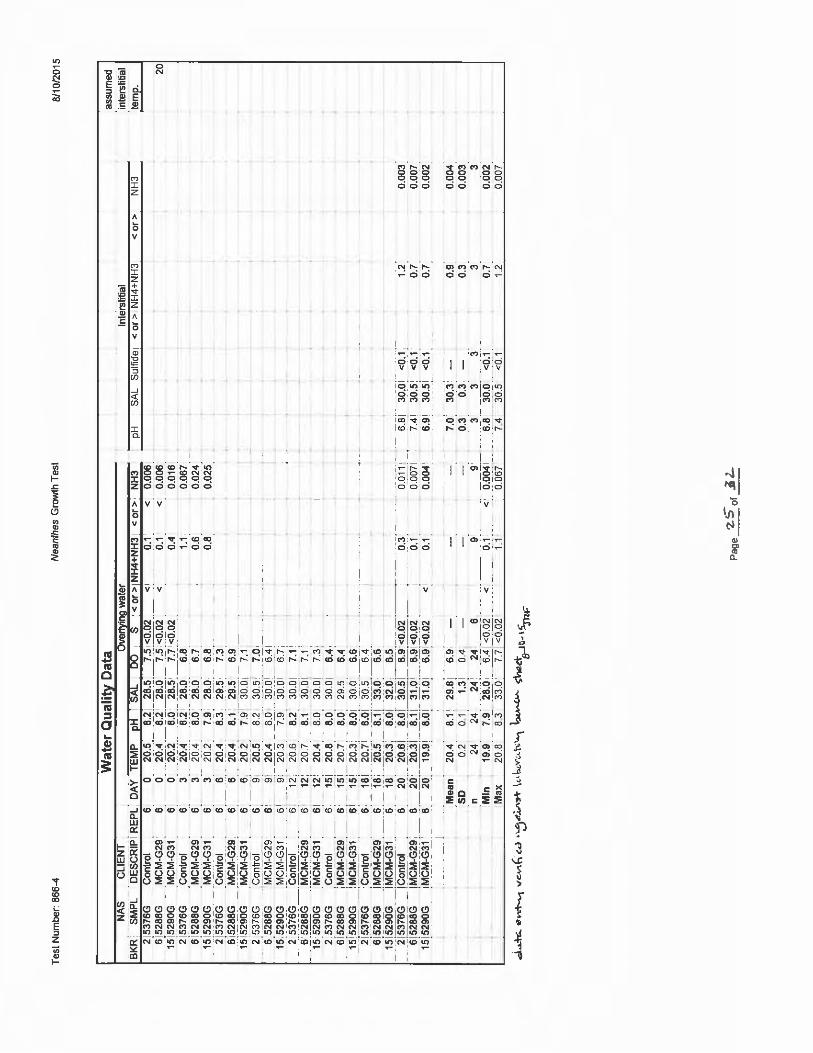
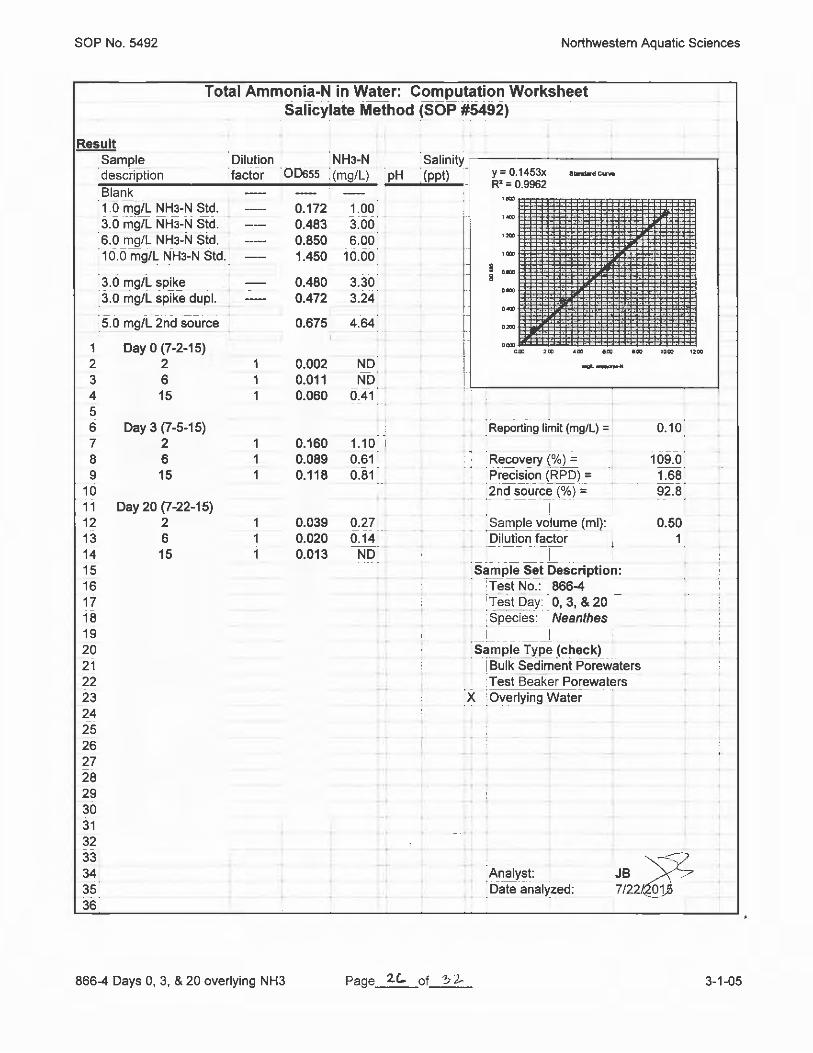

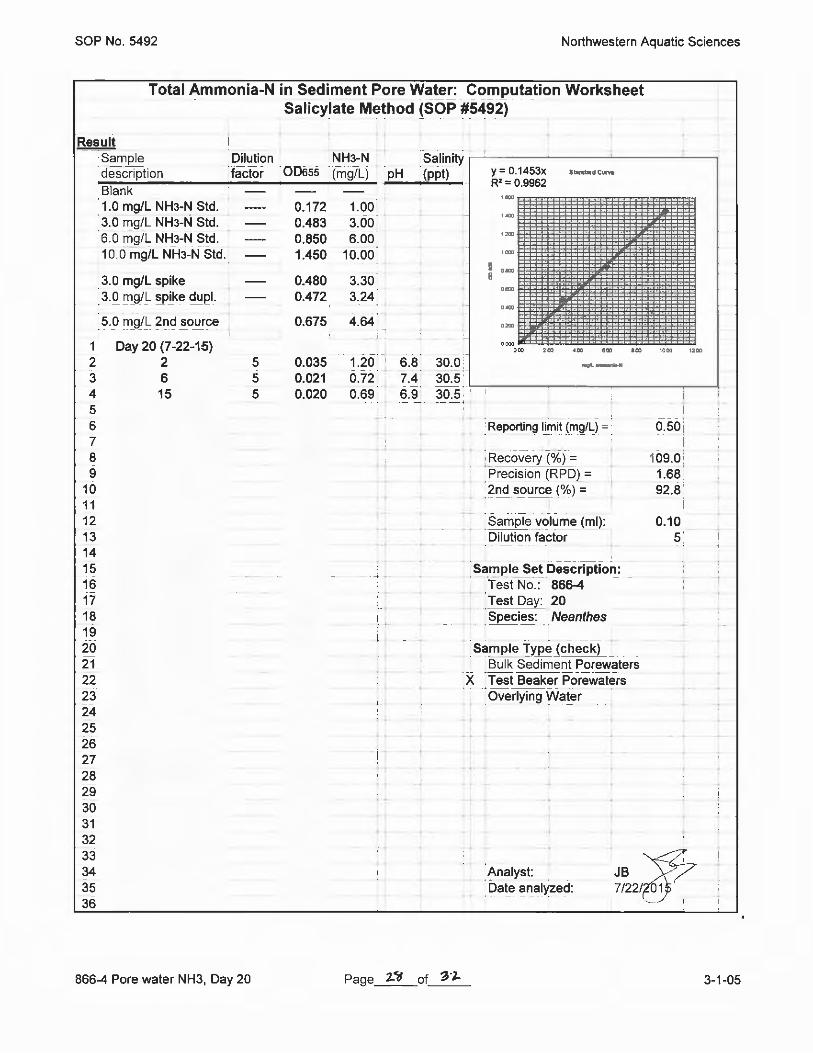

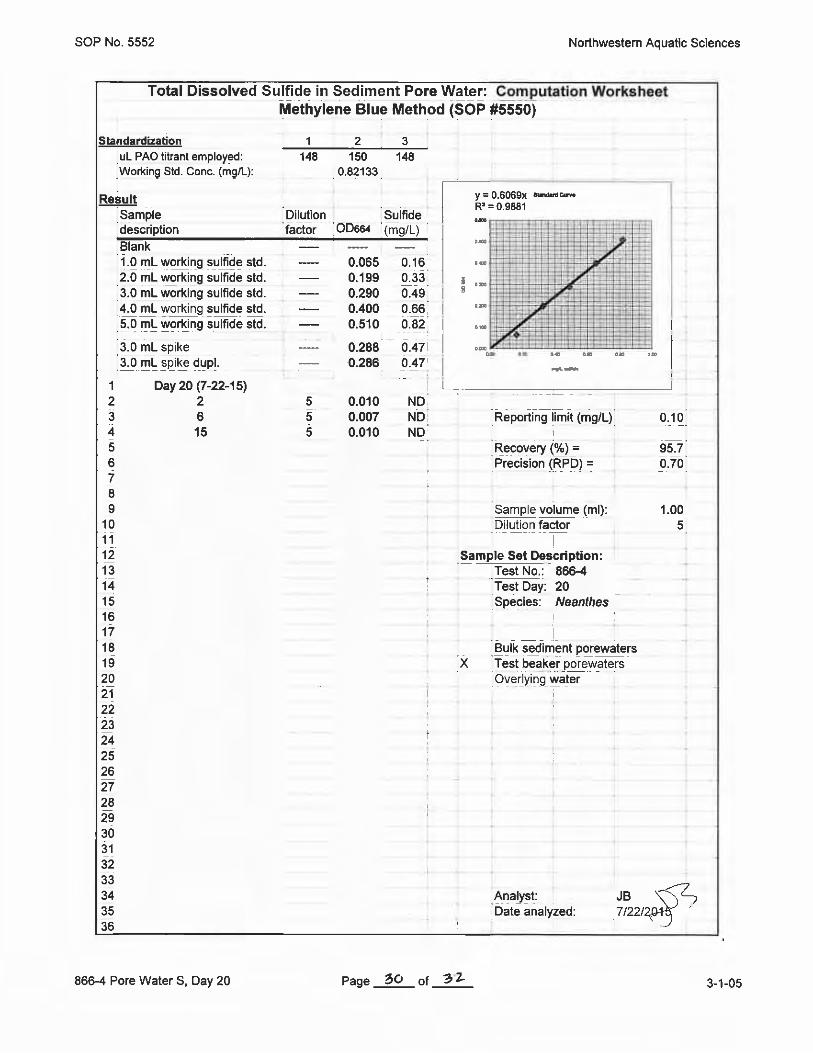
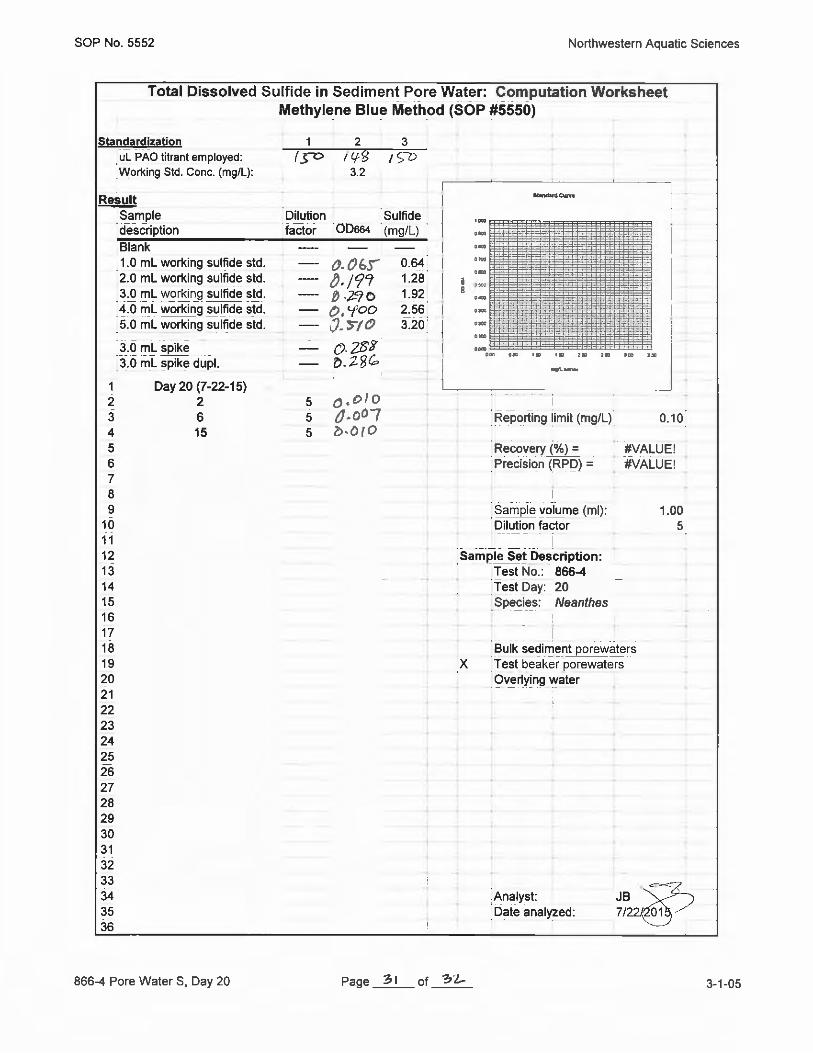
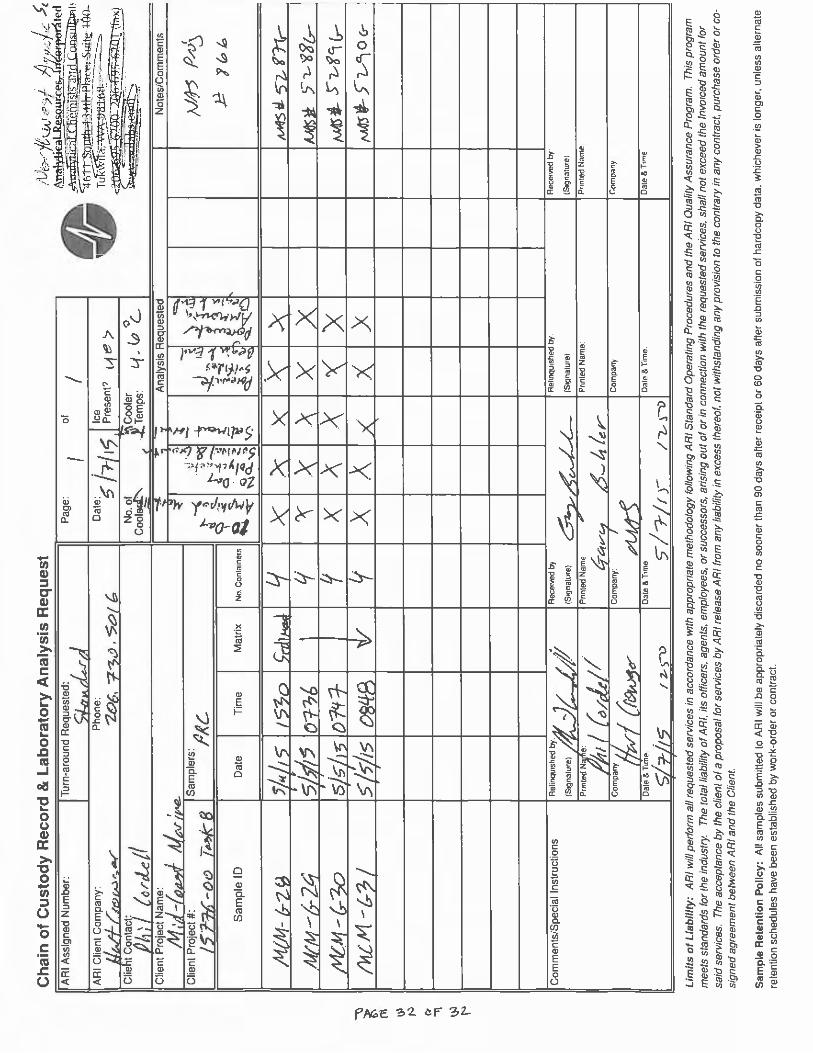
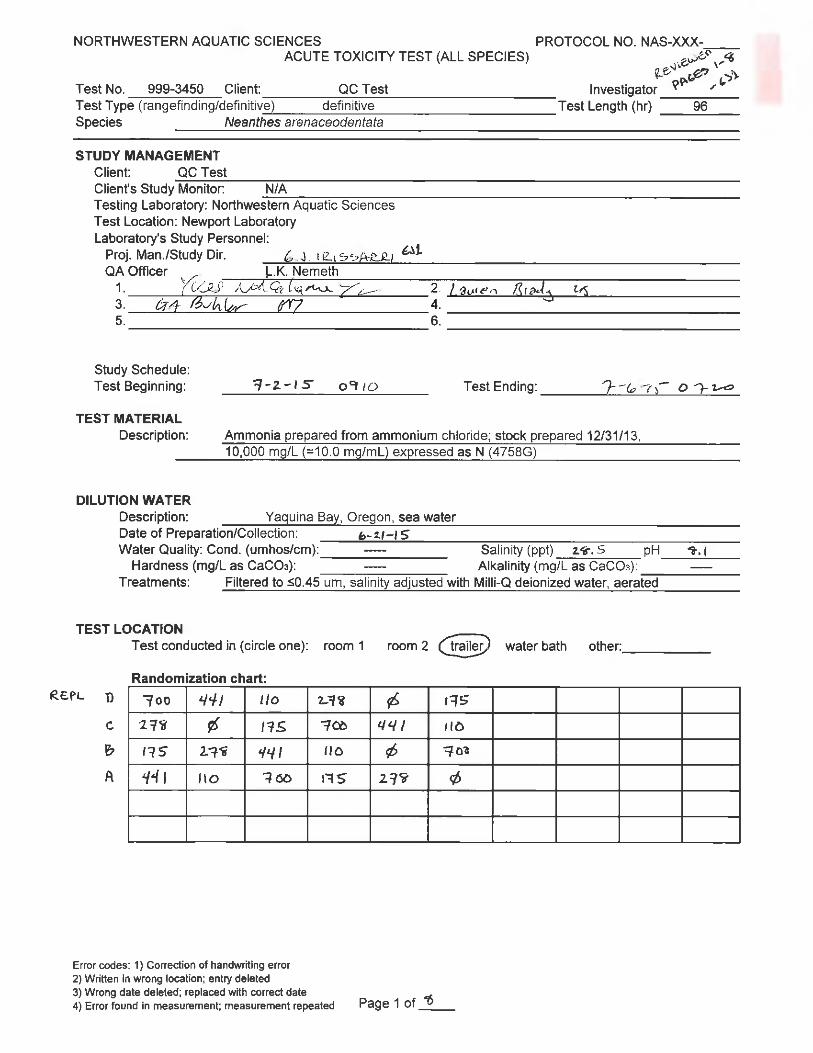
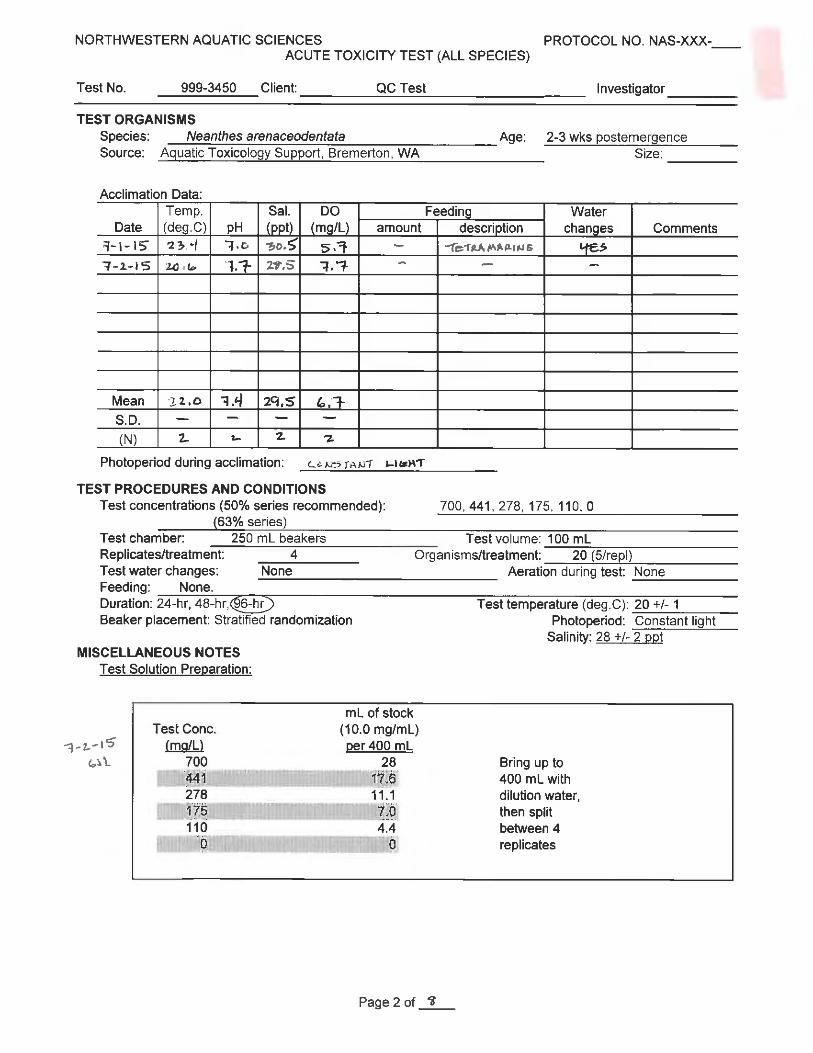

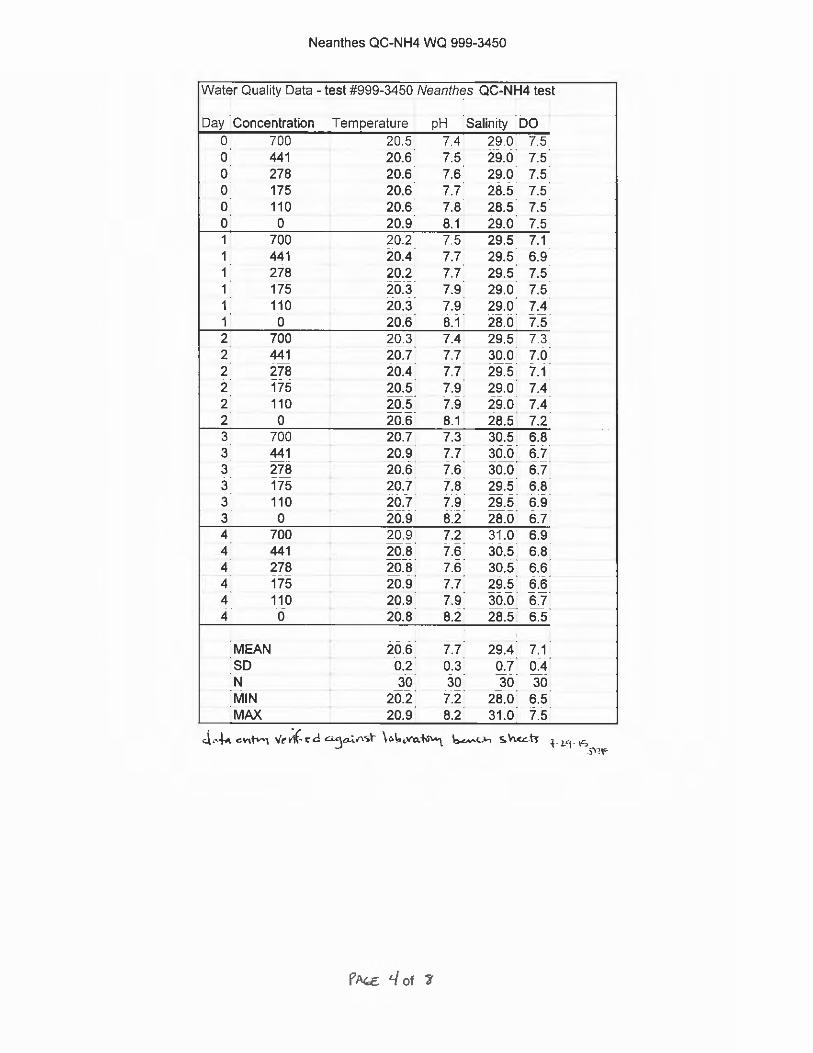
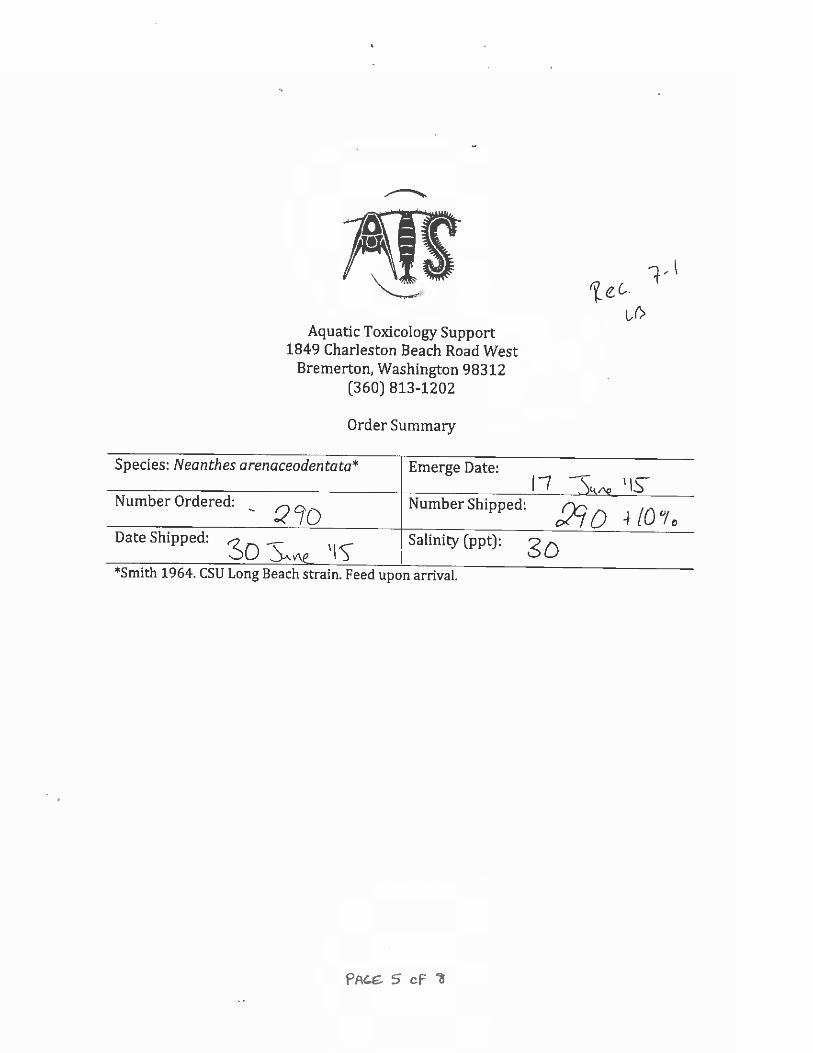
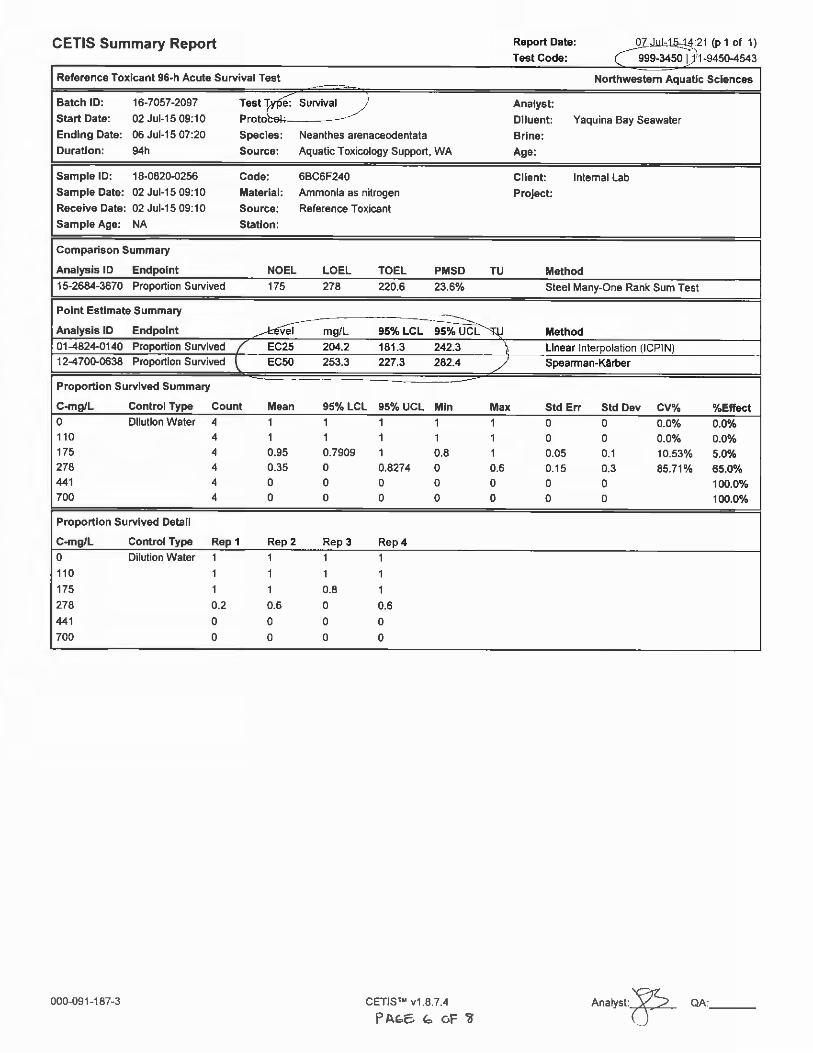
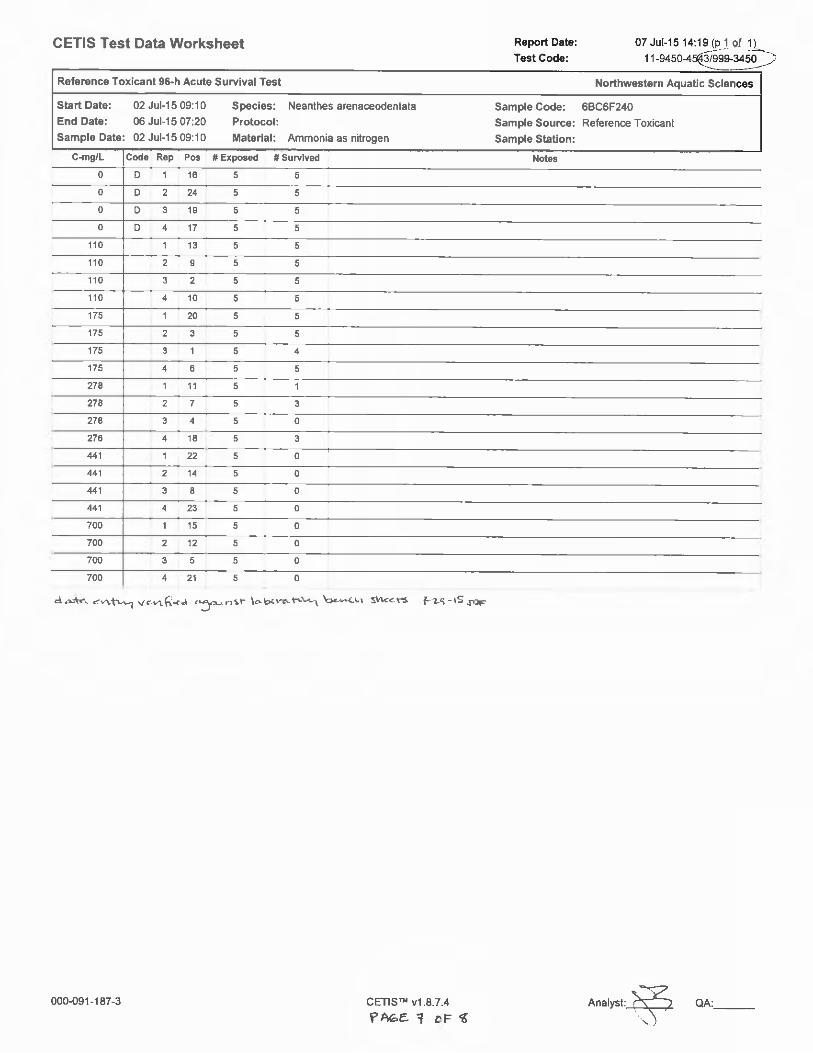
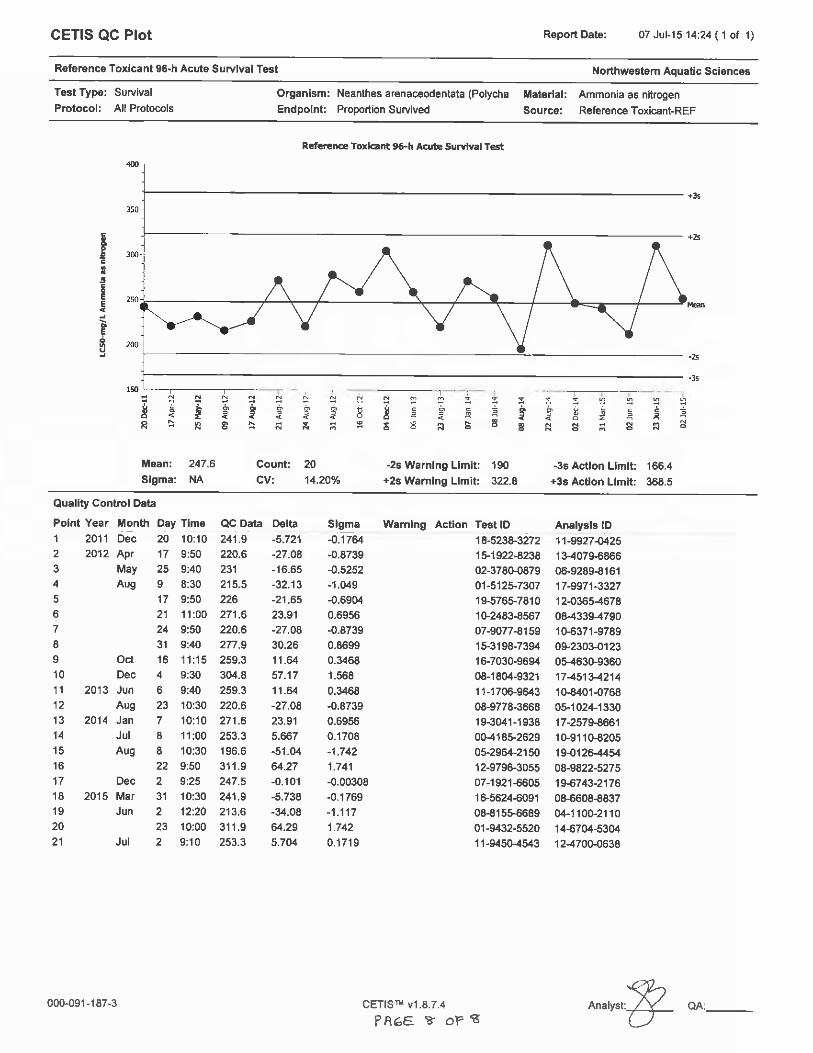
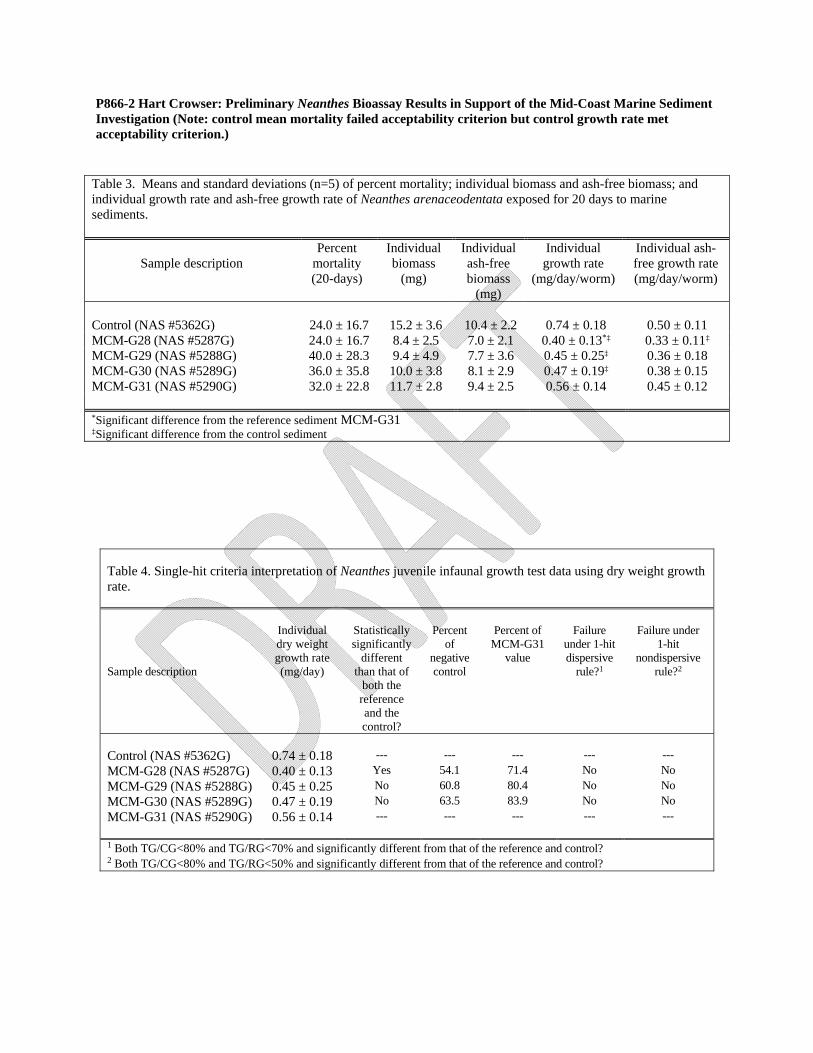
P866-2 Hart Crowser: Preliminary Neanthes Bioassay Results in Support of the Mid-Coast Marine Sediment Investigation (Note: control mean mortality failed acceptability criterion but control growth rate met acceptability criterion.)
Table 3. Means and standard deviations (n=5) of percent mortality; individual biomass and ash-free biomass; and individual growth rate and ash-free growth rate of Neanthes arenaceodentata exposed for 20 days to marine sediments.
Sample description
Percent mortality (20-days)
Individual biomass
(mg)
Individual ash-free biomass
(mg)
Individual growth rate
(mg/day/worm)
Individual ash-free growth rate (mg/day/worm)
Control (NAS #5362G) 24.0 ± 16.7 15.2 ± 3.6 10.4 ± 2.2 0.74 ± 0.18 0.50 ± 0.11 MCM-G28 (NAS #5287G) 24.0 ± 16.7 8.4 ± 2.5 7.0 ± 2.1 0.40 ± 0.13*‡ 0.33 ± 0.11‡ MCM-G29 (NAS #5288G) 40.0 ± 28.3 9.4 ± 4.9 7.7 ± 3.6 0.45 ± 0.25‡ 0.36 ± 0.18 MCM-G30 (NAS #5289G) 36.0 ± 35.8 10.0 ± 3.8 8.1 ± 2.9 0.47 ± 0.19‡ 0.38 ± 0.15 MCM-G31 (NAS #5290G) 32.0 ± 22.8 11.7 ± 2.8 9.4 ± 2.5 0.56 ± 0.14 0.45 ± 0.12 *Significant difference from the reference sediment MCM-G31 ‡Significant difference from the control sediment
Table 4. Single-hit criteria interpretation of Neanthes juvenile infaunal growth test data using dry weight growth rate. Sample description
Individual dry weight growth rate (mg/day)
Statistically significantly
different than that of
both the reference and the control?
Percent of
negative control
Percent of MCM-G31
value
Failure under 1-hit dispersive
rule?1
Failure under 1-hit
nondispersive rule?2
Control (NAS #5362G) 0.74 ± 0.18 --- --- --- --- ---
MCM-G28 (NAS #5287G) 0.40 ± 0.13 Yes 54.1 71.4 No No
MCM-G29 (NAS #5288G) 0.45 ± 0.25 No 60.8 80.4 No No
MCM-G30 (NAS #5289G) 0.47 ± 0.19 No 63.5 83.9 No No
MCM-G31 (NAS #5290G) 0.56 ± 0.14 --- --- --- --- --- 1 Both TG/CG<80% and TG/RG<70% and significantly different from that of the reference and control? 2 Both TG/CG<80% and TG/RG<50% and significantly different from that of the reference and control?
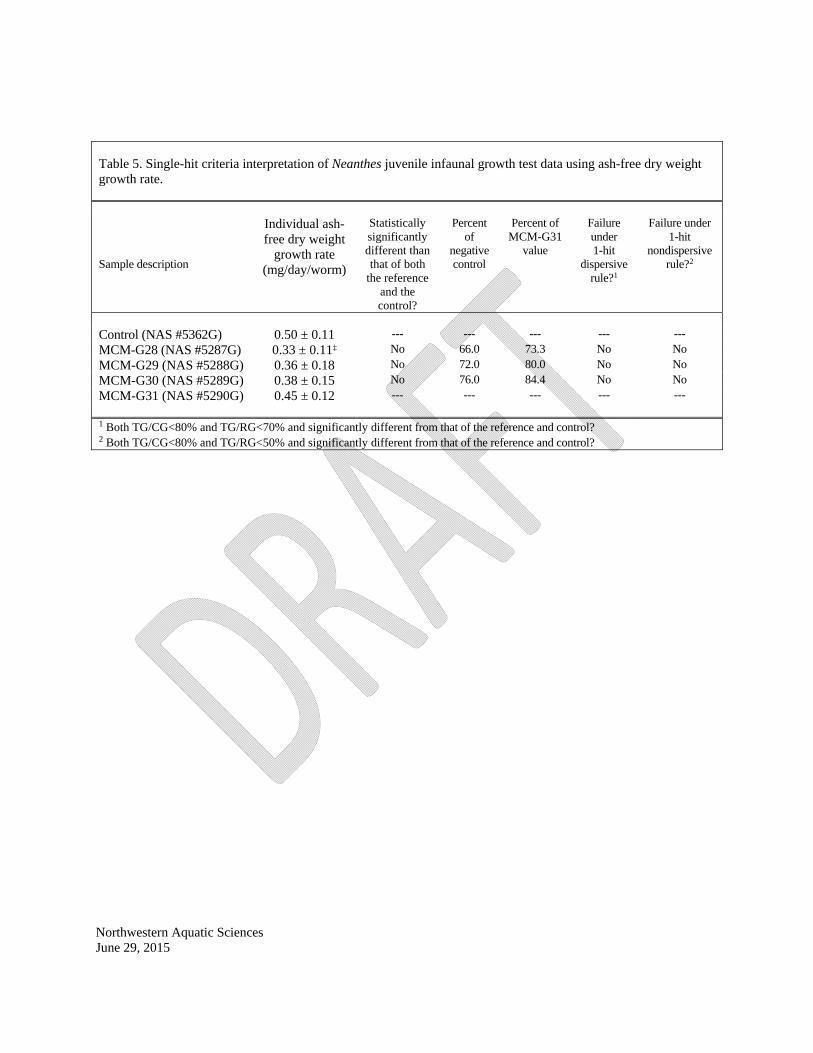
Table 5. Single-hit criteria interpretation of Neanthes juvenile infaunal growth test data using ash-free dry weight growth rate. Sample description
Individual ash-free dry weight
growth rate (mg/day/worm)
Statistically significantly different than that of both
the reference and the control?
Percent of
negative control
Percent of MCM-G31
value
Failure under 1-hit
dispersive rule?1
Failure under 1-hit
nondispersive rule?2
Control (NAS #5362G) 0.50 ± 0.11 --- --- --- --- ---
MCM-G28 (NAS #5287G) 0.33 ± 0.11‡ No 66.0 73.3 No No
MCM-G29 (NAS #5288G) 0.36 ± 0.18 No 72.0 80.0 No No
MCM-G30 (NAS #5289G) 0.38 ± 0.15 No 76.0 84.4 No No
MCM-G31 (NAS #5290G) 0.45 ± 0.12 --- --- --- --- --- 1 Both TG/CG<80% and TG/RG<70% and significantly different from that of the reference and control? 2 Both TG/CG<80% and TG/RG<50% and significantly different from that of the reference and control? Northwestern Aquatic Sciences June 29, 2015
15776‐00/Task 9 January 28, 2016
APPENDIX D HISTORICAL REPORT TABLES
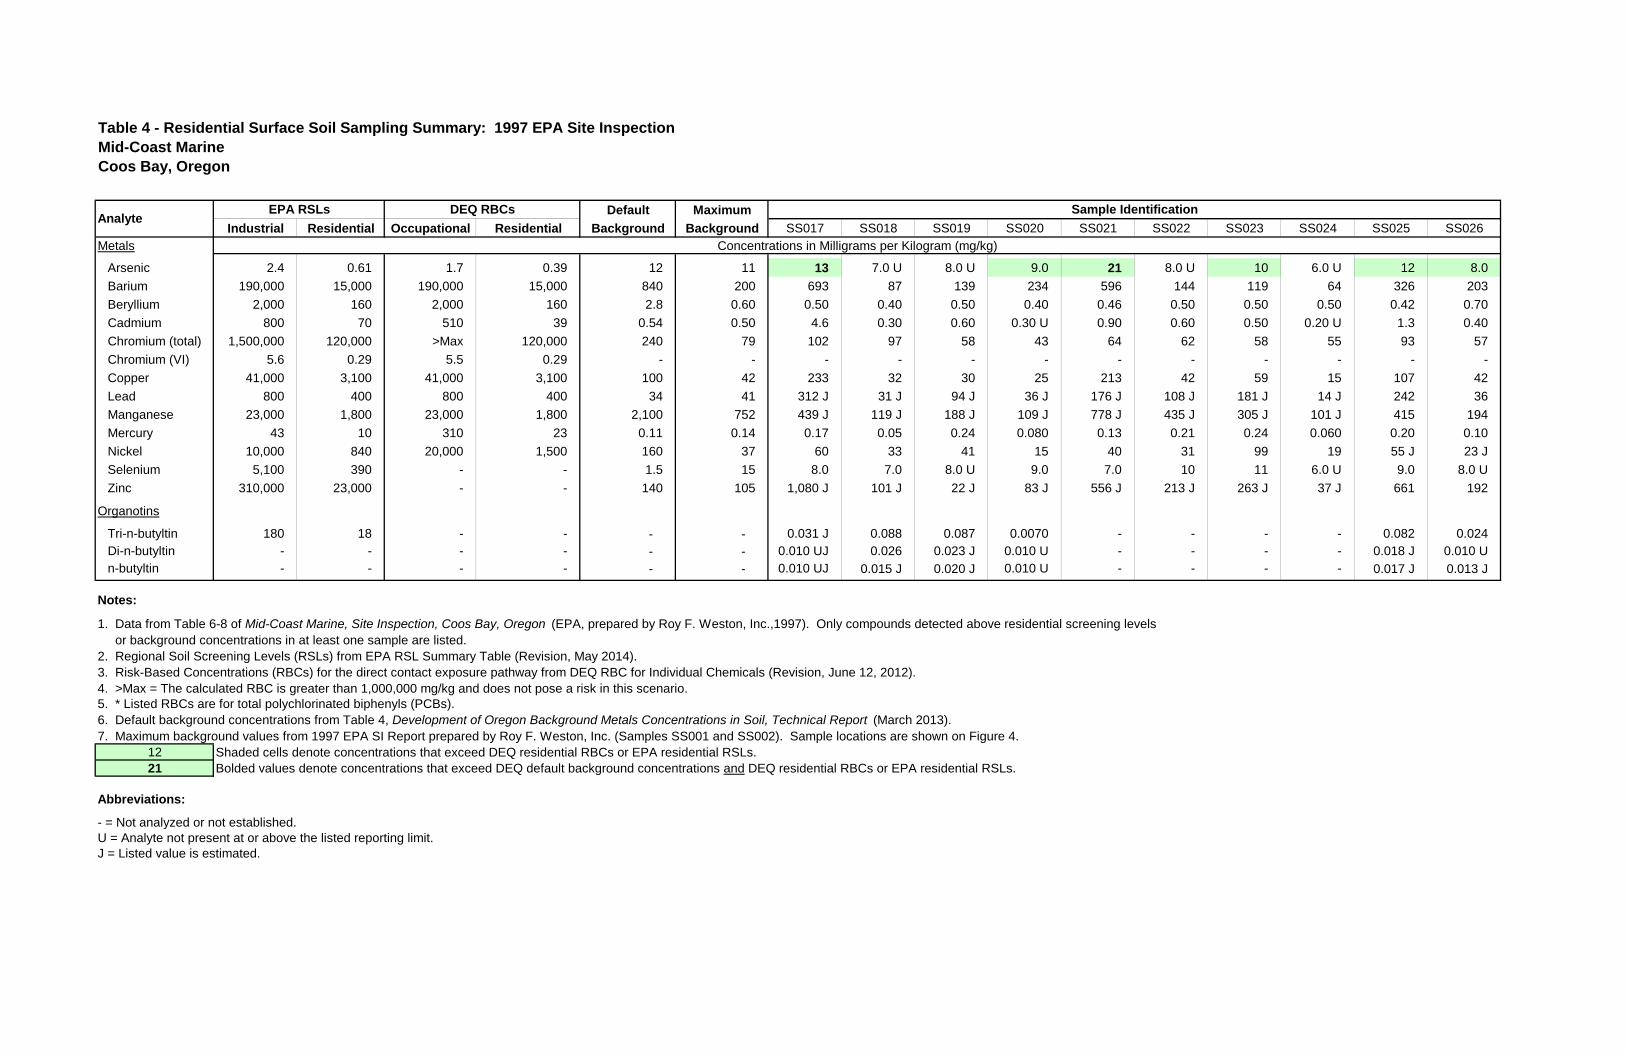
Table 4 - Residential Surface Soil Sampling Summary: 1997 EPA Site InspectionMid-Coast MarineCoos Bay, Oregon
Default Maximum
Industrial Residential Occupational Residential Background Background SS017 SS018 SS019 SS020 SS021 SS022 SS023 SS024 SS025 SS026Metals
Arsenic 2.4 0.61 1.7 0.39 12 11 13 7.0 U 8.0 U 9.0 21 8.0 U 10 6.0 U 12 8.0
Barium 190,000 15,000 190,000 15,000 840 200 693 87 139 234 596 144 119 64 326 203
Beryllium 2,000 160 2,000 160 2.8 0.60 0.50 0.40 0.50 0.40 0.46 0.50 0.50 0.50 0.42 0.70
Cadmium 800 70 510 39 0.54 0.50 4.6 0.30 0.60 0.30 U 0.90 0.60 0.50 0.20 U 1.3 0.40
Chromium (total) 1,500,000 120,000 >Max 120,000 240 79 102 97 58 43 64 62 58 55 93 57
Chromium (VI) 5.6 0.29 5.5 0.29 - - - - - - - - - - - -
Copper 41,000 3,100 41,000 3,100 100 42 233 32 30 25 213 42 59 15 107 42
Lead 800 400 800 400 34 41 312 J 31 J 94 J 36 J 176 J 108 J 181 J 14 J 242 36
Manganese 23,000 1,800 23,000 1,800 2,100 752 439 J 119 J 188 J 109 J 778 J 435 J 305 J 101 J 415 194
Mercury 43 10 310 23 0.11 0.14 0.17 0.05 0.24 0.080 0.13 0.21 0.24 0.060 0.20 0.10
Nickel 10,000 840 20,000 1,500 160 37 60 33 41 15 40 31 99 19 55 J 23 J
Selenium 5,100 390 - - 1.5 15 8.0 7.0 8.0 U 9.0 7.0 10 11 6.0 U 9.0 8.0 U
Zinc 310,000 23,000 - - 140 105 1,080 J 101 J 22 J 83 J 556 J 213 J 263 J 37 J 661 192
Organotins
Tri-n-butyltin 180 18 - - - - 0.031 J 0.088 0.087 0.0070 - - - - 0.082 0.024Di-n-butyltin - - - - - - 0.010 UJ 0.026 0.023 J 0.010 U - - - - 0.018 J 0.010 Un-butyltin - - - - - - 0.010 UJ 0.015 J 0.020 J 0.010 U - - - - 0.017 J 0.013 J
Notes:
1. Data from Table 6-8 of Mid-Coast Marine, Site Inspection, Coos Bay, Oregon (EPA, prepared by Roy F. Weston, Inc.,1997). Only compounds detected above residential screening levels or background concentrations in at least one sample are listed.2. Regional Soil Screening Levels (RSLs) from EPA RSL Summary Table (Revision, May 2014).3. Risk-Based Concentrations (RBCs) for the direct contact exposure pathway from DEQ RBC for Individual Chemicals (Revision, June 12, 2012). 4. >Max = The calculated RBC is greater than 1,000,000 mg/kg and does not pose a risk in this scenario.5. * Listed RBCs are for total polychlorinated biphenyls (PCBs).6. Default background concentrations from Table 4, Development of Oregon Background Metals Concentrations in Soil, Technical Report (March 2013).7. Maximum background values from 1997 EPA SI Report prepared by Roy F. Weston, Inc. (Samples SS001 and SS002). Sample locations are shown on Figure 4.
12 Shaded cells denote concentrations that exceed DEQ residential RBCs or EPA residential RSLs.21 Bolded values denote concentrations that exceed DEQ default background concentrations and DEQ residential RBCs or EPA residential RSLs.
Abbreviations:
- = Not analyzed or not established.U = Analyte not present at or above the listed reporting limit.J = Listed value is estimated.
Concentrations in Milligrams per Kilogram (mg/kg)
AnalyteEPA RSLs DEQ RBCs Sample Identification
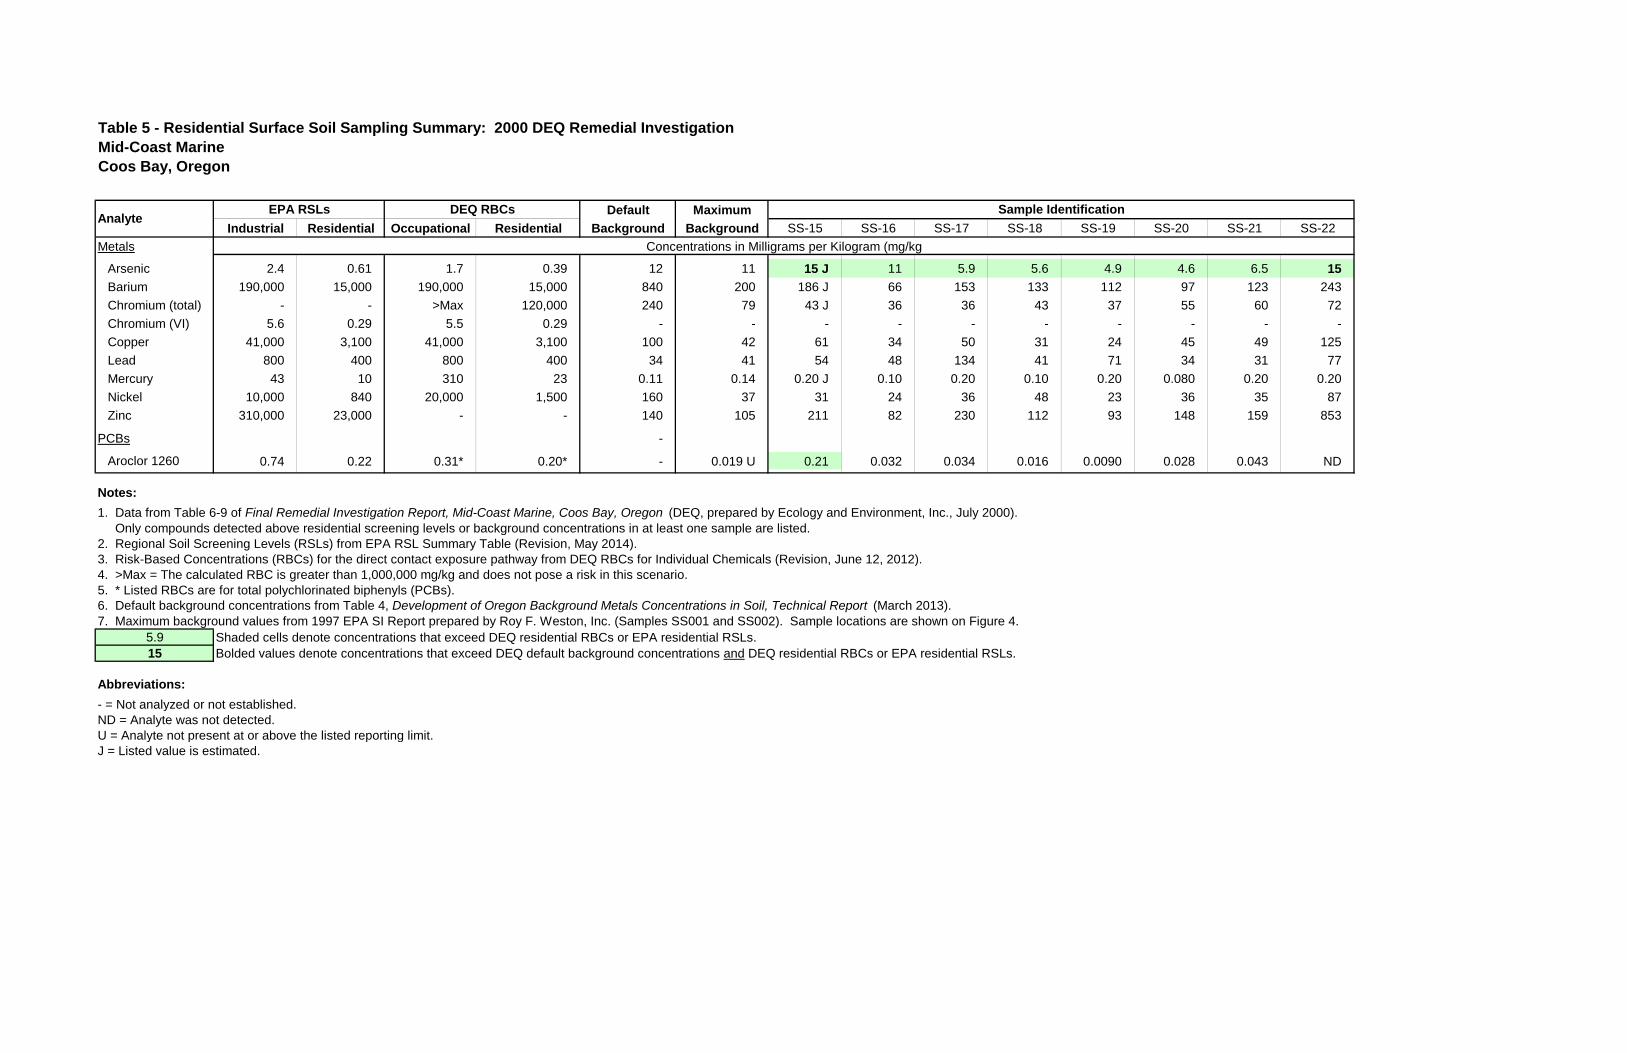
Table 5 - Residential Surface Soil Sampling Summary: 2000 DEQ Remedial InvestigationMid-Coast MarineCoos Bay, Oregon
Default Maximum
Industrial Residential Occupational Residential Background Background SS-15 SS-16 SS-17 SS-18 SS-19 SS-20 SS-21 SS-22
Metals
Arsenic 2.4 0.61 1.7 0.39 12 11 15 J 11 5.9 5.6 4.9 4.6 6.5 15
Barium 190,000 15,000 190,000 15,000 840 200 186 J 66 153 133 112 97 123 243
Chromium (total) - - >Max 120,000 240 79 43 J 36 36 43 37 55 60 72
Chromium (VI) 5.6 0.29 5.5 0.29 - - - - - - - - - -
Copper 41,000 3,100 41,000 3,100 100 42 61 34 50 31 24 45 49 125
Lead 800 400 800 400 34 41 54 48 134 41 71 34 31 77
Mercury 43 10 310 23 0.11 0.14 0.20 J 0.10 0.20 0.10 0.20 0.080 0.20 0.20
Nickel 10,000 840 20,000 1,500 160 37 31 24 36 48 23 36 35 87
Zinc 310,000 23,000 - - 140 105 211 82 230 112 93 148 159 853
PCBs -
Aroclor 1260 0.74 0.22 0.31* 0.20* - 0.019 U 0.21 0.032 0.034 0.016 0.0090 0.028 0.043 ND
Notes:
1. Data from Table 6-9 of Final Remedial Investigation Report, Mid-Coast Marine, Coos Bay, Oregon (DEQ, prepared by Ecology and Environment, Inc., July 2000). Only compounds detected above residential screening levels or background concentrations in at least one sample are listed.2. Regional Soil Screening Levels (RSLs) from EPA RSL Summary Table (Revision, May 2014).3. Risk-Based Concentrations (RBCs) for the direct contact exposure pathway from DEQ RBCs for Individual Chemicals (Revision, June 12, 2012). 4. >Max = The calculated RBC is greater than 1,000,000 mg/kg and does not pose a risk in this scenario.5. * Listed RBCs are for total polychlorinated biphenyls (PCBs).6. Default background concentrations from Table 4, Development of Oregon Background Metals Concentrations in Soil, Technical Report (March 2013).7. Maximum background values from 1997 EPA SI Report prepared by Roy F. Weston, Inc. (Samples SS001 and SS002). Sample locations are shown on Figure 4.
5.9 Shaded cells denote concentrations that exceed DEQ residential RBCs or EPA residential RSLs.15 Bolded values denote concentrations that exceed DEQ default background concentrations and DEQ residential RBCs or EPA residential RSLs.
Abbreviations:
- = Not analyzed or not established.ND = Analyte was not detected.U = Analyte not present at or above the listed reporting limit.J = Listed value is estimated.
Concentrations in Milligrams per Kilogram (mg/kg
Sample IdentificationDEQ RBCsAnalyte
EPA RSLs
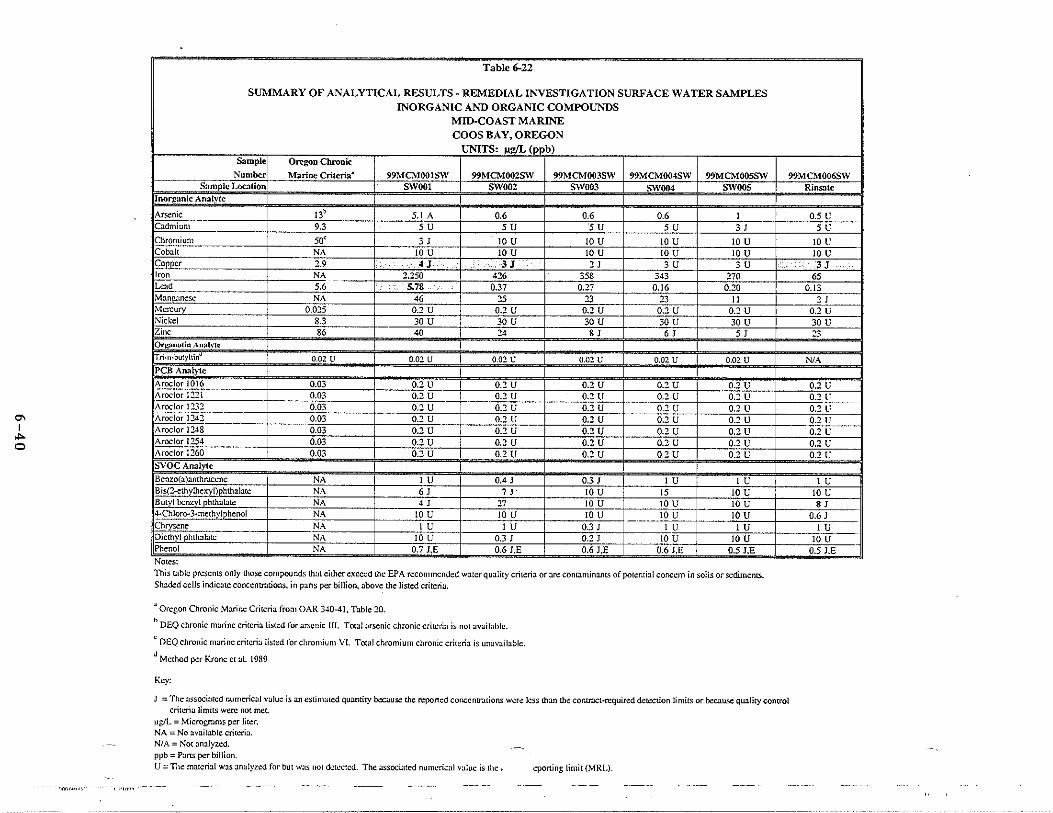
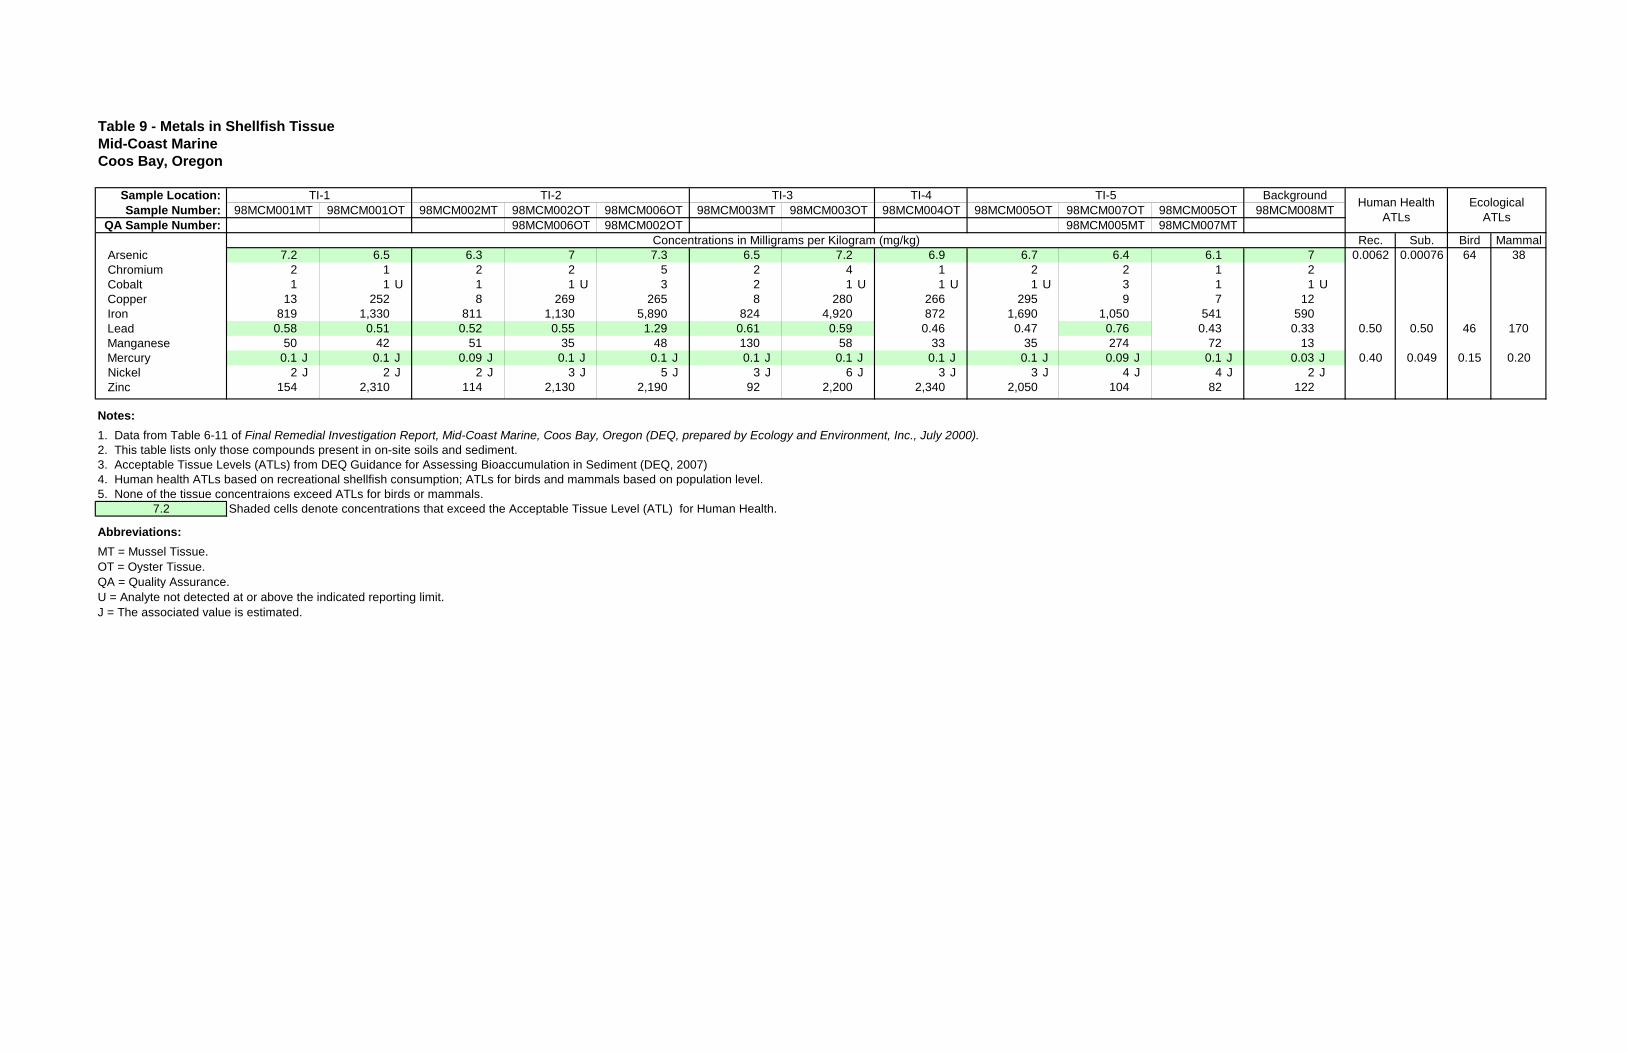
Table 9 - Metals in Shellfish TissueMid-Coast MarineCoos Bay, Oregon
Sample Location: Sample Number: 98MCM001MT 98MCM001OT 98MCM002MT 98MCM002OT 98MCM006OT 98MCM003MT 98MCM003OT 98MCM004OT 98MCM005OT 98MCM007OT 98MCM005OT 98MCM008MT
QA Sample Number: 98MCM006OT 98MCM005MTRec. Sub. Bird Mammal
Arsenic 7.2 6.5 6.3 7 7.3 6.5 7.2 6.9 6.7 6.4 6.1 7 0.0062 0.00076 64 38Chromium 2 1 2 2 5 2 4 1 2 2 1 2Cobalt 1 1 U 1 1 U 3 2 1 U 1 U 1 U 3 1 1 UCopper 13 252 8 269 265 8 280 266 295 9 7 12Iron 819 1,330 811 1,130 5,890 824 4,920 872 1,690 1,050 541 590Lead 0.58 0.51 0.52 0.55 1.29 0.61 0.59 0.46 0.47 0.76 0.43 0.33 0.50 0.50 46 170Manganese 50 42 51 35 48 130 58 33 35 274 72 13Mercury 0.1 J 0.1 J 0.09 J 0.1 J 0.1 J 0.1 J 0.1 J 0.1 J 0.1 J 0.09 J 0.1 J 0.03 J 0.40 0.049 0.15 0.20Nickel 2 J 2 J 2 J 3 J 5 J 3 J 6 J 3 J 3 J 4 J 4 J 2 JZinc 154 2,310 114 2,130 2,190 92 2,200 2,340 2,050 104 82 122
Notes:
1. Data from Table 6-11 of Final Remedial Investigation Report, Mid-Coast Marine, Coos Bay, Oregon (DEQ, prepared by Ecology and Environment, Inc., July 2000). 2. This table lists only those compounds present in on-site soils and sediment.3. Acceptable Tissue Levels (ATLs) from DEQ Guidance for Assessing Bioaccumulation in Sediment (DEQ, 2007)4. Human health ATLs based on recreational shellfish consumption; ATLs for birds and mammals based on population level.5. None of the tissue concentraions exceed ATLs for birds or mammals.
7.2 Shaded cells denote concentrations that exceed the Acceptable Tissue Level (ATL) for Human Health.
Abbreviations:
MT = Mussel Tissue.OT = Oyster Tissue.QA = Quality Assurance.U = Analyte not detected at or above the indicated reporting limit.J = The associated value is estimated.
TI-5 Background
98MCM002OT 98MCM007MT
Human Health ATLs
Ecological ATLs
Concentrations in Milligrams per Kilogram (mg/kg)
TI-1 TI-2 TI-3 TI-4
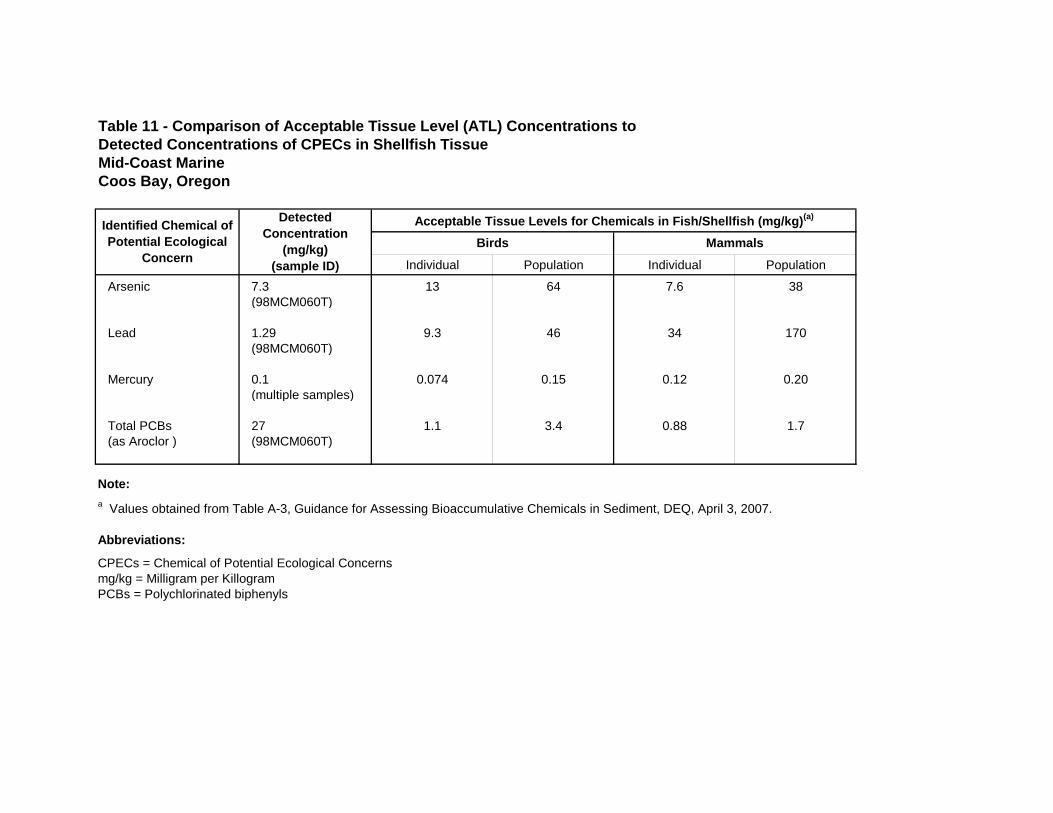
Table 11 - Comparison of Acceptable Tissue Level (ATL) Concentrations toDetected Concentrations of CPECs in Shellfish TissueMid-Coast MarineCoos Bay, Oregon
Individual Population Individual Population
Arsenic 7.3 13 64 7.6 38 (98MCM060T)
Lead 1.29 9.3 46 34 170 (98MCM060T)
Mercury 0.1 0.074 0.15 0.12 0.20 (multiple samples)
Total PCBs 27 1.1 3.4 0.88 1.7(as Aroclor ) (98MCM060T)
Note:
a Values obtained from Table A-3, Guidance for Assessing Bioaccumulative Chemicals in Sediment, DEQ, April 3, 2007.
Abbreviations:
CPECs = Chemical of Potential Ecological Concernsmg/kg = Milligram per KillogramPCBs = Polychlorinated biphenyls
Acceptable Tissue Levels for Chemicals in Fish/Shellfish (mg/kg)(a)
Birds
Detected Concentration
(mg/kg)(sample ID)
MammalsIdentified Chemical of Potential Ecological
Concern
15776‐00/Task 9 January 28, 2016
APPENDIX E Prospective Purchaser Agreement
(DEQ No. 01-01, February 21, 2001)
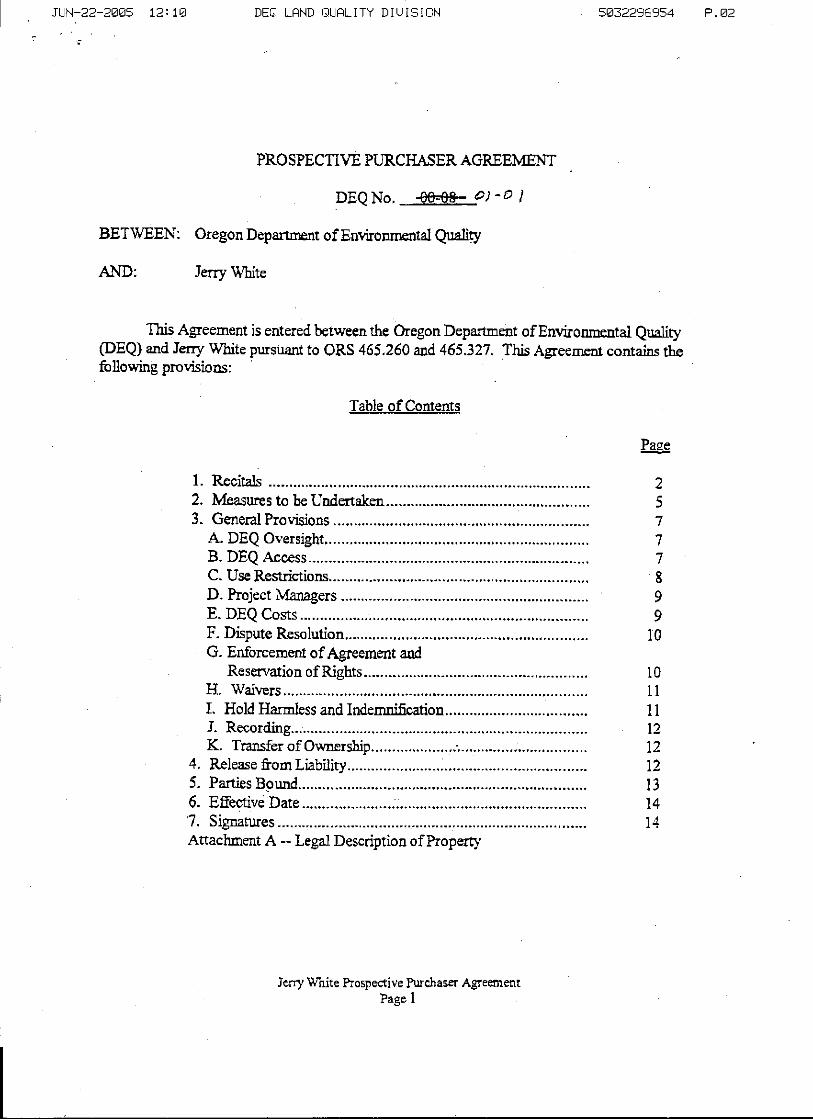
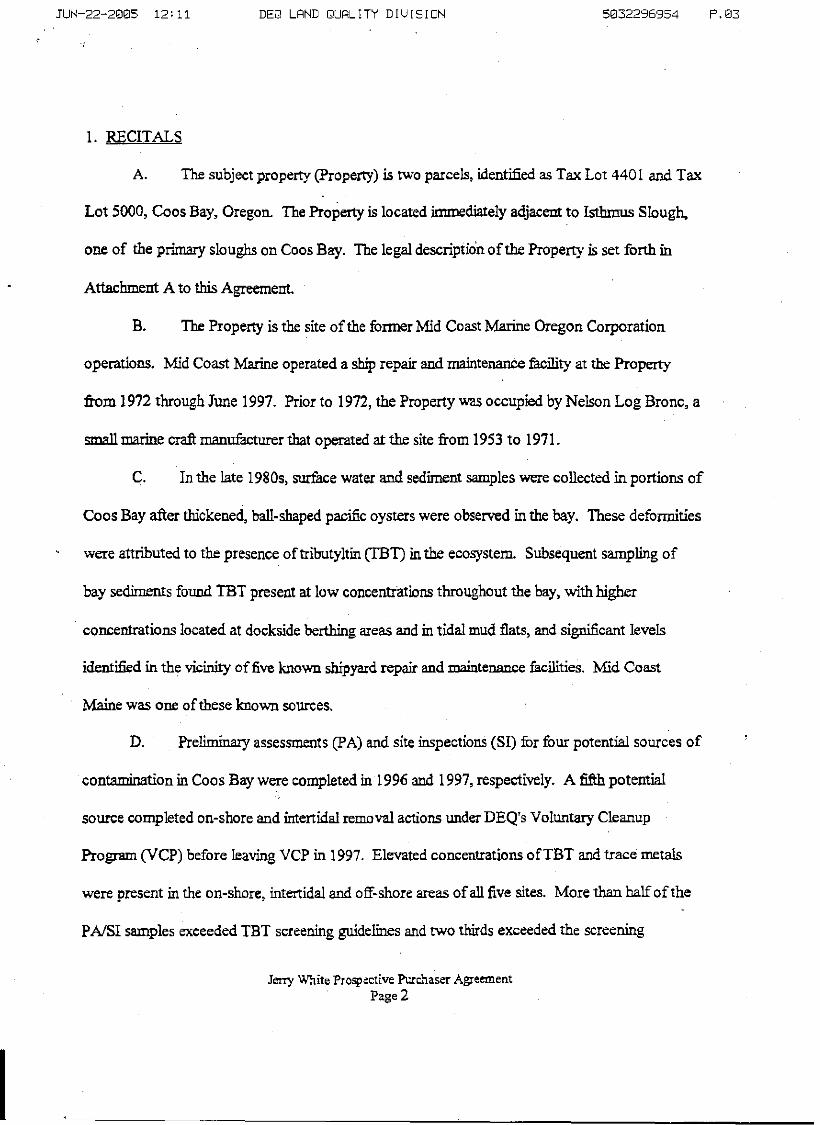
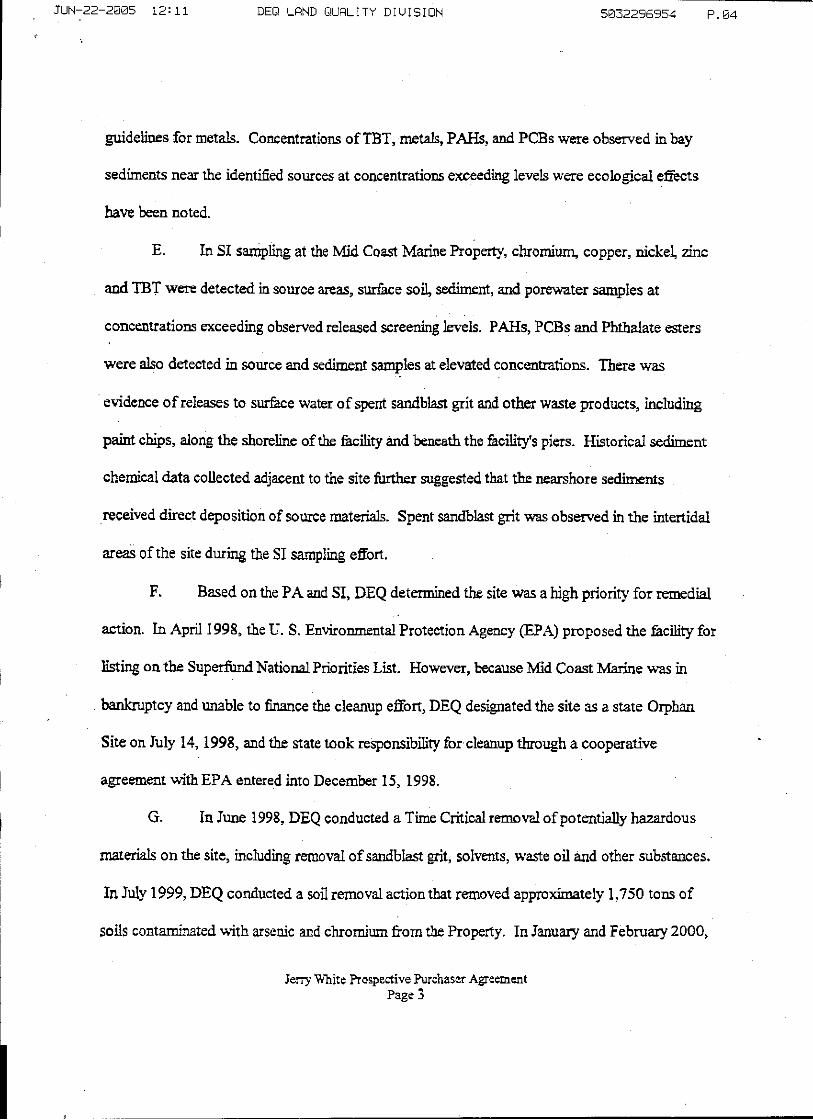
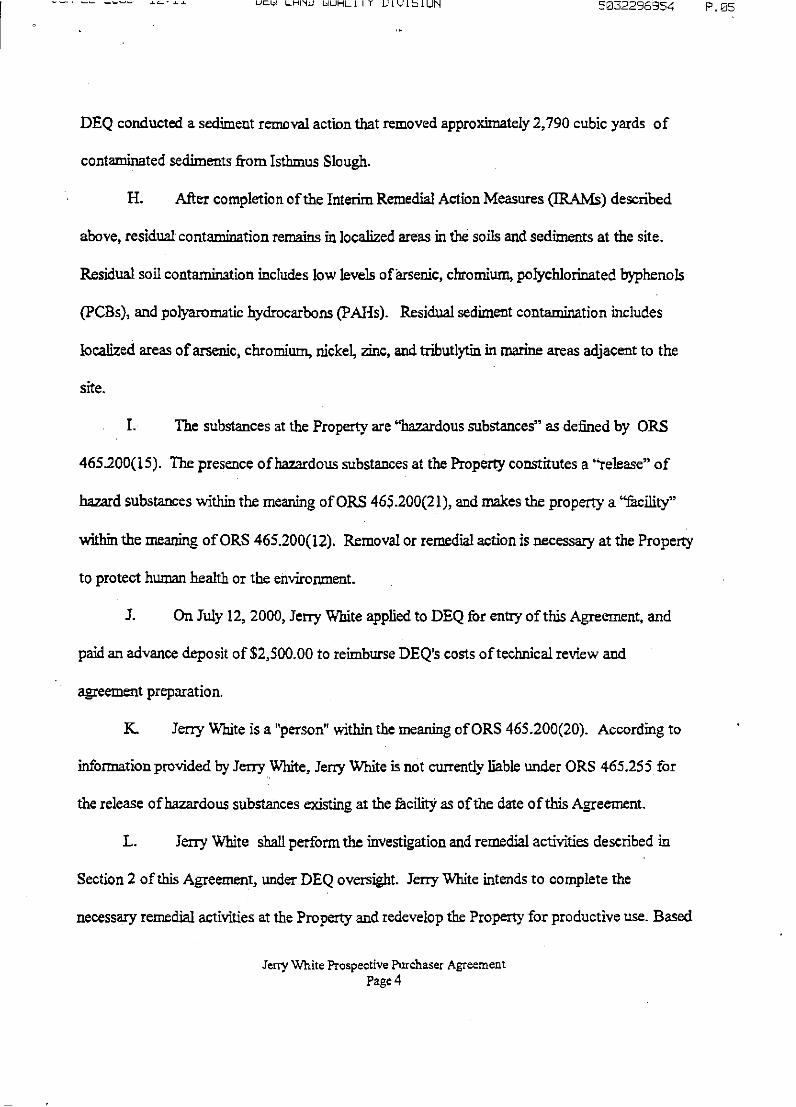
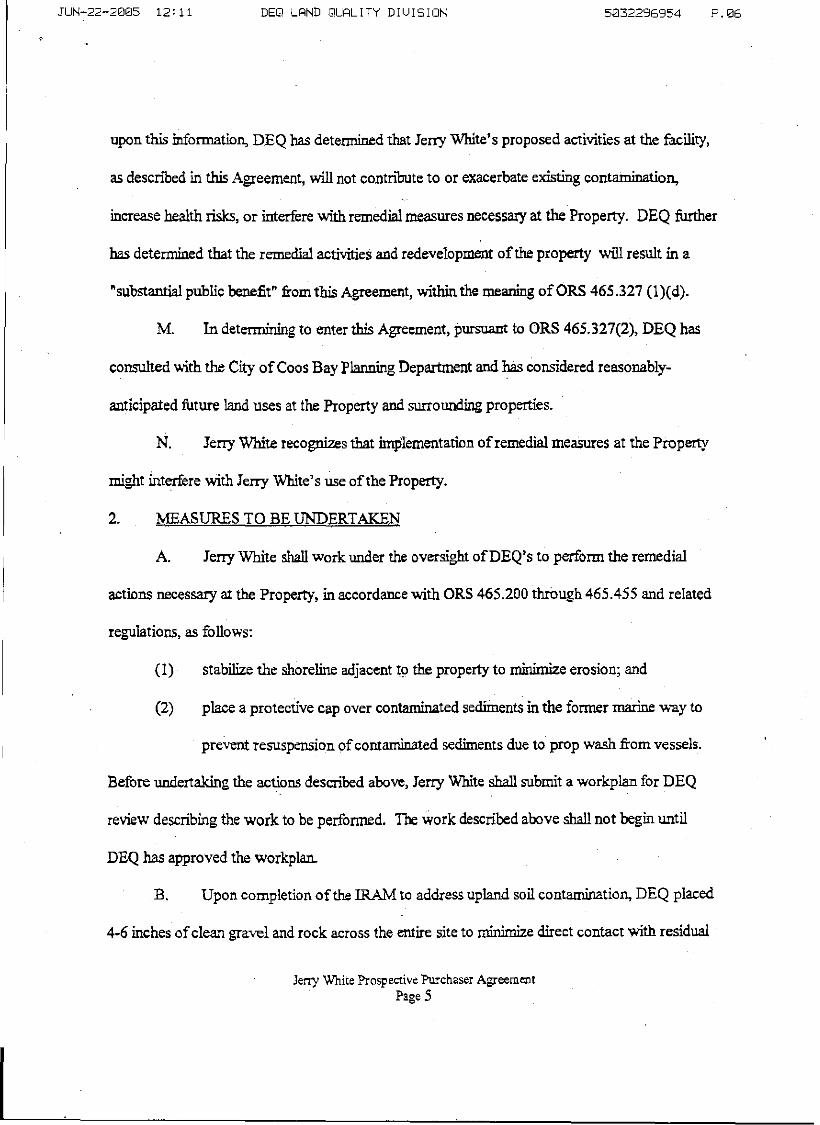
Aitken
Rectangle