Remark Quick Stats® Reports – Survey Tabulation · Survey Tabulation Gravic, Inc.— Remark...
16
Remark Quick Stats® Reports – Survey Tabulation Gravic, Inc.— Remark Products Group Web: http://www.RemarkSoftware.com Phone: 1.800.858.0860 or +1.610.647.7850 FAX: +1.610.647.8771 E-Mail: [email protected] Mail: 17 General Warren Blvd. Malvern, PA 19355-1245 USA
Transcript of Remark Quick Stats® Reports – Survey Tabulation · Survey Tabulation Gravic, Inc.— Remark...
Remark Quick Stats® Reports – Survey Tabulation
Gravic, Inc.— Remark Products Group
Web: http://www.RemarkSoftware.com Phone: 1.800.858.0860 or +1.610.647.7850 FAX: +1.610.647.8771 E-Mail: [email protected] Mail: 17 General Warren Blvd. Malvern, PA 19355-1245 USA

Remark Quick Stats® Reports – Survey Tabulation
Remark Quick Stats is included with all Remark products and can be used for survey tabulation. There are many options available when reviewing surveys, including grouping like questions together for analysis in groups. Question benchmarks can also be applied to determine if a desired value has been met. Weights can be applied to questions in analysis groups. It is also easy to review open-ended comments. Remark Quick Stats offers many different reports, all of which can be printed and exported for portability. There are a wide variety of statistics that are calculated. All reports can be customized to suit individual needs. It is possible to choose whether to include most statistics. Headers and footers can also be modified, in addition to numerous other settings that can be changed for each report. This document reviews every report available for survey analysis. For each report, a suggested use is provided, as well as a brief description of what is included in the report. An image of an example report is provided with notes pointing out some of the features of the report. Default settings are used for the images provided. The uses described below are only suggestions. You are encouraged to experiment with different settings and reports to find the reports that are best suited to your needs.
Index:
Detailed Item Analysis Report Item Analysis Graph Report Condensed Item Analysis Report Basic Item Analysis Report Integrated Item Analysis Report Item Statistics Report Crosstabulation Report Comparative Item Report Question Mean Report Analysis Group Report Response Report by Item Response Report by Respondent About Gravic, Inc.
Detailed Item Analysis Report
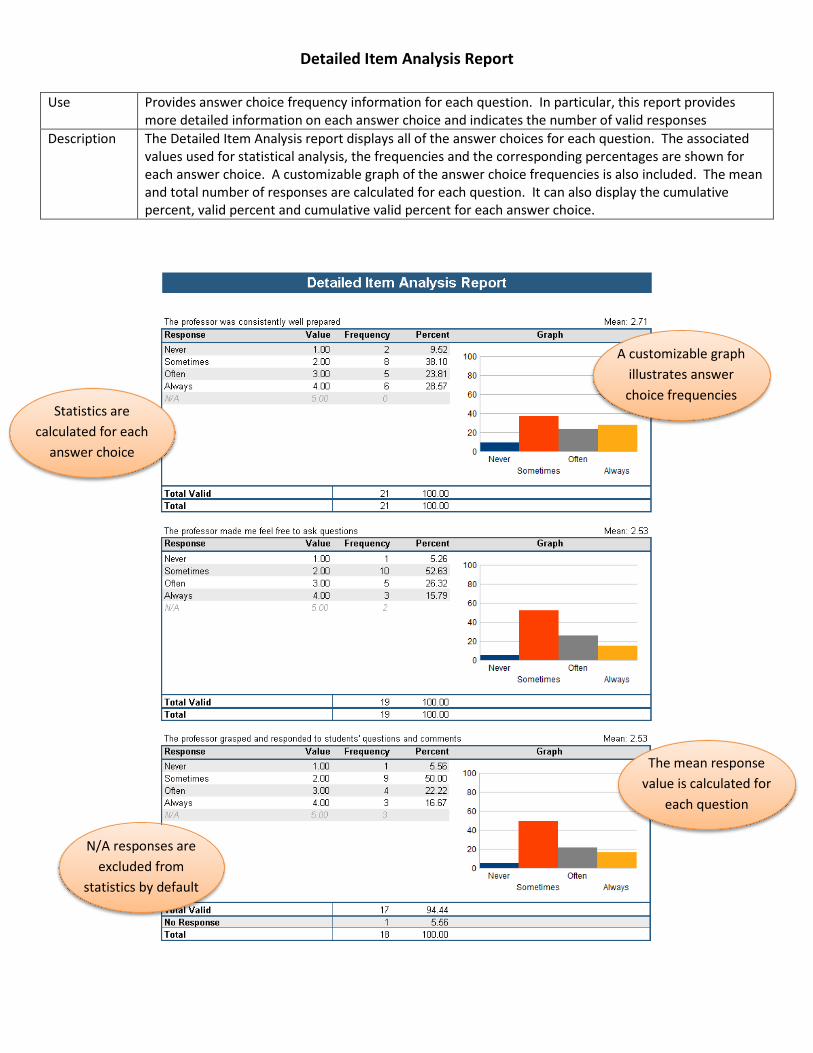
Use Provides answer choice frequency information for each question. In particular, this report provides more detailed information on each answer choice and indicates the number of valid responses
Description The Detailed Item Analysis report displays all of the answer choices for each question. The associated values used for statistical analysis, the frequencies and the corresponding percentages are shown for each answer choice. A customizable graph of the answer choice frequencies is also included. The mean and total number of responses are calculated for each question. It can also display the cumulative percent, valid percent and cumulative valid percent for each answer choice.
Statistics are calculated for each
answer choice
A customizable graph illustrates answer choice frequencies
N/A responses are excluded from
statistics by default
The mean response value is calculated for
each question

Item Analysis Graph Report
Use Provides answer choice frequency information for each question. In particular, this report provides response frequencies for each question and a graph of the frequencies.
Description The Item Analysis Graph report displays all of the answer choices for each question. The frequency percentages are calculated for each answer choice. A customizable graph of the answer choice frequencies is also included. The mean is reported for each question.
A customizable graph illustrates answer choice frequencies
The mean response value is calculated for
each question
N/A answers are not included in
calculations

Condensed Item Analysis Report
Use Provides answer choice frequency information for each question. In particular, this report highlights any data exceptions, such as blanks or multiple responses.
Description The Condensed Item Analysis report displays all of the answer choices for each question. The frequencies and corresponding percentages are calculated for each answer choice, and any data exceptions are specified. A customizable graph of the answer choice frequencies is also included. The mean is reported for each question.
Response frequencies and percentages are calculated for each
answer choice
The mean response value is calculated for each question
Blank responses are counted separately
A customizable graph illustrates answer choice frequencies
Basic Item Analysis Report
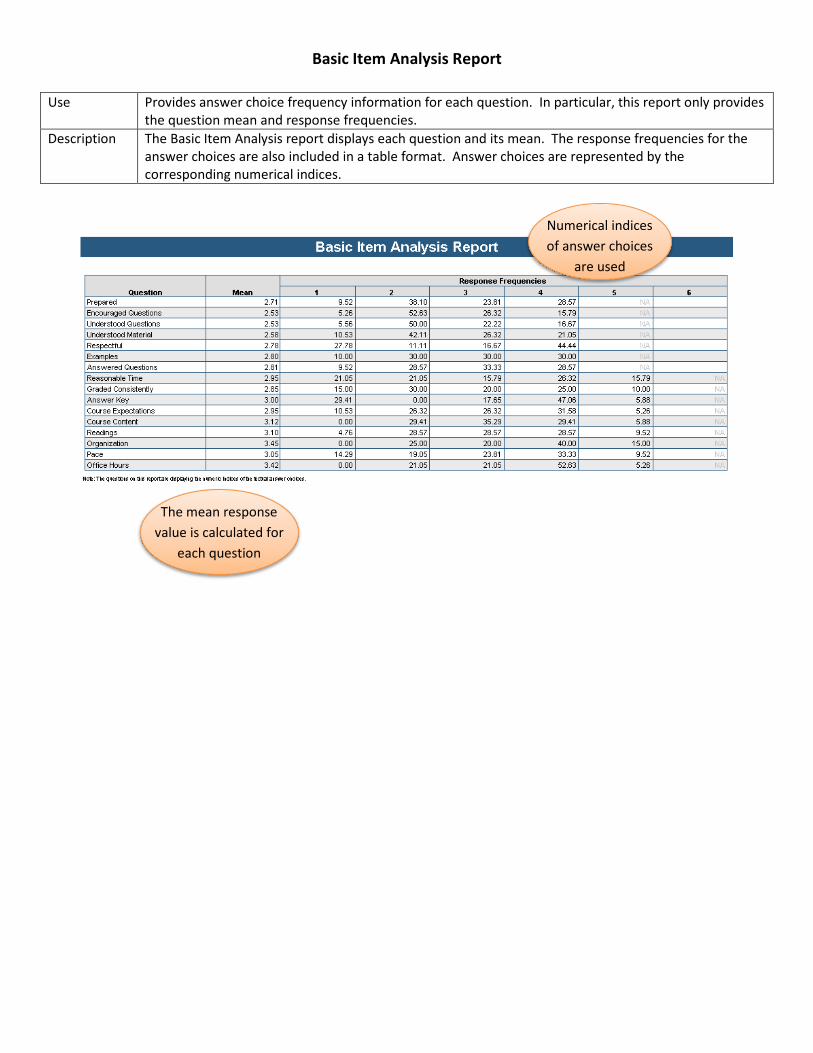
Use Provides answer choice frequency information for each question. In particular, this report only provides the question mean and response frequencies.
Description The Basic Item Analysis report displays each question and its mean. The response frequencies for the answer choices are also included in a table format. Answer choices are represented by the corresponding numerical indices.
The mean response
value is calculated for each question
Numerical indices of answer choices
are used

Integrated Item Analysis
Use Combines the Condensed Item Analysis report with the Response by Item report. This report is an easy way to view answer choice frequencies for multiple choice questions and free response answers in the same report.
Description The Integrated Item Analysis report displays all of the answers to the selected free response questions. Each multiple choice question is displayed with all of the answer choices. Frequencies and the corresponding percentages are calculated for each answer choice. A customizable graph of the frequencies is also included.
Respondents’ answers to free-
response questions can be shown
A customizable graph illustrates response
frequencies
Response frequencies and percentages are calculated for each
answer choice

Question means are calculated for
each question
N/A answers are not included in
statistics
Free response questions are listed in the order they appear
in the data center

Item Statistics Report
Use Displays various statistical information for each question. This report is useful for gaining a better understanding of the distribution of respondents’ answers and how they relate to the entire population.
Description The Item Statistics report displays the following statistics for each question: Question: sample size and number excluded Summary Statistics: mean, variance, standard deviation and standard error Descriptive Statistics: skewness, kurtosis, T value, mean absolute deviation Percentiles: 25th and 75th percentiles, median and inter quartile range Values: minimum, maximum and range Confidence Intervals: upper and lower bound estimates for a 95% and for a 99% confidence interval
N/A answers and
blanks are excluded from statistics
Information is grouped by type
of statistic

Crosstabulation Report
Use Creates a conditional table for any two questions’ responses. This report is helpful if you want to investigate if a relationship exists between the information gathered from two questions.
Description The Crosstabulation report creates a table that describes the distribution of two questions’ answers. The answer choices for the first question are down the left, and the answer choices for the second question are across the top. Within each cell are the conditional frequencies for each combination of answers. Totals for individual questions are across the bottom and down the right. Frequencies can be displayed as percentages or numbers.
Total percentages for each question are along the right
and the bottom
Conditional frequencies are in
the middle cells

Comparative Item Report
Use Compares mean responses for various demographic groups on each question. This report is useful if you want to see how certain groups of respondents answered questions.
Description The Comparative Item report allows you to select up to three questions from your data set by which to group respondents. For all of the questions in the survey, the report displays the number of respondents included in each subgroup, along with the mean response provided by that group and a bar chart of the mean. This information is displayed in a hierarchical format.
Respondents are grouped based on
demographic information
Statistics are provided for each
question

Question Mean Report
Use Provides the mean for every question tabulated. This allows you to quickly see individual question performance.
Description The Question Mean report allows you to view the minimum and maximum values assigned to the question and the mean response value for each tabulated question. In addition, you can display a bar chart of the mean. You can also include benchmarks, which are shown on the bar chart and make it easy to see which questions fell above or below the benchmark values.
The question mean is calculated and
graphed
The minimum and maximum possible values are shown
Information is provided for each
question

Analysis Group Report
Use Provides the mean for every question, followed by the means for each analysis group. This allows you to quickly see individual question and analysis group performance.
Description The Analysis Group report provides information for all questions in the survey and for each analysis group. For every question, this report displays the question mean, benchmark (if applicable) and a bar chart of the mean. The mean for each analysis group is also calculated.
The question mean is calculated
and graphed
The overall mean for the analysis
group is calculated
Information is provided for each question
individually and in each analysis group
Question weights alter how each
question impacts the group mean

Response Report by Item
Use Lists responses to open-ended questions and any questions that are not tabulated. This report is typically used to view data from free response questions, with answers grouped by question.
Description The Response by Item report provides a listing of responses to available questions of your choosing. Available questions include any free-response questions or questions that are not tabulated. This report organizes the question data by question. A respondent identifier is optional.
Each student’s response is displayed
Responses are grouped by
question

Response Report by Respondent
Use Lists responses to open-ended questions and any questions that are not graded. This report is typically used to view data from free response questions, with answers grouped by respondent.
Description The Response by Item report provides a listing of responses to available questions of your choosing. Available questions include any free-response questions or questions that are not tabulated. This report organizes the question data by respondent. A respondent identifier is optional.
Each student’s responses for the
selected questions are displayed
Responses are grouped by respondent

About Gravic, Inc.
Gravic, Inc. is a privately-held corporation located in Malvern, PA, about ten miles (16km) west of Philadelphia, PA USA. We make a number of computer software products for data collection, transformation and distribution uses. Customers for our products include schools (Primary and Higher Education), hospitals, large and small businesses, health care, government agencies, market researchers, trainers, meeting planners, brokerages, travel agencies, stock exchanges, electric utilities and telcos. The Remark Products Group of Gravic, Inc. was founded as Principia Products in 1991. We have worked in the area of image processing and pattern recognition since the early 1980’s. Our early work in OCR and ICR sold thousands of licenses. In 1991, we began to focus on OMR (optical mark recognition) with image scanners (Remark Office OMR® 1.0 release). Our strength is in our ability to innovate and develop solutions for common problems, while maintaining easy-to-use and affordable software. In 2001, we renamed Principia Products, Inc. to Gravic, Inc. and began a merger of our other entities (ITI and Compucon Services). We completed the merger in 2003 and now all product groups are run by common management.
Please visit our website to learn more about our company, values, and purpose.
Copyright © 2015 Gravic, Inc. , 17 General Warren Blvd., Malvern, PA 19355 - 1245 USA. All Rights Reserved. Gravic, Remark, Remark Office OMR, Remark Web Survey and Remark Quick Stats are registered trademarks of Gravic, Inc. All other products mentioned are trademarks of their respective holders. Specifications subject to
change without notice.
Gravic, Inc.— Remark Products Group
Web: http://www.RemarkSoftware.com
Phone: 1.800.858.0860 or +1.610.647.7850
FAX: +1.610.647.8771
E-Mail: [email protected]
Mail: 17 General Warren Blvd.
Malvern, PA 19355-1245 USA