
Religare Health Trust - listed...
27
Religare Health Trust Financial Results for the Quarter ended 30 September 2013 12 November 2013 STRICTLY PRIVATE AND CONFIDENTIAL
Transcript of Religare Health Trust - listed...

Religare Health Trust Financial Results for the Quarter ended 30 September 201312 November 2013
STRICTLY PRIVATE AND CONFIDENTIAL

This presentation is focused on comparing actual results from the period from 1 July 2013 to 30 September 2013
(“2Q FY 2014”) versus the projected figures for the financial year 2014. No other comparative figures will be
presented as the acquisition of the Portfolio of RHT as well as listing on the Singapore Stock Exchange was
completed on 19 October 2012.
This presentation may contain forward-looking statements that involve risks and uncertainties. Actual future
performance, outcomes and results may differ materially from those expressed in forward-looking statements as a
result of a number of risks, uncertainties and assumptions. Representative examples of these factors include
(without limitation) general industry and economic conditions, interest rate trends, cost of capital and capital
availability, competition from other developments or companies, shifts in expected levels of income and occupancy
rate, changes in operating expenses (including employee wages, benefits and training), governmental and public
policy changes and the continued availability of financing in the amounts and the terms necessary to support future
business. Investors are cautioned not to place undue reliance on these forward-looking statements.
The Indian Rupee and Singapore Dollar are defined herein as “INR” and “S$” respectively. Any discrepancy
between individual amounts and total shown in this presentation is due to rounding.
Disclaimer

Agenda
2Q FY 2014 Key Highlights & Financial Review
Portfolio Highlights
Growth Strategy
Peer Analysis
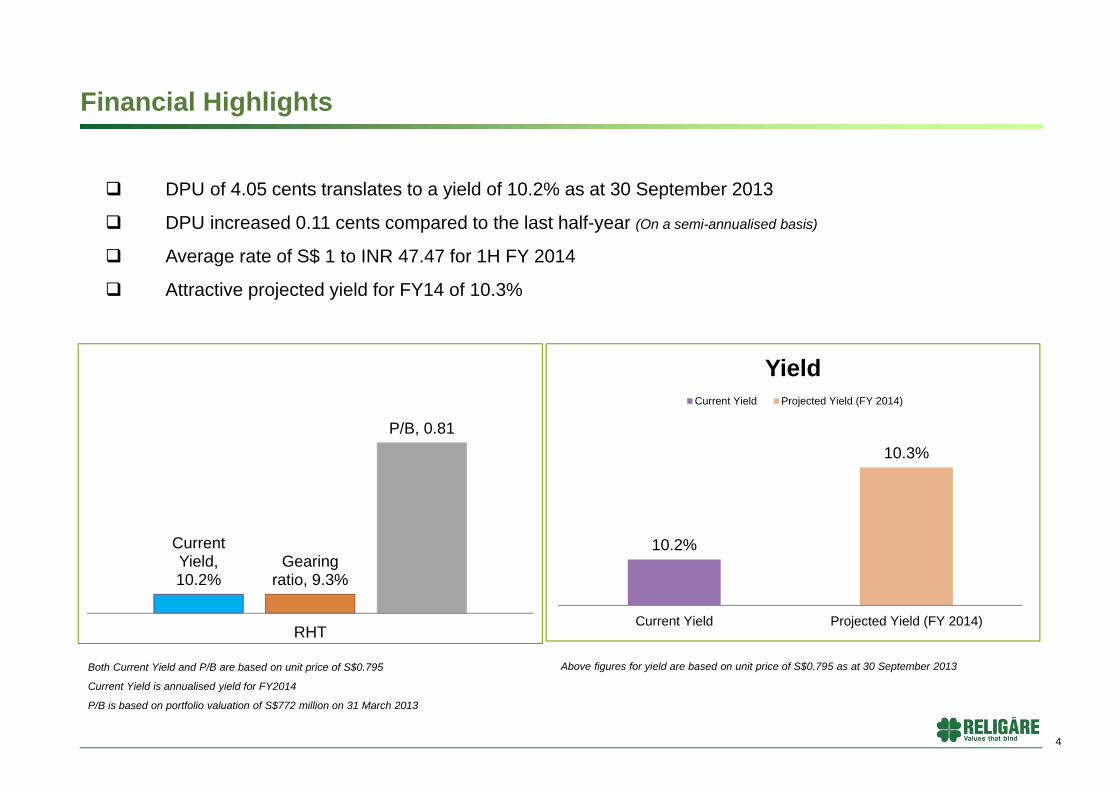
Financial Highlights
DPU of 4.05 cents translates to a yield of 10.2% as at 30 September 2013
DPU increased 0.11 cents compared to the last half-year (On a semi-annualised basis)
Average rate of S$ 1 to INR 47.47 for 1H FY 2014
Attractive projected yield for FY14 of 10.3%
Both Current Yield and P/B are based on unit price of S$0.795
Current Yield is annualised yield for FY2014
P/B is based on portfolio valuation of S$772 million on 31 March 2013
Above figures for yield are based on unit price of S$0.795 as at 30 September 2013
4
10.2%
10.3%
Current Yield Projected Yield (FY 2014)
YieldCurrent Yield Projected Yield (FY 2014)
Current Yield, 10.2%
Gearing ratio, 9.3%
P/B, 0.81
RHT
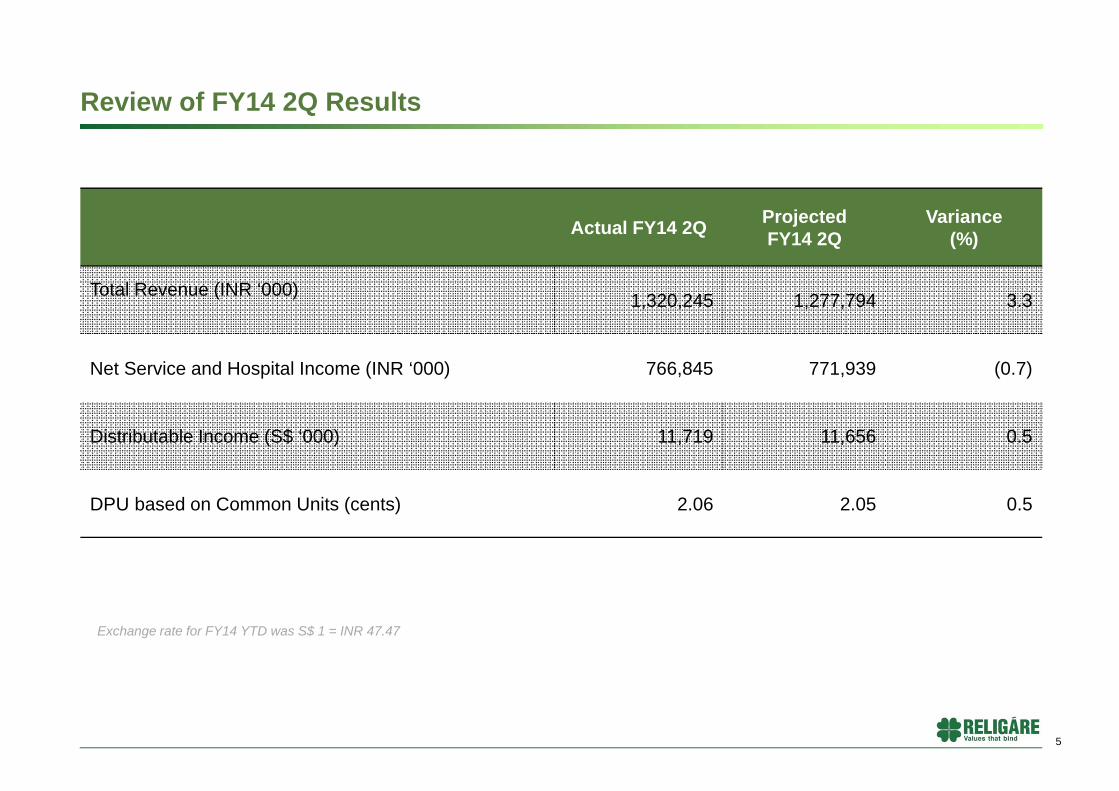
Review of FY14 2Q Results
Actual FY14 2Q ProjectedFY14 2Q
Variance (%)
Total Revenue (INR ‘000) 1,320,245 1,277,794 3.3
Net Service and Hospital Income (INR ‘000) 766,845 771,939 (0.7)
Distributable Income (S$ ‘000) 11,719 11,656 0.5
DPU based on Common Units (cents) 2.06 2.05 0.5
5
Exchange rate for FY14 YTD was S$ 1 = INR 47.47

FY 14 2QActual
FY14 2Q Projection Variance
S$'000 S$'000 S$'000
Service fee 23,741 25,569 (1,828) Hospital income 1,684 1,311 373 Other income 1,080 483 597 Total revenue 26,505 27,363 (858)
Total service fee and hospital expenses (11,111) (10,832) (279)
Finance income 263 5 258 Finance expenses (576) (565) (11) Trustee-Manager fee (1,297) (1,216) (81) Other trust expenses (215) (367) 152 Foreign exchange loss (3,059) - (3,059) Total expenses (15,995) (12,975) (3,020)
Profit before changes in fair value of financial derivatives 10,510 14,388 (3,878)
Fair value gain on financial derivatives 2,586 - 2,586 Profit Before Taxes 13,096 14,388 (1,292)
Taxes (3,643) (3,215) (428) Net Profit 9,453 11,173 (1,720)
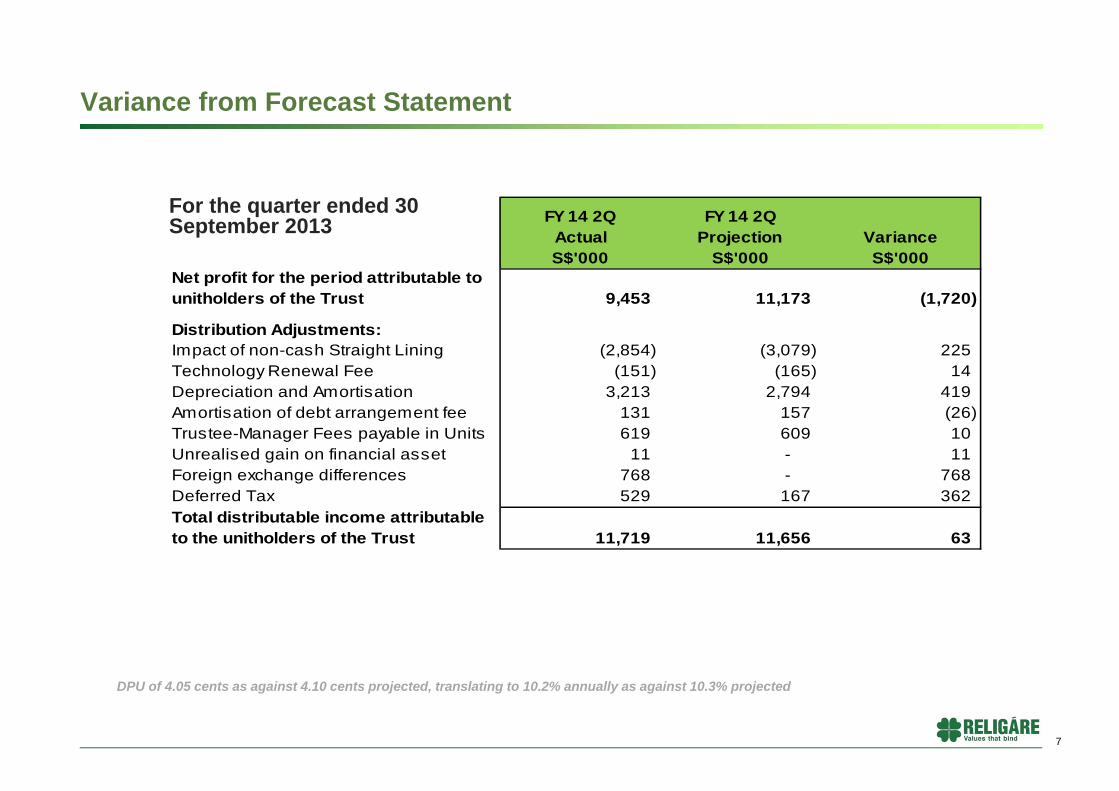
Variance from Forecast Statement
6
For the quarter ended 30 September 2013
FY 14 2QActual
FY 14 2QProjection Variance
S$'000 S$'000 S$'000Net profit for the period attributable to unitholders of the Trust 9,453 11,173 (1,720)
Distribution Adjustments:Impact of non-cash Straight Lining (2,854) (3,079) 225 Technology Renewal Fee (151) (165) 14 Depreciation and Amortisation 3,213 2,794 419 Amortisation of debt arrangement fee 131 157 (26) Trustee-Manager Fees payable in Units 619 609 10 Unrealised gain on financial asset 11 - 11 Foreign exchange differences 768 - 768 Deferred Tax 529 167 362 Total distributable income attributable to the unitholders of the Trust 11,719 11,656 63
Variance from Forecast Statement
DPU of 4.05 cents as against 4.10 cents projected, translating to 10.2% annually as against 10.3% projected
7
For the quarter ended 30 September 2013
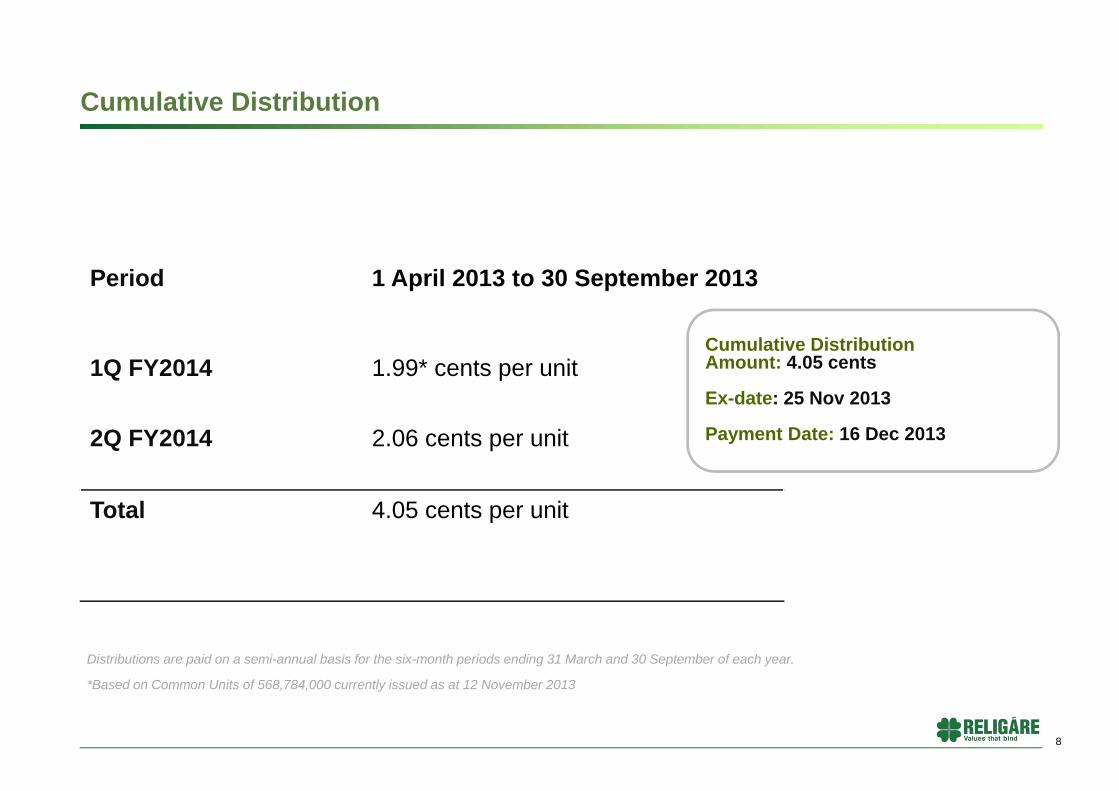
Cumulative Distribution
Period 1 April 2013 to 30 September 2013
1Q FY2014 1.99* cents per unit
2Q FY2014 2.06 cents per unit
Total 4.05 cents per unit
8
Cumulative Distribution Amount: 4.05 cents
Ex-date: 25 Nov 2013
Payment Date: 16 Dec 2013
Distributions are paid on a semi-annual basis for the six-month periods ending 31 March and 30 September of each year.
*Based on Common Units of 568,784,000 currently issued as at 12 November 2013

Portfolio

Clinical Establishment Performance for quarter ended 30 September 2013
10
^excluding Gurgaon
Average^ FY 14 1Q FY 14 2Q % increase
ARPOB (INR Mn) 10.17 9.93 (2.4)
Occupancy 78% 86% 8%
17.47
14.59
11.17 10.86 10.9110.29
8.54 8.42
0.00
14.15
11.7110.87 10.47
10.97
8.59 8.77
-
2
4
6
8
10
12
14
16
18
20
Gurgaon Noida Mulund BG Road Malar Shalimar Bagh Anandpur Jaipur
INR
(Mill
ion)
Q2FY14 Q1FY1413.4%
0.1%4.2%
4.6%
3.1%
6.2%
0.6%4.0%
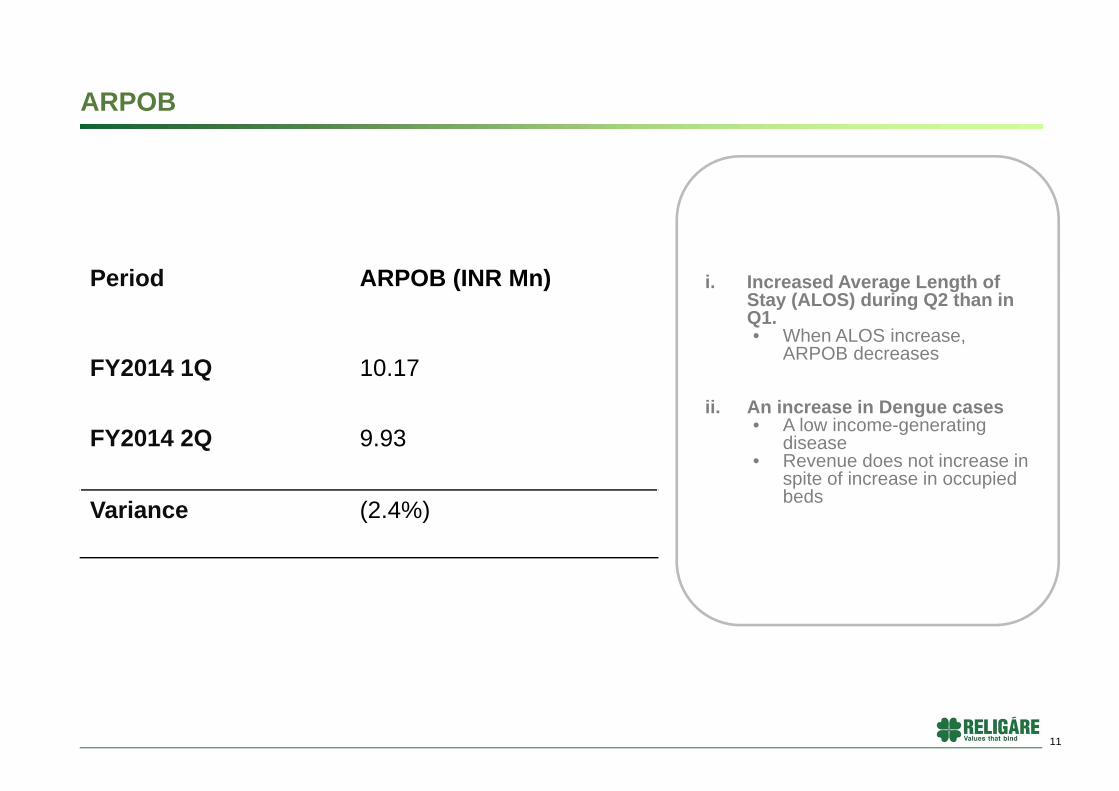
ARPOB
Period ARPOB (INR Mn)
FY2014 1Q 10.17
FY2014 2Q 9.93
Variance (2.4%)
11
i. Increased Average Length of Stay (ALOS) during Q2 than in Q1. • When ALOS increase,
ARPOB decreases
ii. An increase in Dengue cases • A low income-generating
disease• Revenue does not increase in
spite of increase in occupied beds

Strong Portfolio Occupancy
Gurgaon Operating Bed Capacity is approximately 300 beds
12
47%
80% 80%
83%
90%96%
90%
61%
300
254247
191209
155 148167
450
567
255
200
320
350373
178
0
100
200
300
400
500
600
Gurgaon Mulund BG Road Noida Jaipur Shalimarbagh Anandpur Malar
Occupancy Operating Bed Capacity Installed Bed Capacity
Figures as of 30 September 2013
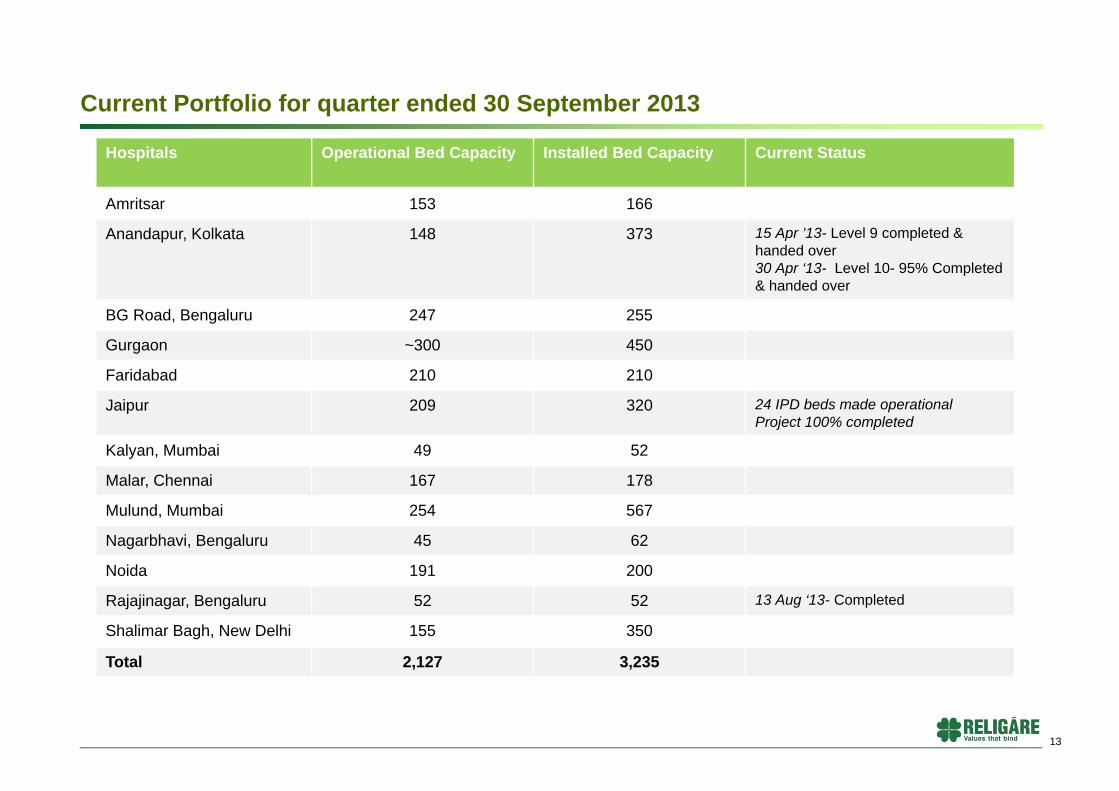
Current Portfolio for quarter ended 30 September 2013
13
Hospitals Operational Bed Capacity Installed Bed Capacity Current Status
Amritsar 153 166
Anandapur, Kolkata 148 373 15 Apr ’13- Level 9 completed & handed over30 Apr ‘13- Level 10- 95% Completed & handed over
BG Road, Bengaluru 247 255
Gurgaon ~300 450
Faridabad 210 210
Jaipur 209 320 24 IPD beds made operationalProject 100% completed
Kalyan, Mumbai 49 52
Malar, Chennai 167 178
Mulund, Mumbai 254 567
Nagarbhavi, Bengaluru 45 62
Noida 191 200
Rajajinagar, Bengaluru 52 52 13 Aug ‘13- Completed
Shalimar Bagh, New Delhi 155 350
Total 2,127 3,235

Expansion at Rajajinagar – A Few Glimpses
14
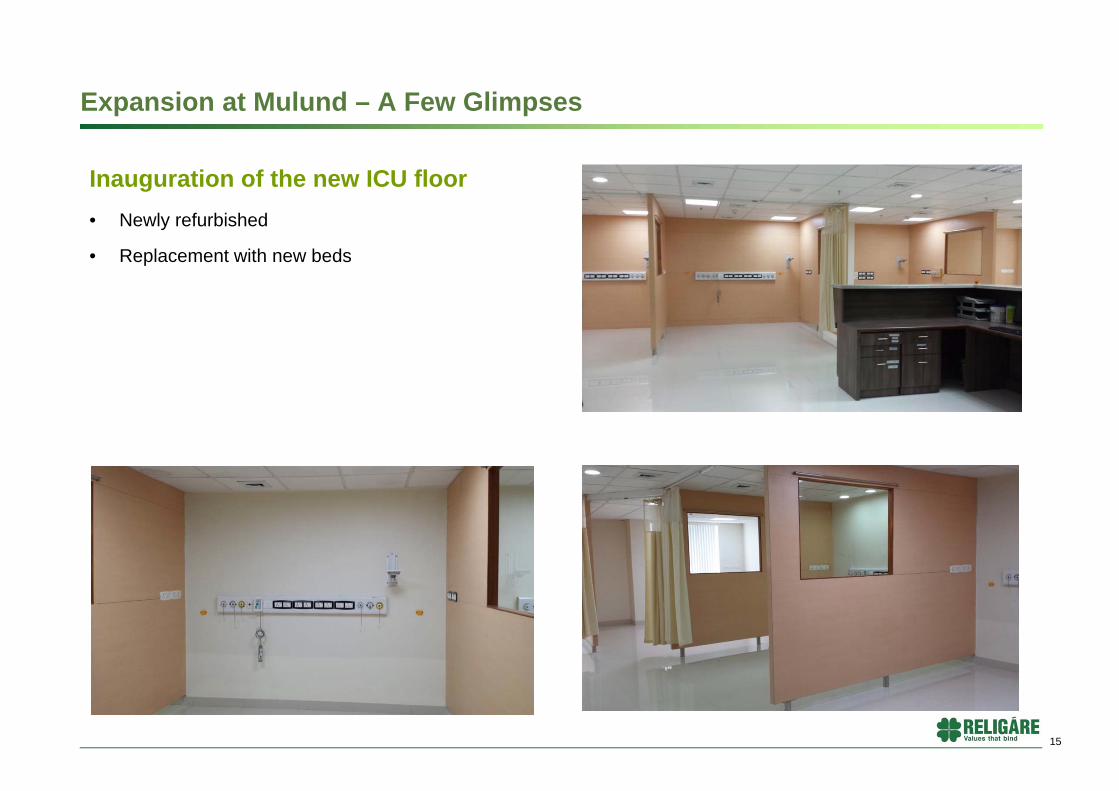
Expansion at Mulund – A Few Glimpses
15
Inauguration of the new ICU floor• Newly refurbished
• Replacement with new beds
16
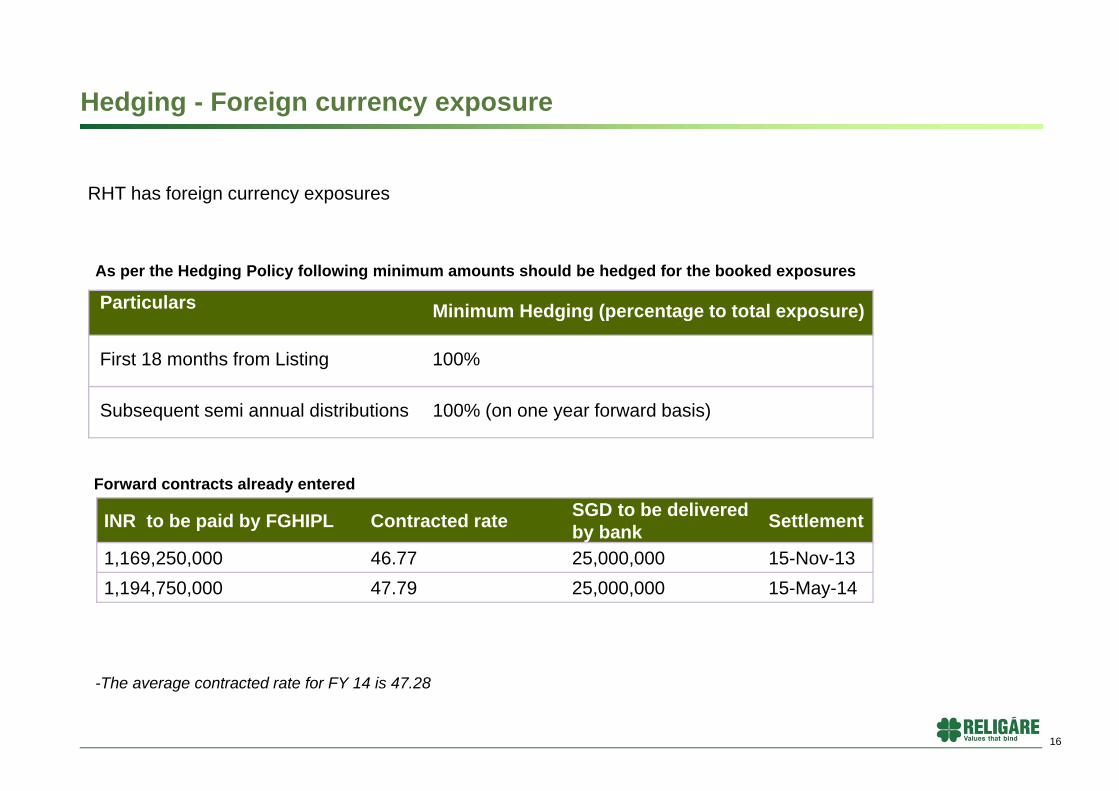
Hedging - Foreign currency exposure
Particulars Minimum Hedging (percentage to total exposure)
First 18 months from Listing 100%
Subsequent semi annual distributions 100% (on one year forward basis)
RHT has foreign currency exposures
As per the Hedging Policy following minimum amounts should be hedged for the booked exposures
INR to be paid by FGHIPL Contracted rate SGD to be delivered by bank Settlement
1,169,250,000 46.77 25,000,000 15-Nov-131,194,750,000 47.79 25,000,000 15-May-14
Forward contracts already entered
-The average contracted rate for FY 14 is 47.28

Fortis – a stronger balance sheet Sale of international assets in 2013
Australia- Dental Corp for AUD 270 million
Vietnam- Hoan My Medical Medical Corp for US$80 million
Hong Kong- Quality Healthcare for US$355 million
Public Issue of Foreign Currency Convertible Bonds (FCCBs)
Issue of US$30 million listed on Singapore Exchange Ltd (SGX)
International Financial Corporation (IFC)
Invested a total of US$100 million through a mix of preferential allotment and FCCBs
Preferential Allotment of Equity Shares – Standard Chartered
3.7 million equity shares to Standard Chartered Pvt Equity Mauritius III (SCPE)
US$5.5 million raised
Gearing
Net Debt-to-Equity ratio stood at 0.7 (Jun ‘13) vs. 0.5-0.6 (Oct ‘13) 11 Source: VCCircle Interview with Vishal Bali, 28 October 2013
17

Mohali Clinical Establishment
Mohali Clinical Establishment
Operating Company Fortis Health Management (North) Limited
Built-up Area (approx.) 434, 172 sq. ft.
Installed Bed Capacity 355 (including new Oncology block)
18
^Converted based on rate of SGD 1 = INR 50.39 as at 8 November 2013 (Source: Bloomberg)
The Trustee-Manager is currently exploring the acquisition of the Mohali Clinical Establishment.
As at 12 November 2013, no definitive agreement has been reached with the vendor of the Mohali Clinical Establishment and there is no assurance that the acquisition of
the Mohali Clinical Establishment will materialise. The Trustee-Manager will make further announcements at the appropriate juncture concerning the potential acquisition of
the Mohali Clinical Establishment as may be required by the listing rules of the Singapore Exchange Securities Trading Limited. In the meantime, unitholders of RHT
(“Unitholders”) are advised to refrain from taking any action in respect of their units in RHT (“Units”) which may be prejudicial to their interests and to exercise caution when
dealing with the Units. In the event that Unitholders wish to deal in the Units, they are advised to seek their own professional advice.

Peer Analysis

80%
85%
90%
95%
100%
105%
110%
115%
01 Jul 13 10 Jul 13 19 Jul 13 30 Jul 13 12 Aug 13 21 Aug 13 30 Aug 13 10 Sep 13 19 Sep 13
RHT AIT FTSE REIT STI First REIT Plife REIT
Name Currency Last Price Open Close Change (%) Total Volume* Daily Average Volume*
Religare Health Trust SGD 0.795 0.85 0.795 (6.47) 97,840,000 1,553,016
First Real Estate Investment Trust SGD 1.115 1.21 1.115 (7.85) 58,314,000 925,619
Ascendas India Trust SGD 0.625 0.72 0.625 (13.19) 53,540,000 849,841
Parkway Life REIT SGD 2.35 2.38 2.35 (1.26) 21,987,000 349,000
Source: MiraqleFigures as of 30 September 2013
Unit Price Performance
20

Comparative Analysis – Financial Analysis
21
Yield figures as at 30 September2013 (OCBC Investment Research Weekly SREITs), Gearing figures are as announced by respective REIT/BT
RHT figures based on actual numbers, annualised yield and using share price of 0.795 as at 30 September 2013
P/B is based on portfolio valuation of S$772 million on 31 March 2013
7.9% 4.6% 7.0% 10.2%
20%
31% 33%
9.3%
0.98
1.52
1.23
0.81
AIT Plife First Reit RHT
Yield Gearing ratio P/B

7.1% 7.4%
2.8%2.9%
Actual Yr 2013(annualised)
Projection Yr 2014
22
Financial Projection FY2014
Notes:(1) Financials converted at S$1 = INR44.04 for FY2013, S$1 = INR46.70 for FY 2014, and exchange rate at the listing date of S$1= INR43.55.(2) Includes straight lining of Base Service Fee.(3) DPU calculated based on unit price of S$0.795 as at 30 September2013
102.3102.5
5.25.91.92.0
Actual Year 2013(annualised)
Projection Yr 2014
Service Fee Hospital Income Other Income
Revenue (1)(2)
(S$m)DPU Yield (3)
44.846.6
Actual Year 2013(annualised)
Projection Yr 2014
110.4 109.4
Distributable Income (1)
(S$m)
9.9%10.3%
Gearing: 9.3%
Sponsor Waiver
Average NOI margin: 59%
Appendix
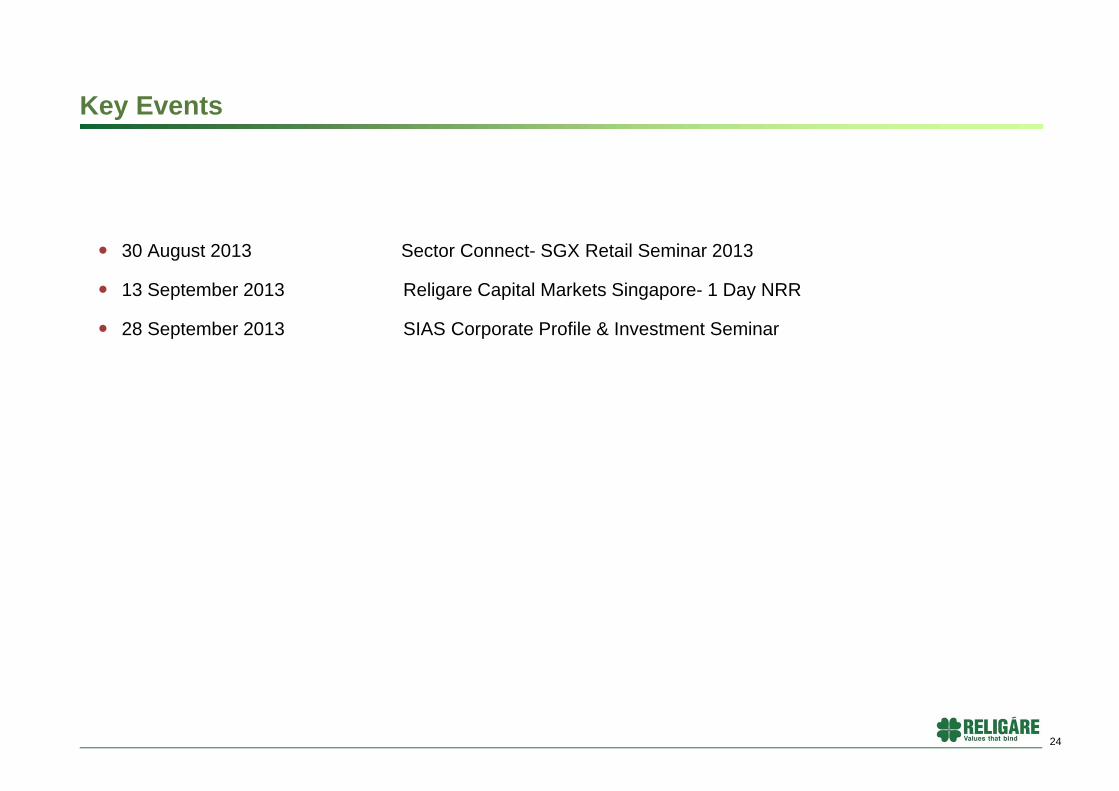
30 August 2013 Sector Connect- SGX Retail Seminar 2013
13 September 2013 Religare Capital Markets Singapore- 1 Day NRR
28 September 2013 SIAS Corporate Profile & Investment Seminar
Key Events
24
25
0.5% - 1.0% of acquisition price
0.5% of the sale price (Divestment to 3rd party)
No divestment fee (Divestment to Sponsor)
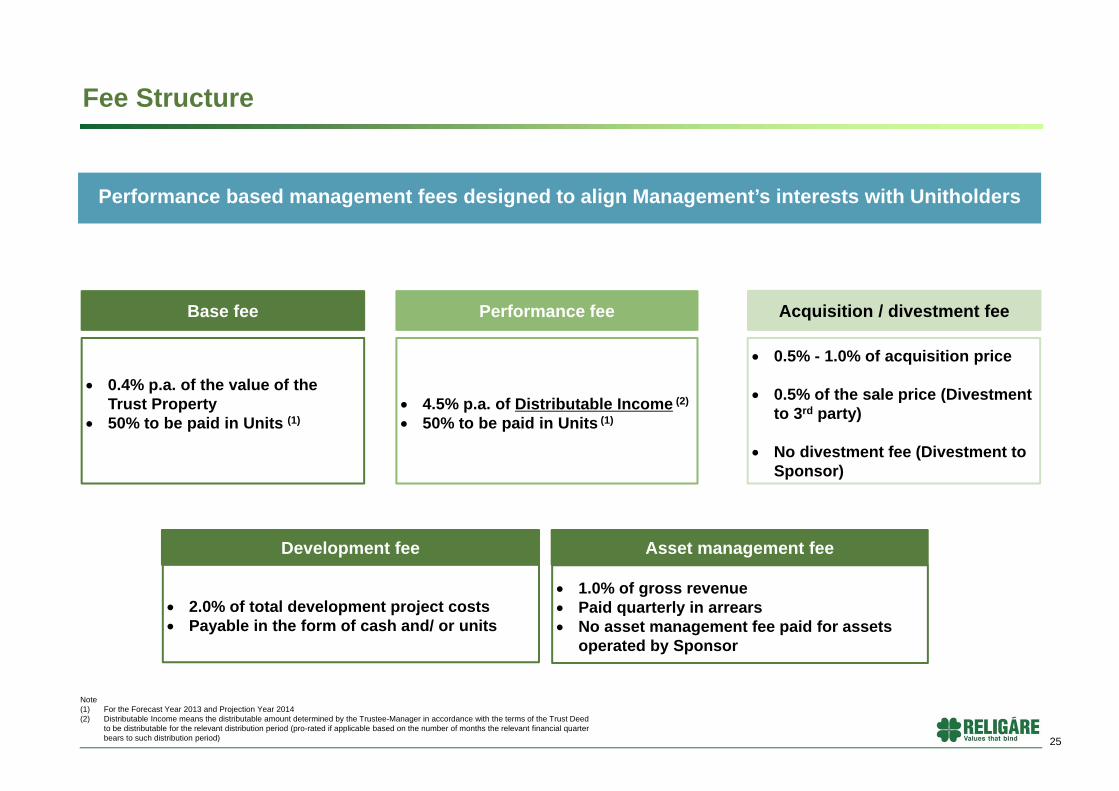
Performance based management fees designed to align Management’s interests with Unitholders
Base fee Performance fee Acquisition / divestment fee
0.4% p.a. of the value of the Trust Property
50% to be paid in Units (1) 4.5% p.a. of Distributable Income (2)
50% to be paid in Units (1)
2.0% of total development project costs Payable in the form of cash and/ or units
Development fee Asset management fee
Fee Structure
1.0% of gross revenue Paid quarterly in arrears No asset management fee paid for assets
operated by Sponsor
Note (1) For the Forecast Year 2013 and Projection Year 2014(2) Distributable Income means the distributable amount determined by the Trustee-Manager in accordance with the terms of the Trust Deed
to be distributable for the relevant distribution period (pro-rated if applicable based on the number of months the relevant financial quarter bears to such distribution period)

Efficient Trust Structure
Note:(1) Promoters comprise Malvinder Mohan Singh, Shivinder Mohan Singh and their associates.
India Singapore
Acts on behalf ofUnitholders and provides
management servicesDistributions
Others New Unitholders Trustee-Manager
~19%~81%
Hospital and Medical Services Agreements(“HMSAs”)
Fortis Operating Companies
(“FOCs”) CCD Interest paymentsand dividends
Investments in CompulsoryConvertible Debentures
(“CCDs”) and equity shares
TM Fees
Distributions
100%
Hospital operatingcapabilities
Ownership of medical andhealthcare infrastructure facilities
Dividends 100%
28.0%
72.0%
Promoters (1)
Fortis Global Healthcare
InfrastructureService Fees
Clinical Establishment
Services Hospital Services
Companies (“HSCs”)
Fortis Health International Limited
(Mauritius)
100%
Dividends
26

27
Term of Agreement
15 years with option to extend by another 15 years by mutual consent
Primary Obligations of HSCos
Making available and maintaining the Clinical Establishments
Provision of outpatient services
Provision of radio diagnostic services
Primary Obligations of FOCs
Provision of healthcare services at the Clinical Establishments
Pay to HSCos the Services Fees and Commitment Deposits
Services Fee
Base Service Fee– Increased by 3% p.a.– Upward revision for any capex / expansion– Provision for capex to replace medical equipment
(“Technology Renewal Fee”) added to Base Fee (2)
– HSCos entitled to request for an advance of up to 60% of the Base Service Fee
Variable Service Fee– 7.5% of the operating income of the FOC
Commitment Deposits
FOC to pay to HSCo 25% of cost for expansions of capacity / modification of Fortis Hospitals as an interest free refundable commitment deposit
Income Secured Through Long Term Working Agreements
Mechanics of the HMSA Key Terms of the HMSA
Services Fees
Fortis OperatingCompany
Clinical Establishment
Operated by
Hospital Services Company
Ownership
Services
B
AC
Ancillary Services
Ownership Earnings
Commitment Deposits
D+
Public
Source: TMNotes:(1) Fortis has signed commitment agreements to enter into similar HMSAs for the greenfield healthcare infrastructure assets.(2) Technology Renewal Fee will be paid into a Technology Renewal Fund to be maintained by Fortis.
A
B
C
D
Prior to listing, the Hospital Services Companies (“HSCos”) will enter into Hospital and Medical Services Agreements (“HMSAs”) with the Fortis Operating Companies (“FOCs” ) to operate the healthcare infrastructure assets (1).