Reliability of Reinforced Concrete Structures Subjected … serviceability and safety (Imam et al....
13
Reliability of Reinforced Concrete Structures Subjected to Corrosion-Fatigue and Climate Change Emilio Bastidas-Arteaga* (Received November 26, 2016, Accepted January 7, 2018) Abstract: Durability of reinforced concrete (RC) structures is affected by certain environmental conditions and operational actions which can reduce their lifetime significantly. Among these actions, this paper proposes a stochastic model that accounts for the combined effects of chloride-induced corrosion, climate change and cyclic loading. Separately, corrosion leads to cross-section reduction, climate change produces changes in temperature and humidity and fatigue induces nucleation and propagation of cracks in the rebars. When considered together, pitting corrosion nucleates cracks while environmental factors affect the kinematics of chloride ingress and corrosion propagation. The proposed approach is illustrated with the reliability analysis of a bridge girder subjected to cyclic loading under various environmental conditions. The overall results indicate that climate change effect induces lifetime reductions ranging between 1.4 and 2.3% if fatigue load is neglected. Under cyclic loading, total lifetime reduction increases up to 7%. Keywords: reliability, corrosion-fatigue, reinforced concrete, climate change, chloride ingress. 1. Introduction Reinforced concrete (RC) civil infrastructure systems are critical assets for the socioeconomic development of any country. Designing and maintaining these systems for a particular service lifetime have been recognized as critical issues worldwide. RC structures are characterized by high durability; however, during their operational life, they are subjected to internal and external actions that affect perfor- mance, serviceability and safety (Imam et al. 2015; Kim et al. 2016; Marquez-Pen ˜aranda et al. 2016; Morga and Marano 2015; Sa ´nchez-Silva and Klutke 2016). Nowadays, many deteriorated structures are evaluated for possible repair and continued service because their replacement would be economically unfeasible. For example, about 173,000 bridges in the United States are structurally deficient or functionally obsolete due in part to corrosion (Bhide 1999; Pritzl et al. 2014; Radlin ´ska et al. 2014). Regarding costs, Koch et al. (2016) reported that the global cost of corrosion is US$2.5 trillion (about 3.4% of the global Gross Domestic Product). Thus, developing robust models for prediction and strategies for periodic inspection and maintenance plays a significant role in enabling target reliabilities to be met over a period of continued service (Bastidas-Arteaga et al. 2009; Bastidas-Arteaga and Schoefs 2015; Clifton 1993; Mori and Ellingwood 1995). This paper focuses on a combined corrosion-fatigue dete- rioration mechanism. Corrosion is induced by chloride pen- etration that results in turn from a complex interaction between physical and chemical processes that are driven by environmental surrounding conditions (Bastidas-Arteaga and Stewart 2016; Nguyen et al. 2017; Saetta et al. 1993). Com- bined corrosion-fatigue deterioration results from the action of cycling stresses in corrosive environments. Localized corro- sion leading to pitting may provide sites for fatigue crack initiation. For example, several experimental studies have shown that pitting corrosion has been responsible for the nucleation of fatigue cracks in a wide range of steels and aluminum alloys (Ahn et al. 1992; Chen and Duquette 1992; Kondo 1989). Corrosive agents (e.g., seawater) increase the fatigue crack growth rate (Gangloff 2005), whereas the mor- phology of metals/alloys at micro-level governs the pit nucleation sites (Rajasankar and Iyer 2006). There exists a limited amount of experimental tests on corrosion-fatigue in RC structures. Ahn and Reddy (2001) performed an experimental study to evaluate the durability of RC beams subjected to fatigue loading and chloride ingress. The tests included 16 beams and accounted for the influence of static and cyclic loading for different water/ cement ratios. Alternate filling and draining of a tank sim- ulated the marine tidal zone, and a galvanostatic corrosion technique was used to accelerate corrosion of the rein- forcement. The ultimate strength of the beams was tested after 78,000 cycles by applying four-point flexural loading. The results indicated that beams subjected to cyclic loading UBL, Universite ´ de Nantes, GeM, Institute for Research in Civil and Mechanical Engineering/Sea and Littoral Research Institute, CNRS UMR 6183/FR 3473, 2 rue de la Houssinie `re, BP 99208, 44322 Nantes Cedex 3, France. *Corresponding Author; E-mail: [email protected] Copyright Ó The Author(s) 2018. This article is an open access publication International Journal of Concrete Structures and Materials DOI 10.1186/s40069-018-0235-x ISSN 1976-0485 / eISSN 2234-1315
-
Upload
duongkhuong -
Category
Documents
-
view
213 -
download
0
Transcript of Reliability of Reinforced Concrete Structures Subjected … serviceability and safety (Imam et al....
Reliability of Reinforced Concrete Structures Subjected toCorrosion-Fatigue and Climate Change
Emilio Bastidas-Arteaga*
(Received November 26, 2016, Accepted January 7, 2018)
Abstract: Durability of reinforced concrete (RC) structures is affected by certain environmental conditions and operational
actions which can reduce their lifetime significantly. Among these actions, this paper proposes a stochastic model that accounts for
the combined effects of chloride-induced corrosion, climate change and cyclic loading. Separately, corrosion leads to cross-section
reduction, climate change produces changes in temperature and humidity and fatigue induces nucleation and propagation of cracks
in the rebars. When considered together, pitting corrosion nucleates cracks while environmental factors affect the kinematics of
chloride ingress and corrosion propagation. The proposed approach is illustrated with the reliability analysis of a bridge girder
subjected to cyclic loading under various environmental conditions. The overall results indicate that climate change effect induces
lifetime reductions ranging between 1.4 and 2.3% if fatigue load is neglected. Under cyclic loading, total lifetime reduction
increases up to 7%.
Keywords: reliability, corrosion-fatigue, reinforced concrete, climate change, chloride ingress.
1. Introduction
Reinforced concrete (RC) civil infrastructure systems arecritical assets for the socioeconomic development of anycountry. Designing and maintaining these systems for aparticular service lifetime have been recognized as criticalissues worldwide. RC structures are characterized by highdurability; however, during their operational life, they aresubjected to internal and external actions that affect perfor-mance, serviceability and safety (Imam et al. 2015; Kimet al. 2016; Marquez-Penaranda et al. 2016; Morga andMarano 2015; Sanchez-Silva and Klutke 2016). Nowadays,many deteriorated structures are evaluated for possible repairand continued service because their replacement would beeconomically unfeasible. For example, about 173,000bridges in the United States are structurally deficient orfunctionally obsolete due in part to corrosion (Bhide 1999;Pritzl et al. 2014; Radlinska et al. 2014). Regarding costs,Koch et al. (2016) reported that the global cost of corrosionis US$2.5 trillion (about 3.4% of the global Gross DomesticProduct). Thus, developing robust models for prediction andstrategies for periodic inspection and maintenance plays asignificant role in enabling target reliabilities to be met over
a period of continued service (Bastidas-Arteaga et al. 2009;Bastidas-Arteaga and Schoefs 2015; Clifton 1993; Mori andEllingwood 1995).This paper focuses on a combined corrosion-fatigue dete-
rioration mechanism. Corrosion is induced by chloride pen-etration that results in turn from a complex interactionbetween physical and chemical processes that are driven byenvironmental surrounding conditions (Bastidas-Arteaga andStewart 2016; Nguyen et al. 2017; Saetta et al. 1993). Com-bined corrosion-fatigue deterioration results from the action ofcycling stresses in corrosive environments. Localized corro-sion leading to pitting may provide sites for fatigue crackinitiation. For example, several experimental studies haveshown that pitting corrosion has been responsible for thenucleation of fatigue cracks in a wide range of steels andaluminum alloys (Ahn et al. 1992; Chen and Duquette 1992;Kondo 1989). Corrosive agents (e.g., seawater) increase thefatigue crack growth rate (Gangloff 2005), whereas the mor-phology of metals/alloys at micro-level governs the pitnucleation sites (Rajasankar and Iyer 2006).There exists a limited amount of experimental tests on
corrosion-fatigue in RC structures. Ahn and Reddy (2001)performed an experimental study to evaluate the durabilityof RC beams subjected to fatigue loading and chlorideingress. The tests included 16 beams and accounted for theinfluence of static and cyclic loading for different water/cement ratios. Alternate filling and draining of a tank sim-ulated the marine tidal zone, and a galvanostatic corrosiontechnique was used to accelerate corrosion of the rein-forcement. The ultimate strength of the beams was testedafter 78,000 cycles by applying four-point flexural loading.The results indicated that beams subjected to cyclic loading
UBL, Universite de Nantes, GeM, Institute for Research
in Civil and Mechanical Engineering/Sea and Littoral
Research Institute, CNRS UMR 6183/FR 3473, 2 rue de
la Houssiniere, BP 99208, 44322 Nantes Cedex 3, France.
*Corresponding Author;
E-mail: [email protected] � The Author(s) 2018. This article is an open
access publication
International Journal of Concrete Structures and MaterialsDOI 10.1186/s40069-018-0235-xISSN 1976-0485 / eISSN 2234-1315
during the exposure period showed lower ultimate strengththan those subjected to static loading. Taking into accountthe imminent reduction of ultimate strength, other experi-mental studies focused on estimating the effectiveness ofusing composite repair materials (Al-Hammoud et al. 2011;ElSafty et al. 2014; Masoud et al. 2005; Song and Yu 2015).More recently, Wang et al. (2018) performed a comprehen-sive experimental study to quantify the effects of cyclic loadon the chloride ingress process. They found that consideringfatigue loading conditions have important effects in lifetimeassessment depending on the aggressiveness of the sur-rounding environment.Modeling the combined effect of corrosion and fatigue
remains still an open challenge. Bastidas-Arteaga et al.(2009) proposed a first probabilistic corrosion-fatigue modelfor RC structures subjected to chloride ingress; however, thismodel uses a simplified solution of Fick’s law to simulate thechloride ingress process that does not always representreality. On the other hand, experimental evidence indicatesthat the chloride ingress is highly influenced by the weatherconditions at the surrounding environment—i.e. temperatureand humidity. Since climate change studies predict severalchanges in the climate (IPCC 2013), the impact of globalwarming on chloride ingress, and therefore on structuralreliability, should be also considered in the assessment of thestructural behavior.Within this context, the main goal of this paper is to
improve the model proposed by Bastidas-Arteaga et al.(2009) to be able to consider the influence of realisticexposure conditions (including climate change) on failureprobability. To accomplish this objective, the proposedlifetime prediction approach includes a numerical solutionfor the transport governing equations in the assessment ofthe corrosion initiation time.The paper starts describing the deterioration model used to
combine the interaction between corrosion and fatigue (Sect. 2).Section 3 presents a stochastic weather model, including globalwarming. Section 4 describes the stochastic approach to theproblem, and Sect. 5 applies the proposed methodology to thereliability assessment of a bridge girder subjected to variousenvironmental and cyclic loading conditions.
2. Deterioration Model
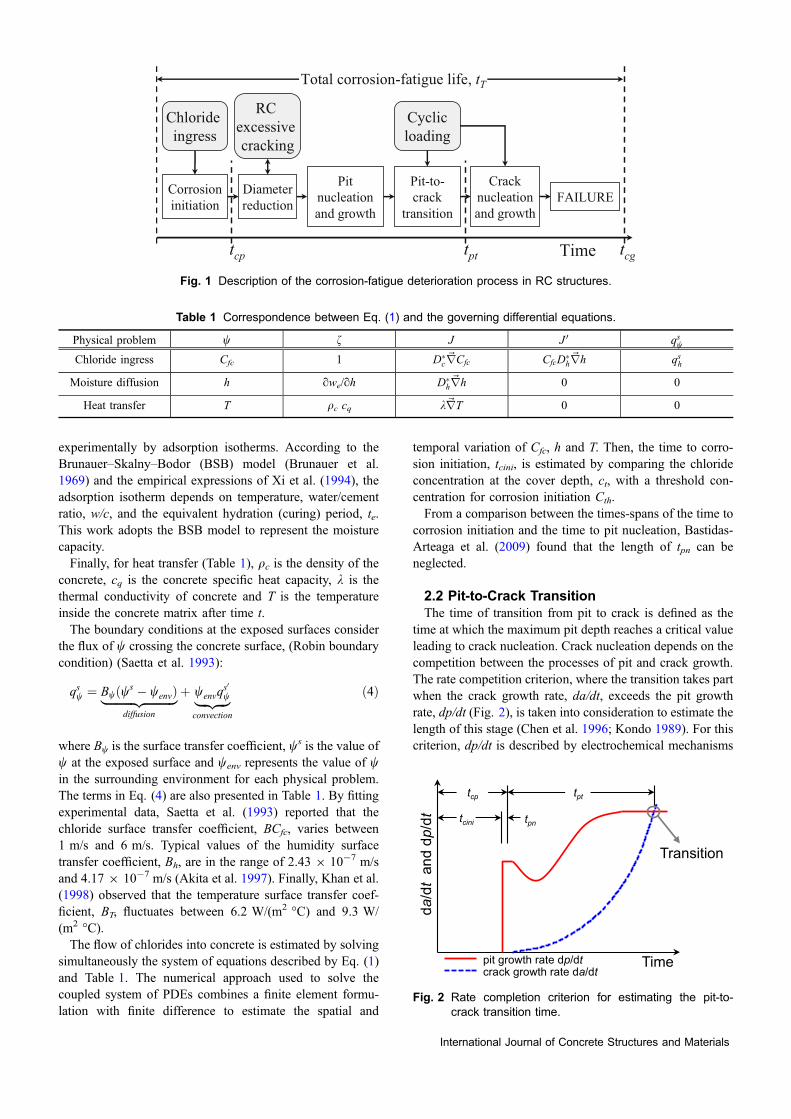
Assessment of corrosion-fatigue effects on RC structuresis a difficult task because several deterioration mechanismsinteract in the process. The corrosion-fatigue deteriorationprocess accounts for the interaction between three mecha-nisms: (i) chloride ingress, (ii) concrete cracking due tocorrosion propagation and (iii) cyclic loading (Fig. 1).Chloride ingress induces both corrosion initiation and pittingcorrosion leading to crack nucleation on the steel bar. Theaccumulation of corrosion products in the steel/concreteinterface generates concrete cracking, which plays animportant role in the steel corrosion rate when excessiveconcrete cracking is reached. Cyclic loading takes part in the
process during the stages of pit-to-crack transition and crackgrowth. Based on the previous considerations, the corrosion-fatigue process is divided into three stages: (i) corrosioninitiation and pit nucleation, tcp; (ii) pit-to-crack transition,tpt; and (iii) crack growth, tcg.The proposed deterioration model does not account for the
loss of adhesion at the steel/concrete interface caused bycorrosion propagation as well as the effect of permanentcharges on the long-term mechanical behavior. Furthermodel developments will be necessary in the future tointegrate these aspects and improve lifetime assessment.
2.1 Corrosion Initiation and Pit NucleationThis stage is divided into two sub-stages: (i) time to cor-
rosion initiation, tcini, and (ii) time to pit nucleation, tpn. Thefirst sub-stage encompasses the time from the end of con-struction until corrosion begins. For the assessment of tcini,this section presents a formulation for chloride ingressmodeling that considers the interaction between threephysical problems: chloride ingress, moisture diffusion andheat transfer. Each phenomenon is represented by a partialdifferential equation (PDE) expressed in the following gen-eral form (Bastidas-Arteaga et al. 2011):
fowot
¼ divJ|ffl{zffl}
diffusion
þ divJ 0|ffl{zffl}
convection
ð1Þ
where w represents the studied parameter (chloride concen-tration, relative humidity content or temperature), t is thetime period and the correspondence between f, J, J0 and theterms for the physical problem is presented in Table 1.For chloride ingress, Cfc is the concentration of free
chlorides, h is the relative humidity and Dc* and Dh
* representthe apparent chloride and humidity diffusion coefficients,respectively:
D�c ¼
Dc;ref f1ðTÞf2ðtÞf3ðhÞ1þ ð1=weÞðoCbc=oCfcÞ
ð2Þ
D�h ¼
Dh;ref g1ðhÞg2ðTÞg3ðteÞ1þ ð1=weÞðoCbc=oCfcÞ
ð3Þ
where Dc,ref and Dh,ref are reference diffusion coefficientsmeasured to standard conditions (Saetta et al. 1993), we is theevaporable water content, and fi and gi are correction func-tions to account for the effects of temperature (T), relativehumidity, ageing and degree of hydration of concrete. Thesefunctions are detailed in (Bastidas-Arteaga et al. 2011). Theterm qCbc/qCfc represents the binding capacity of thecementitious system which relates the free and bound chlo-rides concentration at equilibrium. Cbc is the concentration ofbound chlorides, and we, and the pore relative humidity.For moisture diffusion, the humidity diffusion coefficient
Dh is estimated by accounting for the influence of theparameters presented in Eq. (3). The term qwe/qh (Table 1)represents the moisture capacity which relates h and we. Fora given temperature this relationship has been determined
International Journal of Concrete Structures and Materials
experimentally by adsorption isotherms. According to theBrunauer–Skalny–Bodor (BSB) model (Brunauer et al.1969) and the empirical expressions of Xi et al. (1994), theadsorption isotherm depends on temperature, water/cementratio, w/c, and the equivalent hydration (curing) period, te.This work adopts the BSB model to represent the moisturecapacity.Finally, for heat transfer (Table 1), qc is the density of the
concrete, cq is the concrete specific heat capacity, k is thethermal conductivity of concrete and T is the temperatureinside the concrete matrix after time t.The boundary conditions at the exposed surfaces consider
the flux of w crossing the concrete surface, (Robin boundarycondition) (Saetta et al. 1993):
qsw ¼ Bwðws � wenvÞ|fflfflfflfflfflfflfflfflfflffl{zfflfflfflfflfflfflfflfflfflffl}
diffusion
þ wenvqs0
w|fflfflffl{zfflfflffl}
convection
ð4Þ
where Bw is the surface transfer coefficient, ws is the value ofw at the exposed surface and wenv represents the value of win the surrounding environment for each physical problem.The terms in Eq. (4) are also presented in Table 1. By fittingexperimental data, Saetta et al. (1993) reported that thechloride surface transfer coefficient, BCfc, varies between1 m/s and 6 m/s. Typical values of the humidity surfacetransfer coefficient, Bh, are in the range of 2.43 9 10-7 m/sand 4.17 9 10-7 m/s (Akita et al. 1997). Finally, Khan et al.(1998) observed that the temperature surface transfer coef-ficient, BT, fluctuates between 6.2 W/(m2 �C) and 9.3 W/(m2 �C).The flow of chlorides into concrete is estimated by solving
simultaneously the system of equations described by Eq. (1)and Table 1. The numerical approach used to solve thecoupled system of PDEs combines a finite element formu-lation with finite difference to estimate the spatial and
temporal variation of Cfc, h and T. Then, the time to corro-sion initiation, tcini, is estimated by comparing the chlorideconcentration at the cover depth, ct, with a threshold con-centration for corrosion initiation Cth.From a comparison between the times-spans of the time to
corrosion initiation and the time to pit nucleation, Bastidas-Arteaga et al. (2009) found that the length of tpn can beneglected.
2.2 Pit-to-Crack TransitionThe time of transition from pit to crack is defined as the
time at which the maximum pit depth reaches a critical valueleading to crack nucleation. Crack nucleation depends on thecompetition between the processes of pit and crack growth.The rate competition criterion, where the transition takes partwhen the crack growth rate, da/dt, exceeds the pit growthrate, dp/dt (Fig. 2), is taken into consideration to estimate thelength of this stage (Chen et al. 1996; Kondo 1989). For thiscriterion, dp/dt is described by electrochemical mechanisms
Pit-to-crack
transitionFAILURECorrosion
initiation
Pit nucleation and growth
Crack nucleation and growth
Diameter reduction
tcp tpt tcg
Total corrosion-fatigue life, tT
Chloride ingress
RC excessive cracking
Cyclicloading
Time
Fig. 1 Description of the corrosion-fatigue deterioration process in RC structures.
Table 1 Correspondence between Eq. (1) and the governing differential equations.
Physical problem w f J J 0 qsw
Chloride ingress Cfc 1 D�cr~Cfc CfcD�
hr~h qsh
Moisture diffusion h qwe/qh D�hr~h 0 0
Heat transfer T qc cq kr~T 0 0
tpn
da/d
t an
d dp
/dt
Time crack growth rate da/dt pit growth rate dp/dt
tpttcp
tcini
Transition
Fig. 2 Rate completion criterion for estimating the pit-to-crack transition time.
International Journal of Concrete Structures and Materials
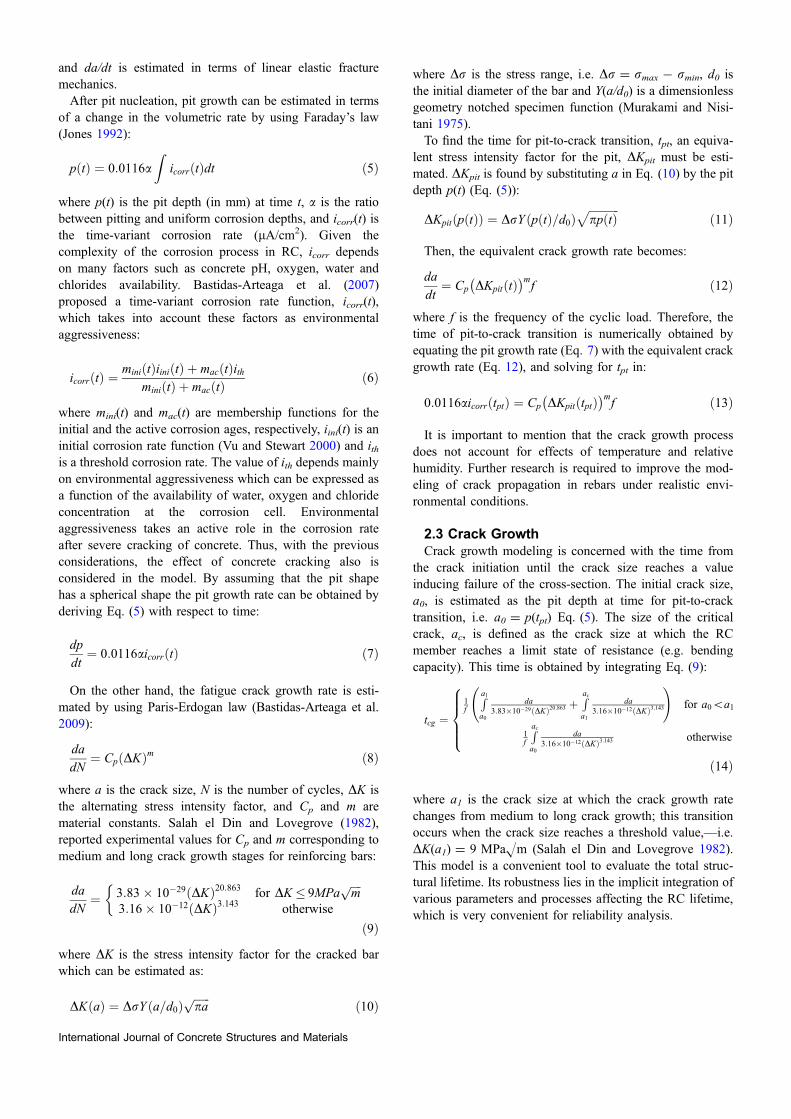
and da/dt is estimated in terms of linear elastic fracturemechanics.After pit nucleation, pit growth can be estimated in terms
of a change in the volumetric rate by using Faraday’s law(Jones 1992):
p tð Þ ¼ 0:0116aZ
icorr tð Þdt ð5Þ
where p(t) is the pit depth (in mm) at time t, a is the ratiobetween pitting and uniform corrosion depths, and icorr(t) isthe time-variant corrosion rate (lA/cm2). Given thecomplexity of the corrosion process in RC, icorr dependson many factors such as concrete pH, oxygen, water andchlorides availability. Bastidas-Arteaga et al. (2007)proposed a time-variant corrosion rate function, icorr(t),which takes into account these factors as environmentalaggressiveness:
icorr tð Þ ¼ miniðtÞiiniðtÞ þ macðtÞithminiðtÞ þ macðtÞ
ð6Þ
where mini(t) and mac(t) are membership functions for theinitial and the active corrosion ages, respectively, iini(t) is aninitial corrosion rate function (Vu and Stewart 2000) and ithis a threshold corrosion rate. The value of ith depends mainlyon environmental aggressiveness which can be expressed asa function of the availability of water, oxygen and chlorideconcentration at the corrosion cell. Environmentalaggressiveness takes an active role in the corrosion rateafter severe cracking of concrete. Thus, with the previousconsiderations, the effect of concrete cracking also isconsidered in the model. By assuming that the pit shapehas a spherical shape the pit growth rate can be obtained byderiving Eq. (5) with respect to time:
dp
dt¼ 0:0116aicorr tð Þ ð7Þ
On the other hand, the fatigue crack growth rate is esti-mated by using Paris-Erdogan law (Bastidas-Arteaga et al.2009):
da
dN¼ Cp DKð Þm ð8Þ
where a is the crack size, N is the number of cycles, DK isthe alternating stress intensity factor, and Cp and m arematerial constants. Salah el Din and Lovegrove (1982),reported experimental values for Cp and m corresponding tomedium and long crack growth stages for reinforcing bars:
da
dN¼ 3:83� 10�29 DKð Þ20:863 for DK � 9MPa
ffiffiffiffi
mp
3:16� 10�12 DKð Þ3:143 otherwise
�
ð9Þ
where DK is the stress intensity factor for the cracked barwhich can be estimated as:
DK að Þ ¼ DrY a=d0ð Þffiffiffiffiffiffi
pap
ð10Þ
where Dr is the stress range, i.e. Dr = rmax - rmin, d0 isthe initial diameter of the bar and Y(a/d0) is a dimensionlessgeometry notched specimen function (Murakami and Nisi-tani 1975).To find the time for pit-to-crack transition, tpt, an equiva-
lent stress intensity factor for the pit, DKpit must be esti-mated. DKpit is found by substituting a in Eq. (10) by the pitdepth p(t) (Eq. (5)):
DKpit p tð Þð Þ ¼ DrY p tð Þ=d0ð Þffiffiffiffiffiffiffiffiffiffiffi
pp tð Þp
ð11Þ
Then, the equivalent crack growth rate becomes:
da
dt¼ Cp DKpit tð Þ
� �mf ð12Þ
where f is the frequency of the cyclic load. Therefore, thetime of pit-to-crack transition is numerically obtained byequating the pit growth rate (Eq. 7) with the equivalent crackgrowth rate (Eq. 12), and solving for tpt in:
0:0116aicorrðtptÞ ¼ Cp DKpitðtptÞ� �m
f ð13Þ
It is important to mention that the crack growth processdoes not account for effects of temperature and relativehumidity. Further research is required to improve the mod-eling of crack propagation in rebars under realistic envi-ronmental conditions.
2.3 Crack GrowthCrack growth modeling is concerned with the time from
the crack initiation until the crack size reaches a valueinducing failure of the cross-section. The initial crack size,a0, is estimated as the pit depth at time for pit-to-cracktransition, i.e. a0 = p(tpt) Eq. (5). The size of the criticalcrack, ac, is defined as the crack size at which the RCmember reaches a limit state of resistance (e.g. bendingcapacity). This time is obtained by integrating Eq. (9):
tcg ¼1f
Ra1
a0
da3:83�10�29 DKð Þ20:863 þ
Rac
a1
da3:16�10�12 DKð Þ3:143
!
for a0\a1
1f
Rac
a0
da3:16�10�12 DKð Þ3:143 otherwise
8
>>><
>>>:
ð14Þ
where a1 is the crack size at which the crack growth ratechanges from medium to long crack growth; this transitionoccurs when the crack size reaches a threshold value,—i.e.DK(a1) = 9 MPaHm (Salah el Din and Lovegrove 1982).This model is a convenient tool to evaluate the total struc-tural lifetime. Its robustness lies in the implicit integration ofvarious parameters and processes affecting the RC lifetime,which is very convenient for reliability analysis.
International Journal of Concrete Structures and Materials
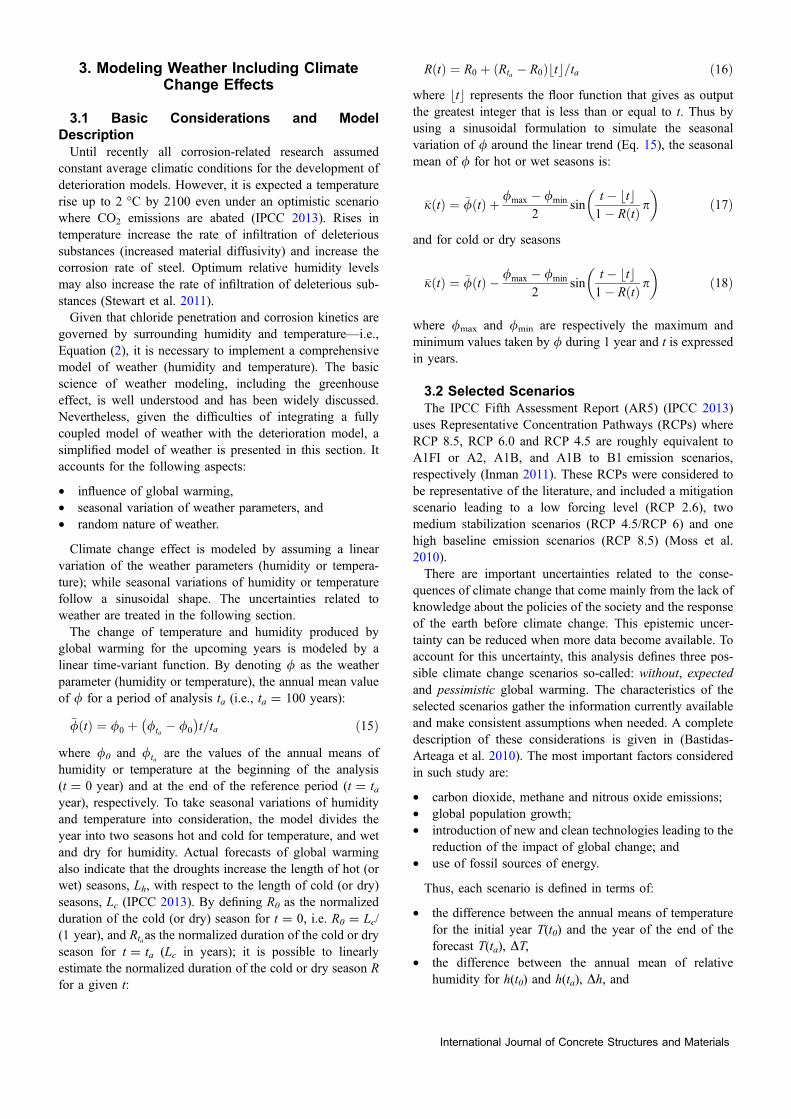
3. Modeling Weather Including ClimateChange Effects
3.1 Basic Considerations and ModelDescriptionUntil recently all corrosion-related research assumed
constant average climatic conditions for the development ofdeterioration models. However, it is expected a temperaturerise up to 2 �C by 2100 even under an optimistic scenariowhere CO2 emissions are abated (IPCC 2013). Rises intemperature increase the rate of infiltration of deleterioussubstances (increased material diffusivity) and increase thecorrosion rate of steel. Optimum relative humidity levelsmay also increase the rate of infiltration of deleterious sub-stances (Stewart et al. 2011).Given that chloride penetration and corrosion kinetics are
governed by surrounding humidity and temperature—i.e.,Equation (2), it is necessary to implement a comprehensivemodel of weather (humidity and temperature). The basicscience of weather modeling, including the greenhouseeffect, is well understood and has been widely discussed.Nevertheless, given the difficulties of integrating a fullycoupled model of weather with the deterioration model, asimplified model of weather is presented in this section. Itaccounts for the following aspects:
• influence of global warming,• seasonal variation of weather parameters, and• random nature of weather.
Climate change effect is modeled by assuming a linearvariation of the weather parameters (humidity or tempera-ture); while seasonal variations of humidity or temperaturefollow a sinusoidal shape. The uncertainties related toweather are treated in the following section.The change of temperature and humidity produced by
global warming for the upcoming years is modeled by alinear time-variant function. By denoting / as the weatherparameter (humidity or temperature), the annual mean valueof / for a period of analysis ta (i.e., ta = 100 years):
�/ðtÞ ¼ /0 þ /ta � /0
� �
t=ta ð15Þ
where /0 and /ta are the values of the annual means ofhumidity or temperature at the beginning of the analysis(t = 0 year) and at the end of the reference period (t = tayear), respectively. To take seasonal variations of humidityand temperature into consideration, the model divides theyear into two seasons hot and cold for temperature, and wetand dry for humidity. Actual forecasts of global warmingalso indicate that the droughts increase the length of hot (orwet) seasons, Lh, with respect to the length of cold (or dry)seasons, Lc (IPCC 2013). By defining R0 as the normalizedduration of the cold (or dry) season for t = 0, i.e. R0 = Lc/(1 year), and Rtaas the normalized duration of the cold or dryseason for t = ta (Lc in years); it is possible to linearlyestimate the normalized duration of the cold or dry season Rfor a given t:
RðtÞ ¼ R0 þ Rta � R0ð Þ tb c=ta ð16Þ
where tb c represents the floor function that gives as outputthe greatest integer that is less than or equal to t. Thus byusing a sinusoidal formulation to simulate the seasonalvariation of / around the linear trend (Eq. 15), the seasonalmean of / for hot or wet seasons is:
�jðtÞ ¼ �/ðtÞ þ /max � /min
2sin
t � tb c1� RðtÞ p� �
ð17Þ
and for cold or dry seasons
�jðtÞ ¼ �/ðtÞ � /max � /min
2sin
t � tb c1� RðtÞ p� �
ð18Þ
where /max and /min are respectively the maximum andminimum values taken by / during 1 year and t is expressedin years.
3.2 Selected ScenariosThe IPCC Fifth Assessment Report (AR5) (IPCC 2013)
uses Representative Concentration Pathways (RCPs) whereRCP 8.5, RCP 6.0 and RCP 4.5 are roughly equivalent toA1FI or A2, A1B, and A1B to B1 emission scenarios,respectively (Inman 2011). These RCPs were considered tobe representative of the literature, and included a mitigationscenario leading to a low forcing level (RCP 2.6), twomedium stabilization scenarios (RCP 4.5/RCP 6) and onehigh baseline emission scenarios (RCP 8.5) (Moss et al.2010).There are important uncertainties related to the conse-
quences of climate change that come mainly from the lack ofknowledge about the policies of the society and the responseof the earth before climate change. This epistemic uncer-tainty can be reduced when more data become available. Toaccount for this uncertainty, this analysis defines three pos-sible climate change scenarios so-called: without, expectedand pessimistic global warming. The characteristics of theselected scenarios gather the information currently availableand make consistent assumptions when needed. A completedescription of these considerations is given in (Bastidas-Arteaga et al. 2010). The most important factors consideredin such study are:
• carbon dioxide, methane and nitrous oxide emissions;• global population growth;• introduction of new and clean technologies leading to the
reduction of the impact of global change; and• use of fossil sources of energy.
Thus, each scenario is defined in terms of:
• the difference between the annual means of temperaturefor the initial year T(t0) and the year of the end of theforecast T(ta), DT,
• the difference between the annual mean of relativehumidity for h(t0) and h(ta), Dh, and
International Journal of Concrete Structures and Materials

• the difference between the normalized durations of coldseasons for R(t0) and R(ta), DR.
By taking as reference a period of analysis of 100 years—i.e., ta = 100 yr, Table 2 provides the features and the val-ues of DT, Dh and DR for each scenario. It is important tomention that the values presented in Table 2 are not down-scaled from global circulation models for a specific locationbut they roughly correspond to expected values for middleand equatorial latitudes for AR5 scenarios. They will be usedin the numerical example (Sect. 5) for illustrative purposes.Although in general terms the presented model simulates
the effect of seasonal variations and climate on temperatureand humidity, it is important to stress that predicted valuesonly represent an overall behavior which does not includethe randomness of the phenomena. The following sectionaddresses this and other random aspects.
4. Probabilistic Approach
4.1 Modeling Weather UncertaintiesTo improve the predictability of the assessments, it is
important to implement a weather model that reproducesrealistically the temperature and the humidity during theperiod of analysis. Within this context, stochastic processmodels were used to represent the random nature of theweather parameters. Taking into account the simplicity of theimplementation and the computational time, Karhunen-Loeve expansion is appropriate to represent the weathervariables. Let j(t, h) be a random process, which is functionof time t and defined over the domain D with h belonging tothe space of random events X; j(t, h) can thus be expandedas follows (Ghanem and Spanos 1991):
jðt; hÞ ’ �jðtÞ þXnKL
i¼1
ffiffiffiffi
kip
niðhÞfiðtÞ ð19Þ
where �j is the mean of the process (Eqs. 17 and 18), ni(h) isa set of normal random variables, nKL is the number of termsof the truncated discretization, fi(t) are a complete set ofdeterministic orthogonal functions and ki are the eigenvaluesof the covariance function C(t1,t2):
Cðt1; t2Þ ¼ e� t1�t2j j=b ð20Þ
where b is the correlation length, which must be expressed inthe same units as t. Since closed-form solutions for fi(t) andki are obtained for an exponential covariance (Ghanem andSpanos 1991), this paper assumes that the processes oftemperature and humidity follow this kind of covariance.
4.2 Probability of FailureThe integration of the deterioration model presented pre-
viously into a suitable probabilistic framework is necessaryto perform efficient probabilistic lifetime assessments andreliability analysis. The cumulative distribution function(CDF) of the total lifetime, FtT ðtÞ, is:
FtT tð Þ ¼ Pr tT � tf g ¼Z
tcpþtptþtcg � tf xð Þdx ð21Þ
where x is the vector of random variables to be taken intoaccount and f(x) is the joint probability density function of x.Defining failure in terms of the crack size, the limit statefunction becomes:
g x; tð Þ ¼ ac xð Þ � at x; tð Þ ð22Þ
where at(x, t) is the crack or pit size at time t and ac(x) is thecritical crack or pit size that generates structural failure. Theterms ac(x) and at(x, t) also include the pit size because pitgrowth also induces structural failure when the pit growthrate is higher than the crack growth rate. In this work, ac(x)is treated as a random variable resulting from the evaluationof other limit state of member resistance, gr(•). For instance,for the limit state of bending, gr(•) becomes:
gr As;P; xð Þ ¼ Mf As; xð Þ �Me P; xð Þ ð23Þ
where As is the cross-sectional area of reinforcement, P is theapplied load, x is the vector of random variables (i.e.concrete compressive strength, yield stress, etc.), Mf (As, x)is the bending moment capacity and Me (P, x) is the bendingmoment due to the load P. Failure is reached in Eq. (23)when As is equal to a critical value Asc. By taking intoconsideration that Asc can be expressed as a function of thecritical crack or pit size, ac is computed by solving:
Table 2 Climate change scenarios.
Scenario DT (�C) Dh DR
Without climate change is neglected 0 0 0
Expected Use of alternative and fossil sources of energy,birthrates follow the current patterns and there is no extensive
employ of clean technologies (equivalent to scenariosRCP2.6–RCP4.5 depending on the location)
2.5 0.05 - 0.1
Pessimistic Vast utilization of fossil sources of energy,appreciable growth of population and there are no policies todevelop and extend the use of clean technologies (equivalent
to scenarios RCP6–RCP8.5 depending on the location)
6.5 0.1 0.2
International Journal of Concrete Structures and Materials
Mf Asc acð Þ; xð Þ ¼ Me P; xð Þ ð24Þ
Note that, although ac(x) does not depend on both thecorrosion process and the frequency of the cyclic load, thetime to reach ac(x), tT, depends on both environmentalaggressiveness and the frequency of the cyclic load (Basti-das-Arteaga et al. 2009). For the limit state functionexpressed by Eq. (22) the failure probability, pf, can beestimated as:
pf ¼Z
gðx;tÞ� 0f ðxÞdx ð25Þ
Closed-form solutions for both the CDF of the total cor-rosion-fatigue lifetime and the failure probability are verydifficult to obtain. Therefore, Monte Carlo simulations andLatin hypercube sampling are used herein to deal with thisproblem.
5. Numerical Example
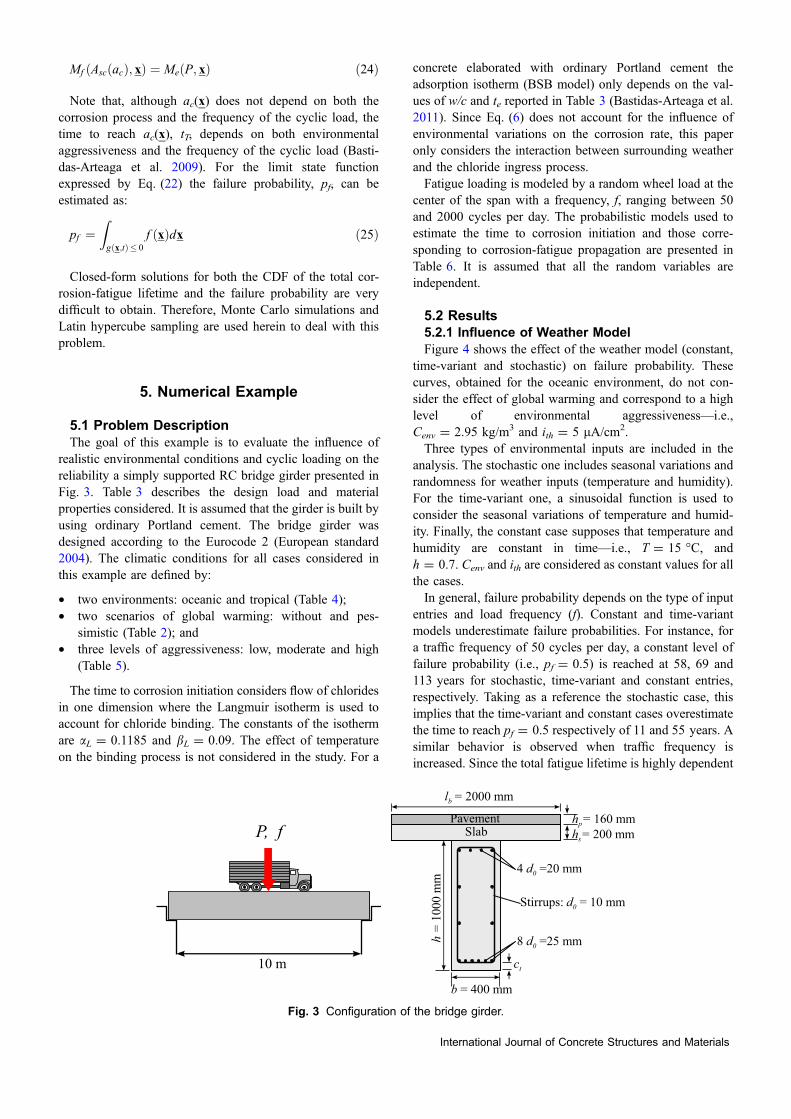
5.1 Problem DescriptionThe goal of this example is to evaluate the influence of
realistic environmental conditions and cyclic loading on thereliability a simply supported RC bridge girder presented inFig. 3. Table 3 describes the design load and materialproperties considered. It is assumed that the girder is built byusing ordinary Portland cement. The bridge girder wasdesigned according to the Eurocode 2 (European standard2004). The climatic conditions for all cases considered inthis example are defined by:
• two environments: oceanic and tropical (Table 4);• two scenarios of global warming: without and pes-
simistic (Table 2); and• three levels of aggressiveness: low, moderate and high
(Table 5).
The time to corrosion initiation considers flow of chloridesin one dimension where the Langmuir isotherm is used toaccount for chloride binding. The constants of the isothermare aL = 0.1185 and bL = 0.09. The effect of temperatureon the binding process is not considered in the study. For a
concrete elaborated with ordinary Portland cement theadsorption isotherm (BSB model) only depends on the val-ues of w/c and te reported in Table 3 (Bastidas-Arteaga et al.2011). Since Eq. (6) does not account for the influence ofenvironmental variations on the corrosion rate, this paperonly considers the interaction between surrounding weatherand the chloride ingress process.Fatigue loading is modeled by a random wheel load at the
center of the span with a frequency, f, ranging between 50and 2000 cycles per day. The probabilistic models used toestimate the time to corrosion initiation and those corre-sponding to corrosion-fatigue propagation are presented inTable 6. It is assumed that all the random variables areindependent.
5.2 Results5.2.1 Influence of Weather ModelFigure 4 shows the effect of the weather model (constant,
time-variant and stochastic) on failure probability. Thesecurves, obtained for the oceanic environment, do not con-sider the effect of global warming and correspond to a highlevel of environmental aggressiveness—i.e.,Cenv = 2.95 kg/m3 and ith = 5 lA/cm2.Three types of environmental inputs are included in the
analysis. The stochastic one includes seasonal variations andrandomness for weather inputs (temperature and humidity).For the time-variant one, a sinusoidal function is used toconsider the seasonal variations of temperature and humid-ity. Finally, the constant case supposes that temperature andhumidity are constant in time—i.e., T = 15 �C, andh = 0.7. Cenv and ith are considered as constant values for allthe cases.In general, failure probability depends on the type of input
entries and load frequency (f). Constant and time-variantmodels underestimate failure probabilities. For instance, fora traffic frequency of 50 cycles per day, a constant level offailure probability (i.e., pf = 0.5) is reached at 58, 69 and113 years for stochastic, time-variant and constant entries,respectively. Taking as a reference the stochastic case, thisimplies that the time-variant and constant cases overestimatethe time to reach pf = 0.5 respectively of 11 and 55 years. Asimilar behavior is observed when traffic frequency isincreased. Since the total fatigue lifetime is highly dependent
Fig. 3 Configuration of the bridge girder.
International Journal of Concrete Structures and Materials

on time to corrosion initiation, it is expected that the type ofinput entries becomes a paramount parameter in the assess-ment of failure probability (Bastidas-Arteaga et al. 2011).These results justify the use of a more representative chlo-ride ingress model including realistic environmental inputsfor improving lifetime assessment with respect to the find-ings presented in (Bastidas-Arteaga et al. 2009).
5.2.2 Failure Probabilities for Different Levelsof AggressivenessFigure 5 presents the failure probability of the beam for
the tropical environment and the three considered levels ofaggressiveness. The analysis included stochastic environ-mental entries and does not account for the action of climatechange.
Table 3 Design load and material constants.
Variable Value
Characteristic punctual design load, Pk 150 kN
Elastic modulus of steel, Est 200 GPa
Characteristic concrete compression strength, f’ck 30 MPa
Characteristic steel strength, fyk 500 MPa
Concrete Poisson ratio, mc 0.2
Water to cement ratio, w/c 0.5
Curing period, te 28 days
Table 4 Description of the studied environments.
Climate Latitude Tmin Tmax hmin hmax ba
Oceanic Middle 5 �C 25 �C 0.6 0.8 0.1 year
Tropical Equatorial 20 �C 30 �C 0.7 0.9 0.1 year
aThe values of b are the same for temperature and relative humidity.
Table 5 Aggressiveness levels.
Level Cenv (McGee 2000) ith (Geocisa and the Torroja Institute 2002)
Low 0.35 kg/m3 0.5 lA/cm2
Moderate 1.15 kg/m3 2.0 lA/cm2
High 2.95 kg/m3 5.0 lA/cm2
Table 6 Probabilistic models of the random variables (Bastidas-Arteaga et al. 2011).
Variable Units Distribution Mean COV
Dc,ref m2/s Log-normal 3 9 10-11 0.20
Cth wt % cem. Normala 0.5 0.20
ct mm Normalb 50 0.25
Dh,ref m2/s Log-normal 3 9 10-10 0.20
k W/(m �C) Beta on (1.4; 3.6) 2.5 0.20
cq J/(kg �C) Beta on (840; 1170) 1000 0.10
qc kg/m3 Normala 2400 0.05
P kN Log-normal 115 0.20
f’c MPa Normala 40 0.15
fy MPa Normala 600 0.10
aTruncated at 0.bTruncated at 10 mm.
International Journal of Concrete Structures and Materials
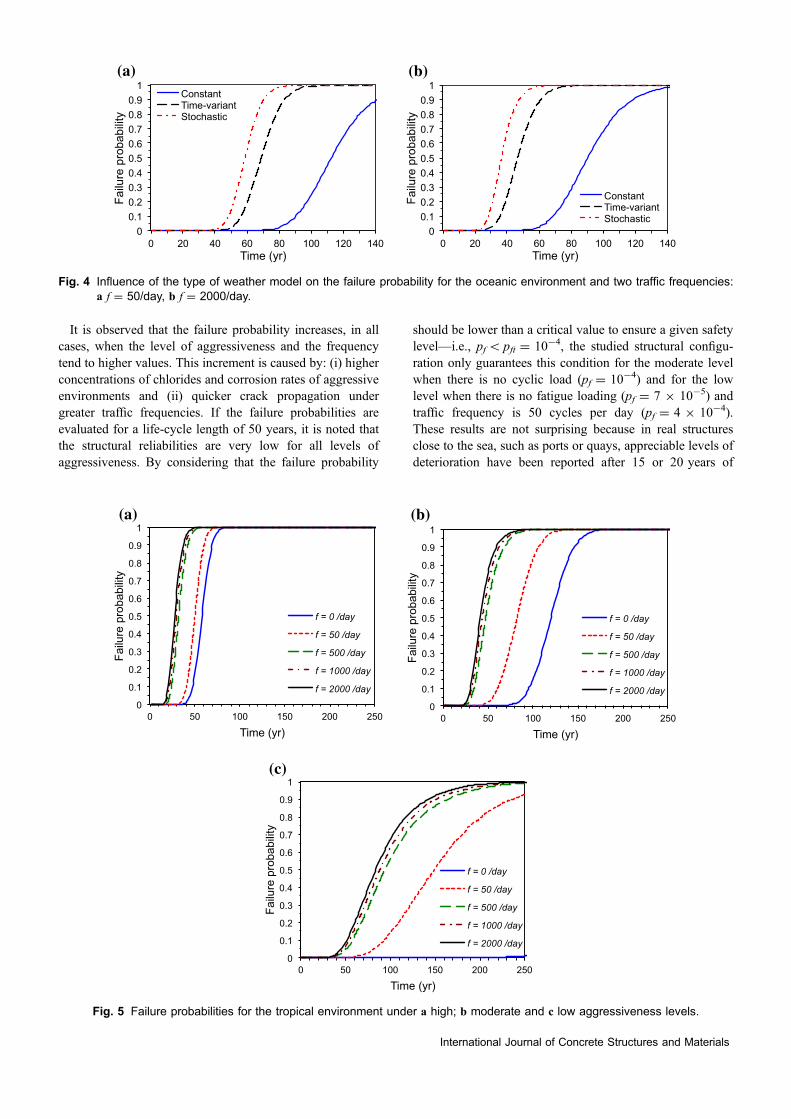
It is observed that the failure probability increases, in allcases, when the level of aggressiveness and the frequencytend to higher values. This increment is caused by: (i) higherconcentrations of chlorides and corrosion rates of aggressiveenvironments and (ii) quicker crack propagation undergreater traffic frequencies. If the failure probabilities areevaluated for a life-cycle length of 50 years, it is noted thatthe structural reliabilities are very low for all levels ofaggressiveness. By considering that the failure probability
should be lower than a critical value to ensure a given safetylevel—i.e., pf\ pft = 10-4, the studied structural configu-ration only guarantees this condition for the moderate levelwhen there is no cyclic load (pf = 10-4) and for the lowlevel when there is no fatigue loading (pf = 7 9 10-5) andtraffic frequency is 50 cycles per day (pf = 4 9 10-4).These results are not surprising because in real structuresclose to the sea, such as ports or quays, appreciable levels ofdeterioration have been reported after 15 or 20 years of
0 0.1 0.2 0.3 0.4 0.5 0.6 0.7 0.8 0.9
1
0 20 40 60 80 100 120 140
Failu
re p
roba
bilit
y
Time (yr)
Constant Time-variant Stochastic
0 0.1 0.2 0.3 0.4 0.5 0.6 0.7 0.8 0.9
1
0 20 40 60 80 100 120 140
Failu
re p
roba
bilit
y
Time (yr)
Constant Time-variant Stochastic
(a) (b)
Fig. 4 Influence of the type of weather model on the failure probability for the oceanic environment and two traffic frequencies:a f = 50/day, b f = 2000/day.
0
0.1
0.2
0.3
0.4
0.5
0.6
0.7
0.8
0.9
1
0 50 100 150 200 250
Failu
re p
roba
bilit
y
Time (yr)
f = 0 /day
f = 50 /day
f = 500 /day
f = 1000 /day
f = 2000 /day
0
0.1
0.2
0.3
0.4
0.5
0.6
0.7
0.8
0.9
1
0 50 100 150 200 250
Failu
re p
roba
bilit
y
Time (yr)
f = 0 /day
f = 50 /day
f = 500 /day
f = 1000 /day
f = 2000 /day
0
0.1
0.2
0.3
0.4
0.5
0.6
0.7
0.8
0.9
1
0 50 100 150 200 250
Failu
re p
roba
bilit
y
Time (yr)
f = 0 /day
f = 50 /day
f = 500 /day
f = 1000 /day
f = 2000 /day
(a) (b)
(c)
Fig. 5 Failure probabilities for the tropical environment under a high; b moderate and c low aggressiveness levels.
International Journal of Concrete Structures and Materials
exposure. The behavior for the oceanic environment issimilar, but the failure probabilities are lower for all expo-sures and frequencies. This behavior indicates that asophisticated model of chloride ingress calibrated withexperimental observations and monitored with inspectionsshould be included in the management of RC bridges toassure appropriate levels of safety during their lifecycle.
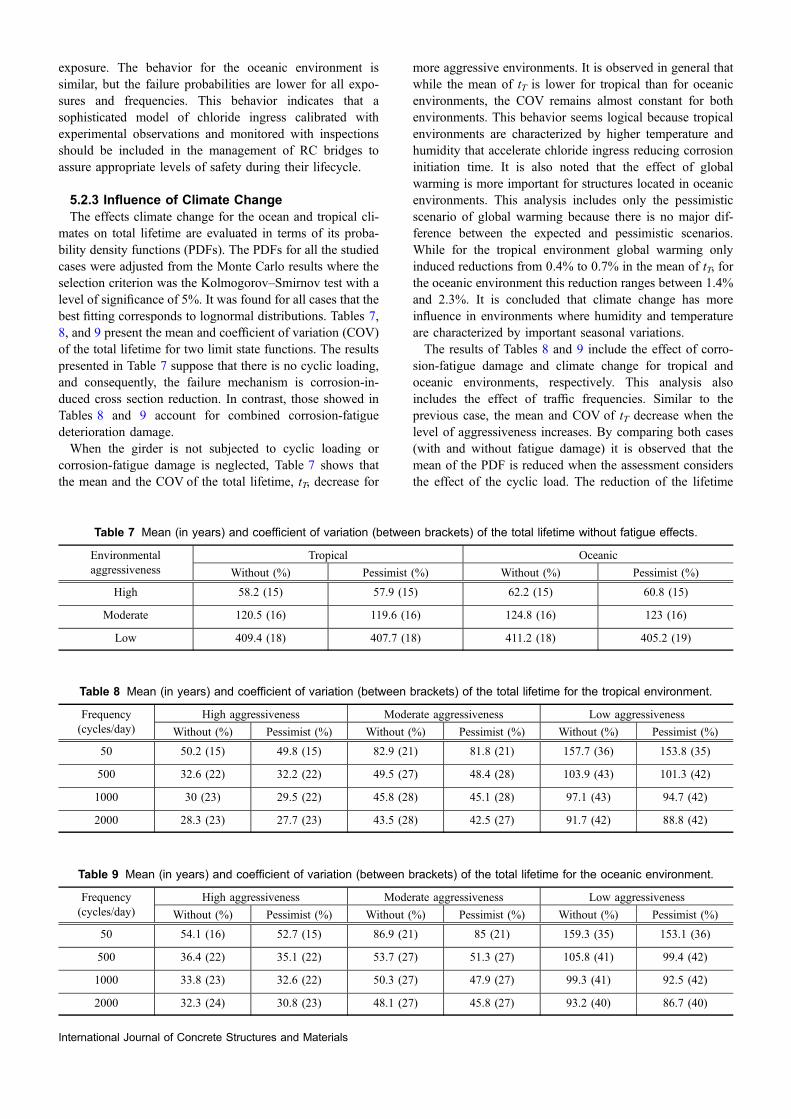
5.2.3 Influence of Climate ChangeThe effects climate change for the ocean and tropical cli-
mates on total lifetime are evaluated in terms of its proba-bility density functions (PDFs). The PDFs for all the studiedcases were adjusted from the Monte Carlo results where theselection criterion was the Kolmogorov–Smirnov test with alevel of significance of 5%. It was found for all cases that thebest fitting corresponds to lognormal distributions. Tables 7,8, and 9 present the mean and coefficient of variation (COV)of the total lifetime for two limit state functions. The resultspresented in Table 7 suppose that there is no cyclic loading,and consequently, the failure mechanism is corrosion-in-duced cross section reduction. In contrast, those showed inTables 8 and 9 account for combined corrosion-fatiguedeterioration damage.When the girder is not subjected to cyclic loading or
corrosion-fatigue damage is neglected, Table 7 shows thatthe mean and the COV of the total lifetime, tT, decrease for
more aggressive environments. It is observed in general thatwhile the mean of tT is lower for tropical than for oceanicenvironments, the COV remains almost constant for bothenvironments. This behavior seems logical because tropicalenvironments are characterized by higher temperature andhumidity that accelerate chloride ingress reducing corrosioninitiation time. It is also noted that the effect of globalwarming is more important for structures located in oceanicenvironments. This analysis includes only the pessimisticscenario of global warming because there is no major dif-ference between the expected and pessimistic scenarios.While for the tropical environment global warming onlyinduced reductions from 0.4% to 0.7% in the mean of tT, forthe oceanic environment this reduction ranges between 1.4%and 2.3%. It is concluded that climate change has moreinfluence in environments where humidity and temperatureare characterized by important seasonal variations.The results of Tables 8 and 9 include the effect of corro-
sion-fatigue damage and climate change for tropical andoceanic environments, respectively. This analysis alsoincludes the effect of traffic frequencies. Similar to theprevious case, the mean and COV of tT decrease when thelevel of aggressiveness increases. By comparing both cases(with and without fatigue damage) it is observed that themean of the PDF is reduced when the assessment considersthe effect of the cyclic load. The reduction of the lifetime
Table 7 Mean (in years) and coefficient of variation (between brackets) of the total lifetime without fatigue effects.
Environmentalaggressiveness
Tropical Oceanic
Without (%) Pessimist (%) Without (%) Pessimist (%)
High 58.2 (15) 57.9 (15) 62.2 (15) 60.8 (15)
Moderate 120.5 (16) 119.6 (16) 124.8 (16) 123 (16)
Low 409.4 (18) 407.7 (18) 411.2 (18) 405.2 (19)
Table 8 Mean (in years) and coefficient of variation (between brackets) of the total lifetime for the tropical environment.
Frequency(cycles/day)
High aggressiveness Moderate aggressiveness Low aggressiveness
Without (%) Pessimist (%) Without (%) Pessimist (%) Without (%) Pessimist (%)
50 50.2 (15) 49.8 (15) 82.9 (21) 81.8 (21) 157.7 (36) 153.8 (35)
500 32.6 (22) 32.2 (22) 49.5 (27) 48.4 (28) 103.9 (43) 101.3 (42)
1000 30 (23) 29.5 (22) 45.8 (28) 45.1 (28) 97.1 (43) 94.7 (42)
2000 28.3 (23) 27.7 (23) 43.5 (28) 42.5 (27) 91.7 (42) 88.8 (42)
Table 9 Mean (in years) and coefficient of variation (between brackets) of the total lifetime for the oceanic environment.
Frequency(cycles/day)
High aggressiveness Moderate aggressiveness Low aggressiveness
Without (%) Pessimist (%) Without (%) Pessimist (%) Without (%) Pessimist (%)
50 54.1 (16) 52.7 (15) 86.9 (21) 85 (21) 159.3 (35) 153.1 (36)
500 36.4 (22) 35.1 (22) 53.7 (27) 51.3 (27) 105.8 (41) 99.4 (42)
1000 33.8 (23) 32.6 (22) 50.3 (27) 47.9 (27) 99.3 (41) 92.5 (42)
2000 32.3 (24) 30.8 (23) 48.1 (27) 45.8 (27) 93.2 (40) 86.7 (40)
International Journal of Concrete Structures and Materials
induced by cyclic load can be estimated by setting the casewithout fatigue damage as the reference one. For example,for a case without climate change, oceanic environment, lowaggressiveness, and f = 50 cycles/day, the mean of tT isreduced by 61%. For the same conditions but f = 2000cycles/day this value corresponds to 77%. These resultsjustify the consideration of combined damage mechanismsin lifetime assessment.Similar to the case without fatigue damage, the structures
located in oceanic environments are more susceptible to theeffects of global warming. The reduction of the mean of tTvaries between 0.8% and 2.5% for the tropical environmentand ranges between 2.6% and 3.9% for the oceanic envi-ronment when traffic frequency is f = 50 cycles/day. Theimpact of climate change increases for higher traffic fre-quency (f = 2000 cycles/day) where reductions from 2.1%to 3.2% were observed for the tropical environment andfrom 4.4% to 7% for the oceanic environment. High trafficfrequencies reduce the length of the stages of pit-to-cracktransition and crack propagation (Eqs. 13 and 14), andconsequently, the participation of the stage of time to cor-rosion initiation and pit nucleation becomes more important.For all cases and environments, it is observed that the
reduction induced by global warming is maximum 7% oftotal lifetime; however, it is important to clarify that theseresults are conservative because they do not include theeffect of global warming after corrosion initiation. Nowa-days, it is known that corrosion rate can be influenced bytemperature and humidity, and therefore should be affectedby climate change. Nevertheless, there is no a consensusabout a comprehensive corrosion model that considers thisinteraction in a comprehensive manner. Further research inthis area is required to improve the prediction after corrosioninitiation.
6. Conclusions
This paper presented a deterioration model that integratesthe effects of chloride-induced corrosion, climate change andcyclic loading for RC structures. The total corrosion-fatiguelife was divided into three stages: (i) corrosion initiation andpit nucleation, (ii) corrosion initiation and pit nucleation, and(iii) crack growth. Since some of these stages are sensitive toclimatic conditions, a simplified model of weather thatincludes global warming was also included. The wholedeterioration model was introduced into a stochastic frame-work to take the inherent uncertainties into account. Finally,a numerical example illustrated the consequences of thedeterioration process in the reliability of a RC bridge girder.It was found that for traffic frequencies between 500 and2000 cycles/day, the combined effect of corrosion and fati-gue leads to appreciable lifetime reductions. When no fati-gue damage is considered, the climate change effect onlyinduces lifetime reductions ranging between 1.4 and 2.3%.Under cyclic loading, total lifetime could be reduced up to7% by global warming action. These results highlight the
importance of including the combined effect of corrosionand fatigue for comprehensive lifetime assessment.
Open Access
This article is distributed under the terms of the CreativeCommons Attribution 4.0 International License (http://creativecommons.org/licenses/by/4.0/), which permits unrestricted use, distribution, and reproduction in any medium,provided you give appropriate credit to the original author(s)and the source, provide a link to the Creative Commonslicense, and indicate if changes were made.
References
Ahn, S. H., Lawrence, F. V., & Metzger, M. M. (1992). Cor-
rosion fatigue of an HSLA steel. Fatigue and Fracture of
Engineering Materials and Structures, 15, 625–642.
Ahn, W., & Reddy, D. V. (2001). Galvanostatic testing for the
durability of marine concrete under fatigue loading. Cement
and Concrete Research, 31, 343–349.
Akita, H., Fujiwara, T., & Ozaka, Y. (1997). A practical pro-
cedure for the analysis of moisture transfer within concrete
due to drying. Magazine of Concrete Research, 49(179),
129–137.
Al-Hammoud, R., Soudki, K., & Topper, T. H. (2011). Fatigue
flexural behavior of corroded reinforced concrete beams
repaired with CFRP sheets. Journal of Composites for
Construction, 15(1), 42–51. https://doi.org/10.1061/
(asce)cc.1943-5614.0000144.
Bastidas-Arteaga, E., Bressolette, P., Chateauneuf, A., & San-
chez-Silva, M. (2009). Probabilistic lifetime assessment of
RC structures under coupled corrosion-fatigue processes.
Structural Safety, 31(1), 84–96. https://doi.org/10.1016/j.
strusafe.2008.04.001.
Bastidas-Arteaga, E., Chateauneuf, A., Sanchez-Silva, M.,
Bressolette, P., & Schoefs, F. (2010). Influence of weather
and global warming in chloride ingress into concrete: A
stochastic approach. Structural Safety, 32(4), 238–249.
https://doi.org/10.1016/j.strusafe.2010.03.002.
Bastidas-Arteaga, E., Chateauneuf, A., Sanchez-Silva, M.,
Bressolette, P., & Schoefs, F. (2011). A comprehensive
probabilistic model of chloride ingress in unsaturated
concrete. Engineering Structures, 33(3), 720–730. https://
doi.org/10.1016/j.engstruct.2010.11.008.
Bastidas-Arteaga, E., Sanchez-Silva, M., & Chateauneuf, A.
(2007). Structural reliability of RC structures subject to
biodeterioration, corrosion and concrete cracking. In J.
Kanda, T. Takada, & H. Furuta (Eds.), 10th International
Conference on Applications of Statistics and Probability in
Civil Engineering (pp. 183–190). Tokyo.
Bastidas-Arteaga, E., & Schoefs, F. (2015). Sustainable main-
tenance and repair of RC coastal structures. Proceedings of
the Institution of Civil Engineers—Maritime Engineering,
168(4), 162–173. https://doi.org/10.1680/jmaen.14.00018.
International Journal of Concrete Structures and Materials

Bastidas-Arteaga, E., & Stewart, M. G. (2016). Economic
assessment of climate adaptation strategies for existing RC
structures subjected to chloride-induced corrosion. Struc-
ture and Infrastructure Engineering, 12(4), 432–449.
https://doi.org/10.1080/15732479.2015.1020499.
Bhide, S. (1999). Material Usage and Condition of Existing
Bridges in the {U.S.}. Skokie, Ill.
Brunauer, S., Skalny, J., & Bodor, E. (1969). Adsorption in
nonporous solids. Journal of Colloid Interface Science, 30,
546–552.
Chen, G. S., & Duquette, D. J. (1992). Corrosion fatigue of a
precipitation-hardened Al-Li-Zr alloy in a 0.5 M sodium
chloride solution. Metallurgical Transactions, 23,
1563–1572.
Chen, G. S., Wan, K. C., Gao, M., Wei, R. P., & Flournoy, T. H.
(1996). Transition from pitting to fatigue crack growth
modeling of corrosion fatigue crack nucleation in a
2024-T3. aluminum alloy. Materials Science and Engi-
neering A, 219, 126–132.
Clifton, J. R. (1993). Predicting the service life of concrete. ACI
Materials Journal, 90, 611–617.
ElSafty, A., Graeff, M. K., & Fallaha, S. (2014). Behavior of
laterally damaged prestressed concrete bridge girders
repaired with CFRP laminates under static and fatigue
loading. International Journal of Concrete Structures and
Materials, 8(1), 43–59. https://doi.org/10.1007/s40069-
013-0053-0.
European standard. (2004). Eurocode 1 and 2: Basis of design
and actions on structures and design of concrete structures
(AFNOR.).
Gangloff, R. P. (2005). Environmental cracking corrosion fati-
gue. In R. Baboian (Ed.), Corrosion tests and standards:
Application and interpretation (pp. 302–321). West Con-
shohocken: ASTM International.
Geocisa, & the Torroja Institute. (2002). Contecvet: A validated
users manual for assessing the residual service life of
concrete structures. Manual for assessing corrosion-af-
fected concrete structures. Annex C Calculation of a rep-
resentative corrosion rate. British Cement Association,
UK.
Ghanem, R. G., & Spanos, P. D. (1991). Stochastic Finite
Elements: A Spectral Approach. New York: Springer.
http://link.springer.com/content/pdf/10.1007/978-1-4612-
3094-6.pdf.
Imam, A., Anifowose, F., & Azad, A. K. (2015). Residual
strength of corroded reinforced concrete beams using an
adaptive model based on ANN. International Journal of
Concrete Structures and Materials, 9(2), 159–172. https://
doi.org/10.1007/s40069-015-0097-4.
Inman, M. (2011). Opening the future. Nature Climate Change,
1(1), 7–9. https://doi.org/10.1038/nclimate1058.
IPCC. (2013). T. F. Stocker, D. Qin, G.-K. Plattner, M. Tignor,
S. K. Allen, J. Boschung, et al. (eds.), Climate Change
2013: The Physical Science Basis. Contribution of Working
Group I to the Fifth Assessment Report of the Intergov-
ernmental Panel on Climate Change. Cambridge, United
Kingdom and New York, NY, USA: Cambridge University
Press.
Jones, D. A. (1992). Principles and prevention of corrosion.
New York: Macmillan Publishing Co.
Khan, A., Cook, W., & Mitchell, D. (1998). Thermal properties
and transient thermal analysis of structural members during
hydration. ACI Materials Journal, 95(3), 293–303.
Kim, H.-R., Choi, W.-C., Yoon, S.-C., & Noguchi, T. (2016).
Evaluation of bond properties of reinforced concrete with
corroded reinforcement by uniaxial tension testing. Inter-
national Journal of Concrete Structures and Materials,
10(S3), 43–52. https://doi.org/10.1007/s40069-016-0152-9.
Koch, G., Varney, J., Thompson, N., Moghissi, O., Gould, M.,
& Payer, J. (2016). International measures of prevention,
application, and economics of corrosion technologies study
(p. 77084). Houston, TX: NACE International IMPACT
Report.
Kondo, Y. (1989). Prediction of fatigue crack initiation life
based on pit growth. Corrosion, 45, 7–11.
Marquez-Penaranda, J. F., Sanchez-Silva, M., Husserl, J., &
Bastidas-Arteaga, E. (2016). Effects of biodeterioration on
the mechanical properties of concrete. Materials and
Structures, 49(10), 4085–4099. https://doi.org/10.1617/
s11527-015-0774-4.
Masoud, S., Soudki, K., & Topper, T. (2005). Postrepair fatigue
performance of FRP-repaired corroded RC beams: Exper-
imental and analytical investigation. Journal of Composites
for Construction, 9(5), 441–449. https://doi.org/10.1061/
(asce)1090-0268(2005)9:5(441).
McGee, R. (2000). Modelling of durability performance of
Tasmanian bridges. In R. E. Melchers & M. G. Stewart
(Eds.), Applications of statistics and probability in civil
engineering (pp. 297–306). Rotterdam: Balkema.
Morga, M., & Marano, G. C. (2015). Chloride penetration in
circular concrete columns. International Journal of Con-
crete Structures and Materials, 9(2), 173–183. https://doi.
org/10.1007/s40069-014-0095-y.
Mori, Y., & Ellingwood, B. R. (1995). Reliability-based life
prediction of structures degrading due to environment and
repeated loading. In M. Lemaire, J. L. Favre, & A. Mebarki
(Eds.), Applications of statistics and probability: Civil
engineering reliability and risk analysis (pp. 971–976).
Paris: Balkema.
Moss, R. H. R. H., Edmonds, J. A. J. A., Hibbard, K. A. K. A.,
Manning, M. R., Rose, S. K. S. K., van Vuuren, D. P. D. P.,
et al. (2010). The next generation of scenarios for climate
change research and assessment. Nature, 463(7282),
747–756. https://doi.org/10.1038/nature08823.
Murakami, Y., & Nisitani, H. (1975). Stress intensity factor for
circumferentially cracked round bar in tension. Transac-
tions of the Japan Society of Mechanical Engineers, 41,
360–369.
Nguyen, P.-T., Bastidas-Arteaga, E., Amiri, O., & El Soueidy,
C.-P. (2017). An efficient chloride ingress model for long-
term lifetime assessment of reinforced concrete structures
under realistic climate and exposure conditions. Interna-
tional Journal of Concrete Structures and Materials, 11(2),
199–213. https://doi.org/10.1007/s40069-017-0185-8.
Pritzl, M. D., Tabatabai, H., & Ghorbanpoor, A. (2014). Lab-
oratory evaluation of select methods of corrosion
International Journal of Concrete Structures and Materials
prevention in reinforced concrete bridges. International
Journal of Concrete Structures and Materials, 8(3),
201–212. https://doi.org/10.1007/s40069-014-0074-3.
Radlinska, A., McCarthy, L. M., Matzke, J., & Nagel, F. (2014).
Synthesis of DOT use of beam end protection for extending
the life of bridges. International Journal of Concrete
Structures and Materials, 8(3), 185–199. https://doi.org/10.
1007/s40069-014-0077-0.
Rajasankar, J., & Iyer, N. R. (2006). A probability-based model
for growth of corrosion pits in aluminum alloys. Engi-
neering Fracture Mechanics, 73, 553–570.
Saetta, A., Scotta, R., & Vitaliani, R. (1993). Analysis of
chloride diffusion into partially saturated concrete. ACI
Materials Journal, 90(5), 441–451.
Salah el Din, A., & Lovegrove, J. M. (1982). Fatigue of cold
worked ribbed reinforcing bar—A fracture mechanics
approach. International Journal of Fatigue, 4, 15–26.
Sanchez-Silva, M., & Klutke, G.-A. (2016). Reliability and life-
cycle analysis of deteriorating systems. Cham: Springer
International Publishing. https://doi.org/10.1007/978-3-
319-20946-3.
Song, L., & Yu, Z. (2015). Fatigue flexural behaviour of cor-
roded RC beams strengthened with CFRP sheets. IJEMS
Vol. 22(1) [February 2015].
Stewart, M. G., Wang, X., & Nguyen, M. N. (2011). Climate
change impact and risks of concrete infrastructure deterio-
ration. Engineering Structures, 33(4), 1326–1337. https://
doi.org/10.1016/j.engstruct.2011.01.010.
Vu, K. A. T., & Stewart, M. G. (2000). Structural reliability of
concrete bridges including improved chloride-induced
corrosion. Structural Safety, 22, 313–333.
Wang, X. H., Bastidas-Arteaga, E., & Gao, Y. (2018). Proba-
bilistic analysis of chloride penetration in reinforced con-
crete subjected to pre-exposure static and fatigue loading
and wetting-drying cycles. Engineering Failure Analysis,
84, 205–219. https://doi.org/10.1016/j.engfailanal.2017.11.
008
Xi, Y., Bazant, Z., & Jennings, H. (1994). Moisture diffusion in
cementitious materials—Adsorption isotherms. Advanced
Cement Based Materials, 1(6), 248–257.
International Journal of Concrete Structures and Materials