Reliability Based Optimization within the CAD Environment · Reliability Based Optimization within...
16
Reliability Based Optimization within the CAD Environment Andreas Vlahinos Advanced Engineering Solutions, LLC Subhash Kelkar Ford Motor Company Stefan Reh, Robert SeCaur, Steve Pilz ANSYS Inc. Abstract Great advances have been achieved over the last two decades in the design process, yet in many industries, this process is still executed by deploying traditional methods. A new method that is flexible enough to accommodate potentially contradictory design requirements such as cost, performance, aesthetics, safety, life cycle, and environmental impacts is being sought by industry leaders seeking an advantage over technically less adept competitors. Simulation, modeling, safety and costing tools have improved dramatically in the past decade. What is missing is a workable synergy between these tools. Used separately, these individual tools require several manual iterations to attain the optimum design. An intelligent modeling process for integrating the Probabilistic Design System (PDS) of ANSYS and the Behavioral Modeling feature of Pro/Engineer to automatically create optimum robust designs will be presented. An example from the automotive industry will be used to demonstrate this new integration of these tools. In this example, the parametric Reliability Based Optimization (RBO) becomes a feature of the solid model. As changes are made in the solid model, the RBO is automatically run during model regeneration, and the design is verified. This process empowers design engineers to conveniently generate 6-sigma quality designs early in the development process using sophisticated tools previously utilized by technically advanced engineers only. Introduction The need for innovative tools is urgent now since engineers face increasingly complex design requirements such as cost, performance, safety, quality, time to market, life cycle, environmental impact, aesthetics and changes in business models. Robust Design is a methodology that addresses product quality issues early in the design cycle. The goal of Robust Design is to deliver customer expectations at affordable cost regardless of customer usage, degradation over product life and variation in manufacturing, suppliers, distribution, delivery and installation. Since randomness and scatter is a part of reality, probabilistic design techniques are necessary to engineer quality into designs. Traditional deterministic approaches compensate for uncertainties through the use of empirical safety factors which do not provide sufficient information to achieve optimal use of available resources. The probabilistic design process has not been widely used because it has been intimidating and tedious due to its complexity. Since 1999, ANSYS has introduced an integrated probabilistic system (ANSYS PDS) that makes the probabilistic analysis setup within ANSYS user-friendly. In the latest ANSYS version, a probabilistic analysis wizard has been introduced that makes the process even simpler. In Robust Design, Control parameters are defined as those factors which the designer can control, such as geometric design variables, material selection, design configurations and manufacturing process settings. Noise parameters on the other hand are factors that are beyond the control of the designer, such as material property variability, imperfections resulting from the manufacturing process, temperature, humidity, component degradation with time, etc. The probabilistic analysis setup within ANSYS is possible as long
Transcript of Reliability Based Optimization within the CAD Environment · Reliability Based Optimization within...

Reliability Based Optimization within the CAD Environment Andreas Vlahinos
Advanced Engineering Solutions, LLC Subhash Kelkar
Ford Motor Company Stefan Reh, Robert SeCaur, Steve Pilz
ANSYS Inc.
Abstract Great advances have been achieved over the last two decades in the design process, yet in many industries, this process is still executed by deploying traditional methods. A new method that is flexible enough to accommodate potentially contradictory design requirements such as cost, performance, aesthetics, safety, life cycle, and environmental impacts is being sought by industry leaders seeking an advantage over technically less adept competitors.
Simulation, modeling, safety and costing tools have improved dramatically in the past decade. What is missing is a workable synergy between these tools. Used separately, these individual tools require several manual iterations to attain the optimum design. An intelligent modeling process for integrating the Probabilistic Design System (PDS) of ANSYS and the Behavioral Modeling feature of Pro/Engineer to automatically create optimum robust designs will be presented. An example from the automotive industry will be used to demonstrate this new integration of these tools. In this example, the parametric Reliability Based Optimization (RBO) becomes a feature of the solid model. As changes are made in the solid model, the RBO is automatically run during model regeneration, and the design is verified. This process empowers design engineers to conveniently generate 6-sigma quality designs early in the development process using sophisticated tools previously utilized by technically advanced engineers only.
Introduction The need for innovative tools is urgent now since engineers face increasingly complex design requirements such as cost, performance, safety, quality, time to market, life cycle, environmental impact, aesthetics and changes in business models. Robust Design is a methodology that addresses product quality issues early in the design cycle. The goal of Robust Design is to deliver customer expectations at affordable cost regardless of customer usage, degradation over product life and variation in manufacturing, suppliers, distribution, delivery and installation. Since randomness and scatter is a part of reality, probabilistic design techniques are necessary to engineer quality into designs. Traditional deterministic approaches compensate for uncertainties through the use of empirical safety factors which do not provide sufficient information to achieve optimal use of available resources. The probabilistic design process has not been widely used because it has been intimidating and tedious due to its complexity. Since 1999, ANSYS has introduced an integrated probabilistic system (ANSYS PDS) that makes the probabilistic analysis setup within ANSYS user-friendly. In the latest ANSYS version, a probabilistic analysis wizard has been introduced that makes the process even simpler. In Robust Design, Control parameters are defined as those factors which the designer can control, such as geometric design variables, material selection, design configurations and manufacturing process settings. Noise parameters on the other hand are factors that are beyond the control of the designer, such as material property variability, imperfections resulting from the manufacturing process, temperature, humidity, component degradation with time, etc. The probabilistic analysis setup within ANSYS is possible as long

as one can define as ANSYS parameters all the Control design parameters. Usually, when the component geometry is complex, the solid model is generated in a CAD system and either the geometry is transferred to ANSYS or the component is meshed within the CAD system and the finite element model is transferred to ANSYS. This paper describes a technique to perform probabilistic analysis, reliability based optimization and robust optimization within the CAD environment using ANSYS PDS and Pro/Engineer Behavioral Modeling.
Procedure
Pro/Engineer and Behavioral Modeling Pro/Engineer is a powerful feature-based parametric solid modeler. Typical features within the solid models can be protrusions, holes, rounds, etc. Figure 1 shows the model tree and a typical list of features. Mechanica FEM-mode (formerly known as Pro-mesh) is an additional module of the Pro/Engineer family that enables the generation of finite element models within Pro/Engineer. The Mechanica FEM-mode can generate simulation features such as mid-plane extraction of thin structures, mesh controls, loads, boundary conditions, end and perimeter welds, etc. These simulation features are associated and stored with the appropriate part or assembly files. The Behavioral Modeling Extension of Pro/Engineer is an additional module that has the capability of generating analysis and optimization study features. Typical analysis features are measures of the model such as volume, moment of inertia, clearance, etc. An external analysis feature is also available. Both analysis and optimization study features appear in the model tree and are being regenerated as the model changes. The external analysis feature sends certain information to an external program, executes it, retrieves some predefined results from the output information and generates Pro/Engineer parameters. The "optimization study features" perform an optimization to find the value of the design variables that optimize the objective function and assign these design variables to the model.
Behavioral Modeling
Pro-Engineer
ANSYS PDS
Pro-Mesh
Solid Model Feature 1
Analysis Feature
Generate Parametersfrom Response
Variables
Solid Model Feature 2
Create FE Mesh,Loads and BC
Create ANSYS inputfiles
Establish RandomVariables and
Perform ProbabilisticAnalysis
Compute Mean &Standard Deviation ofResponse Variables
OptimizationFeature
Establish DesignVariables, Reliability
Constraints andPerform Optimizationto Compute OptimumResponse Variables
Optimization Loop
Figure 1 - Workflow for Reliability Based Optimization within Pro/Engineers using ANSYS PDS
Probabilistic Design System ANSYS Probabilistic Design System (PDS) provides an automated process to answer the following questions as described in the probabilistic design guide (Chapter 3, ANSYS Advanced Analysis Guides):
-If the input variables of a finite element model are subjected to scatter, how large is the scatter of the output parameters?
-How robust are the output parameters? (Here, output parameters can be any parameter that ANSYS can calculate. Examples are temperature, stress, strain, or deflection at a node, the maximum temperature, etc.)
-If the output is subjected to scatter due to the variation of the input variables, then what is the probability that a design criterion given for the output parameters is no longer met?
-How large is the probability that an unexpected and unwanted event takes place (what is the failure probability)?
-Which input variables contribute the most to the scatter of an output parameter and to the failure probability?

-What are the sensitivities of the output parameter with respect to the input variables?
Probabilistic design can be used to determine the effect of one or more variables on the outcome of the analysis. In addition to the probabilistic design techniques available, ANSYS offers a set of strategic tools that can be used to enhance the efficiency of the probabilistic design process. For example, one can graph the effects of one input variable versus an output parameter. And one can easily add more samples and additional analysis loops to refine one's analysis.
Automating Probabilistic Analysis for External Analysis Several ANSYS macros were written to automate the PDS process with a single executable command. Appendix A shows the listing of the PDS_CCD macro that runs a central composite design. First, the macro requests to run the loop file, at least once, to get the parameter values. The loop file runs the model generated by Pro/Engineer and defines the random input and output variables. After the variable definition, the PDS_CCD macro runs a central composite design analysis and post processes the results. The selected values of the output random variables are returned to Pro/Engineer.
A toolkit application was built using the toolkit methods available by Pro/Engineer. The application has been successfully tested for Pro/Engineer releases 2000i2 and 2001. This application may be linked to an external analysis using behavioral modeling in order to create an external analysis feature that may be added to Pro/Engineer models. Upon addition to the model, the user may specify the macro file that will be used as input to ANSYS. It is this macro file, or some other that may be called from it, that is responsible for requesting Pro/Engineer to enter the Pro/mesh module, to generate the mesh, apply all loads and boundary conditions and generate the finite element of the model. Using the finite element model file, the macro sets up and executes an ANSYS PDS analysis and creates a file (AnsysResults.out) that contains a set of variables, and their values. This set of probabilistic variables is then passed to Pro/Engineer, which generates a set of model parameters. Consequently one may generate an optimization feature that uses the probabilistic variables as constraints or objective functions to perform an optimization analysis of any Pro/Engineer design Variable.
The analysis feature, when regenerated, requests finite element mesh data from Pro/Engineer, passes that data to ANSYS, executes the steps defined by the previously identified macro and then passes the results in AnsysResults.out along to Pro/Engineer. Since a PDS analysis may be time consuming, it is important for the user to note that the External Analysis feature may be suppressed and unsuppressed, just like other feature. Suppressing the feature would reduce the regeneration time when analysis may not be desired. Figure 1 shows the workflow used for reliability-based optimization within Pro/Engineer using ANSYS PDS.
Formulations for Deterministic, Reliability and Robust Optimization The ever-increasing use of optimization tools in engineering designs can generate designs that are on the design constraint limits leaving very little room for tolerances in modeling uncertainties and manufacturing imperfections. Optimum designs developed without consideration of uncertainty could possibly lead to unreliable designs. In addition to the active constraint problems, optimum designs may be sensitive to design parameters such that small changes in the design variables may lead to a significant loss of performance. A possible formulation of deterministic optimization from automotive crashworthiness (with fictitious numbers) can be:
Minimize Weight
Subject to: B-Pillar Velocity ≤ 10 mm/s
Abdomen Load ≤ 1.0 KN
Rib Displacement ≤ 30 mm

Symphysis Load ≤ 5.0 KN
Thickness Design Variables:
timin ≤ ti ≤ ti
max
The Reliability Based Design Optimization (RBDO) methodologies not only provide improved designs but also a confidence range of the simulation based optimum designs.
Reliability Index Approach For a reliability based design, a performance function can be defined as G = R -S where R and S are statistically independent and normally distributed random variables of the resistance and load measurements of the structure. Typically, R can be the yield stress and S the maximum Von Mises stress. The G function is also called limit state function or failure function. The curve G = 0 divides the design space into two regions, the safe region when G > 0 and unsafe region when G < 0. Since we consider R and S to have variation, G will also exhibit variation. The ratio β of the mean value of the G function (µG)
and the standard deviation of the G function (σG) is defined as safety index or reliability index. If Φ is the cumulative distribution function and G has a normal distribution then:
β = -Φ(1-Reliability) = µG / σG
A possible formulation can be:
Maximize β
Subject to: Weight < Target-Weight
DVimin< DVi < DVi
max
Another formulation using the reliability index can be:
Minimize Weight
Subject to: β > Target β
DVimin< DVi < DVi
max
A typical target value β is 3, which corresponds to probability failure of 0.00135. However, it has been observed that Reliability Index Approach exhibits very slow convergence or even divergence for some problems.
Reliability Optimization Approach Significant research effort has been devoted to making reliability based structural design optimization practical [Ref 1,2,3]. Reliability based optimization requires two major steps. First, we need to identify the random variables and qualify the causes of variation. Typically the distribution type and the necessary values that describe the distribution function of the random variables (i.e. mean and standard deviation for a normal distribution) need to be found. Second we need to select the desired reliability level (i.e 90%) and reformulate the deterministic constraints as probabilistic constraints. For example a 90% reliability goal may be expressed as: the probability of failure Pf of the Abdomen Force to be greater than 1 KN must be less than 10%.
A possible formulation of reliability-based optimization with a reliability goal of 95% from automotive crashworthiness (with fictitious numbers) can be:

Minimize Weight
Subject to: P failure [ B-Pillar Velocity > 10 mm/s] ≤ 5%
P failure [ Abdomen Load > 1.0 KN ] ≤ 5%
P failure [ Rib Displacement > 30 mm ] ≤ 5%
P failure [ Symphysis Load > 5.0 KN ] ≤ 5%
Design Variables mean values of design parameters:
µtimin ≤ µti ≤ µti
max
Random Variables with Given Variation:
Thickness
Yield Stress
Barrier Height
Impact Position
The reliability based optimization approach accounts for variation and generates designs that meet a given level of reliability and usually move optimum solutions away from the constraints.
Robust Optimization Approach The robust design optimization approach not only shifts performance mean to the target value but also reduces the product’s performance variability, achieving Six-sigma level robustness on the key product performance characteristics with respect to the quantified variation. A possible formulation of a 3-sigma level robust design optimization approach from automotive crashworthiness (with fictitious numbers) can be:
Minimize Weight
Subject to: µ[ B-Pillar Velocity ] + 3 σ[ B-Pillar Velocity ] ≤ 10 mm/s
µ [ Abdomen Load ] + 3 σ [ Abdomen Load ] ≤ 1.0 KN
µ [ Rib Displacement ] + 3 σ [ Rib Displacement ] ≤ 30 mm
µ [ Symphysis Load] + 3 σ [Symphysis Load] ≤ 5.0 KN
Design Variables mean values or standard deviation of design parameters:
µtimin ≤ µti ≤ µti
max
σtimin ≤ σti ≤ σti
max
Random Variables with Given Variation:
Thickness
Yield Stress
Barrier Height
Impact Position

Reliability Optimization Example The current product development process is still CAD-centric and highly iterative. The success of this process requires skilled practitioners. The growth in capabilities and user interface of CAD systems with parametric features allows the rapid generation of design alternatives. Although with ANSYS connection products the evaluation of candidate designs has been simplified, the ideal environment would be to embed the prediction of product attributes within the CAD environment. This will allow a rigorous evaluation and comparison of design alternatives. Additionally, this process will capture the knowledge of the skilled practitioner into the CAD design allowing the reuse of product designs and systematic decision making.
With this vision in mind, the team of authors linked the Behavioral Modeling external analysis feature of Pro/Engineer with ANSYS PDS via the Pro/Engineer toolkit application described earlier.
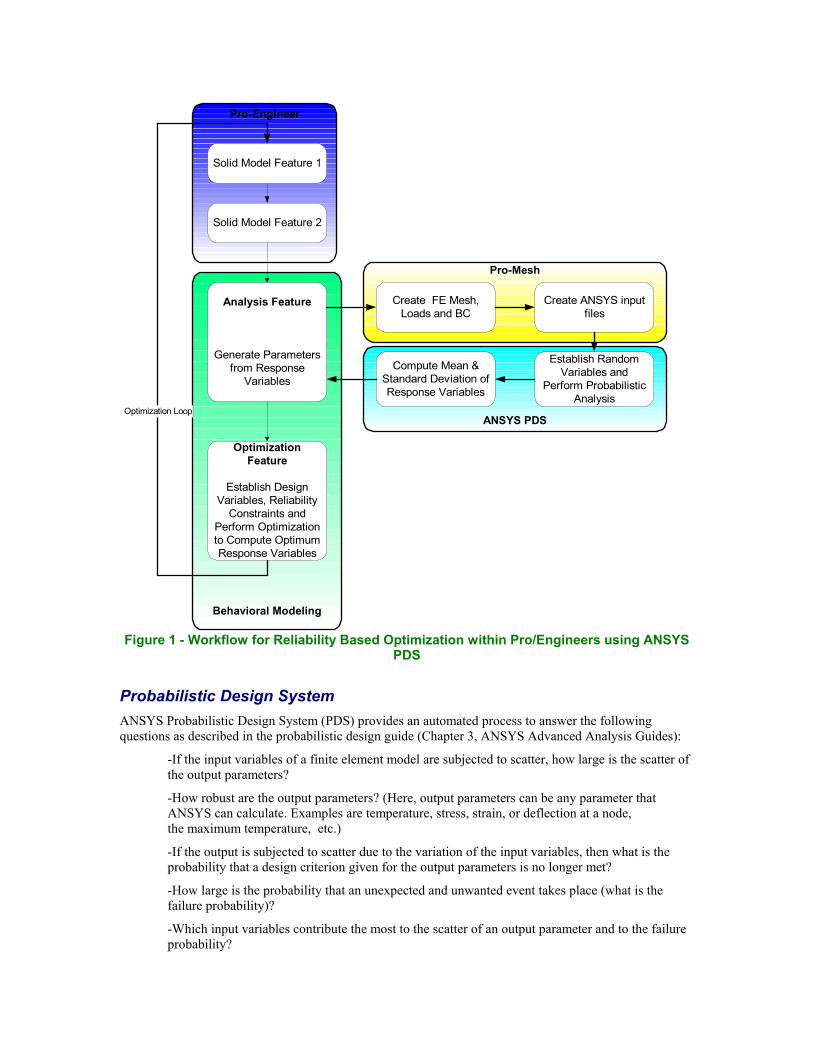
An example that demonstrates the process is presented. Although the example geometry is simple, the methodology is applicable to any geometry that one can build and mesh within Pro/Engineer. The power of this process lies in the fact that one can perform reliability-based optimization on virtually any Pro/Engineer design variable. Figure 2a shows the simple box beam used in the example. The following formulation of reliability-based optimization with reliability goal of 95% was used:
Minimize Weight
Subject to: P failure [ ω1LCL ≤ ω1 ≤ ω1UCL ] ≤ 5%
P failure [ ω2LCL ≤ ω2 ≤ ω2UCL ] ≤ 5%
Design Variables
Wmin ≤ W ≤ Wmax
Hmin ≤ H ≤ Hmax
Random Variables with Given Variation:
Thickness with standard deviation 3.0%
Modules of Elasticity with standard deviation 1.0%
Density with standard deviation 0.6%
Where
ω1LCL - ω1UCL is an interval, which the first natural frequency ω1 should avoid
ω2LCL - ω2UCL is an interval, which the second natural frequency ω2 should avoid
Wmin ,Wmax is the minimum and maximum values of the section width W
Hmin ,Hmax is the minimum and maximum values of the section height H
(a)
(b)
(c)
(d)
Figure 2 - Simulation Model, Mesh, Model tree and Optimization feature for Reliability Optimization
Figure 2 also shows the Pro/Engineer solid model with the boundary condition simulation feature. Figure 2b shows the finite element mesh generated within Pro/Engineer. This process can be used in assemblies in which end- and perimeter-welds can be used to constrain assembly components. Figure 2c shows the

model tree. The first four features correspond to the basic datum planes and the global coordinate system. The fifth feature corresponds to the protrusion used to build the beam. Next is an analysis feature that computes the weight. The next feature in the model tree is called ANSYS PDS and is the external analysis feature that calls the ANSYS PDS macro and returns with the probability of failure described earlier. The last feature corresponds to the optimization feature, which finds the width and height that minimize the weight and satisfies the reliability constraints. Figure 2d shows the dialog box of the optimization feature setup with the goal of minimizing the weight, design constraints (probability of a natural frequency to be in the interval < 5%) and design variables and their limits (W, H). The optimization feature can be easily substituted by a feasibility study (evaluate the existence of a solution) or by a sensitivity study that can determine (and plot) the effect of any Pro/Engineer design variable on the natural frequency or on the probability of failure.
Robust Optimization Example
Probabilistic Modeling Of Manufacturing Variations In this example, probabilistic modeling of manufacturing variations for a subassembly of the auto body assembly shown in Figure 3 is performed to determine the sensitivity and the response distribution (stress, stiffness, fatigue life) due to the scatter of the random variables. The scatter of the modulus of elasticity and the thickness and loading are defined in terms of probability distribution functions. Monte Carlo and response surface sampling techniques are implemented in determining the response distribution. Six sigma design criteria are established to size the component and compare this design to the one developed using the traditional nominal value criteria. For this example, the battery, the battery tray and the interface elements were selected. The tray is made from a composite material SMC and is supporting the battery as shown in Figure 4.
Figure 3 - Assembly Finite Element Model

Figure 4 - FE Model of the Battery and Tray Assembly
The battery is modeled with an elastic isotropic material of uniform density appropriately adjusted to produce the battery weight. The tray with a set of springs at appropriate locations supports the battery. The parametric model contains 2105 shell, 324 solid and 48 spring elements. It is assumed that the tray is rigidly fixed at the support locations. The input parameters of the FEA model can be any dimension, material property and loading. For this study, three parameters were considered: the wall thickness (t), the modulus of elasticity (E) and the vertical loading (q). We call these model parameters, and for any set of values of the three model parameters a solution of the FEA model can produce two model output variables: the maximum Von Mises stress (max σe) and the maximum equivalent strain (max εe).
Uncertainty in the input parameters of the FEA model can be introduced by assuming certain randomness in the input parameters. In this study, it was assumed that the thickness (t) and the modulus of elasticity (E) are characterized by a Gaussian distribution and that the vertical loading (q) is characterized by a lognormal distribution. These assumptions are based on historical data. The distribution parameters (mean values and standard deviations) can be specified to define a set of random values for the model parameters. The mean value of the thickness was considered as a controllable parameter and it was declared as an optimization design variable. The rest of the distribution parameters (mean values of E & q) and the standard deviation of t, E and q were considered uncontrollable or noise parameters. Figures 5, 6 and 7 show the probability distributions and the probability of the input variables, namely, thickness, modulus of elasticity and vertical loading. The ANSYS [Ref 5] Probabilistic Design System was used to generate the values from the distribution parameters. A set of 100 points from these distributions was used to perform FEA analysis on the tray. It was assumed that the thickness exhibits a Gaussian distribution with a mean value of 3.0 mm and a standard deviation of 0.3 mm. In the optimization model, the mean value of the thickness was an unknown design variable. It was also assumed that the modulus of elasticity exhibits a Gaussian distribution with a mean value of 5723 N/mm2 and a standard deviation of 570 N/mm2. The lognormal distribution with a mean of 58842 m/sec2 and standard deviation of 12000 m/sec2 was considered for the vertical loading.
Figures 8 and 9 show the histograms of the max equivalent strain and stress respectively. The mean (average) value of the max Von Mises stress is 40.95 N/mm2 and the standard deviation is 24.60 N/mm2. The mean (average) value of the max strain is 1.6345224e-002 and the standard deviation is 5.8322964e-003.

2 3 40
0 . 1
0 . 2
0 . 3
0 . 4
0 . 5
0 . 6
0 . 7
T h i c k n e s s ( m m )
Pro
babi
lity
Den
sity
P r o p a b i l i t y D e n s i t y o f T h i c k n e s s
1 2 3 4 50
0 . 1
0 . 2
0 . 3
0 . 4
0 . 5
0 . 6
0 . 7
0 . 8
0 . 9
1
T h i c k n e s s ( m m )
Prob
abili
ty
P r o p a b i l i t y o f T h i c k n e s s ( I n p u t V a r ia b le t )
Figure 5 - Probability Distribution of Thickness t (input variable)
3 0 0 0 4 0 0 0 5 0 0 0 6 0 0 0 7 0 0 0 8 0 0 00
0 . 5
1
1 . 5
2
2 . 5
3
3 . 5x 1 0
- 4
M o d u lu s o f E la s t i c i t y ( N / m m2 )
Pro
babi
lity
Den
sity
P r o p a b i l i t y D e n s i t y o f M o d u lu s o f E la s t i c i t y
2 0 0 0 4 0 0 0 6 0 0 0 8 0 0 0 1 0 0 0 00
0 . 1
0 . 2
0 . 3
0 . 4
0 . 5
0 . 6
0 . 7
0 . 8
0 . 9
1
M o d u lu s o f E la s t i c i t y ( N / m m 2 )
Prob
abili
ty
P r o p a b i l i t y o f I n p u t V a r i a b l e E
Figure 6 - Probability Distribution of Modulus of Elasticity E (input variable)
0 2 4 6 8 1 0
x 1 04
0
0 . 5
1
1 . 5
2
2 . 5
3
3 . 5x 1 0
- 5
V e r t i c a l L o a d i n g ( m m / s e c 2 )
Pro
babi
lity
Den
sity
P r o p a b i l i t y D e n s i t y o f V e r t i c a l L o a d i n g
2 0 0 0 4 0 0 0 6 0 0 0 8 0 0 0 1 0 0 0 00
0 . 1
0 . 2
0 . 3
0 . 4
0 . 5
0 . 6
0 . 7
0 . 8
0 . 9
1
V e r t i c a l L o a d i n g ( m m / s e c 2 )
Prob
abili
ty
P r o p a b i l i t y o f I n p u t V a r i a b l e V
Figure 7 - Probability Distribution of Vertical Loading q (input variable)

-0.01 -0.005 0 0.005 0.01 0.015 0.02 0.025 0.03 0.035 0.040
0.005
0.01
0.015
0.02
0.025
0.03
0.035
max Strain
Rel
ativ
e Fr
eque
ncy
Histogram of max Strain with Box-Behnken Matrix Design
Figure 8 - Histogram Of Max Strain Using The Box-Behneken Matrix Design
0 50 100 150 200 2500
0.01
0.02
0.03
0.04
0.05
0.06
0.07
max Von Mises Stress (N/mm2)
Rel
ativ
e Fr
eque
ncy
Histogram of max Stress with Box-Behnken Matrix Design
Figure 9 - Histogram Of Max Stress Using The Box-Behneken Matrix Design

Designing for Six Sigma quality with PDS and Optimization Factors like geometric dimensions (mean value of thickness) of a part can be controlled by designers in typical automotive designs. Uncontrollable or noise factors such as manufacturing imperfections (standard deviation of the thickness), environmental variables (loading), or product deterioration (material properties) are sources of variations whose effects cannot be eliminated. The goal of a robust design is to reduce a product's variation by reducing the sensitivity of the product to the sources of variation rather than by controlling these sources. An effort was made to reduce response variation by selecting appropriate settings for controllable parameters to dampen the effects of hard-to-control noise variables. The methodology for implementing robust design used in this research effort is summarized in a workflow diagram shown in Figure 10.
The objective is to automatically select the mean value of the geometric design variables that produce a design that meets a target value while minimizing variability. To automate this, we can set up an optimization loop that uses as design variables the mean values of thickness. For a given set of mean values (using the probabilistic model) this approach can produce the mean and standard deviation of the response, in this case the mean max Von Mises stress and its standard deviation. The next step is to compute the value of the constraint:
σcon = µ(max σe) + 6 * σ(max σe),
compare it to a target value and select the mean values of the design variables that minimize the standard deviation subject to σcon < σTarget
The formulation of this example problem can be expressed in mathematical terms as:
Select the mean values of the model design variables within a given range:
t min < µ ti < t max
that minimize the standard deviation of the response
Minimize [σ(max σe)]
subject to the constraint:
[µ (max σe) + 6 * σ (max σe)] < σTarget
For this example and number of design variables, the Box-Behneken Matrix design technique was used since it produces the same quality of results as the other techniques, but with the minimum number of FEA runs. This technique may not be valid if a large number of design variables forms a highly non-linear problem. In that case, the Latin Hypercube or the direct Monte Carlo should be used to validate the "goodness" of the Box-Behneken Matrix technique. With the probabilistic design and optimization approach, engineers are able to identify better designs that meet the performance objectives while being less sensitive to manufacturing variations.

Generate trial design of the optimization design variables ODV(mean values of the model design variables MDV)
tmin < mean ti < tmax
Generate a set of randomvalues of the model design
variables MDV ( ti, E, Q)
Statistical Distribution functions(Gauss, Lognormal, etc.)
Std. Dev. of MDV (noise)
Select Sampling Technique:MC: 1) Latin Hypercube 2) Direct Monte CarloRS: 3) Central Composite Design 4) Box-Behnken Matrix
Generate a trial design of the modeldesign variables MDV ( ti, E, Q)
Execute ANSYS Parametric FEA Model
Last design
ProbabilisticDesign loop
Yes
Compute Mean & Std. Dev of RV (responsevariables max stress, max strain)
Form approximations for:Objective Function (Std. Dev of RV) &Constraints (mean RV + 6 Std. Dev.)
OptimizationConvergence
OptimizationDesign loop
Mean Values of ODV that minimize Std. Dev. of RVwhile: mean RV + 6 Std. Dev. < target
Figure 10 - Workflow Diagram for Robust Design

Conclusions Probabilistic Modeling of Manufacturing Variations coupled with optimization can avoid over-design (deterministic analysis) and in our example, also demonstrated a reduction in component weight by 17%. By incorporating the physical scatter into the model, the risk of failing legal or consumer tests can be minimized.
The robust design optimization approach is more flexible, shifts performance mean to the target value and reduces the performance variability of a product, offering the potential for achieving Six Sigma level robustness on the key product performance characteristics with respect to the quantified variation. The robust optimization method should be used with caution since a fundamental assumption for using it is that the response random variables exhibit normal distribution.
A technique to perform probabilistic analysis, reliability based optimization and robust optimization within the CAD environment using ANSYS PDS and Pro/Engineer - Behavioral Modeling has been successfully demonstrated.
Acknowledgments The robust optimization example of this research effort was funded by the Department of Energy. The authors would like to express their appreciation to Robert Kost of DOE, Terry Penney and Keith Wipke of NREL, and Dan Arbitter, Eleni Beyko, N. Purushotthaman and Qutub Khaja of Ford Motor Company. We also wish to thank Chad Jackson and Dmitriy Shkolnik of PTC for their contributions to the BMX external analysis effort.
References 1) A. Haldar, S. Mahadevan, "Reliability Assessment Using Stochastic Finite Element Analysis,"
John Wiley, 2000, New York, New York.
2) J. Marckzyk, "Principals of Simulation-based Computer-aided Engineering," FIM Publications, September 1999
3) X.Chen, T.K. Hasselman, and D.J. Neill, "Reliability Based Structural Design Optimization for Paractical Aplications," 38th AIAA/ASME/ASCE/AHS/ASC, Structures, Structural Dynamics and Materials Conference, paper # AIAA-97-1403, Kissimmee, FL 1997
4) A. Vlahinos and S. Kelkar "Body-in-White Weight Reduction via Probabilistic Modeling of Manufacturing Variations," 2001 International Body Engineering Conference, SAE paper # 01IBECA-6, Detroit, MI, October 2001
5) ANSYS Inc: Probabilistic Design Techniques
6) ANSYS Inc. Advanced Analysis Guides, Chapter 3 Probabilistic Design
Appendix A Listing of the PDS_CCD.MAC ANSYS Marco ! run a central composite design
PDMETH,RSM,CCD
PDEXE,CCD_RUN,SER
! save the current status and results
PDSAVE,CCD_RUN,pds

!
! ++++++++++++++++++++++++++++++
! PDS response surfaces
! ++++++++++++++++++++++++++++++
! retrieve the number random output parameters
*get,NumRp,PDS,,NTRP
!
! loop over the random output parameters
*DO,iVarIdx,1,NumRp
!
! get the names of the random output parmeter
*get,_ZC1,PDS,,RNAM,iVarIdx,STAR,1
*get,_ZC2,PDS,,RNAM,iVarIdx,STAR,9
*get,_ZC3,PDS,,RNAM,iVarIdx,STAR,17
*get,_ZC4,PDS,,RNAM,iVarIdx,STAR,25
!
! fit the response surface
RSFIT,CCD_FIT,CCD_RUN,%_ZC1%%_ZC2%%_ZC3%%_ZC4%,QUAD,BOX,0.001,FSR,0.9
*ENDDO
! save the current status and results
PDSAVE,CCD_RUN,pds
! ++++++++++++++++++++++++++++++
! PDS post-processing
! ++++++++++++++++++++++++++++++
pds_post,'CCD_RUN',2,20000
! clean-up unneeded parameters
iMode=
iVarIdx=
NumRp=