Reliability Assessment of a Real Time Distribution · PDF filereliability studies, ... located...
8
International Journal of Electronic and Electrical Engineering. ISSN 0974-2174 Volume 7, Number 9 (2014), pp. 993-999 © International Research Publication House http://www.irphouse.com Reliability Assessment of a Real Time Distribution System Stuti Gupta 1 and M.L. Kansal 2 1,2 Department of WRD&M, IIT Roorkee, Roorkee 247 667, Uttarakhand, India Abstract: Distribution systems form an important link between the bulk energy sources and consumers. About 80% of the interruptions that the consumers experience occur due to failures in distribution systems. This is due to radial nature of these links and scarcity of protection devices. Therefore, reliability assessment is essential to identify weaker areas needing reinforcements and understand, how changes made in one part of system affects performance in the remainder part of the system. In this paper, study has been conducted on the existing distribution system of Indian Institute of Technology, Roorkee as it is a miniature form of our modern day distribution systems, which represents different kind of loads existing simultaneously and where continuity of supply needs to be maintained at all times. The reliability indices for this system are evaluated by analytical method using the concept of failure modes and effect analysis for radial distribution systems. The results obtained help determine unreliable sections in the distribution system which are required to be upgraded. Keywords – reliability, distribution systems, distribution indices etc. Introduction: The distribution system is that portion of electric power system which links the bulk power sources to consumer demand points. A distribution system is relatively cheaper than the generation and transmission system and their outages have a localized effect. Thus, less effort has been devoted to quantitative assessment of the adequacy of its various designs and reinforcements. But, analysis of customer failure statistics by most of the utilities shows that distribution system makes the greatest contribution to the unavailability of supply to a customer. The main concern while planning a distribution system today is to evaluate the quantitative merits of various reinforcement schemes along with optimized economic solutions. This is achieved through reliability assessment of the system.
Transcript of Reliability Assessment of a Real Time Distribution · PDF filereliability studies, ... located...

International Journal of Electronic and Electrical Engineering. ISSN 0974-2174 Volume 7, Number 9 (2014), pp. 993-999 © International Research Publication House http://www.irphouse.com
Reliability Assessment of a Real Time Distribution System
Stuti Gupta1 and M.L. Kansal2
1,2Department of WRD&M, IIT Roorkee, Roorkee 247 667, Uttarakhand, India
Abstract:
Distribution systems form an important link between the bulk energy sources and consumers. About 80% of the interruptions that the consumers experience occur due to failures in distribution systems. This is due to radial nature of these links and scarcity of protection devices. Therefore, reliability assessment is essential to identify weaker areas needing reinforcements and understand, how changes made in one part of system affects performance in the remainder part of the system. In this paper, study has been conducted on the existing distribution system of Indian Institute of Technology, Roorkee as it is a miniature form of our modern day distribution systems, which represents different kind of loads existing simultaneously and where continuity of supply needs to be maintained at all times. The reliability indices for this system are evaluated by analytical method using the concept of failure modes and effect analysis for radial distribution systems. The results obtained help determine unreliable sections in the distribution system which are required to be upgraded. Keywords – reliability, distribution systems, distribution indices etc.
Introduction: The distribution system is that portion of electric power system which links the bulk power sources to consumer demand points. A distribution system is relatively cheaper than the generation and transmission system and their outages have a localized effect. Thus, less effort has been devoted to quantitative assessment of the adequacy of its various designs and reinforcements. But, analysis of customer failure statistics by most of the utilities shows that distribution system makes the greatest contribution to the unavailability of supply to a customer. The main concern while planning a distribution system today is to evaluate the quantitative merits of various reinforcement schemes along with optimized economic solutions. This is achieved through reliability assessment of the system.
994 Stuti Gupta and M.L. Kansal
For computing reliability, various probabilistic methods[1] have been developed. For application of these methods, the IEEE Application of Probability Methods(APM) Subcommittee published a Reliability Test System (RTS) in 1979 [2]. Although it has been used extensively in recent years, but due to its large size its realistic assessment and modelling was difficult. To overcome this, Roy Billinton Test System(RBTS) [3],the small 6 bus bar system was developed. The probabilistic techniques could be easily applied on RBTS distribution systems[4] and systems similar to it, to give accurate results. In the present paper, the existing distribution system of Indian Institute of Technology, Roorkee (IIT- Roorkee) has been studied to carry out the reliability assessment. Being a miniature form of modern power system, the analytical techniques[5] could be easily applied to compute its reliability. The system comprises of various kinds of loads existing at the same time, such that 85% of the places require continuous supply. The network of IIT Roorkee is meshed but works as a radial feeder system due to the presence of normally open points. For carrying out the reliability studies, every load point is explained in terms of three fundamental reliability parameters namely: average failure rate (λ), average outage duration (r) and average annual outage time (U)[5,6]. Apart from load point indices, the complete representation of system behaviour is depicted in customer based reliability indices such as SAIFI (System Average Interruption Frequency Index), SAIDI (System Average Interruption Duration Index), ASAI (Average Service Availability) and ENS(Energy Not Supplied)[5,6]. These indices reflect the severity of system failures and help to identify the weaker areas needing reinforcement. Study Area: The real time system taken under consideration is the existing electrical distribution system of IIT Roorkee. The main supply for this network comes from 33kV station located at Govindpuri whose incoming power is from 220/132/33 kV substation situated at Ramnagar, 4 kms away from IIT campus. The power from Govindpuri is delivered through two 5 MVA, 33/11kV transformers to 16 distribution stations in the form of ring mains. All distribution transformers rated (800kVA, 630kVA, 500kVA), 11/.415kV distribute power to more than 80 load points.

Reliability Assessment of a Real Time Distribution System 995
.
Figure 1: Location of substations in IIT Roorkee Source- Map data 2014 Google
Out of these, 8 sub stations form the starting(1,7,10,16) and ending (6,9,12,13) points of ring mains as shown in Figure 1. The idea behind ring mains is to keep the provision for alternate supply. All the distribution stations falling in the ring circuit are connected through high tension (HT) underground cables of 11 kV. All underground cables are 3 core XLPE insulated with aluminium conductors. The cables joining the primary feeders to load points are 415V low tension(LT) underground cables.
Figure 2: Single line diagram of IIT Roorkee Distribution System

996 Stuti Gupta and M.L. Kansal
Most of the transformers installed are of dry type. The presence of vacuum circuit breakers and isolators on HT cables with air circuit breakers and moulded cast type on LT cables adds good protection to the system. The single line diagram (SLD) of IIT Roorkee distribution system is as shown in Figure 2. The SLD of Wind Tunnel substation is shown in Figure 3.
Figure 3: SLD of Wind Tunnel Substation The substation has two transformers(11/.415) kV supplying power to individual loads like departmental, residential etc. At the time of fault, the bus coupler can be activated and loads can be shifted on second transformer. Thus, this scheme reduces the outage time of load curtailment drastically during failures. The APFC load is a capacitor bank designed according to the needs of substation to take care of power factor. The SLDs of all other substations have the same configuration but with different component ratings depending upon the load. Methodology: The reliability assessment of IIT Roorkee distribution system is carried out through failure modes and effect analysis approach as depicted in Figure 4.
Figure 4: Philosophy for Reliability Assessment
Reliability Assessment of a Real Time Distribution System 997
According to it, in case of failure, the state of components leading to loss of load are considered and are made to form minimal cut set[7]. In the present analysis, only single outage events are considered. The components on 33kV side are assumed to be 100% reliable. The effect of scheduled maintenance is not considered. Following steps are followed for estimating the reliability indices for the given system :
1. In order to estimate the failure rate of various components, the failure data of the components is collected.
2. The outage and switching time data for every component is collected. 3. Average load and energy at each load point is estimated using substation data. 4. Number of consumers connected at every load point is estimated. 5. The length of HT and LT cables is estimated. 6. Failure modes and effect analysis is carried out for evaluation of load point
indices. 7. From the load point indices, the customer oriented indices are estimated.
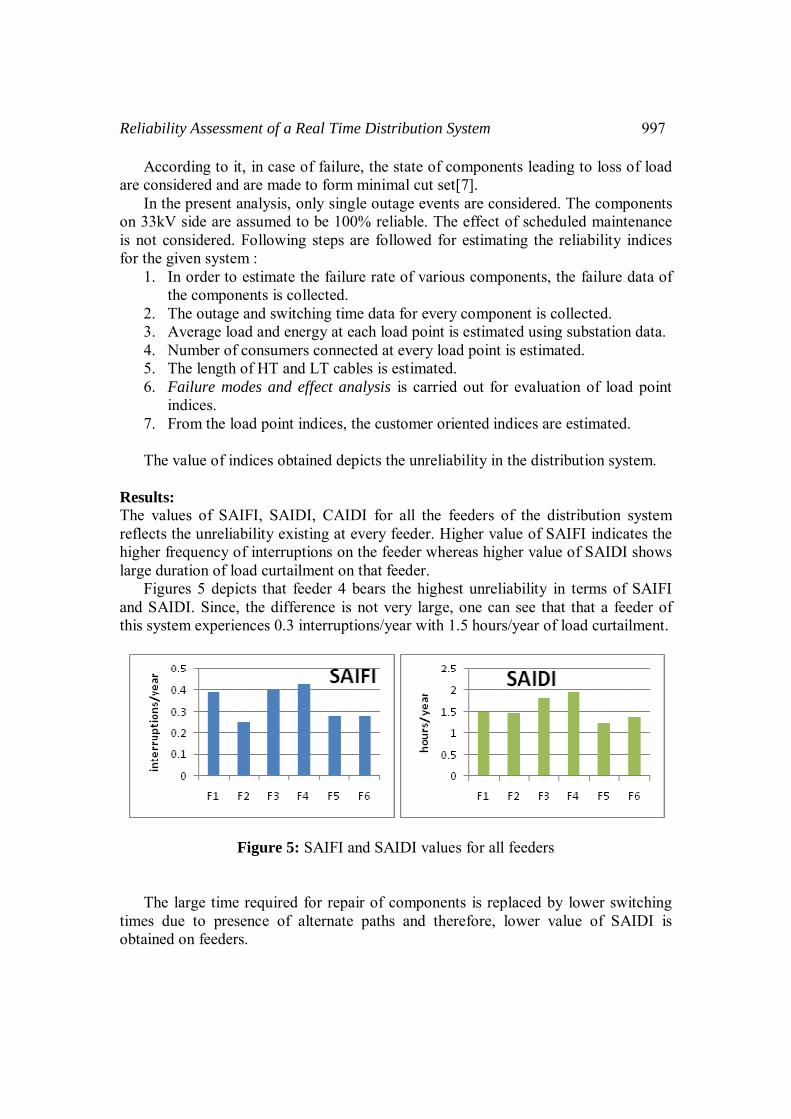
The value of indices obtained depicts the unreliability in the distribution system. Results: The values of SAIFI, SAIDI, CAIDI for all the feeders of the distribution system reflects the unreliability existing at every feeder. Higher value of SAIFI indicates the higher frequency of interruptions on the feeder whereas higher value of SAIDI shows large duration of load curtailment on that feeder. Figures 5 depicts that feeder 4 bears the highest unreliability in terms of SAIFI and SAIDI. Since, the difference is not very large, one can see that that a feeder of this system experiences 0.3 interruptions/year with 1.5 hours/year of load curtailment.
Figure 5: SAIFI and SAIDI values for all feeders
The large time required for repair of components is replaced by lower switching times due to presence of alternate paths and therefore, lower value of SAIDI is obtained on feeders.

998 Stuti Gupta and M.L. Kansal
Figure 6: ASAI values for all feeders Figure 7: ENS values for average loads on all feeders
ASAI in Figure 6 is around 99.99% which indicates high service availability. ENS in Figure 7 depicts the energy (in kWh) not supplied to the feeders due to failures per year. As one can see, feeder 1 experiences the highest energy curtailment. The reason is the presence of large number of loads on the first feeder. Any interruption leads to large load curtailment. Conclusions: The values of computed indices for IIT Roorkee distribution system indicate high reliability. This shows that the system is equipped with good protection system along with provision of alternate paths to maintain continuity of supply. The presence of capacitor bank at all substations controls reactive power and voltage magnitude. The underground cables have a considerable impact to reduce distribution failures as compared to overhead lines. The transformers within a substation are designed to carry the loads of whole substation in case of fault occurs on one of them, using a bus coupler. The high tension cables in ring mains use normally open tie points that permit service to be restored in case of failure. All these factors make the distribution system of IIT Roorkee quiet reliable in all respects. References: [1] R. Billinton.,"Bibliography on the application of probability methods in power
system reliability evaluation", IEEE Trans. Power App. Syst.(1972), vol. PAS-91, pp.649-660.
[2] "IEEE Reliability Test System", IEEE Trans, vol. PAS-98 (1979), pp.2047-2054.
[3] R. Billinton,S. Kumar, N. Chowdhury, K. Chu, K. Debnath, L. Goel, E. Khan, P. Kos, G. Nourbakhsh and J. Oteng-Adjei "A Reliability Test System for Educational Purposes-Basic Data", IEEE Trans on Power Systems, vol. PWRS-4 (1989), pp.1238-1244.
[4] R. N. Allan, R. Billinton, L. Goel, I. Sjarrief, and K. S. So, "A reliability test system for educational purposes-basic distribution system data and results",

Reliability Assessment of a Real Time Distribution System 999
IEEE Trans. Power Systems (1991), vol. 6, no. 2, pp.813-820 [5] R.Billinton, R.N.Allan, ”Reliability evaluation of power systems”, Longman,
London (England)/Plenum Press, New York(1994). [6] R. Billinton, J.E. Billinton, “Distribution system reliability indices” IEEE
Trans.,1, 561 – 568. [7] R.Billinton and R.N.Allan, “Reliability evaluation of engineering systems:
Concepts and Techniques”, Longman, London (England)/ Plenum Press, New York (1983).