Reliability Analysis of a Tunnel Design with RELY -...
16
SOFiSTiK Seminar 2016, München Reliability Analysis of a Tunnel with RELY W. Betz, I. Papaioannou, M. Eckl, H. Heidkamp, D. Straub - 1 - Reliability Analysis of a Tunnel Design with RELY Wolfgang Betz, TU München & Eracons GmbH, München Iason Papaioannou, TU München & Eracons GmbH, München Michael Eckl, EDR GmbH, München Holger Heidkamp, SOFiSTiK AG, Oberschleißheim Daniel Straub, TU München & Eracons GmbH, München Summary RELY is a novel SOFiSTiK module for reliability analysis. It allows to employ the full capabilities of the SOFiSTiK finite element package to model the engineering system of interest, in combination with a powerful stochastic model and analysis toolbox. The kernel of RELY is powered by Strurel, one of the leading reliability software tools. We show how to apply RELY to perform reliability analysis of a conventionally driven tunnel. Model parameters that are subject to considerable uncertainty are represented stochastically. The first-order reliability method (FORM) is employed to estimate the reliability of the outer tunnel lining. Sensitivity information provided by FORM is used to quantify the relative importance of the stochastic model parameters. Zusammenfassung RELY ist ein SOFiSTiK Modul zur Zuverlässigkeitsanalyse, das mit der Version SOFiSTiK 2016 eingeführt wurde. RELY ermöglicht die probabilistische Analyse komplexer mit SOFiSTiK erzeugter Finite Element Modelle. Der Rechenkern von RELY basiert auf dem Rechenkern von Sturel, einer führenden Software zur Zuverlässigkeitsanalyse. Wir benutzen RELY zur Zuverlässigkeitsanalyse eines mit der Neuen Österreichischen Tunnelbaumethode vorgetriebenen Tunnels. Modellparameter die nennenswerten Unsicherheiten unterliegen, werden durch Wahrscheinlichkeitsverteilungen beschrieben. Die Zuverlässigkeit der mit Spritzbeton hergestellten Außenschale des Tunnels wird mit der First- Order Reliability Method (FORM) untersucht. Darüber hinaus werden mit dem FORM Verfahren erhaltene Informationen zur Sensitivität der stochastischen Parameter genutzt, um die relative Wichtigkeit der stochastischen Modellparameter zu beschreiben.
Transcript of Reliability Analysis of a Tunnel Design with RELY -...

SOFiSTiK Seminar 2016, München Reliability Analysis of a Tunnel with RELY
W. Betz, I. Papaioannou, M. Eckl, H. Heidkamp, D. Straub
- 1 -
Reliability Analysis of a Tunnel Design with RELY
Wolfgang Betz, TU München & Eracons GmbH, München
Iason Papaioannou, TU München & Eracons GmbH, München
Michael Eckl, EDR GmbH, München
Holger Heidkamp, SOFiSTiK AG, Oberschleißheim
Daniel Straub, TU München & Eracons GmbH, München
Summary
RELY is a novel SOFiSTiK module for reliability analysis. It allows to employ the full
capabilities of the SOFiSTiK finite element package to model the engineering system of
interest, in combination with a powerful stochastic model and analysis toolbox. The kernel of
RELY is powered by Strurel, one of the leading reliability software tools.
We show how to apply RELY to perform reliability analysis of a conventionally driven tunnel.
Model parameters that are subject to considerable uncertainty are represented stochastically.
The first-order reliability method (FORM) is employed to estimate the reliability of the outer
tunnel lining. Sensitivity information provided by FORM is used to quantify the relative
importance of the stochastic model parameters.
Zusammenfassung
RELY ist ein SOFiSTiK Modul zur Zuverlässigkeitsanalyse, das mit der Version SOFiSTiK
2016 eingeführt wurde. RELY ermöglicht die probabilistische Analyse komplexer mit SOFiSTiK
erzeugter Finite Element Modelle. Der Rechenkern von RELY basiert auf dem Rechenkern
von Sturel, einer führenden Software zur Zuverlässigkeitsanalyse.
Wir benutzen RELY zur Zuverlässigkeitsanalyse eines mit der Neuen Österreichischen
Tunnelbaumethode vorgetriebenen Tunnels. Modellparameter die nennenswerten
Unsicherheiten unterliegen, werden durch Wahrscheinlichkeitsverteilungen beschrieben. Die
Zuverlässigkeit der mit Spritzbeton hergestellten Außenschale des Tunnels wird mit der First-
Order Reliability Method (FORM) untersucht. Darüber hinaus werden mit dem FORM
Verfahren erhaltene Informationen zur Sensitivität der stochastischen Parameter genutzt, um
die relative Wichtigkeit der stochastischen Modellparameter zu beschreiben.

SOFiSTiK Seminar 2016, München Reliability Analysis of a Tunnel with RELY
W. Betz, I. Papaioannou, M. Eckl, H. Heidkamp, D. Straub
- 2 -
1 Reliability-based structural design and assessment
An engineering structure must be adequately stable and utilizable during its lifetime. It is the
responsibility of the engineer to design the structure such that the safety requirements are met.
Traditionally, compliance of an engineering system is demonstrated by means of safety
factors. The safety concept for civil engineering structures is specified in Eurocode 0. The
Eurocodes are primarily based on the concept of partial safety factors. An alternative to this
classical approach is specified in Appendix C of Eurocode 0: By means of structural reliability
techniques, the safety of an engineering system can be assessed probabilistically. The
following is a brief summary of the main concepts for assessing the design of structures. A
more detailed introduction can be found in (Straub 2015).
1.1 Design of structures using partial safety factors
In the partial factor method, partial safety factors and combination factors are used to
evaluate a design value for demand 𝐸d and capacity 𝑅d. The design is considered sufficiently
reliable if 𝑅d ≥ 𝐸d. The design based on partial safety factors is usually a cost-effective design
concept for most practical problems.
We illustrate the partial factor method by means of a rather simple example (This example
is also used in the next section to explain the design based on probabilistic techniques): The
task is to determine the diameter 𝑑 of a rod under tension in order to maintain structural safety.
The material of the rod to design is steel S235. The characteristic value for the yield stress 𝑓𝑦
of steel S235 is 235N/mm². The characteristic value 𝑅k for the capacity of the rod depends on
the diameter 𝑑 and is: 𝑅k = 𝑓𝑦 ∙ 0.25 ∙ 𝜋 ∙ 𝑑2. The partial safety factor used to obtain the design
value for capacity 𝑅d is 𝛾𝑅 = 1.1 (Eurocode 3). Thus, the design value for capacity is 𝑅d =
𝑅k/𝛾𝑅. The lower end of the rod is loaded permanently with one cubic meter of oak wood.
According to EN 1990, Section 4.1.2, the characteristic value of a permanent load can be
selected as the 95% quantile. The average value and coefficient of variation for the weight of
oak wood is given in the JCSS Probabilistic Model Code: the average is 6kN/m³ and the
coefficient of variation is 10%. The mean value and coefficient of variation of the applied load
is consequently 𝜇E = 6kN and 𝛿E = 10%. It is appropriate to assume that the load follows a
Normal distribution. The characteristic value of the demand is the 95% quantile of its
distribution. Because the load follows the Normal distribution, we have 𝐸k = 𝜇E ∙ (1 + 𝑘𝐸𝛿E),
where 𝑘𝐸 = 1.64; i.e., 𝐸k = 7kN. The design value for the demand is defined in terms of 𝐸k as
𝐸d = 𝐸k ∙ 𝛾𝐸, where for permanent loads a partial safety factor of 𝛾𝐸 = 1.35 is required by the
code. To ensure a sufficiently reliable design, the design value 𝑅d of the capacity must be at
least as large as 𝐸d. Based on this condition, we can compute the required characteristic value
for the resistance as: 𝑅k ≥ 𝐸k ∙ 𝛾𝐸 ∙ 𝛾𝑅. Consequently, the required minimum diameter 𝑑min is:
𝑑min = √𝐸k ∙ 𝛾𝐸 ∙ 𝛾𝑅𝑓𝑦 ∙ 0.25 ∙ 𝜋
= √7kN ∙ 1.35 ∙ 1.1
235 ∙ 103kN/m² ∙ 0.25 ∙ 𝜋= 7.5mm
Fig. 1: A tension rod is loaded with 1m³ of oak wood. The diameter of the rod that is required for a safe design is to be determined. This simple example is tackled with the classical design approach based on safety factors (Section 1.1) and by means of a probabilistic design approach (Section 1.2).

SOFiSTiK Seminar 2016, München Reliability Analysis of a Tunnel with RELY
W. Betz, I. Papaioannou, M. Eckl, H. Heidkamp, D. Straub
- 3 -
1.2 Design of structures based on probabilistic techniques
Appendix C of Eurocode 0 specifies the design of structures based on probabilistic
techniques. Such a probabilistic design is usually more complex than the design based on
partial safety factors and, therefore, cost-effective only in special cases. In a probabilistic
design, uncertainties in loading, material properties and geometry are taken into account
explicitly; i.e., the uncertainties are represented by means of probability distributions. The
target quantity of interest in reliability analysis is the probability of failure 𝑝𝑓 of the investigated
structure. Note that the obtained probability of failure should not be interpreted as the
probability that the investigated structure will actually fail: For example, human errors can have
a considerably impact on the reliability of a structure, but they cannot be properly accounted
for in the reliability analysis. The probability of failure 𝑝𝑓 obtained by means of structural
reliability is used to compare the level of safety of different structures quantitatively.
The probabilities of failure 𝑝𝑓 of engineering structures are commonly small; i.e., 𝑝𝑓 ≪ 10−3.
As a consequence, it is often clearer to communicate the reliability of a structure by means of
the so-called reliability index 𝛽. The reliability index is defined as 𝛽 = −Φ−1(𝑝𝑓), where Φ−1(∙)
is the function of the cumulative distribution function of the standard Normal distribution. The
reliability index increases if the reliability of the investigated structure is increased and the
corresponding probability of failure is decreased. The method of partial factors should ensure
the reliability of the structure to be at least 𝛽 ≥ 3.8 within a reference period of 50 years (this
corresponds to 𝑝𝑓 ≤ 7 ∙ 10−5), according to Annex B in Eurocode 0. Annex B in Eurocode 0
distinguishes three consequence classes. For increasing consequences, the required reliability
index is increased. The requirement for a reliability index of at least 3.8 refers to the second
class of consequences and a 50-year reference period.
We will use the example already presented in the previous section to illustrate the
probabilistic design of a structure. Our aim is to evaluate the reliability index for the previously
computed diameter 𝑑min = 7.5mm. The probability of structural failure can be expressed as
the probability that the demand 𝐸 (the load that acts on the structure) exceeds the capacity 𝑅
of the structure; i.e., Pr(𝑅 − 𝐸 < 0). The mean and coefficient of variation of 𝐸 is given in the
last section as 𝜇E = 6kN and 𝛿E = 10%. The coefficient of variation 𝛿𝑦 of the yield stress of
steel is selected as 7% based on the JCSS Probabilistic Model Code, Part 3. We assume that
the yield stress 𝑦 follows a Normal distribution. Considering that the coefficient of variation of
7% is small, this assumption is justifiable – as the probability of negative values is practically
zero. The characteristic value of the yield stress 𝑓𝑦 corresponds to the 5% quantile of 𝑦; hence,
𝑘𝑦 = −1.64 (the quantity 𝑘𝑦 is defined as the inverse of the cumulative distribution function of
the standard normal distribution, evaluated at 5%). Consequently, the mean value of the yield
stress 𝜇𝑦 can be obtained as 𝜇𝑦 = 𝑓𝑦/(1 + 𝑘𝑦𝛿𝑦) = 235N/mm²/(1 − 1.64 ∙ 0.07) = 265N/
mm². The capacity of the tension rod is 𝑅 = 𝑦 ∙ 0.25 ∙ 𝜋 ∙ 𝑑2 and follows a Normal distribution
as well. The mean 𝜇R and coefficient of variation 𝛿R of 𝑅 is 𝜇R = 11.7kN and 𝛿R = 7%. Let the
difference between the capacity and load be denoted as 𝑀 = 𝑅 − 𝐸. As both 𝑅 and 𝐸 follow a
Normal distribution, 𝑀 is also Normal. The expectation of 𝑀 is 𝜇𝑀 = 𝜇𝑅 − 𝜇𝐸 = 5.7kN, and the
standard deviation of 𝑀 is 𝜎𝑀 = √𝜎𝑅2 + 𝜎𝐸
2 = 1.0kN. As 𝑀 follows a Normal distribution, the
reliability index can be calculated explicitly as:
𝛽 =𝜇𝑀𝜎𝑀
= 5.7
The evaluated reliability index of 5.7 is larger than any reliability index demanded in Annex B
of Eurocode 0. Therefore, the design with 𝑑min = 7.5mm can be regarded as comparatively
conservative. However, this finding holds only for the test case at hand and should not be
generalized.

SOFiSTiK Seminar 2016, München Reliability Analysis of a Tunnel with RELY
W. Betz, I. Papaioannou, M. Eckl, H. Heidkamp, D. Straub
- 4 -
1.3 Limit-state function
The limit-state function 𝑔 is a function that is by definition negative in case of failure and
positive otherwise. If resistance 𝑅 and action 𝐸 can be clearly separated, the limit-state function
is usually defined as 𝑔 = 𝑅 − 𝐸. For some systems a separation of demand and capacity is not
feasible (e.g., due to soil-structure interaction in tunneling). If demand and capacity cannot be
separated easily, the limit-state function is often defined as the difference between some
threshold value and the corresponding model output; e.g., the displacement at the tip of a
cantilever beam versus the maximum allowed displacement for that system.
1.4 The reliability problem
Based on the definition of the limit-state function, the probability of failure 𝑝𝑓 can be
expressed as:
𝑝𝑓 = ∫ 𝑝𝐗(𝐱)d𝐱𝑔(𝐱)≤0
where 𝐗 is an 𝑀-dimensional vector of uncertain input quantities of the system of interest, and
𝑝𝐗(𝐱) is the joint probability density function of 𝐗. The above integral can often not be evaluated
analytically, because the domain {𝑔(𝐱) ≤ 0} is not known explicitly. Instead, the integral is
usually solved numerically. The probabilities that we are dealing with in reliability analysis are
typically rather small; i.e., 𝑝𝑓 ≪ 10−2. This renders the numerical treatment of the reliability
integral difficult, because {𝑔(𝐱) ≤ 0} constitutes only a small part of the total domain of 𝐗.
1.5 Commonly used reliability methods
The class of numerical methods specifically designed to solve the reliability integral
introduced in the previous section are referred to as reliability methods. The various reliability
methods differ in their treatment of the reliability integral.
The most straight-forward (and simplest) method to solve the reliability problem is Monte
Carlo Simulation (MCS). However, for small failure probabilities MCS requires a prohibitively
large number of limit-state function evaluations. Hence, efficient reliability methods have been
developed that aim at minimizing the number of required limit-state function calls. This is
because in structural reliability, the limit-state function is commonly expressed as a function
that depends on the outcome of a finite element analysis. Consequently, for every limit-state
function evaluation, a finite element analysis must be performed – which renders the reliability
analysis of large finite element systems computationally expensive.
Besides MCS, other well-known reliability methods are the First Order Reliability Method
(FORM) (Hasofer and Lind 1974; Rackwitz and Flessler 1978), the Second Order Reliability
Method (SORM) (Breitung 1984), importance sampling methods including line sampling
(Hohenbichler and Rackwitz 1988; Koutsourelakis et al. 2004; Rackwitz 2001) and directional
importance sampling (Bjerager 1988; Ditlevsen et al. 1990), and Subset Simulation (Au and
Beck 2001; Papaioannou et al. 2015).
1.6 First Order Reliability Method (FORM)
FORM, which is explicitly referred to in Appendix C of Eurocode 0, computes an
approximation of the probability of failure based on a linearization of the limit-state function.
The random variable space 𝐗 of the problem is transformed to an underlying space of
independent standard Normal random variables, denoted 𝐔. FORM linearizes the limit-state
function with respect to 𝐔 at the so-called design point 𝐮∗. The design point 𝐮∗ is defined as
the point on the failure surface (i.e., the region where the limit-state function is zero) that is
closest to the origin and represents the most likely failure point in the outcome space of 𝐔. The
principal idea behind FORM is illustrated in Fig. 2. The probability of failure is computed based
on the linearized limit-state function around 𝐮∗.

SOFiSTiK Seminar 2016, München Reliability Analysis of a Tunnel with RELY
W. Betz, I. Papaioannou, M. Eckl, H. Heidkamp, D. Straub
- 5 -
Fig. 2: Design point and linear approximation of the limit-state surface. Left-side: original random variable space; right-side: standard Normal space. [taken from (Klüppelberg et al. 2014)]
The design point 𝐮∗ is obtained by solving a constraint optimization problem. The main
computational burden in FORM is to solve this optimization problem. Since an optimization
problem has to be solved, the limit-state function is usually required to be differentiable.
As a by-product of FORM, the random variables that have the largest influence on the total
variance of the linearized limit-state function can be determined.
2 The SOFiSTiK module RELY
RELY is a module of SOFiSTiK that performs reliability analysis. The engineering system
of interest is modeled using the full capabilities of the SOFiSTiK finite element package. The
kernel of RELY is powered by the well-established reliability software Strurel. Numerous
structural reliability methods are included: Monte Carlo simulation, FORM, SORM, importance
sampling, line sampling, directional sampling, adaptive sampling and subset simulation. RELY
is available in SOFiSTiK starting from version SOFiSTiK 2016.
The definition of failure criteria by means of limit-state functions is very flexible and powerful
in SOFiSTiK. All relevant information about the engineering system can directly be read from
the comprehensive SOFiSTiK database CDB.
3 Investigated engineering problem: reliability analysis of a tunnel
To reduce traffic congestion in the German town of Freising, a bypass west of the town is
planned. The bypass involves the construction of a tunnel. The conventional driven part of the
tunnel has a total length of 465m. The building authority of Freising is in charge of the planning
of the tunnel. The tunnel is designed using a finite element model of the tunnel by the
engineering office EDR GmbH. Based on this project, we exemplarily show how to investigate
a tunnel probabilistically by means of reliability analysis. The goal is to assess the reliability of
the shotcrete lining and to determine the model parameters that have the largest influence on
the reliability of the tunnel.
The purpose of this investigation is to show how the SOFiSTiK module RELY can be applied
to assess the reliability of a tunnel. The actual dimensioning of the tunnel lining – which is
conducted by EDR GmbH – was done independently of this probabilistic analysis. We
emphasize that the results obtained in this study should not be misinterpreted as the reliability
associated with the mentioned tunneling project for the following reasons: 1) The probabilistic
description of the input is based mainly on a geological survey (Vogt et al. 2015) and on

SOFiSTiK Seminar 2016, München Reliability Analysis of a Tunnel with RELY
W. Betz, I. Papaioannou, M. Eckl, H. Heidkamp, D. Straub
- 6 -
engineering standards. If this were an actual consulting project, we would have to explicitly
consult experts (i.e., geologists and material testers) for specific information regarding the
uncertainties at hand. 2) We perform the reliability analysis only for a selected section of the
tunnel (i.e., the section located 405m after the beginning of the tunnel). In the project at hand,
groundwater levels and geotechnical conditions vary considerably throughout the tunnel.
Therefore, for the analysis to be meaningful, we would have to analyze multiple tunnel
sections. 3) In the present analysis, we assess the reliability of the shotcrete lining. An equally
important query would be to assess tunnel induced settlements, as the tunnel passes beneath
area covered by buildings (Camόs et al. 2016).
4 Mechanical model of the tunnel
4.1 General
The investigated tunnel is a conventional driven tunnel with a tapering cross-section. The
problem is modeled in the SOFiSTiK finite element (FE) software package (SOFiSTiK AG
2016), using 2D plane strain finite elements. The numerical model has a width of 60m and a
height of 40m. The FE mesh and the tunnel profile are illustrated in Fig. 3.
The tunnel is located in a depth of approximately 10m below ground. The tunnel profile has
a height of 10.5m and a width of 12.5m. The shotcrete lining is modeled using linear elastic
beam elements. The required thickness of the shotcrete lining is 0.3m.
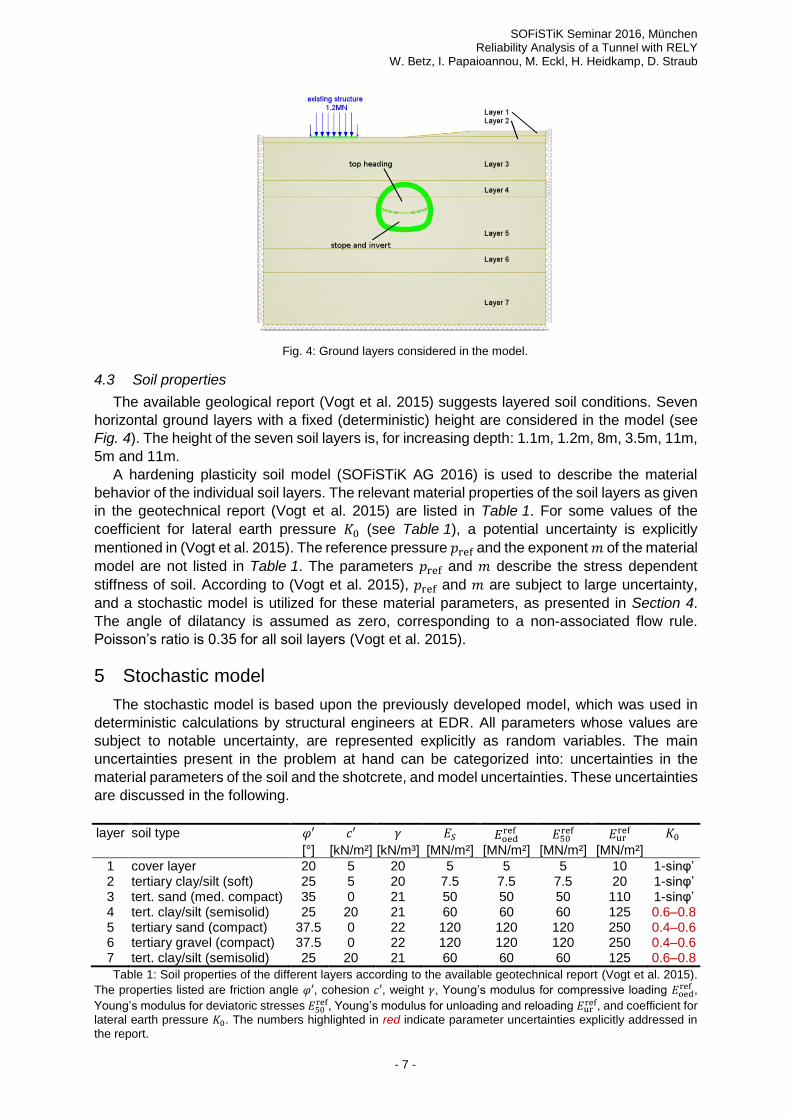
The reliability of the tunnel lining is investigated for an exemplarily picked section of the
tunnel. A load of 1.2 MN is distributed at ground level over a length of 10m to model the weight
of an existing structure (see Fig. 4).
4.2 Excavation process
The excavation process is modeled by application of the stress reduction method (Swobota
1979, Panet and Guenot 1982, Schikora and Ostermeier 1988). In this method, a specified
fraction 𝛼 of the initial stress is left inside the excavated tunnel area. The remaining stresses
act as a support pressure to approximately account for the three-dimensional arching effect.
The support pressure is removed from the model after installation of the lining. The parameter
𝛼 is referred to as relaxation factor.
The excavation and installation of the tunnel lining is modeled in five steps: 1) representation
of primary soil stresses before tunnel construction, 2) relaxation of the top heading,
3) excavation of the calotte and installation of shotcrete, 4) relaxation of the stope and invert,
5) excavation of the stope and invert, and installation of shotcrete.
Fig. 3: Finite element mesh used to discretize the tunnel.
SOFiSTiK Seminar 2016, München Reliability Analysis of a Tunnel with RELY
W. Betz, I. Papaioannou, M. Eckl, H. Heidkamp, D. Straub
- 7 -
Fig. 4: Ground layers considered in the model.
4.3 Soil properties
The available geological report (Vogt et al. 2015) suggests layered soil conditions. Seven
horizontal ground layers with a fixed (deterministic) height are considered in the model (see
Fig. 4). The height of the seven soil layers is, for increasing depth: 1.1m, 1.2m, 8m, 3.5m, 11m,
5m and 11m.
A hardening plasticity soil model (SOFiSTiK AG 2016) is used to describe the material
behavior of the individual soil layers. The relevant material properties of the soil layers as given
in the geotechnical report (Vogt et al. 2015) are listed in Table 1. For some values of the
coefficient for lateral earth pressure 𝐾0 (see Table 1), a potential uncertainty is explicitly
mentioned in (Vogt et al. 2015). The reference pressure 𝑝ref and the exponent 𝑚 of the material
model are not listed in Table 1. The parameters 𝑝ref and 𝑚 describe the stress dependent
stiffness of soil. According to (Vogt et al. 2015), 𝑝ref and 𝑚 are subject to large uncertainty,
and a stochastic model is utilized for these material parameters, as presented in Section 4.
The angle of dilatancy is assumed as zero, corresponding to a non-associated flow rule.
Poisson’s ratio is 0.35 for all soil layers (Vogt et al. 2015).
5 Stochastic model
The stochastic model is based upon the previously developed model, which was used in
deterministic calculations by structural engineers at EDR. All parameters whose values are
subject to notable uncertainty, are represented explicitly as random variables. The main
uncertainties present in the problem at hand can be categorized into: uncertainties in the
material parameters of the soil and the shotcrete, and model uncertainties. These uncertainties
are discussed in the following.
layer soil type 𝜑′ 𝑐′ 𝛾 𝐸𝑆 𝐸oedref 𝐸50
ref 𝐸urref 𝐾0
[°] [kN/m²] [kN/m³] [MN/m²] [MN/m²] [MN/m²] [MN/m²]
1 cover layer 20 5 20 5 5 5 10 1-sinφ’ 2 tertiary clay/silt (soft) 25 5 20 7.5 7.5 7.5 20 1-sinφ’ 3 tert. sand (med. compact) 35 0 21 50 50 50 110 1-sinφ’ 4 tert. clay/silt (semisolid) 25 20 21 60 60 60 125 0.6–0.8 5 tertiary sand (compact) 37.5 0 22 120 120 120 250 0.4–0.6 6 tertiary gravel (compact) 37.5 0 22 120 120 120 250 0.4–0.6 7 tert. clay/silt (semisolid) 25 20 21 60 60 60 125 0.6–0.8
Table 1: Soil properties of the different layers according to the available geotechnical report (Vogt et al. 2015).
The properties listed are friction angle 𝜑′, cohesion 𝑐′, weight 𝛾, Young’s modulus for compressive loading 𝐸oedref ,
Young’s modulus for deviatoric stresses 𝐸50ref, Young’s modulus for unloading and reloading 𝐸ur
ref, and coefficient for
lateral earth pressure 𝐾0. The numbers highlighted in red indicate parameter uncertainties explicitly addressed in
the report.
SOFiSTiK Seminar 2016, München Reliability Analysis of a Tunnel with RELY
W. Betz, I. Papaioannou, M. Eckl, H. Heidkamp, D. Straub
- 8 -
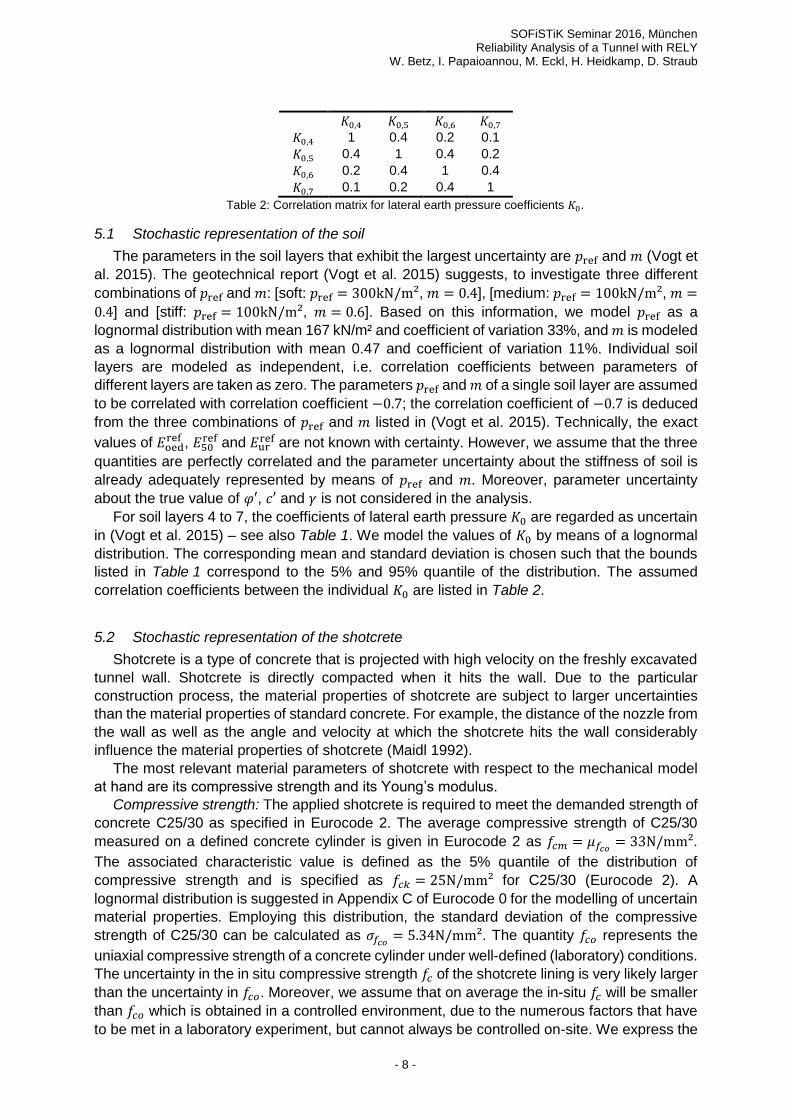
𝐾0,4 𝐾0,5 𝐾0,6 𝐾0,7
𝐾0,4 1 0.4 0.2 0.1
𝐾0,5 0.4 1 0.4 0.2
𝐾0,6 0.2 0.4 1 0.4
𝐾0,7 0.1 0.2 0.4 1
Table 2: Correlation matrix for lateral earth pressure coefficients 𝐾0.
5.1 Stochastic representation of the soil
The parameters in the soil layers that exhibit the largest uncertainty are 𝑝ref and 𝑚 (Vogt et
al. 2015). The geotechnical report (Vogt et al. 2015) suggests, to investigate three different
combinations of 𝑝ref and 𝑚: [soft: 𝑝ref = 300kN/m², 𝑚 = 0.4], [medium: 𝑝ref = 100kN/m², 𝑚 =
0.4] and [stiff: 𝑝ref = 100kN/m², 𝑚 = 0.6]. Based on this information, we model 𝑝ref as a
lognormal distribution with mean 167 kN/m² and coefficient of variation 33%, and 𝑚 is modeled
as a lognormal distribution with mean 0.47 and coefficient of variation 11%. Individual soil
layers are modeled as independent, i.e. correlation coefficients between parameters of
different layers are taken as zero. The parameters 𝑝ref and 𝑚 of a single soil layer are assumed
to be correlated with correlation coefficient −0.7; the correlation coefficient of −0.7 is deduced
from the three combinations of 𝑝ref and 𝑚 listed in (Vogt et al. 2015). Technically, the exact
values of 𝐸oedref , 𝐸50
ref and 𝐸urref are not known with certainty. However, we assume that the three
quantities are perfectly correlated and the parameter uncertainty about the stiffness of soil is
already adequately represented by means of 𝑝ref and 𝑚. Moreover, parameter uncertainty
about the true value of 𝜑′, 𝑐′ and 𝛾 is not considered in the analysis.
For soil layers 4 to 7, the coefficients of lateral earth pressure 𝐾0 are regarded as uncertain
in (Vogt et al. 2015) – see also Table 1. We model the values of 𝐾0 by means of a lognormal
distribution. The corresponding mean and standard deviation is chosen such that the bounds
listed in Table 1 correspond to the 5% and 95% quantile of the distribution. The assumed
correlation coefficients between the individual 𝐾0 are listed in Table 2.
5.2 Stochastic representation of the shotcrete
Shotcrete is a type of concrete that is projected with high velocity on the freshly excavated
tunnel wall. Shotcrete is directly compacted when it hits the wall. Due to the particular
construction process, the material properties of shotcrete are subject to larger uncertainties
than the material properties of standard concrete. For example, the distance of the nozzle from
the wall as well as the angle and velocity at which the shotcrete hits the wall considerably
influence the material properties of shotcrete (Maidl 1992).
The most relevant material parameters of shotcrete with respect to the mechanical model
at hand are its compressive strength and its Young’s modulus.
Compressive strength: The applied shotcrete is required to meet the demanded strength of
concrete C25/30 as specified in Eurocode 2. The average compressive strength of C25/30
measured on a defined concrete cylinder is given in Eurocode 2 as 𝑓𝑐𝑚 = 𝜇𝑓𝑐𝑜 = 33N/mm².
The associated characteristic value is defined as the 5% quantile of the distribution of
compressive strength and is specified as 𝑓𝑐𝑘 = 25N/mm² for C25/30 (Eurocode 2). A
lognormal distribution is suggested in Appendix C of Eurocode 0 for the modelling of uncertain
material properties. Employing this distribution, the standard deviation of the compressive
strength of C25/30 can be calculated as 𝜎𝑓𝑐𝑜 = 5.34N/mm². The quantity 𝑓𝑐𝑜 represents the
uniaxial compressive strength of a concrete cylinder under well-defined (laboratory) conditions.
The uncertainty in the in situ compressive strength 𝑓𝑐 of the shotcrete lining is very likely larger
than the uncertainty in 𝑓𝑐𝑜. Moreover, we assume that on average the in-situ 𝑓𝑐 will be smaller
than 𝑓𝑐𝑜 which is obtained in a controlled environment, due to the numerous factors that have
to be met in a laboratory experiment, but cannot always be controlled on-site. We express the

SOFiSTiK Seminar 2016, München Reliability Analysis of a Tunnel with RELY
W. Betz, I. Papaioannou, M. Eckl, H. Heidkamp, D. Straub
- 9 -
relation between 𝑓𝑐 and 𝑓𝑐𝑜 as 𝑓𝑐 = 𝑓𝑐𝑜 ∙ 𝑌𝑐, where 𝑌𝑐 is modeled as a lognormal random variable
that is independent from 𝑓𝑐𝑜 and has mean 0.8 and coefficient of variation 10%. As both 𝑓𝑐𝑜
and 𝑌𝑐 are lognormal, the distribution of 𝑓𝑐 is also lognormal with mean 𝜇𝑓𝑐 = 0.8 ∙ 33N/mm² =
26.4N/mm² and coefficient of variation 𝛿𝑓𝑐 = 19%. Note: The probabilistic description of 𝑓𝑐 is
mainly based on the recommendations given in the JCSS Probabilistic Model Code. During
construction, the quality of shotcrete is constantly verified on-site. This means that in practice,
the mean of 𝑌𝑐 is expected to be larger and the coefficient of variation smaller than assumed
in this investigation. This is not considered in the chosen distribution for 𝑌𝑐, and, therefore, the
probabilistic description of 𝑓𝑐 is conservative. By consulting an expert and/or assuring the
quality on site, the uncertainties in 𝑌𝑐 could be more appropriately quantified, and the
probabilistic description of 𝑌𝑐 could deviate from the recommendations given in the JCSS
Probabilistic Model Code.
Young’s modulus: The Young’s modulus of concrete is closely related to the compressive
strength of concrete. Eurocode 2 suggests to work with an average Young’s modulus 𝐸𝑐𝑚 that
is based on the average compressive strength 𝑓𝑐𝑚: 𝐸𝑐𝑚 = 11 ∙ 103 ∙ 𝑓𝑐𝑚0.3. A similar
relationship is employed in the JCSS Probabilistic Model Code to represent the uncertainties
in the Young’s modulus. We use a stochastic model to describe the Young’s modulus as a
random variable 𝐸𝑐 that is based on both Eurocode 2 and the JCSS Probabilistic Model Code:
𝐸𝑐 = 11 ∙ 103 ∙ 𝑓𝑐0.3 ∙ 𝑌𝐸, where 𝑌𝐸 is a random variable that expresses the conditional
uncertainty about 𝐸𝑐 if 𝑓𝑐 is known. We model 𝑌𝐸 as lognormal with mean 1.0 and coefficient of
variation 15%, as recommended in the JCSS Probabilistic Model Code. Note that in our
stochastic model, 𝐸𝑐 is not modeled directly, but is expressed as the product of the two random
variables 𝑓𝑐 and 𝑌𝐸. The marginal distribution of 𝐸𝑐 can be obtained analytically; it is lognormal
with mean 29 ∙ 103N/mm² and coefficient of variation 16%. Note: The early loading of the
tunnel lining causes its effective stiffness to be smaller than the chosen probabilistic model of
𝐸𝑐 suggests (Kusterle et al. 2014). This means that the mean of 𝑌𝐸 could in principle be reduced
– the coefficient of variation of 𝑌𝐸 would be increased in this case. However, it is difficult to
quantify the corresponding uncertainties, because the mechanical and chemical processes
that lead to such a reduced stiffness are complex and cannot be modelled in a straightforward
way. In the investigation at hand, this effect is not considered. As a larger stiffness of the tunnel
lining leads to larger internal forces, the applied probabilistic model for the Young’s modulus is
on the conservative side.
5.3 Limit-state function
We analyze failure of the shotcrete lining. We describe failure as the event that admissible
normal forces and bending moments are exceeded on at least one location of the shotcrete
lining. This means that the overall limit-state function can be expressed as the minimum of all
local limit-state functions – where local refers to a particular cross-section of the shotcrete
lining.
name group type mean CV
𝑓𝑐𝑜 concrete lognormal 33N/mm² 16%
𝑌𝑐 concrete lognormal 0.8 10%
𝑌𝐸 concrete lognormal 1.0 15%
𝛼 model beta 0.4 10%
𝑝ref,𝑖 soil lognormal 167 kN/m² 33%
𝑚𝑖 soil lognormal 0.47 11%
𝐾0,4, 𝐾0,7 soil lognormal 0.68 10%
𝐾0,5, 𝐾0,6 soil lognormal 0.49 13%
Table 3: List of basic random variables employed in the problem. The name, type, mean and coefficient of variation (CV) is listed for each random variable. Note that for 𝑝ref,𝑖 and 𝑚𝑖, 𝑖 = 1,… ,7; and for 𝐾0, 𝑖 = 4,… ,7. The
stochastic model contains a total number of 22 random variables.

SOFiSTiK Seminar 2016, München Reliability Analysis of a Tunnel with RELY
W. Betz, I. Papaioannou, M. Eckl, H. Heidkamp, D. Straub
- 10 -
At a particular cross-section we take the normal force 𝑁 and bending moment 𝑀 in the
shotcrete lining computed with the SOFiSTiK finite element model. We neglect that the
shotcrete lining in the tunnel is reinforced (this assumption is discussed in the next section)
and perform the structural analysis assuming the shotcrete lining as unreinforced. For the given
𝑁 and 𝑀 we compute the eccentricity 𝑒 of the normal force 𝑁 that generates bending moment
𝑀. For the obtained eccentricity 𝑒 we determine the maximum normal force 𝑁𝑅 that the cross-
section can withstand and compare it to 𝑁. If 𝑁𝑅 ≤ 𝑁, failure occurs. Consequently, the local
limit-state function of the corresponding cross-section can be expressed as 𝑔𝑙 = 𝑁𝑅 −𝑁.
In order to determine 𝑁𝑅 for a particular eccentricity 𝑒, the stress-strain curve of concrete is
required. The tensile strength of concrete is assumed to be zero. Furthermore, we assume that
the theory of Bernoulli applies (i.e., strains are linear over the cross-section). Thus, the normal
force that the cross-section can withstand is the integral of the compressive strength as a
function of strain according to the stress-strain curve over the compressed area of the cross-
section. The value of 𝑁𝑅 is obtained by selecting linear strains of the cross-section such that
the generated normal force is maximized for the given eccentricity 𝑒.
The selected shape of the stress-strain curve of concrete is of particular relevance in the
absence of safety factors. For example, the bi-linear stress-strain curve that can be applied
according to Eurocode 2 is only conservative as long as the factor of safety associated with
the allowable compressive strength is chosen large enough. For a factor of safety of one, the
bi-linear stress-strain curve does not give conservative values for 𝑁𝑅 compared to the non-
linear stress-strain curve suggested in section 3.1.5 of Eurocode 2. As a consequence, we
evaluate 𝑁𝑅 directly based on the mentioned non-linear stress-strain curve. Note that also the
relation 𝑁𝑅 = 𝑓𝑐 ∙ 𝑏 ∙ ℎ ∙ (1 − 2𝑒/ℎ) suggested in (Schikora and Thomée 2005) should only be
applied using design values for the compressive strength of concrete – and not with the actual
strength of concrete as required in reliability analysis.
The limit-state function is continuous but not differentiable, as the overall limit-state function
is taken as the minimum of all local limit-state functions, corresponding to each cross section
of the tunnel lining. For the problem at hand, the shotcrete lining is modeled using 164 beam
elements, and a single evaluation of the overall limit-state function requires evaluation of 328
local limit-state functions (i.e., for two cross-sections per beam element).
5.4 Modeling uncertainties
Any engineering model is only an imperfect representation of reality. For the assessed
problem, the main causes for modeling uncertainties include: 1) The employed two-
dimensional finite element model can only approximately represent three-dimensional effects.
2) The behavior of soil under different stress situations is a very complex problem that can only
be approximately represented by the employed material model. 3) The properties of soil are
subject to spatial variability. 4) The structural safety of the shotcrete lining is investigated for
the material properties of shotcrete after hardening. In reality, the shotcrete is not loaded
instantly, but gradually. In tunneling, this is a very complex process, as the shotcrete takes
already stresses when it is still hardening. 5) Creep and shrinkage of concrete are not
considered in the mechanical model. 6) It is not feasible to model all quantities that are subject
to uncertainty. Often only the parameters with the largest uncertainty and the largest impact
can be modeled stochastically. The influence of some quantities is actually readily neglected
in the engineering model (e.g., we usually model the structure at the macroscopic level and do
not explicitly consider what happens at smaller scales).
The relaxation factor 𝛼 is used to account for the missing three-dimensional effects in the
two-dimensional model. By considering the value of 𝛼 as uncertain, we can – at least partially
– account for modeling uncertainties. We model the relaxation factor 𝛼 as a beta distributed
random variable on the interval [0,1] that has a mean of 0.4 and coefficient of variation 10%.
In general, modeling uncertainties must be considered in the analysis (Eurocode 0).
However, we here choose to neglect them, because the modeling uncertainty (which leads to

SOFiSTiK Seminar 2016, München Reliability Analysis of a Tunnel with RELY
W. Betz, I. Papaioannou, M. Eckl, H. Heidkamp, D. Straub
- 11 -
an increased probability of failure) is smaller than the degree of conservativeness of the model
(which leads to a reduced probability of failure). Neglecting the former partially compensates
for the effect of the latter on the estimated reliability.
The model at hand is conservative in the following aspects: 1) Reinforcement in the
shotcrete lining is neglected in the limit-state function. 2) The limit-state function also neglects
that the concrete can actually take tensile stresses up to a certain amount. 3) Exceeding the
admissible moment for a given normal force does usually not lead to failure of the tunnel lining,
as assumed in the limit-state function. Instead, the tunnel lining has the potential to redistribute
bending moments and to form joints (Schikora and Thomée 2005). 4) The parameter 𝑓𝑐𝑜 that
models the stiffness of shotcrete was chosen conservatively (as is discussed in Section 5.2).
5) The chosen probabilistic model for the Young’s modulus of shotcrete is on the conservative
side (as is discussed in Section 5.2) – i.e., the internal forces in the shotcrete lining are on
average larger than to be expected in reality.
6 Reliability analysis of the tunnel
6.1 Representation of the stochastic model in RELY
In a first step, the random variables are defined in the input-file of RELY. This step is
illustrated in Fig. 5. The definition starts with the keyword VAR and is followed by the name of
the random variable. In the study at hand, only the lognormal distribution (LOGN) and the beta
distribution (BETA) are applied. However, the list of distribution types that are supported in
RELY is comprehensive (SOFiSTiK AG 2016). The random variables listed in Fig. 5 are
defined in terms of their mean (P1) and standard deviation (P2). For the beta distribution, the
upper and lower bound of the support of the random variable (P3 and P4) must be specified
as well.
Fig. 5: Definition of random variables in RELY.

SOFiSTiK Seminar 2016, München Reliability Analysis of a Tunnel with RELY
W. Betz, I. Papaioannou, M. Eckl, H. Heidkamp, D. Straub
- 12 -
Fig. 6: Definition of the correlation between the random variables defined in Fig. 5.
The definition of the correlation between the random variables is shown in Fig. 6. The
correlation between two random variables is specified using the keyword CORR followed by
the names of the two random variables and the corresponding correlation coefficient.
The coupling of the stochastic model in RELY to an existing finite element model is depicted
in Fig. 7. The actual coupling is done using the keyword PROJ. In Fig. 7, the SOFiSTiK finite
element model is defined in a dat-file that has name ‘tunnel_fem.dat’. At the end of the dat-file
‘tunnel_fem.dat’, the variable ‘rel_fun’ is stored in the SOFiSTiK database CDB. The variable
‘rel_fun’ contains the current value of the limit-state function that was evaluated based on the
results of the finite element analysis.
Finally, the reliability analysis can be started. To start a FORM analysis, the keyword FORM
is used.
Fig. 7: Coupling of RELY to an existing finite element model.
6.2 Comments on the employed reliability method: FORM
The efficiency of a reliability method is usually expressed in terms of the number of limit-
state function evaluations required to obtain an estimate for the probability of failure. The
number of limit-state function calls should ideally be small, as each time the limit-state function
is evaluated, a non-linear finite element analysis of the mechanical tunnel model must be
performed. The efficiency of FORM decreases with an increasing number of random variables
in the problem. The problem at hand consists of 22 random variables. For this number of
random variables, FORM is still efficient compared to other reliability methods. Based on the
design point computed with FORM, importance sampling based reliability methods can be
employed to improve the estimated probability of failure.
Besides the assessment of the reliability of the shotcrete lining, we also intend to identify
the random variables that have the largest influence on the probability of failure. This is another
reason why we employ FORM, as this method provides answers to both questions.
FORM solves a constrained optimization problem. Most optimization algorithms used in
combination with FORM require the limit-state function to be differentiable. The gradient of the
limit-state function is typically evaluated using a finite difference scheme. For the problem at
hand, the employed limit-state function is not differentiable for the following reasons: 1) The
limit-state function is expressed as the minimum of local limit-state functions. 2) The solution
of the non-linear finite element problem is subject to numerical noise. In principle, the numerical
noise of the finite element solver can be reduced, however, this would increase the
computational costs of evaluating the limit-state function. In some cases, convergence of the
optimization algorithm can be achieved for non-differentiable limit-state functions by increasing
the step size of the finite difference scheme.

SOFiSTiK Seminar 2016, München Reliability Analysis of a Tunnel with RELY
W. Betz, I. Papaioannou, M. Eckl, H. Heidkamp, D. Straub
- 13 -
6.3 Results of the reliability analysis
For the problem at hand, an approximate design point, reflecting the most probable
combination of parameters that will lead to failure, can be obtained. The coordinates of the
design point as well as the relative importance of the individual random variables are listed in
Table 4. Based on the obtained design point and a linearization of the limit-state function
around the design point, the reliability index of the tunnel section can be approximated as 4.6;
which corresponds to a probability of failure of 2 ⋅ 10−6. The computed reliability index fulfills
the demands for safety specified in Eurocode 0. However, the interpretation of the computed
reliability is not straightforward, as we investigated only a single section of the tunnel. For a
proper assessment of the reliability of the entire tunnel, different tunnel sections must be
investigated, to account for the variability of the soil layers and soil properties along the tunnel
axis.
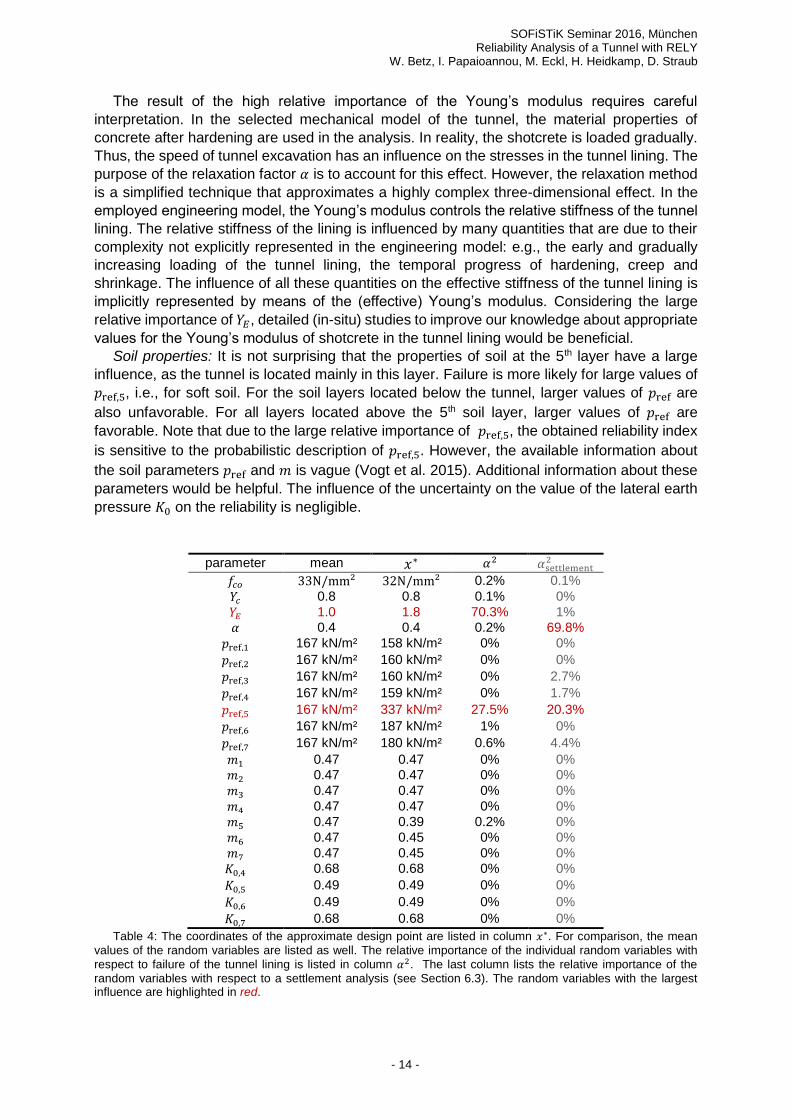
The results presented in Table 4 clearly indicate that the reliability is mainly influenced by
two random variables: 𝑌𝐸 and 𝑝ref,5. This means that the Young’s modulus of concrete (through
random variable 𝑌𝐸) and the soil properties of the 5th layer (through quantity 𝑝ref,5) have a large
influence on the analysis. These two quantities are discussed in the following.
Young’s modulus of concrete: The chosen probabilistic description of the Young’s modulus
of concrete has the largest impact on the reliability. The Young’s modulus 𝐸𝑐 depends on the
two random variables 𝑌𝐸 and 𝑓𝑐; i.e., 𝐸𝑐 = 11 ∙ 103 ∙ 𝑓𝑐0.3 ∙ 𝑌𝐸. The random variable 𝑓𝑐 is set to
the power of 0.3. The expectation and coefficient of variation of 𝑓𝑐0.3 are 2.66 and 5.7%,
respectively. Consequently, the uncertainty on 𝐸𝑐 (the coefficient of variation of 𝐸𝑐 is 𝛿𝐸𝑐 =
16%) is dominated by the uncertainty on 𝑌𝐸 (the coefficient of variation of 𝑌𝐸 is 𝛿𝑌𝐸 = 15%).
Therefore, the relative importance of 𝑌𝐸 is much larger than the importance of 𝑓𝑐 = 𝑓𝑐𝑜 ⋅ 𝑌𝑐.
Failure occurs for large values of 𝑌𝐸, because in the underlying mechanical model a stiffer
lining leads to larger internal forces in the lining. This effect is more pronounced than the
decrease of capacity due to a decrease in 𝑓𝑐.
Fig. 8: Relative importance of the stochastic model parameters with respect to the reliability of the tunnel lining.
SOFiSTiK Seminar 2016, München Reliability Analysis of a Tunnel with RELY
W. Betz, I. Papaioannou, M. Eckl, H. Heidkamp, D. Straub
- 14 -
The result of the high relative importance of the Young’s modulus requires careful
interpretation. In the selected mechanical model of the tunnel, the material properties of
concrete after hardening are used in the analysis. In reality, the shotcrete is loaded gradually.
Thus, the speed of tunnel excavation has an influence on the stresses in the tunnel lining. The
purpose of the relaxation factor 𝛼 is to account for this effect. However, the relaxation method
is a simplified technique that approximates a highly complex three-dimensional effect. In the
employed engineering model, the Young’s modulus controls the relative stiffness of the tunnel
lining. The relative stiffness of the lining is influenced by many quantities that are due to their
complexity not explicitly represented in the engineering model: e.g., the early and gradually
increasing loading of the tunnel lining, the temporal progress of hardening, creep and
shrinkage. The influence of all these quantities on the effective stiffness of the tunnel lining is
implicitly represented by means of the (effective) Young’s modulus. Considering the large
relative importance of 𝑌𝐸, detailed (in-situ) studies to improve our knowledge about appropriate
values for the Young’s modulus of shotcrete in the tunnel lining would be beneficial.
Soil properties: It is not surprising that the properties of soil at the 5th layer have a large
influence, as the tunnel is located mainly in this layer. Failure is more likely for large values of
𝑝ref,5, i.e., for soft soil. For the soil layers located below the tunnel, larger values of 𝑝ref are
also unfavorable. For all layers located above the 5th soil layer, larger values of 𝑝ref are
favorable. Note that due to the large relative importance of 𝑝ref,5, the obtained reliability index
is sensitive to the probabilistic description of 𝑝ref,5. However, the available information about
the soil parameters 𝑝ref and 𝑚 is vague (Vogt et al. 2015). Additional information about these
parameters would be helpful. The influence of the uncertainty on the value of the lateral earth
pressure 𝐾0 on the reliability is negligible.
parameter mean 𝑥∗ 𝛼2 𝛼settlement2
𝑓𝑐𝑜 33N/mm² 32N/mm² 0.2% 0.1%
𝑌𝑐 0.8 0.8 0.1% 0%
𝑌𝐸 1.0 1.8 70.3% 1%
𝛼 0.4 0.4 0.2% 69.8%
𝑝ref,1 167 kN/m² 158 kN/m² 0% 0%
𝑝ref,2 167 kN/m² 160 kN/m² 0% 0%
𝑝ref,3 167 kN/m² 160 kN/m² 0% 2.7%
𝑝ref,4 167 kN/m² 159 kN/m² 0% 1.7%
𝑝ref,5 167 kN/m² 337 kN/m² 27.5% 20.3%
𝑝ref,6 167 kN/m² 187 kN/m² 1% 0%
𝑝ref,7 167 kN/m² 180 kN/m² 0.6% 4.4%
𝑚1 0.47 0.47 0% 0%
𝑚2 0.47 0.47 0% 0%
𝑚3 0.47 0.47 0% 0%
𝑚4 0.47 0.47 0% 0%
𝑚5 0.47 0.39 0.2% 0%
𝑚6 0.47 0.45 0% 0%
𝑚7 0.47 0.45 0% 0%
𝐾0,4 0.68 0.68 0% 0%
𝐾0,5 0.49 0.49 0% 0%
𝐾0,6 0.49 0.49 0% 0%
𝐾0,7 0.68 0.68 0% 0%
Table 4: The coordinates of the approximate design point are listed in column 𝑥∗. For comparison, the mean
values of the random variables are listed as well. The relative importance of the individual random variables with
respect to failure of the tunnel lining is listed in column 𝛼2. The last column lists the relative importance of the
random variables with respect to a settlement analysis (see Section 6.3). The random variables with the largest influence are highlighted in red.

SOFiSTiK Seminar 2016, München Reliability Analysis of a Tunnel with RELY
W. Betz, I. Papaioannou, M. Eckl, H. Heidkamp, D. Straub
- 15 -
Fig. 9: Relative importance of the stochastic model parameters in a settlement analysis.
6.4 Settlement analysis
In a second study we assess the sensitivity of the stochastic model parameters with respect
to settlements at ground level. More precisely, we investigate vertical misalignment of the
existing structure depicted in Fig. 4. The system state is considered inadequate if the
inclination due to tunnel construction exceeds 1/300. The inclination of the existing structure is
evaluated using the vertical settlement at both ends of the structure. More advanced failure
scenarios are discussed in e.g. (Meschke 2014).
The sensitivities are computed by means of FORM. The relative importance of the random
variables is listed in the last column of Table 4 and depicted in Fig. 9. In this case, the two most
important random variables are 𝛼 and 𝑝ref,5. Contrary to the investigation of the tunnel lining,
the material properties of shotcrete are of minor relevance if ground settlements are
investigated. The parameter 𝑝ref,5 is equally important in both investigations.
The high importance of the relaxation factor 𝛼 indicates that the settlement analysis is
sensitive to changes of this parameter. A three-dimensional finite element model of the tunnel
could be beneficial, as it renders the relaxation factor 𝛼 redundant. However, note that the
parameter 𝛼 is used in the two-dimensional model to implicitly account for modeling errors
(compare Section 5.4). It is important to consider modeling errors also in a three dimensional
model.
7 Summary
Reliability analysis of engineering structures can help to better understand the behavior of
the employed mechanical model. By means of the first-order reliability method (FORM), one
can gain useful insights beyond the reliability index (or probability of failure). In particular,
FORM provides information on the sensitivity of the reliability to the input uncertainties, which
can help in improving the engineering model.
For the considered engineering project of a conventional driven tunnel, we show how to
apply the SOFiSTiK module RELY to perform reliability analysis. We mainly concentrate on
the reliability of the tunnel lining. FORM is used to approximate the reliability index of the
investigated tunnel section, and to determine the stochastic model parameters with the largest
influence on the tunnel’s reliability. In particular, the effective stiffness of shotcrete was found
to have a dominant impact on the reliability of the tunnel lining. Additional studies aimed at
improving our knowledge about the effective stiffness of the tunnel lining would be beneficial.

SOFiSTiK Seminar 2016, München Reliability Analysis of a Tunnel with RELY
W. Betz, I. Papaioannou, M. Eckl, H. Heidkamp, D. Straub
- 16 -
Literature
Au, S.K. and Beck, J.L.: Estimation of small failure probabilities in high dimensions by Subset Simulation. Probabilistic Engineering Mechanics, 16(4):263-277, 2001.
Bjerager, P.: Probability integration by directional simulation. Journal of Engineering Mechanics,
114(8):1285-1302, 1988.
Breitung, K.: Asymptotic approximations for multinormal integrals. Journal of Engineering Mechanics, 110(3):357-366, 1984.
Camόs C., Špačková O., Straub D., Molins C. (2016). Probabilistic approach to assessing and monitoring settlements caused by tunneling. Tunneling and Underground Space Technology,
51: 313–325
Ditlevsen, O. and Melchers, R.E. and Gluver, H.: General multi-dimensional probability integration by directional simulation. Computers & Structures, 36(2):355-368, 1990.
Eurocode 0: Basis of structural design (EN 1990)
Eurocode 2: Design of concrete structures (EN 1992)
Eurocode 3: Design of steel structures (EN 1993)
Vogt, N. and Fillibeck, J. and Barcatta, M.: Westtangente Freisung – Tunnelbautechnisches Gutachten. Zentrum Geotechnik, Technische Universität München, 2015.
Hasofer, A.M. and Lind, N.C.: An exact invariant first-order reliability format. Journal of the Engineering Mechanics Division ASCE, 100:111-121, 1974.
Hohenbichler, M. and Rackwitz R.: Improvement of second-order reliability estimates by importance sampling. Journal of Engineering Mechanics, 114(2):2195-2199, 1988.
JCSS Probabilistic Model Code, 2001.
Klüppelberg, C. and Straub, D. and Welpe, I.M.: Risk – A Multidisciplinary Introduction. Springer 2014.
Koutsourelakis, P.S. and Prandlwarter H.J. and Schueller G.I.: Reliability of structures in high dimensions, Part I: algorithms and applications. Probabilistic Engineering Mechanics, 19(4):409-417, 2004.
Kusterle, W. and Jäger, J. and John, M. and Neumann, C. and Röck, R.: Spritzbeton im Tunnelbau. Beton-Kalender 2014, 303-390, 2014.
Maidl, B.: Handbuch für Spritzbeton. Ernst & Sohn, 1992.
Meschke, G.: Numerische Simulation im Tunnelbau. Beton-Kalender 2014, 303-390, 2014.
Panet, M. and Guenot A.: Analysis of convergence behind the face of a tunnel. In Proc. International Conference on Tunneling, London, 1982.
Papaioannou I., Betz W., Zwirglmaier K., Straub D. (2015). MCMC Algorithms for Subset Simulation. Probabilistic Engineering Mechanics, 41: 89-103.
Rackwitz R.: Reliability analysis – a review and some perspectives. Structural safety, 23(4):365-395, 2001.
Rackwitz, R. and Flessler, B.: Structural reliability under combined random load sequences. Computers & Structures, 9(5):489-494, 1978.
Schikora, K. and Ostermeier, B.: Two-dimensional calculation model in tunnelling. Verification by measurement results and by spatial calculation. Proceedings of the 6th International Conference on Numerical Methods in Geomechanics, pp. 1499–1503, Innsbruck, 1988.
Schikora, K. and Thomée, B.: Bemessungskonzepte im Tunnelbau Spritzbeton – Stahlfaserbeton. Baustatik-Baupraxis 9, TU Dresden, 2005.
SOFiSTiK AG (2016): SOFiSTiK analysis programs version 2016. SOFiSTiK AG, Oberschleißheim,
2016
Straub D. (2015). Wahrscheinlichkeit, Zuverlässigkeit & Risiko - Eine Einführung für Ingenieure. Vorlesungsunterlagen, TU München.
Swoboda, G.: Finite Element Analysis of the New Austrian Tunnelling Method (NATM). Third International Conference on Numerical Methods in Geomechanics, 1979.