Release de Results 3T19...Hidrelétrica Itaocara S.A. Light S.A. (Holding) Lightger S.A. Amazônia...
50
Transcript of Release de Results 3T19...Hidrelétrica Itaocara S.A. Light S.A. (Holding) Lightger S.A. Amazônia...


1
Release de Results3T19
Rio de Janeiro, May 7, 2020.
Light reduces energy losses and secures trend of improved results at DisCo Financial Highlights
Consolidated EBITDA totaled R$466 million in 1Q20, representing a decrease of R$109 million, or 19%, compared to 1Q19. This decrease is primarily due to the results of the Generation Company as a result of the GSF, which was significantly less favorable in 1Q20 and resulted in lower sales of surplus energy in the quarter.
EBITDA of Light SESA, on its turn, increased by 4.3% in 1Q20 compared to 1Q19, primarily due to the decrease in energy losses and the reduction in PMS.
In 1Q20, consolidated net income totaled R$167 million, in line with R$164 million in 1Q19. We highlight the net income of the Distribution Company, which totaled R$62 million in 1Q20, compared to a net loss of R$25 million in 1Q19, due to the better financial result in the period, as a result of the gain from marked-to-market debt swap transactions.
PMSO, excluding the non-recurring expense of R$12.4 million under the Voluntary Dismissal Plan (Plano de Demissões Voluntárias) (VDP), launched in October 2019, increased by R$3 million compared to 1Q19. In 1Q20, consolidated PMS, excluding the VDP, decreased by 4.4%.
In 1Q20, PECLD totaled R$123 million (compared to R$73 million in 1Q19), accounting for 2.8% of the gross revenue (12 months). The
index increased by 0.9 p.p. compared to that recorded in December 2019, due to the progress of the customer regularization initiatives, as expected by the Company. At the end of 1Q20, Net Debt/EBITDA ratio was 3.06x, above the Net Debt/EBITDA ratio of 2.98x in 4Q19 and below the limit of 3.75x set forth as covenant in most debt agreements. At the end of March 2020, net debt totaled R$6,721 million.
At the end of 1Q20, consolidated cash totaled R$1,534 million, in view of debt in the amount of R$1,207 million maturing by the end of the year. In April, Light received R$105 million as transfer of sector funds, raised R$400 million in debentures and, in order to preserve its cash position, shareholders approved the retention of 2019 dividends, which shall be paid in coming years.
Operating Highlights
At the end of 1Q20, total loss on grid load (12 months) was 25.44%, representing a 0.6 p.p. decrease compared to 26.04% in December 2019. In 1Q20, total loss on grid load (12 months) amounted to 9,264 GWh, representing a 472 GWh decrease compared to 9,736 GWh in 4Q19. In 1Q20, excluding REN, total loss on grid load (12 months) was 26.09%, representing a 0.5 p.p. decrease compared to 4Q19.
The non-technical loss over low voltage market (12 months) closed 1Q20 at 50.25%, 1.8 p.p. lower than in December/19.
The grid load decreased by 9.1% compared to 1Q19, due to the decrease in temperature (Δ of -2.6°C), the decrease in losses and the reflexes of Covid-19, perceived in the second fortnight of March.
The billed market decreased by 6.7%, below the decrease in grid load, due to the decrease in losses.
In March 2020, Light reached a record result in quality of services provided, in line with the best and largest distribution companies in the country. In 1Q20, DEC (12 months) was 6.96 hours, representing a 10.4% decrease compared to 4Q19, while FEC (12 months) was 4.27x, in line with the result recorded in December 2019. Both indicators are below the limit stablished by ANEEL.
The 8.7% increase in the number of own employees is due to the strategy to insource labor related to activities to combat losses, emergencies and new connections.
1- Adjusted EBITDA is CVM EBITDA adjusted by equity income and other operating income (expenses). The Company adopted Adjusted EBITDA to conduct the analyses described in this document.
Operational Highlights 1Q20 1Q19% Change
1Q20/1Q19
Grid Load* (GWh) 9,855 10,841 -9.1%
Billed Market (GWh) 7,194 7,708 -6.7%
Sold Energy - Generation (MWm) 611 576 6.1%
Commercializated Energy - Com (MWm) 645 641 0.7%
Total Loss/Grid Load (12 months) 25.44% 24.49% 0.96 p.p.
DEC - Hours (12 Months) 6.96 8.09 -14.0%
FEC - Times (12 Months) 4.27 4.36 -2.1%
Number of own staff 5,246 4,825 8.7%
Number of outsourced staff 6,729 7,765 -13.3%
* Own Load + Use of Network
Financial Highlights (R$ MN) 1Q20 1Q19% Change
1Q20/1Q19
Net Revenue* 2,895 3,179 -8.9%
PMSO 241 225 7.1%
Adjusted EBITDA¹ 466 575 -19.0%
Net Income 167 164 1.5%
Net Debt/EBITDA - covenants (x) 3.06 3.70 -17.4%
PECLD/ROB 2.8% 2.1% 0.7 p.p.
CAPEX Light 182 164 11.2%
Net operating cash generation 208 154 35.2%* Does not consider construction revenue.

2
Release de Results 3T19
Disclaimer
Operating information and information relating to Management’s expectations on the future performance of the Company
have not been reviewed by the independent auditors. Forward-looking statements are subject to risks and uncertainties.
These statements are based on Management’s judgment and assumptions and information currently available to the
Company. Forward-looking statements include information about our current plans, opinions or expectations, as well as the
plans, opinions or expectations of the members of the Board of Directors and Board of Executive Officers of the Company.
Forward-looking statements and information also include information about potential or assumed results of operations, as
well as statements that are preceded or followed by, or include the terms “believe,” “may,” “will,” “continue,” “expect,”
“predict,” “intend,” “estimate” or similar words. Forward-looking statements and information are not an assurance of future
performance. They involve risks, uncertainties, and assumptions as they relate to future events and therefore are contingent
on circumstances which may or may not occur. Future results and the creation of shareholder value may differ significantly
from those expressed or suggested by forward-looking statements. Many of the factors that will determine these results
and amounts are beyond the control of or cannot be predicted by LIGHT S.A.
3
Release de Results 3T19
Table of Contents 1. Profile and Corporate Structure ........................................................................................................................................... 4
2. Material Events in the Period ............................................................................................................................................... 5
2.1 Change in Share Ownership ............................................................................................................................................ 5 2.2 Resignation of Member of the Board of Directors ......................................................................................................... 5 2.3 ANEEL defines the 2020 Tariff Adjustment for Light SESA.............................................................................................. 5 2.4 Election of the Corporate Management Officer ............................................................................................................. 7
3. Subsequent Events ............................................................................................................................................................... 7
3.1 Settlement of the 18th issuance of debentures of Light Sesa ......................................................................................... 7 3.2 Proof of claim regarding credits resulting from the exclusion of ICMS from the calculation basis of PIS/COFINS ........ 7 3.3 Intercompany loan from Light Energia to Light Sesa ...................................................................................................... 7 3.4 Change in share ownership............................................................................................................................................. 7 3.5 Fitch reaffirmed Light’s rating ......................................................................................................................................... 7 3.6 Annual and Extraordinary General Meeting and Extraordinary General Meeting ......................................................... 7
4. Impacts of COVID-19 ............................................................................................................................................................. 9
5. Light S.A. – Consolidated .................................................................................................................................................... 11
5.1. Consolidated Financial Performance ........................................................................................................................... 11 5.2. Consolidated Adjusted EBITDA .................................................................................................................................... 12 5.3. Consolidated Net Income ............................................................................................................................................ 13
6. Light SESA – Distribution ..................................................................................................................................................... 14
6.1. Operating Performance ............................................................................................................................................... 14 6.1.1. Market .................................................................................................................................................................. 14 6.1.2. Energy Balance ...................................................................................................................................................... 17 6.1.3. Energy Loss ........................................................................................................................................................... 18 6.1.4. Collection .............................................................................................................................................................. 21 6.1.5. Operating Quality ................................................................................................................................................. 22
6.2. Financial Performance of Light SESA ........................................................................................................................... 23 6.2.1. Net Revenue of Light SESA .................................................................................................................................... 23 6.2.2. Costs and Expenses of Light SESA ......................................................................................................................... 24 6.2.3. Variation Offset Account – CVA ............................................................................................................................ 26 6.2.4. Financial Result of Light SESA ............................................................................................................................... 26
7. Light Energia – Generation ................................................................................................................................................. 27
7.1. Operating Performance ............................................................................................................................................... 27 7.1.1. Energy Purchases and Sales .................................................................................................................................. 27 7.1.2. Level of Energy Contracted/Uncontracted (Light Energia + Light Com) ............................................................... 28
7.2. Financial Performance of Light Energia ....................................................................................................................... 29 7.2.1. Net Revenue, Costs and Expenses of Light Energia .............................................................................................. 29 7.2.2. Financial Result of Light Energia ........................................................................................................................... 30 7.2.3. Net Income (Loss) of Light Energia ....................................................................................................................... 30
8. Light Com – Trading ............................................................................................................................................................ 31
8.1. Operating Performance of Light Com .......................................................................................................................... 31 8.2. Financial Performance of Light Com ............................................................................................................................ 31
9. Indebtedness ...................................................................................................................................................................... 32
9.1. Light S.A. ...................................................................................................................................................................... 32 9.2. Debt Breakdown .......................................................................................................................................................... 35
10. Consolidated Investment .................................................................................................................................................. 36
11. Capital Markets ................................................................................................................................................................. 37
ANNEX I – Generation Assets .................................................................................................................................................. 37
ANNEX II – CVM EBITDA Reconciliation .................................................................................................................................. 39
ANNEX III – Income Statement ............................................................................................................................................... 40
ANNEX IV – Statement of Financial Result .............................................................................................................................. 42
ANNEX V – Statement of Financial Position............................................................................................................................ 43
ANNEX VI – Statement of Cash Flows ..................................................................................................................................... 46
4
Release de Results 3T19
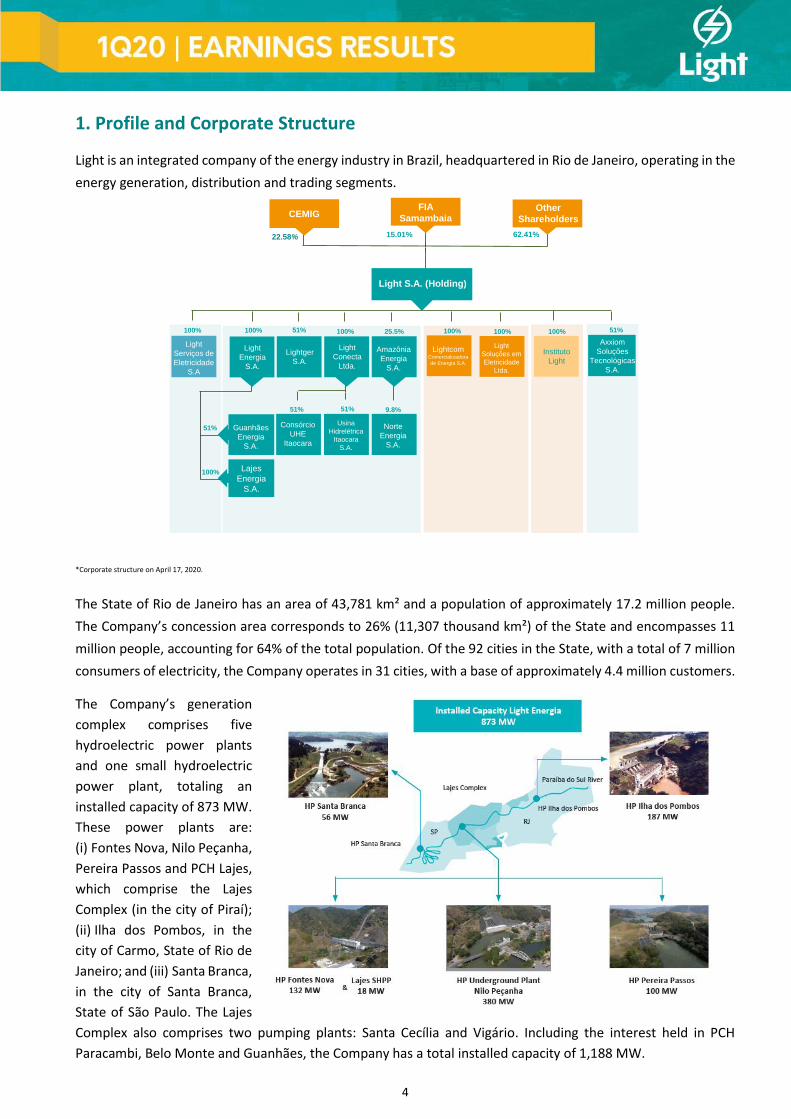
1. Profile and Corporate Structure
Light is an integrated company of the energy industry in Brazil, headquartered in Rio de Janeiro, operating in the
energy generation, distribution and trading segments.
*Corporate structure on April 17, 2020.
The State of Rio de Janeiro has an area of 43,781 km² and a population of approximately 17.2 million people.
The Company’s concession area corresponds to 26% (11,307 thousand km²) of the State and encompasses 11
million people, accounting for 64% of the total population. Of the 92 cities in the State, with a total of 7 million
consumers of electricity, the Company operates in 31 cities, with a base of approximately 4.4 million customers.
The Company’s generation
complex comprises five
hydroelectric power plants
and one small hydroelectric
power plant, totaling an
installed capacity of 873 MW.
These power plants are:
(i) Fontes Nova, Nilo Peçanha,
Pereira Passos and PCH Lajes,
which comprise the Lajes
Complex (in the city of Piraí);
(ii) Ilha dos Pombos, in the
city of Carmo, State of Rio de
Janeiro; and (iii) Santa Branca,
in the city of Santa Branca,
State of São Paulo. The Lajes
Complex also comprises two pumping plants: Santa Cecília and Vigário. Including the interest held in PCH
Paracambi, Belo Monte and Guanhães, the Company has a total installed capacity of 1,188 MW.
Instituto
Light
51%
Lajes
Energia
S.A.
51% 9.8%
100%
Guanhães
Energia
S.A.
Consórcio
UHE
Itaocara
Norte
Energia
S.A.
100% 100% 100% 51%100%
51%
Axxiom
Soluções
Tecnológicas
S.A.
LightcomComercializadora
de Energia S.A.
Light
Soluções em
Eletricidade
Ltda.
Light
Serviços de
Eletricidade
S.A
Usina
Hidrelétrica
Itaocara
S.A.
Light S.A. (Holding)
Lightger
S.A.
Amazônia
Energia
S.A.
Light
Energia
S.A.
Light
Conecta
Ltda.
100% 100%51% 25.5%
FIA
SamambaiaOther
Shareholders
15.01% 62.41%
CEMIG
22.58%

5
Release de Results 3T19
2. Material Events in the Period
2.1 Change in Share Ownership
On January 15, BNDESPAR informed that, from December 26, 2019 to January 15, 2020, it sold all common
shares it held in the capital stock of the Company and, therefore, is no longer a shareholder.
On January 16, FIA Samambaia informed that it became the holder of 22,730,000 common shares, representing
7.48% of the capital stock of Light and, on January 27, it informed that it increased its equity interest to 10.17%.
2.2 Resignation of Member of the Board of Directors
On February 11, Mr. Ivan Monteiro resigned as member of the Board of Directors.
2.3 ANEEL defines the 2020 Tariff Adjustment for Light SESA
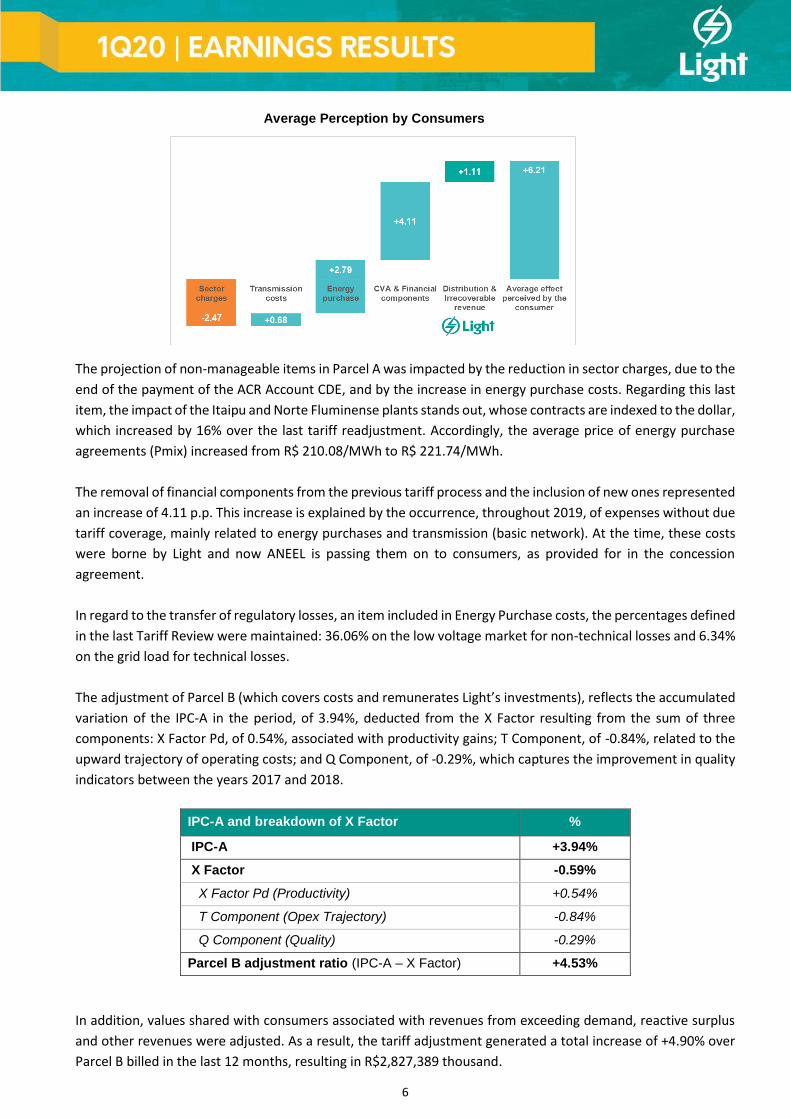
On March 10, ANEEL approved the tariff adjustment for Light SESA, with an average effect of +6.21%. The new
tariffs take effect as of March 15, 2020.
Residential consumers perceived a 5.91% increase, as set forth in the table below, which also shows the impact
to be perceived by other classes and voltage levels.
Average Perception by Consumers
FREE + CAPTIVE
AVERAGE
EFFECT
Gro
up
A
A2 (88 to 138kV)
7.11%
A4 (2.3 to 25kV)
6.53%
AS (Subterranean)
7.46%
Lo
w V
olt
ag
e B1 (Residential)
5.91%
B2 (Rural)
14.35%
B3 (Commercial)
6.05%
B4 (Public Illumination)
5.99%
Group A
6.73%
Low Voltage
5.98%
Group A + LV
6.21%
The annual tariff adjustment process consists of passing on to consumers the non-manageable costs of the
concession (Parcel A: energy purchase costs, sector charges and transmission charges), and updating the
manageable costs (Parcel B) according to the IPC-A fluctuation, adjusted by the X Factor components, which
passes on to consumers the annual productivity gains of the company and the adjustments in operating costs
defined in the last Tariff Review, in addition to incorporating quality improvement incentive mechanisms.
The chart below summarizes the share of each cost item in the average effect perceived by consumers.
6
Release de Results 3T19
Average Perception by Consumers
The projection of non-manageable items in Parcel A was impacted by the reduction in sector charges, due to the
end of the payment of the ACR Account CDE, and by the increase in energy purchase costs. Regarding this last
item, the impact of the Itaipu and Norte Fluminense plants stands out, whose contracts are indexed to the dollar,
which increased by 16% over the last tariff readjustment. Accordingly, the average price of energy purchase
agreements (Pmix) increased from R$ 210.08/MWh to R$ 221.74/MWh.
The removal of financial components from the previous tariff process and the inclusion of new ones represented
an increase of 4.11 p.p. This increase is explained by the occurrence, throughout 2019, of expenses without due
tariff coverage, mainly related to energy purchases and transmission (basic network). At the time, these costs
were borne by Light and now ANEEL is passing them on to consumers, as provided for in the concession
agreement.
In regard to the transfer of regulatory losses, an item included in Energy Purchase costs, the percentages defined
in the last Tariff Review were maintained: 36.06% on the low voltage market for non-technical losses and 6.34%
on the grid load for technical losses.
The adjustment of Parcel B (which covers costs and remunerates Light’s investments), reflects the accumulated
variation of the IPC-A in the period, of 3.94%, deducted from the X Factor resulting from the sum of three
components: X Factor Pd, of 0.54%, associated with productivity gains; T Component, of -0.84%, related to the
upward trajectory of operating costs; and Q Component, of -0.29%, which captures the improvement in quality
indicators between the years 2017 and 2018.
IPC-A and breakdown of X Factor %
IPC-A +3.94%
X Factor -0.59%
X Factor Pd (Productivity) +0.54%
T Component (Opex Trajectory) -0.84%
Q Component (Quality) -0.29%
Parcel B adjustment ratio (IPC-A – X Factor) +4.53%
In addition, values shared with consumers associated with revenues from exceeding demand, reactive surplus
and other revenues were adjusted. As a result, the tariff adjustment generated a total increase of +4.90% over
Parcel B billed in the last 12 months, resulting in R$2,827,389 thousand.

7
Release de Results 3T19
2.4 Election of the Corporate Management Officer
On March 17, Mrs. Déborah Brasil was elected Corporate Management Officer, replacing Mr. Claudio Moraes.
Mrs. Déborah is a lawyer graduated from UERJ, with a post-graduation degree from IBMEC and an MBA from FGV.
In recent years, she held the position of General Counsel of the Distribution Companies of the Enel Group, as well as
other positions in the Enel Group in Brazil. Previously, she worked at Grupo Globo, Oi and Net/Claro.
3. Subsequent Events
3.1 Settlement of the 18th issuance of debentures of Light Sesa
On April 15, the 18th issuance of debentures of Light Sesa was settled, in the total amount of R$400 million.
The debentures accrue interest at the CDI rate + 2.51% p.a. and mature within one year. The proceeds will be
used to reinforce the working capital of Light Sesa.
3.2 Proof of claim regarding credits resulting from the exclusion of ICMS from the calculation
basis of PIS/COFINS On April 9, the Brazilian Revenue Office accepted the proof of claim regarding tax credits confirmed by the
final and unappealable judgement rendered in the lawsuit that sought the exclusion ICMS from the calculation
basis of PIS/COFINS, which amount to approximately R$6 billion, adjusted for inflation. This was the last step
pending for Light to begin using these tax credits to offset federal taxes payable.
3.3 Intercompany loan from Light Energia to Light Sesa On April 14, ANEEL approved the request for a loan between Light Energia and Light Sesa, in the amount of up
to R$500 million, maturing in 24 months. The proceeds will be used to reinforce the working capital of Light
Sesa. On May 4, Light Energia granted the loan to Light Sesa, in the amount of R$500 million.
3.4 Change in share ownership
On April 17, FIA Samambaia informed that it became the holder of 45,621,300 common shares of Light (15.01%).
3.5 Fitch reaffirmed Light’s rating
On April 24, rating agency Fitch Ratings reaffirmed Light’s rating of A+ (bra), on the national scale, and BB-, on
the international scale, changing both ratings from a stable outlook to a negative outlook.
3.6 Annual and Extraordinary General Meeting and Extraordinary General Meeting
On April 28, Light held a shareholders’ meeting that approved the financial statements for 2019; the use of the
result for 2019, which will be retained in a special reserve for subsequent distribution; the installation of the
Fiscal Council, with the reelection of sitting members and alternates; and the determination of the annual global
compensation of members of management for 2020. This shareholders’ meeting also approved the election of
Mr. Hélio Paulo Ferraz as member of the Board of Directors, replacing Mr. Ivan Monteiro, who resigned on
February 11. Accordingly, the Board of Directors of the Company currently has the following composition:
David Zylbersztajn, Chairman Independent Member
Carlos Marcio Ferreira, Vice- Chairman
Independent Member

8
Release de Results 3T19
Antonio Rodrigues dos Santos e Junqueira Member
Carlos Alberto da Cruz
Member
Carlos da Costa Parcias Júnior Independent Member
Helio Paulo Ferraz
Independent Member
Octávio Cortes Pereira Lopes Independent Member
Patrícia Gracindo Marques de Assis Bentes
Independent Member
Ricardo Reisen de Pinho Independent Member
On the same day, another meeting was held, which approved the amendment to the Bylaws of the Company.
Accordingly, the officers now coordinate and manage the processes related to the following areas:
NAME / STATUTORY POSITION AREAS OF OPERATION
Ana Marta Horta Veloso
Chief Executive Officer and
Investor Relations Officer
Investor Relations
Regulation
Human Resources
Internal Audit, Compliance and Corporate Risks
Institutional Relations / Communication
Corporate Governance
Ombudsman
Roberto Caixeta Barroso
Officer
Finance
Supplies / Equity
Information Technology
Déborah Meirelles Rosa Brasil
Officer Legal
Alessandra Genu Dutra Amaral
Officer Energy and Commercialization
Dalmer Alves de Souza
Officer Planning of Distribution
Marcus Auguste Pimenta
Officer Operation of Distribution

9
Release de Results 3T19
4. Impacts of COVID-19
Considering the progress of the Covid-19 pandemic and the key nature of the services provided by Light, we
adopted certain measures to ensure the continuity of the services we provide to society, while ensuring the
wellbeing and health of our employees and customers.
On March 12, we implemented a crisis committee comprised of representatives of a number of areas of the
Company to monitor the progress of the pandemic and assist our management in making decisions that ensure
the provision of a quality service, protecting the physical integrity of employees and customers.
The main initiatives include the implementation of home office for all administrative teams, the granting of leave
and medical assistance to individuals included in risk groups, the offer of hand sanitizers in all buildings and
vehicles, the distribution of face masks, the taking of temperature of employees and public in general that enter
the company’s facilities and the anticipation of the H1N1 vaccination campaign.
In addition to these measures, we have prioritized requests made by hospitals, either for new energy
connections or increase in load/demand. We are anticipating the needs of these customers and providing
flexible procedures, as these requests must be met as soon as possible.
The recommendation of social isolation made by the governments of the city and state of Rio de Janeiro, at the
end of March, in order to reduce contamination by the new coronavirus, decreased the demand for energy in
Light’s concession area, mainly in commercial retail activities and electro-intensive industry.
On March 24, Aneel approved measures to ensure the provision of services of distribution of energy, including
the prohibition to suspend supply due to non-payment by urban and rural residential consumers (including low-
income consumers), in addition to key services and activities (for example, hospitals). This measure does not
prohibit the collection of overdue bills, including the inclusion of defaulting consumers in credit bureau lists.
Aneel also allowed the temporary suspension of in-person customer service. Accordingly, Light interrupted
customer service at its commercial agencies, directing customers to its digital channels, including Agência
Virtual, WhatsApp, Facebook and Twitter.
On April 8, also in the regulatory context, Presidential Provisional Decree (Medida Provisória) No. 950 was
enacted, providing for the allocation of funds from the Brazilian National Treasury to a sector fund to subsidize
low-income consumers with a maximum consumption of up to 220 kWh by the end of June. This Decree also
provides for the discussion of measures that may ensure the economic and financial equilibrium of distribution
companies, which is currently handled by ANEEL, the Ministry of Mines and Energy and the Ministry of Economy.
Also in April, in order to reinforce the cash of distribution companies, Aneel released more than R$1.5 billion in
sector funds, and Light received approximately R$105 million.
Additionally, the Company took action to strengthen its cash. Light SESA issued R$400 million in debentures in
April and received R$500 million under an intercompany loan granted by Light Energia in May.

10
Release de Results 3T19
Main operating impacts recorded in April as a result of Covid-19
April’ 20 figures are preliminary and unaudited
Social Responsibility Actions
In view of the impacts of the Covid-19 pandemic and aware of the demands of society, Light has been taking a
number of actions focused on health and the needs of the population.
We highlight the donation of R$1.5 million to the emergency fund of Fiocruz to support the production and
purchase of rapid test kits to diagnose Covid-19––an initiative taken together with other companies of the
energy sector, and the free supply of energy to the field hospital located in the neighborhood of Leblon, in the
city of Rio de Janeiro, which will have a total of 200 beds.
We also donated 300,000 hygiene items to the communities in which we operate.
Moreover, we intensified communication actions through advertisement, social networks and the press to get
even closer to society, informing about the important role played by the company and the initiatives in the
current context.
In view of the suspension of activities of Centro Cultural Light, we redirected the educational program to digital
channels, providing information and entertainment to children and families during times of social isolation.
Apr’ 20 Apr’ 19 % Change
Grid Load(GWh) 2,632 3,292 -20.1%
Billed Market (GWh) 1,996 2,347 -15.0%
Collection (%) 92.0% 100.3% -8.30 p.p.

11
Release de Results 3T19
5. Light S.A. – Consolidated
5.1. Consolidated Financial Performance
Note: excludes Construction Revenue/Expenses.
* Adjusted EBITDA is calculated as net income before income tax and social contribution, equity income, other operating income
(expenses), financial result, depreciation and amortization.
Income Statement (R$ MN) 1Q20 1Q19 Var. %
Gross Operating Revenue 4,780 5,414 -11.7%
Deductions (1,885) (2,236) -15.7%
Net Operating Revenue 2,895 3,179 -8.9%
Operating Expense (2,579) (2,750) -6.2%
PMSO (241) (225) 7.1%
Personnel (123) (106) 16.4%
Material (7) (6) 6.6%
Outsourced Services (117) (133) -12.1%
Others 5 20 -73.4%
Purchased Energy (1,993) (2,230) -10.6%
Depreciation (149) (146) 2.1%
Provisions (72) (76) -5.1%
PECLD (123) (73) 68.8%
Adjusted EBITDA* 466 575 -19.0%
Financial Result (56) (191) -70.6%
Other Operating Income / Expenses (5) (5) 2.9%
Result Before Taxes and Interest 256 233 9.5%
Social Contributions and Income Tax (6) (89) -92.7%
Deferred Income Tax (80) 10 -
Equity Income (2) 9 -
Net Income 167 164 1.5%

12
Release de Results 3T19
5.2. Consolidated Adjusted EBITDA4
In 1Q20, consolidated EBITDA totaled R$466 million, representing a 19% decrease compared to 1Q19, due to
the decrease in EBITDA of the Generation Company, as a result of GSF, which was significantly less favorable in
1Q20 and resulted in lower sales of surplus energy in the quarter.
On its turn, EBITDA of the distribution company increased by 4.3%, due to the decrease in energy losses and
PMS in 1Q20, maintaining the downward trend of previous quarters. In 1Q20, the energy loss disallowances
decreased by R$51.2 million compared to that of 1Q19.
Consolidated Adjusted EBITDA
1Q19 / 1Q20 – R$ MN
4 Adjusted EBITDA is calculated as net income before income tax and social contribution, equity income, other operating income (expenses), net financial result, depreciation
and amortization.
575466
-284 237
-16-46
0
100
200
300
400
500
600
700
800
900
1000
Adjusted EBITDA 1Q19 Net Revenue Non ManageableExpenses
Manageable Expenses(PMSO)
Provisions Adjusted EBITDA 1Q20
Consolidated EBITDA by Segment (R$ MN) 1Q20 1Q19% Change
1Q20/1Q19
Distribution 307 295 4.3%
Generation 138 231 -40.1%
Trading 25 52 -51.8%
Others and eliminations (5) (2) 138.2%
Total 466 575 -19.0%
EBITDA Margin (%) 16.1% 18.1% -2.00 p.p.

13
Release de Results 3T19
5.3. Consolidated Net Income
In 1Q20, consolidated net income totaled R$167 million, in line with R$164 million in 1Q19. We highlight the net
income of the distribution company, which totaled R$62 million, compared to a net loss of R$25 million in 1Q19,
due to the better financial result in the period, as a result of the gain from marked-to-market debt swap
transactions in foreign currency.
Consolidated Net Income
1Q19 / 1Q20 – R$ MN
Consolidated Net Income/Loss by Segment (R$ MN) 1Q20 1Q19% Change
1Q20/1Q19
Distribution 62 (25) -
Generation 93 151 -38.3%
Trading 17 37 -54.1%
Others and eliminations (6) 0 -
Total 167 164 1.5%
Net Margin (%) 5.8% 5.2% 0.59 p.p.
164 167
-109
135
-8 -3-11
1Q19 Result Adjusted EBITDA Financial Result Taxes Depreciation Equity Income 1Q20 Result

14
Release de Results 3T19
6. Light SESA – Distribution
6.1. Operating Performance
The increase in the number of employees is due to the insourcing strategy, primarily regarding activities to
combat losses, emergencies and new connections. The objective of insourcing is to obtain productivity gains and
allow a better ethical control and management of field teams.
The 6.0% increase in average energy purchase agreement expenses is due to increased payments related to
availability agreements and the appreciation of the U.S. dollar exchange rate. However, average energy
purchase expenses (which do not include hydrological risk) decreased by 4.4% compared to 1Q19, due to the
decrease in PLD and load in the period.
6.1.1. Market
Temperature (C°)
(Billing View)
Operating Highlights 1Q20 1Q19% Change
1Q20/1Q19
Nº of Consumers (thousand) 4,420 4,428 -0.2%
Nº of Employees 5,010 4,575 9.5%
Average tariff* - R$/MWh 821 786 4.5%
Average tariff* - R$/MWh (w/out taxes) 581 525 10.7%
Average bilateral contracts cost** - R$/MWh 224 211 6.0%
Average energy purchase cost with Spot*** - R$/MWh 230 240 -4.4%¹ Considers the number of active contracts
² Captive market and free market
* Does not include purchase in the spot market and hydrological risk
**Does not include hydrological risk
28.425.0
22.024.5 25.8
28.1
24.5
21.8
24.8
27.5
1Q19 2Q19 3Q19 4Q19 1Q20
Average Historical average (last 4 years)

15
Release de Results 3T19
Billed Market (GWh)
1Q20
Energy Market
1Q20
In 1Q20, the total energy market amounted to 7,194 GWh, representing a 6.7% decrease compared to 1Q19,
primarily due to the lower average temperature recorded in 1Q20 (Δ -2.6°C). The energy market decreased in
the second fortnight of March, mainly in commercial retail activities and energy-intensive industry. Light’s
market is highly sensitive to variations in temperature, especially during summer months, when high average
temperatures require an increased use of cooling devices, increasing the consumption of certain home
appliances, including refrigerators and freezers.
In 1Q20, the consumption of the Residential segment totaled 2,353 GWh, representing a 9.1% decrease
compared to 1Q19, primarily due to the decrease in average temperature in the quarter, which was partially
offset by activities of formalization and incorporation of energy of customers that had their energy supply cut,
which activities were initiated in 4Q19.
In 1Q20, the consumption of the Commercial segment, including captive and free customers, decreased by 7.2%
compared to 1Q19, due to the lower temperature and the impacts of Covid-19 in the second fortnight of March.
2,587 2,353 1,558 1,397
158 129 943 835
5,247 4,713
624 628
1,127 1,176 95 130
1,846 1,935
616 546
2,587 2,353 2,182 2,025
1,285 1,305 1,038 965
616 546
7,708 7,194
1Q19 1Q20 1Q19 1Q20 1Q19 1Q20 1Q19 1Q20 1Q19 1Q20 1Q19 1Q20
Residential Commercial Industrial Others Concessionaires Total
Total Billed Market (GWh)
Captive Free Concessionaires
-7,2%-9.1%
+1.5%-7.0%
-6.7%
-11.4%
32.7%
28.1%
18.1%
7.6%
13.4%
Residential
Industrial
Commercial
Others
Concessionaires

16
Release de Results 3T19
In 1Q20, the consumption of the Industrial segment increased by 1.5%, compared to 1Q19, primarily due to the
11.3% increase in consumption of the steel sector. In the second fortnight of March, the consumption of the
Industrial segment decreased by 4% compared to the first weeks of March.
In 1Q20, the consumption of the Others segment decreased by 7.0% due to the same factors that affected the
Commercial segment.
At the end of 1Q20, the free market accounted for 26.9% of the total market of the distribution company. The
migration of captive customers to the free market does not affect the Company’s margin, as energy continues
to be transported by the Company, which receives TUSD. In 1Q20, the number of free customers increased by
47 compared to December 2019, totaling 1,018 customers at the end of 1Q20.

17
Release de Results 3T19
6.1.2. Energy Balance
Energy Distribution Balance (GWh)
1Q20
1.3%
100 2,353
15.3% Captive Billed Industrial
Energy 129
1,147 4,713
Commercial
36.6% 7,375 1,397
Total
2,748 7,506 Losses Others
2,661 835
21.1%
1,583
-0.5%
-35
23.3%
1,748
2.9%
215
(*) Others = Purchases in Spot - Sales in Spot.
COTAS
ANGRA I & II
NORTE FLU
(CCEE)
Basic netw. Losses
(**)
OTHERS(*)
(CCEE)131
PROINFAResidential
ITAIPU
(CCEE)
Own load
Light
AUCTIONS
(CCEE)Required E.
(CCEE)
Energy Balance (GWh) 1Q20 1Q19% Change
1Q20/1Q19
= Grid Load 9,855 10,841 -9.1%
- Energy transported to utilities 546 616 -11.4%
- Energy transported to free customers 1,935 1,846 4.8%
= Own Load 7,375 8,380 -12.0%
- Billed Energy (Captive Market) 4,713 5,247 -10.2%
Low Voltage Market 3,675 3,998 -8.1%
Medium and High Voltage Market 1,038 1,249 -16.9%
= Total Loss 2,661 3,134 -15.1%
18
Release de Results 3T19
6.1.3. Energy Loss
Changes in Total Losses
12 months
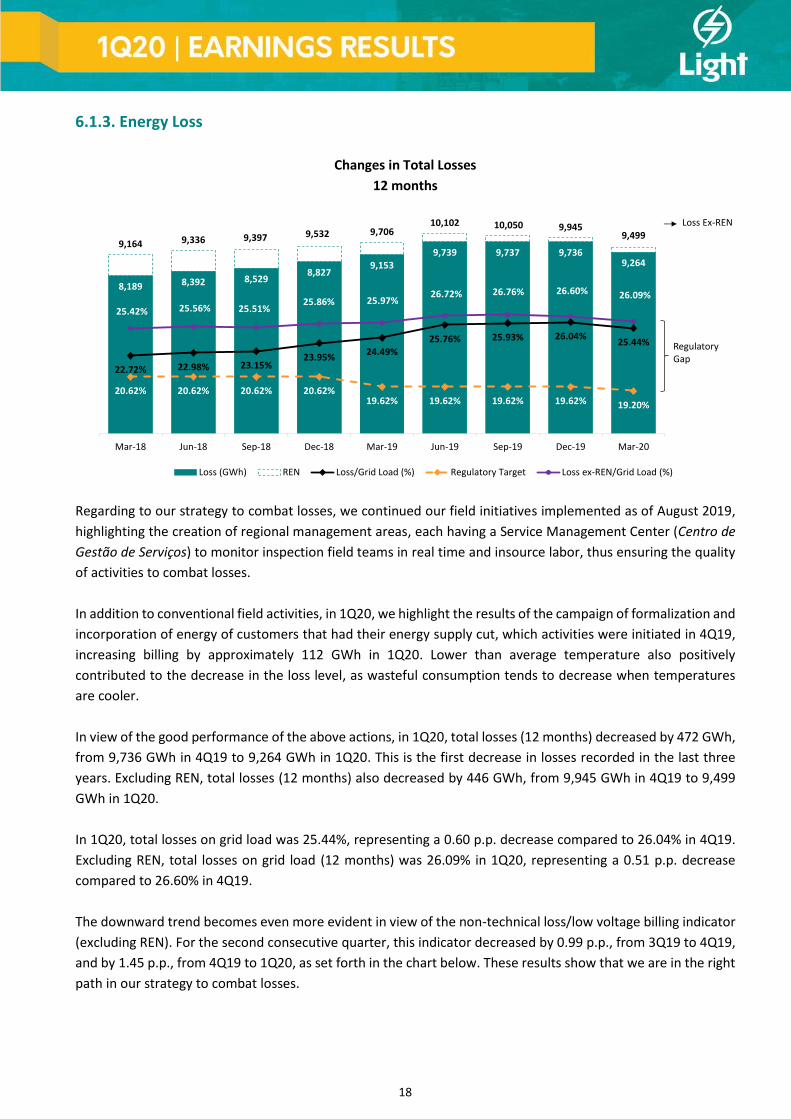
Regarding to our strategy to combat losses, we continued our field initiatives implemented as of August 2019,
highlighting the creation of regional management areas, each having a Service Management Center (Centro de
Gestão de Serviços) to monitor inspection field teams in real time and insource labor, thus ensuring the quality
of activities to combat losses.
In addition to conventional field activities, in 1Q20, we highlight the results of the campaign of formalization and
incorporation of energy of customers that had their energy supply cut, which activities were initiated in 4Q19,
increasing billing by approximately 112 GWh in 1Q20. Lower than average temperature also positively
contributed to the decrease in the loss level, as wasteful consumption tends to decrease when temperatures
are cooler.
In view of the good performance of the above actions, in 1Q20, total losses (12 months) decreased by 472 GWh,
from 9,736 GWh in 4Q19 to 9,264 GWh in 1Q20. This is the first decrease in losses recorded in the last three
years. Excluding REN, total losses (12 months) also decreased by 446 GWh, from 9,945 GWh in 4Q19 to 9,499
GWh in 1Q20.
In 1Q20, total losses on grid load was 25.44%, representing a 0.60 p.p. decrease compared to 26.04% in 4Q19.
Excluding REN, total losses on grid load (12 months) was 26.09% in 1Q20, representing a 0.51 p.p. decrease
compared to 26.60% in 4Q19.
The downward trend becomes even more evident in view of the non-technical loss/low voltage billing indicator
(excluding REN). For the second consecutive quarter, this indicator decreased by 0.99 p.p., from 3Q19 to 4Q19,
and by 1.45 p.p., from 4Q19 to 1Q20, as set forth in the chart below. These results show that we are in the right
path in our strategy to combat losses.
8,189 8,392 8,5298,827
9,1539,739 9,737 9,736
9,264
9,164 9,336 9,397 9,532 9,70610,102 10,050 9,945
9,499
22.72% 22.98% 23.15%23.95%
24.49%25.76% 25.93% 26.04%
25.44%
20.62% 20.62% 20.62% 20.62%19.62% 19.62% 19.62% 19.62% 19.20%
25.42% 25.56% 25.51%25.86% 25.97%
26.72% 26.76% 26.60% 26.09%
Mar-18 Jun-18 Sep-18 Dec-18 Mar-19 Jun-19 Sep-19 Dec-19 Mar-20
Loss (GWh) REN Loss/Grid Load (%) Regulatory Target Loss ex-REN/Grid Load (%)
Loss Ex-REN
RegulatoryGap

19
Release de Results 3T19
Changes in non-technical losses5/low voltage market
12 months
Currently, the Company is 6.24 p.p. above the percentage of regulatory transfer to tariffs, of 19.20%6, pursuant
to the parameters established by Aneel in the Periodic Tariff Adjustment (RTP) of March 2017, adjusted by the
reference market for the next 12 months and ratified by Aneel at the time of the tariff adjustment (IRT) in March
2020. In 2019, the Company was 0.42 p.p. below the regulatory level, due to the retraction of the low voltage
market in the 2020 IRT.
In 1Q20, IEN totaled 142 GWh, representing an increase of 121 GWh compared to 1Q19. This increase is in line
with the main pillar of the current plan to combat losses, which is the focus of the incorporation of energy. In
1Q20, the volume of REN (12 months), on its turn, increased by 12.4% compared to 4Q19, totaling 235 GWh,
due to the actions described above.
5 In 1Q20, we reviewed technical losses for 2019, as a result of the change in the calculation assumption related to the distribution of energy in the circuits of the concessionaire.
6 Calculated based on loss pass-through levels established by ANEEL in the 4th Periodic Tariff Revision (4th RTP), ratified on March 15, 2017 for the 2017-2022 period, as follows: 6.34% for technical losses on the grid load and 36.06% for non-technical losses on the low voltage market. These percentages may vary during the cycle due to the performance of the low voltage market and the grid load.
5,773 5,895 5,9656,212
6,517
7,048 7,084 7,0856,682
6,749 6,838 6,8326,917 7,070
7,412 7,396 7,2956,918
41.47%42.06% 42.62%
45.18%46.90%
51.25%51.86% 52.05%
50.25%
36.06% 36.06% 36.06% 36.06% 36.06% 36.06% 36.06% 36.06% 36.06%
52.13% 52.27% 52.00% 52.96%
52.92%55.30% 55.36% 54.37%
52.92%
Mar-18 Jun-18 Sep-18 Dec-18 Mar-19 Jun-19 Sep-19 Dec-19 Mar-20
REN Non-Techinical Loss (GWh)
Non-Techinical Loss/Low Voltage Market % Regulatory Target
Non-Techinical Loss/Low Voltage Market ex-REN ( %)
Non-Techinical Loss Ex-REN

20
Release de Results 3T19
Changes in IEN and REN in the Quarter and in the Last 12 Months (GWh) and Number of TOIs (thousands)
*Refers to invoicing cancelations imposed by court decisions.
In 1Q20, the installation of all border meters in risk areas was completed, providing increased strength to data.
At the end of 1Q20, non-technical losses (12 months) in risk areas remained virtually stable in GWh, at 4,088
GWh. However, non-technical losses in risk areas now account for 61% of all non-technical losses due to the
decrease in losses in possible areas.
In 1Q20, in possible areas, non-technical losses totaled 2,595 GWh (39%), representing a 492 GWh decrease
compared to 4Q19, an improvement since the beginning of its verification, in 2016. The total loss/grid load
indicator (12 months) in these areas decreased by 1.3 p.p., from 16.6% in 4Q19 to 15.3% in 1Q20, in line with
our strategy to decrease losses in possible areas.
169234
135 167
1645
84 6442
93 10262 42
22 28 28 14 121657
89 106
21 3050
186142
976 943868
705
553
363312
209 235
0
400
800
1200
0
100
200
300
400
500
600
1Q18 2Q18 3Q18 4Q18 1Q19 2Q19 3Q19 4Q19 1Q20
REN Quarter (GWh) # TOIs (thousand) IEN Quarter (GWh) REN 12 months (GWh)
GWh 1Q18 2Q18 3Q18 4Q18 1Q19 2Q19 3Q19 4Q19 1Q20
Gross REN 214 285 172 210 51 78 114 104 66
(-) Cancellations* 45 51 37 43 35 33 30 40 24
(=) Net REN 169 234 135 167 16 45 84 64 42
4,886 5,080 5,273 5,417 5,592
32,491 32,731 32,276 31,977 30,816
87% 87% 86% 86% 85%
13% 13% 14% 14% 14%
37,378 37,811 37,549 37,394 36,408
1Q19 2Q19 3Q19 4Q19 1Q20
Grid Load (GWh)12 months
Risk Areas Possible Areas
3,594 3,748 3,906 3,999
4,088
2,9233,300 3,177 3,087 2,595
(45%)(47%) (45%) (44%)
(39%)
(55%) (53%) (55%) (56%)(61%)
6,5177,048
7,084 7,0856,682
1Q19 2Q19 3Q19 4Q19 1Q20
Non Technical Loss (GWh)12 monhts
Risk Areas Possible Areas

21
Release de Results 3T19
6.1.4. Collection
Collection Rate by Segment (12 months)
(Considering REN overdue bills)
In 1Q20, total collection (12 months) reached 96.9%, representing a 0.8 p.p. decrease compared to 97.7% in
1Q19, mainly due to the negative impact in collection in March 2020 as a result of the first effects of Covid-19.
In the 12 months ended March 31, 2020, the adjusted PECLD/Gross Revenue ratio was 2.8%, representing a 0.9
p.p. increase compared to that of 4Q19 and a 0.7 p.p. increase compared to that of 1Q19, due to the progress
of initiatives of regularization of customers, as expected by the Company. Considering the non-recurring effect
due to the extraordinary PECLD in 4Q19, the indicator reached 5.4%.
16.0% 16.0% 16.1% 15.9% 15.9%17.1% 16.8% 16.6%
15.3%
Mar-18 Jun-18 Sep-18 Dec-18 Mar-19 Jun-19 Sep-19 Dec-19 Mar-20
Total Losses / Grid Load – Possible Areas 12 Months
80.1% 80.0% 80.3% 81.1% 81.5% 81.8% 82.1% 81.8% 81.1%
Mar-18 Jun-18 Sep-18 Dec-18 Mar-19 Jun-19 Sep-19 Dec-19 Mar-20
Total Losses / Grid Load – Risk Areas 12 Months
95.0%
101.4% 102.6%
97.7%95.1%
100.2% 99.8%96.9%
Retail Large Clients Public Sector Total
1Q19 1Q20

22
Release de Results 3T19
PECLD/Gross Revenue7
(Supply – 12 Months)
6.1.5. Operating Quality
DEC (hours)
12 months
FEC (times)
12 months
In March 2020, Light recorded a record result in the quality of services provided, in line with the best and largest
distribution companies in Brazil. In 1Q20, regardless of the impacts of the pandemic, the absenteeism rate of
field teams was low, as a result of the insourcing strategy and the adopted measures to manage the crisis.
In March 2020, DEC (12 months) was 6.96 hours, representing a 10.4% decrease compared to December 2019.
The excellent result was primarily due to the continuity of implementation of the multiannual investment plan
and the actions of modernization of networks and substations, associated with continuous operating
improvements and more assertively directed maintenance actions. At the end of 1Q20, DEC was 14.5% below
the limit of 8.14 hours established by ANEEL in the concession agreement.
In March 2020, FEC (12 months) was 4.27x, in line with that of 4Q19, and 21.4% below the limit of 5.43x
established by ANEEL in the concession agreement.
7 Gross Revenue from the Captive Market + Free Market.
2.1% 1.8% 1.8% 1.9%2.8%
5.0%5.4%
Mar-19 Jun-19 Sep-19 Dec-19 Mar-20
11.5110.97
10.28
9.14
7.96 7.83 7.67 7.788.09
8.36 8.40
7.77
6.96
Mar-17 Jun-17 Sep-17 Dec-17 Mar-18 Jun-18 Sep-18 Dec-18 Mar-19 Jun-19 Sep-19 Dec-19 Mar-20
DEC (hours)12 months
Target set at the 5th amendment to the concession contract (dec/20)
-14.5%
8.14
6.41 6.095.54 5.26
4.83 4.71 4.60 4.44 4.36 4.38 4.36 4.314.27
Mar-17 Jun-17 Sep-17 Dec-17 Mar-18 Jun-18 Sep-18 Dec-18 Mar-19 Jun-19 Sep-19 Dec-19 Mar-20
FEC (times)12 months
Target set at the 5th amendment to the concession contract (dec/20)
5.43
-21.4%

23
Release de Results 3T19
6.2. Financial Performance of Light SESA
6.2.1. Net Revenue of Light SESA8
In 1Q20, excluding construction revenue, net revenue totaled R$2,635 million, representing a 5.2% decrease
compared to 1Q19, including the following highlights:
at the end of 1Q20, Captive and Free Customers totaled R$2,661 million, in line with 1Q19. The worsening
in the billed market was partially offset by the tariff adjustment.
at the end of 1Q20, non-billed energy totaled a negative amount of R$61 million, compared to a positive
amount of R$73 million in 1Q19, due to the lower average temperature in 1Q20 compared to 1Q19 (-2.6°C).
in 1Q20, CVA totaled a negative amount of R$46 million, compared to a positive amount of R$25 million in
1Q19, primarily due to the higher negative amortization of CVA and the lower formation of Energy CVA,
partially offset by the items of the basic network, CDE and neutrality.
8 On December 10, 2014, the Company entered into the fourth amendment to its distribution concession agreement, pursuant to which the remaining balances of any tariff under-collected amounts or reimbursements at the end of the concession will be added to or deducted from the indemnification amount, allowing the recognition of the balances of these regulatory assets and liabilities.
Net Revenue (R$ MN) 1Q20 1Q19% Change
1Q20/1Q19
Captive Customers and Network Use (TUSD) 2,661 2,615 1.8%
Non billed Energy (61) 73 -
CCRBT Account 7 (1) -
CVA (46) 25 -
Others 73 68 7.5%
Concession Right of Use 62 61 0.5%
Others Revenues 11 6 76.5%
Subtotal 2,635 2,780 -5.2%
Construction Revenue* 154 160 -3.6%
Total 2,789 2,939 -5.1%
* The subsidiary Light SESA book revenues and costs, with zero margin, related to services of construction or improvement in
infrastructure used in providing electricity distribution services.
Income Statement (R$ MN) 1Q20 1Q19% Change
1Q20/1Q19
Net Operating Revenue 2,635 2,780 -5.2%
Operating Expense (2,466) (2,622) -5.9%
Adjusted EBITDA 307 295 4.3%
Financial Result (74) (195) -62.1%
Result before taxes and interest 95 (36) -
Income Tax/Social Contribution (33) 12 -
Net Income/Loss 62 (25) -
EBITDA Margin* 11.7% 10.6% 1.06 p.p.* Does not consider construction revenue

24
Release de Results 3T19
6.2.2. Costs and Expenses of Light SESA
6.2.2.1. Manageable Costs and Expenses of Light SESA
In 1Q20, manageable costs and expenses totaled R$556 million, representing an increase of 12.8% (R$63 million)
compared to 1Q19, primarily due to the increase in PECLD by R$50 million.
PMSO increased by 6.4% (R$13 million) compared to 1Q19, exclusively due to the recognition of the
extraordinary expense under the VDP, recorded in Personnel, in the amount of R$11 million, and lower revenue
from fines for late payment by customers, recorded in Others, in the amount of R$8 million.
PMS expenses (excluding the VDP), which measure the effort of the company in reducing its manageable
expenses, decreased by 5.6% at Light SESA compared to 1Q19.
In view of the progress of the insourcing of field teams, expenses with Personnel (excluding the VDP) and
Services decreased by R$13 million compared to 1Q19, reflecting productivity gains.
In 1Q20, provisions/contingencies totaled R$73 million, in line with 1Q19. Excluding the effect of the reversal of
the VDP provision of R$11 million, provisions/contingencies increased by R$9 million in the quarterly
comparison.
The increase of R$13 million in Civil provisions is mostly due to the reassessment of the prognosis of loss in
lawsuits. However, it is worth noting that new Civil lawsuits filed in 1Q20 decreased by 31.4% compared to 1Q18
and 37.3% compared to 1Q19.
Provisions for Special Civil Court (Juizado Especial Cível) (JEC) lawsuits, which are directly affected by the filing
of new lawsuits, maintained its downward trajectory for the third consecutive quarter. In the quarterly
comparison (1Q20 compared to 1Q19), the number of new filings decreased by 26% and the amount of
provisions decreased by 18.6%.
Costs and Expenses (R$ MN) 1Q20 1Q19% Change
1Q20/1Q19
Non-Manageable Costs and Expenses (1,910) (2,129) -10.3%
Energy Purchase Costs (2,042) (2,298) -11.1%
Costs with Charges and Transmission (250) (211) 18.5%
PIS/COFINS Credit on purchase 189 178 6.1%
Crédito ICMS sobre compra de Energia 192 202 -4.8%
Manageable Costs and Expenses (556) (493) 12.8%
PMSO (221) (208) 6.4%
Personnel (111) (96) 15.8%
Material (6) (6) 8.1%
Outsourced Services (111) (128) -13.3%
Others 8 22 -65.1%
Provisions - Contingencies (73) (76) -3.6%
Provisions - PECLD (123) (73) 68.8%
Depreciation and Amortization (135) (132) 2.1%
Non Operating Result (4) (4) -6.7%
Total costs without Construction Revenue (2,466) (2,622) -5.9%
Construction Revenue (154) (160) -3.6%
Total Costs (2,620) (2,781) -5.8%

25
Release de Results 3T19
In 1Q20, the number of customer complaints decreased significantly compared to 1Q19, in all relationship
fronts: -47% at call center and agencies, -31% at Ombudsman and -39% at Aneel. These indicators show the
downward trend in the number of new lawsuits filed against the Company.
6.2.2.2. Non-Manageable Costs and Expenses of Light SESA
In 1Q20, non-manageable costs and expenses totaled R$1,910 million, representing a decrease of R$219 million,
or 10.3%, compared to 1Q19. Of this amount, R$51.2 million refers to decreased purchase of energy due to the
decrease in losses.
The main decrease occurred in the short-term market (CCEE) line item, which decreased by R$350 million due
to reduced purchases in the spot market, as a result of the reduction in load and lower PLD in the period.
Provisions (R$ MN) 1Q20 1Q19% Change
1Q20/1Q19
JEC (34) (42) -18.6%
Civil (41) (28) 46.8%
Others 2 (6) -
Total (73) (76) -3.6%
Non-Manageable Costs and Expenses (R$ MN) 1Q20 1Q19% Change
1Q20/1Q19
Use of Basic Network and ONS Charges (230) (196) 17.2%
Connection Charges - Transmission (20) (14) 35.6%
Itaipu (339) (271) 24.9%
Transported Energy - Itaipu (29) (28) 5.8%
TPP Norte Fluminense (630) (611) 3.1%
PROINFA (34) (44) -22.1%
Assured energy Quotas (164) (160) 2.5%
Nuclear Quotas (60) (55) 9.4%
Energy auction (534) (528) 1.1%
Contracts by Availabilities (242) (323) -25.3%
Contracts by Quantity (292) (205) 42.8%
Costs with Charges and Transmission (251) (601) -58.2%
Sale/ Purchase (Spot) (62) (415) -85.0%
Hydrological Risk (61) (49) 24.5%
Effects of Contracts by Availabilities (128) (119) 7.5%
ESS (7) (14) -54.3%
Other 6 (3) -
PIS / COFINS Credit on Purchase 189 178 6.1%
ICMS Credit on Purchase 192 202 -4.8%
Total (1,910) (2,129) -10.3%
17.1
21.920.0
13.3 12.7
16.918.9
20.7
16.3
11.6
21.825.0 24.2
21.3 22.4
1Q19 2Q19 3Q19 4Q19 1Q20
Number of JEC processes (‘000)
# new lawsuits # closed lawsuits # stock of lawsuits

26
Release de Results 3T19
We also highlight the increase of R$68 million in energy purchases from Itaipu, due to the appreciation of the
U.S. dollar exchange rate.
Total contracted energy remained virtually stable compared to 1Q19. CCEARs that expired in 2019 were offset
by new agreements entered into at ACR Auctions.
6.2.3. Variation Offset Account – CVA
At the end of 1Q20, the balance of the Variation Offset Account – CVA totaled R$620 million, encompassing
(i) the amount of CVA and financial items ratified by Aneel and transferred to tariffs in the tariff adjustment of
March 2020, which will be invoiced and amortized in subsequent months, and (ii) the formation of CVA not yet
transferred to tariffs, primarily comprised of amounts regarding the period from January to March 2020, which
Aneel will take into account in the tariff process of March 2021.
6.2.4. Financial Result of Light SESA
In 1Q20, financial result totaled net financial expenses of R$74 million, compared to net financial expenses of
R$195 million in 1Q19, primarily due to the gain from marked-to-market debt swap transactions in foreign
currency, as a result of the decrease in the future curve of the CDI rate and the increase in the future curve of
the U.S. dollar in the period.
Moreover, the exchange rate variation line item of Itaipu totaled an expense of R$46 million in 1Q20, due to the
appreciation of the U.S. dollar in the period.
Financial Result (R$ MN) 1Q20 1Q19% Change
1Q20/1Q19
Financial Revenues 569 24 2259.2%
Income from Financial Investments 8 9 -12.6%
Swap Operations 523 - -
Interest on energy accounts and debt installments 17 22 -21.0%
Restatement of Sector's Assets and Liabilities 4 (10) -
Restatement of ICMS calculation basis of PIS/COFINS 11 - -
Others Financial Revenues 6 3 74.8%
Financial Expenses (642) (219) 193.7%
Debt Expenses (Local Currency) (100) (116) -14.3%
Debt Expenses (Foreign Currency) (38) (40) -4.6%
Monetary Variation (38) (30) 24.4%
Exchange Rate Variation (410) (11) 3739.0%
Swap Operations - (1) -
Itaipu Exchange Rate Variation (46) (0) 11106.5%
Restatement of provision for contingencies (4) (4) 2.7%
Restatement of R&D/PEE/FNDCT (2) (3) -29.3%
Interest and Fines on Taxes (0) (2) -96.7%
Installment Payment - Fines and Interest Rates Law 11.941/09 (REFIS) (1) (1) -45.5%
Other Financial Expenses (Includes IOF) (4) (10) -62.7%
Total (74) (195) -62.1%
Net Regulatory Assets/ Liabilities (R$ MN) 1Q20 4Q19 3Q19 2Q19 1Q19
Regulatory Assets 1,197 1,077 1,380 1,486 1,728
Regulatory Liabilities (577) (415) (560) (754) (1,002)
Net Regulatory Assets/ Liabilities 620 662 819 732 725

27
Release de Results 3T19
7. Light Energia – Generation
7.1. Operating Performance
7.1.1. Energy Purchases and Sales
In 1Q20, energy sales (ACL + spot market) decreased by 94 MW average compared to 1Q19, due to the lower
amount of available energy. This was due to the lower GSF in the period (105.1% in 1Q20 compared to 149.2%
in 1Q19).
Energy purchases in the ACL increased by 54% compared to 1Q19, primarily due to the hedging policy of the
Generation Company and lower GSF.
Pursuant to a court decision, Light Energia does not have to make payments relating to any exposure in monthly
CCEE settlements, exempting it from making payments in the spot market and protecting its cash flows, even
though this cost and revenue are regularly fully recognized in its result. As of March 31, 2020, the outstanding
balance of the liabilities for the period between May 2015 and March 2020 totaled approximately R$1.3 billion
under trading in the short-term market. On the other hand, the balance of receivables of the Generation
Company totaled R$590 million, resulting in net liabilities of R$686 million as of March 2020.
The completion of discussions on Bill 10,985/18 must be taken into account. This bill had already been approved
in June 2019 by the Brazilian Congress, including an amendment about another matter that does not concern
renegotiation. The Bill returned to the Brazilian Senate solely as a result of this amendment. In March 2020, Bill
3,975/19 (formerly known as Bill 10,985/18) was approved by the Economic Affairs Committee (Comissão de
Assuntos Econômicos), following to the Senate plenary session, which cannot present new amendments to the
text, but only accept or reject changes. Subsequently, the Bill will be sent to the Presidency to be sanctioned.
Then Aneel will regulate the matter after publication of the Law.
Operating Highlights 1Q20 1Q19% Change
1Q20/1Q19
Nº of Employees 205 219 -6.4%
Installed capacity (MW) 1,188 1,122 5.9%
Light Energia 873 873 0.1%
Participation¹ 315 250 25.9%
Assured energy (Average MW) 544 563 -3.3%
Light Energia² 408 410 -0.4%
Participation 136 153 -11.0%
¹Proportional stake in associates: Renova, Belo Monte, Guanhães and PCH Paracambi.
² Net assured energy of pumping and internal losses
Energy Sale (MWm) 1Q20 1Q19% Change
1Q20/1Q19
Sales 615 709 -13.3%
Free Contracting Environment 611 576 6.1%
Spot (CCEE) 4 133 -96.9%
Purchase 144 90 58.7%
Free Contracting Environment 139 90 54.1%
Spot (CCEE) 4 - -
* Values include the plants: Fontes Nova, Nilo Peçanha, Pereira Passos, Ilha dos Pombos, Santa Branca and SHPP Lajes

28
Release de Results 3T19
GSF – Generation Scaling Factor
Average Monthly PLD Southeast/Midwest
(R$/MWh)
7.1.2. Level of Energy Contracted/Uncontracted (Light Energia + Light Com)
86.4%105.2%
123.7%
162.4%148.4%
136.7%
119.0%
92.3%
66.9%
54.6%48.8%
53.1% 58.0%66.9%
85.7%
Jan Feb Mar Apr May Jun Jul Aug Sep Oct Nov Dec
2020 2019
327.4
154.4
81.9
192.1
443.7
234.5
180.4
135.2
78.5
185.5
237.3219.6
273.9
317.3
227.3
Jan Feb Mar Apr May Jun Jul Aug Sep Oct Nov Dec
2020 2019
424351 317 264 249
108 108
96169 203 256 271
412 412
2020 2021 2022 2023 2024 2025 2026
Contracted Uncontracted
18% 33% 52%39% 49% 79% 79%

29
Release de Results 3T19
7.2. Financial Performance of Light Energia
7.2.1. Net Revenue, Costs and Expenses of Light Energia
In 1Q20, net revenue decreased by 11% (R$30 million) compared to 1Q19, primarily due to decreased sales in
the spot market9, as a result of a lower GSF (105.1% in 1Q20 compared to 149.2% in 1Q19) and a lower average
PLD Southeast/Midwest (R$187.9/MWh in 1Q20 compared to R$290.1/MWh in 1Q19).
In 1Q20, costs and expenses totaled R$130 million, representing a R$64 million increase compared to 1Q19, due
to higher energy purchase expenses in the free market, as a result of the variation of GSF, which was less
favorable in the period.
PMS expenses, excluding the VDP in the amount of R$1.8 million, decreased by 12.0% at Light Energia compared
to 1Q19.
9 For purposes of recording with the CCEE, GSF=1 is used as reference at the monthly closing. In the subsequent month, CCEE informs the required adjustment in revenue, based on the actual GSF assessed.
Net Revenue (R$ MN) 1Q20 1Q19% Change
1Q20/1Q19
Generation Sale (ACL) 217 229 -5.2%
Short-Term 35 52 -34.0%
Others 2 3 -25.9%
Total 254 284 -10.7%
Income Statement (R$ MN) 1Q20 1Q19% Change
1Q20/1Q19
Net Operating Revenue 254 284 -10.7%
Operating Expense (130) (66) 96.5%
Adjusted EBITDA 138 231 -40.1%
Financial Result 16 (3) -
Result before taxes and Equity Income 138 216 -35.9%
Income Tax/Social Contribution (45) (71) -36.0%
Equity Income (0) 7 -
Net Income/Loss 93 151 -38.3%
EBITDA Margin 54.5% 81.1% -26.67 p.p.
Operating Costs and Expenses (R$ MN) 1Q20 1Q19% Change
1Q20/1Q19
Personnel (7) (7) 2.0%
Material and Outsourced Services (4) (4) 9.7%
Purchased Energy / CUSD / CUST (104) (41) 154.9%
Depreciation (14) (14) 2.1%
Non Operating Result (1) 1 -
Others (includes provisions) (1) (2) -63.9%
Total (130) (66) 96.5%

30
Release de Results 3T19
7.2.2. Financial Result of Light Energia
In 1Q20, net financial revenues totaled R$16 million, compared to net financial expenses of R$3 million in 1Q19.
This improvement is due to the gain from marked-to-market debt swap transactions in foreign currency, as a
result of the decrease in the future curve of the CDI rate and the increase in the future curve of the U.S. dollar
in the period.
7.2.3. Net Income (Loss) of Light Energia
Net Income/Loss (R$MN) 1Q20 1Q19% Change
1Q20/1Q19
Light Energia (without Stakes) 94 144 -34.8%
Guanhães - Equity Income (0) 7 -
Net Result 93 151 -38.3%
Financial Result (R$ MN) 1Q20 1Q19% Change
1Q20/1Q19
Financial Revenues 312 22 1337.6%
Income from Financial Investments 7 9 -21.7%
Swap Operations 305 13 2246.0%
Financial Expenses (296) (25) 1083.2%
Debt Expenses (Local Currency) (1) (8) -93.2%
Debt Expenses (Foreign Currency) (18) (15) 15.1%
Exchange Rate Variation (245) (2) 10249.4%
Restatement of R&D/PEE/FNDCT (0) (0) -20.4%
Restatement of GSF (31) 2 -
Other Financial Expenses (Includes IOF) (1) (1) -37.9%
Total 16 (3) -

31
Release de Results 3T19
8. Light Com – Trading
8.1. Operating Performance of Light Com
In 1Q20, sales volume increased by 1.5% compared to 1Q19. Notwithstanding the expiration of certain long-
term agreements entered into with end consumers, new short-term transactions were conducted with
Generation and Trading Companies, resulting in an increase in sales volume.
In 1Q20, the average sales price decreased by 5.5% compared to 1Q19, due to the lower market price for short-
term transactions.
8.2. Financial Performance of Light Com
In 1Q20, EBITDA of the Trading Company totaled R$25 million, representing a R$27 million decrease compared
to 1Q19, when we recognized an extraordinary amount of R$31 million, due to the indemnification for changes
made in the commercial conditions of existing agreements between Light Com and Renova, an affiliated
company at the time. Excluding this extraordinary effect, EBITDA of the Trading Company increased by R$4
million, or 19%, in the quarterly comparison.
Operating Highlights 1Q20 1Q19% Change
1Q20/1Q19
Volume Sold - MWm 645 635 1.5%
Average Selling Price (Net of Taxes) - R$/MWh 188.6 199.5 -5.5%
Income Statement (R$ MN) 1Q20 1Q19% Change
1Q20/1Q19
Net Operating Revenue 267 277 -3.6%
Energy Supply 267 255 4.7%
Others 0 22 -99.4%
Operating Expenses (242) (225) 7.5%
Personnel (1) (1) 40.3%
Material and Outsourced Services (0) (0) 254.5%
Others (0) (0) 34.0%
Purchased Energy (240) (224) 7.3%
Adjusted EBITDA 25 52 -51.8%
EBITDA Margin 9.3% 18.7% -9.33 p.p.
Financial Result 1 5 -77.0%
Financial Revenue 1 5 -75.3%
Financial Expense (0) (0) -39.8%
Result Before Taxes and Interests 26 56 -53.9%
Net Income/Loss 17 37 -54.1%

32
Release de Results 3T19
9. Indebtedness
9.1. Light S.A.
In 1Q20, consolidated net debt totaled R$6,721 million, in line with R$6,750 million recorded in 4Q19.
R$ Million Cost Current %Non
Current % Total %
Light SESA 1,266 100.0% 6,841 100.0% 8,107 100.0%
Domestic Currency 1,266 100.0% 5,055 73.9% 6,321 78.0%
Debentures 8th Issuance CDI + 1,18% 39 3.1% 235 3.4% 274 3.4%
Debentures 9th Issuance - Serie A CDI + 1,15% 250 19.7% 250 3.7% 500 6.2%
Debentures 9th Issuance - Serie B IPCA + 5,74% 216 17.1% 649 9.5% 865 10.7%
Debentures 10th Issuance 115% CDI 250 19.7% - 0.0% 250 3.1%
Debentures 12ª Issuance 3 IPCA + 9,09% 59 4.7% - 0.0% 59 0.7%
Debentures 13ª Issuance IPCA + 7,44% - 0.0% 504 7.4% 504 6.2%
Debentures 15ª Issuance 1 IPCA + 6,83% - 0.0% 568 8.3% 568 7.0%
Debentures 15ª Issuance 2 CDI + 2,20% - 0.0% 160 2.3% 160 2.0%
Debentures 16ª Issuance 1 CDI + 0,90% - 0.0% 133 1.9% 133 1.6%
Debentures 16ª Issuance 2 CDI + 1,25% - 0.0% 423 6.2% 423 5.2%
Debentures 16ª Issuance 3 CDI + 1,35% - 0.0% 63 0.9% 63 0.8%
Debentures 17ª Issuance 1 CDI + 1,50% - 0.0% 500 7.3% 500 6.2%
Debentures 17ª Issuance 2 CDI + 1,75% - 0.0% 50 0.7% 50 0.6%
Debentures 17ª Issuance 4 IPCA + 5,25% - 0.0% 152 2.2% 152 1.9%
Promissory notes - 5ª PN Sesa CDI + 1,25% 100 7.9% 200 2.9% 300 3.7%
CCB IBM 2017 CDI + 3,84% 1 0.1% - 0.0% 1 0.0%
CCB IBM 2019 CDI 1 0.0% 0 0.0% 1 0.0%
BNDES (CAPEX) TJLP ** TJLP + 3,52% 34 2.7% - 0.0% 34 0.4%
BNDES (CAPEX) SELIC ** Selic + 3,08% 23 1.8% - 0.0% 23 0.3%
BNDES (CAPEX) TLP ** IPCA + 6,14% 42 3.3% 214 3.1% 256 3.2%
BNDES (CAPEX) Prefixed ** 6.00% 14 1.1% 48 0.7% 62 0.8%
BNDES Olimpíadas TJLP ** TJLP + 2,89% 12 0.9% 4 0.1% 15 0.2%
BNDES Olimpíadas SELIC ** SELIC + 2,58% 4 0.3% 1 0.0% 6 0.1%
BNDES Olimpíadas Prefixed ** 3.50% 2 0.1% 4 0.1% 6 0.1%
FINEP - Innovation and Research 4.00% 23 1.8% 27 0.4% 50 0.6%
FIDC 2018 Série A CDI + 1,20% 177 14.0% 701 10.2% 878 10.8%
FIDC 2018 Série B IPCA + 5,75% 86 6.8% 279 4.1% 365 4.5%
Others - (66) -5.2% (110) -1.6% (177) -2.2%
Foreign Currency - 0.0% 1,786 26.1% 1,786 22.0%
Tesouro Nacional 64,05% CDI - 0.0% 30 0.4% 30 0.4%
Citibank CDI + 1,50% - 0.0% 416 6.1% 416 5.1%
Notes Units 142,79% CDI - 0.0% 1,352 19.8% 1,352 16.7%
Others - 0.0% (12) -0.2% (12) -0.1%-
Light Energia 6 100.0% 1,119 100.0% 1,126 100.0%
Domestic Currency 6 100.0% 34 3.0% 40 3.5%
Debentures 3rd Issuance CDI + 1,18% 3 39.5% 15 1.3% 18 1.6%
BNDES Lajes TJLP + 2,95% 4 60.9% 19 0 23 2.0%Others - (0) 0.0% (0) (0) (0) 0.0%
Foreign Currency - 0.0% 1,086 1 1,086 96.5%
Citibank CDI + 1,30% - 0.0% 416 0 416 36.9%
Notes Units 143,01% CDI - 0.0% 676 1 676 60.0%
Others - - 0.0% (6) (0) (6) -0.5%
Light Conecta 1 100.0% 0 100.0% 1 100.0%
BNDES - Conecta (Domestic Currency) TJLP + 0,53% 1 100% 0 100% 1 100%
Total 1,273 7,961 9,234
R$ MN Light SESA Light Energia ConectaOthers Light
S.A.
Light S.A.
1Q20
Light S.A.
4Q19Δ %
Domestic Currency 6,321 40 1 0 6,362 6,434 -1.1%
Foreign Currency 1,786 1,086 0 0 2,871 2,261 27.0%0 - 0 0 0 - jan/00
Loans and Financing 3,671 1,108 1 0 4,780 4,280 11.7%
Debentures 4,436 17 0 0 4,453 4,416 0.8%
Interest 166 21 0 0 187 71 162.8%
Swap Operations (751) (414) 0 0 (1,166) (338) 244.5%
Gross Debt 7,521 733 1 0 8,255 8,428 -2.1%
Cash and Cash Equivalents 648 756 13 117 1,534 1,678 -8.6%
Net Debt 6,873 (24) (12) (117) 6,721 6,750 -0.4%

33
Release de Results 3T19
Amortization of Loans and Financing and Debentures (R$ MN)
Average Maturity: 2.6 years
At the end of 1Q20, the Net Debt/EBITDA ratio was 3.06x, representing an increase compared to 2.98x in 4Q19.
It is important to highlight that the contractual covenant limit is 3.75x under most agreements.
At the end of 1Q20, EBITDA/Interest ratio was 3.39x, above the minimum contractual limit of 2.0x under most
agreements.
Consolidated Gross and Net Debt
(R$ MN)
Debt Indices¹ Debt Service Costs
¹ Considering Hedge * Equivalent to the sum of fixed cost, Libor and U.S. dollar exchange rate variation.
1,534
1,207
1,893 1,940
2,897
777 510
132
Cash 2020 2021 2022 2023 2024 2025 2026
9,1408,593 8,428 8,255
7,9896,541 6,750 6,721
3.69
3.00 2.983.06
3.75
-
0.50
1.00
1.50
2.00
2.50
3.00
3.50
4.00
-
2,000
4,000
6,000
8,000
10,000
12,000
14,000
16,000
18,000
2Q19 3Q19 4Q19 1Q20
Gross Debt Net Debt Net Debt/EBITDA Contractual Cap for Dívida Líquida/EBITDA
CDI65%
IPCA32%
TJLP1%
Others*2%
5.39% 5.78% 5.78%4.30%
4.14%
9.49% 9.34% 8.84% 8.79%
8.31%
1Q19 2Q19 3Q19 4Q19 1Q20
Actual Cost Nominal Cost

34
Release de Results 3T19
National Foreign
Fitch A+ BB- 04/24/2020
Standard & Poors AA+ - 07/15/2019
Moody's A2.br Ba3 09/04/2019
RatingsGrade
Date
mar/20 dec/19 sep/19 jun/19 mar/19
Loans and Financing + 4,837 4,334 5,417 5,293 5,367
Loans and Financing Cost - (57) (55) (68) (72) -
Interest related to Loans and Financing + 79 28 88 39 88
Debentures + 4,519 4,487 3,788 4,265 4,137
Debentures Cost - (66) (71) (65) (74) -
Interest related to Debentures + 108 43 107 59 99
Swap Operations + (1,166) (338) (673) (369) (260)
Gross Debt = 8,255 8,428 8,593 9,140 9,431
Cash - 1,534 1,678 2,052 1,151 1,187
Net Debt (a) = 6,721 6,750 6,541 7,989 8,244
EBITDA CVM (12 months) 1,754 1,875 2,358 1,524 1,645
Equity Income (12 months) - (50) (38) (31) (128) (59)
Provision (12 months) - (1,586) (1,540) (919) (597) (627)
Other Operational Revenues/Expenses (12 months) - (49) (49) (85) (73) (82)
Regulatory Assets and Liabilities (12 months) + (154) (153) (124) (155) (185)
Other Revenue -PIS/COFINS credit 1,086 1,086 1,086 - -
EBITDA for Covenants (12 months) (b) = 2,199 2,262 2,183 2,167 2,229
Interests (c) 649 669 699 726 718
Net Debt/EBITDA for Covenants (a/b) 3.06 2.98 3.00 3.69 3.70
Contractual Cap for Dívida Líquida/EBITDA 3.75 3.75 3.75 3.75 3.75
EBITDA for Covenants/Interest (b/c) 3.39 3.38 3.12 2.99 3.10
Contractual Lower Limit for EBITDA/Juros 2.00 2.00 2.00 2.00 2.00
Covenants Multiple - R$ MN
35
Release de Results 3T19
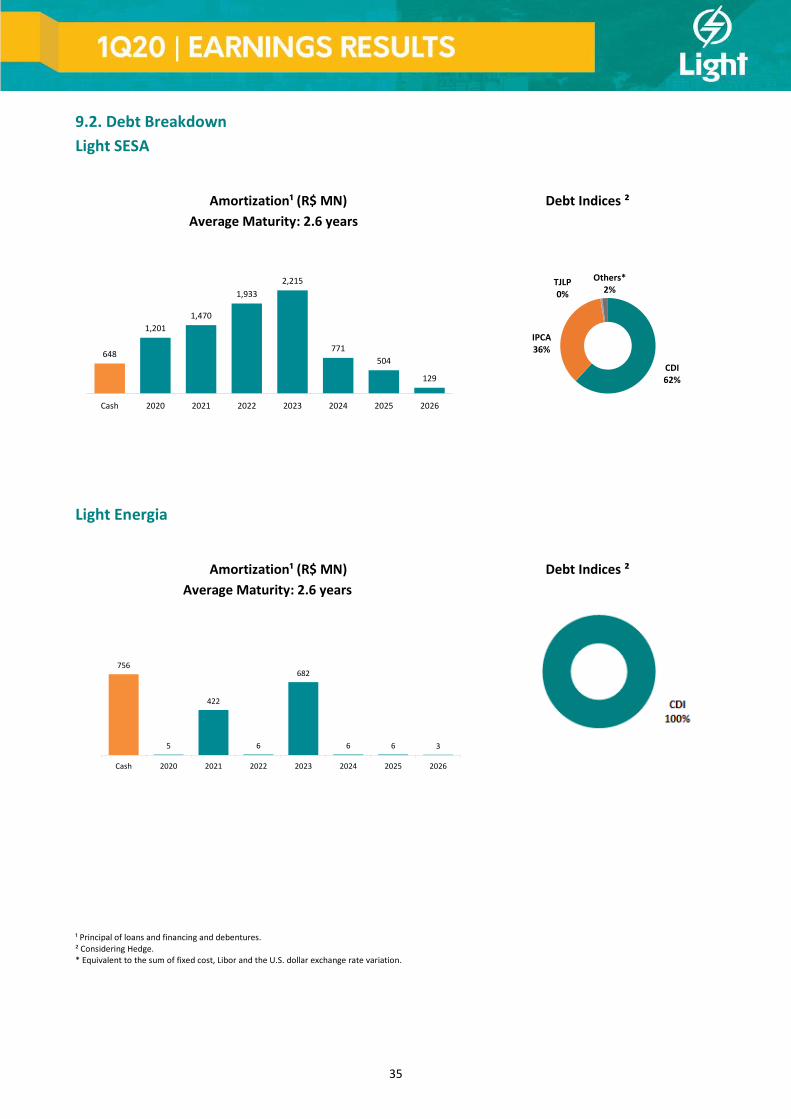
9.2. Debt Breakdown
Light SESA
Amortization¹ (R$ MN) Debt Indices ²
Average Maturity: 2.6 years
Light Energia
Amortization¹ (R$ MN) Debt Indices ²
Average Maturity: 2.6 years
¹ Principal of loans and financing and debentures. ² Considering Hedge. * Equivalent to the sum of fixed cost, Libor and the U.S. dollar exchange rate variation.
648
1,201
1,470
1,933
2,215
771
504
129
Cash 2020 2021 2022 2023 2024 2025 2026
756
5
422
6
682
6 6 3
Cash 2020 2021 2022 2023 2024 2025 2026
CDI62%
IPCA36%
TJLP0%
Others*2%
36
Release de Results 3T19
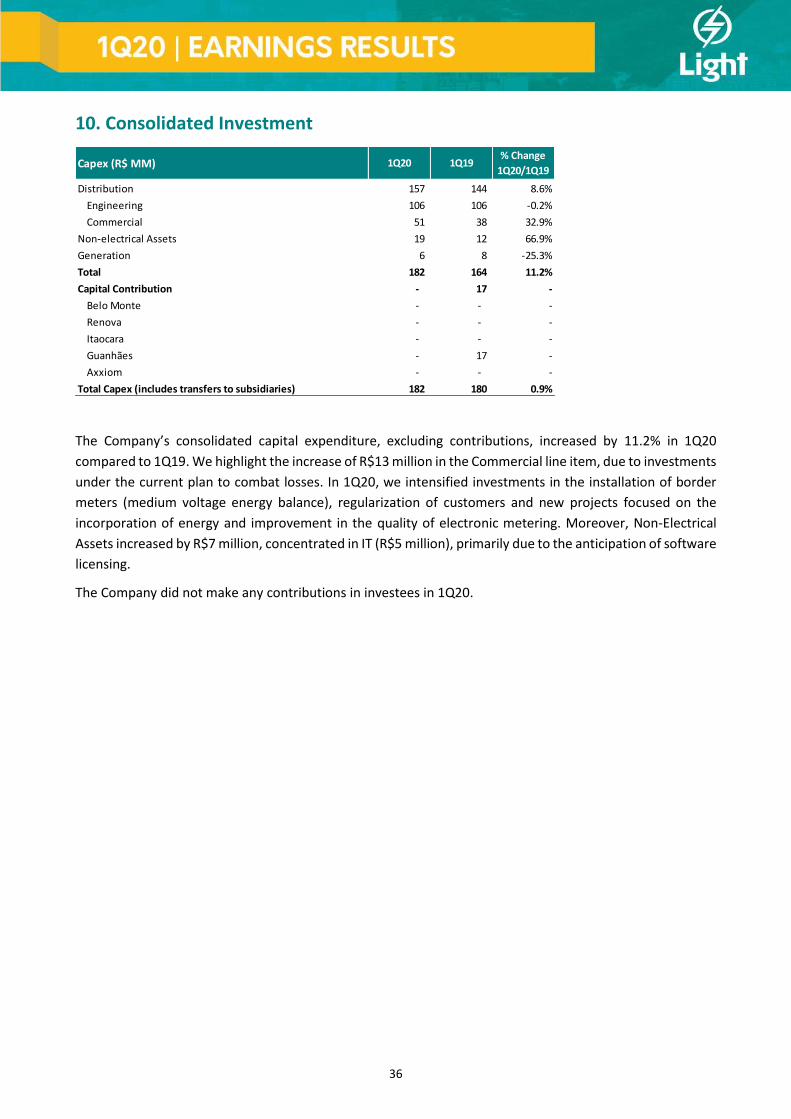
10. Consolidated Investment
The Company’s consolidated capital expenditure, excluding contributions, increased by 11.2% in 1Q20
compared to 1Q19. We highlight the increase of R$13 million in the Commercial line item, due to investments
under the current plan to combat losses. In 1Q20, we intensified investments in the installation of border
meters (medium voltage energy balance), regularization of customers and new projects focused on the
incorporation of energy and improvement in the quality of electronic metering. Moreover, Non-Electrical
Assets increased by R$7 million, concentrated in IT (R$5 million), primarily due to the anticipation of software
licensing.
The Company did not make any contributions in investees in 1Q20.
Capex (R$ MM) 1Q20 1Q19% Change
1Q20/1Q19
Distribution 157 144 8.6%
Engineering 106 106 -0.2%
Commercial 51 38 32.9%
Non-electrical Assets 19 12 66.9%
Generation 6 8 -25.3%
Total 182 164 11.2%
Capital Contribution - 17 -
Belo Monte - - -
Renova - - -
Itaocara - - -
Guanhães - 17 -
Axxiom - - -
Total Capex (includes transfers to subsidiaries) 182 180 0.9%

37
Release de Results 3T19
11. Capital Markets
Light S.A.’s shares (LIGT3) were priced at R$9.65 at the end of March 2020. At the end of 1Q20, the Company’s
market value was R$2.9 billion.
Performance of Light’s shares vs. Ibovespa vs. IEE
On a 100 basis on April 1, 2019
R$19,20
abr/19 mai/19 jun/19 jul/19 ago/19 set/19 out/19 nov/19 dez/19 jan/20 fev/20 mar/20
Ibovespa Light IEE
R$9,65
73.020
57.6510%
-10%
+10%
+20%
+30%
+40%
+50%
+60%
-20%
-30%
-40%
-50%
-60%
-70%
Market Information 1Q20 1Q19
Volume Average - LIGT3 (R$ MN) 77.5 27.4
Shares Average - LIGT3 (R$ / share) 20.10 19.60
ADTV 90 days (R$ MN) 70.8 27.7
Price Change - LIGT3 -59.6% 23.7%
Price Change - IEE -25.5% 13.3%
Price Change - IBOV -38.4% 4.8%

38
Release de Results 3T19
ANNEX I – Generation Assets
Existing Power PlantsInstalled Capacity
(MW)¹
Assured Energy
(MWm)¹Operation Start
Concession /
Authorization
Expiration Date
Light's stake
Fontes Nova 132 99 1940 2026 100%
Nilo Peçanha 380 334 1953 2026 100%
Pereira Passos 100 49 1962 2026 100%
Ilha dos Pombos 187 109 1924 2026 100%
Santa Branca 56 30 1999 2026 100%
Elevatórias - (101) - - -
SHPP Lajes 18 17 2018 2026 100%
SHPP Paracambi 13 10 2012 2031 51%
Belo Monte 280 114 2016 2045 2.49%
Guanhães 22 12 2018 2047 51%
Total 1188 672 - - -
¹Light's proportional stake
Current Generation Park

39
Release de Results 3T19
ANNEX II – CVM EBITDA Reconciliation
CVM EBITDA (R$ MN) 1Q20 1Q19% Change
1Q20/1Q19
Net Operating Revenue (A) 167 164 1.5%
Social Contributions & Income Tax (B) (6) (89) -92.7%
Deferred Income Tax (C) (80) 10 -
EBT (A - (B + C)) 254 243 4.5%
Depreciation (D) (149) (146) 2.1%
Financial Expenses Revenue (E) (56) (191) -70.6%
CVM EBITDA ((A) - (B) - (C) - (D) - (E)) 459 580 -20.8%

40
Release de Results 3T19
ANNEX III – Income Statement
Light SESA
Income Statement (R$ MN) 1Q20 1Q19
% Change
1Q20/1Q19
Operating Revenues 4,634 5,123 -9.6%
Electricity Sales 3,874 4,334 -10.6%
CVA (46) 25 -
Construction Revenues 154 160 -3.6%
Other Revenues 652 604 8.0%
Deductions From Operating Revenues (1,845) (2,184) -15.5%
Net Operating Revenues 2,789 2,939 -5.1%
Electricity Costs (2,064) (2,288) -9.8%
Operating Expenses (417) (356) 17.0%
Personnel (111) (96) 15.8%
Material (6) (6) 8.1%
Third party services (111) (128) -13.3%
Provisions (196) (149) 31.9%
Others 8 22 -65.1%
Adjusted EBITDA 307 295 4.3%
Depreciation and amortization (135) (132) 2.1%
Other operating revenues/expenses (4) (4) -6.7%
Operating Income 169 158 6.5%
Net Financial Result (74) (195) -62.1%
Financial Revenues 569 24 2259.2%
Financial Expenses (642) (219) 193.7%
Income before tax 95 (36) -
Income Tax / Social Contribution - - -
Deferred Taxes (33) 12 -
Net Income 62 (25) -

41
Release de Results 3T19
Light Energia
Income Statement (R$ MN) 1Q20 1Q19% Change
1Q20/1Q19
Operating Revenues 291 322 -9.7%
Energy supply - Energy sales 249 260 -4.1%
Energy supply - Spot 39 59 -33.4%
Others - TUSD 2 2 -23.7%
Others 0 1 -33.0%
Deductions from Operating Revenues (37) (38) -2.3%
Net Operating Revenues 254 284 -10.7%
Electricity Costs (104) (41) 154.9%
Operating Expenses (12) (13) -7.4%
Personnel (7) (7) 2.0%
Material (0) (0) -31.1%
Third party services (4) (4) 12.2%
Provisions 1 0 4372.0%
Others (2) (2) -16.7%
Adjusted EBITDA 138 231 -40.1%
Depreciation and amortization (14) (14) 2.1%
Other operating revenues/expenses (1) 1 -
Operating income 123 218 -43.4%
Equity Income (0) 7 -
Net Financial Result 16 (3) -
Financial Revenues 312 22 1337.6%
Financial Expenses (296) (25) 1096.3%
Income before Tax 139 222 -37.5%
Income Tax / Social Contribution (0) (69) -99.5%
Deferred Taxes (45) (1) 3176.8%
Net Income 93 151 -38.3%

42
Release de Results 3T19
ANNEX IV – Statement of Financial Result
Light S.A.
Financial Result (R$ MN) 1Q20 1Q19% Change
1Q20/1Q19
Financial Revenues 882 53 1571.7%
Income from Financial Investments 16 19 -16.4%
Swap Operations 828 12 6614.3%
Moratory Increase / Debts Penalty 17 22 -21.0%
Restatement of Sector's Assets and Liabilities 4 (10) -
Restatement of ICMS calculation basis of PIS/COFINS 11 - -
Others Financial Revenues 6 10 -32.7%
Financial Expenses (938) (244) -285.4%
Debt Expenses (Local Currency) (100) (124) -19.1%
Debt Expenses (Foreign Currency) (56) (55) 0.9%
Monetary Variation (38) (30) 24.2%
Exchange Rate Variation (655) (13) 4922.3%
Itaipu Exchange Rate Variation (46) (0) 11106.5%
Restatement of provision for contingencies (4) (4) 2.4%
Restatement of R&D/PEE/FNDCT (2) (3) -28.9%
Interest and Fines on Taxes (0) (2) -96.0%
Installment Payment - Fines and Interest Rates Law 11.941/09 (REFIS) (1) (1) -45.5%
Restatement of GSF (31) 2 -
Other Financial Expenses (Includes IOF) (5) (12) -59.5%
Total (56) (191) -70.6%

43
Release de Results 3T19
ANNEX V – Statement of Financial Position
Light S.A. (R$ million)
ASSETS 1Q20 4Q19
Current 6,348 5,354
Cash & cash equivalents 797 996
Marketable securities 737 682
Receivable accounts 2,568 2,537
Inventories 60 60
Taxes and contributions recoverable 1,235 81
Income tax and social contribution recoverable 143 135
Sector's financial assets 477 550
Prepaid expenses 21 23
Receivables from services rendered 33 31
Other current assets 277 260
Non-current 18,299 18,490
Receivable accounts 1,146 1,113
Taxes and contributions recoverable 5,123 6,257
Deferred taxes 33 36
Sector's financial assets 142 113
Concession financial asset 4,835 4,748
Deposits related to litigation 275 273
Swap derivative financial instruments 1,166 373
Contractual asset 615 497
Right of use asset 71 77
Investments 578 579
Fixed assets 1,581 1,587
Intangible 2,733 2,837
Total Assets 24,647 23,844
LIABILITIES 1Q20 4Q19
Current 4,968 5,178
Suppliers 2,485 2,546
Taxes and contributions 307 172
Income tax and social contribution 1 38
Loans and financing 554 551
Debentures 905 836
Dividends payable 0 315
Labor obligations 98 86
Leasing 33 32
Other obligations 585 600
Non-current 12,964 12,436
Loans and financing 4,305 3,756
Debentures 3,656 3,623
Swap derivative financial instruments 0 35
Taxes and contributions 218 348
Deferred taxes 478 400
Uncovered equity income 23 22
Provisions for tax, civil, labor and regulatory risks 559 543
Leasing 42 48
Amounts to be refunded to consumers 3,631 3,606
Other obligations 52 54
Shareholders' Equity 6,715 6,231
Capital Stock 4,051 4,051
Capital reserves 5 3
Profit reserves 1,958 1,958
Special reserve 315 0
Asset valuation adjustments 316 320
Other comprehensive income (101) (101)
Retained Earnings 171 00 0
Total Liabilities 24,647 23,844

44
Release de Results 3T19
Light SESA (R$ million)
ASSETS 1Q20 4Q19
Current 4,687 3,780
Cash & cash equivalents 269 554
Marketable securities 379 327
Receivable accounts 1,858 1,824
Inventories 55 56
Taxes and contributions 1,229 77
Income tax and social contribution 97 89
Sector's financial assets 477 550
Prepaid expenses 20 21
Receivables from services rendered 32 31
Other current assets 271 252
Non-current 15,935 16,402
Receivable accounts 1,124 1,090
Taxes and contributions 5,123 6,257
Deposits related to litigation 271 269
Sector's financial assets 142 113
Concession financial asset 4,835 4,748
Swap derivative financial instruments 751 249
Contractual asset 615 497
Right of use asset 69 74
Investments 29 29
Fixed assets 246 245
Intangible 2,729 2,833
Total Assets 20,622 20,182
LIABILITIES 1Q20 4Q19
Current 3,565 3,715
Suppliers 1,171 1,242
Taxes and contributions 302 165
Income tax and social contribution 1 1
Loans and financing 529 540
Debentures 903 833
Dividends payable 0 274
Labor obligations 88 77
Leasing 31 30
Other obligations 541 552
Non-current 11,564 11,310
Loans and financing 3,200 2,896
Debentures 3,641 3,609
Swap derivative financial instruments 0 18
Taxes and contributions 218 348
Deferred taxes 235 202
Provisions for tax, civil, labor and regulatory risks 554 540
Leasing 40 46
Amounts to be refunded to consumers 3,631 3,606
Other obligations 44 46
Shareholders' Equity 5,493 5,158
Capital Stock 4,146 4,146
Capital reserves 7 7
Profit reserves 1,375 1,101
Other comprehensive income (97) (97)
Retained Earnings 62 0
Total Liabilities 20,622 20,182

45
Release de Results 3T19
Light Energia (R$ million)
ASSETS 1Q20 4Q19
Current 1,505 1,427
Cash & cash equivalents 415 342
Marketable securities 341 338
Receivable accounts 733 734
Taxes and contributions 4 2
Provided services 1 0
Inventories 5 4
Prepaid expenses 1 2
Other current assets 5 5
Non-current 1,852 1,570
Swap derivative financial instruments 414 124
Contingency deposits 4 3
Right-of-use assets 3 3
Investments 136 136
Fixed assets 1,294 1,301
Intangible 2 2
Total Assets 3,357 2,998
LIABILITIES 1Q20 4Q19
Current 1,385 1,393
Suppliers 1,304 1,285
Taxes and contributions 3 4
Income tax and social contribution 0 37
Loans and financing 25 11
Debentures 3 3
Labor obligations 7 7
Leasing obligations 2 1
Other obligations 41 450 0
Non-current 1,376 1,102
Loans and financing 1,104 860
Debentures 15 15
Deferred taxes 244 199
Swap 0 16
Provisions 4 3
Other obligations 8 8
Leasing obligations 1 20 0
Shareholders' Equity 596 503
Capital Stock 77 77
Profit reserves 25 25
Proposed additional dividends 0 84
Asset valuation adjustments 316 320
Other comprehensive income (4) (4)
Accumulated losses 181 0
Total Liabilities 3,357 2,998
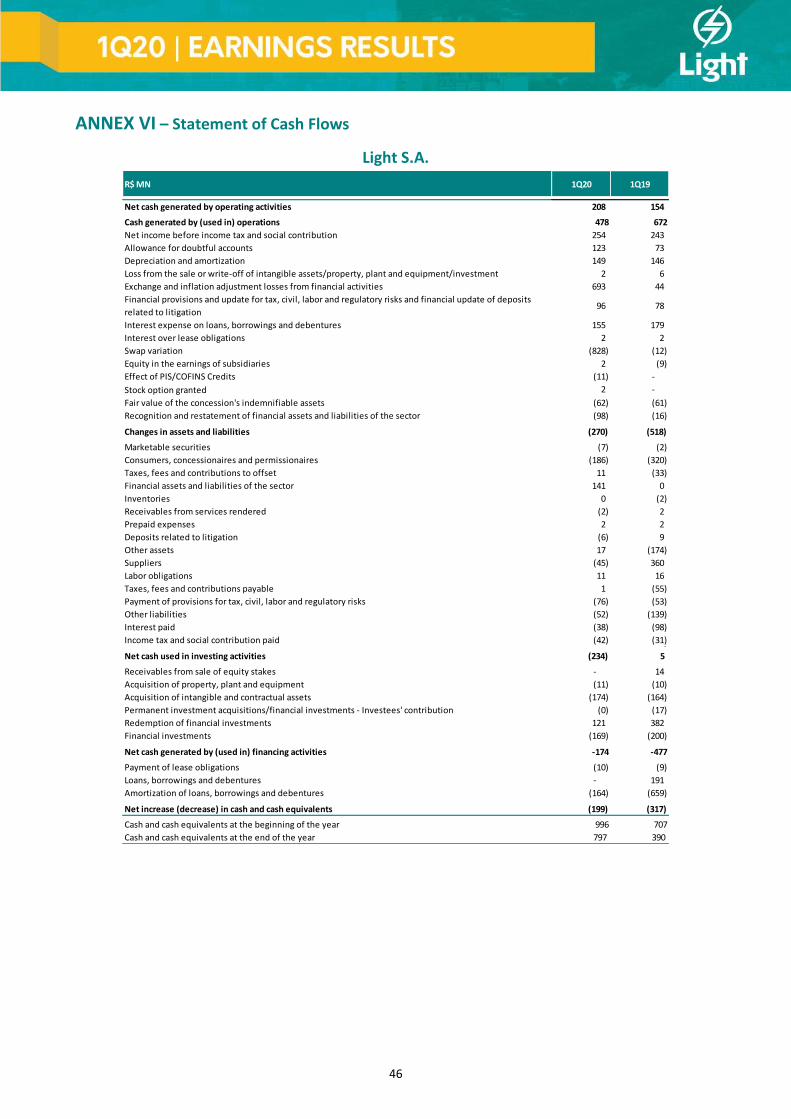
46
Release de Results 3T19
ANNEX VI – Statement of Cash Flows
Light S.A.
R$ MN 1Q20 1Q19
Net cash generated by operating activities 208 154
Cash generated by (used in) operations 478 672
Net income before income tax and social contribution 254 243
Allowance for doubtful accounts 123 73
Depreciation and amortization 149 146
Loss from the sale or write-off of intangible assets/property, plant and equipment/investment 2 6
Exchange and inflation adjustment losses from financial activities 693 44
Financial provisions and update for tax, civil, labor and regulatory risks and financial update of deposits
related to litigation96 78
Interest expense on loans, borrowings and debentures 155 179
Interest over lease obligations 2 2
Swap variation (828) (12)
Equity in the earnings of subsidiaries 2 (9)
Effect of PIS/COFINS Credits (11) -
Stock option granted 2 -
Fair value of the concession's indemnifiable assets (62) (61)
Recognition and restatement of financial assets and liabilities of the sector (98) (16)
Changes in assets and liabilities (270) (518)
Marketable securities (7) (2)
Consumers, concessionaires and permissionaires (186) (320)
Taxes, fees and contributions to offset 11 (33)
Financial assets and liabilities of the sector 141 0
Inventories 0 (2)
Receivables from services rendered (2) 2
Prepaid expenses 2 2
Deposits related to litigation (6) 9
Other assets 17 (174)
Suppliers (45) 360
Labor obligations 11 16
Taxes, fees and contributions payable 1 (55)
Payment of provisions for tax, civil, labor and regulatory risks (76) (53)
Other liabilities (52) (139)
Interest paid (38) (98)
Income tax and social contribution paid (42) (31) 0
Net cash used in investing activities (234) 5
Receivables from sale of equity stakes - 14
Acquisition of property, plant and equipment (11) (10)
Acquisition of intangible and contractual assets (174) (164)
Permanent investment acquisitions/financial investments - Investees' contribution (0) (17)
Redemption of financial investments 121 382
Financial investments (169) (200) 0 0
Net cash generated by (used in) financing activities -174 -477
Payment of lease obligations (10) (9)
Loans, borrowings and debentures - 191
Amortization of loans, borrowings and debentures (164) (659)
Net increase (decrease) in cash and cash equivalents (199) (317)
Cash and cash equivalents at the beginning of the year 996 707
Cash and cash equivalents at the end of the year 797 390

47
Release de Results 3T19
Light SESA
R$ MN 1Q20 1Q19
Net cash generated by operating activities 115 15
Cash generated by (used in) operations 342 373
Net income before income tax and social contribution 95 (36)
Allowance for doubtful accounts 123 73
Depreciation and amortization 135 132
Loss from the sale or write-off of intangible assets/property, plant and equipment 2 5
Exchange and monetary losses (gains) from financial activities 447 41
Provisions for tax, civil, labor and regulatory risks and judicial deposits 95 78
Interest expense on loans, borrowings and debentures 137 156
Interest over lease obligations 2 2
Effect of PIS/COFINS Credits (11) -
Swap variation (523) (1)
Fair value of the concession's indemnifiable assets
Recognition and restatement of financial assets and liabilities of the sector (523) (16)
Changes in assets and liabilities (227) (358)
Marketable securities (3) (5)
Consumers, concessionaires and permissionaires (191) (341)
Taxes, fees and contributions to offset 12 (38)
Financial assets and liabilities of the sector 141 0
Inventories 1 (1)
Receivables from services rendered (1) 2
Prepaid expenses 1 1
Deposits related to litigation (6) 9
Other assets 2 (19)
Suppliers (54) 341
Estimated obligations 10 15
Taxes, fees and contributions payable 4 (54)
Provisions for tax, civil, labor and regulatory risks (76) (53)
Other liabilities (31) (139)
Interest paid (35) (77) 0
Net cash used in investing activities (228) 16 0
Acquisition of property, plant and equipment (5) (2)
Acquisition of intangible and contractual assets (174) (164)
Redemption of financial investments 113 382
Financial investments (162) (200)
Net cash generated by (used in) financing activities (172) (296)
Loans, borrowings and debentures - 191
Amortization of loans, borrowings and debentures (163) (479)
Payment of lease obligations (9) (9) 0
Net increase (decrease) in cash and cash equivalents (285) (265)
Cash and cash equivalents at the beginning of the year 554 491
Cash and cash equivalents at the end of the year 269 225

48
Release de Results 3T19
Light Energia
R$ MN 1Q20 1Q19
Net cash generated by operating activities 82 203
Cash generated by (used in) operations 112 241
Net income before income tax and social contribution 139 222
Depreciation and amortization 14 14
Exchange rate and monetary losses (gains) from financial activities 245 2
Provision for contingencies and restatement 1 0
Interest expense on loans, borrowings and debentures 18 23
Swap variation (305) (13)
Equity in the earnings of subsidiaries 0 (7)0 0
Changes in assets and liabilities (31) (38)
Marketable securities (3) 4
Concessionaires and licensees 1 20
Taxes, fees and contributions (2) 4
Inventories (0) (1)
Prepaid expenses 1 1
Deposits related to litigation (0) (0)
Other assets 15 4
Suppliers 19 (35)
Labor liabilities 0 1
Taxes, fees and contributions payable (1) 0
Other liabilities (21) 1
Interest paid (3) (21)
Income tax and social contribution paid (37) (15)
Net cash used in investing activities (6) (24)
Acquisition of property, plant and equipment (6) (8)
Redemption of financial investments 7 -
Financial investments (7) -
Investments/Acquisition of invenstments - (17)0 0
Net cash generated by (used in) financing activities (1) (180)
Amortization of loans, borrowings and debentures (1) (179)
Payment of finance lease obligations (0) (0)
Net increase (decrease) in cash and cash equivalents 73 (1)
Cash and cash equivalents at the beginning of the year 342 90
Cash and cash equivalents at the end of the year 415 88

49
Release de Results 3T19
List of Abbreviations and Acronyms
ACL – Free Contracting Environment
ANEEL – National Electric Energy Agency
BNDES – Brazilian Development Bank
CCEE – Brazilian Electricity Trading Chamber
CCRBT – Rate Tier Fund Account
CDE – Energy Development Account
ACR Account – Regulated Market Account
CUSD – Distribution System Utilization Agreement
CUST – Transmission System Utilization Agreement
CVA – “A Component” Variation Offset Account
CVM – Brazilian Securities Commission
DDSD – Delegated Services Defense Office
DEC – Equivalent Outage Duration
DIC – Individual Outage Duration per Consumer Unit
DIT – Other Distribution Facilities
ESS – System Service Charges
FEC – Equivalent Outage Frequency
FIC – Individual Outage Frequency per Consumer Unit
GSF – Generation Scaling Factor
IRT – Annual Tariff Adjustment Index
O&M – Operation and Maintenance
PCH – Small Hydro Plant
PECLD – Estimated Allowance for Doubtful Accounts
PLD – Difference Settlement Price
PMSO – Personnel, Materials, Services and Others
REN – Energy Recovery
TOI – Inspection Report
TUSD – Distribution System Usage Charge
TUST – Transmission System Usage Charge
UHE – Hydropower Plant
UTE – Thermal Power Plant
VNR – New Replacement Value