Release and Detection of microRNA by Combining Magnetic ...
19
HAL Id: hal-03116605 https://hal.archives-ouvertes.fr/hal-03116605 Submitted on 20 Jan 2021 HAL is a multi-disciplinary open access archive for the deposit and dissemination of sci- entific research documents, whether they are pub- lished or not. The documents may come from teaching and research institutions in France or abroad, or from public or private research centers. L’archive ouverte pluridisciplinaire HAL, est destinée au dépôt et à la diffusion de documents scientifiques de niveau recherche, publiés ou non, émanant des établissements d’enseignement et de recherche français ou étrangers, des laboratoires publics ou privés. Distributed under a Creative Commons Attribution| 4.0 International License Release and Detection of microRNA by Combining Magnetic Hyperthermia and Electrochemistry Modules on a Microfluidic Chip Marie-Charlotte Horny, Vincent Dupuis, Jean-Michel Siaugue, Jean Gamby To cite this version: Marie-Charlotte Horny, Vincent Dupuis, Jean-Michel Siaugue, Jean Gamby. Release and Detection of microRNA by Combining Magnetic Hyperthermia and Electrochemistry Modules on a Microfluidic Chip. Sensors, MDPI, 2021, 21 (1), pp.185. 10.3390/s21010185. hal-03116605
Transcript of Release and Detection of microRNA by Combining Magnetic ...
HAL Id: hal-03116605https://hal.archives-ouvertes.fr/hal-03116605
Submitted on 20 Jan 2021
HAL is a multi-disciplinary open accessarchive for the deposit and dissemination of sci-entific research documents, whether they are pub-lished or not. The documents may come fromteaching and research institutions in France orabroad, or from public or private research centers.
L’archive ouverte pluridisciplinaire HAL, estdestinée au dépôt et à la diffusion de documentsscientifiques de niveau recherche, publiés ou non,émanant des établissements d’enseignement et derecherche français ou étrangers, des laboratoirespublics ou privés.
Distributed under a Creative Commons Attribution| 4.0 International License
Release and Detection of microRNA by CombiningMagnetic Hyperthermia and Electrochemistry Modules
on a Microfluidic ChipMarie-Charlotte Horny, Vincent Dupuis, Jean-Michel Siaugue, Jean Gamby
To cite this version:Marie-Charlotte Horny, Vincent Dupuis, Jean-Michel Siaugue, Jean Gamby. Release and Detectionof microRNA by Combining Magnetic Hyperthermia and Electrochemistry Modules on a MicrofluidicChip. Sensors, MDPI, 2021, 21 (1), pp.185. 10.3390/s21010185. hal-03116605

sensors
Article
Release and Detection of microRNA by Combining MagneticHyperthermia and Electrochemistry Modules on aMicrofluidic Chip
Marie-Charlotte Horny 1,2,3, Vincent Dupuis 2, Jean-Michel Siaugue 2 and Jean Gamby 1,*
Citation: Horny, M.-C.; Dupuis, V.;
Siaugue, J.-M.; Gamby, J. Release and
Detection of microRNA by
Combining Magnetic Hyperthermia
and Electrochemistry Modules on a
Microfluidic Chip. Sensors 2021, 21,
185. https://doi.org/10.3390/
s21010185
Received: 6 November 2020
Accepted: 25 December 2020
Published: 29 December 2020
Publisher’s Note: MDPI stays neu-
tral with regard to jurisdictional clai-
ms in published maps and institutio-
nal affiliations.
Copyright: © 2020 by the authors. Li-
censee MDPI, Basel, Switzerland.
This article is an open access article
distributed under the terms and con-
ditions of the Creative Commons At-
tribution (CC BY) license (https://
creativecommons.org/licenses/by/
4.0/).
1 Université Paris-Saclay, CNRS, Centre de Nanosciences et de Nanotechnologies, 91120 Palaiseau, France;[email protected]
2 Sorbonne Université, CNRS, Physico-Chimie des Électrolytes et Nanosystèmes Interfaciaux, PHENIX,F-75005 Paris, France; [email protected] (V.D.);[email protected] (J.-M.S.)
3 Sorbonne Université, CNRS, Laboratoire Interfaces et Systèmes Electrochimiques, LISE, F-75005 Paris, France* Correspondence: [email protected]; Tel.: +33-1-70-27-06-70
Abstract: The heating of a biologic solution is a crucial part in an amplification process such as thecatalytic detection of a biological target. However, in many situations, heating must be limited inmicrofluidic devices, as high temperatures can cause the denaturation of the chip components. Localheating through magnetic hyperthermia on magnetic nano-objects has opened the doors to numerousimprovements, such as for oncology where a reduced heating allows the synergy of chemotherapyand thermotherapy. Here we report on the design and implementation of a lab on chip without globalheating of samples. It takes advantage of the extreme efficiency of DNA-modified superparamagneticcore–shell nanoparticles to capture complementary sequences (microRNA-target), uses magnetichyperthermia to locally release these targets, and detects them through electrochemical techniquesusing ultra-sensitive channel DNA-modified ultramicroelectrodes. The combination of magnetichyperthermia and microfluidics coupled with on-chip electrochemistry opens the way to a drasticreduction in the time devoted to the steps of extraction, amplification and nucleic acids detection.The originality comes from the design and microfabrication of the microfluidic chip suitable to itsinsertion in the millimetric gap of toric inductance with a ferrite core.
Keywords: microfluidics; nucleic acids; channel microelectrode; magnetic hyperthermia; magneticrelease; core–shell nanoparticles; amorphous carbon nitride; early diagnostics
1. Introduction
Within the framework of early diagnosis, decreased time scales lead to more efficienttreatments but also to less overwhelmed health care centers. With a lower cost per test,molecular diagnosis could be used more often as routine liquid biopsy tests, making it analternative to tissue biopsy or medical imaging such as magnetic resonance imaging (MRI).Currently, sensitivity, specificity and time scales are key parameters for efficient assaysfrom sample to result. Multiple molecular steps are involved in molecular diagnostics toensure result accuracy, but three of them step out as crucially needing reduction because oftheir time scales: target extraction, target release and target detection.
To this goal, miniaturization and coupling of various processes of molecular biologyon the same device were reported to decrease analysis time, to reduce the volume ofreagents and to decrease contamination with fewer steps requiring an operator [1–3].The most advanced devices that meet these specifications are using PCR amplification(polymerase chain reaction) coupled with microfluidics. For each step and amplificationcycle (90 C, 55 C, 70 C and 37 C), the temperature has to be precisely controlledover a large range [4], which is time-consuming, and absolute quantification cannot bereached especially for short RNA sequences [5]. To overcome these limitations, some recent
Sensors 2021, 21, 185. https://doi.org/10.3390/s21010185 https://www.mdpi.com/journal/sensors
Sensors 2021, 21, 185 2 of 18
innovations, digital PCR in droplets, [6–9], isothermal PCR (loop-mediated amplification—LAMP, [10] nucleic acid sequence-based amplification—NASBA and [11] rolling circleamplification—RCA, [12,13]) are becoming interesting alternatives to the classical PCR.Houssin et al. [14] have demonstrated a molecular amplification with a non-isothermalchip with an ultra-rapid thermalization speed using the temperature controller CherryBiotech (heat cooler for microscopy in the 5–70 C temperature range) [10].
Closely following on-chip PCR progresses, recent advances in on-chip electrochemistryhave been obtained due to standard photolithographic or laser photoablation technologiesand microelectrodes to fit into microfluidic devices [15–22]. Electrochemistry has a majoradvantage over other detection methods, in that it directly transduces biological events(e.g., DNA hybridization) without any further transformation of the physical signal [23,24].Combining high specificity, cheapness, ease of use, portability and compatibility withmicrofabrication processes, electrochemical biosensors are excellent candidates for clinicalinterest diagnosis. During the DNA hybridization step, the target’s sequence is identifiedwith a DNA probe that possesses a complementary sequence to the one of the target DNA(Watson and Crick’s rules [25]). Along this line, Ferguson et al. [4] reported an integratedmicrofluidic electrochemical DNA (IMED) sensor coupling two modules on chip e.g., PCRand electrochemical detection (ED) with an enzyme digestion in between to get a single-strand DNA. The PDMS/glass chip is composed of a PCR chamber that performs 38 cyclesof amplifications in 1 h 40 min (including enzyme digestion), controlled by a temperaturecontroller regulating a platinum resistive temperature detector mounted onto a customthermofoil pad. Their gold transducer is composed of a mixed probe layer with thiolatesadsorbed and a methylene blue redox labeled probe diluted with 6-mercapto-1-hexanol.Their device demonstrated a 10 attomolar LOD (limit of detection) for non-purified genomicDNA (17-basis).
All the above described coupling technologies must have a heating system with athermalization chamber and a feedback loop for temperature, whether it is a heating viaJoule effect (nanoheaters), Peltier, infrared or microwaves [13,26,27]. For these reasons,local heating in or outside a chip is an attractive alternative to the global heating of abiological sample.
Local heating using magnetic fluid hyperthermia on magnetic nanoparticles hasproven to induce the death of tumor cells [28–31], and the release of DNA targets attachedto their probe and immobilized on magnetic nanoparticles [32,33]. The use of a complex ex-ternal temperature module with complex calibration systems between water inset, heatinginduced by imaging devices and temperature compensation is avoided. This makes it pos-sible to use a heater with a temperature range from 0 to 95 C, without a feedback loop anddirect temperature measurement of the sample. Dias et al. [32] showed, using DNA strandsof different length and hyperthermia, that the rise in local temperature can be recorded.Similarly, Dong et al. [34] assessed the temperature in the vicinity of nanoparticles.
Here we report on magnetic hyperthermia transposition in microfluidics coupled toelectrochemistry. The latter opens the way to a drastic reduction in the time devoted tomicroRNA targets extraction, amplification and detection steps. The major originality ofour work comes from the microfluidic device design and microfabrication adapted to itsinsertion into the millimetric gap of toric inductance with a ferrite core.
In the first section, the proof of concept of microRNA release with on-chip magnetichyperthermia at room temperature is presented. Hyperthermia in microfluidics allows afine and dynamic tuning of a confined environment (concentrations, flow rates and time ofresidency of particles), while keeping the volume of reaction under the microliter, especiallyrelevant for the use of expensive biological samples. The second section is dedicatedto microelectrode integration on the on-chip magnetic hyperthermia device to combinemicroRNA release and electrochemical detection in a one-step microfluidic protocol.

Sensors 2021, 21, 185 3 of 18
2. Materials and Methods2.1. Chemicals
Sodium chloride (NormaPur), methylene blue (Alfa Aesar), potassium ferricyanide(III), and potassium hexacyanoferrate (II) (Sigma-Aldrich, St Quentin Fallavier, France)were used in the experiments without further purification. N-(3-Dimethylaminopropyl)-N-ethylcarbodiimide hydrochloride (EDC); N-Hydroxy-sulfosuccinimide sodium salt (NHS);3-(N-Morpholino)propanesulfonic acid sodium salt (MOPS) and tetraethoxyorthosilicate(TEOS); 3-(aminopropyl)triethoxysilane (APTS) were purchased from Sigma–Aldrich(St Quentin Fallavier, France). Citric acid was purchased from Merck (Nogent sur Marne,France). 2-[Methoxy(polyethyleneoxypropyl]-trimethoxysilane (PEOS), containing 3–6 ethy-lene oxide groups, was purchased from Gelest (Morrisville, PA, USA). From VWR (Stras-bourg, France) 30% H2O2, HCl and NaOH solutions were obtained.
2.2. Oligonucleotide Sequences
The oligonucleotides were purchased from Integrated DNA Technology (Belgium).The DNA probe (P) is a 21-basis long nucleic acid and is modified with a carboxy-end forconjugation to magnetic nanoparticles. The DNA probe (P’) is modified with an amino-end for microelectrode functionalization. The target is an unmodified DNA sequence of20 bases as written in Table 1 mimicking the fragment of interest, miRNA-122, for thediagnosis of liver cells in case of injury (hepatitis, alcoholism and obesity).
Table 1. Sequences of oligonucleotide strands.
Oligonucleotide Sequence (5′ to 3′)
DNA Probe (P) for MNPs 5′-Carboxy C6-CAA ACA CCA TTG TCA CAC TGC-3′
DNA Probe (P’) for microelectrodes 5′-Amino C6-CAA ACA CCA TTG TCA CAC TGC-3′
Target (T) 5′-GC AGT GTG ACA ATG GTG TTT G-3′
2.3. DNA Hybridization on Core–Shell Nanoparticles γ-Fe2O3 @SiO2 PEG/NH2, Release andTarget Detection
Core–shell nanoparticles γ-Fe2O3@SiO2 PEG/NH2 were synthetized (see Appendix A)and functionalized with the carboxy-modified DNA probe (Table 1). An amount of 120 µLof a carboxy-modified DNA probe at 1000 µg mL−1 and 120 µL of a complementary DNAtarget (10:1 probe) at 1 × 10⁴ µg mL−1 were left to hybridize in MOPS 0.1 M pH 7.4, NaCl0.5 M for 30 min. Coupling reagents EDC and NHS (200 and 335 equivalents related tothe DNA-probe respectively) were poured into the reacting solution for 20 min. A volumeof 78 µL of core shell nanoparticles solution ([Fe] = 0.016 M) was added and left to reactovernight. Miltenyi columns were used for magnetic separation, performed by rinsingtwice with 500 µL of MOPS 0.1 M pH 7.4 and NaCl 0.5 M followed by DNA grafted coreshell nanoparticles elution with 1 mL of MOPS 0.1 M, pH 7.4 and NaCl 0.5 M.
After DNA duplex immobilization on magnetic nanoparticles, the duplexes wereintroduced in the microfluidic device at a specific flow rate with the use of a programmablesyringe pump. For the fluorescence measurements, either 100 or 400 µL of the outletsolution from the device was collected and filtrated with a Miltenyi column to discardnanoparticles before DNA target released for measurement.
Sensors 2021, 21, 185 4 of 18
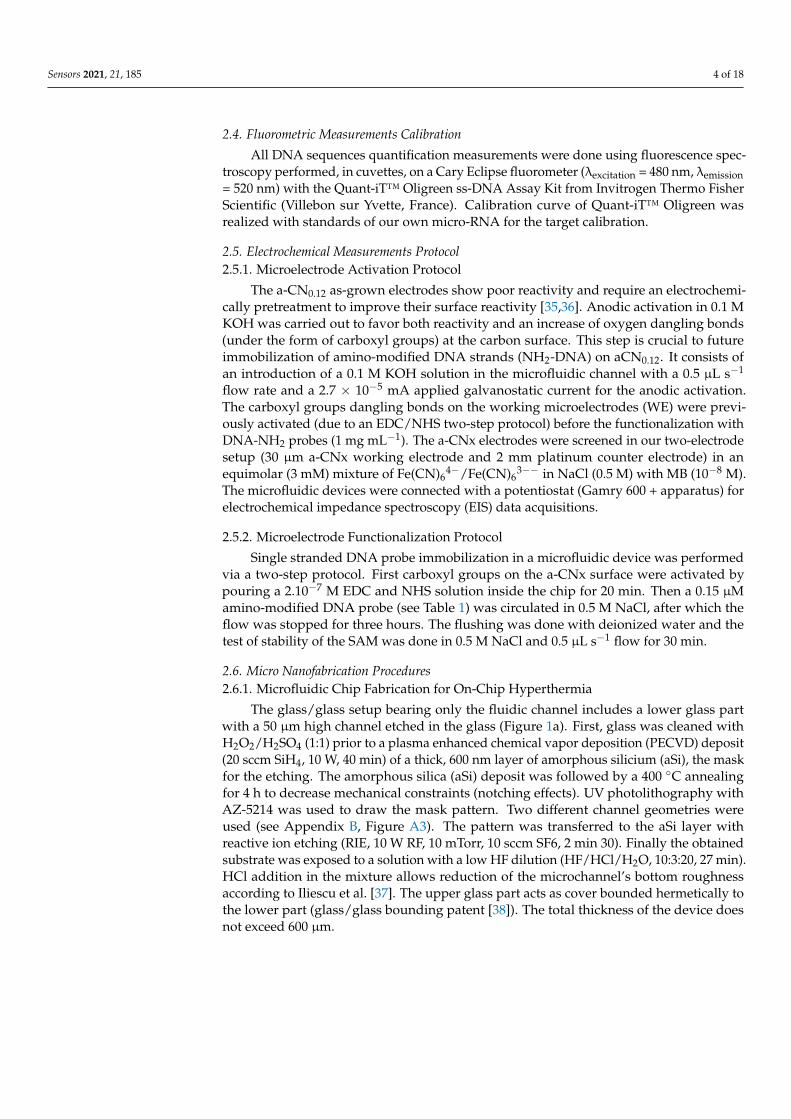
2.4. Fluorometric Measurements Calibration
All DNA sequences quantification measurements were done using fluorescence spec-troscopy performed, in cuvettes, on a Cary Eclipse fluorometer (λexcitation = 480 nm, λemission= 520 nm) with the Quant-iT™ Oligreen ss-DNA Assay Kit from Invitrogen Thermo FisherScientific (Villebon sur Yvette, France). Calibration curve of Quant-iT™ Oligreen wasrealized with standards of our own micro-RNA for the target calibration.
2.5. Electrochemical Measurements Protocol2.5.1. Microelectrode Activation Protocol
The a-CN0.12 as-grown electrodes show poor reactivity and require an electrochemi-cally pretreatment to improve their surface reactivity [35,36]. Anodic activation in 0.1 MKOH was carried out to favor both reactivity and an increase of oxygen dangling bonds(under the form of carboxyl groups) at the carbon surface. This step is crucial to futureimmobilization of amino-modified DNA strands (NH2-DNA) on aCN0.12. It consists ofan introduction of a 0.1 M KOH solution in the microfluidic channel with a 0.5 µL s−1
flow rate and a 2.7 × 10⁻⁵ mA applied galvanostatic current for the anodic activation.The carboxyl groups dangling bonds on the working microelectrodes (WE) were previ-ously activated (due to an EDC/NHS two-step protocol) before the functionalization withDNA-NH2 probes (1 mg mL−1). The a-CNx electrodes were screened in our two-electrodesetup (30 µm a-CNx working electrode and 2 mm platinum counter electrode) in anequimolar (3 mM) mixture of Fe(CN)6
4−/Fe(CN)63−− in NaCl (0.5 M) with MB (10−8 M).
The microfluidic devices were connected with a potentiostat (Gamry 600 + apparatus) forelectrochemical impedance spectroscopy (EIS) data acquisitions.
2.5.2. Microelectrode Functionalization Protocol
Single stranded DNA probe immobilization in a microfluidic device was performedvia a two-step protocol. First carboxyl groups on the a-CNx surface were activated bypouring a 2.10−7 M EDC and NHS solution inside the chip for 20 min. Then a 0.15 µMamino-modified DNA probe (see Table 1) was circulated in 0.5 M NaCl, after which theflow was stopped for three hours. The flushing was done with deionized water and thetest of stability of the SAM was done in 0.5 M NaCl and 0.5 µL s−1 flow for 30 min.
2.6. Micro Nanofabrication Procedures2.6.1. Microfluidic Chip Fabrication for On-Chip Hyperthermia
The glass/glass setup bearing only the fluidic channel includes a lower glass partwith a 50 µm high channel etched in the glass (Figure 1a). First, glass was cleaned withH2O2/H2SO4 (1:1) prior to a plasma enhanced chemical vapor deposition (PECVD) deposit(20 sccm SiH4, 10 W, 40 min) of a thick, 600 nm layer of amorphous silicium (aSi), the maskfor the etching. The amorphous silica (aSi) deposit was followed by a 400 C annealingfor 4 h to decrease mechanical constraints (notching effects). UV photolithography withAZ-5214 was used to draw the mask pattern. Two different channel geometries wereused (see Appendix B, Figure A3). The pattern was transferred to the aSi layer withreactive ion etching (RIE, 10 W RF, 10 mTorr, 10 sccm SF6, 2 min 30). Finally the obtainedsubstrate was exposed to a solution with a low HF dilution (HF/HCl/H2O, 10:3:20, 27 min).HCl addition in the mixture allows reduction of the microchannel’s bottom roughnessaccording to Iliescu et al. [37]. The upper glass part acts as cover bounded hermetically tothe lower part (glass/glass bounding patent [38]). The total thickness of the device doesnot exceed 600 µm.
Sensors 2021, 21, 185 5 of 18
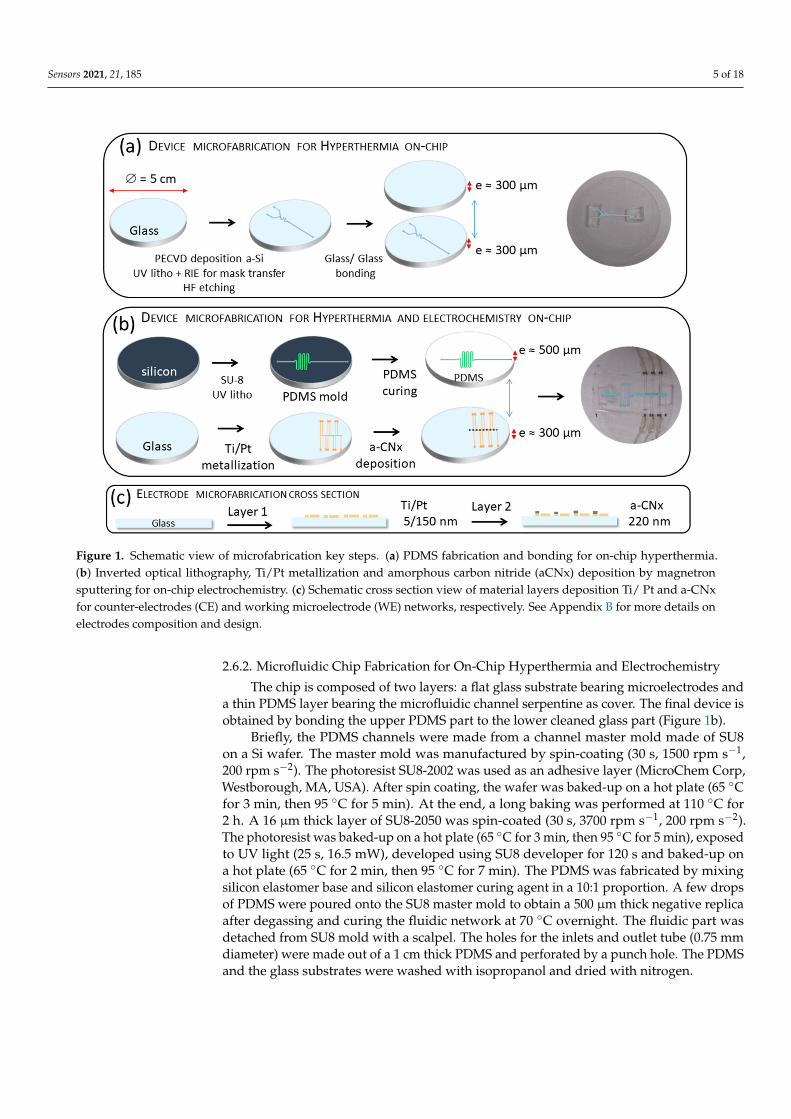
Figure 1. Schematic view of microfabrication key steps. (a) PDMS fabrication and bonding for on-chip hyperthermia.(b) Inverted optical lithography, Ti/Pt metallization and amorphous carbon nitride (aCNx) deposition by magnetronsputtering for on-chip electrochemistry. (c) Schematic cross section view of material layers deposition Ti/ Pt and a-CNxfor counter-electrodes (CE) and working microelectrode (WE) networks, respectively. See Appendix B for more details onelectrodes composition and design.
2.6.2. Microfluidic Chip Fabrication for On-Chip Hyperthermia and Electrochemistry
The chip is composed of two layers: a flat glass substrate bearing microelectrodes anda thin PDMS layer bearing the microfluidic channel serpentine as cover. The final device isobtained by bonding the upper PDMS part to the lower cleaned glass part (Figure 1b).
Briefly, the PDMS channels were made from a channel master mold made of SU8on a Si wafer. The master mold was manufactured by spin-coating (30 s, 1500 rpm s−1,200 rpm s−2). The photoresist SU8-2002 was used as an adhesive layer (MicroChem Corp,Westborough, MA, USA). After spin coating, the wafer was baked-up on a hot plate (65 Cfor 3 min, then 95 C for 5 min). At the end, a long baking was performed at 110 C for2 h. A 16 µm thick layer of SU8-2050 was spin-coated (30 s, 3700 rpm s−1, 200 rpm s−2).The photoresist was baked-up on a hot plate (65 C for 3 min, then 95 C for 5 min), exposedto UV light (25 s, 16.5 mW), developed using SU8 developer for 120 s and baked-up ona hot plate (65 C for 2 min, then 95 C for 7 min). The PDMS was fabricated by mixingsilicon elastomer base and silicon elastomer curing agent in a 10:1 proportion. A few dropsof PDMS were poured onto the SU8 master mold to obtain a 500 µm thick negative replicaafter degassing and curing the fluidic network at 70 C overnight. The fluidic part wasdetached from SU8 mold with a scalpel. The holes for the inlets and outlet tube (0.75 mmdiameter) were made out of a 1 cm thick PDMS and perforated by a punch hole. The PDMSand the glass substrates were washed with isopropanol and dried with nitrogen.
Sensors 2021, 21, 185 6 of 18
3. Results3.1. Setup for Performing Magnetic Hyperthermia On-Chip
Microfluidic chip fabrication for hyperthermia (Figure 1a) and its coupling with on-chip electrochemistry (Figure 1b) are above described. Our miniaturized setup was inspiredfrom the large scale setup from Lacroix et al. [39] where homogeneous radiofrequency (RF)magnetic field is produced inside a large 1 cm ferrite gap (in which the Eppendorf tubeis inserted). In our homemade set-up, the homogeneous RF magnetic field is producedinside a small 1 mm gap (in which the microfluidic serpentine is inserted), cut in a low lossferrite ring on which 55 turns of Litz wire are wound. This magnetizing coil is coupled toa 1 nF capacitor to form a series LC circuit, whose resonance frequency is about 180 kHz.The resonant circuit is excited at the resonance frequency by a signal generator coupled toa RF power amplifier and produces magnetic field amplitude of 370 Oe (measured usinga single turn pick-up coil). The microfluidic channel was connected to a programmablesyringe pump allowing flow rates from 0.01 to 5 µL s−1.
3.1.1. Theory of Electromagnetism, an Electromagnet with a Gap
The setup is taking advantage of the use of an electromagnet with a millimetric gap(ca. 1 mm) with a winding composed of n spires in which is flowing a current i. The gapcan be considered as a thin layer of air perpendicular to the median line of the circuit,and with a thickness far below the mean torus perimeter. In these conditions, edge effectscan be neglected, and it is commonly admitted that the magnetic lines are parallel to themedian line of the torus.
Assuming that the gap length is small (compared to the core length) and that therelative magnetic permeability of the ferrite is large, the field, He, in the gap, e, can bewritten as follows
He =n× i
e(1)
with n, the number of spires, i the current intensity in the spires. The magnetic flux, φ,transiting through the circuit, especially in the gap, is given by:
ϕ =µ0 × n× i× S
e(2)
with µ0 represents the vacuum permeability and S, the spires’ surface.Equation (2) highlights the possibility to reach a high field by focusing, in a small gap,
the field produced by an inductance with dimensions far above the one of the gap [40].
3.1.2. Magnetic Hyperthermia, Neel and Brown Contributions
Superparamagnetic particles exhibit a heating behavior when submitted to an alterna-tive magnetic field. The calculation of magnetization relaxation times depends on the waythe particle is rotating in the solvent of dispersion, either external (Brown relaxation) orinternal (Neel relaxation). Brown relaxation comes from the physical rotation of MNPs inthe carrier fluid, the magnetic moment being locked onto the crystal anisotropy axis with acharacteristic time, τB, given in the herein Shliomis [41]:
τB =3× η ×Vhydro
k× T(3)
where, η is the viscosity of the carrier fluid, k the Boltzmann constant, T the temperatureand Vhydro the hydrodynamic volume of the particle.

Sensors 2021, 21, 185 7 of 18
Neel relaxation is induced by the rotation of the MNP magnetic moment within thecrystalline network, which occurs when the anisotropy energy barrier K.V (for a uniaxialcrystal) is overcome. The released energy by the spin relaxation is dependent on theanisotropy energy of the MNP, i.e., the energy that imposes the direction of the magneticmoment within the crystalline network. The characteristic time, τN, for Neel relaxation iswritten as follows,
τN= τ0 × eEa
kBT (4)
where τ0 is of the order of 10−9 s and Ea = kB×T, the thermal energy.Our MNPs are composed of multiple single domain of maghemite cores aggre-
gated inside a silica shell forming more or less well-defined short chain-like aggregates(see Appendix A for synthesis of core–shell nanoparticles γ-Fe2O3@SiO2 PEG/NH2). In liq-uids, both Neel and Brown relaxation occur; the predominant process being that with theshortest characteristic time (1/τ= 1/τN + 1/τB). For a monodomain core, the time necessaryto jump over the magnetic anisotropy energy barrier K.V is governed by Neel relaxationtime with τN, in the order of magnitude of a few nanoseconds. For bigger particles there isa contribution of Brown relaxation.
Fortin et al. determined by using different solvent viscosities (restriction of the particleorientation) that the loss process for maghemite particles with diameters below 16 nm inwater was governed by Neel relaxation [42].
3.1.3. Magnetic Hyperthermia on Chip
The device thus takes advantage of an optimal field (the field magnitude increaseswith the inverse of the gap size) and an increase of the reaction due to confinement.However, to fit into the 1 mm gap of the torus generating the field, the microfluidicchip’s thickness has to be less than 1 mm. This was achieved by using thin glass coveror by manufacturing ultra-thin PDMS layers (see Figure 1a,b). Two flow rates (0.11 and0.01 µL s−1) within microfluidic channels (see Appendix B, Figure A3) were selected toinvestigate the magnetic nanoparticles residence time under the AC magnetic field andthus the time of DNA heating. Table 2 summarizes the experimental condition used interms of flow rates, time of residence, volume of detection and time of experiment. Flowrates and time of experiment were calculated so that the final volume recovered after ∆tcontains enough single-strand DNA to perform reliable fluorometric detection. The torehas a 1 cm2 section. The path length under the tore where MNP are circulating in theserpentine configuration and is thus 1 cm. The residence time is given by Equation (5),as follows:
∆t =w× d× h
v(5)
where, ∆t is the residence time of the suspension of nanoparticles under the magneticfield, w.d the section of the channel under the electromagnet (w, the channel width, and d,the length under the magnet), v the flow rate and h the channel height.
Table 2. Comparison of optimized parameters for flow rates and residency time under AC fieldwith fluidic geometry A (see Appendix B, Figure A3b) for on-chip magnetic hyperthermia andfluorometric detection.
Fluidic Geometry v (µL s−1) Residence Time (t) Volume ofDetection (µL) ∆t §
A 0.11 3 s 400 2 h 48 minA 0.01 12 s 100 2 h 48 min
§ minimum time of experiment to get a sufficient volume V for fluorometric detection.
Sensors 2021, 21, 185 8 of 18
DNA hybridization on core–shell nanoparticles γ-Fe2O3 @SiO2 PEG/NH2, releaseand target detection protocols are given in the Section 2.3.
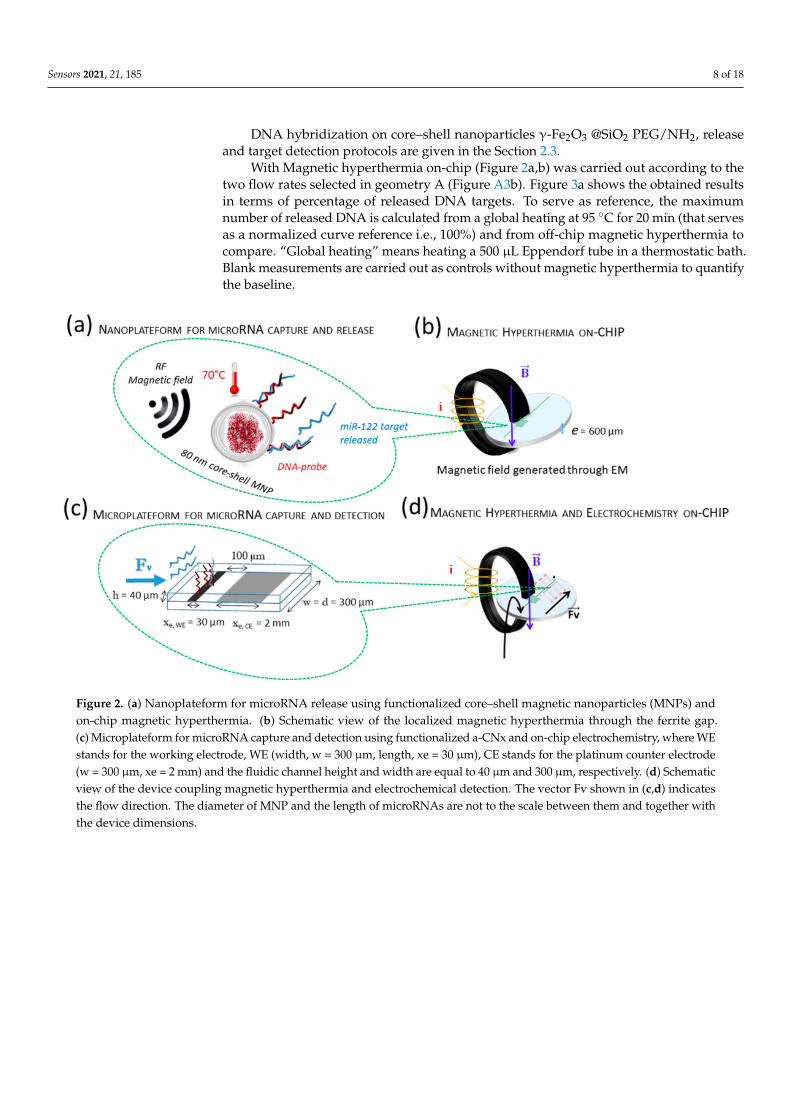
With Magnetic hyperthermia on-chip (Figure 2a,b) was carried out according to thetwo flow rates selected in geometry A (Figure A3b). Figure 3a shows the obtained resultsin terms of percentage of released DNA targets. To serve as reference, the maximumnumber of released DNA is calculated from a global heating at 95 C for 20 min (that servesas a normalized curve reference i.e., 100%) and from off-chip magnetic hyperthermia tocompare. “Global heating” means heating a 500 µL Eppendorf tube in a thermostatic bath.Blank measurements are carried out as controls without magnetic hyperthermia to quantifythe baseline.
Figure 2. (a) Nanoplateform for microRNA release using functionalized core–shell magnetic nanoparticles (MNPs) andon-chip magnetic hyperthermia. (b) Schematic view of the localized magnetic hyperthermia through the ferrite gap.(c) Microplateform for microRNA capture and detection using functionalized a-CNx and on-chip electrochemistry, where WEstands for the working electrode, WE (width, w = 300 µm, length, xe = 30 µm), CE stands for the platinum counter electrode(w = 300 µm, xe = 2 mm) and the fluidic channel height and width are equal to 40 µm and 300 µm, respectively. (d) Schematicview of the device coupling magnetic hyperthermia and electrochemical detection. The vector Fv shown in (c,d) indicatesthe flow direction. The diameter of MNP and the length of microRNAs are not to the scale between them and together withthe device dimensions.
Sensors 2021, 21, 185 9 of 18
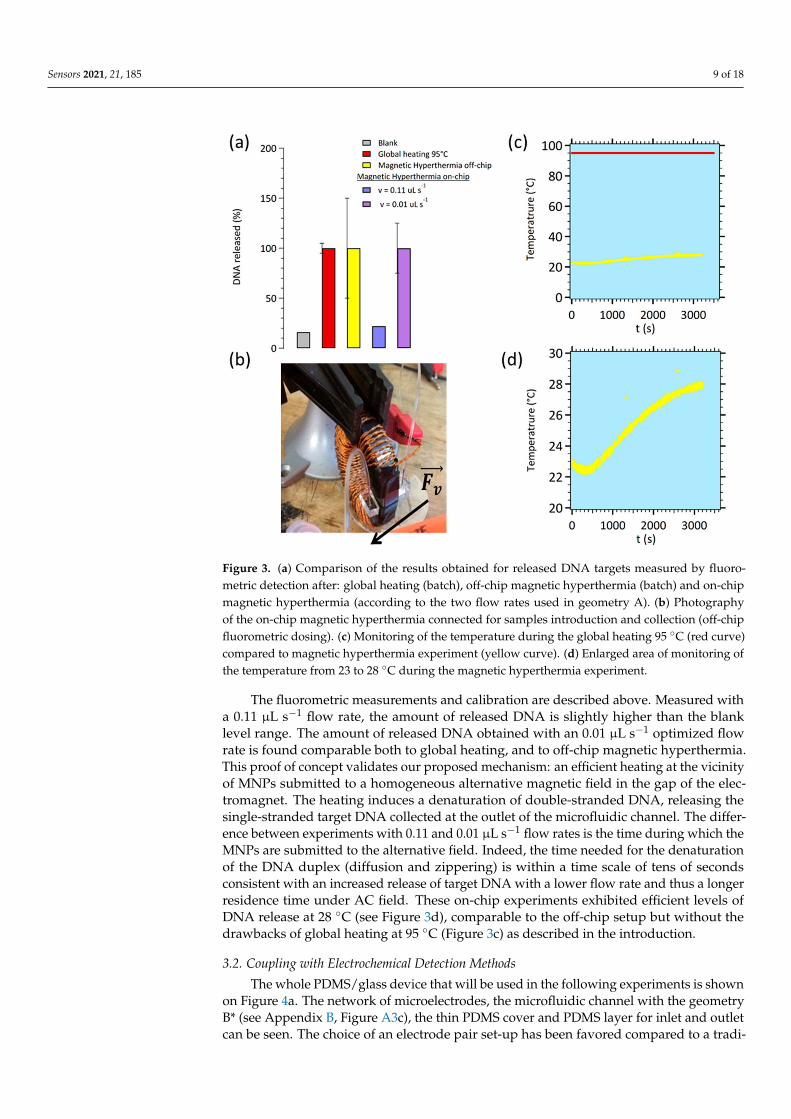
Figure 3. (a) Comparison of the results obtained for released DNA targets measured by fluoro-metric detection after: global heating (batch), off-chip magnetic hyperthermia (batch) and on-chipmagnetic hyperthermia (according to the two flow rates used in geometry A). (b) Photographyof the on-chip magnetic hyperthermia connected for samples introduction and collection (off-chipfluorometric dosing). (c) Monitoring of the temperature during the global heating 95 C (red curve)compared to magnetic hyperthermia experiment (yellow curve). (d) Enlarged area of monitoring ofthe temperature from 23 to 28 C during the magnetic hyperthermia experiment.
The fluorometric measurements and calibration are described above. Measured witha 0.11 µL s−1 flow rate, the amount of released DNA is slightly higher than the blanklevel range. The amount of released DNA obtained with an 0.01 µL s−1 optimized flowrate is found comparable both to global heating, and to off-chip magnetic hyperthermia.This proof of concept validates our proposed mechanism: an efficient heating at the vicinityof MNPs submitted to a homogeneous alternative magnetic field in the gap of the elec-tromagnet. The heating induces a denaturation of double-stranded DNA, releasing thesingle-stranded target DNA collected at the outlet of the microfluidic channel. The differ-ence between experiments with 0.11 and 0.01 µL s−1 flow rates is the time during which theMNPs are submitted to the alternative field. Indeed, the time needed for the denaturationof the DNA duplex (diffusion and zippering) is within a time scale of tens of secondsconsistent with an increased release of target DNA with a lower flow rate and thus a longerresidence time under AC field. These on-chip experiments exhibited efficient levels ofDNA release at 28 C (see Figure 3d), comparable to the off-chip setup but without thedrawbacks of global heating at 95 C (Figure 3c) as described in the introduction.
3.2. Coupling with Electrochemical Detection Methods
The whole PDMS/glass device that will be used in the following experiments is shownon Figure 4a. The network of microelectrodes, the microfluidic channel with the geometryB* (see Appendix B, Figure A3c), the thin PDMS cover and PDMS layer for inlet and outletcan be seen. The choice of an electrode pair set-up has been favored compared to a tradi-

Sensors 2021, 21, 185 10 of 18
tional three electrodes configuration for two main advantages. First, from a technologicalpoint of view, the microfabrication process contains less steps. For instance no planarAg/AgCl reference electrode integration step in the microdevice is needed. Second, as de-scribed in Figure 2c and A3 caption (see Appendix B), the large CE (300 µm × 2 × 103 µm)versus WE (300 µm × 30 µm) area ratio (ACE/AWE ~ 70-fold) permits the drastic reductionof the CE current density (jCE = i/ACE) and concomitantly stabilizes the rest potential at0 volts with the addition of an equimolar mixture of the [Fe(III)(CN)6]3−/[Fe(II)(CN)6]4−
redox couple in solution. With these conditions, the CE electrode can be viewed as a pseudo-reference electrode [21,43]. In addition, to reducing the time of experiment, one way is toplay on the geometry of the channel notably by increasing the volume under the AC field.The choice was made to increase the path length of the serpentine, giving rise to geometryB* with a serpentine of 5.7 cm in length instead of 1 cm (see Figure A3b versus Figure A3c).Table 3 shows the updated parameters.
Figure 4. (a) Picture of the final PDMS/glass microfluidic setup for magnetic hyperthermia and electrochemical detectioncoupling. For convenient the microfluidic channel is highlighted in blue. (b) Microchip insertion for the localized magnetichyperthermia through the ferrite gap. (c) On-chip hyperthermia protocol to release micro-RNA targets from magneticnanoparticles coupled with electrochemical detection. (1) DNA probe and micro-RNA target are hybridized outside the chip.(2) Off-chip grafting of double-strand DNA/micro-RNA via peptide coupling on MNPs. (3) Introduction of functionalizedMNPs in the microfluidic device for magnetic hyperthermia release under the AC magnetic field. Hybridization of releasedtargets on the carbon microelectrode sensor functionalized with complementary probes. (4) micro-RNA electrochemicaldetection in 3 mM FeIIICN6
3−/FeIICN64−, 10−8M methylene blue (MB) diluted in 0.5 M NaCl electrolyte. (d) Electrochemical
impedance responses of the electrochemical on-chip detection of hybridization (following hyperthermia on-chip step)between 100 kHz and 0.2 Hz with 10 mV AC signal perturbation on the microchannel electrode sensor filled with of3 mM [Fe(III)(CN)6]3−/[Fe(II)(CN)6]4− + 10−8 M MB in 0.5 M NaCl. Nyquist plot of probe immobilized on carbon nitridemicroelectrode after circulating of 100 µg mL−1 DNA probe sequence diluted in 0.5 M NaCl for a 0.5 µL s−1 working flow(#). Target hybridization of miR-122 released for a working flow of 0.056 µL s−1 (#).
Sensors 2021, 21, 185 11 of 18
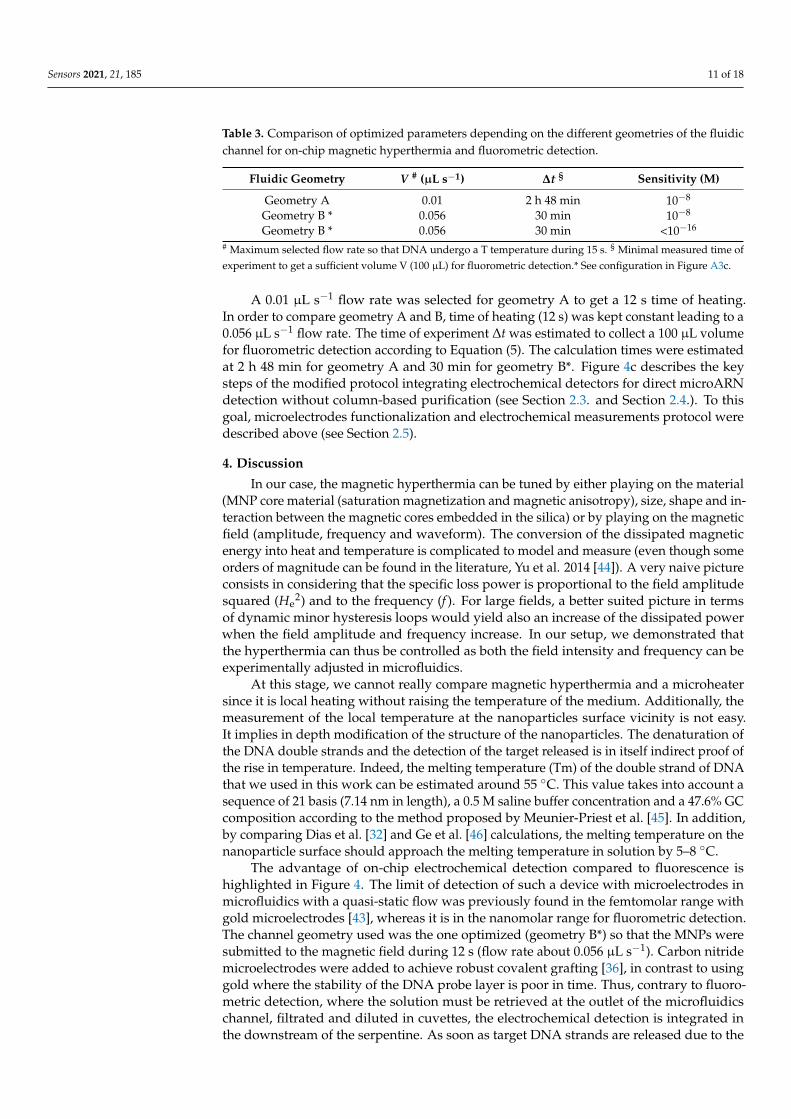
Table 3. Comparison of optimized parameters depending on the different geometries of the fluidicchannel for on-chip magnetic hyperthermia and fluorometric detection.
Fluidic Geometry V # (µL s−1) ∆t § Sensitivity (M)
Geometry A 0.01 2 h 48 min 10−8
Geometry B * 0.056 30 min 10−8
Geometry B * 0.056 30 min <10−16
# Maximum selected flow rate so that DNA undergo a T temperature during 15 s. § Minimal measured time ofexperiment to get a sufficient volume V (100 µL) for fluorometric detection.* See configuration in Figure A3c.
A 0.01 µL s−1 flow rate was selected for geometry A to get a 12 s time of heating.In order to compare geometry A and B, time of heating (12 s) was kept constant leading to a0.056 µL s−1 flow rate. The time of experiment ∆t was estimated to collect a 100 µL volumefor fluorometric detection according to Equation (5). The calculation times were estimatedat 2 h 48 min for geometry A and 30 min for geometry B*. Figure 4c describes the keysteps of the modified protocol integrating electrochemical detectors for direct microARNdetection without column-based purification (see Section 2.3. and Section 2.4.). To thisgoal, microelectrodes functionalization and electrochemical measurements protocol weredescribed above (see Section 2.5).
4. Discussion
In our case, the magnetic hyperthermia can be tuned by either playing on the material(MNP core material (saturation magnetization and magnetic anisotropy), size, shape and in-teraction between the magnetic cores embedded in the silica) or by playing on the magneticfield (amplitude, frequency and waveform). The conversion of the dissipated magneticenergy into heat and temperature is complicated to model and measure (even though someorders of magnitude can be found in the literature, Yu et al. 2014 [44]). A very naive pictureconsists in considering that the specific loss power is proportional to the field amplitudesquared (He
2) and to the frequency (f ). For large fields, a better suited picture in termsof dynamic minor hysteresis loops would yield also an increase of the dissipated powerwhen the field amplitude and frequency increase. In our setup, we demonstrated thatthe hyperthermia can thus be controlled as both the field intensity and frequency can beexperimentally adjusted in microfluidics.
At this stage, we cannot really compare magnetic hyperthermia and a microheatersince it is local heating without raising the temperature of the medium. Additionally, themeasurement of the local temperature at the nanoparticles surface vicinity is not easy.It implies in depth modification of the structure of the nanoparticles. The denaturation ofthe DNA double strands and the detection of the target released is in itself indirect proof ofthe rise in temperature. Indeed, the melting temperature (Tm) of the double strand of DNAthat we used in this work can be estimated around 55 C. This value takes into account asequence of 21 basis (7.14 nm in length), a 0.5 M saline buffer concentration and a 47.6% GCcomposition according to the method proposed by Meunier-Priest et al. [45]. In addition,by comparing Dias et al. [32] and Ge et al. [46] calculations, the melting temperature on thenanoparticle surface should approach the melting temperature in solution by 5–8 C.
The advantage of on-chip electrochemical detection compared to fluorescence ishighlighted in Figure 4. The limit of detection of such a device with microelectrodes inmicrofluidics with a quasi-static flow was previously found in the femtomolar range withgold microelectrodes [43], whereas it is in the nanomolar range for fluorometric detection.The channel geometry used was the one optimized (geometry B*) so that the MNPs weresubmitted to the magnetic field during 12 s (flow rate about 0.056 µL s−1). Carbon nitridemicroelectrodes were added to achieve robust covalent grafting [36], in contrast to usinggold where the stability of the DNA probe layer is poor in time. Thus, contrary to fluoro-metric detection, where the solution must be retrieved at the outlet of the microfluidicschannel, filtrated and diluted in cuvettes, the electrochemical detection is integrated inthe downstream of the serpentine. As soon as target DNA strands are released due to the
Sensors 2021, 21, 185 12 of 18
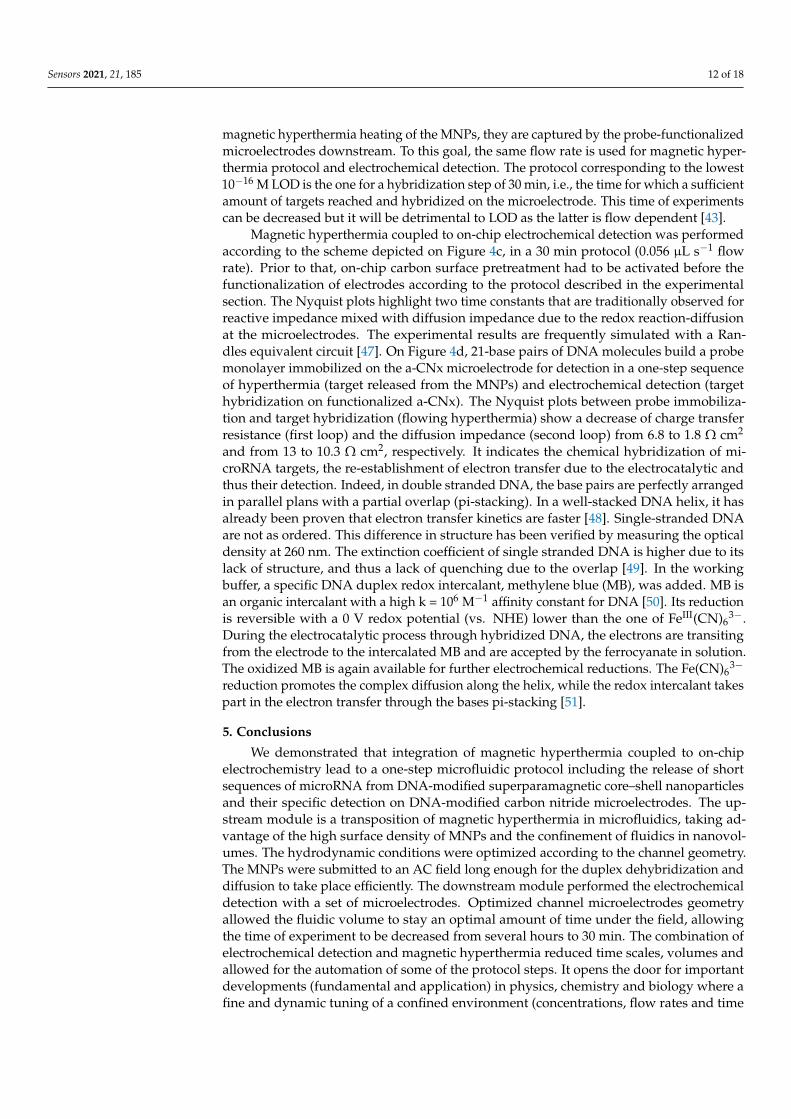
magnetic hyperthermia heating of the MNPs, they are captured by the probe-functionalizedmicroelectrodes downstream. To this goal, the same flow rate is used for magnetic hyper-thermia protocol and electrochemical detection. The protocol corresponding to the lowest10−16 M LOD is the one for a hybridization step of 30 min, i.e., the time for which a sufficientamount of targets reached and hybridized on the microelectrode. This time of experimentscan be decreased but it will be detrimental to LOD as the latter is flow dependent [43].
Magnetic hyperthermia coupled to on-chip electrochemical detection was performedaccording to the scheme depicted on Figure 4c, in a 30 min protocol (0.056 µL s−1 flowrate). Prior to that, on-chip carbon surface pretreatment had to be activated before thefunctionalization of electrodes according to the protocol described in the experimentalsection. The Nyquist plots highlight two time constants that are traditionally observed forreactive impedance mixed with diffusion impedance due to the redox reaction-diffusionat the microelectrodes. The experimental results are frequently simulated with a Ran-dles equivalent circuit [47]. On Figure 4d, 21-base pairs of DNA molecules build a probemonolayer immobilized on the a-CNx microelectrode for detection in a one-step sequenceof hyperthermia (target released from the MNPs) and electrochemical detection (targethybridization on functionalized a-CNx). The Nyquist plots between probe immobiliza-tion and target hybridization (flowing hyperthermia) show a decrease of charge transferresistance (first loop) and the diffusion impedance (second loop) from 6.8 to 1.8 Ω cm2
and from 13 to 10.3 Ω cm2, respectively. It indicates the chemical hybridization of mi-croRNA targets, the re-establishment of electron transfer due to the electrocatalytic andthus their detection. Indeed, in double stranded DNA, the base pairs are perfectly arrangedin parallel plans with a partial overlap (pi-stacking). In a well-stacked DNA helix, it hasalready been proven that electron transfer kinetics are faster [48]. Single-stranded DNAare not as ordered. This difference in structure has been verified by measuring the opticaldensity at 260 nm. The extinction coefficient of single stranded DNA is higher due to itslack of structure, and thus a lack of quenching due to the overlap [49]. In the workingbuffer, a specific DNA duplex redox intercalant, methylene blue (MB), was added. MB isan organic intercalant with a high k = 106 M−1 affinity constant for DNA [50]. Its reductionis reversible with a 0 V redox potential (vs. NHE) lower than the one of FeIII(CN)6
3−.During the electrocatalytic process through hybridized DNA, the electrons are transitingfrom the electrode to the intercalated MB and are accepted by the ferrocyanate in solution.The oxidized MB is again available for further electrochemical reductions. The Fe(CN)6
3−
reduction promotes the complex diffusion along the helix, while the redox intercalant takespart in the electron transfer through the bases pi-stacking [51].
5. Conclusions
We demonstrated that integration of magnetic hyperthermia coupled to on-chipelectrochemistry lead to a one-step microfluidic protocol including the release of shortsequences of microRNA from DNA-modified superparamagnetic core–shell nanoparticlesand their specific detection on DNA-modified carbon nitride microelectrodes. The up-stream module is a transposition of magnetic hyperthermia in microfluidics, taking ad-vantage of the high surface density of MNPs and the confinement of fluidics in nanovol-umes. The hydrodynamic conditions were optimized according to the channel geometry.The MNPs were submitted to an AC field long enough for the duplex dehybridization anddiffusion to take place efficiently. The downstream module performed the electrochemicaldetection with a set of microelectrodes. Optimized channel microelectrodes geometryallowed the fluidic volume to stay an optimal amount of time under the field, allowingthe time of experiment to be decreased from several hours to 30 min. The combination ofelectrochemical detection and magnetic hyperthermia reduced time scales, volumes andallowed for the automation of some of the protocol steps. It opens the door for importantdevelopments (fundamental and application) in physics, chemistry and biology where afine and dynamic tuning of a confined environment (concentrations, flow rates and time

Sensors 2021, 21, 185 13 of 18
of residency of nanoparticles), where the microchannel volume of reaction is under themicroliter, while maintaining the microchannel at room temperature.
Author Contributions: J.G. supervised the research project. M.-C.H. and J.G. optimized the devicemicrofabrication steps in cleanrooms for on-chip hyperthermia integrating microelectrodes andprepared samples and protocols for electrochemical measurements. M.-C.H. and J.-M.S. optimizedthe core–shell nanoparticles γ-Fe2O3 @SiO2 PEG/NH2 synthesis and functionalization with DNAprobes for magnetic hyperthermia. V.D. designed the configuration the ferrite gap and optimized withM.-C.H. set-up for homogeneous RF magnetic field. J.G. wrote the paper and all authors commentedon the paper. All authors have read and agreed to the published version of the manuscript.
Funding: This research was funded by the LabEx MiChem part of French state funds managed bythe ANR within the Investissements d’Avenir program under the reference ANR-11IDEX-0004-02.
Institutional Review Board Statement: Not applicable.
Informed Consent Statement: Not applicable.
Data Availability Statement: Data sharing is not applicable to this article.
Acknowledgments: This work was supported by the C2N-CNRS technological platform, a memberof the RENATECH network.
Conflicts of Interest: The authors declare no conflict of interest.
Appendix A
Synthesis of Core–Shell Nanoparticles γ-Fe2O3@SiO2 PEG/NH2
The size sorted maghemite γ-Fe2O3 nanoparticles were obtained by a Massart’s copre-cipitation method [52]. One liter of NH3 22.5% was added to an acidic iron (II) and iron (III)ions solution (180 g of FeCl2, 100 mL of HCl 37% and 715 mL of FeCl3 35.2%, in 3.5 L of dis-tilled water) under agitation. After rinsing with distilled water using magnetic decantation,the obtained Fe3O4 nanoparticles were oxidized in maghemite nanoparticles and then sizesorted and citrated due to previously reported protocols [53,54]. Size distribution of sortedγ-Fe2O3 nanoparticles was characterized by transmission electron microscopy (TEM) on aJEOL 1011 instrument (Figure A1a). Nanoparticles’ images analysis was done with Image Jsoftware on 200 nanoparticles using a spherical model. The size distribution (Figure A1b)was analyzed as a Log Normal distribution leading to a mean physical diameter of 11.8 nm(σ = 0.12).
Figure A1. TEM image (a) and size distribution (b) of size sorted γ-Fe2O3 nanoparticles.

Sensors 2021, 21, 185 14 of 18
Silica coating was performed using a modified previously reported protocol [55–57].Of size sorted γ-Fe2O3 nanoparticles solution ([Fe] = 1.02 M) 700 µL were diluted in 50 mLof water and 100 mL of ethanol (99%). Then 6 mL of NH4Cl solution (0.1 M) was addedin order to increase the ionic strength thus inducing slight aggregation of the magneticcores. Subsequently, 900 µL of TEOS and 1.88 mL of NH3 30% were added. After 2 h ofagitation, the functionalization of the silica shell by short polyethylene glycol (PEG) chainsand amine functions was carried out by the addition of 300 µL of TEOS, 350 µL of PEOSand 150 µL of APTS. The mixture was stirred overnight. The resulting nanoparticles werethen rinsed 3 times with a mixture of diethylether/ethanol 15:1 and finally redispersed in50 mL of a 3-morpholinopropane-1-sulfonic acid (MOPS) buffer at 0.1 mol/L and pH = 7.4.
The obtained core–shell nanoparticles γ-Fe2O3 @SiO2 PEG/NH2 were characterizedby TEM (Figure A2a). The nanoparticles’ image analysis was done with Image J softwareusing an elliptical model on 110 nanoparticles. The size distributions were analyzed as LogNormal distributions, leading to a mean major axis of 60.3 nm (σ = 0.44) for the magneticcores (Figure A2b) and of 97.9 nm (σ = 0.35) for the core–shell nanoparticles (Figure A2c).
Figure A2. TEM images (a) and size distribution: (b) cores and (c) core–shell nanoparticles of core–shell nanoparticlesγ-Fe2O3 @SiO2 PEG/NH2.
In comparison to spherical core shell nanoparticles previously described [56] largercore shell nanoparticles with an elliptical morphology are obtained. Size sorted γ-Fe2O3nanoparticles form short chain-like structures inside the silica shell. This can be explainedby the increase of the ionic strength, leading to a slight aggregation and an alignment ofmagnetic nanoparticles prior to the silica coating.
Thus preaggregation of γ-Fe2O3 nanoparticles seems to allow increasing the size ofthe magnetic cores, and modifying the morphology from a spherical to an elliptical one,although TEM pictures show some polydispersity, resulting in larger size distribution forthe cores and the core shell nanoparticles.
Sensors 2021, 21, 185 15 of 18
Appendix B
Photography and L-Edit Channel and Microelectrodes Geometries
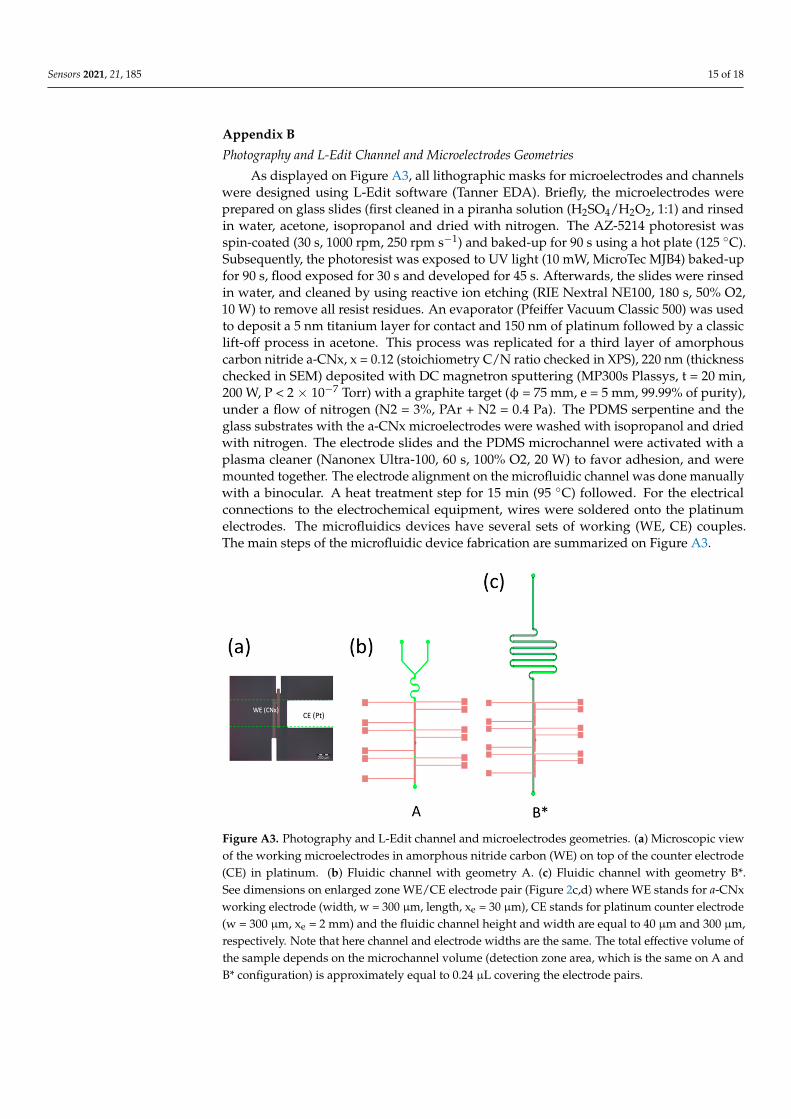
As displayed on Figure A3, all lithographic masks for microelectrodes and channelswere designed using L-Edit software (Tanner EDA). Briefly, the microelectrodes wereprepared on glass slides (first cleaned in a piranha solution (H2SO4/H2O2, 1:1) and rinsedin water, acetone, isopropanol and dried with nitrogen. The AZ-5214 photoresist wasspin-coated (30 s, 1000 rpm, 250 rpm s−1) and baked-up for 90 s using a hot plate (125 C).Subsequently, the photoresist was exposed to UV light (10 mW, MicroTec MJB4) baked-upfor 90 s, flood exposed for 30 s and developed for 45 s. Afterwards, the slides were rinsedin water, and cleaned by using reactive ion etching (RIE Nextral NE100, 180 s, 50% O2,10 W) to remove all resist residues. An evaporator (Pfeiffer Vacuum Classic 500) was usedto deposit a 5 nm titanium layer for contact and 150 nm of platinum followed by a classiclift-off process in acetone. This process was replicated for a third layer of amorphouscarbon nitride a-CNx, x = 0.12 (stoichiometry C/N ratio checked in XPS), 220 nm (thicknesschecked in SEM) deposited with DC magnetron sputtering (MP300s Plassys, t = 20 min,200 W, P < 2 × 10⁻⁷ Torr) with a graphite target (φ = 75 mm, e = 5 mm, 99.99% of purity),under a flow of nitrogen (N2 = 3%, PAr + N2 = 0.4 Pa). The PDMS serpentine and theglass substrates with the a-CNx microelectrodes were washed with isopropanol and driedwith nitrogen. The electrode slides and the PDMS microchannel were activated with aplasma cleaner (Nanonex Ultra-100, 60 s, 100% O2, 20 W) to favor adhesion, and weremounted together. The electrode alignment on the microfluidic channel was done manuallywith a binocular. A heat treatment step for 15 min (95 C) followed. For the electricalconnections to the electrochemical equipment, wires were soldered onto the platinumelectrodes. The microfluidics devices have several sets of working (WE, CE) couples.The main steps of the microfluidic device fabrication are summarized on Figure A3.
Figure A3. Photography and L-Edit channel and microelectrodes geometries. (a) Microscopic viewof the working microelectrodes in amorphous nitride carbon (WE) on top of the counter electrode(CE) in platinum. (b) Fluidic channel with geometry A. (c) Fluidic channel with geometry B*.See dimensions on enlarged zone WE/CE electrode pair (Figure 2c,d) where WE stands for a-CNxworking electrode (width, w = 300 µm, length, xe = 30 µm), CE stands for platinum counter electrode(w = 300 µm, xe = 2 mm) and the fluidic channel height and width are equal to 40 µm and 300 µm,respectively. Note that here channel and electrode widths are the same. The total effective volume ofthe sample depends on the microchannel volume (detection zone area, which is the same on A andB* configuration) is approximately equal to 0.24 µL covering the electrode pairs.

Sensors 2021, 21, 185 16 of 18
References1. Mitchell, P. Microfluidics—Downsizing large-scale biology. Nat. Biotechnol. 2001, 19, 717–721. [CrossRef] [PubMed]2. LaVan, D.A.; McGuire, T.; Langer, R. Small-scale systems for in vivo drug delivery. Nat. Biotechnol. 2003, 21, 1184–1191. [CrossRef]
[PubMed]3. Lee, W.-B.; Chien, C.-C.; You, H.-L.; Kuo, F.-C.; Lee, M.S.; Lee, G.-B. An integrated microfluidic system for antimicrobial
susceptibility testing with antibiotic combination. Lab Chip 2019, 19, 2699–2708. [CrossRef] [PubMed]4. Ferguson, B.S.; Buchsbaum, S.F.; Swensen, J.S.; Hsieh, K.; Lou, X.; Soh, H.T. Integrated Microfluidic Electrochemical DNA Sensor.
Anal. Chem. 2009, 81, 6503–6508. [CrossRef] [PubMed]5. Moldovan, L.; Batte, K.E.; Trgovcich, J.; Wisler, J.; Marsh, C.B.; Piper, M. Methodological challenges in utilizing miRNAs as
circulating biomarkers. J. Cell. Mol. Med. 2014, 18, 371–390. [CrossRef]6. Pekin, D.; Skhiri, Y.; Baret, J.-C.; Le Corre, D.; Mazutis, L.; Ben Salem, C.; Millot, F.; El Harrak, A.; Hutchison, J.B.; Larson, J.W.;
et al. Quantitative and sensitive detection of rare mutations using droplet-based microfluidics. Lab Chip 2011, 11, 2156–2166.[CrossRef]
7. Taly, V.; Pekin, D.; Benhaim, L.; Kotsopoulos, S.K.; Le Corre, D.; Li, X.; Atochin, I.; Link, D.R.; Griffiths, A.D.; Pallier, K.; et al.Multiplex Picodroplet Digital PCR to Detect KRAS.; Mutations in Circulating DNA from the Plasma of Colorectal Cancer Patients.Clin. Chem. 2013, 59, 1722. [CrossRef]
8. Robinson, S.; Follo, M.; Haenel, D.; Mauler, M.; Stallmann, D.; Heger, L.A.; Helbing, T.; Duerschmied, D.; Peter, K.; Bode, C.; et al.Chip-based digital PCR as a novel detection method for quantifying microRNAs in acute myocardial infarction patients. ActaPharmacol. Sin. 2018, 39, 1217–1227. [CrossRef]
9. Lin, J.; Jordi, C.; Son, M.; Van Phan, H.; Drayman, N.; Abasiyanik, M.F.; Vistain, L.; Tu, H.-L.; Tay, S. Ultra-sensitive digitalquantification of proteins and mRNA in single cells. Nat. Commun. 2019, 10, 3544. [CrossRef]
10. Parida, M.; Sannarangaiah, S.; Dash, P.K.; Rao, P.V.L.; Morita, K. Loop mediated isothermal amplification (LAMP): A newgeneration of innovative gene amplification technique; perspectives in clinical diagnosis of infectious diseases. Rev. Med. Virol.2008, 18, 407–421. [CrossRef]
11. Craw, P.; Balachandran, W. Isothermal nucleic acid amplification technologies for point-of-care diagnostics: A critical review. LabChip 2012, 12, 2469–2486. [CrossRef] [PubMed]
12. Gomez, K.F.; Lane, J.; Cunnick, G.; Grimshaw, D.; Jiang, W.G.; Mansel, R.E. From PCR to RCA: A surgical trainee’s guide to thetechniques of genetic amplification. Eur. J. Surg. Oncol. 2002, 28, 554–556. [CrossRef] [PubMed]
13. Chang, C.-M.; Chang, W.-H.; Wang, C.-H.; Wang, J.-H.; Mai, J.D.; Lee, G.-B. Nucleic acid amplification using microfluidic systems.Lab Chip 2013, 13, 1225–1242. [CrossRef] [PubMed]
14. Houssin, T.; Cramer, J.; Grojsman, R.; Bellahsene, L. Ultrafast, sensitive and large-volume on-chip real-time PCR for the moleculardiagnosis of bacterial and viral infections. Lab Chip 2016, 16, 1401–1411. [CrossRef]
15. Frisbie, C.D.; Fritsch-Faules, I.; Wollman, E.W.; Wrighton, M.S. Preparation and characterization of redox active molecularassemblies on microelectrode arrays. Thin Solid Films 1992, 210–211, 341–347. [CrossRef]
16. Compton, R.G.; Fisher, A.C.; Wellington, R.G.; Dobson, P.J.; Leigh, P.A. Hydrodynamic voltammetry with microelectrodes:Channel microband electrodes; theory and experiment. J. Phys. Chem. 1993, 97, 10410–10415. [CrossRef]
17. Rossier, J.S.; Schwarz, A.; Reymond, F.; Ferrigno, R.; Bianchi, F.; Girault, H.H. Microchannel networks for electrophoreticseparations. Electrophoresis 1999, 20, 727–731. [CrossRef]
18. Gamby, J.; Abid, J.-P.; Girault, H.H. Supercapacitive Admittance Tomoscopy. J. Am. Chem. Soc. 2005, 127, 13300–13304. [CrossRef]19. Streeter, I.; Fietkau, N.; Del Campo, J.; Mas, R.; Munoz, F.X.; Compton, R.G. Voltammetry at Regular Microband Electrode Arrays:
Theory and Experiment. J. Phys. Chem. C 2007, 111, 12058–12066. [CrossRef]20. Amatore, C.; Da Mota, N.; Sella, C.; Thouin, L. General Concept of High-Performance Amperometric Detector for Microfluidic
(Bio)Analytical Chips. Anal. Chem. 2008, 80, 4976–4985. [CrossRef]21. Faure, M.; Pallandre, A.; Chebil, S.; Le Potier, I.; Taverna, M.; Tribollet, B.; Deslouis, C.; Haghiri-Gosnet, A.-M.; Gamby, J.
Improved electrochemical detection of a transthyretin synthetic peptide in the nanomolar range with a two-electrode systemintegrated in a glass/PDMS microchip. Lab Chip 2014, 14, 2800–2805. [CrossRef] [PubMed]
22. Veselinovic, J.; Li, Z.; Daggumati, P.; Seker, E. Electrically Guided DNA Immobilization and Multiplexed DNA Detection withNanoporous Gold Electrodes. Nanomaterials 2018, 8, 351. [CrossRef] [PubMed]
23. Drummond, T.G.; Hill, M.G.; Barton, J.K. Electrochemical DNA sensors. Nat. Biotechnol. 2003, 21, 1192–1199. [CrossRef] [PubMed]24. Rant, U.; Arinaga, K.; Fujita, S.; Yokoyama, N.; Abstreiter, G.; Tornow, M. Electrical manipulation of oligonucleotides grafted to
charged surfaces. Org. Biomol. Chem. 2006, 4, 3448–3455. [CrossRef] [PubMed]25. Watson, J.D.; Crick, F.H.C. A structure for deoxyribose nucleic acid. Nature 1953, 171, 737–738. [CrossRef]26. Khandurina, J.; McKnight, T.E.; Jacobson, S.C.; Waters, L.C.; Foote, R.S.; Ramsey, J.M. Integrated System for Rapid PCR-Based
DNA Analysis in Microfluidic Devices. Anal. Chem. 2000, 72, 2995–3000. [CrossRef]27. Ruano-Lopez, J.M.; Agirregabiria, M.; Olabarria, G.; Verdoy, D.; Bang, D.D.; Bu, M.; Wolff, A.; Voigt, A.; Dziuban, J.A.; Walczak,
R.; et al. The SmartBioPhone™, a point of care vision under development through two European projects: OPTOLABCARD andLABONFOIL. Lab Chip 2009, 9, 1495–1499. [CrossRef]

Sensors 2021, 21, 185 17 of 18
28. Jordan, A.; Scholz, R.; Wust, P.; Fähling, H.; Roland, F. Magnetic fluid hyperthermia (MFH): Cancer treatment with AC magneticfield induced excitation of biocompatible superparamagnetic nanoparticles. J. Magn. Magn. Mater. 1999, 201, 413–419. [CrossRef]
29. Hirsch, L.R.; Stafford, R.J.; Bankson, J.A.; Sershen, S.R.; Rivera, B.; Price, R.E.; Hazle, J.D.; Halas, N.J.; West, J.L. Nanoshell-mediated near-infrared thermal therapy of tumors under magnetic resonance guidance. Proc. Natl. Acad. Sci. USA 2003, 100,13549–13554. [CrossRef]
30. Lee, J.-H.; Jang, J.-T.; Choi, J.-S.; Moon, S.H.; Noh, S.-H.; Kim, J.-W.; Kim, J.-G.; Kim, I.-S.; Park, K.I.; Cheon, J. Exchange-coupledmagnetic nanoparticles for efficient heat induction. Nat. Nanotechnol. 2011, 6, 418–422. [CrossRef]
31. Rao, W.; Zhang, W.; Poventud-Fuentes, I.; Wang, Y.; Lei, Y.; Agarwal, P.; Weekes, B.; Li, C.; Lu, X.; Yu, J.; et al. Thermallyresponsive nanoparticle-encapsulated curcumin and its combination with mild hyperthermia for enhanced cancer cell destruction.Acta Biomater. 2014, 10, 831–842. [CrossRef] [PubMed]
32. Dias, J.T.; Moros, M.A.A. DNA as a molecular local thermal probe for the analysis of magnetic hyperthermia. Angew. Chem. Int.Ed. 2013, 52, 11526–11529. [CrossRef] [PubMed]
33. Jangpatarapongsa, K.; Polpanich, D.; Yamkamon, V.; Dittharot, Y.; Peng-On, J.; Thiramanas, R.; Hongeng, S.; Jootar, S.; Charoen-mak, L.; Tangboriboonrat, P. DNA detection of chronic myelogenous leukemia by magnetic nanoparticles. Analyst 2011, 136,354–358. [CrossRef] [PubMed]
34. Dong, J.; Zink, J.I. Taking the temperature of the interiors of magnetically heated nanoparticles. ACS Nano 2014, 8, 5199–5207.[CrossRef] [PubMed]
35. Faure, M.; Billon, F.; Le Potier, I.; Haghiri-Gosnet, A.M.; Tribollet, B.; Pailleret, A.; Deslouis, C.; Gamby, J. Improvement ofelectrochemical detection of transthyretin synthetic peptide and its amino acids on carbon electrodes: Glassy carbon versusamorphous carbon nitride a-CNx. Electrochim. Acta 2019, 296, 251–258. [CrossRef]
36. Horny, M.C.; Billon, F.; Deslouis, C.; Lazerges, M.; Dupuis, V.; Siaugue, J.M.; Pailleret, A.; Gamby, J. microRNA electrochemicalbiosensor based on amorphous carbon nitride microband integrated in a microfluidic device. Electrochim. Acta 2020. In revision(under review).
37. Iliescu, C.; Jing, J.; Tay, F.E.H.; Miao, J.; Sun, T. Characterization of masking layers for deep wet etching of glass in an improvedHF/HCl solution. Surf. Coat. Technol. 2005, 198, 314–318. [CrossRef]
38. Nanteuil, C.; Gosnet-Haghiri, A.M. Method for Manufacturing a Microfluidic Chip, and Related Chip and Plate. U.S. Patent8,747,604, 10 June 2014.
39. Lacroix, L.M.; Malaki, R.B.; Carrey, J.; Lachaize, S.; Respaud, M.; Goya, G.F.; Chaudret, B. Magnetic hyperthermia in single-domainmonodisperse FeCo nanoparticles: Evidences for Stoner-Wohlfarth behavior and large losses. J. Appl. Phys. 2009, 105. [CrossRef]
40. De Lacheisserie, E.D.T. Magnétisme, Tome 1: Fondements (Coll. Grenoble Sciences); UGA: Saint-Martin-d’Hères, France, 2000.41. Shliomis, M.I. Magnetic fluids. Soviet Phys. Uspekhi 1974, 17, 153. [CrossRef]42. Fortin, J.P.; Wilhelm, C.; Servais, J.; Mnager, C.; Bacri, J.C.; Gazeau, F. Size-Sorted Anionic Iron Oxide Nanomagnets as Colloidal
Mediators for Magnetic Hyperthermia. J. Am. Chem. Soc. 2007, 129, 2628–2635. [CrossRef]43. Horny, M.C.; Lazerges, M.; Siaugue, J.M.; Pallandre, A.; Rose, D.; Bedioui, F.; Deslouis, C.; Haghiri-Gosnet, A.M.; Gamby,
J. Electrochemical DNA biosensors based on long-range electron transfer: Investigating the efficiency of a fluidic channelmicroelectrode compared to an ultramicroelectrode in a two-electrode setup. Lab Chip 2016, 16, 4373–4381. [CrossRef] [PubMed]
44. Yu, L.; Liu, J.; Wu, K.; Klein, T.; Jiang, Y.; Wang, J.-P. Evaluation of Hyperthermia of Magnetic Nanoparticles by DehydratingDNA. Sci. Rep. 2014, 4, 7216. [CrossRef] [PubMed]
45. Meunier-Prest, R.; Raveau, S.; Finot, E.; Legay, G.; Cherkaoui-Malki, M.; Latruffe, N. Direct measurement of the meltingtemperature of supported DNA by electrochemical method. Nucleic Acids Res. 2003, 31, e150. [CrossRef] [PubMed]
46. Ge, D.; Wang, X.; Williams, K.; Levicky, R. Thermostable DNA Immobilization and Temperature Effects on Surface Hybridization.Langmuir 2012, 28, 8446–8455. [CrossRef] [PubMed]
47. Tamiasso-Martinhon, P.; Cachet, H.; Deslouis, C.; Vivier, V. Amorphous carbon nitride a-CNx microelectrode: Fabrication andcharacterization. Electrochem. Commun. 2010, 12, 1074–1076. [CrossRef]
48. Kelley, S.O.; Holmlin, R.E.; Stemp, E.D.A.; Barton, J.K. Photoinduced Electron Transfer in Ethidium-Modified DNA Duplexes:Dependence on Distance and Base Stacking. J. Am. Chem. Soc. 1997, 119, 9861–9870. [CrossRef]
49. Kaplan, J.-C.; Delpech, M. Biologie Moléculaire et Médecine; Flammarion Médecine-Sciences: Paris, France, 1989.50. Kelley, S.O.; Barton, J.K.; Jackson, N.M.; Hill, M.G. Electrochemistry of Methylene Blue Bound to a DNA-Modified Electrode.
Bioconj. Chem. 1997, 8, 31–37. [CrossRef]51. Kelley, S.O.; Jackson, N.M.; Hill, M.G.; Barton, J.K. Long-range electron transfer through DNA films. Angew. Chem. Int. Ed. 1999,
38, 941–945. [CrossRef]52. Massart, R.; Dubois, E.; Cabuil, V.; Hasmonay, E. Preparation and properties of monodisperse magnetic fluids. J. Magn. Magn.
Mater. 1995, 149, 1–5. [CrossRef]53. Lefebure, S.; Dubois, E.; Cabuil, V.; Neveu, S.; Massart, R. Monodisperse magnetic nanoparticles: Preparation and dispersion in
water and oils. J. Mater. Res. 1998, 13. [CrossRef]54. Schöneborn, H.; Raudzus, F.; Secret, E.; Otten, N.; Michel, A.; Fresnais, J.; Ménager, C.; Siaugue, J.-M.; Zaehres, H.; Dietzel,
I.D.; et al. Novel Tools towards Magnetic Guidance of Neurite Growth: (I) Guidance of Magnetic Nanoparticles into NeuriteExtensions of Induced Human Neurons and In Vitro Functionalization with RAS Regulating Proteins. J. Funct. Biomater.2019, 10, 32. [CrossRef] [PubMed]

Sensors 2021, 21, 185 18 of 18
55. Maurice, V.; Georgelin, T.; Siaugue, J.-M.; Cabuil, V. Synthesis and characterization of functionalized core–shell γFe2O3–SiO2nanoparticles. J. Magn. Magn. Mater. 2009, 321, 1408–1413. [CrossRef]
56. Georgelin, T.; Bombard, S.; Siaugue, J.-M.; Cabuil, V. Nanoparticle-Mediated Delivery of Bleomycin. Angew. Chem. Int. Ed. 2010,49, 8897–8901. [CrossRef] [PubMed]
57. Etoc, F.; Vicario, C.; Lisse, D.; Siaugue, J.-M.; Piehler, J.; Coppey, M.; Dahan, M. Magnetogenetic Control of Protein GradientsInside Living Cells with High Spatial and Temporal Resolution. Nano Lett. 2015, 15, 3487–3494. [CrossRef]