RELATÓRIO E CONTAS ANNUAL REPORT CONSOLIDADO · Management System (ISO 14001) for Tintas CIN...
62
ANNUAL REPORT
-
Upload
truongduong -
Category
Documents
-
view
219 -
download
0
Transcript of RELATÓRIO E CONTAS ANNUAL REPORT CONSOLIDADO · Management System (ISO 14001) for Tintas CIN...

RELATÓRIO E CONTASCONSOLIDADOANNUAL REPORT

100 YEARS OF EXPERIENCEOne century of innovation
For 100 years CIN has been developing a history of success, determination and innovation which placed the company in a position of relevance over the last two decades as sector leader in the Iberian Peninsula. Nowadays, the company is worldly renowned and one of the major manufacturers in Europe.
Created in 1917, the CIN brand has resisted wars and revolutions, renewed itself and expanded, internationalised and continued to innovate until today.
Working daily to improve processes, predict trends and develop efficient and environmentally friendly products, CIN operates in three main segments: Architectural, Industrial and Protective Coatings.
“This century long history would not have been possible without all of those who helped transform the small Portuguese paint factory into the innovative and dynamic CIN of 2017, a solid, dynamic and sustainable company fully prepared for the challenges that the future brings. Our guiding values of responsibility, ambition, drive and innovation still prevail one hundred years later.”
João Serrenho, 2017
ABOUT CIN
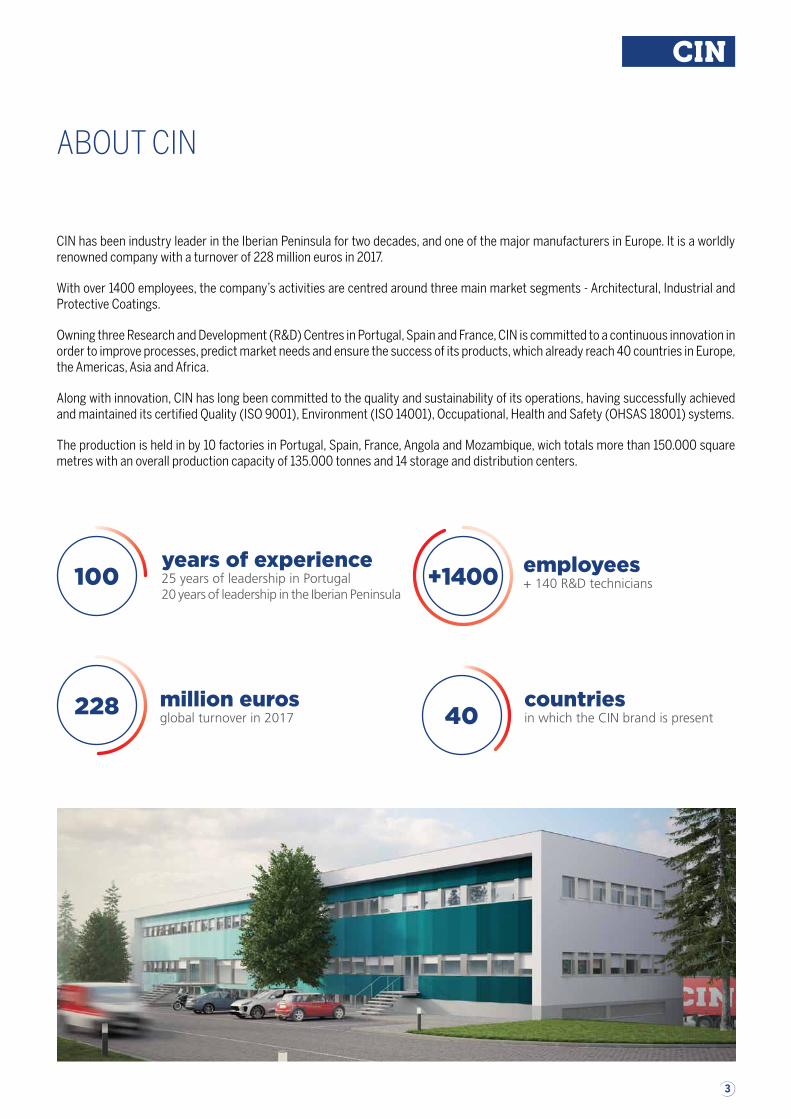
CIN has been industry leader in the Iberian Peninsula for two decades, and one of the major manufacturers in Europe. It is a worldly renowned company with a turnover of 228 million euros in 2017.
With over 1400 employees, the company’s activities are centred around three main market segments - Architectural, Industrial and Protective Coatings.
Owning three Research and Development (R&D) Centres in Portugal, Spain and France, CIN is committed to a continuous innovation in order to improve processes, predict market needs and ensure the success of its products, which already reach 40 countries in Europe, the Americas, Asia and Africa.
Along with innovation, CIN has long been committed to the quality and sustainability of its operations, having successfully achieved and maintained its certified Quality (ISO 9001), Environment (ISO 14001), Occupational, Health and Safety (OHSAS 18001) systems.
The production is held in by 10 factories in Portugal, Spain, France, Angola and Mozambique, wich totals more than 150.000 square metres with an overall production capacity of 135.000 tonnes and 14 storage and distribution centers.
100years of experience25 years of leadership in Portugal20 years of leadership in the Iberian Peninsula
million eurosglobal turnover in 2017
countriesin which the CIN brand is present
228 40
employees+ 140 R&D technicians+1400
3
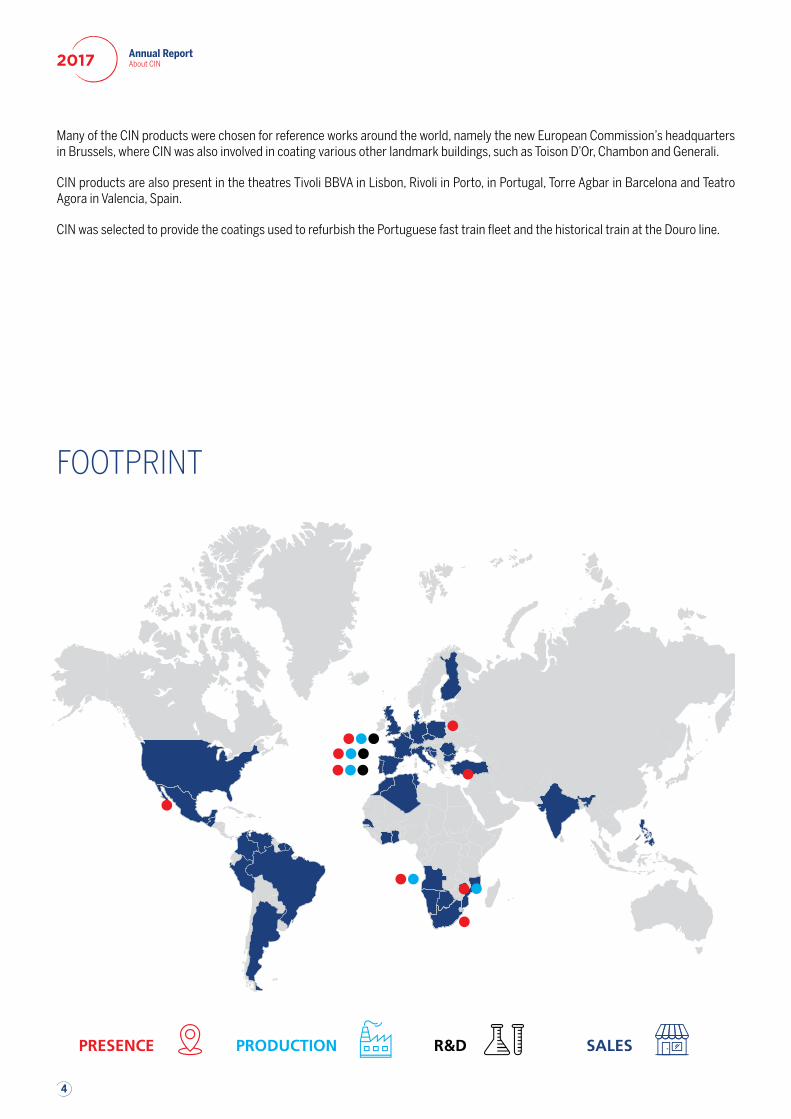
Many of the CIN products were chosen for reference works around the world, namely the new European Commission’s headquarters in Brussels, where CIN was also involved in coating various other landmark buildings, such as Toison D’Or, Chambon and Generali.
CIN products are also present in the theatres Tivoli BBVA in Lisbon, Rivoli in Porto, in Portugal, Torre Agbar in Barcelona and Teatro Agora in Valencia, Spain.
CIN was selected to provide the coatings used to refurbish the Portuguese fast train fleet and the historical train at the Douro line.
SALESR&DPRODUCTIONPRESENCE
FOOTPRINT
Annual ReportAbout CIN2017
4

This business unit encompasses coatings for buildings applied by professionals painters and end customers (Do-It-Yourselfers) and is the most representative of the three. Production is held in the Iberian Peninsula and the African continent.
In all these territories, the innovation, quality and reliability of CIN production have earned the trust of both professionals and consumers for a variety of purposes, from a simple interior paint job to major projects such as Palacete Araújo Porto (a monument awarded with the Portuguese Urban Rehabilitation National Prize in 2017), Teatro Tivoli BBA (Portuguese public interest monument with 91 years of history, located at the centre of Lisbon), Urb. Hacienda Riquelme, in Sucina (Murcia) and Hospital Serrania de Ronda in Malaga, both in Spain.
The Architectural Coatings business unit represented 52% of the turnover in 2017. We highlight a market share increase in Portugal, an evolution which was felt in all product categories. In Spain, the business reorganization is already showing positive results both in modern distribution and in direct sales.
Currently, the company has 125 own shops, including 6 megastores and 19 superstores, distributed throughout Portugal, Spain, Angola and Mozambique. An aggressive renovation plan is underway for the existing shops, as well as a plan to open new stores, with a view to promoting proximity with the clients. Among the many interventions taking place, we highlight the implementation of the new ICS - Industrial Coatings Solutions - concept, a special range of industrial and protective coatings products for retail sale.
Other important development was the launch of the Color Trends colour card, with 12 new shades inspired by nature, complementing the iconic Color Revelation colour card. Worth mentioning too is the new image of the waterproofing range AQUASTOP and the multi-surface paint Cinacryl. These changes intend to enhance the products’ superior performance, evidenced by the growth of both products and professional recognition.
Following the commitment with proximity and interaction with the consumer, CIN’s presence in the social media was extended with the creation of an Instagram CIN page (www.instagram.com/tintascin) where the brand releases its colours, new products and services using image as the main focus.
countriesin Europe, Africa, the Americas and Oceania
20
ARCHITECTURAL COATINGS
of the CIN business120 million euros in 2017
52%
5

The industrial coatings business unit produces and markets powder coatings for metal protection and finishing, as well as liquid coatings for a wide range of industrial applications.
With production units in Portugal, Spain and France, CIN serves more than a dozen sectors, including building components, commercial and industrial vehicles, plastic and glass containers and packaging. This business unit’s growth and consolidation rests upon two strategic foundations: geographic expansion and increasing the product offering.
This business unit represented 37% of CIN’s turnover in 2017, the year in which CIN acquired the Madrid based Govesan, one of the major powder coating manufacturers in Europe. With synergies such as the production unit already in place in Portugal, this acquisition aimed at integrating the productive and technical know-how and skills in order to provide the clients with a more diversified and robust offer of solutions available for the different markets and clients. This integration will result in a stronger presence in geographically strategic markets.
CIN is the largest manufacturer of coatings for drums (metal container) and in 2017 was chosen to provide of the largest European gas cylinders manufacturer and one of the largest crane manufacturers, thus extending its lead in that segment. CIN is still a major provider of coating for springs circulating in light and heavy duty commercial vehicles in Europe.
33 countriesin Europe, Africa, Asia and the Americas
37% of the CIN business86 million euros in 2017
INDUSTRIAL COATINGS
Annual ReportAbout CIN2017
6

PROTECTIVE COATINGS
13 countriesin Europe, Africa, Asia and the Americas
11% of the CIN business26 million euros in 2017
This business unit includes protective coatings for structures used in various sectors (petrochemical, mining, energy, civil infrastructure, heavy equipment OEM).
Its four large ranges of coating solutions - Anticorrosion Protection, Passive Fire Protection, Floors and Concrete Protection - have been selected for significant public and private works in Europe, Central America, Africa and the Middle East.
With production in Portugal and Spain, this business unit follows a strategy of opening new sales offices or establishing partnerships with local businesses in order to establish the CIN brand in the global market and widen its presence in strategic markets.
Representing 11% of the global business, CIN broke new ground in its internationalization strategy also in this area, consolidating and reinforcing operations in Poland, Turkey, Mexico and South Africa.
In 2017, a new portfolio of greater performance products was launched, focusing on protective coatings for metal and concrete. Additional investments were made in Research and Development activities in all product lines.
7

Within the African continent, where the three business units operate transversally, CIN is based in Angola and Mozambique. Having two units of production and storage.
The company continues to invest in these countries, aiming at increasing the installed capacity and operational efficiency. CIN still focuses on a wide and modern network of stores, as well as on establishing business partnerships with local companies.
At the same time expansion to new key markets in the African continent, is now under way. The creation of a company in South Africa exclusively dedicated to the Protective Coatings business is a testimony of that strategy.
In 2017, APCER granted an extension to CIN’s Quality Management System Certification (ISO 9001) and to the Environmental Management System (ISO 14001) for Tintas CIN Mozambique. Tintas CIN Mozambique was the first company of the sector to obtain this double certification in Mozambique.
A renovation plan is still underway for the existing shops, as well as a plan to open new stores: in Mozambique a third store was opened in Maputo. Quifica store was relocated and the Lobito and Benguela stores were reopened.
Although we have a global Facebook page, for some markets there are dedicated Facebook pages, to allow a more targeted communication and interaction with our costumers. In this year a CIN Angola and CIN Mozambique dedicated Facebook pages were launched and rapidly became a success with a very large number of fans and an extremely high interaction rate.
.
13 countriesfrom Africa
10500 tonnesof production capacity
AFRICA
Annual ReportAbout CIN2017
8
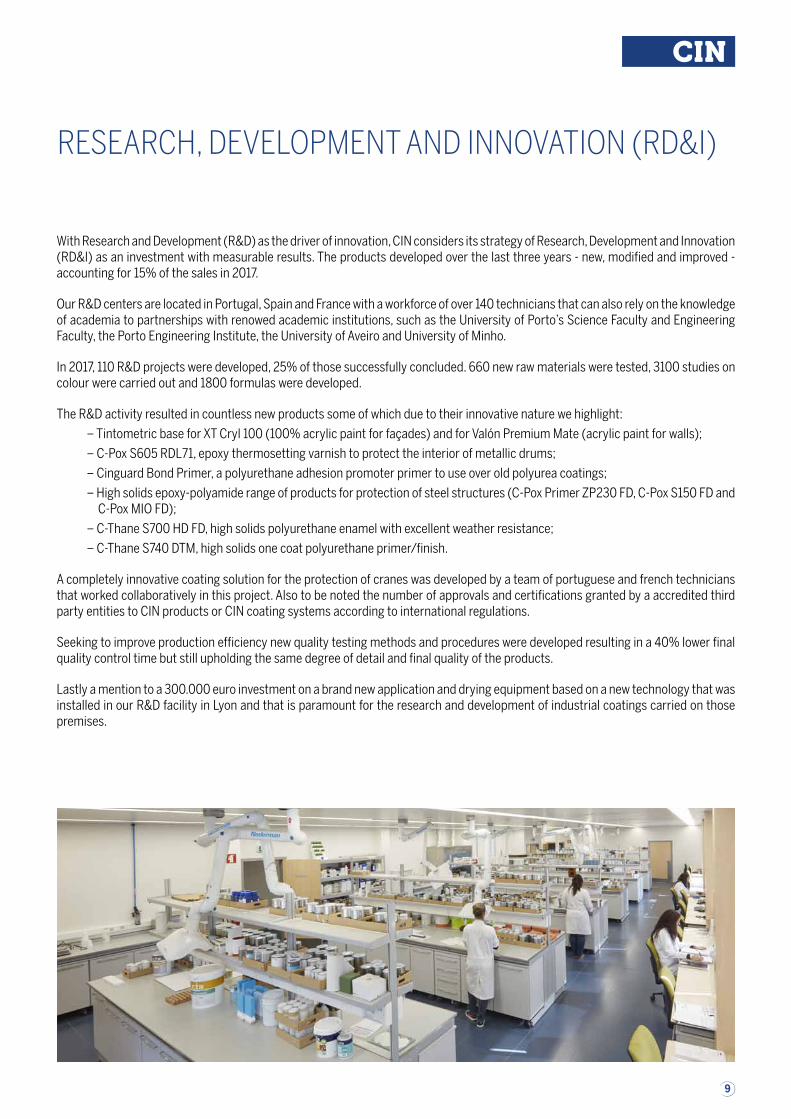
RESEARCH, DEVELOPMENT AND INNOVATION (RD&I)
With Research and Development (R&D) as the driver of innovation, CIN considers its strategy of Research, Development and Innovation (RD&I) as an investment with measurable results. The products developed over the last three years - new, modified and improved - accounting for 15% of the sales in 2017.
Our R&D centers are located in Portugal, Spain and France with a workforce of over 140 technicians that can also rely on the knowledge of academia to partnerships with renowed academic institutions, such as the University of Porto’s Science Faculty and Engineering Faculty, the Porto Engineering Institute, the University of Aveiro and University of Minho.
In 2017, 110 R&D projects were developed, 25% of those successfully concluded. 660 new raw materials were tested, 3100 studies on colour were carried out and 1800 formulas were developed.
The R&D activity resulted in countless new products some of which due to their innovative nature we highlight:
– Tintometric base for XT Cryl 100 (100% acrylic paint for façades) and for Valón Premium Mate (acrylic paint for walls);
– C-Pox S605 RDL71, epoxy thermosetting varnish to protect the interior of metallic drums;
– Cinguard Bond Primer, a polyurethane adhesion promoter primer to use over old polyurea coatings;
– High solids epoxy-polyamide range of products for protection of steel structures (C-Pox Primer ZP230 FD, C-Pox S150 FD and C-Pox MIO FD);
– C-Thane S700 HD FD, high solids polyurethane enamel with excellent weather resistance;
– C-Thane S740 DTM, high solids one coat polyurethane primer/finish.
A completely innovative coating solution for the protection of cranes was developed by a team of portuguese and french technicians that worked collaboratively in this project. Also to be noted the number of approvals and certifications granted by a accredited third party entities to CIN products or CIN coating systems according to international regulations.
Seeking to improve production efficiency new quality testing methods and procedures were developed resulting in a 40% lower final quality control time but still upholding the same degree of detail and final quality of the products.
Lastly a mention to a 300.000 euro investment on a brand new application and drying equipment based on a new technology that was installed in our R&D facility in Lyon and that is paramount for the research and development of industrial coatings carried on those premises.
9

10
Annual ReportManagement Report2017
Management Report

11
Annual ReportManagement Report2017
Dear Shareholders,In fulfilment of our legal obligations and, in particular, the provisions of Articles 508-A and 508-C of
the Commercial Companies Code, we hereby submit the consolidated management report, the consoli-dated balance sheet, the consolidated financial statements of income by types, cash flow statements and accompanying notes for the financial year 2017.
Macroeconomic environment
The developed economies experienced strong economic growth, meeting the expectations created in 2016, as well as benefiting from a general improvement in confidence on the part of companies and consumers, despite the occur-rence of political fragmentation, polarisation and internal and external tensions casting a shadow over the social spectrum.
In the USA, the recovery from the financial crisis spread to the middle class, with the labour market achieving indices of almost full employ-ment, with a consequent rise in wages. At present, economic activity has not been affected by the uncertainty about the government policies of the Trump administration. Inflationary pressures continue not to be very significant and the imple-mentation of the Fed’s monetary policy, supported by moderate and controlled increases in interest rates, is being absorbed well by the market.
The economy of the euro zone grew above fore-cast (+2.4%) due to the improvement in the global economic environment, the reduction in political risk and the accommodative policy of the ECB. The improvement in prospects was matched by a more even distribution of growth between coun-tries.
Of the euro zone economies, Spain and Portugal stand out for the robustness of their GDP growth indicators (+3.1% and +2.7%, respectively). The French economy was no exception to this posi-tive trend, which was amplified by the feeling of confidence stemming from expectations about the implementation of President Macron’s economic programme.
China has apparently succeeded in its efforts to control capital flows, and is continuing to tran-sition gradually to a service-oriented economy and giving greater importance to the size of the domestic market.
The emerging economies also performed well, benefiting from the strong recovery in the world economy which positively influenced a rise in the price of raw materials, as well as from the exit from recession of key economies such as Russia and Brazil.
On the other hand, the Angolan and Mozam-bican economies are not benefiting from this favourable international economic environment due to internal macroeconomic imbalances, the adjustment of which is currently in progress.
This favourable economic climate was reflected in a positive environment in the capital markets, which experienced significant gains, particularly in the USA where the S&P 500 index rose by approximately 20%, with an even greater impact among emerging economies where the MSCI index appreciated by more than 30%.
Operations in 2017
Markets
Turnover in 2017 was €227.8 million, an increase of 8.3% compared with the previous year. This growth reflects the inclusion of CIN Govesan and CIN Coatings Turkey for the first time in the consolidation perimeter, and the effect of applying IAS 29 - Hyperinflationary Economies to the busi-ness in Angola.
The growth in sales from 2016 to 2017, using the same consolidation perimeter as in 2017, would show growth in turnover of 4.6%.
In Spain in the first quarter of the year, the Group acquired certain assets and liabilities in the Govesan production plant, which manufactures powder paints, incorporating them into a new company called CIN Govesan. This acquisition will substantially strengthen the Group’s produc-tion capacity and international presence in this market segment and make possible significant synergies.

12
Annual ReportManagement Report2017
In terms of markets, sales in Portugal using the same perimeter grew by 5.1%, with a particular impact in the decorative paints and industrial coat-ings segment.
In Spain, like-for-like sales increased by 5.1% in 2017, with particular growth in the industrial and protective coatings segments, with the deco-rative paints segment maintaining the previous year’s levels. In addition, with the incorporation of CIN Govesan, the weight of the industrial coat-ings sector has increased significantly.
In France, sales in 2017 increased by 1.9% compared with the previous year, albeit with unequal performances by different companies. Celliose’s turnover grew by 3.9% with the greater emphasis on the decorative paints segment, while Monopol’s turnover contracted by 0.3% due to the ongoing modification of its business model.
The export market decreased by 3.6% in like-for-like terms, mainly due to the decline in the segment of industrial coatings for the German market. Cin Govesan exports about two-thirds of its turnover, which contributed to a significant increase in the importance of the Group’s export market.
The business in Angola showed a very signifi-cant increase in turnover (+25.5%), benefiting from the action of the monetary authorities in opening documentary credits for the import of raw materials, thereby encouraging local production.
In Mozambique turnover grew marginally (+1.6%) compared with the previous year, despite the stagnation of the main macroeconomic indica-tors, although benefiting from the stabilisation of the metical exchange rate against major interna-tional currencies.
Turkish market turnover was included in the consolidated statements for the first time in 2017 in export markets for protective coatings where there is a local presence. Using a like-for-like perimeter, turnover grew by an impressive 16.4%.
Business Units (B.U.)
In the Decorative Paints Business Unit, turn-over grew by 6.1% compared with the same period in the previous year.
In Portugal, sales maintained their robust growth in line with the trend, already seen in previous periods, of gaining market share, benefiting from the positive trend in the indicators of domestic demand and renovation of buildings and from the market’s recognition of the defined strategy.
In Spain, global sales of decorative paints remained at 2016 levels, with Cin Valentine and the chain of stores showing a marginally positive trend and Cin Canárias showing a slight fall in this segment.
In France, the CIN Deco project showed growth of 7.7%, returning to growth following the modifi-cations to its business model.
In Angola, the decorative paints business unit grew by 32%, beating the overall performance of this market, and in Mozambique the decorative paints segment maintained the previous year’s turnover.
Exports of decorative paints grew extremely positively (+24%), benefiting from the improve-ment of the economic climate of the destination countries.
The turnover of the Industrial Coatings Busi-ness Unit grew by an impressive 11.7%, mainly due to the incorporation of CIN Govesan, which brought an important contribution to the Spanish and export markets. Like-for-like sales grew by 2.2% due to good performance in the Portugal, Spain and Angola markets. Exports performed negatively due to problems in the German market.
In the Protective Coatings Business Unit, like-for-like sales grew by 9.2%, sustained by good performance in all the markets where we operate. Of particular note was the increase in sales in Spain, recovering from the fall in 2016.
Financial overview
Note: The 2017 accounts are not directly comparable with those of the previous year as the consolidation perimeter in 2017 includes for the first time the companies Cin Govesan and Cin Coatings Turkey and incorporates the effects of the application of IAS 29 – Hyperinflationary Economies, which are explained in note 1.2 (d) of the Notes to the Accounts. In addition, the comparability of operating performance in the years under review is affected by non-recurring movements, whose effects are stripped out in the subsequent analysis.

13
The Group’s consolidated sales totalled €227.8 million, an increase of 8.3% compared with 2016. The change using a consolidation perimeter equiv-alent to that of 2017 would show growth in turn-over of 4.6%.
The gross percentage margin decreased signifi-cantly compared with the previous year, from 53.6% to 52.6%, as a result of the exhaustion – already forecast in 2016 – of the process of lowering the price of raw materials which, on the contrary, experienced large increases that it was not possible to pass on in their entirety to customers and the enlargement of the turnover perimeter with below-average margins. In like-for-like terms the reduction would have been 0.4%.
Recurring EBITDA in 2017 totalled €24.8 million, an increase of €2.6 million compared with the previous year, reflecting a significant retention of the contribution of gross margin on operating performance (60%), on a like-for-like consolidation perimeter basis, reflecting control of the growth of operating costs and the marginal contribution of the companies now included in the consolidation perimeter.
This increase is due to the fact that it has been possible to improve profitability in all geogra-phies, in particular in Portugal and Angola, with the exception of Spain which is in the process of restructuring and refining its business model. The result is that there is a lag between the period when additional costs are incurred, in order to strengthen the response capacity to the market, and the potential return that will be derived from that same market.
CIN Valentine’s exposure to the Catalan market was an additional factor in the less successful performance in Spain in 2017, given the current political and social environment.
The Group’s usual conservatism was main-tained in hedging business risks and in investment policies to anticipate and ensure the response capacity to prospects of future growth of the busi-ness. As a result, recurring EBIT totalled €15.6 million, an increase of 12.9% compared with the same period in 2016 and, on a like-for-like consol-idation perimeter basis, an improvement of 16.2%.
Net financial costs remained steady at 2016 levels, sustained by the decrease in the pricing of financing lines resulting from the ongoing process
of debt renegotiation in terms of price and matu-rity. Against this, there was a significant increase in bank debt resulting from investments in progress and the large increase in working capital requirements due to the increase in stock levels. This policy was determined both by the need to ensure a safety stock of raw materials in case of scarcity in the market, and to hedge the continual rise in prices, as well as to take advantage of the opening of documentary credits for the import of raw materials by the National Bank of Angola.
Reflecting the activity described above, as well as a significant increase in the estimate of tax due, net profit for the year totalled €7.6 million, a slight increase compared with the previous year.
In 2017, the Group generated cash flow for operating activities totalling €10.9 million, 43% lower than in 2016. This variation is mainly due to the effect of payments to suppliers arising from the large increase in stocks, and the fact that it was not possible to pass on to the customers the entirety of the increase in raw materials prices that occurred during 2017.
€16.0 million were expended on investment activities, explained mainly by investments in tangible fixed assets totalling €7.8 million, mainly in Portugal, modernisation projects at the Maia plant, the new raw materials warehouse and the introduction of the new ERP (Enterprise Resource Planning) system. In addition, €4.1 million was expended on financial investments, mainly related to the acquisition of assets associated with CIN Govesan’s business, and €2.3 million in net flows related to investment properties.
In terms of financing activities, payments were made of net financial charges costing €3.1 million and dividends of €3.5 million, and utilisation of financing lines increased by €2.7 million.
Total assets amounted to €282.7 million, an increase of €18.4 million compared with 2016. The non-current component increased signifi-cantly by approximately €12.0 million as the result of the incorporation of €2.9 million of good-will from CIN Govesan and an increase of €7.5 million in net tangible fixed assets. Also under this item there was an increase in gross terms of €8.6 million relating to equipment and factory premises where CIN Govesan operates, and €2.6 million in investment properties.

14
Annual ReportManagement Report2017
Current assets increased by €6.4 million, mainly due to an increase of €10.8 million in inventories. Cash balances were reduced by €8.5 million in view of the fact that the stability of the world economy made it possible to reduce the liquidity buffer that it is deemed necessary to maintain, while customers’ balances increased by €2.5 million which, given the growth in sales, demonstrates good management of credit risk.
Non-current liabilities totalled €103.7 million, an increase of €6.8 million compared with 2016, due to an increase of €3.9 million in financing obtained, an increase in the amount and maturity of a commercial paper programme and an increase of €2.6 million in deferred taxes resulting from the application of IAS 29 and the determination of the fair value of CIN Govesan’s assets. Current liabil-ities totalled €89.1 million, an increase of €11.9 million compared with the previous year, due to the increase in accounts payable to suppliers and other creditors of €8.0 million and provisions of €4.0 million to cover potential risks related to the purchase of CIN Govesan’s assets and liabilities and the restructuring in Spain.
Total shareholders’ equity of €89.9 million is at the same level as in the previous year, giving a net debt-to-equity ratio of 37.1%, a slight decrease from the 42% in 2016.
Money market
The consolidation and increase in the rate of economic growth has been matched by an increase in the inflation rate, albeit at a slower rate than expected. The ECB has adopted a conservative approach in its stimulus withdrawal policy, given the apparent difficulty in inflation meeting the 2% target set by the central bank.
Against this background, the process of debt renegotiation was continued, increasing maturi-ties and improving the all-in terms of loans, while at the same time stabilising the level of fixed-rate debt coverage.
Description of the dividend distribution policy
The Group has established the principle of distributing between 35% and 60% of net profit
in order to ensure that there are stable resources to cover the requirements for financing the Group’s growth.
The Group’s operating performance improved considerably during 2017, with some risk of expo-sure to Spain being forecast, although corrective measures have been taken, the effect of which is expected to be seen in 2018-2019.
Cash flow was affected by short-term issues resulting from the increase in working capital requirements, which will be adjusted in due course.
The macroeconomic framework is sound, so no additional pressure on operating performance is expected, while investments in progress will bring increased flexibility and agility to the Group.
Given these circumstances, the Board of Direc-tors intends to propose to the Annual General Meeting that, of the net profit of €7.6 million, €4.5 million be distributed in dividends, corre-sponding to 18 cents per share.
Governance bodies
1. Composition of the Board of Directors
The Board of Directors currently has five members, four of whom are representatives of shareholders, with one independent director. Executive directors have direct responsibility for business operations, while the non-executive director is responsible for making an independent and objective assessment of the decisions of the Board.
2. Board Member Remuneration Policy
Board remuneration is based on three compo-nents:
a) A fixed monthly salary;b) An annual incentive based on an evalua-
tion of achievement of the set objectives;c) Long term incentives based on best market
practice,
which are decided by the Remuneration Committee, comprising the Chairmen of the
15
General Meeting, the Supervisory Board and the Board of Directors.
Prospects
The macroeconomic and political framework of last year has not materially altered.
The rate of economic growth has been acceler-ating, creating a momentum of global growth.
The principal difference lies in monetary policy and the possible trumping of the immunity of economic activity to the impact of centrifugal forces on the current political and social frame-work.
The processes of monetary normalisation in the USA, the exit from QE by the ECB and the adjustments of margins by the Bank of China to de-lever the system are creating an environment of instability that needs to be taken into account. On the political side, the constant up and downs in the Brexit negotiations, the Catalan problem, Trump’s protectionist decisions and uncertainties about Italy are leading to the creation of a potential envi-ronment of additional uncertainty. However, the long-awaited convergence of synchronised growth in the main economic blocs is starting to happen.
In responding to these challenges, the strategic vision defined for the growth and complementarity of the businesses, adopting a granular approach to markets and segments, remains valid.
In this context, the company is focused on growth in profits in order to guarantee its independ-ence, supported by the continuous pursuit of main-tenance of a solid organisational structure, without loss of agility and flexibility, and increasing the component in intangible investments.
For the Industrial Coatings Business Unit there is a clear global market vision – based on organic growth and appropriate methodologies and instru-ments – mergers, acquisitions and alliances.
In 2018 the objective is to strength France with the necessary instruments to consolidate its level of operating profitability, extend the business to high added value segments – e.g. aeronautics – and enter new markets, where significant compe-tencies can be gained in intangible assets.
The DECO Business Unit will continue its strategy of consolidating its leading position in the Portuguese market, with the revision of the business model in Spain which involves a modi-fication of the structure and search for integration solutions, in particular through the acquisition of distribution networks, with varied approaches depending on the relative local strength of the brand.
The Protective Coatings Business Unit is in the final stages of the rationalisation and revision of its core product range, and the key indicators suggest that we will see increased competitive-ness of CIN’s products in the Iberian and interna-tional markets. As a result, a number of business opportunities are expected to materialise in 2018, especially in the area of intumescent coatings, which will allow consolidation, on the one hand, of the CIN brand as a player recognised by the market, and on the other hand, of the position of the Protective Coatings business in the identified key geographies.
A contract has been signed for the implemen-tation of a new ERP system, with the defined objective of choosing an information system that integrates all the data and processes in a single system, covering different functional areas and organisational aspects in different geographies, in order to capture a range of benefits associated with the efficiency and integration of core and non-core processes, the elimination of applica-tion and process redundancies, and the centralised visibility of the information supporting decision-making processes.
The implementation will take place over the next 2-3 years. The reliability and efficiency of this system will provide one of the pillars for the execution of a digital strategy, which will have as a second pillar a digital platform that provides speed and flexibility, in order to create additional response capacity to the constant changes in the market.
As a pilot project for this digital strategy, an evaluation process will be initiated in 2018 for the implementation of a digital commitment with customers with a view to strengthening ties of loyalty and trust, providing an innovative, person-alised experience that integrates the experiences of individual clients.

16
Annual ReportManagement Report2017
Acknowledgements
To our customers, the principal reason for our existence, a word of appreciation for the confidence they have placed in us and their cooperation in the development of our products.
To our employees, for their hard work, cooperation and professionalism and the enthusiastic way they have responded to the challenges resulting from the growth and transformation of the company.
To the financial institutions and our suppliers, our appreciation of the professional way in which they have supported us.
Thank you to the Supervisory Board, the Statutory Auditor and our Auditors, for always being avail-able to provide expert advice.
Maia, 10 May 2018
O CONSELHO DE ADMINISTRAÇÃOJoão Manuel Fialho Martins Serrenho, PresidenteMaria Francisca Fialho Martins Serrenho Bulhosa, VogalMaria João Fialho Martins Serrenho Santos Lima, VogalÂngelo Barbedo César Machado, VogalManuel Fernando de Macedo Alves Monteiro, Vogal

17
FinancialInformation

18
Annual ReportFinancial Information2017

19
Annual ReportFinancial Information2017
Consolidated statements of financial position for the years ended as of 31 December 2017 and 2016
(Amounts expressed in Euro)
IAS/IFRS IAS/IFRS
ASSETS Notes 31/12/17 31/12/16NON CURRENT ASSETS:
Goodwill 7 26 670 398 23 771 320Intangible assets 8 3 651 554 3 682 480Tangible assets 6 102 188 791 94 682 239Investment properties 9 9 644 577 6 958 781Other financial assets 10, 11 2 788 679 3 761 961Other investments 4 53 001 133 194Deferred tax assets 12 4 361 708 4 398 433Other non current assets 10, 13 264 293 258 470
Total non current assets 149 623 001 137 646 878
CURRENT ASSETS:Inventories 14 43 696 879 32 934 201Customers 10, 15 37 910 338 35 383 005Other current debtors 10, 16 3 950 453 3 684 495State and other public entities 10, 26 4 373 396 4 063 585Other current assets 10, 17 2 624 075 2 550 394Other financial assets 10, 11 15 199 001 14 192 710Cash and cash equivalents 10, 18 25 327 543 33 862 242
Total current assets 133 081 685 126 670 632
Total assets 282 704 686 264 317 510
SHAREHOLDERS’ FUNDS AND LIABILITIESSHAREHOLDERS’ FUNDS:
Share capital 10 25 000 000 25 000 000 Legal reserve 20 5 000 000 5 000 000 Revaluation reserves 20 2 758 445 2 758 445 Conversion reserves 20 (7 414 217) (4 327 808)Cash-Flow Hedging reserves 20 (30 352) - Fair value reserves 20 (354 232) (419 065)Other reserves 57 369 398 54 913 877 Consolidated net profit for the year 7 609 480 7 326 121
89 938 522 90 251 570
Non-controlling interests 21 2 637 4 987
Total shareholders’ funds 89 941 159 90 256 557
LIABILITIES:NON CURRENT LIABILITIES:
Bank loans 10, 22 91 739 028 87 800 000 Other non current creditors 10, 25 3 514 933 3 581 184 Derivative financial instruments 10 51 375 - Retirement benefit obligations 23 1 461 611 1 231 278 Deferred tax liabilities 12 6 931 578 4 331 783
Total non current liabilities 103 698 525 96 944 245
CURRENT LIABILITIES:Bank loans 10, 22 22 748 153 24 767 181Suppliers 10, 24 30 075 369 23 778 366Other current creditors 10, 25 4 434 512 2 673 968State and other public entities 10, 26 7 967 587 7 526 341Other current liabilities 10, 27 15 182 434 13 765 036Provisions 28 8 656 947 4 605 816
Total current liabilities 89 065 002 77 116 708
Total shareholders’ funds and liabilities 282 704 686 264 317 510
The accompanying notes form an integral part of the consolidated financial statements as of 31 December 2017.
ACCOUNTANT Nº 63002 THE BOARD OF DIRECTORS
Paula Macedo João Manuel Fialho Martins Serrenho, President Maria Francisca Fialho Martins Serrenho Bulhosa, Member Maria João Serrenho dos Santos Lima, Member Ângelo Barbedo César Machado, Member Manuel Fernando de Macedo Alves Monteiro, Member

20
Annual ReportFinancial Information2017
Consolidated statements of profit and loss for the years ended as of 31 December 2017 and 2016
(Amounts expressed in Euro)
IAS/IFRS IAS/IFRS
Notes 31/12/17 31/12/16Operating income:
Sales 29 227 799 208 210 297 066 Services rendered 29 20 820 11 142 Other operating income 2 970 401 2 197 468
Total operating income 230 790 429 212 505 676
Operating expenses:Raw materials and consumables used 14 110 154 200 98 025 331 Changes in inventories of finished goods and work in progress 14 (2 220 020) (510 893)External supplies and services 41 146 883 39 469 546 Payroll expenses 54 581 171 50 769 822 Amortisation and depreciation expenses 6, 8 9 316 172 8 390 247 Provisions and impairment losses 28 1 471 796 (33 958)Other operating expenses 3 167 488 4 744 730
Total operating expenses 217 617 690 200 854 826
Operating results 13 172 739 11 650 850
Financial expenses 30 (3 271 628) (3 071 426)Financial income 30 760 876 625 757
Results before income taxes 10 661 987 9 205 181
Income taxes 31 (3 054 858) (1 881 525)
Consolidated net profit for the year 7 607 129 7 323 656
Attributable to:Group 7 609 480 7 326 121 Non-controlling interests 21 (2 351) (2 465)
7 607 129 7 323 656
Earnings per share
Basic 34 0,304 0,293Diluted 34 0,304 0,293
The accompanying notes form an integral part of the consolidated financial statements as of 31 December 2017.
ACCOUNTANT Nº 63002 THE BOARD OF DIRECTORS
Paula Macedo João Manuel Fialho Martins Serrenho, President Maria Francisca Fialho Martins Serrenho Bulhosa, Member Maria João Serrenho dos Santos Lima, Member Ângelo Barbedo César Machado, Member Manuel Fernando de Macedo Alves Monteiro, Member

21
Consolidated statements of changes in shareholders’ funds for the years ended as of 31 December 2017 and 2016
(Amounts expressed in Euro)
ReservesCapital share
Legalreserve
Revaluationreserves
Conversionreserves
Holding reserves
Fair valuereserves
Otherreserves
Total reserves
Non-controllinginterests
Netprofit
Total
Balances as of 1 January 2016 25.000.000 5.000.000 2.758.445 (690 944) - (301 011) 51 851 221 58 617 711 7 452 8 454 641 92 079 804
Appropriation of consoli-dated net profit of 2015:
Transfer to other reserves - - - - - - 4 954 641 4 954 641 - (4 954 641) -
Distributions - - - - - - - - - (3 500 000) (3 500 000)Comprehensive income for the year - - - (3 636 864) - (118 054) - (3 754 918) (2 465) 7 326 121 3 568 738
Others - - - - - - (1 891 985) (1 891 985) - - (1 891 985)
Balances as of 31 December 2016 25.000.000 5.000.000 2.758.445 (4 327 808) - (419 065) 54 913 877 57 925 449 4 987 7 326 121 90 256 557
Balances as of 1 January 2017 25.000.000 5.000.000 2.758.445 (4 327 808) - (419 065) 54 913 877 57 925 449 4 987 7 326 121 90 256 557
IAS 29 effect as of 1 of January 2017 (844 257) (844 257)
Appropriation of consoli-dated net profit of 2016:
Transfer to other reserves - - - - - - 3 826 121 3 826 121 - (3 826 121) -
Distributions - - - - - - - - - (3 500 000) (3 500 000)Comprehensive income for the year - - - (2 242 152) (30 352) 64 833 - (2 207 671) (2 351) 7 609 480 5 399 459
Changes in perimeter - - - - - - (414 483) (414 483) - - (414 483)Others - - - - - - (956 117) (956 117) - - (956 117)
Balances as of 31 December 2017 25.000.000 5.000.000 2.758.445 (7 414 217) (30 352) (354 232) 57 369 398 57 329 042 2 637 7 609 480 89 941 159
The accompanying notes form an integral part of the consolidated financial statements as of 31 December 2017.
ACCOUNTANT Nº 63002 THE BOARD OF DIRECTORS
Paula Macedo João Manuel Fialho Martins Serrenho, President Maria Francisca Fialho Martins Serrenho Bulhosa, Member Maria João Serrenho dos Santos Lima, Member Ângelo Barbedo César Machado, Member Manuel Fernando de Macedo Alves Monteiro, Member

22
Annual ReportFinancial Information2017
Consolidated statements of comprehensive income for the years ended as of 31 December 2017 and 2016
(Amounts expressed in Euro)
IAS/IFRS IAS/IFRS
31/12/17 31/12/16
Consolidated comprehensive income for the year, including non-controlling interests 7 607 129 7 323 656
Other consolidated comprehensive income: Items to be reclassified to net profit in the future:
Variation in hedging reserves (30 352) - Variation in exchange conversion reserves (2 242 152) (3 636 864) Variation in fair value reserves 64 833 (118 054)
Balances as of 31 December 5 399 459 3 568 738
The accompanying notes form an integral part of the consolidated financial statements as of 31 December 2017.
ACCOUNTANT Nº 63002 THE BOARD OF DIRECTORS
Paula Macedo João Manuel Fialho Martins Serrenho, President Maria Francisca Fialho Martins Serrenho Bulhosa, Member Maria João Serrenho dos Santos Lima, Member Ângelo Barbedo César Machado, Member Manuel Fernando de Macedo Alves Monteiro, Member

23
Consolidated statements of cash flows for the years ended as of 31 December 2017 and 2016
(Amounts expressed in Euro)
IAS/IFRS IAS/IFRSOPERATING ACTIVITIES: Notes 31/12/17 31/12/16Receipts from customers 259 415 888 245 836 689 Payments to suppliers (170 225 991) (152 008 392)Payments to employees (29 843 967) (28 664 617)
Cash generated from operations 59 345 930 65 163 680 Income taxes paid (2 187 775) (1 786 078)Other receipts/(payments) relating to operating activities (46 222 361) (44 271 820)
Flows generated before extraordinary items (48 410 136) (46 057 898)Discontinued operations
Net cash generated by operating activities (1) 10 935 794 19 105 782
INVESTING ACTIVITIES:Receipts relating to:
Investments available for sale 3 265 015 11 970 187 Investment properties 420 000 - Tangible assets 5 489 66 030
3 690 504 12 036 217 Payments relating to:
Other investments 5 (4 127 679) (1 186 350)Investments available for sale (4 987 992) (11 043 312)Investment properties (2 746 743) -Tangible assets (7 817 597) (5 358 190)Intangible assets (9 800) (70 695)
(19 689 811) (17 658 547) Net cash used in investing activities (2) (15 999 307) (5 622 330)
FINANCING ACTIVITIES:Receipts relating to:
Borrowings 44 226 108 103 050 424 Interest and similar income 590 017 438 292
44 816 125 103 488 716 Payments relating to:
Borrowings (41 506 827) (106 130 534)Dividends (3 500 000) (3 500 000)Interest and similar costs (3 141 578) (3 356 552)
(48 148 405) (112 987 086) Net cash used in financing activities (3) (3 332 280) (9 498 369)
Variation of cash and cash equivalents (4) = (1) + (2) + (3) (8 395 793) 3 985 083 Cash and cash equivalents at the beginning of the year 33 862 242 28 086 744 Changes in perimeter 5 110 354 3 238 256 Exchange variation in cash and cash equivalents at the beginning of the year (249 260) (1 447 841)Cash and cash equivalents at the end of the year 18 25 327 543 33 862 242
The accompanying notes form an integral part of the consolidated statement for the year ended as of 31 December 2017.
ACCOUNTANT Nº 63002 THE BOARD OF DIRECTORS
Paula Macedo João Manuel Fialho Martins Serrenho, President Maria Francisca Fialho Martins Serrenho Bulhosa, Member Maria João Serrenho dos Santos Lima, Member Ângelo Barbedo César Machado, Member Manuel Fernando de Macedo Alves Monteiro, Member

24
Annual ReportFinancial Information2017
Introduction
CIN - Corporação Industrial do Norte, S.A. (“CIN” or “the Company”) is a share capital company (“Socie-dade Anónima”), established in 1926, with headquar-ters located in Maia and is the Parent Company of a group of companies (“CIN Group” or “Group”) and its main activity is the production and sale of paint, varnish and similar products.
The Group develops its activities in Portugal, with subsidiaries in Spain, France, Netherlands, Luxem-bourg, Angola, Mozambique, South Africa and Mexico.
As of 31 December 2017, Pleso Holding B.V. (with headquarters located in Netherlands) fully owns CIN’s share capital.
The accompanying financial statements are expressed in Euro (rounded to the nearest unit), as it is the functional currency used in the economic environ-ment where the Group operates. Foreign operations and transactions are included in the financial statements in accordance with the policy established in Note 1.2.d).
1. Main accounting policies
The main accounting policies adopted in the prep-aration of the accompanying consolidated financial statements are as follows:
1.1. Basis of presentation
The accompanying consolidated financial state-ments have been prepared on a going concern basis from the books and accounting records of the compa-nies included in the consolidation (Note 3), main-tained in accordance with the International Finan-
cial Reporting Standards (“IFRS”), as adopted by the European Union for financial years started as from 1 January 2017. These standards include the Interna-tional Financial Reporting Standards issued by the International Accounting Standards Board (“IASB”), the International Accounting Standards (“IAS”) issued by the International Accounting Standards Committee (“IASC”) and respective interpretations issued by the International Financial Reporting Interpretations Committee (“IFRIC”) and by the Standing Interpreta-tions Committee (“SIC”), as adopted by the European Union. The standards and interpretations mentioned above will generally be presented as “IFRS”.
The Board of Directors has assessed the Company’s and its subsidiaries and associates ability to operate on a continuous basis, based on all relevant informa-tion, facts and circumstances of a financial, commer-cial or other nature, including subsequent events to the reporting date of the financial statements, avail-able about the future. As a result of the evaluation, the Board of Directors has concluded that it has adequate resources to maintain its activities, and there is no intention to cease activities in the short term, and therefore considered appropriate to use the assump-tion of continuity of operations in the preparation of the financial statements.
Adoption of new, amended or reviewed standards and interpretations.
The following standards, interpretations, amend-ments and endorsed revisions by the European Union and with mandatory application for first time in the year ended as of 31 December 2017:
Notes to the Consolidated Financial Statementsas of 31 December 2017
(Amounts expressed is Euro)

25
Standard
Applicable in the European Union
in the years starting on or
after
Observations
Amendment to IAS 12 - Deferred tax assets recognition through unrealised losses
01-Jan-17 This amendment clarifies the conditions of measurement and recognition of deferred tax assets resulting from unrealised losses.
Amendment to IAS 7 - Disclosures 01-Jan-17 This amendment introduces aditional disclosures related to cash flow and financing activities.
There are no significant effects recorded in the Group’s financial statements for the year ended December 31, 2017, as a result of the adoption of the standards, interpretations, amendments and revisions referred to above.
New, amended or reviewed standards and interpreta-tions that will take effect in future years
The following standards, interpretations, amend-ments and revisions, with mandatory application in future years, were, until the approval date of the accompanying financial statements, endorsed by the European Union:
Standard
Effective date (annual periods beginning on or
after)
Observations
IFRS 9 – Financial Instruments (2009) and subsequent amendments 01-Jan-18
This standard is part of the revision of IAS 39 and establishes the new require-ments for the classification and measurement of financial assets and liabilities to the methodology for the calculation of impairment and for the application of hedge accounting rules.
IFRS 15 – Revenues from client con-tracts 01-Jan-18
This standard introduces a structure for revenue recognition based on prin-ciples and on a model to be applied to all contracts entered into with clients, substituting IAS 18 – Revenue; IAS 11 – Construction contracts; IFRIC 13 – Fide-lity programs; IFRIC 15 – Real estate construction contracts; IFRIC 18 – Transfer of assets from clients and SIC 31 – Revenue – Direct exchange contracts invol-ving services and publicity.
IFRS 16 – Leases 01-Jan-19
This standard introduced the principles for the measurement and recognition of leasing, substituting IAS 17 – Leases. This standard defines a single accounting model of leasing contracts which result in the lessor’s recognition of assets and liabilities for all leases except those contracts shorter than 12 months or for contracts concerning low-value assets. Lessors will continue to classify leases as being either operating or financial leases, meaning that IFRS 16 will not bring substantial changes to these entities in the scope of standards set by IAS 17.
Clarifications concerning IFRS 15 - Re-venues from client contracts 01-Jan-18
The changes will provide various clarifications in the standard, the aim of which will be eliminating the possibility of misguided interpretations on the various topics addressed by the norm.
Amendment to IFRS 4: Applying IFRS 9 – Financial instruments, with IFRS 4 – Insurance contracts
01-Jan-18This amendment provides orientation with regards to the aplication of IFRS 4 in conjunction with IFRS 9. IFRS 4 will be substituted with the implementation of IFRS 17.
Regarding IFRS 9 there is an on-going analysis, already in its final stages, of the possible impacts resulting from the application of the standard.

26
Annual ReportFinancial Information2017
The Group has analyzed the potential impact of the adoption of IFRS 15 on revenue recognition with regards to measurement and timing of recognition. From this analysis it has been concluded that the adop-tion of IFRS 15 for use in the Group’s consolidated financial statements will, as of 1 January 2018, have an immaterial estimated net impact on the consolidated shareholder’s funds.
At the date of issuing of these consolidated finan-cial statements, the Group is carrying out indexing procedures of existing lease contracts. The Group is analyzing these contracts in their respective tech-nical frameworks by considering what is proposed by IFRS 16. Furthermore, the Group is reviewing existing IT systems in order to ascertain the extent of which it will be necessary to proceed with the adaptation of these systems when faced with the requirements of this standard. At this stage, it is still not yet possible to estimate the impact inherent to its adoption.
The Group estimates that the adoption of the remaining standards will not produce relevant or mate-rial impacts.
New, amended or reviewed standards and interpreta-tions not adopted
The following standards, interpretations, amend-ments and revisions, with mandatory application in future years, weren’t, until the approval date of the accompanying financial statements, endorsed by the European Union:
Standard Observations
FRS 17 - Insurance ContractsFor insurance contracts in its scope, this standard sets the principles for their recognition, measurement, presentation and disclosure. This norm substitutes FRS 4 - Insurance Contracts.
Amendment to FRS 2 - Classification and measurement of transactions of share payments
This amendment introduces various clarifications in the norm related to: (i) the accounting of transactions of share-based payments which are settled with cash, (ii) the registration of modifications in transactions of share-based pay-ments (from being settled with cash to being settled with equity-based financial instruments); (iii) the classification of transactions with characteristics of clea-red settlement.
Amendment to IAS 40: Transfer of investment properties.This amendment clarifies that the change in classification to, or from, invest-ment properties, must only be carried out when evidence exists of a change in how the asset is utilized.
Improvements to international norms of financial reporting (cycle 2014-2016)
These improvements involve the clarification of aspects related to: FRS 1 - First--time adoption of internacional financial reporting standards: eliminates some short-term exemptions; FRS 12 - Disclosures of interests in other entities: cla-rifies the aim of the standard regarding its applications of interests classified as being held with the intent selling or held to distribute under FRS 5; IAS 28 - Investments in Associates and Joint-Ventures: introduces clarifications over fair-value measuring of investment results in associates or joint-ventures held by private equity or investment funds.

27
Improvements to international norms of financial reporting (cycle 2015-2017)
These improvements involve the clarification of some aspects related to : FRS 3 - Concentration of business activities: requires the re-measurement of pre-viously held interests when an entity acquires control over a subsidiary which it had previously co-controlled; IFRS 11 - Joint arrangements: clarifies that the re-measurement of interests previously held must not happen when an entity jointly acquires control of a joint-operation; IAS 12 - Income tax: clarifies that all fiscal consequences of dividends must be registered as profit/loss, indepen-dently of how the tax occurred; IAS 23 - Borrowing Costs - clarifies that part of a borrowing directly related with the acquisition/construction of an asset which is owed after the related asset became ready for its intended use, is, for the pur-poses of determining the capitalization rate, considered to be part of the generic borrowings of the entity.
Amendment to FRS 9: characteristics of advance payments with negative compensation
This amendment allows financial assets with contractual conditions which foresee, in its anticipated amortization, the payment of a considerable amount by the creditor, can be measured at the amortized cost or by fair value with reserves (depending on the business model), given that: (i) at the date of initial asset recognition, fair value of the advance amortization component is of resi-dual value; and (ii) the possibility of negative compensation in the anticipated amortization is the only reason that the asset is not considered na instrument which includes only capital and interest payments.
Amendment to IAS 28: Investments in associates and joint-ventures
This amendment will clarify that FRS 9 must be applied (including its respective requirements relative to impairment) to investments in associates and joint-ven-tures when the equity accounting method is not applied to the measurement of these.
IFRIC 22 - Foreign currency Transactions and Advance Considerations
This interpretation serves to establish the date of initial recognition or of defer-red income as the transaction date for the purpose of determining the exchange rate of revenue recognition.
IFRIC 23 - Uncertainty over Income Tax TreatmentThis interpretation will provide guidance over how to determine taxable income, fiscal basis, reportable fiscal losses, fiscal credits to be used and tax rates in scenarios characterized by uncertainty, when related to income tax.
These standards have not yet been endorsed by the European Union and as such were not applied by the Group in the year ended 31 December 2017.
The accounting policies and measurement criteria adopted by the Group as of 31 December 2017 are consistent with those used in the preparation of the consolidated financial statements as of 31 December 2016.
In the preparation of the consolidated financial state-ments, in accordance with the IFRS, the Board of Direc-tors adopted certain assumptions and estimates that affect the reported assets and liabilities, as well as the income and expenses in relation to the reported periods. All the estimates and assumptions made by the Board of Directors were made on the basis of its better existing knowledge, with reference to the date of approval of the financial statements, of the events and transactions in progress.
The accompanying consolidated financial statements have been prepared for appreciation and approval by the General Shareholders Meeting. The Group’s Board of Directors believes that they will be approved without changes.

28
Annual ReportFinancial Information2017
1.2. Consolidation policies
The consolidation policies adopted by the Group are as follows:
a) Investments in Group companies
The companies where the Group has control, i.e., where it has, cumulatively: (i) power over the investee; (ii) is exposed to, or has the right over variable results by the relationship it has with the investee; and (iii) has the capability to use its power to affect the amount of the results of the investee, are included in the consolidated financial statements by the full consolidation method. The equity and net result of those investments attrib-utable to non-controlling shareholders are presented separately, under the caption “Non-controlling inter-ests”, in the consolidated statement of financial posi-tion and in the consolidated statement of profit and loss. Companies included in the consolidated financial statements by the full consolidation method are listed in Note 3.
In business combinations occurred after the date of transition to the International Financial Reporting Standards as adopted by the European Union – IFRS (1 January 2004), the assets and liabilities of each subsid-iary are measured at fair value at the date of acquisition in accordance with IFRS 3 - “Business Combinations”, with this measurement able to be concluded until 12 months after acquisition date. Any excess on the cost of acquisition over the fair value of the identifiable net assets acquired (including contingent liabilities) is recognized as goodwill (Note 1.2 c)). Any excess of the fair value of the identifiable net assets and liabilities acquired over its cost is recognized as an income in the profit and loss statement of the period of acquisition, after reassessment of the estimated fair value attrib-uted to the net assets acquired. Non-controlling inter-ests are presented according to their share in the fair value of the acquired identifiable assets and liabilities.
The results of the subsidiaries acquired or disposed during the year are included in the consolidated income statement as from the effective date of acquisition or up to the effective date of disposal, respectively.
Adjustments to the financial statements of the affili-ates are performed, whenever necessary, in order to adapt its accounting policies to those used by the Group. All intercompany transactions, balances and distributed dividends are eliminated during the consoli-dation process.
Whenever the Group has, in substance, control over other entities created for a specific purpose (“Special Purpose Entities – SPE´s”), even if no share capital interest is directly or indirectly held in those entities, these are consolidated by the full consolidation method.
As of 31 December 2017 and 2016, there are no special purpose entities within the Group perimeter.
b) Investments in associated companies
Investments in associated companies (companies where the Group has significant influence but has no control over the financial and operating decisions - usually corresponding to holdings between 20% and 50% in a company’s share capital) are accounted for in accordance with the equity method.
According to the equity method, the investments in associated companies are initially recorded at acquisition cost, which is adjusted proportionally to the Group’s corresponding share capital, as at the acquisition date or as at the date of the first adoption of the equity method. On a yearly basis, investments are subsequently adjusted in accordance with the Group’s participation in the associated company’s net result. Additionally, the dividends of the subsidiary are recorded as a reduction in the investment’s book value, and the Group’s proportion in the changes occurred in the associated company’s equity are recorded as a change in the Group’s equity.
Any excess of the cost of acquisition over the Group’s share in the fair value of the identifiable net assets acquired is recognized as goodwill, which is included in the caption “Investments in associated companies” (Note 1.2.c)). If that difference is negative, it is recorded as a gain in the caption “Gains and losses in associated companies” after reassessment of the fair value of the identifiable assets and liabilities acquired.
An evaluation of investments held in associated companies is performed on an annual basis to assess if there are signs of impairment in those investments. Impairment losses are recorded in the statement of profit and loss for the period in the caption “Gains and losses in associated companies”. When those losses recorded in previous periods are no longer applicable, they are reversed in the statement of profit and loss for the period.
When the Group’s share of losses in the associ-ated company exceeds the investment’s book value, the investment is recorded at null value, except to the extent of the Group’s commitments to the associate. In such case, the Group records a provision to cover those commitments.
Unrealized gains arising from transactions with associates are eliminated to the extent of the Group’s interest in the associate against the investment held. Unrealized losses are also eliminated, but only to the extent that there is no evidence of impairment of the transferred asset.
29
As of 31 December 2017 and 2016, the Group has no investments in associated companies.
c) Goodwill
In acquisitions made after the date of transition to IFRS (1 January 2004), the difference between the acquisition cost of financial investments in Group companies (subsidiaries), added by the amount of the non-controlling interests, and the attributable amount to the fair value of the identifiable assets and liabili-ties of those companies, as of the acquisition date, when positive, is recorded under the caption “Good-will” (Note 7) and, when negative, after reassessing its computation, is directly recorded in the statement of income. The differences between the acquisition cost of financial investments in associated companies and in jointly controlled entities and the amount attributable to the fair value of the identifiable assets and liabilities of those companies, as of the acquisition date, when positives, are maintained in the caption “Investments in associated companies” and, when negatives, after a reassessment of its computation, are directly recorded in the statement of income.
Additionally, the excess of the cost of acquisition of investments in foreign companies over the fair value of their identifiable assets and liabilities as at the date of acquisition is calculated using the local currency of each of those companies. Translation to the Group’s currency (Euro) is performed using the exchange rate as at the balance sheet date. Exchange rate differ-ences arising from this translation are recorded under the equity caption “Conversion reserves”.
Goodwill arising from acquisitions made prior to the date of transition to IFRS (1 January 2004) is stated using the carrying amounts in accordance with gener-ally accepted accounting principles in Portugal as of that date, and was then subject to impairment tests. The impact of these adjustments was recorded in the caption “Retained earnings”, in accordance with IFRS 1. Goodwill arising from the acquisition of foreign companies was recomputed retrospectively using the local currency of each subsidiary.
The Group, in a transaction basis (for each business combination), will choose to measure any non-control-ling interest in the acquire either at fair value or at the proportionate share of the non-controlling interest of the acquire’s identifiable net assets. Until January 1, 2010, the non-controlling interests were valued solely in accordance with the proportion of the fair value of assets and liabilities acquired.
Future contingent payments are recognized as a liability as of the date of the business combination at its fair value, with any change in the initial amount being recorded against “Goodwill”, but only during the reas-
sessment period (12 months following the acquisition date) and if related with events prior to the acquisition date, otherwise, it will have to be recorded in the state-ment of profit and loss.
Acquisitions or disposals of stakes in already controlled entities, as long as they do not represent a loss of control, are treated as transactions between shareholders, thus only affecting the equity caption with no impact on goodwill or net results.
Whenever a disposal generates a loss in control, all assets and liabilities of the disposed entity will have to be disregarded and whatever interest recognized in the disposed company will have to be reassessed at fair value and the resulting gain or loss arising from the disposal recorded in the statement of profit and loss.
Goodwill is not amortized, but is subject to impair-ment tests on an annual basis. The recoverable amounts of cash generating units are determined based on the estimation of its value of use and from its disposal at the end of its useful life. The recovery amount is estimated to individual assets or, if not possible, for the cash-generating unit to which the asset belongs. These esti-mations require the use of assumptions based on esti-mates of future circumstances, which may be different from the expected outcomes. Impairment losses identi-fied in the period are recorded in the statement of profit and loss under the caption “Provisions and impairment losses”, and may not be reversed.
d) Conversion of financial statements of foreign com-panies
Assets and liabilities in the financial statements of foreign entities are translated to Euro using the exchange rates in force at the balance sheet date. Profit and loss and cash flows are converted to Euro using the average exchange rate for the period. The resulting exchange rate differences are recorded in equity captions. The exchange rate differences origi-nated after 1 January 2004 are recorded in equity, under the caption “Conversion reserves”. The accumulated exchange differences until before 1 January 2004 (IFRS transition date) were written-off against the caption “Other reserves”.
Goodwill and adjustments to the fair value arising from the acquisition of foreign subsidiaries are recorded as assets and liabilities of those companies and trans-lated to Euro at the balance sheet date exchange rate. Exchange differences occurring in this conver-sion are recorded in the equity capitation “Conversion reserves”.
Whenever a foreign company is disposed, the accu-mulated exchange rate differences are recorded in the statement of profit and loss as a gain or loss associated with the disposal.

30
Annual ReportFinancial Information2017
In the last trimester of 2017, the Angolan economy was considered hyperinflationary in accordance with IAS 29 – Financial reporting in Hyperinflationary Econo-mies.
This standard demands that financial statements prepared in the currency of a hyperinflationary economy must be expressed in terms of the current unit of measurement at the date of the preparation of the financial statements. In summary, the key consid-erations to have in account when re-expressing the financial statements are the following:
- Monetary assets and liabilities are unaltered as these are already accurate at the date of the financial statements;
- Non-monetary assets and liabilities (those which are not expressed at the current unit at the date of the financial statements) are re-stated by the application of an index;
- The inflationary effect of the monetary position of associated companies is reflected in the statement of profit and loss as a loss in the net monetary position.
The Group’s Board of Directors has opted not to
affect the statement of profit and loss, as required by the standard, with the impact of approximately 1.500.000 Euros relative to the re-expression of the year of 2017 of the non-monetary assets and liabilities, equity, and items of the consolidated statement of comprehensive income and of the adjustment of indexed assets and liabilities, opting to record this amount against caption “Retained earnings”, as it is the understanding of the Board of Directors that the affectedness of CIN Ango-la’s profit and loss statement of 2017 of this amount would distort the aforementioned statement, not providing a truthful and appropriate image of the opera-tional activity of this subsidiary for the year ending 31 of December 2017. It is worth mentioning that such procedure does not affect the value of the consolidated shareholder’s funds of the CIN Group.
Additionally, according to the IAS 21, the re-expres-sion of the consolidated financial statements when the parent company does not operate within a hyperinfla-tionary economy is forbidden.
As a result of the high rate of inflation in Angola and subsequent application of the IAS 29, the indi-vidual profit and loss statements of CIN’s subsidiary in Angola were re-stated, in order to consolidate, with effects from 1 January 2017, having the impacts of this re-expression been reflected in CIN’s shareholder’s funds.
The conversion coefficient utilized in the re-expres-sion of the individual financial statements of the Angolan subsidiaries was the Consumer Price Index
(CPI), published by the Banco Nacional de Angola, as follows: Exchange rates used in the translation of foreign group companies were as follows:
Base 100 IPCConverted CPI(Base 100 Year
2010)
Dec/10 Year 2010 100,0 100,0
Dec/11 Year 2010 111,4 111,4
Dec/12 Year 2011 109,0 121,5
Dec/13 Year 2014 93,0 130,8
Dec/14 Year 2014 100,0 140,6
Dec/15 Year 2014 114,3 160,6
Dec/16 Year 2014 162,2 228,0
Dec/17 Year 2014 204,6 287,9
The quotations utilized for conversion to Euros of the associated foreign accounts were the following:
31 December of 2017 31 December of 2016
End of the year
Year average
End of the year
Year average
Kwanza (AOA) 185,400 185,393 174,537 180,569
Metical (MZN) 70,637 64,701 75,463 69,346
South African Rand (ZAR)
14,817 15,041 14,4541 16,2835
Mexican Peso (MXM) 23,582 21,335 21,8100 20,6677
Turkish Lira (TRY) 4,534 4,210 N/A N/A
1.3. Main accounting policies
The main accounting policies used by CIN Group in the preparation of its consolidated financial statements are as follows:
a) Tangible assets
Tangible assets acquired until 1 January 2004 (IFRS transition date), are recorded at their respec-tive deemed cost, which corresponds to its acquisition cost, or its acquisition cost restated in accordance with generally accepted accounting principles in Portugal (and in other countries) until that date, net of accumu-lated amortization and accumulated impairment losses.
Tangible assets acquired after those dates are
recorded at acquisition cost, net of depreciation and accumulated impairment losses.
The impairments that are detected are booked in the year, in the “Amortization and depreciation” caption of the profit and loss statement.

31
Depreciation is calculated on a straight line basis, as from the date the asset is available for use, over the expected useful life for each group of assets.
The depreciation rates used correspond to the following estimated useful lives:
YearsBuildings and other constructions 20 50Machinery and equipment 7 17Transport equipment 3 5Office equipment 3 14Other tangible assets and tools 4 14
Maintenance and repair costs are recorded as expenses in the year they are incurred. The signifi-cant improvements of fixed assets, that increase the corresponding estimated useful life, are capitalized and depreciated in accordance with the remaining useful life of the asset.
Tangible assets in progress represent fixed assets still in construction/development and are stated at acquisition cost. These assets are transferred to fixed assets and depreciated as from the date they are concluded or ready to be used, in accordance with management’s intentions.
Gains or losses arising from the disposal or write-off of tangible assets are calculated as the difference between the selling price and the assets’ net book value as of the date of its disposal/write-off, being recorded in the statement of profit and loss under the captions “Other operating income” or “Other operating expenses”.
b) Intangible assets
Intangible assets are recorded at cost, net of depre-ciation and accumulated impairment losses. Intangible assets are only recognized if it is likely that future economic benefits will flow to the Group, are controlled by the Group and if its cost can be reliably measured.
Research costs and expenses with new technical knowledge are recorded in the statement of profit and loss, when incurred.
Development costs are recognized as an intangible asset if the Group has proven technical feasibility and ability to finish the development and to sell/use such assets and it is likely that those assets will generate future economic benefits. Development costs which do not fulfill these conditions are recorded as an expense in the period in which they are incurred.
Intangible assets, which mainly comprise project development costs, industrial property and other rights, and software are amortized on a straight line basis over a period of 3 to 5 years.
Commercial goodwill is not subject to depreciation, being subject to annual impairment tests.
Brands with indefinite useful life are not amortized and are subject to an annual impairment analysis.
Amortization and depreciation of intangible assets are recorded in the statement of profit and loss in the caption ”Amortization and depreciation”.
c) Investment properties
Investment properties corresponding to real estate assets held for rental or capitalization rather than industrial or administrative purposes are stated at acquisition cost. The Group disclosures the investment properties fair value (Note 9).
d) Financial instruments
i) Investments
Investments held by the Group are classified as follows: ‘Investments measured at fair value through profit and loss’, ‘Loans and account receivables’, ‘Investments held to maturity’ e ‘Investments available-for-sale’. The classification depends on the intention behind the acquisition of investment.
Investments measured at fair value through profit and loss
This category is divided into two subcategories: “Financial assets classified as held for trading” and “Financial assets designated by the Group at fair value through profit or loss”. A financial asset is classified under this category if it is acquired principally for the purpose of selling it in the short term or its performance or investment strategy are analyzed and defined by the Board of Direc-tors based on the fair value of the financial asset. Derivatives are also classified as instruments held for trading, except if designated as an effective hedging instrument. Financial instruments in this category are classified as current assets if they are held for trading or if it is expected that they will be realized within twelve months of the balance sheet date.
Investments held to maturity
This category includes financial assets, non derivatives, with fixed or variable repayments and fixed maturity and is the intention of the Board of Directors to hold them until its maturity date. These investments are classified as non-current assets, unless they mature within 12 months of the balance sheet date.

32
Annual ReportFinancial Information2017
Investments available-for-sale
It includes financial assets, non derivative, designated as available for sale or all the other investments that are not classified as held to maturity or measured at fair value through profit and loss. This category is included in non-current assets except if the Board of Directors has the intention to sale the investment in less than twelve months as of the balance sheet date.
All purchases and sales of investments are recog-nized on its trade date, which the date the Group assumes all risks and obligations inherent in the purchase or sale of the asset. All investments are initially recognized at fair value more transaction costs, the only exception being the ‘investments recorded at fair value through profit and loss’. In this case, invest-ments are initially recognized at fair value and the transaction costs are recognized in the statement of profit and loss.
The investments are derecognized when the right to receive financial flows have expired or have been transferred and, consequently, all the risks and benefits involved have been transferred.
Investments available-for-sale and investments measured at fair value through profit or loss are subse-quently recorded at fair value excluding any deduction of transaction costs which may be incurred during its sale taking into consideration the stock market price at the balance sheet date, without any deduction of trans-action costs that may occur until its disposal.
Held to maturity investments, loans and accounts receivables are carried at amortized cost using the effective interest rate method.
Changes in the fair value of investments measured at fair value through profit or loss are included in the consolidated income statement for the period under financial expenses or gains. Gains or losses arising from changes in fair value of available-for-sale invest-ments are recorded directly under the “Fair value reserve” in Equity, until the investment is sold or other-wise disposed of, or until it is considered to be impaired, at which time the cumulative gain or loss previously recorded in equity is transferred to net profit or loss for the period.
The fair value of investments held for sale is based on current market prices. If the market in which invest-ments are included is not an active market, or has no liquidity, (unquoted investments), the Group records at cost, taking into account the existence of impairment losses. The Board of Directors believes that the fair value of these investments does not differ significantly from their acquisition cost. The fair value of quoted investments is based on the closing price of the stock market where they are traded at the balance sheet date.
Group assesses at each balance sheet date when-ever there is objective evidence that a financial asset may be impaired. In the case of equity instruments clas-sified as available for sale, a significant or prolonged decline in the fair value to below its cost is indicative of the asset is on impairment. If there is some evidence of impairment to ‘Investments available for sale’, the accumulated losses - calculated by the difference between the acquisition cost and fair value less any impairment loss previously recognized in the statement of profit and loss - is removed from equity and recog-nized in the statement of profit and loss.
All purchases and sales of investments are recorded on its trade date, independently of the settlement date.
ii) Accounts receivable
The debts from customers and other debtors that don´t bear interests are recorded at their nominal amount and presented in the consolidated state-ment of financial position deduced from impair-ment losses, in order to reflect their net realizable value. The accounts receivable, when current, do not include interests given the immaterial impact of discounting the cash flows.
iii) Loans
Loans are recorded as liabilities at the respec-tive nominal value net of up-front fees and commissions directly related to the issuance of those instruments. Financial expenses are calcu-lated based on the effective interest rate and are recorded in the statement of profit and loss on an accrual basis.
iv) Accounts payable
Non interest bearing debts to third parties are stated at their nominal value, except if the impact of discounting the cash flows is material.
v) Derivative instruments and Hedge accounting
The Group may use derivative instruments to manage its exposure to financial risks. Derivative instruments are only used for hedge accounting purposes. Derivative instruments are not used for speculation purposes.
The cash-flow hedges used by the Group relate to swaps of interest rates to cover (hedge) the interest rate variation risk of bank loans obtained.
The Group uses the following criteria to classify derivative instruments as cash-flows hedges:
– The hedge transaction is expected to be highly effective in offsetting changes in cash flows attributable to the hedged risk;

33
– The hedging efficiency can be reasonably measured;
– There is proper documentation about the hedging transaction at the inception date;
– T he hedged transaction has to be highly prob-able.
Cash flow hedges are initially recorded at cost, if any, and subsequently revaluated at their fair value. Changes in the fair value of derivatives that are designated and qualify as cash flow hedges are deferred in equity in the caption “Hedging reserves” and transferred to income in the same period that the hedged instrument affects the profit and loss statement.
In cases when the derivative instruments do not comply with the above mentioned requirements to be considered as a cash-flow hedge, although initially engaged for that purpose, the changes in its fair value are recognized directly in the profit and loss statement.
Hedge accounting is discontinued when the hedging instrument expires or is sold, terminated, or exercised. When a hedging instrument no longer qualifies for hedge accounting, the cumulative gain or loss that was deferred in equity is transferred immediately to the profit and loss of the year and the subsequent revaluations of the derivative are recorded in the income statement, or added to the carrying amount of the hedged asset. Subsequent revaluations are recorded directly in the income statement.
In the case of derivatives embedded in other financial instruments or contracts, these are treated as separate derivatives when the risks and characteristics are not closely related with the host contracts and when the contracts are not reflected by its fair value with unrealized gains and losses recognized in the income statement.
vi) Cash and cash equivalents
Cash and cash equivalents include cash on hand, cash at banks on demand and term deposits and other treasury applications which reach its maturity within less than three months and may be mobilized without significant risk of change in value.
e) Lease contracts
Lease contracts are classified as (i) a financial lease if the risks and rewards incidental to ownership lie with the lessee and (ii) as an operating lease if the risks and rewards incidental to ownership do not lie with the lessee.
Classifying a lease as financial or as operational depends on the substance of the transaction rather than on the form of the contract.
Tangible fixed assets acquired under financial lease contracts and the corresponding liabilities are recorded in accordance with the financial method. Under this method, the cost of the fixed assets and the corresponding liability are reflected in the statement of financial position. In addition, interests included in the lease installments and depreciation of the fixed assets, calculated as explained in Note 1.3 a), are recorded in the statement of profit and loss of the period to which they apply.
The operational lease installments on assets acquired under long-term rental contracts are recog-nized in full as expenses in the period to which they refer to (Note 33).
f) Inventories
Merchandise, raw, subsidiary and consumable materials are stated at acquisition average cost, which is lower than market value.
Finished and intermediate goods are stated at production cost (includes the cost of raw materials, direct labor and production overheads), which is lower than market value.
Whenever necessary, the Group companies record impairment losses to reduce inventories to their net realizable or market value.
g) Provisions
Provisions are recognized when, and only when, the Group has a present obligation (legal or constructive) arising from a past event, it is probable that an outflow of resources will be required to settle the obligation, and a reliable estimate can be made of that obligation. Provisions are reviewed and adjusted at each balance sheet date so as to reflect the best estimate of its fair value as of that date (Note 28). Restructuring provisions are recorded by the Group whenever a formal and detailed restructuring plan exists and has been commu-nicated to those affected by it.
h) Government or other public entities subsidies
Government subsidies are recognized at their fair value if only it is highly likely that it will receive them and will be able to accomplish the conditions required to its concession.
Non-repayable subsidies obtained to finance invest-ments in tangible fixed assets are recorded as “Other non-current liabilities” and “Other current liabilities”. These subsidies are recognized in the statement of

34
Annual ReportFinancial Information2017
profit and loss in accordance with the depreciation of the related tangible fixed assets.
Subsidies related to incurred costs are recorded as income in the financial statements since there is reasonable assurance that they will be received, the entity has already incurred in costs and all conditions to reimbursement are fulfilled.
i) Pension complements
As mentioned in Note 23, the Group has assumed (through its Parent company and some subsidiaries) commitments to provide pension complements to its employees due to age or disability, which comprise defined benefit plans. For this effect, the Group has constituted pension funds and insurances.
With the purpose of estimating its responsibilities related to these commitments, the Group determines each year the actual cost of those responsibilities, based in the “Projected Unit Credit Method”.
In accordance with IAS 19 – “Employees Benefits” the costs with past responsibilities are immediately recog-nized in situations where the benefit is being paid. Other-wise, they are recognized on a straight line basis during the average estimated period until the start of the benefits payment.
The responsibilities related to pensions complements recognized at balance sheet date represent the present value of the future benefits, adjusted by actuarial gains/losses and/or past responsibilities non-recognized, deducted of the fair value of net pension funds assets.
j) Accrual basis and Revenue recognition
Income and expenses are recorded on an accrual basis. Under this basis, income and expenses are recognized in the period to which they relate inde-pendently of when the amounts are received or paid. Differences arising between the amounts received and paid and the corresponding income and expenses are recorded in the captions “Accruals and deferrals” included in “Other current assets” and “Other current liabilities”.
Revenue arising from the sale of goods is recognised in the consolidated income statement when (i) the risks and benefits have been transferred to the buyer, (ii) the Company retains neither continued manage-ment involvement in a degree usually associated with ownership nor effective control over the goods sold, (iii) the amount of the revenue can be measured reason-ably, (iv) it is likely that the economic benefits associ-ated with the transaction will flow to the Company, and (v) the costs incurred or to be incurred related with the transaction can be reliably measured. Sales are recorded net of taxes, discounts and other expenses
arising from the sale, and are measured at the fair value of the amount received or receivable.
Income and expenses for which the actual amount is yet unknown, are recorded based on the best estimate of the Board of Directors of the Group companies.
k) Income tax
Income Tax for the year is determined based on the taxable results of the companies included in the consolidation, in accordance with tax legislation in force in each company´s jurisdiction, and considers deferred taxation.
Current Income Tax is computed based on the taxable results of the companies included in consolida-tion.
Deferred taxes are computed using the balance sheet liability method and reflect the timing differ-ences between the amount of assets and liabilities for accounting purposes and the correspondent amounts for tax purposes. Deferred taxes are computed an reassessed on a yearly basis using the tax rate that is expected to be in force at the time these temporary differences are reversed.
Deferred tax assets are only recorded when there is reasonable expectation that sufficient taxable profits will arise in the future to allow such deferred tax assets to be used. At the end of each period the Company reviews its recorded and unrecorded deferred tax assets which are reduced whenever its recoverability ceases to be likely, or recorded if it is likely that taxable profits will be generated in the future to enable them to be recovered.
Deferred tax assets and liabilities are recorded in the statement of profit and loss, except if related to items directly recorded in equity. In these cases the corresponding deferred tax is also recorded in equity captions.
l) Tax consolidation
The Income Tax accrual that is reflected in the consolidated financial statements is computed in accordance with the Special Taxation Regime for Groups of Companies (“Regime Especial de Tributação dos Grupos de Sociedades”), which includes most of CIN Group companies with headquarters in Portugal. Cin Group companies with headquarters in Spain: Amida Inversiones, S.L., CIN Valentine, S.A.U., Pinturas Cin Canárias, S.A.U., Cin Pinturas y Barnices, Cin Inmuebles, S.L., CIN Soritec S.A. and CIN Govesan, S.A. are also taxed by the respective consolidated tax result, in accordance with Spanish legislation. CIN Group companies with headquarters in France, Celliose e PFI are also taxed by the respective consolidated tax result, in accordance with French legislation. Additionally, the

35
other CIN Group companies are taxed on an individual basis and according to the applicable legislation.
m) Balance sheet classification
All assets and liabilities, including deferred taxes, accomplishable or demandable in more than one year after the balance sheet date are classified as “Non-current assets or liabilities”. Deferred taxes are also included as “Non-current assets or liabilities”.
n) Legal reserve
Portuguese commercial legislation requires that, at least, 5% of net profit for each year must be appropri-ated for increases in legal reserve until it represents at least 20% of share capital. Such reserve is not attrib-utable unless the Company is under liquidation, but it can be used either to absorb losses after the extinction of all the other reserves or to be incorporated in share capital.
o) Balances and transactions expressed in foreign cur-rencies
All assets and liabilities expressed in foreign curren-cies were translated to Euro using the exchange rates at the date of the balance sheet.
Favorable and unfavorable exchange differences arising from changes in the exchange rates between those prevailing on the dates of the transactions and those in force on the dates of payment, collection or as of the balance sheet date are recorded in the consoli-dated statement of profit and loss of the year.
p) Impairment of assets, except Goodwill
Assets are assessed for impairment at each balance sheet date and whenever events or changes in circum-stances indicate that the carrying amount of an asset may not be recoverable. Whenever the carrying amount of an asset exceeds its recoverable amount, an impairment loss is recognized in the statement of profit and loss under the caption “Provisions and impairment losses”. The recoverable amount is the higher of an asset’s net selling price and its value of use. The net selling price is the amount obtainable from the sale of an asset in an arm’s length transaction less the costs of the disposal. The value of use is the present value of estimated future cash flows expected to arise from the continued use of an asset and from its disposal at the end of its useful life. Recoverable amounts are esti-mated for individual assets or, if not possible, for the cash-generating unit to which the asset belongs.
Reversal of impairment losses recognized in prior years is recorded when the company concludes that
the impairment losses previously recognized for the asset no longer exist or have decreased. The reversal is recorded in the statement of profit and loss as “Other income”. However, the increased carrying amount of an asset due to a reversal of an impairment loss is recognized to the extent it does not exceed the carrying amount that would have been determined (net of depre-ciation and amortization) had no impairment loss been recognized for that asset in prior years.
Evidence of impairment in accounts receivable arises when:
– the counterparty presents significant financial difficulties;
– there are significant delays in payments by the main counterpart; and
– it is likely that the debtor goes into liquidation or in financial restructuring.
For accounts receivable, the Group uses historical information and information for its legal department, which allow estimate the amounts in impairment. For inventories, the impairments are based on market values and in several indicators of rotation of inventories.
q) Financial expenses
The financial expenses related with loans obtained (interests, bonus, accessory costs and lease contracts’ interest) are recorded as costs in the statement of profit and loss, on an accrual basis, except if the expense is related to construction/development of assets that qualify. The capitalization of these expenses takes place after the beginning of the construction prepara-tion activities’ and ends when the asset is ready for use or the project is suspended.
r) Contingent assets and liabilities
Contingent liabilities are defined by the Company as (i) possible obligations that arise from past events and which existence will be confirmed, or not, by one or more occurrences of uncertain future events not controlled by the Company, or (ii) present obligations that arise from past events but that are not recorded because it is unlikely that an outflow of resources occurs to settle the obligation or the obligation amount cannot be reliably measured.
Contingent liabilities are not recorded in the consoli-dated financial statements, being disclosed, unless the probability of a cash outflow is remote, in which case no disclosure is made.
Contingent assets are possible assets arising from past events and whose existence will be confirmed, or not, by uncertain future events not controlled by the Company.

36
Annual ReportFinancial Information2017
Contingent assets are not recorded in the consoli-dated financial statements but only disclosed when the existence of future economic benefits is likely.
s) Judgments and estimates
In preparing the consolidated financial statements, the Board of Directors based it on the best knowledge and experience of past and/ or current events consid-ering certain assumptions concerning future events.
The most significant accounting estimates reflected in the consolidated financial statements for the twelve month period ended 31 December 2017 and 31 December 2016 include:
a) Useful lives of the tangible and intangible assets;b) Impairment analysis of goodwill and intangible
assets with indefinite useful life;c) Recognition of adjustments on assets (accounts
receivable and inventories) and provisions;d) Recoverability of deferred tax assets; ande) Computation of retirement benefits obligations.
The estimates were based on the best information available at the time of preparation of consolidated financial statements and based on best knowledge and experience of past and/ or current events. However, situations that occur in subsequent periods which are not foreseeable at the time, were not considered in these estimates. Changes to these estimates, which occur after the date of the consolidated financial state-ments will be corrected by results of a prospective as required by IAS 8. For this reason and given the degree of uncertainty associated, the actual results of these transactions may differ from corresponding estimates.
The key estimates and assumptions concerning future events included in the preparation of consoli-dated financial statements, are described in the corre-sponding notes.
t) Risk management policies
The Group is exposed to several risks in the course of its activity, namely: market risk (including exchange rate risk, interest rate risk and price risk), credit risk and liquidity risk. Group’s risk management program focuses in the financial market unpredictability and aims to minimize the collateral effects in its financial performance.
Group’s risk management is assured by the finan-cial department of CIN in accordance with the policies approved by the Board of Directors. Accordingly, the Board of Directors has been setting the main overall risk management policies and some specific rules for certain areas, such as interest rate risk hedging, credit risk and liquidity risk.
i) Exchange rate risk
In the course of its operations, the Group performs non Euro transactions. The normal procedure is to elect a functional currency to each subsidiary that fits its main economic environment and that best represents the composition of its cash-flows. Thus, this exchange rate risk arises mainly from trade, resulting from the purchase and sale of products and services in currencies other than the functional currency of each business. The management policy of exchange rate risk and transaction of the Group seeks to minimize or elimi-nate this risk, contributing to a lower sensitivity of the results of the Group to currency fluctuations.
The amount of assets and liabilities (in Euro) of the Group recorded in currency other than Euro can be summarized as follows:
Tintas CinAngola
Tintas CinMoçambique
Tintas CinMéxico
Tintas CinÁfrica do Sul
Tintas CinTurquia
December 31, 2017Assets 32.102.915 4.619.788 618.105 1.160.863 887.243Liabilities (3.327.455) (711.597) (87.481) (46.582) (153.985)
28.775.460 3.908.191 530.624 1.114.281 733.258
December 31, 2016Assets 26.101.212 4.613.009 468.425 1.189.395 -Liabilities (980.990) (538.944) (26.148) (108.097) -
25.120.222 4.074.065 442.277 1.081.298 -

37
Foreign companies’ financial statement transla-tion risk or accounting risk consists of the impact on the Parent company’s net equity as a result of having to ‘translate’ the foreign subsidiaries’ finan-cial statements. The existing guidelines to cover this risk include an individual approach of each hedging opportunity given the specific currency at stake and the subsidiary’s capital structure (as of 31 December 2017, this situation only applies to subsidiaries disclosed above).
As mentioned in note 1.2 d), assets and liabili-ties in the financial statements of foreign entities are translated to Euro using the exchange rates in force at the balance sheet date. Gains and losses, as well as cash flows are translated to Euro using the average exchange rate for the year. The under-lying exchange difference is posted into equity in caption “Conversion reserves”.
ii) Price Risk
Price risk mainly applies to raw materials such as zinc, resin and titanium dioxide.
There is a permanent monitoring of price evolu-tion and trends for these raw materials as to develop expectations and act upon them.
In relation to zinc, price risk is managed through futures’ market hedging. As of 31 December 2017 and 2016 there are no open positions for these instruments.
Resin and titanium dioxide price change risk is minimized by contracts celebrated with suppliers that fix a steady price for larger periods, typically, one semester.
Abnormal price variations in raw materials may be reflected in the selling prices.
iii) Credit Risk
The Group’s exposure to credit risk mainly relates to accounts receivable resulting from its operating activities. Credit risk is the risk that the counterpart fails its contractual obligations, thus originating a Group loss.
Credit risk is essentially associated with receivables from sales and services rendered to customers. Managing this risk assures that effec-tive collections are performed in the agreed terms so that the Group’s financial position is not affected. This risk is monitored on a regular basis, ensuring that (a) credit to customers is limited and is based on the average days of sales outstanding of each customer; (b) credit limit evolution is assessed on a regular basis; (c) receivables impairment assess-ments are performed in a timely manner.
Group’s credit risk is moderate and it is not focused in a single customer or group of customers, as receivables balance are composed by a large variety of entities from different business segments and geographical areas. Credit guaran-tees are asked whenever a customer’s financial position might be questionable. These guarantees may consist of credit insurances and bank guar-antees.
Accounts receivables impairment losses are computed according to the following criteria: (a) the customer credit profile; (b) the average days of sales outstanding; (c) the customer’s financial position. Adjustments recorded in the years ended as of 31 December 2017 and 2016 are disclosed in Note 28.
As of 31 December 2017 and 2016 the Group does not consider the need for any additional impairment losses, besides those recorded and disclosed in Note 28.
Amounts regarding financial assets recorded in the accompanying consolidated financial state-ments are net of accumulated impairment losses, and represent the maximum exposure of the Group to credit risk.
iv) Liquidity Risk
Liquidity risk is the lack of capacity to fulfill all due liabilities in the agreed terms and at a reason-able cost. Liquidity indicators must be set to manage the liquidity levels as to ensure that the maximum return is obtained at a minimum cost and in a safe and efficient way.
CIN Group’s liquidity risk management aims to:
– Liquidity – to ensure permanent, efficient and sufficient access to funds to liquidate obliga-tions in due time;
– Security – to minimize the likelihood of non-collection of applications of funds; and
– Financial efficiency – to minimize the oppor-tunity cost of excess liquidity detention in the short term.
The Group’s procedures seek to match assets and liabilities maturity dates. Group’s balances as of 31 December 2017 and 2016 show that the ‘permanent capital’ is higher than non-current assets, thus confirming Group’s concern towards a well-balanced financial management. The Group ensures that the financial instruments, credit lines, and amounts meet the businesses and subsidi-aries’ specific needs and allow a reasonable liquidity surplus. Typically, these credit facilities are obtained without the concession of guaran-tees.

38
Annual ReportFinancial Information2017
v) Interest rate risk
The exposure of the Group to interest rate risk results of loans that bear interest at variable rates.
Borrowing costs are therefore vulnerable to variable interest rate changes. The impact of vola-tility on the Group’s results and net equity isn’t significant as Group’s financial debt level is low. Moreover, the presumed correlation between interest market rates and economic growth allows operating gains and compensates the additional borrowing costs (‘natural hedge’).
As of 31 December 2017 and 2016 the financial net debt of the Group amounts to 73,960,637 Euros and 64,512,229 Euros, respectively. These balances are composed of current and non-current loans (Note 22), and cash and cash equivalents (Note 18) celebrated with different entities. Additionally, there is the amount of 15,199,001 euros (14,192,710 euros in 2016) included in “Other financial assets” short-term, depending on their characteristics.
Group’s income and cash-flows are not very influenced by interest rate changes, as Group’s cash and bank balances as well as eventual loans granted to Group companies depend only on the Euro interest rates, which volatility is historically low.
As for long term loans, the procedure is to use whenever appropriate cash-flow hedging deriva-tive instruments (e.g. ‘interest rate swaps’), that perfectly cover interest rate risk.
Interest Rate Sensitivity Analysis
The sensitivity analysis was conducted based in the exposure to the interest rate risk as of balance sheet date and both for derivate and non-deriva-tive financial instruments. As for liabilities based on variable interest rates, the following assump-tions were made:
– The liabilities amount was stable throughout the year and price re-fixation happened in the beginning of the year;
– Variations in market interest rates changes interest amounts to be paid or received of vari-able interest rate financial instruments;
– Fixed interest rate financial instrument’s interest to be paid or received are only affected if financial instruments are expressed at fair value;
– Changes in interest market rates will be reflected in the fair value of hedging deriva-tives and all hedging derivatives are efficient;
– Derivative financial instruments (swaps) fair value of any financial asset or liability is esti-mated by discounting future cash-flows to the
present time at interest market rates at the end of each year, assuming a parallel variation in the yields’ curves.
Sensitivity analysis was performed on a ‘ceteris paribus’ basis, this is, by manipulating one vari-able and assuming that all the others remain unchanged. Realistically, this situation isn’t often met and changes in some of the assumptions might be correlated.
If interest rates have been higher or lower in 0.75 basis points, ceteris paribus, [hardly that could have happened], the estimated impact on the Group’s net result and reserves had been the following:
2017 2016 -0,75 b.p. +0,75 b.p. -0,75 b.p. +0,75 b.p.
Net profit (1) 426.000 (403.000) 380.000 (390.000)Net equity (2) (16.000) 8.000 - -
(1) mainly results from the Group’s exposure to interest rate risk on its variable interest rate loans;
(2) mainly results from changes in the fair value of hedging derivatives.
It is the Board of Director’s understanding that this sensitivity analysis doesn’t properly reflect the Group’s inherent interest rate risk, as the exposure at year end might not reflect the expo-sure throughout the year and because it does not account for payments made during the year.
u) Subsequent events
Post balance sheet date events that provide addi-tional information about conditions that existed at the balance sheet date (adjusting events), are reflected in the consolidated financial statements. Post balance sheet date events that provide information about condi-tions that have only arised after the balance sheet date are considered non adjusting events and are disclosed in the Notes to the financial statements, if material.
2. Changes in accounting policies and corrections of misstatements
During the year ended as of 31 December 2017 there were no changes in accounting policies and no mate-rial mistakes related with prior periods.
3. Group companies included in consolidation
The affiliated companies included in consolidation by the full consolidation method, their headquarters and percentage participation held as of 31 December 2017, are as follows:

39
Share Capital heldDesignation Headquarters Direct Indirect EffectiveWith headquarters in Portugal:CIN - Corporação Industrial do Norte, S.A. (“Parent Company”) Maia - - -Cin Industrial Coatings, S.A. (“Cin Industrial Coatings”) Maia - 100% 100%Sotinco Refinish, S.A. (“Refinish”) Maia - 100% 100%Terraços do Souto – Sociedade Imobiliária, S.A. (“Terraços do Souto”) Maia 100% - 100%Martolar – Materiais de Construção, Lda. (“Martolar”) Alenquer 100% - 100%Nictrading – Comércio Internacional, Lda. (“Nictrading”) Machico - 100% 100%Navis – Marina Paints, S.A. (“Navis”) Maia 45% - 45%Atossa Imobiliária, Sociedade Unipessoal, Lda. (“Atossa”) Maia 100% - 100%
With headquarters in others countries:CIN Valentine, S.A. (“CIN Valentine”) Barcelona (Spain) - 100% 100%Pinturas Cin Canarias, S.A. (“Pinturas Cin Canarias”) Tenerife (Spain) - 100% 100%Amida Inversiones, S.L. (“Amida Inversiones”) Madrid (Spain) 5% 95% 100%Cin Inmuebles, S.L. (“Cin Inmuebles”) Barcelona (Spain) - 100% 100%Cin Pinturas & Barnices, SLU (“Cin Pinturas & Barnices”) Madrid (Spain) - 100% 100%Cin Internacional B.V. (“Cin BV”) Amesterdam (Netherlands) 100% - 100%Tintas Cin de Angola, SARL (“Cin Angola”) Benguela (Angola) 1% 99% 100%Tintas Cin (Moçambique), SARL (“Cin Moçambique”) Maputo (Mozambique) - 100% 100%Coatings RE, S.A. (“Coatings RE”) Luxembourg - 100% 100%Vita Investments, S.A. (“Vita Investments”) Luxembourg - 100% 100%PF Investissements, S.A. (“PF Investissements”) Lyon (France) - 100% 100%Cin Celliose, S.A. (“Celliose”) Lyon (France) - 100% 100%Cin Coatings Mexico S de RL de CV (“Cin Coatings Mexico”) Izcalli (Mexico) - 100% 100%Cin Coatings South Africa (PTY), Ltd. (“Cin Coatings South Africa”) Johannesburg (South Africa) - 99% 99%Cin Monopol, SAS (“Monopol”) Valence (France) - 100% 100%Laboratoires des PPC , SRL (“PPC”) Lyon (France) - 100% 100%CIN SORITEC, S.A. (“Soritec”) Girona (Spain) - 100% 100%NASA, Sociedad de R.L. Valence (France) - 100% 100%CIN Coatings Turkey Boya Ticaret A.S. (“CIN Turquia”) Istambul (Turkey) - 100% 100%CIN Govesan, S.A. (“CIN Govesan”) Madrid (Spain) - 100% 100%
These subsidiaries were included in the consoli-dated financial statements using the full consolidation method, as established in IAS 27 – “Consolidated and Separate Financial Statements” (subsidiary control through the major voting rights or other method, being owner of the company’s share capital - Note 1.2.a)).
During the period ended 31 December 2017, the company CIN Coatings Turkey, Limited held by Amida Inversiones, began to be included in the consolidation method through the full consolidation method (Note 5).
During the period ended 31 December 2017, a company was established (subsequently it was re-named as CIN Govesan), based in Spain, that acquired a group of assets and liabilities which form a business unit dedicated to the production and sales of powder paint (Note 5).
4. Subsidiaries excluded from consolidation
The subsidiaries excluded from consolidation, their respective headquarters and the proportion of capital held as of 31 December 2017, are as follows:
Share Capital heldDesignation Headquarteres Book Value Direct Indirect Effective
Held by CIN:Tintas Cin Guiné, Lda. (“Cin Guiné”) Bissau (Guiné) - 51% - 51%Tintas Cin Macau, Lda. (“Cin Macau”) Macau (China) - 90% - 90%
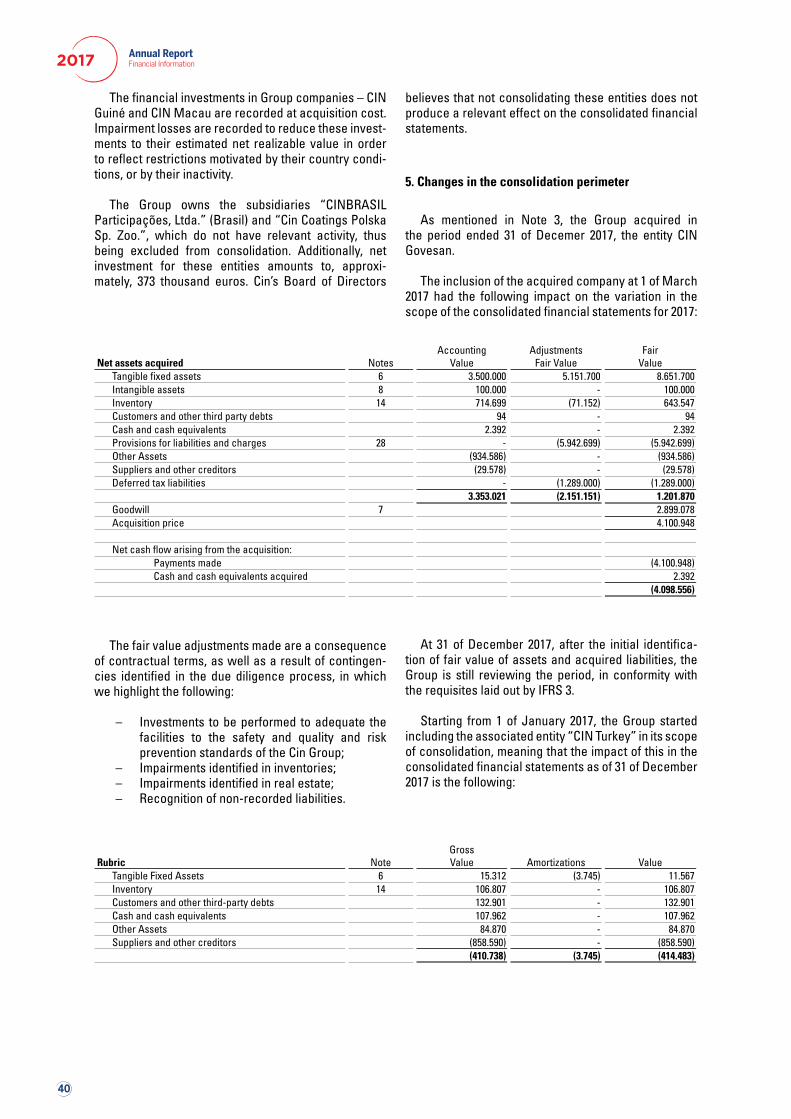
40
Annual ReportFinancial Information2017
The financial investments in Group companies – CIN Guiné and CIN Macau are recorded at acquisition cost. Impairment losses are recorded to reduce these invest-ments to their estimated net realizable value in order to reflect restrictions motivated by their country condi-tions, or by their inactivity.
The Group owns the subsidiaries “CINBRASIL
Participações, Ltda.” (Brasil) and “Cin Coatings Polska Sp. Zoo.”, which do not have relevant activity, thus being excluded from consolidation. Additionally, net investment for these entities amounts to, approxi-mately, 373 thousand euros. Cin’s Board of Directors
believes that not consolidating these entities does not produce a relevant effect on the consolidated financial statements.
5. Changes in the consolidation perimeter
As mentioned in Note 3, the Group acquired in the period ended 31 of Decemer 2017, the entity CIN Govesan.
The inclusion of the acquired company at 1 of March 2017 had the following impact on the variation in the scope of the consolidated financial statements for 2017:
Net assets acquired NotesAccounting
ValueAdjustments
Fair ValueFair
ValueTangible fixed assets 6 3.500.000 5.151.700 8.651.700Intangible assets 8 100.000 - 100.000Inventory 14 714.699 (71.152) 643.547Customers and other third party debts 94 - 94Cash and cash equivalents 2.392 - 2.392Provisions for liabilities and charges 28 - (5.942.699) (5.942.699)Other Assets (934.586) - (934.586)Suppliers and other creditors (29.578) - (29.578)Deferred tax liabilities - (1.289.000) (1.289.000)
3.353.021 (2.151.151) 1.201.870Goodwill 7 2.899.078Acquisition price 4.100.948
Net cash flow arising from the acquisition:Payments made (4.100.948)Cash and cash equivalents acquired 2.392
(4.098.556)
The fair value adjustments made are a consequence of contractual terms, as well as a result of contingen-cies identified in the due diligence process, in which we highlight the following:
– Investments to be performed to adequate the facilities to the safety and quality and risk prevention standards of the Cin Group;
– Impairments identified in inventories;– Impairments identified in real estate;– Recognition of non-recorded liabilities.
At 31 of December 2017, after the initial identifica-tion of fair value of assets and acquired liabilities, the Group is still reviewing the period, in conformity with the requisites laid out by IFRS 3.
Starting from 1 of January 2017, the Group started including the associated entity “CIN Turkey” in its scope of consolidation, meaning that the impact of this in the consolidated financial statements as of 31 of December 2017 is the following:
Rubric NoteGrossValue Amortizations Value
Tangible Fixed Assets 6 15.312 (3.745) 11.567Inventory 14 106.807 - 106.807Customers and other third-party debts 132.901 - 132.901Cash and cash equivalents 107.962 - 107.962Other Assets 84.870 - 84.870Suppliers and other creditors (858.590) - (858.590)
(410.738) (3.745) (414.483)

41
6. Tangible assets
During the years ended 31 December 2017 and 2016, the movements in the gross value of tangible fixed assets, as well as in the respective depreciation and accumulated impairment losses, was as follows:
2017
Land and natural
resources
Buildings and other construc-
tions
Machinery and
equipment
Transport equipment
Administra-tive
equipment
Other tangi-ble assets and tools
Tangible assets in progress
Total
Gross assetsOpening Balance 24.267.163 110.288.968 68.119.424 4.946.425 24.633.764 3.730.334 5.554.766 241.540.844Additions - 878.212 684.401 36.450 562.812 127.812 6.564.549 8.854.239Disposals and write-offs (1.249.000) (4.664.252) (186.402) (323.362) (312.225) (13.170) (832.182) (7.580.593)
Transfers - 3.869.460 655.313 - 208.176 (178.079) (4.165.311) 389.559Perimeter varia-tion (Note 5) 5.150.000 270.411 3.223.200 - 23.401 - - 8.667.012
IAS 29 effect - 3.134.369 937.241 468.126 242.111 1.086.500 (1.021.299) 4.847.048Adjustments - (13.730) (103.001) (20.974) (34.130) (450) (6.954) (179.239)Closing Balance 28.168.163 113.763.438 73.330.176 5.106.665 25.323.909 4.752.950 6.093.569 256.538.870
Accumulated depreciation andimpairment losses
Opening Balance - 65.000.393 57.602.650 3.429.555 18.602.408 2.223.593 - 146.858.605Depreciations - 3.729.126 2.560.940 365.356 1.726.726 284.518 - 8.666.665Disposals and write-offs - (4.664.252) (184.598) (252.282) (258.938) (12.981) - (5.373.051)
Transfers - 103.136 317.008 - (298.267) (121.877) - -Perimeter varia-tion (Note 5) - - 2.310 - 1.435 - - 3.745
IAS 29 effect - 1.196.661 1.047.597 585.033 280.435 1.084.470 - 4.194.196Adjustments - (6.068) (5.917) 3.458 8.234 211 - (82)Closing Balance - 65.358.996 61.339.990 4.131.120 20.062.033 3.457.934 - 154.350.079
Net value 28.168.163 48.404.442 11.990.186 975.545 5.261.876 1.295.016 6.093.569 102.188.791
2016
Land and natural
resources
Buildings and other construc-
tions
Machinery and
equipment
Transport equipment
Administra-tive
equipment
Other tangi-ble assets and tools
Tangible assets in progress
Total
Gross assetsOpening Balance 21.989.527 107.194.687 64.261.238 4.612.782 23.807.045 3.336.389 6.265.499 231.467.167Additions 1.959.708 691.467 573.876 222.512 319.088 205.439 1.962.803 5.934.894Disposals and write-offs - (208.881) (387.260) (374.751) (66.793) (48.050) (885.517) (1.971.252)
Perimeter variation - 347.474 961.060 24.482 290.314 - (1.935.505) (312.175)
Transfers 317.928 2.122.707 2.752.589 421.152 311.941 158.584 - 6.084.901Adjustments - 141.514 (42.079) 40.248 (27.831) 77.972 147.486 337.310Closing Balance 24.267.163 110.288.968 68.119.424 4.946.425 24.633.764 3.730.334 5.554.766 241.540.844
Accumulated depreciation andimpairment losses
Opening Balance - 60.412.980 53.473.683 3.225.214 16.762.303 1.958.717 - 135.832.897Depreciations - 3.369.067 2.097.127 331.480 1.620.099 153.448 - 7.571.220Disposals and write-offs - (205.890) (388.474) (341.119) (61.282) (44.737) - (1.041.502)
Transfers - 78.760 (86.183) 24.536 (1.084) - - 16.029Perimeter variation - 1.284.087 2.421.813 122.309 258.159 114.693 - 4.201.061
Adjustments - 61.389 84.684 67.135 24.213 41.472 - 278.893Closing Balance - 65.000.393 57.602.650 3.429.555 18.602.408 2.223.593 - 146.858.605
Net value 24.267.163 45.288.575 10.516.774 1.516.869 6.031.356 1.506.741 5.554.766 94.682.239

42
Annual ReportFinancial Information2017
As of 31 December 2017 and 2016, the caption “Tangible assets in progress” was made up as follows:
31.12.2017 31.12.2016Portugal 2020 – New factory in
central complex 1.320.158 -
Portugal 2020 – New raw material warehouse 1.339.108 -
Warehouse Angola 991.070 2.656.550New facilities factory solvents –
France - 508.713
Investments in Information Tech-nologies 379.822 353.872
Equipments to factory (Angola) - 290.283Works in building of Maia - 335.444Others 2.063.411 1.409.904
6.093.569 5.554.766
Following the transfer operation of the indus-trial facilities of subsidiary CIN Valentine, on 18 July 2006, the “Junta de Gobierno del Ayuntamiento de Montcada y Reixach” finally approved the “Proyecto de Reparcelación en el âmbito del Plan Parcial Urbanís-tico del Sector Discontinuo Can Milans – Can Cuiás Nord”. According to the above referred land division plan, Barnices Valentine swapped its owned parcels of land denominated “Can Cuyás”, by another parcel of property owned by the municipality and denomi-nated “Can Milans”, where the new industrial facilities were built. According to IAS 16 – Tangible assets – the land received was stated at its fair value based on an external evaluation performed by an expert.
Part of the transfers included in caption “buildings and other constructions” relate to the transfer of the Group’s headquarters building, in Maia, Portugal, which had renovation works done during the period ended 31 of December 2017. This being said, the disposals/write-offs recorded in the same rubric relate to the disposals of the Group’s old facilities, which at the date of publi-cation are fully amortized.
7. Goodwill
During the period ended as of 31 December 2017 the Company recorded the Goodwill generated in the acquisition of CIN Govesan in the value of 2,899,078 Euros (Note 5).
The Group performs formal impairment analysis as of the date of presentation of annual financial accounts.
As of December 31, 2017 and 2016, the net book
value of goodwill, which was originated by acquisitions made by the Group in the referred markets in order to expand its operations in these markets, was made up as follows:
Country / business 31.12.2017 31.12.2016Spain 10.381.460 7.482.382
- CIN Govesan (Note 5) 2.899.078 -- Others 7.482.382 7.482.382
France - Celliose Group 8.704.940 8.704.940 - Monopol Group 3.693.586 3.693.586
Portugal 3.890.412 3.890.41226.670.398 23.771.320
The impairment tests of the goodwill recorded in the financial statements are prepared in accordance with the business plans approved by the Board of Directors of each company. These tests are prepared in accord-ance with the following main assumptions:
Main assumptions Spain France Portugal
Discount rate 10,00% 10,00% 10,00%
Explicit projection period 2018-2022 2018-2022 2018-2022
Rate of growth of perpetuity 1,50% 1,50% 1,50%
A 0.25% increase in the discount rate over the projec-tion years does not imply the need to record impairment losses as of 31 December 2017. Similarly, a decrease of 0.5% on the perpetuity growth rate would not result in significant losses as of 31 December 2017.
8. Intangible assets
During the years ended as of 31 December 2017 and 2016, the movement in intangible assets as well as in the respective accumulated depreciation and accumu-lated impairment losses, was as follows:

43
2017Installation expenses
Development expenses
Industrial property and other rights Goodwill Total
Gross Assets:Opening balance 5.113 7.632.385 6.128.481 2.407.952 16.173.929Additions 9.011 566.299 119.043 22.747 717.100Disposals and write-offs - (225.349) 186.666 38.683 -Changes in perimeter (Note 5) - - 100.000 - 100.000Adjustments (2.097) - (213.192) (8.417) (223.706)Closing balance 12.027 7.973.335 6.320.998 2.460.965 16.767.323
Depreciation and amortizationAccumulated impairment:
Opening balance 4.644 7.785.316 5.247.481 454.010 12.491.451Depreciation of the year 9.462 577.559 20.700 41.786 649.507Transfers - (155.326) 155.326 - -Adjustments (2.079) 7.668 - (30.776) (25.187)Closing balance 12.027 7.215.217 5.423.507 465.020 13.115.771
Net value - 758.118 897.491 1.995.945 3.651.554
2016Installation expenses
Development expenses
Industrial property and other rights Goodwill Total
Gross Assets:Opening balance 30.469 6.450.889 5.828.433 2.398.609 14.708.398Additions - 352.583 158.941 - 511.525Disposals and write-offs - (13.600) - - (13.600)Changes in perimeter (Note 5) - 508.213 132.023 - 640.236Transfers (9.011) 334.300 - 9.011 334.300Adjustments (16.345) - 9.084 332 (6.929)Closing balance 5.113 7.632.385 6.128.481 2.407.952 16.173.929
Depreciation and amortizationAccumulated impairment:
Opening balance 15.290 6.117.488 4.967.537 212.994 11.313.309Depreciation of the year - 470.123 44.052 304.852 819.027Downloads (9.010) (25.501) 103.869 (69.358) -Changes in perimeter (Note 5) - 198.722 132.023 - 330.745Adjustments (1.636) 24.484 - 5.522 28.370Closing balance 4.644 6.785.316 5.247.481 454.010 12.491.451
Net value 469 847.069 881.000 1.953.942 3.682.480
The “Goodwill” rubric includes the amount of 2,107,069 Euros relative to the sales contract celebrated between CIN and the entity Tintas Robbialac, S.A. at 19 November 2007, through which CIN acquired the commercial activities of this entity named “Industry Segment”.
The Group does not proceed to the amortization of that goodwill, performing on an annual basis, formal tests of impairment.
The formal impairment test assumes as cash-gener-ating unit the revenue associated with the segment of products purchased under this contract, and is made regarding the business plan approved by the Board of Directors, which is prepared in accordance with the projected cash flows for the next 10 years. The discount rate used is based on the weighted average cost of capital, and is 10%. In perpetuity the growth rate used is approximately 1.5%.
9. Investment properties
As of 31 December 2017, the caption “Investment properties” includes real estate assets held by CIN Group, mainly located in Guardeiras, Maia that is held for capital appreciation. These assets are stated at the respective acquisition cost.
It is the Board of Directors’ understanding that the fair value of these investment properties does not significantly differ from their book value.
As of 31 December 2017 and 2016, the movement in these captions was as follows:
31.12.2017 31.12.2016Investment properties:
Balance as of 1 January 6.958.781 6.958.781Aditions 2.685.796 -Balance as of 31 December 9.644.577 6.958.781

44
Annual ReportFinancial Information2017
During the period ended 31 December 2017 the Group acquired two real estate assets located in the city of Porto, with the aim of obtaining revenues and value increases.
Investment properties have generated costs in the
amount of approximately 5,736 Euros in 2017 and 7,033 Euros in 2016, which were recorded in the income statement.
10. Classes of financial instruments
The financial instruments in accordance with the policies described in Note 1.3 d), were classified as follows:
Financial assets
NotesLoans and account
receivables
Investments available for
saleSub-total
Assets not covered by
IFRS 7Total
December 31, 2017
Non-current assetsOther finantial assets 11 - 2.788.679 2.788.679 - 2.788.679Other non-current assets 13 264.293 - 264.293 - 264.293
264.293 2.788.679 3.052.972 - 3.052.972Current assets
Customers 15 37.910.338 - 37.910.338 - 37.910.338Other current debtors 16 3.950.453 - 3.950.453 - 3.950.453State and other public entities 26 - - - 4.373.396 4.373.396Other current assets 17 2.624.075 - 2.624.075 - 2.624.075Other finantial assets 11 15.199.001 - 15.199.001 - 15.199.001Cash and cash equivalents 18 25.327.543 - 25.327.543 - 25.327.543
85.011.410 - 85.011.410 4.373.396 89.384.80685.275.703 2.788.679 88.064.382 4.373.396 92.437.778
December 31, 2016
Non-current assetsOther finantial assets 11 - 3.761.961 3.761.961 - 3.761.961Other non-current assets 13 258.470 - 258.470 - 258.470
258.470 3.761.961 4.020.431 - 4.020.431Current assets
Customers 15 35.383.005 - 35.383.005 - 35.383.005Other current debtors 16 3.684.495 - 3.684.495 - 3.684.495State and other public entities 26 - - - 4.063.585 4.063.585Other current assets 17 2.550.394 - 2.550.394 - 2.550.394Other finantial assets 11 14.192.710 - 14.192.710 - 14.192.710Cash and cash equivalents 18 33.862.242 - 33.862.242 - 33.862.242
89.672.846 - 89.672.846 4.063.585 93.736.43189.931.316 3.761.961 93.693.277 4.063.585 97.756.862

45
Financial liabilities
Notes Coverage derivatives
Financial liabilities
registered at amortized cost
Sub-totalLiabilities not
covered by IFRS 7
Total
December 31, 2017
Non-current liabilitiesFinancing obtained 22 - 91.739.028 91.739.028 - 91.739.028Other debts to third parties 25 - 3.514.933 3.514.933 - 3.514.933Financial derivative instruments 51.376 - 51.376 - 51.376
51.376 95.253.961 95.305.337 - 95.305.337Current liabilities
Financing obtained 22 - 22.748.153 22.748.153 - 22.748.153Suppliers 24 - 30.075.369 30.075.369 - 30.075.369Other debts to third parties 25 - 4.434.512 4.434.512 - 4.434.512State and other public entities 26 - - - 7.967.587 7.967.587Other current liabilities 27 - 15.182.434 15.182.434 - 15.182.434
- 72.440.468 72.440.468 7.967.587 80.408.05551.376 167.694.429 167.745.805 7.967.587 175.713.392
December 31, 2016
Non-current liabilitiesFinancing obtained 22 - 87.800.000 87.800.000 - 87.800.000Other debts to third parties 25 - 3.581.184 3.581.184 - 3.581.184
- 91.381.184 91.381.184 - 91.381.184Current liabilities
Financing obtained 22 - 24.767.181 24.767.181 - 24.767.181Suppliers 24 - 23.778.366 23.778.366 - 23.778.366Other debts to third parties 25 - 2.673.968 2.673.968 - 2.673.968State and other public entities 26 - - - 7.526.341 7.526.341Other current liabilities 27 - 13.765.036 13.765.036 - 13.765.036
- 64.984.551 64.984.551 7.526.341 72.510.892- 156.365.735 156.365.735 7.526.341 163.892.076
Financial instruments recognized at fair value
The table below details the financial instruments measured at fair value after initial recognition, grouped into three levels according to the possibility of observing its fair market value:
Level 1: fair value is determined based on current active market prices;
Level 2: fair value is determined based on valu-ation techniques. The main inputs of the valuation models are observable in the market;
Level 3: fair value is determined based on valua-tion models, whose main inputs are not observable in the market.
31-12-2017 Level 1 Level 2 Level 3
Financial assets measuredInvestments availabe for sale (Note 11) 2.115.063 - 673.616
Financial assets measured at fair valueInvestments in financial derivatives - 51.376 -
31-12-2016 Level 1 Level 2 Level 3
Financial assets measuredInvestments availabe for sale (Note 11) 2.760.006 - 1.001.955

46
Annual ReportFinancial Information2017
11. Other financial assets
As of 31 December 2017 and 2016, these captions included financial investments classified as available for sale and had the following movement in the year:
2017
Gross value Impairment losses(Note 28) Net value
Investments available for sale:Balances as of 1 January 2017 4.756.400 (994.439) 3.761.961Fair value variations 133.332 - 133.332Increases 265.942 (644.162) (378.220)Decreases (728.395) - (728.395)Balance as of 31 December 2017 4.427.280 (1.638.601) 2.788.679
Exercício de 2016
Gross value Impairment losses(Note 28) Net value
Investments available for sale:Balances as of 1 January 2016 3.806.418 (277.887) 3.528.531Fair value variations (390.365) - (390.365)Increases 1.340.347 (716.552) 623.795Balance as of 31 December 2016 4.756.400 (994.439) 3.761.961
As of 31 December 2017, the fair value of the Boero Bartolomeo, S,p,A, shares, corresponding to 2,515% of this entity’s share capital, amounted to, approximately, Euro 2,115,063 (1,981,731 Euro as of 31 December 2016), based on the year end stock quotation.
During the period ended 31 December 2017, the Group carried out the sale of shares which it possessed rela-tive to publicly-traded entities quoted in the Euronext Lisboa stock market, in the amount of 728,200 Euros.
The remaining financial investments referred to above mainly represented small investments in non-listed companies, The Board of Directors believes that the net value of these investments is similar to the respective fair value.
As of 31 December 2017 and 2016, the amounts clas-sified as short-term, included investments in banks that did not meet the requirements for classification as “Cash and cash equivalents”, namely bank deposits and investments within economies suffering from restrictions on capital transfers.
12. Taxes
The detail of the amounts and nature of assets and liabilities for deferred taxes recorded in the accom-panying consolidated financial statements, and the respective movement as of 31 December 2017, are as follows:

47
Openingbalances
Perimeter variations
Effecton results
Effecton Equity
Closing balancesDeferred tax assets:
Depreciation not accepted for tax purposes 482.295 - 38.601 - 520.896Provisions and adjustments not accepted for tax purposes 2.125.317 - 98.987 (49.181) 2.175.124Pension fund (relating to accrued cost) 344.537 - (15.675) - 328.862Merger reserve 814.808 - (197.583) - 617.225Tax losses 376.927 - 176.117 - 553.044Valuation of hedging derivate instruments - - - 11.560 11.560Others 254.549 - 22.920 (122.472) 154.997
4.398.433 - (123.367) (160.093) 4.361.708
Openingbalances
Perimeter variations
Effecton results
Effecton Equity
Closing balancesDeferred tax liabilities:
Amortization of revaluations not accepted for tax purposes 5.424 - (484) - 4.940Reinvestment of capital gains 7.403 - (1.900) - 5.503Pension fund (relative to deferred cost) 17.172 - (2.534) - 14.638Barnices Valentine’s fair value land exchange 981.538 - - - 981.538 Fair value of investments held for sale 34.210 - - 39.506 73.716Write-off of provisions 1.992.091 - - (339.084) 1.653.007Adjustments in fair value of properties 1.265.944 1.289.000 (72.956) - 2.481.988IAS 29 effect - - - 1.683.790 1.683.790Others 28.001 - 4.457 - 32.458
4.331.783 1.289.000 (73.417) 1.384.212 6.931.578
The detail of the amounts and nature of assets and liabilities for deferred taxes recorded in the accom-panying consolidated financial statements, and the respective movement as of 31 December 2016, are as follows:
Openingbalances
Perimeter variations
Effecton results
Effecton Equity
Closing balancesDeferred tax assets:
Depreciation not accepted for tax purposes 559.682 - (77.387) - 482.295Provisions and impairment losses not accepted for tax purposes 2.324.638 - (217.317) 17.996 2.125.317Pension fund (referring to accrued costs) 219.957 - 124.580 - 344.537Merger reserve 1.008.811 - (194.003) - 814.808Tax losses 241.818 - 169.020 (33.911) 376.927Others 260.141 - 12.671 (18.263) 254.549
4.615.047 - (182.436) (34.178) 4.398.433
Openingbalances
Perimeter variations
Effecton results
Effecton Equity
Closing balancesDeferred tax liabilities:
Amortization of revaluations not accepted for tax purposes 5.915 - (491) - 5.424Reinvestment of capital gains 9.303 - (1.900) - 7.403Pension fund (referring to deferred costs) 19.705 - (2.533) - 17.172Barnices Valentine’s fair value land exchange 981.538 - - - 981.538Fair value of investments held for sale 157.508 - - (123.298) 34.210Write-off of provisions 2.510.655 - - (518.564) 1.992.091Adjustments in fair value of properties 1.338.900 - (72.956) - 1.265.944Others 36.573 - (13.992) 5.420 28.001
5.060.097 - (91.872) (636.442) 4.331.783
The “Merger reserve” is a consequence of the merger held in previous years by former Spanish subsidiaries of subsidiary Barnices Valentine (and that was written-off in the previous years in the consolida-tion process) and is being depreciated for tax purposes over a period of 20 years.

48
Annual ReportFinancial Information2017
In accordance with the applicable legislation, the income tax returns of CIN and other Group companies are subject to review and correction by the tax authori-ties for a 4-year period (5-year for Social Security) except when tax losses have occurred or tax benefits have been granted, or tax inspections, claims or refu-tations are in progress, in which cases and depending on the circumstances, the deadlines are delayed or suspended, Therefore, the tax declarations of the Group Companies (established in Portugal) since 2014 are still subject to review.
The Board of Directors of CIN believes that eventual corrections following such revisions/inspections by the tax authorities will not have significant effect on the consolidated financial statements as of 31 December 2017.
In Spain, since the beginning of the year 2014, tax losses no longer have time limit for future use, In France, the future use of tax losses not also has a time limit.
As of 31 December 2017, the following Group compa-nies had tax losses that can be carried forward, as follows (in accordance with the respective tax returns):
Year in which they were generated Spain FranceYear 2004 143.761 -Year 2005 1.583.106 -Year 2006 887.467 -Year 2008 3.919.312 -Year 2009 - 241.669Year 2010 15.196.261 581.203Year 2011 10.837.227 2.226.426Year 2012 9.669.035 1.442.147Year 2013 6.943.987 443.956Year 2014 4.607.897 1.348.948Year 2015 5.203.274 -Year 2016 4.681.090 -Year 2017 7.999.218 -
71.671.635 6.284.349
During the period, there were no recorded deferred tax liabilities relative to these amounts.
The Group companies Amida Inversiones, S.L., CIN Valentine, S.A., Pinturas Cin Canárias, S.A., Cin Inmuebles, S.L., CIN Soritec S.A. and CIN Govesan, S.A. located in Spain, are being in accordance with theirs consolidated tax result, whose parent company is Amida Inversiones, S.L.U., which aggregates the tax losses generated by the companies in the tax perimeter. The Group companies located in France, Celliose and PFI, are also taxed in accordance with theirs consoli-dated tax result, in accordance with French legislation.
As of 31 December 2017 and 2016, the tax rates used to calculate the assets and liabilities for deferred taxes can be detailed as follows:
Tax rates31.12.2017 31.12.2016
Country of origin of the subsidiary:
Portugal 22,5% 22,5%Spain 25,0% 25,0%Luxembourg 29,2% 29,2%Angola 30,0% 30,0%Mozambique 32,0% 32,0%France 33,3% 33,3%Mexico 30,0% 30,0%South Africa 28,0% 28,0%
In accordance with article 88 of Corporate Income
Tax Code (“Código do Imposto sobre o Rendimento das Pessoas Colectivas”) CIN and its subsidiaries with headquarters in Portugal are also subject to an autono-mous taxation over a group of expenses at the rates defined in the referred article.
Tax benefits and exemptions
(I) Spain - Canarias
According to Spanish legislation, namely “Ley 19/1994, of 6 July – Modificación del Régimen Económico y Fiscal de Canarias”, modified by “Royal Decree-Law 12/2006 of 29 December” sets a tax measure to “reserve for investments in the Canary Islands,” which allows companies in rela-tion to their properties in the Canary Islands, allo-cate benefits such reservations, as a reduction of their tax calculation basis, with a maximum of 90% of undistributed profit. The amount of allocated benefit was materializing for a maximum period of three years from the fiscal year in which it was provided, the investments and the requirements laid down by that legislation.
The amounts must be invested in fixed assets in the Canary Islands and is necessary for the development of their economic activities, except for contributing to the improvement and environ-mental protection in that territory.
Assets must remain operational in the company at least five years without being transferred, leased or transferred to third parties for use. The reserve, which is included in the equity caption “Other reserves” is unavailable while goods that should remain associated with the Company, and the amount at 31 December 2017 amounted to 4,993,975 Euros, Pending realizable values were recorded in taxes of the respective companies, in a total amount of 265,235 Euros.

49
13. Other non-current assets
As of 31 December 2017 and 2016, the composition of the caption was up as follows:
31.12.2017 31.12.2016Retirement benefits (Note 23) 65.063 76.323Guarantee 199.230 182.147
264.293 258.470
14. Inventories
As of 31 December 2017 and 2016, the composition of the caption was up as follows:
31.12.2017 31.12.2016Raw, subsidiary and consumable materials 16.453.045 8.572.886
Merchandise 4.278.996 3.507.149Finished and intermediate goods 29.358.696 27.288.851
39.368.887Accumulated impairment losses on inventory (Note 28) (6.393.858) (6.434.686)
43.696.879 32.934.201
The cost of goods sold and consumed for the years ended as of 31 December 2017 and 2016 were computed as follows:
31.12.2017 31.12.2016Opening balances:
Raw, subsidiary and consuma-ble materials 8.572.886 10.454.957
Merchandise 3.507.149 2.951.649Changes in perimeter (Note 5) 750.355 1.961.782Purchases 116.581.346 97.934.023Inventory adjustments (364.141) (593.358)IAS 29 effect 1.408.750 -Exchange rate effect 429.896 (2.603.686)Closing Balance:
Raw, subsidiary and consuma-ble materials (16.453.045) (8.572.886)
Merchandise (4.278.996) (3.507.149)110.154.200 98.025.331
The changes in inventories of finished goods and work in progress for the years ended as of 31 December 2017 and 2016, was calculated as follows:
31.12.2017 31.12.2016Closing balances 29.358.696 27.288.851Inventory adjustments 150.175 1.740.950Changes in perimeter (Note 5) - (2.262.954)Opening balances (27.288.851) (26.255.955)
2.220.020 510.893
15. Customers
As of 31 December 2017 and 2016, this caption was composed as follows:
31.12.2017 31.12.2016Customers, current accounts 35.744.702 35.234.423Customers, notes receivable 3.484.477 1.423.518Customers, doubtful accounts 9.949.273 11.349.412
49.178.452 48.007.353Accumulated impairment losses on costumers (Note 28) (12.268.114) (12.624.348)
37.910.338 35.383.005
The Group’s exposure to credit risk is mainly attribut-able to the accounts receivable resulting from its oper-ating activities. The amounts presented in the balance sheet are net of accumulated impairment losses for doubtful accounts that were estimated by the Group, in accordance with its experience and based on the analysis of the economic environment. The Board of Directors believes that the net accounting values of the accounts receivable from customers are similar to their respective fair value. The Group has not a significant concentration of credit risk, as this risk is diluted within a vast number of customer.
In accordance with the information of the Group’s balance sheet, the aging of accounts receivable from customers is as follows:
31.12.2017 31.12.2016Not due: 29.498.494 24.472.330Due and not adjusted:
0-30 outstanding days 6.728.078 6.628.01630-90 outstanding days 1.610.052 1.830.087More than 90 outstanding days 73.714 2.452.572
Due and adjusted:0-90 outstanding days 276.992 382.87190-180 outstanding days 241.779 175.586180-360 outstanding days 1.019.148 868.615More than 360 outstanding days 9.730.195 11.197.276
49.178.452 48.007.353
16. Other debtors
As of 31 December 2017 and 2016, this caption was made up as follows:
31.12.2017 31.12.2016Suppliers debtors balances 338.837 292.332Personnel 128.069 302.535Advances to suppliers and sup-pliers of fixed assets 2.682 19.790
Others debtors 4.039.122 3.573.6764.508.710 4.188.333
Accumulated impairment losses (Note 28) (558.257) (503.838)
3.950.453 3.684.495

50
Annual ReportFinancial Information2017
17. Other current assets
As of 31 December 2017 and 2016, this caption was made up as follows:
31.12.2017 31.12.2016Prepaid insurance 114.686 157.739Prepaid rental 235.564 216.418Prepaid financial expenses 430.545 435.355Others 1.843.280 1.740.882
2.624.075 2.550.394
18. Cash and cash equivalents
As of 31 December 2017 and 2016, the caption “Cash and cash equivalents” was as follows:
31.12.2017 31.12.2016Cash and cash equivalents:
Cash 51.192 52.352Bank deposits on demand 25.230.701 33.762.537Cash equivalentes 45.650 47.353
25.327.543 33.862.242
As of 31 December 2017, the Company and its subsid-iaries have credit facilities amounting to 70,293,523 Euros available for future operating activities and to meet financial commitments, without any restriction to its use.
19. Share capital
As of 31 December 2017, CIN – Corporação Indus-trial do Norte, S.A.’s fully subscribed and paid up capital consisted of 25,000,000 bearer shares, with a nominal value of 1 Euro each.
As of 31 December 2017, Pleso Holding B.V. owned 100% of the Company’s share capital (Introduction).
20. Equity
Legal Reserve
Portuguese commercial legislation defines that at least, 5% of annual net profit must to be allocated to the legal reserve until it represents 20% of a compa-ny’s share capital. This reserve cannot be distributed to shareholders unless the company is to be liquidated. This reserve can be used to compensate accumulated losses provided that all other reserves are used first and can be incorporated into share capital.
Revaluation reserves
The revaluation of reserves may not be distributed to shareholders unless it is fully depreciated or if the property subject to reassessment has been sold.
Currency conversion reserves
The currency conversion reserves reflect the exchange rate changes occurred in the transposition of the financial statements of subsidiaries in currencies other than Euro and cannot be distributed or used to absorb losses.
Fair value reserves
The fair value reserves reflect the changes in fair value of financial instruments available for sale and cannot be distributed or used to absorb losses.
21. Non-controlling interests
During the year ended 31 December 2017 and 2016, the movement in the caption “Non-controlling inter-ests”, is detailed as follows:
31.12.2017 31.12.2016Balance as of 1 January 4.987 7.452Net profit of the period (2.351) (2.465)Balance as of 31 December 2.637 4.987
22. Loans
As of 31 December 2017, the detail by nature of bank loans was made up as follows:

51
Plafond Used amount Current Non currentBank loans 7.896.578 1.503.055 1.248.153 254.902Commercial Paper Programs 131.500.000 67.600.000 21.500.000 46.100.000 Bonds 45.000.000 45.000.000 - 45.000.000 Investment subsidies 399.677 399.677 - 399.677Effective interest rate method n.a. n.a. - (15.551)
184.796.255 114.502.732 22.748.153 91.739.028
Bank loans
As of 31 December 2017, the detail of bank loans (except for commercial paper programs) was made up as follows:
Company Plafond Used amount Current Non currentBarnices Valentine 2.500.000 1.156.477 1.156.477 - CIN 4.800.000 - - -CIN Soritec 250.000 - - - Monopol 219.128 219.128 91.676 127.452PFI Investissments 127.450 127.450 - 127.450
7.896.578 1.503.055 1.248.153 254.902
The other bank loans referred above bear interest at market rates.
Commercial Paper Programs
As of 31 December 2017, the Commercial Paper Programs can be detailed as follows:
Programtotal amount
Nominal value Current Non-current Interest Book value as at
December 31, 2017CIN- Corporação Industrial do Norte, S.AContract (40.000.000 Euros)
4th Emission 40.000.000 7.500.000 - 7.500.000 6.557 7.493.443Contract (40.000.000 Euros)
5th Emission 40.000.000 13.500.000 - 13.500.000 8.994 13.491.006Contract (11.500.000 Euros)
33rd Emission 11.500.000 6.500.000 6.500.000 - 2.889 6.500.000Contract (12.500.000 Euros)
4th Emission 12.500.000 2.350.000 - 2.350.000 1.306 2.350.000Contract (15.000.000 Euros) grouped
contract 11.500.000 11.500.000 - 57.660 11.500.000Contract (10.000.000 Euros)
9th Emission 10.000.000 10.000.000 - 10.000.000 5.333 10.000.000Contract (10.000.000 Euros)
5th Emission 10.000.000 10.000.000 - 10.000.000 8.889 10.000.000Contract (10.000.000 Euros)
5th Emission 10.000.000 2.750.000 - 2.750.000 2.933 2.750.000Contract (10.000.000 Euros)
Not used 10.000.000 - - - - -Contract (5.000.000 Euros)
Not used 5.000.000 - - - - -Contract (7.500.000 Euros)
Not used 7.500.000 - - - - -Cin Valentine SLContract (15.000.000 Euros) grouped
9th Emission contract 1.000.000 1.000.000 - 5.014 1.000.000Amida InversionesContract (15.000.000 Euros) grouped
8th Emission contract 2.500.000 2.500.000 - 12.535 2.500.000 67.600.000 21.500.000 46.100.000 112.110 67.584.449

52
Annual ReportFinancial Information2017
Commercial Paper Program balances have the following underlying contracts:
Company Program total amount Beginning date Maturity
CIN - Corporação Industrial do Norte, S.A. 40.000.000 June 2017 June 2022CIN - Corporação Industrial do Norte, S.A. 15.000.000 September 2014 September 2020CIN - Corporação Industrial do Norte, S.A. 12.500.000 June 2017 June 2020CIN - Corporação Industrial do Norte, S.A. 11.500.000 September 2014 September 2021CIN - Corporação Industrial do Norte, S.A. 10.000.000 June 2016 June 2020CIN - Corporação Industrial do Norte, S.A. 10.000.000 May 2017 May 2022CIN - Corporação Industrial do Norte, S.A. 10.000.000 May 2017 May 2024CIN - Corporação Industrial do Norte, S.A. 10.000.000 March 2014 March 2019CIN - Corporação Industrial do Norte, S.A. 7.500.000 June 2014 June 2019CIN - Corporação Industrial do Norte, S.A. 5.000.000 October 2015 October 2018
131.500.000
In accordance with these contractual terms, the Commercial Paper Programs issuances can be made up to one year, up to the agreed limit. The financial insti-tutions have committed themselves to the full distribu-tion of every issuance.
CIN’s Board of Directors intends to make use of the programs mentioned above for a period longer than 12 months.
Bonds
On 31 December 2017, this caption consisted of two loans denominated “CIN / 2016-2021” and “CIN 2014/2019”, in the amount of Euro 25,000,000 and Euro 20,000,000 respectively, issued by CIN – Corporação Industrial do Norte, S.A.. According to their conditions, the loans bear interest indexed to Euribor, with 1,8625% and 3,35% spread, and maturity is December 2021 and December 2019, respectively.
Borrowings payback plans
As of 31 December 2017, Commercial Paper Programs classified as non-current and the bonds, had the following projected repayment and interest payment plan, considering full use of the existing programs:
Effective interest rate 2018 2019 2020 2021 2022 2023 2024 Total
Repayment - 23.000.000 25.500.000 28.000.000 38.000.000 - 10.000.000 124.500.000Interest 1,50% 1.911.250 1.181.250 1.100.000 771.250 141.667 100.000 41.667 5.947.083
1.911.250 24.881.250 26.600.000 28.771.250 38.141.667 100.000 10.041.667 130.447.083
The detail of the liabilities occurring from financing activities as of the period ended 31 December 2017 can be found below:
BorrowingsBalance as of 1 January 2017 112.567.181Cash-Flows:
Income from financial debt 44.226.108Expense from financial debt (41.506.827)
Conversion of borrowings into non-repayable subsidies. (726.319)
Others (72.962)Balance as of 31 December 2017 114.487.181
23. Pension commitments
CIN Pension Fund:
The CIN Pension Fund, which was created by public deed on 31 December 1987 and is managed by “SGF - Sociedade Gestora de Fundos de Pensões, S,A,”, was set up to provide employees retired as from that date, due to age or disability, the right to a monthly pension complement. This pension complement is calculated at the rate of 0.5% per year of employment, up to a maximum of 12,5% of the employee’s gross salary at the date of retirement.
In accordance with an actuarial valuation performed
by the Fund manager, the present value of the liabilities for past services of retired and current employees as of 31 December 2017 and 2016 was as follows:
53
31.12.2017 31.12.2016Current 5.073.396 4.680.283Retired 2.519.036 2.469.339
7.592.432 7.149.622
As of 31 December 2017 and 2016, those liabilities were calculated using the “Projected Unit Credit” method and the mortality table TV 88/90 and disability table SR (Suisse Re). In addition to the technical parameters referred to above, the valuation was made assuming annual salary increases of 0.5% (0.5% in 2016), a rate of return for the fund of 3.77 (3.77% in 2016, zero rate of increase of the pensions on payment, tech-nical interest rate of 3.77 (3.77% in 2016) and personnel “turnover” computed in accordance with the average historical data for the Company between 1994 and 2016.
The movement in the liabilities for past services for the periods ending 31 December 2017 and 2016 was as follows:
31.12.2017 31.12.2016Liabilities for past services as of 1 January 7.149.622 6.914.664
Current services cost 190.246 187.175Interest cost 264.639 244.352Actuarial losses (gains) 267.435 70.292Retirement supplements paid (279.510) (266.861)
Liabilities for past services as of 31 December 7.592.432 7.149.622
During the years 2017 and 2016, the movement in the net assets of the Fund was as follows:
31.12.2017 31.12.2016Balance as of 1 January 5.918.344 5.937.075
Contributions 300.000 300.000Fund income, net 215.835 (51.870)Retirement supplements paid (279.510) (266.861)Difference related to the prior period valuation
(23.848) -
Estimated balance as of 31 December 6.130.821 5.918.344
The Group maintains recorded in the caption “Retirement benefit obligations” the amount necessary to cover the liabilities for past services not covered by the assets of the Fund in accordance with the actu-arial study reported as of 31 December 2017, total-ling the balance of this caption Euro 1,461,611 as of 31 December 2017 (Euro 1,231,278 as of 31 December 2016), which was subjected to an increase in financial year 2017 of Euro 498,244 (increase of Euro 587,469 in 2016), as detailed below:
31.12.2017 31.12.2016Cost of current services 190.246 187.175Interest cost 264.639 244.352Fund income, net (215.835) 51.870Actuarial losses (gains) 267.435 70.292Cost of past services ("Deffered Costs") 11.260 33.780Diference related to prior period valuation (19.501) -
498.244 587.469
Consequently, the movement occurred during periods ended 31 December 2017 and 2016 on the caption “Retirement benefit obligations” for retirement benefits not covered by the assets of the Pension Fund was as follows:
31.12.2017 31.12.2016Balance as of 1 January 1.231.278 977.589
Personnel 498.244 587.469Contributions to the pension Fund (300.000) (300.000)
Cost of past services ("Deffered Costs") (11.260) (33.780)
Diference related to prior period valuation 43.349 -
Estimated balance as of 31 December 1.461.611 1.231.278
The Group deferred actuarial gains or losses related to changes in criteria in the actuarial estimate of remaining employees active period, which currently amounts to 22 years. Thus, the cost of past services established in 2003, comprising mainly the effects asso-ciated with changes in the universe of workers included in the Pension Fund, was recorded in the caption as “Other non-current assets” (Note 13).
Movements in this caption in 2017 and 2016 related to retirement benefits were made up as follows:
31.12.2017 31.12.2016Balance as of 1 January 76.323 87.583
Amortization of the cost of past services (11.260) (11.260)
Estimated balance as of 31 December 65.063 76.323
24. Suppliers
As of 31 December 2017 and 2016, this caption refers to accounts payable for acquisitions resulting from the normal course of the Group’s activities, and has the following composition:
31.12.2017 31.12.2016Suppliers – current accounts 29.568.360 23.519.889Suppliers – outstanding bills 507.009 258.477
30.075.369 23.778.366
As of 31 December 2017 and 2016, payables to suppliers are due within less than four months.
25. Other creditors
Current As of 31 December 2017 and 2016, this caption was
made up as follows:

54
Annual ReportFinancial Information2017
31.12.2017 31.12.2016Fixed assets suppliers 2.423.151 1.443.333Clients credit balance 478.217 293.090Personnel 252.652 184.647Others 1.280.492 752.898
4.434.512 2.673.698
Minimum payment Present value of minimum payments
31.12.2017 31.12.2016 31.12.2017 31.12.2016Until 1 year 877.036 985.093 860.066 805.774Between 1 to 5 years 2.904.998 3.907.345 2.721.116 3.581.183More than 5 years - - - -
3.782.034 4.892.438 3.581.183 4.386.957Discount financial effect (200.851) (505.481) n/a n/aPresente value of minimum payments 3.581.183 4.386.957 3.581.183 4.386.957
26. State and other public entities
As of 31 December 2017 and 2016, the amounts of liabilities in this caption were as follow:
Asset Liability
31.12.2017 31.12.2016 31.12.2017 31.12.2016Corporate Income Tax 2.508.392 3.373.237 (3.762.246) (3.552.107)Value Added Tax 1.025.583 350.079 (2.152.239) (1.967.550)Social Security contributions - - (1.211.041) (1.345.272)Withholding Income Taxes 190.474 216.839 (656.142) (531.577)Others 648.947 123.430 (185.919) (129.835)
4.373.396 4.063.585 (7.967.587) (7.526.341)
27. Other current liabilities
As of 31 December 2017 and 2016, this caption was made up as follows:
31.12.2017 31.12.2016Accrued costs:
Accrued payroll 5.095.790 5.942.185Rappel 5.489.217 4.433.543Accrued interest 134.617 104.744Accrued insurances 17.328 99.015Royalties 16.284 18.056Others 3.562.222 2.965.308
14.315.458 13.562.851Deferred income:
Investments Subsidies 838.993 190.927Others 27.983 11.258
866.976 202.18515.182.434 13.765.036
Non - Current
As of 31 December 2017 and 2016, this caption respects entirely about leasing contracts related to computer hardware in the amounts of 2,721,116 Euros and 3,581,183 Euros respectively.
The minimum payments for leases as of 31 December 2017 and 2016 are detailed as follows:
28. Provisions and accumulated impairment losses
The movement occurred in provisions and accumu-lated impairment losses for the years ended as of 31 December 2017 and 2016 was as follows:

55
2017Opening
Balances Increase Utilization Decrease Transfer Closing
Impairment losses in accounts receivable (Notes 15 and 16) 13.128.185 1.424.718 (1.656.941) (1.069.591) - 11.826.371
Impairment losses in inventories (Note 14) 6.434.686 1.911.196 4.601 (1.956.625) - 6.393.858
Impairment losses in available for sale Investments (Note 11) 994.440 623.163 20.998 - - 1.638.601
Provision 4.605.815 2.625.796 (3.029.363) (1.488.000) 5.942.699 8.656.947
2016Opening
Balances Increase Utilization Decrease Transfer Closing
Impairment losses in accounts receivable (Notes 15 and 16) 15.937.840 1.255.206 (2.904.426) (1.496.380) 335.945 13.128.185
Impairment losses in inventories (Note 14) 5.588.733 1.872.238 0 (2.254.479) 1.228.194 6.434.686
Impairment losses in available for sale Investments (Note 11) 277.887 742.125 0 (25.572) 0 994.440
Provision 4.869.998 1.326.938 (543.831) (1.317.289) 270.000 4.605.816
The “Accumulated impairment losses” are recorded in the attached consolidated balance sheet as a deduc-tion to the corresponding asset.
29. Sales and services rendered by geographic markets
Sales and services rendered by geographic markets during 2017 and 2016 were as follows:
31.12.2017 31.12.2016Domestic market 194.004.273 180.149.353International market 33.815.755 30.158.855
227.820.028 210.308.208
The Group defines as domestic market the sales made in the countries where it has its operational activity (introduction).
30. Financial results
As of 31 December 2017 and 2016, the financial results were as follows:
31.12.2017 31.12.2016Financial expenses:Interest 1.750.916 1.948.639Other financial expenses 1.520.712 1.123.057
3.271.628 3.071.426Financial results (2.510.752) (2.445.669) 760.876 625.757Financial income:Interest 705.708 562.403Other financial income 55.168 63.354
760.876 625.757
31. Corporate income tax
The Corporate Income Tax recorded in the years ended as of 31 December 2017 and 2016 can be detailed as follows:
31.12.2017 31.12.2016Current tax 3.251.643 1.790.962Deferred taxes (Note 12) (196.785) 90.563
3.054.858 1.881.525
32. Responsibilities for guarantees provided
As of 31 December 2017, the Group had assumed responsibilities for guarantees granted to third parties as follows:
Ayuntamiento de Montcada (Spain) 586.885IAPMEI 338.121Câmara Municipal da Maia 75.000Others 149.713
33. Operating leases
During the year end as of 31 December 2017, was recognized as expense of the period the amount of 1,380,948 Euro (1,905,645 Euro as of 31 December 2016) relating to operating lease contracts.
Additionally, as of the balance sheet date, irrevo-cable operating lease contracts were in place, which had the following renting payments:

56
Annual ReportFinancial Information2017
31.12.2017 31.12.2016Due in N+1 864.651 1.778.599Due in N+2 518.177 1.101.658Due in N+3 303.440 686.390Due after N+3 107.863 1.225.267
1.794.131 4.791.914
The lease contracts mentioned above refer to vehicle leases, which serve the Group’s commercial network, technical services and other employees and administrative teams. The average duration for these leases is 4 years.
34. Earnings per share
The earnings per share, basic and diluted, are calcu-lated dividing the consolidated net result by the average number of existing shares during the period.
31.12.2017 31.12.2016Profit/(Loss):
Net profit for the period 7.609.480 7.326.123Number of shares
Average number of shares in circulation 25.000.000 25.000.000
Basic earnings per share 0,304 0,293
35. Contingent assets and liabilities
Tax Payments:
In December 2002, in the context of the Special Regime for the Settlement of Debts to the Tax Authori-ties and Social Security (“Regime Excepcional de Regularização de Dívidas ao Fisco e Segurança Social” - Decree Law 248-A/2002, of 14 November), and during the year ended as of 31 December 2013, in the context of the Special Regime for the Settlement of Debts (“Regime Excepcional de Regularização de Dívidas” - Decree Law 36/2013, of 24 September), CIN paid addi-tional liquidations of Corporate Income Tax (“Imposto sobre o Rendimento de Pessoas Colectivas”), which were previously contested.
The Company recorded as a debit balance in the caption “State and other public entity” the amount paid of Euro 443,745 and did not create any provision to face the risk of recovery of the amount paid since the Board of Directors believes that the outcome from the claim will be favorable to the Company.
Lawsuits:
On the date of approval of these accounts, the group company, CIN Valentine S.A., is co-defendant in
several lawsuits brought against the modification of the “General Plan Metropolitano” and, as a consequence of the referred land division plan mentioned in Note 6. The financial statements at December 31, 2017 do not include any provision, since the Board of Directors, supported in its legal counsel, believe that the outcome of such lawsuits will be favorable to the group, as any loss generated will be subject to an indemnity from the state authorities in accordance with the contracts in force.
36. Statutory bodies’ members remuneration
As of 31 December 2017 and 2016, CIN (“Mother Company”) attributed to its statutory bodies members of the parent company the following remuneration:
31.12.2017 31.12.2016Board of Directors 373.700 344.400Supervisory Board 21.050 20.600General Assembly 4.300 4.200
37. Number of personnel
As of 31 December 2017 and 2016, the number of employees of the companies included in consolidation was 1,364 e 1,329, respectively.
38. Financial statements approval
The consolidated financial statements were approved by the Board of Directors and authorized for issuance as of 10 May 2018. Additionally, the attached financial statements as of 31 December 2017 are pending approval by the General Assembly of Share-holders. However, the Board of Directors believes that they will be approved without significant changes.
39. Environmental area information
The Group takes the necessary measures regarding the environmental area, in order to comply with the prevailing legislation.
In relation with this matter, it is important to highlight that CIN Group is currently monitoring and taking the necessary measures to comply with the rules set forth in Decree-Law n,º 181/2006, of 6 September, namely the limitation of the volatile organic compounds (“VOC”) emissions from paints and varnishes (that are respon-sible for the formation of tropospheric ozone) and consequently prevent or reduce atmospheric pollution.

57
Maia, May 10th, 2018
ACCOUNTANT Nº 63002 THE BOARD OF DIRECTORS
Paula Macedo João Manuel Fialho Martins Serrenho, President Maria Francisca Fialho Martins Serrenho Bulhosa, Member Maria João Serrenho dos Santos Lima, Member Ângelo Barbedo César Machado, Member Manuel Fernando de Macedo Alves Monteiro, Member
The Board of Directors of CIN Group believes that there are no risks associated to environmental protec-tion and improvement, and confirms that no commu-nication or sanction related with these matters was received during 2017
40. Explanation added for translation
These consolidated financial statements are a translation of financial statements originally issued in Portuguese in accordance with International Finan-cial Reporting Standards (IFRS/IAS), some of which may not conform or be required by generally accepted accounting principles in other countries. In the event of discrepancies, the Portuguese language version prevails.

Annual ReportFinancial Information2017
58
Annual ReportFinancial Information2017
StatutoryAuditReport

59
Annual ReportFinancial Information2017

60
Annual ReportFinancial Information2017

61

CIN – CORPORAÇÃO INDUSTRIAL DO NORTE, S. A.Av de Dom Mendo nº 831 (antes EN13 km6) - 4474-009 Maia - Portugal T +351 229 405 000 - [email protected]