PERFORMANCE ANALYSIS OF A PRIVATE COMMERCIAL BANKS IN BANGLADESH
Upload
jufra-aktherCategory
view
41download
8description
1
AN ANALYSIS OF RELATIVE EFFICIENCY
OF SELECTED BANKS IN BANGLADESH

2
AN ANALYSIS OF RELATIVE EFFICIENCY
OF SELECTED BANKS IN BANGLADESH
AN INTERNSHIP REPORT
Prepared for: Dr. Md. Sadiqul Islam
Professor Department of Finance
University of Dhaka
Prepared by:
Jufra Akther BBA (13th Batch)
ID # 13-036
DEPARTMENT OF FINANCE
UNIVERSITY OF DHAKA
Submission Date: October 31, 2011.

3
October 31, 2011
Dr. Md. Sadiqul Islam
Professor
Department of Finance
University of Dhaka
Subject: Submission of the Report on “An Analysis of Relative Efficiency of Selected Banks
of Bangladesh”.
Dear Sir,
I would like to submit the report on “An Analysis of Relative Efficiency of Selected Banks
of Bangladesh” that you assigned me as partial fulfillment of my BBA degree requirement.
In preparing the report I collected and analyzed all the pertinent information. I have tried my
best to analyze the information as comprehensively as possible.
This report is prepared based on informal interview of the executives, internet data and
analysis of annual reports of the banks. Any sort of suggestion regarding this paper would be
gladly appreciated and I would be gratified if this paper serves its purposes.
Sincerely yours,
………………………….
Jufra Akther
BBA (13th Batch)
ID#13-036
Department of Finance
University of Dhaka

4
TABLE OF CONTENTS
Page No.
LETTER OF TRANSMITTAL I
EXECUTIVE SUMMARY IV
Chapter 1
1. INTRODUCTION 1-2
1.1 Origin of the Study
1.2 Objective of the study
1.3 Limitations of the Study
Chapter 2
2. METHODOLOGY OF THE STUDY 3-7
2.1 Techniques of Analysis
2.2 Data Collection Method
2.3 Secondary Sources
Chapter 3
3. BANKING SECTORS IN BANGLADESH 8-19
3.1 Banking Laws and Regulations
3.1.1 The Bank Company Act, 1991
3.1.2 Banking Regulations
3.2 Institutional Framework of Banking Sector in Bangladesh
3.3 Competition among Banks and Non-banking Financial Institutions
3.3.1 Recent Development and Activities of NBFIs
3.3.2 Competition and Product Diversification
3.3.3 Cost of Fund
3.3.4 ROEs of NBFIs and PCBs
3.3.5 NPL to Total Financing of Banks and NBFIs
Chapter 4
4. COMPARATIVE ANALYSIS AMONG STATE-OWNED, PRIVATE
COMMERCIAL AND FOREIGN BANKS 20-25

5
4.1 Capital Strength
4.2 Credit Quality
4.3 Operating Performance
4.3.1 Return On Equity
4.3.2 Return On Assets
Chapter 5
5. FINANCIAL PERFORMANCE ANALYISIS 26-36
5.1 Cross Sectional Analysis
5.2 Time Series Analysis
Chapter 6
6. CONCLUSION 37-38
Findings from The Study
BIBLIOGRAPHY 39
APPENDIX

6
Executive Summary
Banking sector is expanding its hand in different financial events everyday. Banking
customers have also changed in recent years. Customers are more knowledgeable,
sophisticated, and assertive. They demand higher levels of customer service, are less loyal,
and more inclined to switch to a competitor. Modern customers require flexibility in hours of
operation, greater convenience, customization, transparency, accessibility, and control.
Competition to attract new customers is fierce. At the same time, the banking process is
becoming faster, easier, and the banking arena is becoming wider. As the demand for better
service increases day by day, they are coming with different innovative ideas and products. In
order to survive in the competitive field of the banking sector, all banking organizations are
looking for better service opportunities to provide their fellow clients.
The main objective of the report is to analysis the efficiency of the selected banks. this report
has been sequenced into six chapters. In the first chapter introduction, objective, limitation
have been enunciated. In the second chapter, I have included methodology, techniques of
analysis and data collection. The third chapter focuses on banking sectors in bangladesh. this
chapter shows Banking Laws and Regulations, Institutional Framework of Banking Sector in
Bangladesh, Competition among Banks and Non-banking Financial Institutions. Banking
Laws and Regulations includes Bank Company Act 1991 and Bangladesh Bank Provisions. The
fourth chapter consists of the graphical presentation of comparative analysis among state
owned, private commercial and foreign commercial banks. Fifth chapter includes the analysis
and findings. Sixth chapter includes conclusions and findings from the study. Finally, we have
included the appendix and bibliography.

7
CHAPTER ONE
1. INTRODUCTION

8
1.1 ORIGIN OF THE STUDY:
This report is an Internship Report prepared as a requirement for the completion of the BBA
program of University of Dhaka. The primary goal of internship is to provide an on-the-job
exposure to the student and an opportunity for translation of theoretical conceptions in real
life situation. Students are placed in enterprises, organizations, research institutions as well as
development projects. The program covers a period of three months of organizational
attachment.
After the completion of BBA program, I, Jufra Akther, was assigned to prepare an intership
report on the relative efficiency of selected banks in Bangladesh for the internship program
under the guidance of my faculty advisor Professor Dr. Md. Sadiqul Islam. The duration of my
study was three months. As a requirement for the completion of the program I needed to
submit this report.
1.2 OBJECTIVE OF THE STUDY:
The study has been undertaken with the following objectives:
1. Analysis the Efficiency of the selected banks for the last five years,
2. Assess the Capital Adequacy trend of these selected banks.
1.3 LIMITATIONS OF THE STUDY:
This study is also not without its limitations like any other study. One of its limitations that it
does not include all financial statements of state-owned commercial banks. Due to the
bank’s policy of maintaining secrecy it was not possible to access core data of Banks. There
are other limitations that I have faced while preparing this report like the time to prepare a
report on such an important analytical topic was not sufficient and knowledge of the makers
was not sufficient to solve such an important issue. There are numerous approaches to
measure the performance of a bank. Calculation of average cost and presenting it through
curvature is one of the means to judge the efficiency of commercial bank. Such curvature will
demonstrate a relationship between bank size and unit of production. The other most widely
used methods are Data Envelopment Analysis and the Stochastic Frontier Approach. Because
of data insufficiency neither of this method is trailed

9
CHAPTER TWO
2. METHODOLOGY
10
2.1 Techniques of Analysis:
In processing the data, various methods of conventional statistics were deployed. time series
analysis and cross sectional analysis were the main statistical techniques used for revealing
the innate characteristics of the phenomenon studied. In some cases, calculated data are
presented in graph to give the reader a better understanding of the financial components.
This study uses the major banking activities and is comprised of total deposits, total income,
total expense, total loans & advances, shareholders’ equity, net interest income, net profit,
total assets, interest expense and interest income. Moreover, some selected key financial
ratios are used like Capital Adequacy ratio, % of NPL to total loan, credit to deposit ratio,
return on equity and return on assets. Also, this study tries to explore any kind of variance
according to its different variables. Statistical MINITAB software is used for the trend analysis.
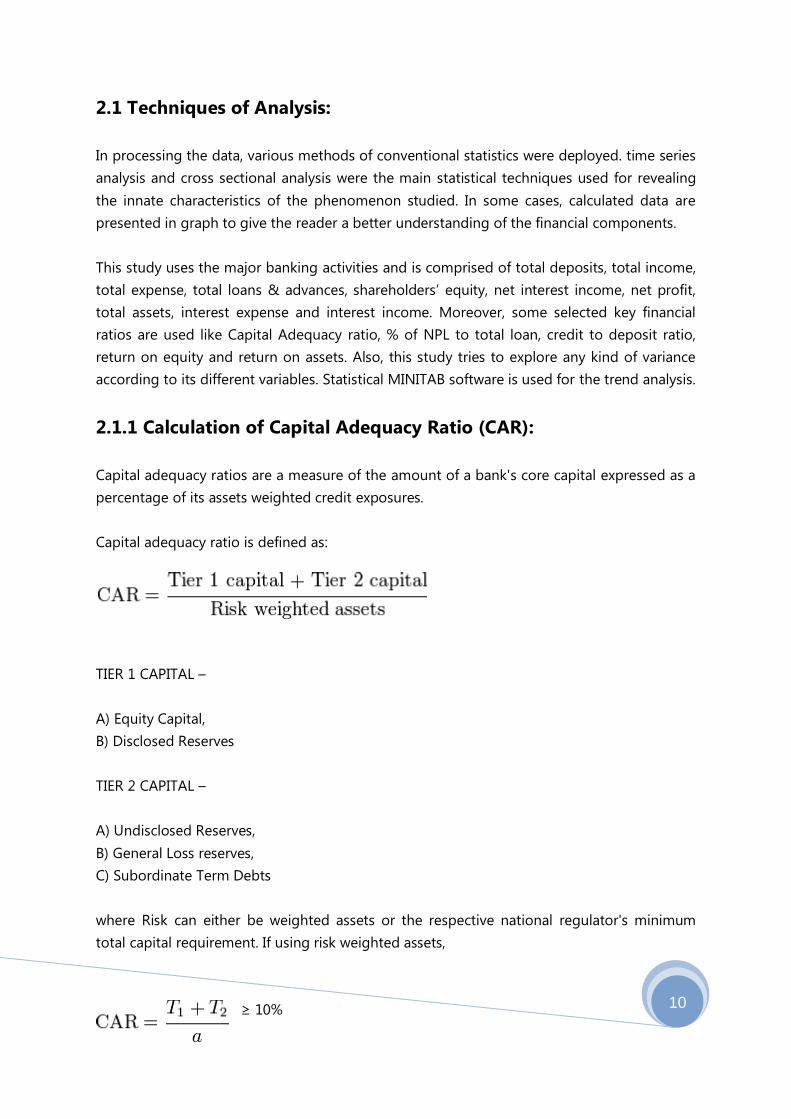
2.1.1 Calculation of Capital Adequacy Ratio (CAR):
Capital adequacy ratios are a measure of the amount of a bank's core capital expressed as a
percentage of its assets weighted credit exposures.
Capital adequacy ratio is defined as:
TIER 1 CAPITAL –
A) Equity Capital,
B) Disclosed Reserves
TIER 2 CAPITAL –
A) Undisclosed Reserves,
B) General Loss reserves,
C) Subordinate Term Debts
where Risk can either be weighted assets or the respective national regulator's minimum
total capital requirement. If using risk weighted assets,
≥ 10%

11
The percent threshold varies from bank to bank (10% in this case, a common requirement for
regulators conforming to the Basel Accords) is set by the national banking regulator of
different countries.
Two types of capital are measured: tier one capital, which can absorb losses without a bank
being required to cease trading, and tier two capital, which can absorb losses in the event of
a winding-up and so provides a lesser degree of protection to depositors.
CORE CAPITAL (TIER-1)
A. Paid up Capital
B. Non-repayable Share premium account
C. Statutory Reserve
D. General Reserve
E. Retained Earnings
F. Minority interest in Subsidiaries
G. Non-Cumulative irredeemable Preference Shares.
H. Dividend Equalisation Account
SUPPLEMENTARY CAPITAL (TIER-2)
A. General provision (1% of Unclassified loans)
B. Assets Revaluation Reserves
C. All other Preference Shares
D. Perpetual Subordinated debt
E. Exchange Equalisation Account
Core Capital must be equal to or more than 4.5% of the risk-weighted assets.
2.1.2 Calculation of Non Performing Loan (NPL):
Non-performing Loan sub-standard loan + doubtful loan + classified loan
% of NPL to Total Loan = (Sub-standard Loan+Doubtful Loan+ Classified Loan)/Total Loan
12
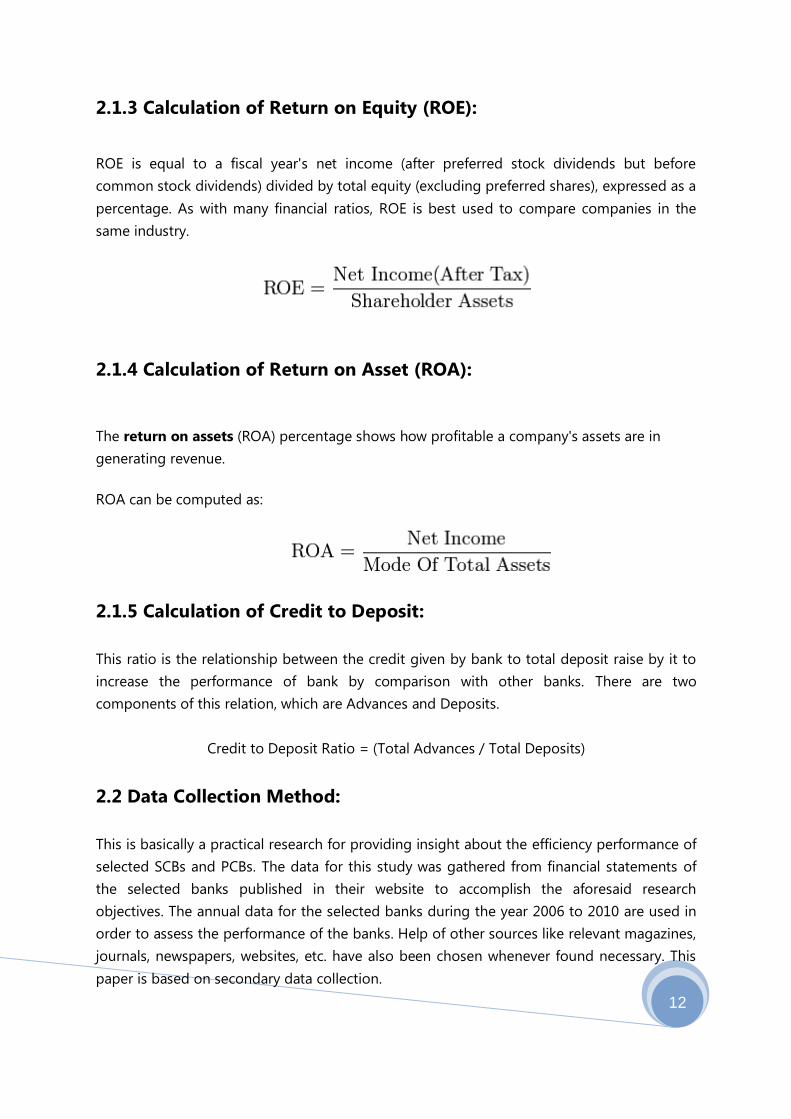
2.1.3 Calculation of Return on Equity (ROE):
ROE is equal to a fiscal year's net income (after preferred stock dividends but before
common stock dividends) divided by total equity (excluding preferred shares), expressed as a
percentage. As with many financial ratios, ROE is best used to compare companies in the
same industry.
2.1.4 Calculation of Return on Asset (ROA):
The return on assets (ROA) percentage shows how profitable a company's assets are in
generating revenue.
ROA can be computed as:
2.1.5 Calculation of Credit to Deposit:
This ratio is the relationship between the credit given by bank to total deposit raise by it to
increase the performance of bank by comparison with other banks. There are two
components of this relation, which are Advances and Deposits.
Credit to Deposit Ratio = (Total Advances / Total Deposits)
2.2 Data Collection Method:
This is basically a practical research for providing insight about the efficiency performance of
selected SCBs and PCBs. The data for this study was gathered from financial statements of
the selected banks published in their website to accomplish the aforesaid research
objectives. The annual data for the selected banks during the year 2006 to 2010 are used in
order to assess the performance of the banks. Help of other sources like relevant magazines,
journals, newspapers, websites, etc. have also been chosen whenever found necessary. This
paper is based on secondary data collection.

13
2.2.1 Sample Size:
With the objective of preparing this report, I have selected seven Banks including five private
commercial banks:
1. Trust Bank,
2. Bank Asia,
3. One Bank,
4. Prime Bank and
5. Premier Bank
and two state-owned banks:
1. Rupali Bank and
2. Pubali Bank.
The analysis of the report has been based on Annual Reports for each banks mentioned
above for the fiscal year 2006 to 2010.
2.3 Secondary Sources:
Secondary sources of data are collected from-
Annual Reports of the selected banks from FY2006 to FY2010.
Website of the selected banks.
Different newspaper, published journals and articles.
Bangladesh bank monthly economic trends.
Bangladesh Bank Bulletin.
Bangladesh Bank Annual Reports from FY2006 to FY2010.

14
CHAPTER THREE
3. BANKING SECTORS IN BANGLADESH

15
3.1 Banking laws & Regulations:
3.1.1 The Bank Company Act, 1991:
Act NO. 14: An Act which was made to make provisions for banking companies. This Act may
be called the Banking Companies Act, 1991. It shall be deemed to have come into force on
14th February 1991. Every company carrying on the business of banking in Bangladesh shall
use the word "bank" or any of its derivatives as part of its name. For the purpose of this
section, "goods" means every kind of movable property.
In the case of new banks and special banks the amount of the paid-up capital and reserves
shall not be less than the amount determined in or under the Act under which the said banks
have been established. The amount of paid-up capital and reserves of all banks except new
banks and special banks shall not be less than one hundred million Takas, or an amount
representing 6 per cent of the total demand and time liabilities of such company at the close
of the last working day of the previous financial year, whichever is higher.
No banking company except new and special banks shall pay any dividend on its shares,
unless- a) all its capitalized expenses including preliminary expenses, organization expenses,
commission for share selling and brokerage, losses and other items have been completely
written off, or b) it manages to preserve constantly six per cent of its temporary and demand
deposits as discharged and reserved capital.
Without the previous approval of the Bangladesh Bank, no banking company shall grant
respite of loans taken from it by any of the following persons or institutions- a) any of its
directors, and his family members; b) a commercial institution or company in which any
director of the banking company is interested as landowner, co-director, managing agent;
and c) any such person in which any director of the banking company is interested as partner
or landowner.
Every banking company shall maintain in Bangladesh in cash, gold or unencumbered
approved securities valued at a price not exceeding the current market price, an amount
which shall not at the close of business on any day be less than the percentage of its time
and demand liabilities the Bangladesh Bank determines from time to time.
The profit and loss account and financial report of a banking company shall be audited in
accordance with the balance sheet prepared under section 38 by a person qualified under
the Bangladesh Chartered Accountants Order, 1973 (P.O. No. 2 of 1973), or any other law for
16
the time being in force to be an auditor of companies and approved by the Bangladesh Bank
to be qualified to audit a banking company.
3.1.2 Banking Regulations:
As part of the ongoing efforts to strengthen the banking system through the adoption of
policies aimed at both improving the financial strength of banks as well as bringing about
greater transparency in their operations, several policy measures were initiated:
Capital Adequacy of the Banks
Bangladesh Bank (BB) has introduced a new Risk Based Capital (RBCA) framework for banks
from 2009 in line with Basel-II. Basel-II has fully come in to force from January 2010 as a
regulatory compliance. Under the new capital adequacy framework (Basel-II), BB is entrusted
with ensuring that banks are accurately assessing all the risk they are exposed to and
maintaining the required capital in commensurate with their risk profile. Banks have been
instructed to raise their capital to Taka 4.0 billion of which paid up capital shall be minimum
Taka 2.0 billion with effect from 11 August 2011. Minimum Capital Requirement (MCR) has
been phased out to 8% of risk-weighted assets (RWA) up to June 2010, 9% up to June 2011
and 10% from July 2011 onward. Any banking company can invest up to a maximum 10
percent of its total capital in any bond/debentures of a company approved by Securities and
Exchange Commission effective from 28 January 2008.
Rationalization of Schedule of charges
Considering the interest of the small depositors it has been decided that no charge can be
imposed as account maintenance fee for average deposit balance up to Taka 5000. It has
also been decided that Taka 100 at maximum may be imposed as account maintenance fee
on six monthly basis for average deposit balance up to Taka 25000.
Rationalization of Rate of Interest
Considering the existing inflation rate and global economic situation, the maximum rate of
interest on agriculture, term loans and working capital for large and medium scale industry,
housing sector loan, trade financing and financing to NBFI's by banks has been fixed at 13%.
Banks are allowed to differentiate rate of interest up to a maximum of 3% considering
comparative risk elements involved among borrowers in same lending category. With
progressive deregulation of interest rates, banks have been advised to announce the mid-
rate of the limit (if any) for different sectors and they may change interest 1.5% more or less
than the announced mid-rate on the basis of the comparative credit risk.

17
Bank Account for Farmers
Considering contribution of the farmers to the economic activities especially in agricultural
activities, it has been decided that a farmer can open an account by depositing 10 Taka only
at any state owned commercial and specialized bank against National ID Card/Birth
Registration Card and Agricultural Equipment Assistance Card issued by the Department of
Agricultural Extension. There will be no bindings for maintaining minimum balance on the
said account and banks shall not impose any charges/fees on these accounts.
Assistance for Export Oriented Ship Industry
Bangladesh Bank has issued necessary instructions to facilitate export oriented ship industry
in the backdrop of increasing demand of ocean going ship in the world market. Those
instructions issued with a view to increasing export earnings as well as creating huge
employment. The commission charged by the local bank against guarantee of advance to
exporters by indenters/buyers in addition to Add Confirmation Charge imposed by foreign
banks for exporting ship shall not exceed yearly 1.50 percent. The existing instruction shall
also be applicable in case of opening L/C for this industry. In this case, commission for
opening sight L/C will be 0.40% at maximum, 0.50% for opening deferred/usance L/Cs,
maximum 0.25% commission for opening L/C by 100% cash margin, and commission for
opening Back to back L/C 0.40% at maximum in each quarter. In any case commission for
opening L/C shall not be in excess of 2% yearly.
No Loan/Investment Facility for Purchasing of Land
Banks have been advised not to provide any loan/investment facility for purchasing of land.
Cash Reserve Requirement of Scheduled Banks with Bangladesh Bank
In pursuance of the objectives of monetary policy, the amount of Cash Reserve Requirement
(CRR) has been increased to 5 percent from 4.5 percent of the banks' total demand and time
liabilities effective from 1 October 2005 and remained unchanged thereafter. However, the
banks are allowed to maintain CRR at the rate of 5.5 percent bi-weekly average basis subject
to the condition that the amount of CRR maintained should not be less than 5.0 percent in
any day from 15 May 2010.
Statutory Liquidity Requirement of Scheduled Banks
Statutory Liquidity Requirement (SLR) of scheduled banks, excluding those banks and
branches of conventional banks based and operated on Islamic Shariah and also the
18
specialized banks (except Basic Bank Ltd.), has been increased to 18.5 percent (of total
demand and time liabilities excluding inter-bank items) effective from 15 May 2010. The rate
of SLR to be maintained including cash reserve with BB by the banks and branches of
conventional banks based and operated on Islamic Shariah has also been increased to 10.5
percent (of total demand and time liabilities excluding inter-bank items) effective from 15
May 2010. Except for the Basic Bank Ltd. the privilege of exemption from maintenance of SLR
for the specialized banks also remains unchanged.
Progress of Basel- II implementation in Bangladesh
BB has commenced the implementation of Basel-II from January 2010 as regulatory
compliance and has provided banks with a Guideline on ‘Risk Based Capital Adequacy for
Banks (Revised regulatory capital framework in line with Basel-II)’ vide BRPD circular no.
24/2009. The framework is based on three mutually reinforcing pillars: (i) new and
considerably more sophisticated minimum capital requirements, (ii) banks’ own assessments
of their capital adequacy and enhanced supervision of capital management, and (iii)
materially increased disclosure requirements. All scheduled banks submit their reports
according to Basel-II guideline on quarterly basis.
Maintaining Adequate Security of Lockers
BB has issued detailed guidelines on maintaining adequate security of lockers. Accordingly,
banks are now to observe the minimum safety and security measures at branches/places
where safe deposit lockers facilities are offered to general public so that the security
procedures are well documented and the concerned staff/officers are well trained about the
procedures. Banks are also to carry out proper due diligence process on the security
agencies, as well as guards posted at their branches. Besides, corporate group insurance as
per categories and sizes of lockers are to be maintained by the banks so that in case of any
loss arising due to breakage/damage to the lockers could be paid to the locker holders.
Maintaining General Provision against Off-Balance Sheet Item
It is further to mention that banks are advised to maintain general provision against Off-
balance sheet exposures in the following manner 1. 0.5 percent provision effective from 31
December 2007 and 2. 1.0 percent provision effective from 31 December 2008
SME Service Centers
Bangladesh Bank has taken a decision in principle to accord permission for opening SME
Service Centers. These Service Centers will be allowed to perform the following functions: 1.
The SME Service Centers will render banking services only for receiving application,

19
disbursement, monitoring and recovery of loan to SME sector. 2. The SME Service Centers
will be allowed to receive foreign remittances and deliver/hand over the same in domestic
currency to the payees concerned. 3. The SME Service Centers will be allowed to open a
separate desk in order to prioritize the women entrepreneurs involved in the promotion of
Small and Medium Enterprise (SME) sector.
Merger/Amalgamation of Banks/Financial Institutions
A detailed guideline for merger/ amalgamation of banks and financial institutions has been
issued by Bangladesh Bank. Under the policies, a bank may be merged with another bank or
a financial institution with other financial institutions/banks.
20
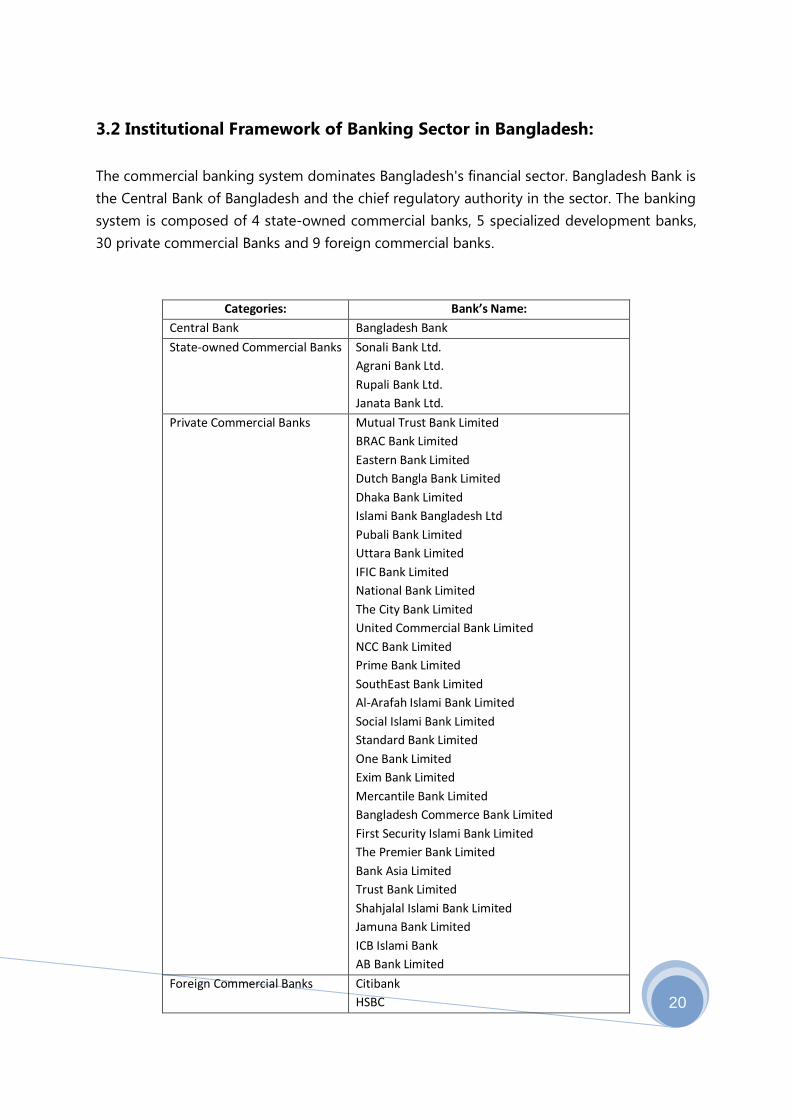
3.2 Institutional Framework of Banking Sector in Bangladesh:
The commercial banking system dominates Bangladesh's financial sector. Bangladesh Bank is
the Central Bank of Bangladesh and the chief regulatory authority in the sector. The banking
system is composed of 4 state-owned commercial banks, 5 specialized development banks,
30 private commercial Banks and 9 foreign commercial banks.
Categories: Bank’s Name:
Central Bank Bangladesh Bank
State-owned Commercial Banks Sonali Bank Ltd.
Agrani Bank Ltd.
Rupali Bank Ltd.
Janata Bank Ltd.
Private Commercial Banks
Mutual Trust Bank Limited
BRAC Bank Limited
Eastern Bank Limited
Dutch Bangla Bank Limited
Dhaka Bank Limited
Islami Bank Bangladesh Ltd
Pubali Bank Limited
Uttara Bank Limited
IFIC Bank Limited
National Bank Limited
The City Bank Limited
United Commercial Bank Limited
NCC Bank Limited
Prime Bank Limited
SouthEast Bank Limited
Al-Arafah Islami Bank Limited
Social Islami Bank Limited
Standard Bank Limited
One Bank Limited
Exim Bank Limited
Mercantile Bank Limited
Bangladesh Commerce Bank Limited
First Security Islami Bank Limited
The Premier Bank Limited
Bank Asia Limited
Trust Bank Limited
Shahjalal Islami Bank Limited
Jamuna Bank Limited
ICB Islami Bank
AB Bank Limited
Foreign Commercial Banks
Citibank
HSBC
21
Standard Chartered Bank
Commercial Bank of Ceylon
State Bank of India
Habib Bank
National Bank of Pakistan
Woori Bank
Bank Alfalah
Specialized Development Banks
Bangladesh Krishi Bank
Rajshahi Krishi Unnayan Bank
Progoti Co-operative Landmortgage Bank Limited
Grameen Bank
The Dhaka Mercantile Co-operative Bank Limited
Bangladesh Development Bank Ltd
Bangladesh Somobay Bank Limited
Ansar VDP Unnyan Bank
BASIC Bank Limited
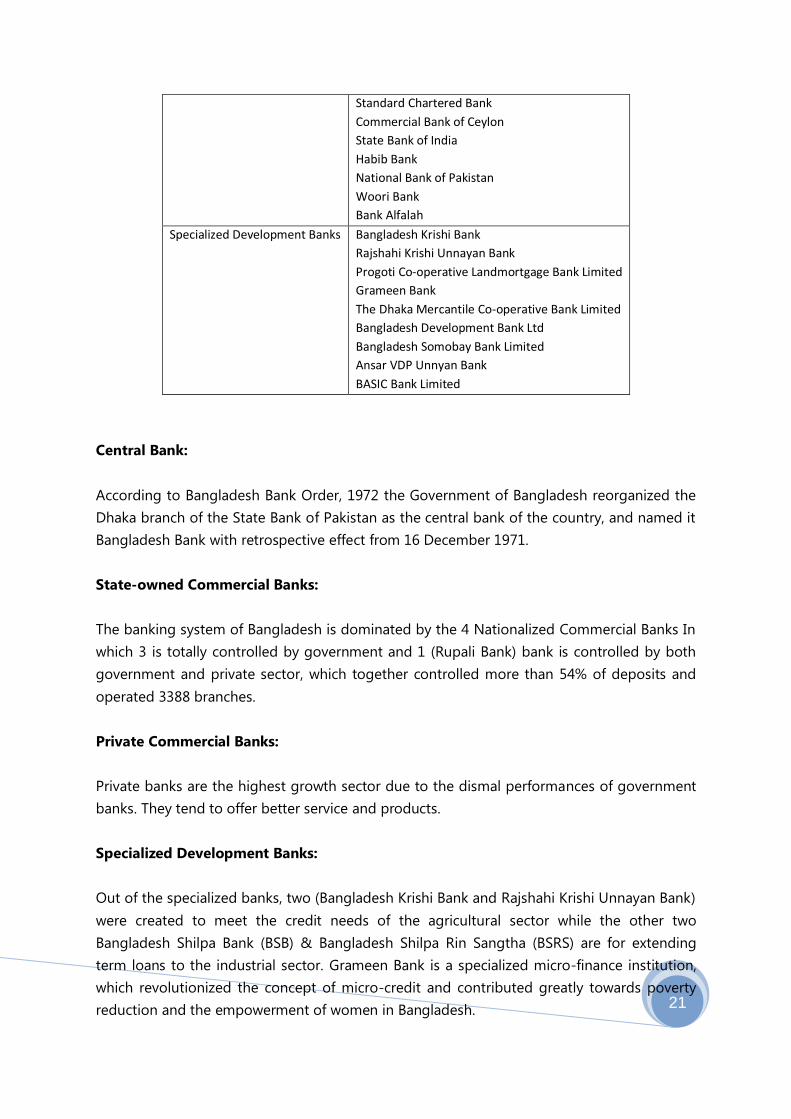
Central Bank:
According to Bangladesh Bank Order, 1972 the Government of Bangladesh reorganized the
Dhaka branch of the State Bank of Pakistan as the central bank of the country, and named it
Bangladesh Bank with retrospective effect from 16 December 1971.
State-owned Commercial Banks:
The banking system of Bangladesh is dominated by the 4 Nationalized Commercial Banks In
which 3 is totally controlled by government and 1 (Rupali Bank) bank is controlled by both
government and private sector, which together controlled more than 54% of deposits and
operated 3388 branches.
Private Commercial Banks:
Private banks are the highest growth sector due to the dismal performances of government
banks. They tend to offer better service and products.
Specialized Development Banks:
Out of the specialized banks, two (Bangladesh Krishi Bank and Rajshahi Krishi Unnayan Bank)
were created to meet the credit needs of the agricultural sector while the other two
Bangladesh Shilpa Bank (BSB) & Bangladesh Shilpa Rin Sangtha (BSRS) are for extending
term loans to the industrial sector. Grameen Bank is a specialized micro-finance institution,
which revolutionized the concept of micro-credit and contributed greatly towards poverty
reduction and the empowerment of women in Bangladesh.

22
3.3 Competition among Banks and Non-banking Financial Institutions:
Financial system is decomposed of into two basic types of institutions. One is the banking
financial institutions (BFIs) and the other is the non-banking financial institutions (NBFIs).
These two financial institutions are different in respect of their activities and treatment of the
assets and liabilities in the financial market. For a well functioning financial market along with
the BFIs, NBFIs have an important role to uplift the economic activity. These two financial
sectors can simultaneously build up and strengthen the financial system of the country.
Non-bank Financial Institutions financial intermediaries that accumulate funds by borrowing
from the general public and lend the same to meet specialized financing needs, but are
prohibited to accept such deposits payable either on demand or by cheque, draft, etc, and
operate checking accounts for which their liabilities are not a part of the money supply.
There are some fundamental differences between the banks and NBFIs. Banks can actually
increase the total volume of spending in the economy by their capacity to add to the stock
of credit in existence. But the non-bank financial institutions do not have that capacity and
they are transmitting funds. NBFIs may grant loans to their members and the general public
up to a certain amount and may also engage in trust functions with prior permission of the
central bank. They are not allowed to engage in foreign exchange transactions.
Non-bank financial institutions represent one of the most important parts of a financial
system. In Bangladesh, NBFIs are new in the financial system as compared to banking
financial institutions. Starting from the IPDC in 1981, a total of 25 NBFIs are now working in
the country. The NBFIs sector in Bangladesh consisting primarily of the development
financial institutions, leasing and investment companies, insurance industries, and the
corporate debt market account for only around 4% of the financial system.
Both bank and non-bank financial institutions for economic development. Banks are the
principal sources of working capital and provide highly liquid investment in which firms’ can
stone receipts. On the other hand, NBF sector is necessary to increase the mobilization of
term savings and enhance availability of equity and term finance for the private sector as well
as support services for the capital market. Bank funds provide liquidity, which ultimately
facilitate trade in commodities and in financial assets. Moreover banks act as the lender of
the first resort of other financial institutions, which ensures its importance in the financial
system.
With the advent of new NBFIs, the market share is being spread over the competing firms
and the demand facing each firm is becoming more elastic. Active participation of
commercial banks in the non-bank financing activities has further increased the level of
23
competition in the industry. Leasing was considered as a non-bank financing activity until
recently. But a large number of banks has also shown their interest in the leasing business
and has already penetrated the market. For banks, public deposit is one major source of
funds which they can collect with relatively lower cost. Thus the business environment for
NBFIs has become more challenging as they have to face uneven competition with banks in
terms of collecting funds.
3.3.1 Recent Development and Activities of NBFIs:
In 2001, the share of NBFIs’ financing to total GDP had been only 0.84%, which was more
than doubled within 5 years and became 1.83% in 2005. The comparative figures for the
banking sector were 34.55% and 41.32% in 2001 and 2005, respectively. The average yearly
growth of NBFIs’ contribution to GDP was about 22% during this period as compared to
4.7% of that by the banking sector.
3.3.2 Competition and Product Diversification:
NBFIs in Bangladesh are operating in a highly competitive environment. The competition for
NBFIs is even more challenging as they have to compete with banks. Given the changes in
the business environment, the need for product diversification is very important.
Non-Bank Financial Institutions play a key role in fulfilling the gap of financial services that
are not generally provided by the banking sector. The competition among NBFIs is
increasing over the years, which is forcing them to diversify to a wider range of products and
services and to provide innovative investment solutions. NBFIs appear to offer flexible
options and highly competitive products to help customers meet their operational and
financial goals.
At present, lease financing constitutes 55% of the total long term assets of NBFIs. The
remaining part concentrates mainly on term financing and housing finance. Some of NBFIs
are primarily engaged in leasing, some are also diversifying into other lines of business like
merchant banking, equity financing etc. Currently, 22 NBFIs (out of 29) specialize in lease
financing. NBFIs are permitted to undertake a wide array of activities and therefore should
not confine themselves to one or two types of product only. Leasing, no doubt, presents a
good alternative form of term financing but NBFIs should also venture into diversified use of
their funds such as merchant banking, venture capital financing, factoring, etc. for a healthy
growth of the capital market.
24
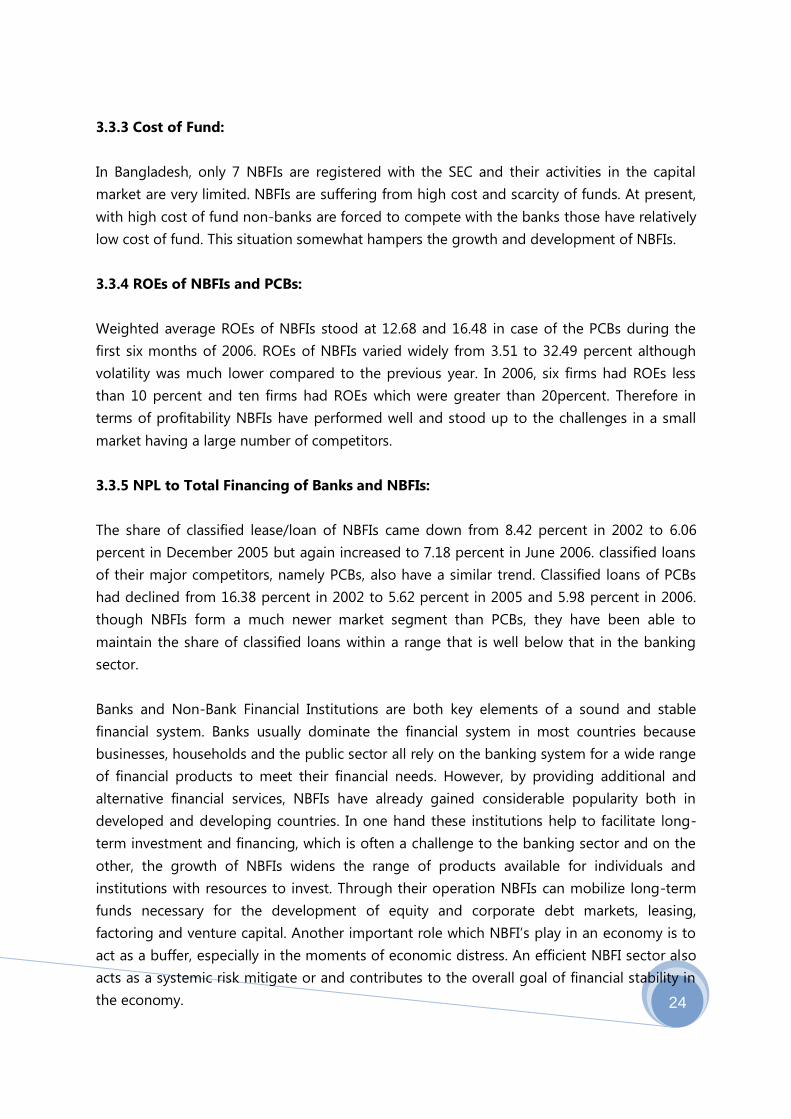
3.3.3 Cost of Fund:
In Bangladesh, only 7 NBFIs are registered with the SEC and their activities in the capital
market are very limited. NBFIs are suffering from high cost and scarcity of funds. At present,
with high cost of fund non-banks are forced to compete with the banks those have relatively
low cost of fund. This situation somewhat hampers the growth and development of NBFIs.
3.3.4 ROEs of NBFIs and PCBs:
Weighted average ROEs of NBFIs stood at 12.68 and 16.48 in case of the PCBs during the
first six months of 2006. ROEs of NBFIs varied widely from 3.51 to 32.49 percent although
volatility was much lower compared to the previous year. In 2006, six firms had ROEs less
than 10 percent and ten firms had ROEs which were greater than 20percent. Therefore in
terms of profitability NBFIs have performed well and stood up to the challenges in a small
market having a large number of competitors.
3.3.5 NPL to Total Financing of Banks and NBFIs:
The share of classified lease/loan of NBFIs came down from 8.42 percent in 2002 to 6.06
percent in December 2005 but again increased to 7.18 percent in June 2006. classified loans
of their major competitors, namely PCBs, also have a similar trend. Classified loans of PCBs
had declined from 16.38 percent in 2002 to 5.62 percent in 2005 and 5.98 percent in 2006.
though NBFIs form a much newer market segment than PCBs, they have been able to
maintain the share of classified loans within a range that is well below that in the banking
sector.
Banks and Non-Bank Financial Institutions are both key elements of a sound and stable
financial system. Banks usually dominate the financial system in most countries because
businesses, households and the public sector all rely on the banking system for a wide range
of financial products to meet their financial needs. However, by providing additional and
alternative financial services, NBFIs have already gained considerable popularity both in
developed and developing countries. In one hand these institutions help to facilitate long-
term investment and financing, which is often a challenge to the banking sector and on the
other, the growth of NBFIs widens the range of products available for individuals and
institutions with resources to invest. Through their operation NBFIs can mobilize long-term
funds necessary for the development of equity and corporate debt markets, leasing,
factoring and venture capital. Another important role which NBFI’s play in an economy is to
act as a buffer, especially in the moments of economic distress. An efficient NBFI sector also
acts as a systemic risk mitigate or and contributes to the overall goal of financial stability in
the economy.

25
The history of the economic development of different countries of the world suggests that
financial development of the country start from banking financial institutions followed by the
non banking financial institutions. But in the later stage, the contribution of non banking
financial institutions becomes more eminent than the BFIs. Actually both types of institutions
are needed and competitions within and between banks and non-banks could enhance
economic development and improve their expertise.

26
CHAPTER FOUR
4. COMPARATIVE ANALYSIS AMONG STATE-OWNED, PRIVATE
COMMERCIAL AND FOREIGN BANKS

27
Performance of the banking sector under CAMEL framework involves analysis, and evaluation
of the five crucial dimensions of banking operations. Among The five indicators used in the
rating system Capital adequacy, Credit quality and Earnings these three are discussed below
with a comparative analysis among state-owned, private commercial and foreign commercial
banks:
4.1 Capital Strength:
Capital adequacy focuses on the total position of bank capital and protects the depositors
from the potential shocks of losses that a bank might incur. It helps absorbing major
financial risks (like credit risk, market risk, foreign exchange risk, interest rate risk and risk
involved in off-balance sheet operations). Banks in Bangladesh were instructed, under Basel -
I, to maintain Capital Adequacy Ratio (CAR) of not less than 10.0 percent with at least 5.0
percent in core capital or Taka 2.0 billion as capital, whichever is higher.
Capital Adequacy Ratios of selected banks and the average ratios of PCBs, SCBs and FCBs
from the FY2006 to FY2010 are given below:
Capital Adequacy Ratio 2006 2007 2008 2009 2010
Bank Asia 21.08% 11.07% 11.25% 12.27% 8.11%
One Bank 10.03% 10.25% 11.02% 10.90% 9.69%
Premier Bank 10.66% 12.66% 12.71% 15.14% 10.01%
Prime Bank 9.95% 11.50% 10.88% 14.71% 11.69%
Pubali Bank 11.75% 12.17% 13.54% 13.63% 13.63%
Rupali Bank 6.49% -29.67% -17.58% -8.68% 9.47%
Trust Bank 9.31% 12.21% 12.81% 12.66% 9.09%
PCBs 9.10% 9.80% 10.60% 11.40% 12.10%
SCBs -0.40% 1.10% 7.90% 6.90% 9%
FCBs 26% 22.70% 22.70% 24% 28.10%
Table shows that in 2006, the PCBs and FCBs maintained CAR of 9.1% and 26% respectively.
The 4 NCBs could not attain the required level due to shortage in owner's equity, provision
shortfall and overburdened expenditure incurred from operation time to time. Bank Asia
maintained CAR of 21.08% which is above the average ratios of other PCBs. There was a
decreasing trend in the CARs where the PCBs had an increasing trend in that ratio over years.
And in 2010 they could not maintain the minimum rate of CAR.
There is a graphical presentation of Capital Adequacy Ratios of selected banks and the
average ratios of PCBs, SCBs and FCBs from the FY2006 to FY2010 which is given below:

28
-40.00%
-30.00%
-20.00%
-10.00%
0.00%
10.00%
20.00%
30.00%
40.00%
2006 2007 2008 2009 2010
Capital Adequacy Ratio
Bank Asia
One Bank
Premier Bank
Prime Bank
Pubali Bank
Rupali Bank
Trust Bank
PCBs
4.2 Credit Quality:
The asset composition of all commercial banks shows the concentration of loans and
advances (61.5 percent). The high concentration of loans and advances indicates vulnerability
of assets to credit risk, especially because of having significant portion of non-performing
assets. A huge non-performing loan portfolio has been the major predicament
of banks particularly of the state-owned commercial banks.
The most important indicator intended to identify problems with asset quality in the loan
portfolio is the ratio of gross non-performing loans (NPLs) to total loans and net NPLs to net
total loans.
% of NPL to Total Loans of selected banks and the average ratios of PCBs, SCBs and FCBs
from the FY2006 to FY2010 are given below:
% of NPL to Total Loans 2006 2007 2008 2009 2010
Bank Asia 2.27% 2.44% 2.68% 1.56% 1.62%
One Bank 1.44% 3.10% 4.23% 5.40% 3.71%
Premier Bank 4.91% 5.96% 4.55% 1.83% 4.66%
Prime Bank 0.82% 1.35% 1.76% 1.29% 1.23%
Pubali Bank 34.44% 28.93% 27.12% 24.60% 21.09%
Rupali Bank 23.53% 25.46% 31.29% 20.91% 11.96%
Trust Bank 1.32% 2.71% 2.52% 2.65% 2.41%
PCBs 1.80% 1.80% 1.40% 0.90% 0.50%
SCBs 13.20% 14.50% 12.90% 5.90% 1.90%
FCBs -2.20% -2.60% -1.90% -2% -2.30%

29
Table shows that the ratio of net NPLs to net total loans stands at 1.9% (SCBs), 0.5% (PCBs)
and 1.7% in 2010.
There is a graphical presentation of % of NPL to Total Loans of selected banks and the
average ratios of PCBs, SCBs and FCBs from the FY2006 to FY2010 which is given below:
-5.00%
0.00%
5.00%
10.00%
15.00%
20.00%
25.00%
30.00%
35.00%
2006 2007 2008 2009 2010
% of NPL to Total Loans
Bank Asia
One Bank
Premier Bank
Prime Bank
Pubali Bank
Rupali Bank
Trust Bank
PCBs
4.3 Operating Performance:
Strong earnings and profitability profile of a bank reflect its ability to support present and
future operations. this determines the capacity to absorb losses by building an adequate
capital base, finance its expansion and pay adequate dividends to its shareholders. Although
there are various measures of earning and profitability, the best and widely used indicator is
return on assets (ROA), which is supplemented by return on equity (ROE).
4.3.1 Return On Equity:
Return on Equity ratios of selected banks and the average ratios of PCBs, SCBs and FCBs
from the FY2006 to FY2010 are given below:
Return On Equity 2006 2007 2008 2009 2010
Bank Asia 27.06% 31.63% 23.00% 32.03% 32.12%
One Bank 22.84% 22.09% 18.23% 23.68% 38.80%
Premier Bank 22.67% 3.19% 20.88% 23.47% 28.23%
Prime Bank 27.25% 26.56% 18.39% 23.71% 17.91%
Pubali Bank 18.67% 22.82% 20.08% 22.00% 15.49%

30
Rupali Bank 44.02% 104.44% -10.70% -29.89% 4.24%
Trust Bank 22.80% 11.10% 14.84% 16.27% 25.37%
PCBs 18.10% 15.20% 16.70% 16.40% 21%
SCBs -6.90% 0% 0% 22.50% 26.40%
FCBs 18.40% 21.50% 20.40% 17.80% 22.40%
SCBs return on equity ratio was 2.4 percent in 2001, but it rose to 26.4% in 2010. The ROE of
PCBs and FCBs were strong in 2010. The ROE of PCBs and FCBs were satisfactory in 2009.
SCBs return on equity ratio was 3.0% in 2003 but have been shown almost zero percent in
2008 considering provision shortfall.
There is a graphical presentation of Return on Equity ratios of selected banks and the
average ratios of PCBs, SCBs and FCBs from the FY2006 to FY2010 which is given below:
-40.00%
-20.00%
0.00%
20.00%
40.00%
60.00%
80.00%
100.00%
120.00%
2006 2007 2008 2009 2010
Return on Equity
Bank Asia
One Bank
Premier Bank
Prime Bank
Pubali Bank
Rupali Bank
Trust Bank
PCBs
4.3.2 Return On Assets:
Return on Assets ratios of selected banks and the average ratios of PCBs, SCBs and FCBs
from the FY2006 to FY2010 are given below:
Return On Assets 2006 2007 2008 2009 2010
Bank Asia 1.77% 2.11% 1.87% 2.18% 2.22%
One Bank 1.50% 1.47% 1.33% 1.61% 3.22%
Premier Bank 1.36% 0.24% 1.68% 2.30% 2.60%
Prime Bank 1.73% 1.76% 1.12% 2.23% 1.97%
Pubali Bank 1.45% 1.89% 1.69% 1.94% 1.53%
Rupali Bank 0.19% -13.52% 1.06% 1.90% 0.48%
Trust Bank 1.24% 0.79% 1.20% 1.13% 2.19%

31
PCBs 1.10% 0.10% 1.10% 1.40% 1.60%
SCBs -0.10% 0% 0% 0.70% 1%
FCBs 3.10% 2.20% 2.20% 2.90% 3.20%
Table Shows that considering huge provision shortfall, the ROA of the SCBs have been less
than one percent. PCBs had an inconsistent trend but satisfactory and FCBs' return on assets
ratio has been consistently strong during last 5 years.
There is a graphical presentation of Return on Assets ratios of selected banks and the
average ratios of PCBs, SCBs and FCBs from the FY2006 to FY2010 which is given below:
-15.00%
-10.00%
-5.00%
0.00%
5.00%
2006 2007 2008 2009 2010
Return on Assets
Bank Asia
One Bank
Premier Bank
Prime Bank
Pubali Bank
Rupali Bank
Trust Bank
PCBs

32
CHAPTER FIVE
5. FINANCIAL PERFORMANCE ANALYISIS
33
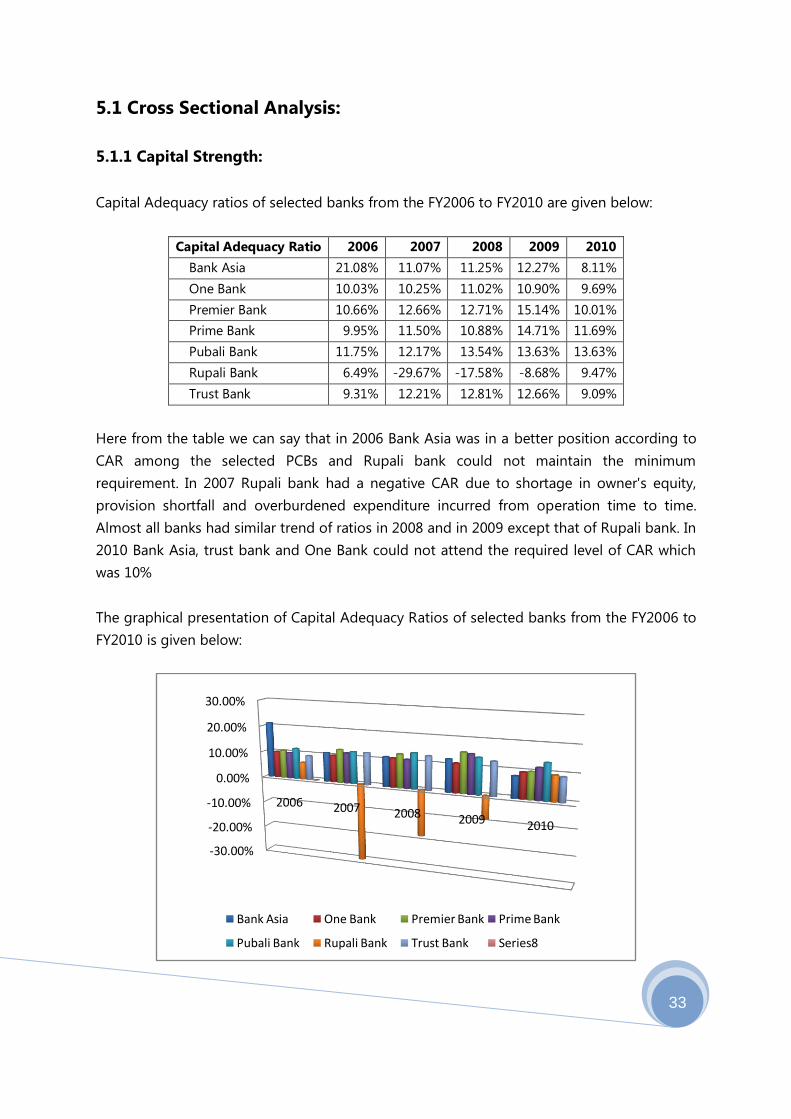
5.1 Cross Sectional Analysis:
5.1.1 Capital Strength:
Capital Adequacy ratios of selected banks from the FY2006 to FY2010 are given below:
Capital Adequacy Ratio 2006 2007 2008 2009 2010
Bank Asia 21.08% 11.07% 11.25% 12.27% 8.11%
One Bank 10.03% 10.25% 11.02% 10.90% 9.69%
Premier Bank 10.66% 12.66% 12.71% 15.14% 10.01%
Prime Bank 9.95% 11.50% 10.88% 14.71% 11.69%
Pubali Bank 11.75% 12.17% 13.54% 13.63% 13.63%
Rupali Bank 6.49% -29.67% -17.58% -8.68% 9.47%
Trust Bank 9.31% 12.21% 12.81% 12.66% 9.09%
Here from the table we can say that in 2006 Bank Asia was in a better position according to
CAR among the selected PCBs and Rupali bank could not maintain the minimum
requirement. In 2007 Rupali bank had a negative CAR due to shortage in owner's equity,
provision shortfall and overburdened expenditure incurred from operation time to time.
Almost all banks had similar trend of ratios in 2008 and in 2009 except that of Rupali bank. In
2010 Bank Asia, trust bank and One Bank could not attend the required level of CAR which
was 10%
The graphical presentation of Capital Adequacy Ratios of selected banks from the FY2006 to
FY2010 is given below:
-30.00%
-20.00%
-10.00%
0.00%
10.00%
20.00%
30.00%
2006 2007 2008 2009 2010
Bank Asia One Bank Premier Bank Prime Bank
Pubali Bank Rupali Bank Trust Bank Series8
34
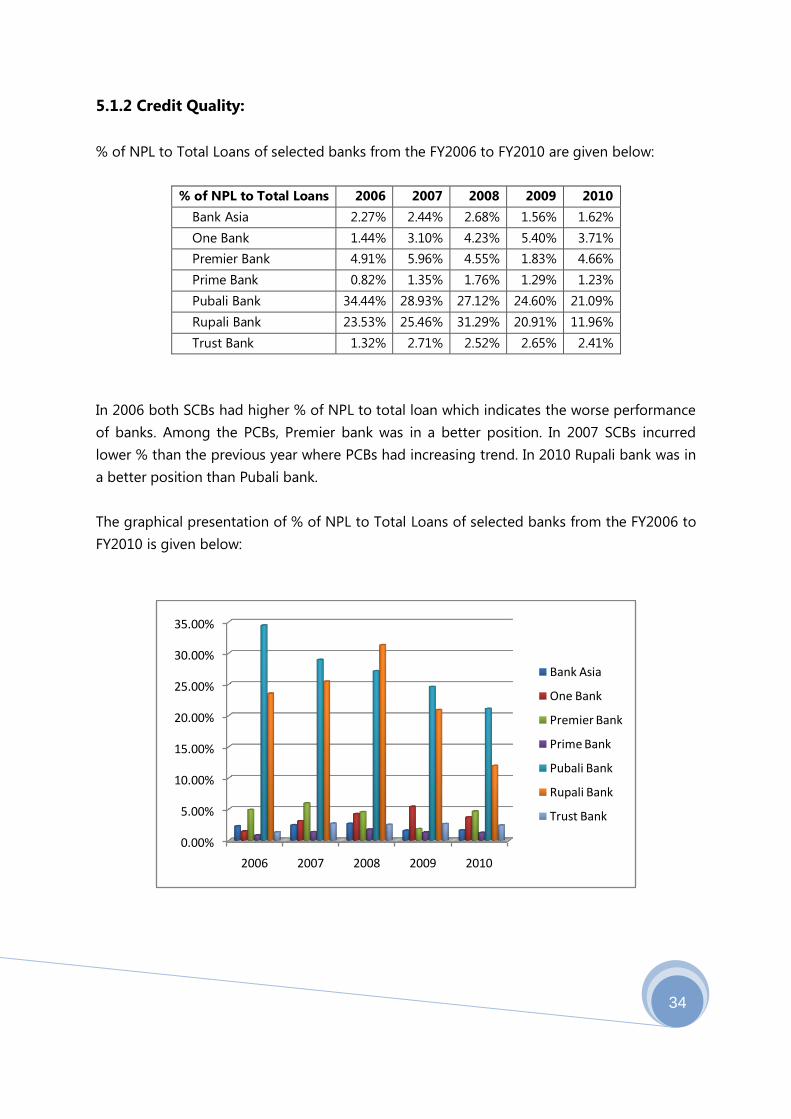
5.1.2 Credit Quality:
% of NPL to Total Loans of selected banks from the FY2006 to FY2010 are given below:
% of NPL to Total Loans 2006 2007 2008 2009 2010
Bank Asia 2.27% 2.44% 2.68% 1.56% 1.62%
One Bank 1.44% 3.10% 4.23% 5.40% 3.71%
Premier Bank 4.91% 5.96% 4.55% 1.83% 4.66%
Prime Bank 0.82% 1.35% 1.76% 1.29% 1.23%
Pubali Bank 34.44% 28.93% 27.12% 24.60% 21.09%
Rupali Bank 23.53% 25.46% 31.29% 20.91% 11.96%
Trust Bank 1.32% 2.71% 2.52% 2.65% 2.41%
In 2006 both SCBs had higher % of NPL to total loan which indicates the worse performance
of banks. Among the PCBs, Premier bank was in a better position. In 2007 SCBs incurred
lower % than the previous year where PCBs had increasing trend. In 2010 Rupali bank was in
a better position than Pubali bank.
The graphical presentation of % of NPL to Total Loans of selected banks from the FY2006 to
FY2010 is given below:
0.00%
5.00%
10.00%
15.00%
20.00%
25.00%
30.00%
35.00%
2006 2007 2008 2009 2010
Bank Asia
One Bank
Premier Bank
Prime Bank
Pubali Bank
Rupali Bank
Trust Bank

35
5.1.3 Operating Performance:
(a) Credit to Deposit Ratio:
A commonly used statistic for assessing a bank's liquidity by dividing the banks total loans
by its total deposits. This number, also known as the LTD ratio, is expressed as a percentage.
If the ratio is too high, it means that banks might not have enough liquidity to cover any
unforeseen fund requirements; if the ratio is too low, banks may not be earning as much as
they could be.
Credit to Deposit Ratios of selected banks from the FY2006 to FY2010 are given below:
Credit to Deposit Ratio 2006 2007 2008 2009 2010
Bank Asia 88.00% 94.84% 94.20% 91.67% 95.10%
One Bank 77.43% 80.50% 83.58% 82.64% 82.93%
Premier Bank 85.45% 87.18% 94.57% 90.06% 84.84%
Prime Bank 82.25% 81.81% 85.38% 83.45% 89.28%
Pubali Bank 82.97% 87.16% 84.62% 83.88% 83.89%
Rupali Bank 67.39% 64.99% 69.76% 70.92% 72.48%
Trust Bank 69.46% 68.93% 83.62% 67.40% 78.95%
Here in 2007 almost all banks had higher ratios which indicates that they were not able to
cover the required fund if necessary. Rupali bank had a better position with 67.39%.
The graphical presentation of Credit to Deposit ratios of selected banks from the FY2006 to
FY2010 is given below:
0.00%
20.00%
40.00%
60.00%
80.00%
100.00%
2006 2007 2008 2009 2010
Credit to Deposit
Bank Asia One Bank Premier Bank Prime Bank
Pubali Bank Rupali Bank Trust Bank Series8

36
(b) Return On Equity:
Numerous researchers have used Return on Equity (ROE) ratio for measuring the profitability
of a bank. The greater the ROE ratio, the better for the bank.
Return On Equity Ratios of selected banks from the FY2006 to FY2010 are given below:
Return On Equity 2006 2007 2008 2009 2010
Bank Asia 27.06% 31.63% 23.00% 32.03% 32.12%
One Bank 22.84% 22.09% 18.23% 23.68% 38.80%
Premier Bank 22.67% 3.19% 20.88% 23.47% 28.23%
Prime Bank 27.25% 26.56% 18.39% 23.71% 17.91%
Pubali Bank 18.67% 22.82% 20.08% 22.00% 15.49%
Rupali Bank 44.02% 104.44% -10.70% -29.89% 4.24%
Trust Bank 22.80% 11.10% 14.84% 16.27% 25.37%
Here we can say Rupali bank’s ROE ratio is higher than that of other banks in 2007. In 2010
they had a lower ROE which indicates a bad performance.
The graphical presentation of Return on Equity Ratios of selected banks from the FY2006 to
FY2010 is given below:
-40.00%
-20.00%
0.00%
20.00%
40.00%
60.00%
80.00%
100.00%
120.00%
2006 2007 2008 2009 2010
Return on Equity
Bank Asia One Bank Premier Bank Prime Bank
Pubali Bank Rupali Bank Trust Bank

37
( c) Return On Assets:
An indicator of how profitable a company is relative to its total assets. ROA gives an idea as
to how efficient management is at using its assets to generate earnings. Calculated by
dividing a company's annual earnings by its total assets, ROA is displayed as a percentage.
Sometimes this is referred to as "return on investment".
Return On Assets Ratios of selected banks from the FY2006 to FY2010 are given below:
Return On Assets 2006 2007 2008 2009 2010
Bank Asia 1.77% 2.11% 1.87% 2.18% 2.22%
One Bank 1.50% 1.47% 1.33% 1.61% 3.22%
Premier Bank 1.36% 0.24% 1.68% 2.30% 2.60%
Prime Bank 1.73% 1.76% 1.12% 2.23% 1.97%
Pubali Bank 1.45% 1.89% 1.69% 1.94% 1.53%
Rupali Bank 0.19% -13.52% 1.06% 1.90% 0.48%
Trust Bank 1.24% 0.79% 1.20% 1.13% 2.19%
Here in 2007 almost all PCBs had similar ROA. In 2008 Rupali bank had a negative ROA which
indicates loss incurred from operations. Premier bank and Trust bank had lower ROA.
The graphical presentation of Return on Assets Ratios of selected banks from the FY2006 to
FY2010 is given below:
-15.00%
-10.00%
-5.00%
0.00%
5.00%
2006 2007 2008 2009 2010
Return on Assets
Bank Asia One Bank Premier Bank Prime Bank
Pubali Bank Rupali Bank Trust Bank

38
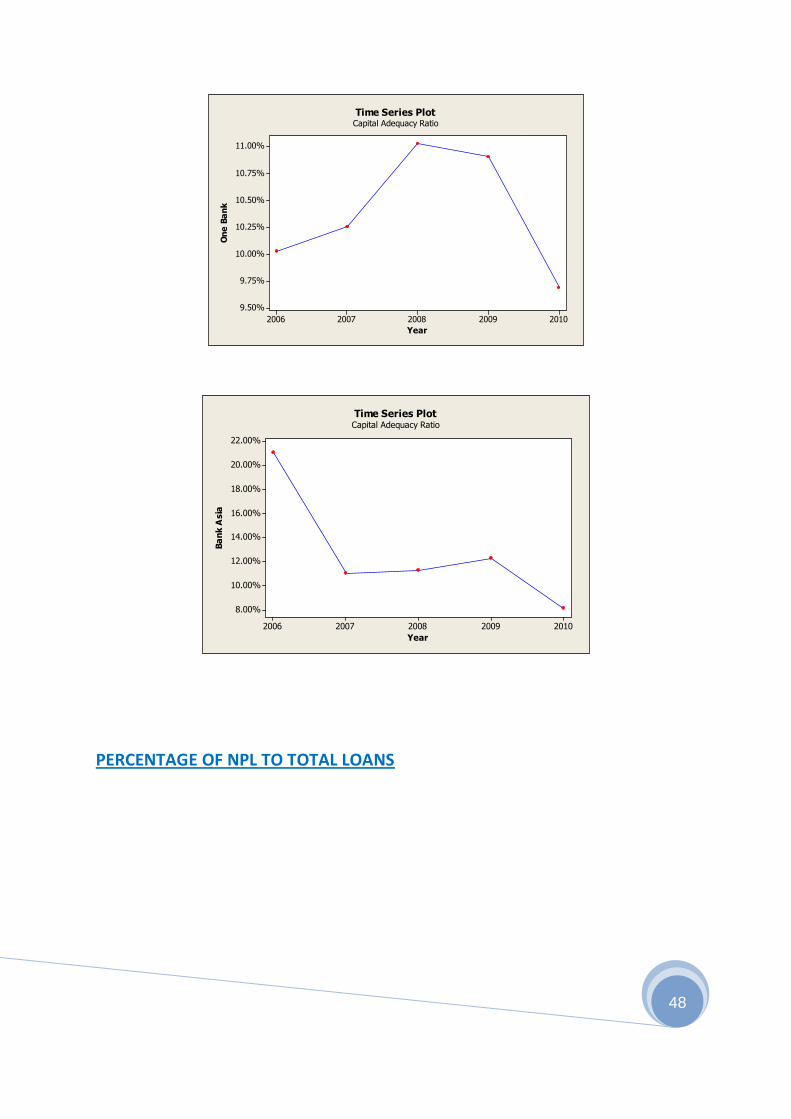
5.2 Time Series Analysis:
5.2.1 Capital Strength:
Capital Adequacy Ratios of selected banks from the FY2006 to FY2010 are given below:
Capital Adequacy Ratio 2006 2007 2008 2009 2010
Bank Asia 21.08% 11.07% 11.25% 12.27% 8.11%
One Bank 10.03% 10.25% 11.02% 10.90% 9.69%
Premier Bank 10.66% 12.66% 12.71% 15.14% 10.01%
Prime Bank 9.95% 11.50% 10.88% 14.71% 11.69%
Pubali Bank 11.75% 12.17% 13.54% 13.63% 13.63%
Rupali Bank 6.49% -29.67% -17.58% -8.68% 9.47%
Trust Bank 9.31% 12.21% 12.81% 12.66% 9.09%
From the table we can see that Bank asia had a higher CAR in 2006 and that had a
decreasing trend and in 2010 they had the lower CAR. Pubali bank had a increasing trend
over years. Till the year 2009 Rupali bank had negative CAR which rose to 9.47% in 2010.
The graphical presentation of Capital Adequacy Ratios of selected banks from the FY2006 to
FY2010 is given below:
-40.00%
-30.00%
-20.00%
-10.00%
0.00%
10.00%
20.00%
30.00%
2006 2007 2008 2009 2010
Bank Asia One Bank Premier Bank Prime Bank
Pubali Bank Rupali Bank Trust Bank

39
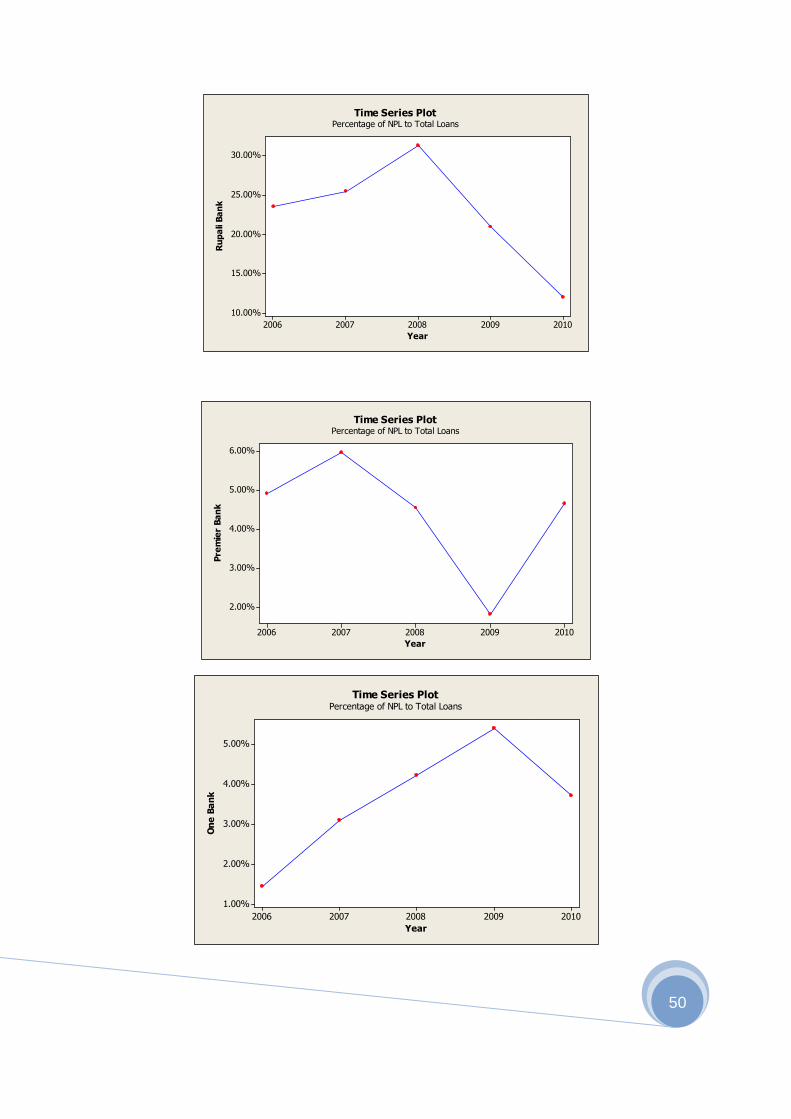
5.2.2 Credit Quality:
% of NPL to Total Loans of selected banks from the FY2006 to FY2010 are given below:
% of NPL to Total Loans 2006 2007 2008 2009 2010
Bank Asia 2.27% 2.44% 2.68% 1.56% 1.62%
One Bank 1.44% 3.10% 4.23% 5.40% 3.71%
Premier Bank 4.91% 5.96% 4.55% 1.83% 4.66%
Prime Bank 0.82% 1.35% 1.76% 1.29% 1.23%
Pubali Bank 34.44% 28.93% 27.12% 24.60% 21.09%
Rupali Bank 23.53% 25.46% 31.29% 20.91% 11.96%
Trust Bank 1.32% 2.71% 2.52% 2.65% 2.41%
In 2006, Prime bank had a better position with 0.82% NPL to total loans. other bank’s % NPL
were varied over years. In 2006 Pubali bank had the higher % NPL which fallen down to
21.09% in 2010.
The graphical presentation of % of NPL to Total Loans of selected banks from the FY2006 to
FY2010 is given below:
0.00%
5.00%
10.00%
15.00%
20.00%
25.00%
30.00%
35.00%
40.00%
2006 2007 2008 2009 2010
Bank Asia One Bank Premier Bank Prime Bank
Pubali Bank Rupali Bank Trust Bank
40
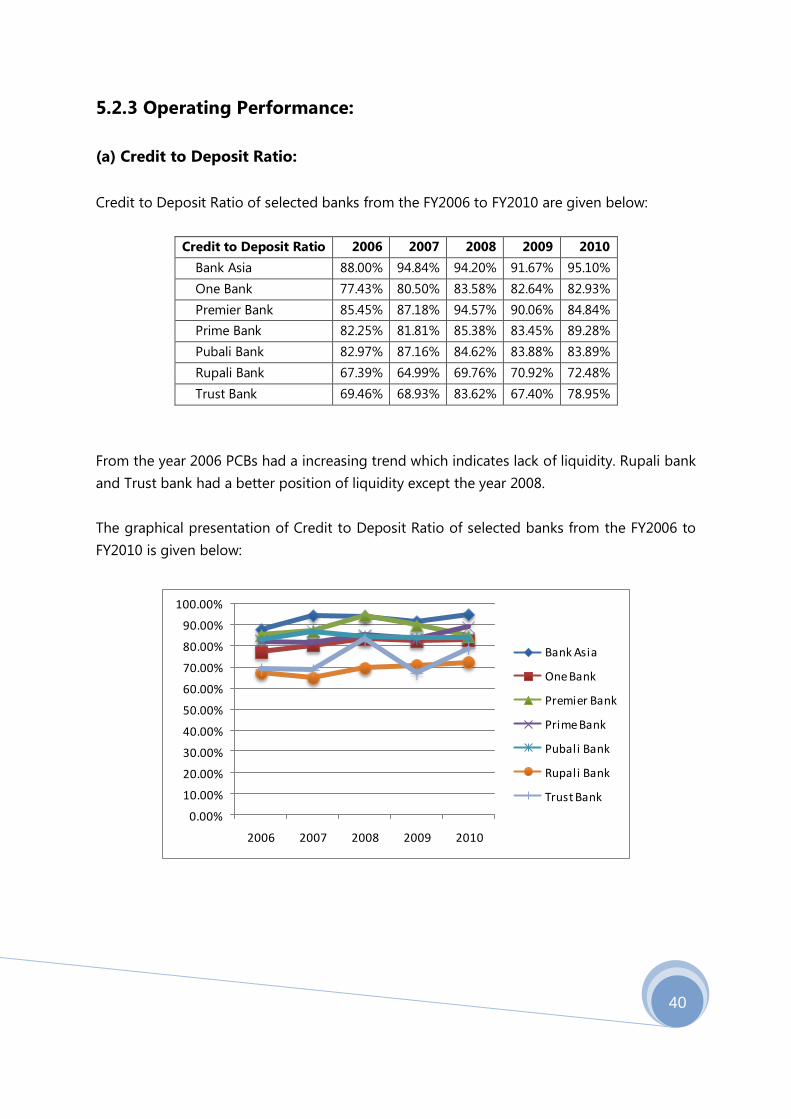
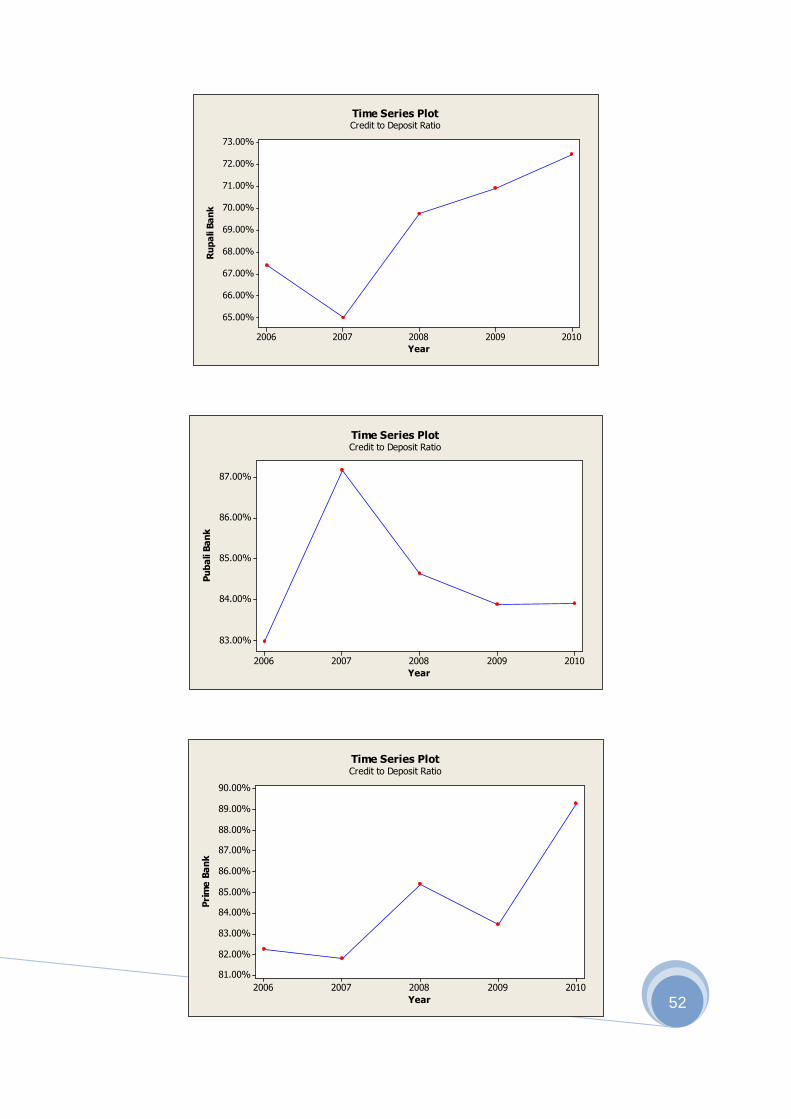
5.2.3 Operating Performance:
(a) Credit to Deposit Ratio:
Credit to Deposit Ratio of selected banks from the FY2006 to FY2010 are given below:
Credit to Deposit Ratio 2006 2007 2008 2009 2010
Bank Asia 88.00% 94.84% 94.20% 91.67% 95.10%
One Bank 77.43% 80.50% 83.58% 82.64% 82.93%
Premier Bank 85.45% 87.18% 94.57% 90.06% 84.84%
Prime Bank 82.25% 81.81% 85.38% 83.45% 89.28%
Pubali Bank 82.97% 87.16% 84.62% 83.88% 83.89%
Rupali Bank 67.39% 64.99% 69.76% 70.92% 72.48%
Trust Bank 69.46% 68.93% 83.62% 67.40% 78.95%
From the year 2006 PCBs had a increasing trend which indicates lack of liquidity. Rupali bank
and Trust bank had a better position of liquidity except the year 2008.
The graphical presentation of Credit to Deposit Ratio of selected banks from the FY2006 to
FY2010 is given below:
0.00%
10.00%
20.00%
30.00%
40.00%
50.00%
60.00%
70.00%
80.00%
90.00%
100.00%
2006 2007 2008 2009 2010
Bank Asia
One Bank
Premier Bank
Prime Bank
Pubali Bank
Rupali Bank
Trust Bank

41
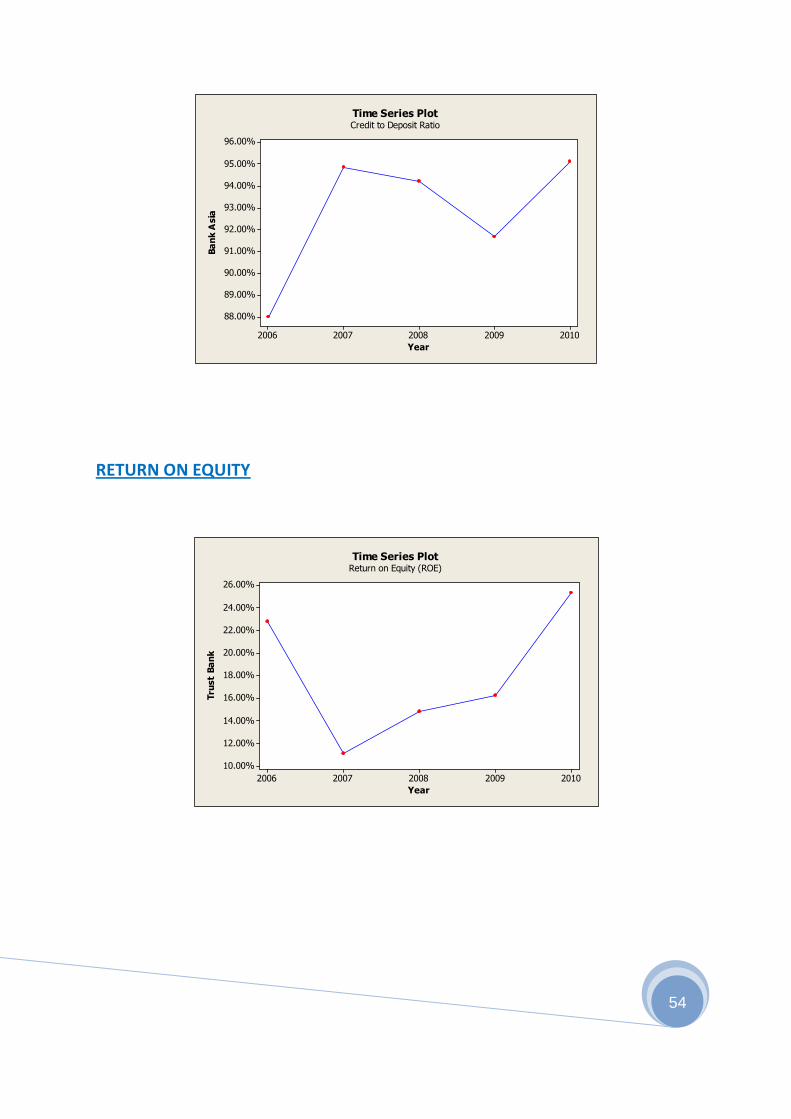
(b) Return On Equity:
Return On Equity Ratios of selected banks from the FY2006 to FY2010 are given below:
Return On Equity 2006 2007 2008 2009 2010
Bank Asia 27.06% 31.63% 23.00% 32.03% 32.12%
One Bank 22.84% 22.09% 18.23% 23.68% 38.80%
Premier Bank 22.67% 3.19% 20.88% 23.47% 28.23%
Prime Bank 27.25% 26.56% 18.39% 23.71% 17.91%
Pubali Bank 18.67% 22.82% 20.08% 22.00% 15.49%
Rupali Bank 44.02% 104.44% -10.70% -29.89% 4.24%
Trust Bank 22.80% 11.10% 14.84% 16.27% 25.37%
Bank Asia, one bank and premier bank had increasing trend while the ROE of Trust bank and
prime bank varied over years . in 2006 and 2007 Rupali bank had higher ROE which fallen
down in the year 2008 and 2009. In 2010 they had a lower ROE.
The graphical presentation of Return On Equity Ratio of selected banks from the FY2006 to
FY2010 is given below:
-40.00%
-20.00%
0.00%
20.00%
40.00%
60.00%
80.00%
100.00%
120.00%
2006 2007 2008 2009 2010
Bank Asia
One Bank
Premier Bank
Prime Bank
Pubali Bank
Rupali Bank
Trust Bank

42
( c) Return On Assets:
Return On Assets Ratios of selected banks from the FY2006 to FY2010 are given below:
Return On Assets 2006 2007 2008 2009 2010
Bank Asia 1.77% 2.11% 1.87% 2.18% 2.22%
One Bank 1.50% 1.47% 1.33% 1.61% 3.22%
Premier Bank 1.36% 0.24% 1.68% 2.30% 2.60%
Prime Bank 1.73% 1.76% 1.12% 2.23% 1.97%
Pubali Bank 1.45% 1.89% 1.69% 1.94% 1.53%
Rupali Bank 0.19% -13.52% 1.06% 1.90% 0.48%
Trust Bank 1.24% 0.79% 1.20% 1.13% 2.19%
in 2006 Rupali bank had ROA below 1% which became more worse in 2007 and then in 2007
ROA rose to 1.06% with an increasing trend.almost all other PCBs had an increasing tren in
ROA over years.
The graphical presentation of Return On Assets Ratio of selected banks from the FY2006 to
FY2010 is given below:
-16.00%
-14.00%
-12.00%
-10.00%
-8.00%
-6.00%
-4.00%
-2.00%
0.00%
2.00%
4.00%
6.00%
2006 2007 2008 2009 2010
Bank Asia
One Bank
Premier Bank
Prime Bank
Pubali Bank
Rupali Bank
Trust Bank

43
CHAPTER SIX
6. CONCLUSION

44
Findings From The Study:
The findings in this paper cannot be taken as a conclusion and it will be wrong to end here
with such result. Because this study actually gives a simple picture and leaves room for
further study in different areas of banking functions such as product of banks, productivity
analysis, Data Envelopment Analysis (DEA), CAMELS rating, robust estimation approach
based on the competing efficient structure (ES) hypothesis, use of statistical tools and more.
Further study also can be conducted on post and pre reforms of banking sector.
The purpose of this study is to classify the Private Commercial Banks and State owned
commercial Banks in Bangladesh on the basis of their financial characteristics revealed by the
financial ratios. A total of five commercial banks and two national banks were financially
analyzed, and simple trend analysis was used to estimate the impact of credit quality,
operating efficiency, and capital strength on the financial performance of these banks. The
study found that the bank with higher total capital, deposits, credits, or total assets does not
always mean that has better profitability performance. Private Commercial Banks have a
better position according to the operational efficiency and credit quality than the State
owned commercial banks. They were able to generate earnings efficiently by using their
assets and maintained an increasing trend on ROA. ROE of these banks were fluctuating due
to the capital restructuring over years.
As the SCBs have lower ROE, ROA, CAR and higher % of NPL to tatal loan, they have to utilize
the resources and perform efficiently to compete with the PCBs. Among the PCBs Bank Asia
Limited is efficient most according to the revealed financial ratio analysis.

45
BIBLIOGRAPHY
Annual Report of Bank Asia Limited, 2006-2010
Annual Report of Trust Bank Limited, 2006-2010
Annual Report of One Bank Limited, 2006-2010
Annual Report of Prime Bank Limited, 2006-2010
Annual Report of Premier Bank Limited, 2006-2010
Annual Report of Pubali Bank Limited, 2006-2010
Annual Report of Sonali Bank Limited, 2006-2010
Annual Report of Bangladesh Bank, 2006-2010
Economic Trends, Bangladesh Bank
Website: URL - http://mpra.ub.uni-muenchen.de
Annual Reports(ARs), Financial Reports (FRs), Non Bank Financial Institutions(NBFIs)
Website: URL - http://www.cgap.org

46
Appendix 1
CAPITAL ADEQUACY RATIO
20102009200820072006
13.00%
12.00%
11.00%
10.00%
9.00%
Year
Tru
st
Ba
nk
Time Series PlotCapital Adequacy Ratio
20102009200820072006
10.00%
0.00%
-10.00%
-20.00%
-30.00%
Year
Ru
pa
li B
an
k
Time Series PlotCapital Adequacy Ratio

47
20102009200820072006
13.50%
13.00%
12.50%
12.00%
11.50%
Year
Pu
ba
li B
an
k
Time Series PlotCapital Adequacy Ratio
20102009200820072006
15.00%
14.00%
13.00%
12.00%
11.00%
10.00%
Year
Pri
me
Ba
nk
Time Series PlotCapital Adequacy Ratio
20102009200820072006
15.00%
14.00%
13.00%
12.00%
11.00%
10.00%
Year
Pre
mie
r B
an
k
Time Series PlotCapital Adequacy Ratio
48
20102009200820072006
11.00%
10.75%
10.50%
10.25%
10.00%
9.75%
9.50%
Year
On
e B
an
k
Time Series PlotCapital Adequacy Ratio
20102009200820072006
22.00%
20.00%
18.00%
16.00%
14.00%
12.00%
10.00%
8.00%
Year
Ba
nk A
sia
Time Series PlotCapital Adequacy Ratio
PERCENTAGE OF NPL TO TOTAL LOANS

49
20102009200820072006
2.80%
2.60%
2.40%
2.20%
2.00%
1.80%
1.60%
1.40%
1.20%
Year
Tru
st
Ba
nk
Time Series PlotPercentage of NPL to Total Loans
20102009200820072006
36.00%
34.00%
32.00%
30.00%
28.00%
26.00%
24.00%
22.00%
20.00%
Year
Pu
ba
li B
an
k
Time Series PlotPercentage of NPL to Total Loans
20102009200820072006
1.80%
1.60%
1.40%
1.20%
1.00%
0.80%
Year
Pri
me
Ba
nk
Time Series PlotPercentage of NPL to Total Loans
50
20102009200820072006
30.00%
25.00%
20.00%
15.00%
10.00%
Year
Ru
pa
li B
an
k
Time Series PlotPercentage of NPL to Total Loans
20102009200820072006
6.00%
5.00%
4.00%
3.00%
2.00%
Year
Pre
mie
r B
an
k
Time Series PlotPercentage of NPL to Total Loans
20102009200820072006
5.00%
4.00%
3.00%
2.00%
1.00%
Year
On
e B
an
k
Time Series PlotPercentage of NPL to Total Loans

51
20102009200820072006
2.75%
2.50%
2.25%
2.00%
1.75%
1.50%
Year
Ba
nk A
sia
Time Series PlotPercentage of NPL to Total Loans
CAPITAL TO DEPOSIT RATIO
20102009200820072006
85.00%
80.00%
75.00%
70.00%
65.00%
Year
Tru
st
Ba
nk
Time Series PlotCredit to Deposit Ratio
52
20102009200820072006
73.00%
72.00%
71.00%
70.00%
69.00%
68.00%
67.00%
66.00%
65.00%
Year
Ru
pa
li B
an
k
Time Series PlotCredit to Deposit Ratio
20102009200820072006
87.00%
86.00%
85.00%
84.00%
83.00%
Year
Pu
ba
li B
an
k
Time Series PlotCredit to Deposit Ratio
20102009200820072006
90.00%
89.00%
88.00%
87.00%
86.00%
85.00%
84.00%
83.00%
82.00%
81.00%
Year
Pri
me
Ba
nk
Time Series PlotCredit to Deposit Ratio

53
20102009200820072006
95.00%
92.50%
90.00%
87.50%
85.00%
Year
Pre
mie
r B
an
k
Time Series PlotCredit to Deposit Ratio
20102009200820072006
84.00%
83.00%
82.00%
81.00%
80.00%
79.00%
78.00%
77.00%
Year
On
e B
an
k
Time Series PlotCredit to Deposit Ratio
54
20102009200820072006
96.00%
95.00%
94.00%
93.00%
92.00%
91.00%
90.00%
89.00%
88.00%
Year
Ba
nk A
sia
Time Series PlotCredit to Deposit Ratio
RETURN ON EQUITY
20102009200820072006
26.00%
24.00%
22.00%
20.00%
18.00%
16.00%
14.00%
12.00%
10.00%
Year
Tru
st
Ba
nk
Time Series PlotReturn on Equity (ROE)
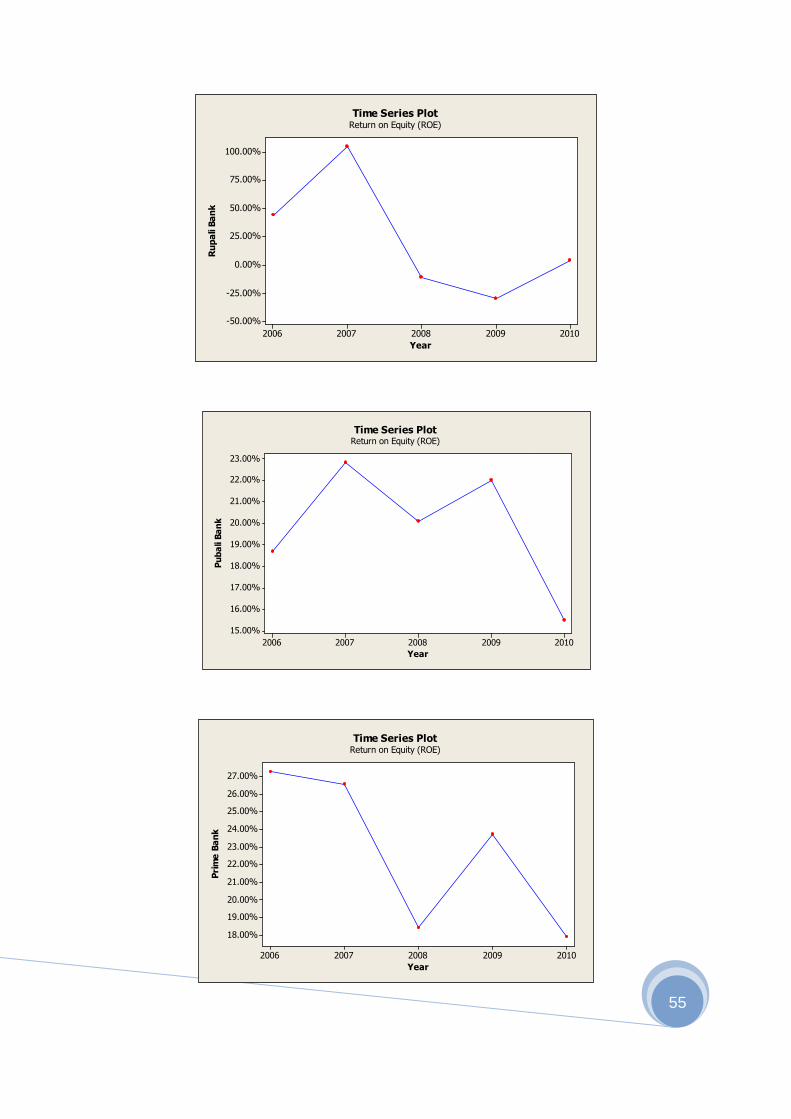
55
20102009200820072006
100.00%
75.00%
50.00%
25.00%
0.00%
-25.00%
-50.00%
Year
Ru
pa
li B
an
k
Time Series PlotReturn on Equity (ROE)
20102009200820072006
23.00%
22.00%
21.00%
20.00%
19.00%
18.00%
17.00%
16.00%
15.00%
Year
Pu
ba
li B
an
k
Time Series PlotReturn on Equity (ROE)
20102009200820072006
27.00%
26.00%
25.00%
24.00%
23.00%
22.00%
21.00%
20.00%
19.00%
18.00%
Year
Pri
me
Ba
nk
Time Series PlotReturn on Equity (ROE)

56
20102009200820072006
30.00%
25.00%
20.00%
15.00%
10.00%
5.00%
0.00%
Year
Pre
mie
r B
an
k
Time Series PlotReturn on Equity (ROE)
20102009200820072006
40.00%
35.00%
30.00%
25.00%
20.00%
Year
On
e B
an
k
Time Series PlotReturn on Equity (ROE)
20102009200820072006
32.00%
30.00%
28.00%
26.00%
24.00%
22.00%
Year
Ba
nk A
sia
Time Series PlotReturn on Equity (ROE)

57
RETURN ON ASSETS
20102009200820072006
2.20%
2.00%
1.80%
1.60%
1.40%
1.20%
1.00%
0.80%
0.60%
Year
Tru
st
Ba
nk
Time Series PlotReturn on Assets
20102009200820072006
0.00%
-5.00%
-10.00%
-15.00%
Year
Ru
pa
li B
an
k
Time Series PlotReturn on Assets

58
20102009200820072006
2.00%
1.90%
1.80%
1.70%
1.60%
1.50%
1.40%
Year
Pu
ba
li B
an
k
Time Series PlotReturn on Assets
20102009200820072006
2.20%
2.00%
1.80%
1.60%
1.40%
1.20%
1.00%
Year
Pri
me
Ba
nk
Time Series PlotReturn on Assets
20102009200820072006
2.50%
2.00%
1.50%
1.00%
0.50%
0.00%
Year
Pre
mie
r B
an
k
Time Series PlotReturn on Assets

59
20102009200820072006
3.00%
2.50%
2.00%
1.50%
Year
On
e B
an
k
Time Series PlotReturn on Assets
20102009200820072006
2.20%
2.10%
2.00%
1.90%
1.80%
Year
Ba
nk A
sia
Time Series PlotReturn on Assets

60
Appendix 2
Symbol Ratio Numerator Denominator Indicator
ATD Advances to
Deposit
Total Advances Total Deposits Liquidity
LATL Liquid Asset
to Liability
Liquid Assets Total Liabilities Liquidity
ATL Advances to
Liability
Ratio
Total Advances Total Liabilities Liquidity
DTA Debt to
Assets
Total Liabilities Total Assets Leverage
DTE Debt to
Equity
Total Liabilities Shareholders’ Equity Leverage
EM Equity
Multiplier
Total Assets Shareholders’ Equity Leverage
ROA Return On
Assets
Net Profit Total Assets Profitabili
ty
ROD Return On
Deposit
Net Profit Total Deposits Profitabili
ty
ROE Return On
Equity
Net Profit Shareholders’ Equity Profitabili
ty
IDR Implicit
Deposit Rate
Interest Expense Total Deposits Profitabili
ty
IIRS Implicit
Interest Rate
Spread
ILR-IDR Profitabili
ty
ILR Implicit
Lending Rate
Interest Income Total Advances Profitabili
ty
AUR Assets
Utilization
Ratio
Total Operating Income Total Assets Profitabili
ty
NIM Net Interest
Margin
Net Interest Income Total Assets Profitabili
ty
NITA Noninterest
Income to
Assets
Noninterest Income Total Assets Profitabili
ty
NITOI Noninterest
Income to
Operating
Income
Noninterest Income Total Operating
Income
Profitabili
ty
OETA Operating
Expense to
Assets
Total Operating Expense Total Assets Efficienc
y
OETNII Operating
Expense to
Total Operating Expense Net Interest Income Efficienc
y

61
Net Interest
Income
OETOI Operating
Expense to
Operating
Income
Total Operating Expense Total Operating
Income
Efficienc
y
CTI Cost to
Income
Total Cost Total Income Efficienc
y
PLL Provision for
Loan Losses
Provision for Loans Total Advances Efficienc
y
CAR Capital
Adequacy
Ratio
Tier 1 Capital plus Tier 2
Capital
Total Risk Weighted
Assets
Capital
Adequacy
T1CTRW
A
Tier 1
Capital to
Total Risk
Weighted
Assets
Tier 1 Capital
Total Risk Weighted
Assets
Solvency
1 EMROA
ROA