Relationships between on-farm tree stocks and soil organic ...
13
Full Terms & Conditions of access and use can be found at http://www.tandfonline.com/action/journalInformation?journalCode=tftl20 Download by: [163.172.28.61] Date: 08 July 2016, At: 03:25 Forests, Trees and Livelihoods ISSN: 1472-8028 (Print) 2164-3075 (Online) Journal homepage: http://www.tandfonline.com/loi/tftl20 Relationships between on-farm tree stocks and soil organic carbon along an altitudinal gradient, Mount Kilimanjaro, Tanzania Mathayo Mpanda Mathew, Amos Enock Majule, Fergus Sinclair & Rob Marchant To cite this article: Mathayo Mpanda Mathew, Amos Enock Majule, Fergus Sinclair & Rob Marchant (2016): Relationships between on-farm tree stocks and soil organic carbon along an altitudinal gradient, Mount Kilimanjaro, Tanzania, Forests, Trees and Livelihoods, DOI: 10.1080/14728028.2016.1202790 To link to this article: http://dx.doi.org/10.1080/14728028.2016.1202790 © 2016 The Author(s). Published by Informa UK Limited, trading as Taylor & Francis Group Published online: 08 Jul 2016. Submit your article to this journal View related articles View Crossmark data
Transcript of Relationships between on-farm tree stocks and soil organic ...

Full Terms & Conditions of access and use can be found athttp://www.tandfonline.com/action/journalInformation?journalCode=tftl20
Download by: [163.172.28.61] Date: 08 July 2016, At: 03:25
Forests, Trees and Livelihoods
ISSN: 1472-8028 (Print) 2164-3075 (Online) Journal homepage: http://www.tandfonline.com/loi/tftl20
Relationships between on-farm tree stocks andsoil organic carbon along an altitudinal gradient,Mount Kilimanjaro, Tanzania
Mathayo Mpanda Mathew, Amos Enock Majule, Fergus Sinclair & RobMarchant
To cite this article: Mathayo Mpanda Mathew, Amos Enock Majule, Fergus Sinclair & RobMarchant (2016): Relationships between on-farm tree stocks and soil organic carbon alongan altitudinal gradient, Mount Kilimanjaro, Tanzania, Forests, Trees and Livelihoods, DOI:10.1080/14728028.2016.1202790
To link to this article: http://dx.doi.org/10.1080/14728028.2016.1202790
© 2016 The Author(s). Published by InformaUK Limited, trading as Taylor & FrancisGroup
Published online: 08 Jul 2016.
Submit your article to this journal
View related articles
View Crossmark data

Forests, trees and LiveLihoods, 2016http://dx.doi.org/10.1080/14728028.2016.1202790
Relationships between on-farm tree stocks and soil organic carbon along an altitudinal gradient, Mount Kilimanjaro, Tanzania
Mathayo Mpanda Mathewa, Amos Enock Majuleb, Fergus Sinclairc and Rob Marchantd
aWorld agroforestry Centre (iCraF), dar es salaam, tanzania; binstitute of resource assessment, University of dar es salaam, dar es salaam, tanzania; cWorld agroforestry Centre (iCraF), nairobi, Kenya; denvironment department, York institute for tropical ecosystems, University of York, York, UK
ABSTRACTUnderstanding above-ground tree biomass carbon (AGC) and relationships to soil organic carbon (SOC) stocks across a landscape provide opportunities for better management of the carbon pools. This study determined relationships between on-farm AGC and SOC stocks along an altitudinal gradient on the slopes of Mount Kilimanjaro. Fifty plots (100 × 100 m) were established, whereby all trees ≥5 cm dbh, were recorded. Soil samples from top (0–20 cm) and subsoils (21–50 cm) were collected at the centre of the plots using four subplots. Tree inventory and soil analyses were performed and statistical tests were conducted to understand relationships between AGC and SOC stocks. Results indicated that stem density increased with altitude, however the upland and the midland did not differ significantly while the lowland differs with both the midland and the upland. A similar pattern was observed for basal area and above-ground tree biomass (AGB), with no significant difference between the midland and upland whereas the lowland differed significantly from both the upland and the midland. SOC stocks varied significantly, being the largest in the upland, amounting to almost twice the size recorded in the midland or the lowland. SOC stocks indicated poor correlation (Pearson’s: r = 0.327, df = 47, p = 0.023) and poor interaction (Wald = 0.0008, df = 1, p = 0.977) with AGC. This study concludes that the relationship between AGC and SOC stocks was masked by other factors including soil types, precipitation and land management. The protocol used to test the relationships might also have contributed further to current observation. Overall, the lowland area, having low AGC and SOC stocks, requires management interventions aimed at increasing SOC stocks.
Introduction
The current trend of diminishing tropical forests and woodlands through deforestation and forest degradation (Gibbs et al. 2010; Green et al. 2013) is associated with declining stocks of soil organic carbon (SOC) (Lal 2006). SOC can be reduced by about 75% when tropical forests are converted to agriculture (Lal 2004); and as SOC stocks decrease, soil fertility
© 2016 the author(s). Published by informa UK Limited, trading as taylor & Francis Group.this is an open access article distributed under the terms of the Creative Commons attribution License (http://creativecommons.org/licenses/by/4.0/), which permits unrestricted use, distribution, and reproduction in any medium, provided the original work is properly cited.
KEYWORDecosystem services; agroforestry; homegardens; carbon stocks; land use; productivity; sustainability; climate change adaptation
CONTACT Mathayo Mpanda Mathew [email protected], [email protected]
OPEN ACCESS
Dow
nloa
ded
by [
163.
172.
28.6
1] a
t 03:
25 0
8 Ju
ly 2
016

2 M. M. MAThEW ET AL.
declines and land degradation can be accelerated. Such losses of SOC undermine the wider provision of ecosystem services and can have negative livelihood impacts. Elevation also influences SOC especially via changing ground cover, tillage and other management prac-tices (Martin et al. 2010).
While tree cover has been decreasing within natural forests, there have been some increases in agricultural lands (Zomer et al. 2014). This follows efforts to diversify tree cover on farmland through domestication of indigenous tree species and other high value tree crops that can bring broader co-benefits of increased ecosystem services (Dawson et al. 2013; Mpanda et al. 2014). Incorporating trees into agro-ecosystems can help mitigate the impacts of climate change, provide habitat for biodiversity (Nkem et al. 2007) and support crop production (Lal 2006) while increasing SOC. Changes in management practices can help reverse SOC losses, and interventions such as vegetation restoration can increase SOC by more than 20% within a decade (Wang et al. 2011). however, the link between tree bio-mass and SOC is currently uncertain and quantifying the value of this regulatory ecosystem service has been a challenge (Gluck 2000; SCBD 2001).
Previous studies on the slopes of Mount Kilimanjaro have assessed the structure of the Chagga home gardens and information on the biodiversity associated with forest, agroforests and the land use changes (hemp 2005; Soini 2005). however, little is known about the dis-tribution and relationships between on-farm tree biomass and SOC. Tree biomass itself is increasingly considered as an important ecosystem service under REDD+ (reducing emis-sions from deforestation and forest degradation with additional role of conservation, sus-tainable management of forests and enhancement of forest carbon stocks). REDD+ aims to enhance the terrestrial carbon stock to mitigate climate change by drawing down atmos-pheric CO2. Whilst we do know that SOC represent a significant carbon store, further insights such as the study presented here contributes to a better understanding of SOC at local scale (Batjes 1996; Fonte et al. 2010).
This study attempted to assess tree biomass carbon and SOC stocks on the slopes of Mount Kilimanjaro. Specifically, it aimed at, (i) identifying variation in the tree biomass carbon in the agricultural landscape, and, (ii) identifying variation in the SOC stocks in the agricultural landscape. We hypothesized that an increase in tree biomass carbon on farm corresponds to an increase in SOC stocks.
Material and methods
Study site and design
This study was conducted on the southern slopes of Mount Kilimanjaro, in Kilimanjaro admin-istrative region in northeastern Tanzania (Figure 1). Mount Kilimanjaro is a stratovolcano, with the highest free-standing solitary mountain rising above the surrounding relief by 5000 m (Nonnotte et al. 2008). Rainfall is bimodal with longer rains from March to May and shorter rains in October to November. Kilimanjaro region’s population stands at 1,640,087 and the average household size is 4.3 (URT 2013).
The landscape outside of the protected area on the slopes of Mount Kilimanjaro was divided into three broad land-use categories, namely the upland, midland and lowland (Table 1), that encompass differences in elevation (topography and slope), climate (precip-itation and temperature), biophysical features (soils and vegetation) and land-use (URT 1998).
Dow
nloa
ded
by [
163.
172.
28.6
1] a
t 03:
25 0
8 Ju
ly 2
016

FORESTS, TREES AND LIvELIhOODS 3
Three major patterns of tree distribution on farm were observed during the tree inventory; (i) boundary planting with a high number of trees of relatively low dbh (diameter at breast height), (ii) scattered trees of medium to large size, at variable densities and (iii) a combination
Figure 1. Location of the study transect that extends from the sub-montane to lowland agricultural fields on the southern slopes of Mount Kilimanjaro, tanzania. source: Mathew et al. 2016.
Table 1. Characteristics of the three land-use zones on the slopes of Mount Kilimanjaro, tanzania.
Land-use zone DescriptionUpland elevation: 1438–1696 m a.s.l.
Precipitation: 1250–2000 mm per annumtemperature: 24 °Ctopography: gentle slope (20–30°)Major soils: weathered volcanic ash, humic nitisolCharacteristics: cultivated farms, Chagga homegardens, zero grazing, high density of coffee and
bananaMidland elevation: 901–1337 m a.s.l.
Precipitation: 1000–1200 mm per annumtemperature: 26 °Ctopography: gentle slope (20–30°)Major soils: sodic volcanic ash, mainly in slopes, haplic PhaeozomCharacteristics: cultivated farms, transition of homegardens and maize belt, zero grazing
Lowland elevation: 680–834 m a.s.l.Precipitation: 400–900 mm per annumtemperature: 33 °Ctopography: Flat terrain (5–10°)Major soils: sediments influenced by volcanic ash, eutric Fluvisol (alluvial with little profile
development) Characteristics: cultivated farms, savannah plain, free grazing
Dow
nloa
ded
by [
163.
172.
28.6
1] a
t 03:
25 0
8 Ju
ly 2
016
4 M. M. MAThEW ET AL.
of (i) and (ii), i.e. boundary planting and scattered trees on farm. In the upland and midland zones, the Chagga homegarden was the common farming system, featured with multi-storey agroforests, where layers of closed tree canopy overlaps with understory layers of coffee and banana (Fernandes et al. 1984).
Methods
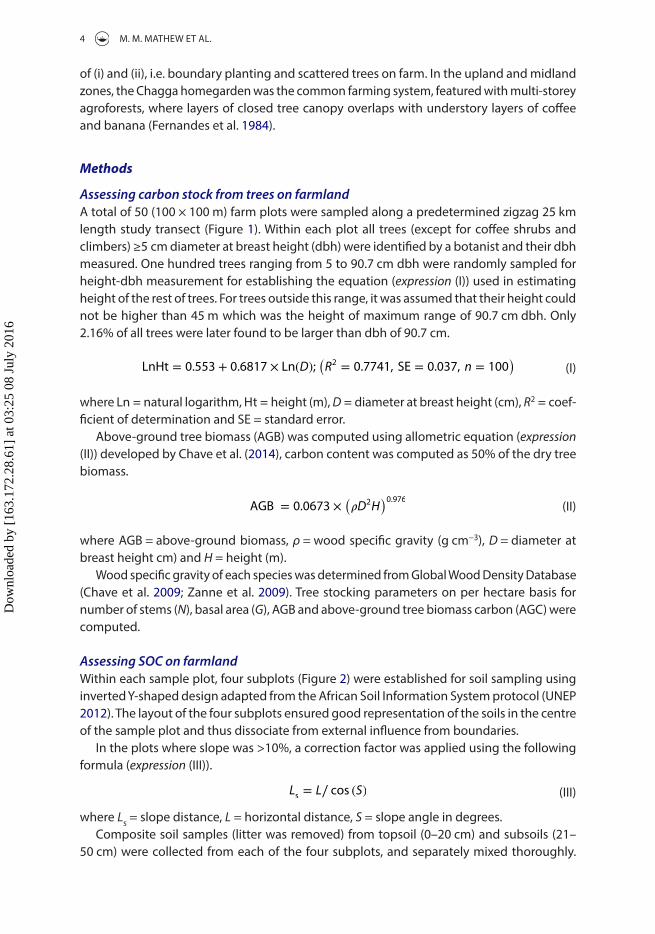
Assessing carbon stock from trees on farmlandA total of 50 (100 × 100 m) farm plots were sampled along a predetermined zigzag 25 km length study transect (Figure 1). Within each plot all trees (except for coffee shrubs and climbers) ≥5 cm diameter at breast height (dbh) were identified by a botanist and their dbh measured. One hundred trees ranging from 5 to 90.7 cm dbh were randomly sampled for height-dbh measurement for establishing the equation (expression (I)) used in estimating height of the rest of trees. For trees outside this range, it was assumed that their height could not be higher than 45 m which was the height of maximum range of 90.7 cm dbh. Only 2.16% of all trees were later found to be larger than dbh of 90.7 cm.
where Ln = natural logarithm, ht = height (m), D = diameter at breast height (cm), R2 = coef-ficient of determination and SE = standard error.
Above-ground tree biomass (AGB) was computed using allometric equation (expression (II)) developed by Chave et al. (2014), carbon content was computed as 50% of the dry tree biomass.
where AGB = above-ground biomass, ρ = wood specific gravity (g cm−3), D = diameter at breast height cm) and H = height (m).
Wood specific gravity of each species was determined from Global Wood Density Database (Chave et al. 2009; Zanne et al. 2009). Tree stocking parameters on per hectare basis for number of stems (N), basal area (G), AGB and above-ground tree biomass carbon (AGC) were computed.
Assessing SOC on farmlandWithin each sample plot, four subplots (Figure 2) were established for soil sampling using inverted Y-shaped design adapted from the African Soil Information System protocol (UNEP 2012). The layout of the four subplots ensured good representation of the soils in the centre of the sample plot and thus dissociate from external influence from boundaries.
In the plots where slope was >10%, a correction factor was applied using the following formula (expression (III)).
where Ls = slope distance, L = horizontal distance, S = slope angle in degrees.Composite soil samples (litter was removed) from topsoil (0–20 cm) and subsoils (21–
50 cm) were collected from each of the four subplots, and separately mixed thoroughly.
(I)LnHt = 0.553 + 0.6817 × Ln(D);(
R2 = 0.7741, SE = 0.037, n = 100
)
(II)AGB = 0.0673 ×(
�D2H)0.976
(III)Ls = L∕ cos (S)
Dow
nloa
ded
by [
163.
172.
28.6
1] a
t 03:
25 0
8 Ju
ly 2
016

FORESTS, TREES AND LIvELIhOODS 5
About 500 g of the composite sample for each top and subsoils were packed in zip-lock bags and labelled.
Cumulative soil mass samples were collected at the centre of each plot (subplot 1) using an Edelman combination auger, at depths of 0–20 cm and 21–50 cm. A sampling plate was used as an auger guide to enable full recovery of the sample. Cumulative soil mass collected from top and subsoils were separately packed and labelled in zip-lock bags.
Soil samples (composite and cumulative separately) were later air dried at 40 °C, then weighed to the nearest 0.1 g using a calibrated top-pan balance. Samples were then sieved with 2 mm mesh size sieve and the course fragments (>2 mm) weighed. Cumulative sub-samples were used for estimation of gravimetric water content and bulk density. Sub-samples were oven-dried at 105 °C for 48 h until a constant weight was obtained, and thereafter computation for the expressions (III) and (Iv) was effected.
(Iv)Gravimetric water content (%) = ((Air dried soil − Oven dried)∕Oven dried) × 100
Figure 2. Layout of the tree sampling plot and nested soil sampling sub-plots.
Dow
nloa
ded
by [
163.
172.
28.6
1] a
t 03:
25 0
8 Ju
ly 2
016
6 M. M. MAThEW ET AL.
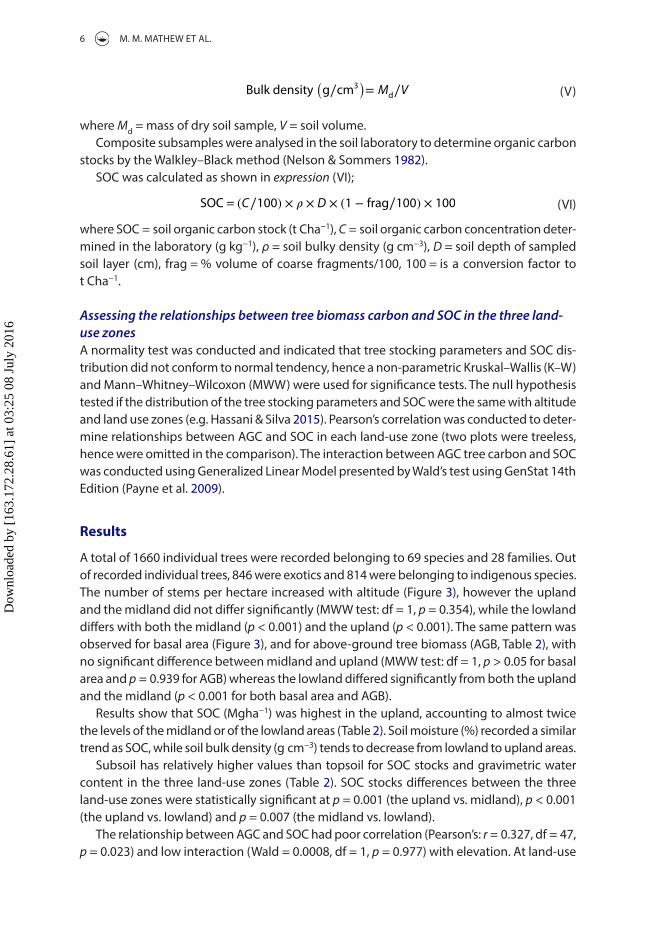
where Md = mass of dry soil sample, V = soil volume.Composite subsamples were analysed in the soil laboratory to determine organic carbon
stocks by the Walkley–Black method (Nelson & Sommers 1982).SOC was calculated as shown in expression (vI);
where SOC = soil organic carbon stock (t Cha−1), C = soil organic carbon concentration deter-mined in the laboratory (g kg−1), ρ = soil bulky density (g cm−3), D = soil depth of sampled soil layer (cm), frag = % volume of coarse fragments/100, 100 = is a conversion factor to t Cha−1.
Assessing the relationships between tree biomass carbon and SOC in the three land-use zonesA normality test was conducted and indicated that tree stocking parameters and SOC dis-tribution did not conform to normal tendency, hence a non-parametric Kruskal–Wallis (K–W) and Mann–Whitney–Wilcoxon (MWW) were used for significance tests. The null hypothesis tested if the distribution of the tree stocking parameters and SOC were the same with altitude and land use zones (e.g. hassani & Silva 2015). Pearson’s correlation was conducted to deter-mine relationships between AGC and SOC in each land-use zone (two plots were treeless, hence were omitted in the comparison). The interaction between AGC tree carbon and SOC was conducted using Generalized Linear Model presented by Wald’s test using GenStat 14th Edition (Payne et al. 2009).
Results
A total of 1660 individual trees were recorded belonging to 69 species and 28 families. Out of recorded individual trees, 846 were exotics and 814 were belonging to indigenous species. The number of stems per hectare increased with altitude (Figure 3), however the upland and the midland did not differ significantly (MWW test: df = 1, p = 0.354), while the lowland differs with both the midland (p < 0.001) and the upland (p < 0.001). The same pattern was observed for basal area (Figure 3), and for above-ground tree biomass (AGB, Table 2), with no significant difference between midland and upland (MWW test: df = 1, p > 0.05 for basal area and p = 0.939 for AGB) whereas the lowland differed significantly from both the upland and the midland (p < 0.001 for both basal area and AGB).
Results show that SOC (Mgha−1) was highest in the upland, accounting to almost twice the levels of the midland or of the lowland areas (Table 2). Soil moisture (%) recorded a similar trend as SOC, while soil bulk density (g cm−3) tends to decrease from lowland to upland areas.
Subsoil has relatively higher values than topsoil for SOC stocks and gravimetric water content in the three land-use zones (Table 2). SOC stocks differences between the three land-use zones were statistically significant at p = 0.001 (the upland vs. midland), p < 0.001 (the upland vs. lowland) and p = 0.007 (the midland vs. lowland).
The relationship between AGC and SOC had poor correlation (Pearson’s: r = 0.327, df = 47, p = 0.023) and low interaction (Wald = 0.0008, df = 1, p = 0.977) with elevation. At land-use
(v)Bulk density(
g∕cm3)
= Md∕V
(vI)SOC = (C∕100) × � × D × (1 − frag∕100) × 100
Dow
nloa
ded
by [
163.
172.
28.6
1] a
t 03:
25 0
8 Ju
ly 2
016

FORESTS, TREES AND LIvELIhOODS 7
zone level, the relation between AGC and SOC was negative for the lowland and for the upland, but was positive for the midland (Figure 4). In each case however, the coefficient of determination was very low, confirming the low correlation between our two variables.
Discussion
This study observed distinct tree stocking levels associated with the three main land-use zones. Levels of SOC exhibited a strong pattern within land-use types although SOC and AGC stocks were poorly correlated. The lowland zone supported considerably lower tree stock densities than both the midland and the upland zones, while SOC was much higher in the upland zone than in both the midland and the lowland zones. Overall observed AGC
Figure 3. Box and whisker’s plots representing the median values per plot of the number of stems and basal per hectare across the three land-uses.
Table 2. above-ground tree biomass carbon (aGC), soil organic carbon (soC), bulk density and gravi-metric water content (gravimetric WC) in the three land-use zones on the southern slopes of Mount Kilimanjaro, tanzania (Mean ± se).
ParametersUpland (1438–1696 m a.s.l)
n = 12Midland (901–1337 m a.s.l)
n = 14Lowland (680–834 m a.s.l.)
n = 24aGC (Mgha−1) 20.11 ± 5.23 22.17 ± 4.9 7.11 ± 2.59soC (Mgha−1) 0–20 cm depth 439.2 ± 62.83 257.57 ± 54.17 207.09 ± 34.47 20–50 cm depth 474.96 ± 69.45 294.15 ± 63.48 233.8 ± 29.08Bulk density (gcm−3) 0−20 cm depth 0.6 ± 0.01 0.6 ± 0.06 0.7 ± 0.03 20–50 cm depth 0.5 ± 0.03 0.6 ± 0.03 0.7 ± 0.03Gravimetric WC (%) 0−20 cm depth 15.06 ± 1.44 11.71 ± 0.98 10.28 ± 0.56 20–50 cm depth 19.43 ± 2.08 13.7 ± 1.55 11.78 ± 0.7
Dow
nloa
ded
by [
163.
172.
28.6
1] a
t 03:
25 0
8 Ju
ly 2
016

8 M. M. MAThEW ET AL.
stocks were in the same range as noted by other studies conducted in the nearby areas (Ensslin et al. 2015). Reasons for the decline of basal area and tree biomass carbon in the upland remained unclear but is likely to result from a cooler climate that prompt farmers to destock trees to allow more space for crops.
Distribution of SOC
SOC stocks were found to strongly decline from the upland to midland, and to lightly decline from midland to lowland. These variations might be linked to the differences in soil types, environmental variables and management regimes (Table 1). SOC stocks trend relates to precipitation and soil moisture content, which increased upslope, and thus may have con-tributed to the acceleration of decomposition of organic matter. Other studies have noted similar trends, where increased soil moisture corresponded to increase in SOC (e.g. Manns & Berg 2014; Klopfenstein et al. 2015). Furthermore, SOC stocks recorded in this study were within the range of other studies conducted close to the study area (e.g. Munishi & Shear 2004; Mwakisunga 2012; Winowiecki et al. 2015).
Land management practices are different in each land-use zone, and probably contributed in influencing the distribution of SOC stocks. The build-up of SOC stocks in the upland and the midland may be reflective of the indigenous practices associated with the Chagga home-garden systems. Fernandes et al. (1984) noted that the intensification in the Chagga home-gardens, where tree intercropped with banana, coffee and zero grazing of livestock sustained the integrity of the system. The amount of litter-fall and other vegetation biomass from this system have higher contribution to SOC stocks accumulation especially in the upland, where there is higher concentration of coffee and banana than in the midland. Additionally, due
Figure 4. scatter matrix of soC and tree carbon showing their relation across the land use zones.notes: Middle regression line (midland zone plots) shows a positive trend; the upper regression line (upland zone plots) and the lower regression line (lowland zone plots) show negative trends.
Dow
nloa
ded
by [
163.
172.
28.6
1] a
t 03:
25 0
8 Ju
ly 2
016
FORESTS, TREES AND LIvELIhOODS 9
to shortage of fodder for livestock in the upland and midland, biomass transfer of crop residuals from the lowland upslope are a common practice (Mambo 2005). In the lowland, the change of savannah vegetation to cropland and free livestock grazing may have con-tributed to low levels of SOC stocks (e.g. Oberholzer et al. 2014).
The low levels of SOC in the midland and lowland areas imply reduced crop productivity compared to the upland. Lal (2006) estimated that between 15 and 150 kgha−1yr−1 increased maize yield can be projected for every 0.5 Mgha−1yr−1 increase in SOC pool. Therefore, any efforts to increase SOC stocks in the lowland area could amount to improvement in crop production. Cropland management such as crop residual retention and crop rotation con-tribute to improving SOC stocks (Raffa et al. 2015) so these strategies could be utilized in the lowlands to help enhance crop productivity.
Relationship between AGC and SOC stocks
vegetation is one among many factors influencing SOC stocks (Oueslati et al. 2015; Sun et al. 2015). Trends of tree vegetation and SOC stocks along land-uses in the study area indicated some commonalities and contrasting features. While the lowland had lower AGC and SOC stocks, the AGC stocks peaked in the midland and SOC stocks peaked in the upland. Our results seem to indicate that at farm level contribution of tree stocks in the build-up of SOC stocks might have been masked by other factors, both long and short term. Therefore, the observed poor correlation and interaction between AGC and SOC stocks can be a result of various contributing factors. Tree cover alone might not be the main contributor especially at larger scale such as farm and landscape. For instance, SOC stocks were found to be similar in adjacent sites containing primary and secondary forests (forest degraded by timber har-vesting from late 1960s to early 1980s) in the nearby East Usambara Mountains in Tanzania. This was the case despite clear differences in tree biomass and vegetation cover. The obser-vation means that differences in tree cover may not necessarily affect SOC stocks, if the cause of the differences did not involve soil disturbances (Kirsten et al. 2016). Similarly, Kinoshita et al. (2016) noted that SOC was influenced mainly by soil properties. The study further noted that topography and vegetation had very little impact. These observations may align with results of our study in which soil types (Table 1) probably contributed to the variability of SOC stocks, irrespective of the tree vegetation within the land-use zones.
Alternative explanation pertaining to poor correlation of carbon pools can be due to effect of long term and current land management practices on build-up of SOC stocks espe-cially in the upland and midland. Zech et al. (2014) noted paleosols sequences with high SOC content of up to 3 m depth on the slopes of Mt. Kilimanjaro, which is irrespective of the tree cover. The accumulation of the SOC might be due to long-term processes. Therefore, observed SOC stocks in our study (Table 2) may also be a result of similar long-term land management practices.
Biomass transfer such as crop residuals, application of manure and other land manage-ment practices used on farm at different levels and intensities may have contributed to either built-up or depletion of SOC stocks on farm. As there was no uniformity and clear patterns on land management due to fragmentation of smallholder farms in the study area, differ-ences of SOC stocks was inevitable. Therefore, miscellaneous inputs of organic matter may have caused disruptions and mismatch in the correlation trends between tree carbon and SOC stocks.
Dow
nloa
ded
by [
163.
172.
28.6
1] a
t 03:
25 0
8 Ju
ly 2
016
10 M. M. MAThEW ET AL.
It is also apparent that the protocol used in collecting field data for trees and soils in the current study might have contributed to the observed low correlation and interaction between AGC and SOC stocks. For instance, Cardinael et al. (2015) noted that an alley crop-ping agroforestry system involving hybrid walnuts accumulated more SOC than only agri-cultural crops. This study took into consideration distance to trees and tree rows, and showed that carbon accumulation takes place under and at very short distance from the trees. In contrast, our study employed fixed subplots position for soil sampling while trees were in irregular patterns, meaning that our protocol may have been poorly suited to the estimation of SOC in such a mixture of trees and crops. Therefore, attempts by the present study to look at the bigger picture on the relation between AGC and SOC stocks accumulation at farm and landscape level revealed that, (i) contribution of tree biomass in SOC stocks was masked by other factors including soil types, precipitation and land management, and, (ii) the pro-tocol used might have contributed to the observed lack of trend as it was ill adapted to capture the irregular patterns of trees on farm.
Conclusion
Understanding AGC and SOC stocks and their spatial relationship in a landscape is important as it provide opportunities for better management of the carbon pools. Tree stocking (basal area and carbon) varied along the altitudinal gradient, with peak in the midland. There was high variability for SOC stocks along the land-use zones with a decreasing trend, where Upland > Midland > Lowland. A poor relationship was observed between AGC and SOC stocks. This study suggested that the role of tree biomass in enhancing accumulation of SOC stocks was masked by other contributing factors such as soil types, climate (precipitation) and land management factors, and possibly by a SOC stocks estimation protocol not suited to the land-uses encountered in this study. Results from this study can be used to inform interventions aimed at improving tree stockings and building up of SOC stocks in areas with low levels. Overall, the lowland was destocked of the tree resources and had low SOC stocks and thus requires intervention.
Acknowledgements
World Agroforestry Centre and CGIAR’s CRP 6 (Forests, Trees and Agroforestry) supported Mathayo Mpanda Mathew in various capacities. Thanks to Late Aubrey Lyimo, Jimmy Sianga and Mr. Mchomvu for their critical assistance during field work, and Richard Giliba for tree identification. Olivia Norfolk provided insights and reviews on data analysis. The authors acknowledge useful suggestions and comments provided by the editor and two anonymous reviewers.
Disclosure statement
No potential conflict of interest was reported by the authors.
Funding
This work was part of a PhD programme funded by the project titled ‘The Climate Change Impacts on Ecosystem Services and Food Security in Eastern Africa (CHIESA)’. ChIESA was funded by the Ministry for Foreign Affairs of Finland, and coordinated by the International Centre of Insect Physiology and Ecology (ICIPE) in Nairobi, Kenya.
Dow
nloa
ded
by [
163.
172.
28.6
1] a
t 03:
25 0
8 Ju
ly 2
016

FORESTS, TREES AND LIvELIhOODS 11
References
Batjes Nh. 1996. Total carbon and nitrogen in the soils of the world. Eur J Soil Sci. 47:151–163.Cardinael R, Chevallier T, Barthès BG, Saby NPA, Parent T, Dupraz C, Bernoux M, Chenu C. 2015. Impact
of alley cropping agroforestry on stocks, forms and spatial distribution of soil organic carbon – a case study in a Mediterranean context. Geoderma. 259–260:288–299.
Chave J, Coomes D, Jansen S, Lewis SL, Swenson NG, Zanne AE. 2009. Towards a worldwide wood economics spectrum. Ecol Lett. 12:351–366.
Chave J, Réjou-Méchain M, Búrquez A, Chidumayo E, Colgan MS, Delitti WBC, Duque A, Eid T, Fearnside PM, Goodman RC, et al. 2014. Improved allometric models to estimate the aboveground biomass of tropical trees. Global Change Biol. 20:3177–3190.
Dawson IK, Guariguata MR, Loo J, Weber JC, Lengkeek A, Bush D, Cornelius J, Guarino L, Kindt R, Orwa K, Russell J, Jamnadass R. 2013. What is the relevance of smallholders’ agroforestry systems for conserving tropical tree species and genetic diversity in ca. situm, in situ and ex situ settings? A review. Biodiversity and Conservation. 22:301–324.
Ensslin A, Rutten G, Pommer U, Zimmermann R, Andreas h, Fischer M. 2015. Effects of elevation and land use on the biomass of trees, shrubs and herbs at Mount Kilimanjaro. Ecosphere. 6:1–15.
Fernandes ECM, Oktingati A, Maghembe J. 1984. The Chagga homegardens: a multistoried agroforestry cropping system on Mt. Kilimanjaro (Northern Tanzania). Agroforest Syst. 2:73–86.
Fonte SJ, Barrios E, Six J. 2010. Earthworms, soil fertility and aggregate-associated soil organic matter dynamics in the Quesungual agroforestry system. Geoderma. 155:320–328.
Gibbs hK, Ruesch AS, Achard F, Clayton MK, holmgren P, Ramankutty N, Foley JA. 2010. Tropical forests were the primary sources of new agricultural land in the 1980s and 1990s. Proc Natl Acad Sci. 107:16732–16737.
Gluck P. 2000. Policy means for ensuring the full value of forests to society. Land Use Policy. 17:177–185.Green JMh, Larrosa C, Burgess ND, Balmford A, Johnston A, Mbilinyi BP, Platts P, Coad L. 2013.
Deforestation in an African biodiversity hotspot: extent, variation and the effectiveness of protected areas. Biol Conserv. 164:62–72.
hassani h, Silva ES. 2015. A Kolmogorov–Smirnov based test for comparing the predictive accuracy of two sets of forecasts. Econometrics. 3:590–609.
hemp A. 2005. The banana forests of Kilimanjaro: biodiversity and conservation of the Chagga homegardens. Biodivers Conserv. 15:1193–1217.
Kinoshita R, Roupsard O, Chevallier T, Albrecht A, Taugourdeau S, Ahmed Z, Es hM. 2016. Large topsoil organic carbon variability is controlled by Andisol properties and effectively assessed by vNIR spectroscopy in a coffee agroforestry system of Costa Rica. Geoderma. 262:254–265.
Kirsten M, Kaaya A, Klinger T, Feger Kh. 2016. Stocks of soil organic carbon in forest ecosystems of the Eastern Usambara Mountains, Tanzania. Catena. 137:651–659.
Klopfenstein ST, hirmas DR, Johnson WC. 2015. Relationships between soil organic carbon and precipitation along a climosequence in loess-derived soils of the Central Great Plains, USA. Catena. 133:25–34.
Lal R. 2004. Soil carbon sequestration impacts on global climate change and food security. Science. 304:1623–1627.
Lal R. 2006. Enhancing crop yields in the developing countries through restoration of the soil organic carbon pool in agricultural lands. Land Degrad Dev. 17:197–209.
Mambo MJ. 2005. Soil nutrient flow dynamics in the slopes of Mount Kilimanjaro, a case study of North Ward in hai District Tanzania. Dar es Salaam: Geography and Environmental Management. University of Dar es Salaam.
Manns hR, Berg AA. 2014. Importance of soil organic carbon on surface soil water content variability among agricultural fields. J hydrol. 516:297–303.
Martin D, Lal T, Sachdev CB, Sharma JP. 2010. Soil organic carbon storage changes with climate change, landform and land use conditions in Garhwal hills of the Indian himalayan mountains. Agric Ecosyst Environ. 138:64–73.
Mathew MM, Majule AE, Sinclair F, Marchant R. 2016. Effect of soil properties on tree distribution across an agricultural landscape on a tropical mountain, Tanzania. Open Journal of Ecology. 6:264–276. http://dx.doi.org/10.4236/oje.2016.65027.
Dow
nloa
ded
by [
163.
172.
28.6
1] a
t 03:
25 0
8 Ju
ly 2
016
12 M. M. MAThEW ET AL.
Mpanda M, Munjuga M, Reyes T, Said A, Rutatina F, Kimaro A, van-Noordwijk M. 2014. Allanblackia, butterflies and cardamom: sustaining livelihoods alongside biodiversity conservation on the forest–agroforestry interface in the East Usambara Mountains, Tanzania. For Trees Livelihoods. 23:127–142.
Munishi P. K. T. and Shear T. h. 2004. Carbon storage in afromontane rain forests of the Eastern Arc Mountains of Tanzania: their net contribution to atmospheric carbon. J Trop For Sci. 16:78–93.
Mwakisunga B. 2012. The influence of altitude and management on carbon stock quantities in rungwe forest, southern highland of Tanzania. Open J Ecol. 2:214–221.
Nelson DW, Sommers LE. 1982. Total carbon, organic carbon and organic matter. In: Page AL, Miller Rh, editors. Methods of soil analysis, Part 2. Chemical and microbiological properties. Madison, WI: ASA and SSSA; p. 539–579.
Nkem J, Santoso h, Murdiyarso D, Brockhaus M, Kanninen M. 2007. Using tropical forest ecosystem goods and services for planning climate change adaptation with implications for food security and poverty reduction. J Semi-Arid Trop Agric Res. 4:1–23.
Nonnotte P, Guillou h, Gall BL, Benoit M, Cotten J, Scaillet S. 2008. New K–Ar age determinations of Kilimanjaro volcano in the North Tanzanian diverging rift, East Africa. J volcanol Geotherm Res. 173:99–112.
Oberholzer hR, Leifeld J, Mayer J. 2014. Changes in soil carbon and crop yield over 60 years in the Zurich Organic Fertilization Experiment, following land-use change from grassland to cropland. J Plant Nutr Soil Sci. 177:696–704.
Oueslati I, Allamano P, Bonifacio E, Claps P. 2015. vegetation and topographic control on spatial variability of soil organic carbon. Pedosphere. 23:48–58.
Payne RW, Murray DA, harding SA, Baird DB, Soutar DM. 2009. GenStat for Windows introduction. hemel hempstead: vSN International.
Raffa DW, Bogdanski A, Tittonell P. 2015. how does crop residue removal affect soil organic carbon and yield? A hierarchical analysis of management and environmental factors. Biomass Bioenergy. 81:345–355.
SCBD. 2001. The value of forest ecosystems: CBD technical series no. 4. Secretariat of Convention on Biological Diversity, Montreal. 70p.
Soini E. 2005. Land use change patterns and livelihood dynamics on the slopes of Mt. Kilimanjaro, Tanzania. Agric Syst. 85:306–323.
Sun W, Zhu h, Guo S. 2015. Soil organic carbon as a function of land use and topography on the Loess Plateau of China. Ecol Eng. 83:249–257.
UNEP. 2012. Land health surveillance: an evidence-based approach to land ecosystem management. Illustrated with a case study in the West Africa Sahel. Nairobi: United Nations Environment Programme.
URT. 1998. Kilimanjaro region socio-economic profile. The planning commission and regional commissioner’s office Kilimanjaro, Kilimanjaro, Planning Commission. p. 238.
URT. 2013. 2012 population and housing census: population distribution by administrative areas. Dar es Salaam: National Bureau of Statistics and Office of Chief Government Statistician; p. 264.
Wang Y, Fu B, Lü Y, Chen L. 2011. Effects of vegetation restoration on soil organic carbon sequestration at multiple scales in semi-arid Loess Plateau, China. Catena. 85:58–66.
Winowiecki L, vågen TG, huising J. 2015. Effects of land cover on ecosystem services in Tanzania: a spatial assessment of soil organic carbon. Geoderma. 263:274–283.
Zanne AE, Lopez-Gonzalez G, Coomes DA, Ilic J, Jansen S, Lewis SL, Miller RB, Swenson NG, Wiemann MC, Chave J. 2009. Data from: towards a worldwide wood economics spectrum. Dryad Digital Repository. http://dx.doi.org/10.5061/dryad.234. [cited Jan 12, 2016].
Zech M, hörold C, Leiber-Sauheitl K, Kühnel A, hemp A, Zech W. 2014. Buried black soils on the slopes of Mt. Kilimanjaro as a regional carbon storage hotspot. Catena. 112:125–130.
Zomer RJ, Trabucco A, Coe R, Place F, van-Noordwijk M, Xu JC. 2014. Trees on farms: an update and reanalysis of agroforestry’s global extent and socio-ecological characteristics. Working Paper 179. Bogor: World Agroforestry Centre (ICRAF) Southeast Asia Regional Program. 33p.
Dow
nloa
ded
by [
163.
172.
28.6
1] a
t 03:
25 0
8 Ju
ly 2
016