Relationship to Desired Conditions Presentation · Pool Frequency Water Temperature Water...
29
Transcript of Relationship to Desired Conditions Presentation · Pool Frequency Water Temperature Water...

ADAPTIVE MANAGEMENTADAPTIVE MANAGEMENT
AssessmentAssessment
PrioritizationPrioritization
ActivityActivity (Design/Implementation)(Design/Implementation)
MonitoringMonitoring
ModificationModification

AssessmentAssessment
PrioritizationPrioritization
ActivityActivity
MonitoringMonitoring
¾¾ What is the Resource Condition?What is the Resource Condition?¾¾ Why?Why?
ADAPTIVE MANAGEMENTADAPTIVE MANAGEMENT
¾¾ What is the Resource Condition?What is the Resource Condition?
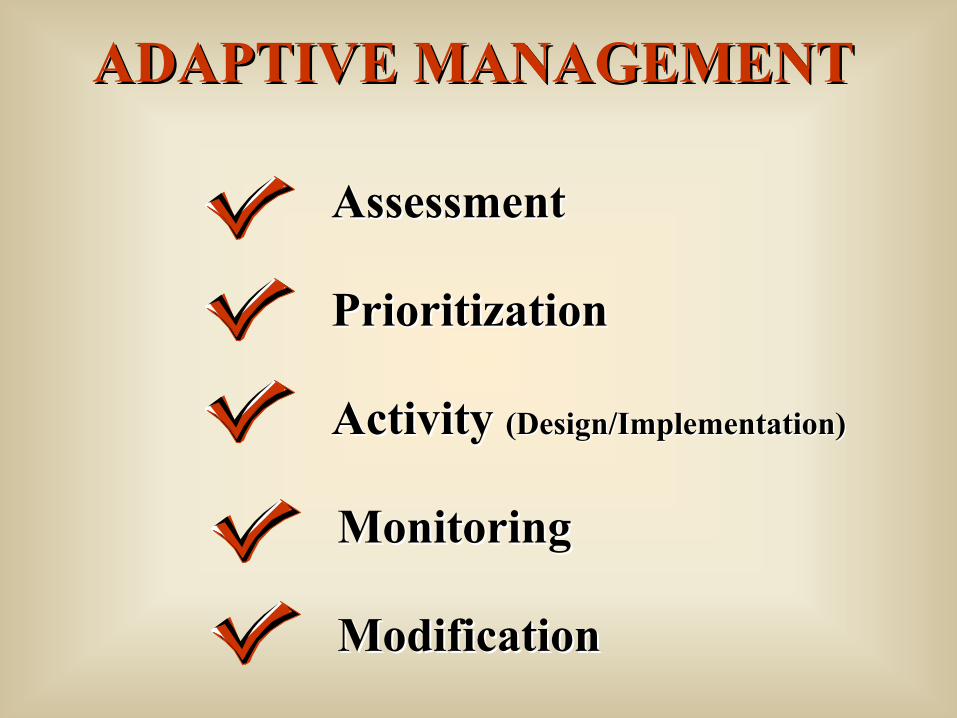
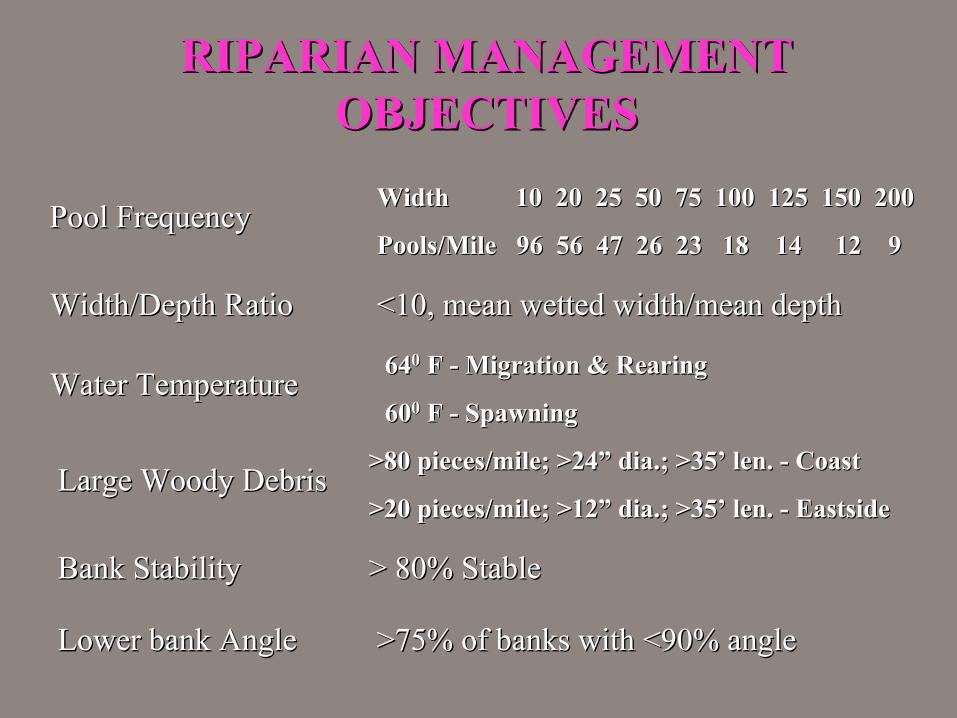
RIPARIAN MANAGEMENTRIPARIAN MANAGEMENT OBJECTIVESOBJECTIVES
Pool FrequencyPool Frequency
Width/Depth RatioWidth/Depth Ratio
Water TemperatureWater Temperature
Large Woody DebrisLarge Woody Debris
Bank StabilityBank Stability
Lower bank AngleLower bank Angle
WidthWidth 1010 2020 2525 5050 7575 100100 125125 150150 200200
Pools/MilePools/Mile 9696 5656 4747 2626 2323 1818 1414 1212 99
<10, mean wetted width/mean depth<10, mean wetted width/mean depth
646400 FF -- Migration & RearinMigration & Rearingg
606000 FF -- SpaSpawningwning
>80 pieces/mile; >24” dia.; >35’ len.>80 pieces/mile; >24” dia.; >35’ len. -- CoastCoast
>20 pieces/mile; >12” dia.; >35’ len.>20 pieces/mile; >12” dia.; >35’ len. -- EastsideEastside
> 80% Stable> 80% Stable
>75% of banks with <90% angle>75% of banks with <90% angle

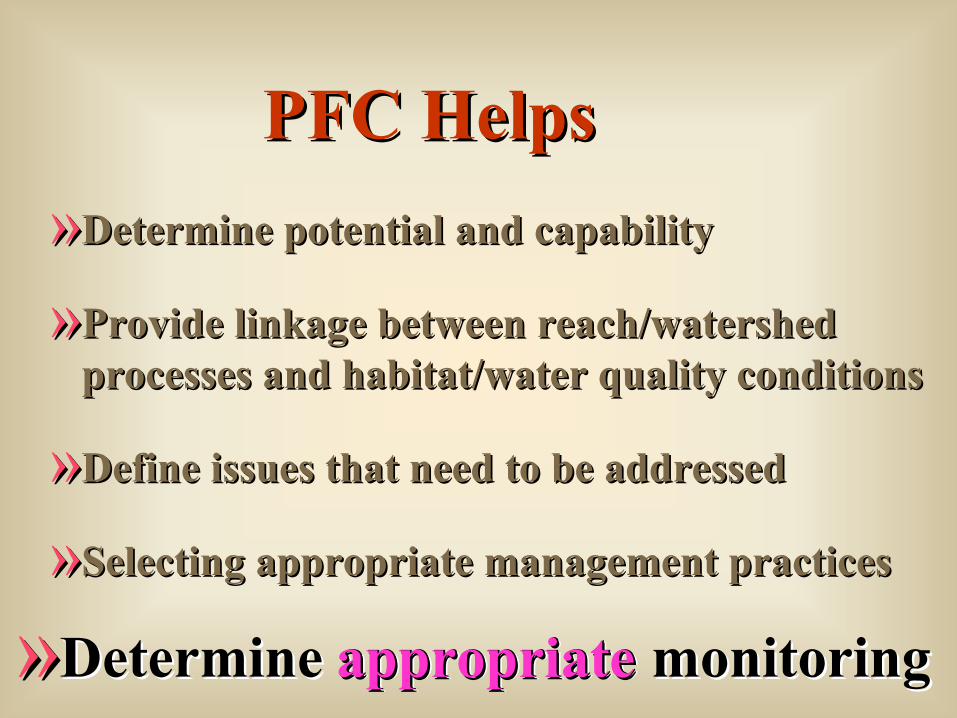
PFC HelpsPFC Helps »»Determine potential and capabilityDetermine potential and capability
»Provide linkage between reach/watershed processes and habitat/water quality conditions
»Define issues that need to be addressed
»Selecting appropriate management practices
»Determine appropriate monitoring

ADAPTIVE MANAGEMENTADAPTIVE MANAGEMENT
AssessmentAssessment
PrioritizationPrioritization
ActivityActivity
MonitoringMonitoring
WhyWhy
WhyWhy WhyWhy
WhyWhy
WhyWhy
WhyWhyWhyWhy WhyWhy
ResourceResource ConditionCondition

Moyer 2002
PFC does not necessarily equal Desired Condition
PFC

PFC HelpsPFC Helps »Determine potential and capability
»»Provide linkage between reach/watershedProvide linkage between reach/watershed processes and habitat/water quality conditionsprocesses and habitat/water quality conditions
»Define issues that need to be addressed
»Selecting appropriate management practices
»Determine appropriate monitoring

Water Quality (water temperature)Water Quality (water temperature)
Width:Depth RatioWidth:Depth RatioWidth:Depth RatioWidth:Depth Ratio
ShadingShading TopographicTopographic RiparianRiparianRiparianRiparian
InflowInflow Bank StorageBank StorageBank StorageBank Storage SpringsSprings Sub Surface FlowSub Surface Flow
In channelIn channel Adjacent slopesAdjacent slopes

88--AA 1122--1166--
2200--2244--
2288--
Difference in Air & Water TemperaturesDifference in Air & Water Temperatures Te
mpe
ratu
re (D
egre
es F
)Te
mpe
ratu
re (D
egre
es F
)
--4040
--2020 00
2020
4040
6060
8080
100100
ugug AugAug
AugAug
AugAug
AugAug
AugAug
AirAir WaterWater DifferenceDifference
Bear CreekBear Creek -- Central OregonCentral Oregon 19771977
DateDate

Difference in Air & Water TemperaturesDifference in Air & Water Temperatures Bear CreekBear Creek -- Central OregonCentral Oregon
19981998
00
2020
4040
6060
8080
100100
120120
77--AugAug
1111--AugAug
1515--AugAug
1919--AugAug
2323--AugAug
2727--AugAug
3131--AugAug
DateDate
Tem
pera
ture
Deg
rees
FTe
mpe
ratu
re D
egre
es F
AirAir WaterWater DifferenceDifference

Physical Habitat StructurePhysical Habitat Structure
»»»» DepthDepthDepthDepth »»»» VelocityVelocityVelocityVelocity »»»» Position In ChannelPosition In ChannelPosition In ChannelPosition In Channel
»»»» TurbulenceTurbulenceTurbulenceTurbulence »»»» ShapeShapeShapeShape
»»»» CoverCoverCoverCover

PFC
Non-functioning
Maxumum T emperature vs. Habitat Condition
NM P Sites - 1997
110
100
90
80
70
60
50
Hab
itat
(% r
efe
ren
ce)
Functioning at Risk
15 20 25 30
Se asonal Max im un 7 Day S tatistic (C)

ADAPTIVE MANAGEMENTADAPTIVE MANAGEMENT
AssessmentAssessment
PrioritizationPrioritization
ActivityActivity
MonitoringMonitoring
¾¾ Based on needBased on need
¾¾ Reach, watershed, basin scaleReach, watershed, basin scale


ADAPTIVE MANAGEMENTADAPTIVE MANAGEMENT
AssessmentAssessment
PrioritizationPrioritization
ActivityActivity
MonitoringMonitoring
¾¾ Designed to address the “why”Designed to address the “why” ¾¾ Reach, watershed, basin scaleReach, watershed, basin scale

PFC HelpsPFC Helps »»Determine potential and capabilityDetermine potential and capability
»»Provide linkage between reach/watershedProvide linkage between reach/watershed processes and habitat/water quality conditionsprocesses and habitat/water quality conditions
»»Define issues that need to be addressedDefine issues that need to be addressed
»»Selecting appropriate management practicesSelecting appropriate management practices
»»Determine appropriate monitoringDetermine appropriate monitoring

Natural Riparian ResourcesNatural Riparian Resources
VegetationVegetationSoil, LandscapeSoil, Landscape
WaterWater

AssessmentAssessment
PrioritizationPrioritization
ActivityActivity
MonitoringMonitoring
¾¾ Is the Resource Condition Improving?Is the Resource Condition Improving?¾¾ Is the activity ‘fixing” the “why”?Is the activity ‘fixing” the “why”?
ADAPTIVE MANAGEMENTADAPTIVE MANAGEMENT
¾¾ Is the Resource Condition Improving?Is the Resource Condition Improving?
Implement ActionImplement Action
Desired Resource Desired Resource ConditionsConditions
MonitorMonitor
RIPARIAN MANAGEMENTRIPARIAN MANAGEMENT OBJECTIVESOBJECTIVES
Pool FrequencyPool Frequency
Water TemperatureWater Temperature
Large Woody DebrisLarge Woody Debris
Bank StabilityBank Stability
Lower bank AngleLower bank Angle
Width/Depth RatioWidth/Depth Ratio
Width 10 20 25 50 75 100 125 150 200Width 10 20 25 50 75 100 125 150 200
Pools/Mile 96 56 47 26 23 18 14 12 9Pools/Mile 96 56 47 26 23 18 14 12 9
<10, mean wetted width/mean depth<10, mean wetted width/mean depth
646400 FF -- Migration & RearingMigration & Rearing
606000 FF -- SpawningSpawning
>80 pieces/mile; >24” dia.; >35’ len.>80 pieces/mile; >24” dia.; >35’ len. -- CoastCoast
>20 pieces/mile; >12” dia.; >35’ len.>20 pieces/mile; >12” dia.; >35’ len. -- EastsideEastside
> 80% Stable> 80% Stable
>75% of banks with <90% angle>75% of banks with <90% angle

1998
2003
2008
2013
2018
2023
2028
2033
2038
TimeTime
00
DecadesDecades
204320
4820
53
-
-
-
-
POWER CURVE
0
0. 2
0. 4
0. 6
0. 8
1
1. 2
Year
Pow
er
Width 10 20 25 50 75 100 125 150 200Width 10 20 25 50 75 100 125 150 200
Pools/Mile 96 56 47 26 23 18 14 12 9Pools/Mile 96 56 47 26 23 18 14 12 9
<10, mean wetted width/mean depth<10, mean wetted width/mean depth
646400 FF - Migration & RearingMigration & Rearing
606000 FF - SpawningSpawning
>80 pieces/mile; >24” dia.; >35’ len.>80 pieces/mile; >24” dia.; >35’ len. - CoastCoast
>20 pieces/mile; >12” dia.; >35’ len.>20 pieces/mile; >12” dia.; >35’ len. - EastsideEastside
RIPARIAN MANAGEMENT OBJECTIVESRIPARIAN MANAGEMENT OBJECTIVES
Pool FrequencyPool Frequency
Water TemperatureWater Temperature
Large Woody DebrisLarge Woody Debris
Bank StabilityBank Stability
Lower bank AngleLower bank Angle
Width/Depth RatioWidth/Depth Ratio
> 80% Stable> 80% Stable
>75% of banks with <90% angle>75% of banks with <90% angle
Implement ActionImplement Action
Desired ResourceDesired Resource ConditionsConditions
MonitorMonitor
¾¾ Is the Resource Condition Improving?Is the Resource Condition Improving?
ADAPTIVE MANAGEMENTADAPTIVE MANAGEMENT
AssessmentAssessment
PrioritizationPrioritization
ActivityActivity
MonitoringMonitoring
¾¾ Is the activity ‘fixing” the “why”?Is the activity ‘fixing” the “why”?
= Riparian Managem= Riparian ObjecObjectiv
VVee e.g. e.g.
Implement ActionImplement Action
Short Term IndicatorsShort Term Indicators
Rev
ise
Rev
ise
Mid Term IndicatorsMid Term Indicators
Rev
ise
Rev
ise
Ultimate ObjectivesUltimate Objectives
MonitorMonitor
MonitorMonitor
MonitorMonitor
ent Managementtives, e.g., temp, poolses, e.g., temp, pools
getative componentgetative componenta. Xa. X--section compositionsection compositionb. Woody recruitmentb. Woody recruitment
= - -
- - =
- = -
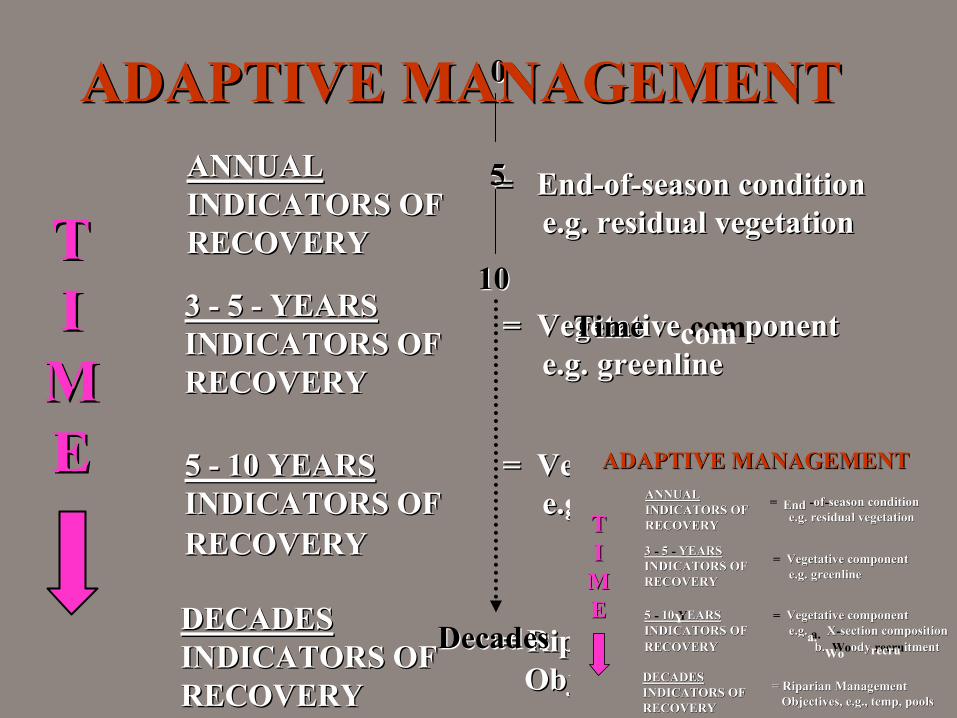
00ADAPTIVE MANAGEMENTADAPTIVE MANAGEMENT ANANNUNUALAL = 55= EndEnd--ofof--season conditionseason condition
CATOR OFININDIDICATORSS OF e.g. residual vege.g. residual vegeetatitationonTT RECOVRECOVEERYRY 1010
33 -- 55 -- YEAYEARRSSII CATOR OFININDIDICATORSS OF
MM RECOVRECOVEERYRY
EE 55 -- 10 YEA10 YEARRSS CATOR OFININDIDICATORSS OF
RECOVRECOVEERYRY
DECDECAADEDESS
== VVeeggeetativtativee comcom pponenonenttTimeTime e.g.e.g. ingreengreenllinee
ADAPTIVE MANAGEMENTADAPTIVE MANAGEMENT== ANNUALANNUAL = EndEnd -ofof-season c nditionseason coonditionINDICATINDICATORORS OS OFF e.g. residua vegetat one.g. residuall vegetatiionTT RERECCOOVVEERYRY
33 - 55 - YYEEARSARS getative cII = VVeegetative coommpponeonennttDICAT RS OININDICATOORS OFF
e.e.g.g. ggreenreenlineline
getative c
MM RERECOCOVVEERYRY
EE 55 - 1010 YY EEAARRSS = VVeegetative coommpponeonenntt ININDICATDICATOO S ORRS OFF e.g.e.g. a.a. XX-sect n cosectioion compmpoossititioionnDecadesDecades RERECOCOVVEERYRY bb.. WoWo ooddyy recrurecru ititmenmenttCATOR OFININDIDICATORSS OF
RECOVCADEDDEECADESS
me= Ri= Riparpariianan ManagManageemennttNDICAT RS OFIINDICATOORS OF , pRECOVEERYRY ObObjjectectivives, e.es, e.gg..,, tteempmp, poooollssRECORECOVVEERYRY
PFC HelpsPFC Helps »»Determine potential and capabilityDetermine potential and capability
»»Provide linkage between reach/watershedProvide linkage between reach/watershed processes and habitat/water quality conditionsprocesses and habitat/water quality conditions
»»Define issues that need to be addressedDefine issues that need to be addressed
»»Selecting appropriate management practicesSelecting appropriate management practices
»»Determine appropriate monitoringDetermine appropriate monitoringappropriateappropriate

Recovery RatesRecovery Rates NonNon--FunctionalFunctional
0
2
4
6
8
10
0 5 10 15 20 25 30 35 40 45 50
Time (yrs)
C o n d i t i o n
Herb. veg Woody veg Channel Water Qual WQS/RMOs PFC

DesiredDesiredCurrentCurrent FutureFutureConditionsConditions
ConditionsConditions

PFCPFC DesiredDesiredCurrentCurrent FutureFutureConditionsConditions
ConditionsConditions

SupportsPFCPFC does notdoes not equalequal
»» Desired Future Condition (DFC)Desired Future Condition (DFC)
SupportsPFCPFC does notdoes not replacereplace
»»Legal Requirements, e.g., ESA, CWALegal Requirements, e.g., ESA, CWA