
Relationship between Perceived and Actual Exertion and ...
48
James Madison University JMU Scholarly Commons Masters eses e Graduate School Spring 2018 Relationship between Perceived and Actual Exertion and Enjoyment of Exercise in Individuals with Autism Nicole Fiscella Follow this and additional works at: hps://commons.lib.jmu.edu/master201019 Part of the Laboratory and Basic Science Research Commons is esis is brought to you for free and open access by the e Graduate School at JMU Scholarly Commons. It has been accepted for inclusion in Masters eses by an authorized administrator of JMU Scholarly Commons. For more information, please contact [email protected]. Recommended Citation Fiscella, Nicole, "Relationship between Perceived and Actual Exertion and Enjoyment of Exercise in Individuals with Autism" (2018). Masters eses. 573. hps://commons.lib.jmu.edu/master201019/573
Transcript of Relationship between Perceived and Actual Exertion and ...

James Madison UniversityJMU Scholarly Commons
Masters Theses The Graduate School
Spring 2018
Relationship between Perceived and ActualExertion and Enjoyment of Exercise in Individualswith AutismNicole Fiscella
Follow this and additional works at: https://commons.lib.jmu.edu/master201019Part of the Laboratory and Basic Science Research Commons
This Thesis is brought to you for free and open access by the The Graduate School at JMU Scholarly Commons. It has been accepted for inclusion inMasters Theses by an authorized administrator of JMU Scholarly Commons. For more information, please contact [email protected].
Recommended CitationFiscella, Nicole, "Relationship between Perceived and Actual Exertion and Enjoyment of Exercise in Individuals with Autism" (2018).Masters Theses. 573.https://commons.lib.jmu.edu/master201019/573

Relationship between Perceived and Actual Exertion and Enjoyment of Exercise in
Individuals with Autism
Nicole Alyssa Fiscella
A thesis submitted to the Graduate Faculty of
JAMES MADISON UNIVERSITY
In
Partial Fulfillment of the Requirements
for the degree of
Master of Science
Department of Kinesiology
May 2018
FACULTY COMMITTEE:
Committee Chair: Dr. Thomas Moran
Committee Members/ Readers:
Dr. Janet Wigglesworth
Dr. Catherine McKay
ii
Dedication Page
I would like to dedicate my thesis to my family and friends who have supported me
throughout my journey. I would not be where I am without your constant support. I would
also like to thank my thesis advisor Dr. Moran for allowing me to be a part of Overcoming
Barriers during my time at JMU and opening up many doors for me.

iii
Acknowledgments
I would like to acknowledge my undergraduate research assistants who dedicated their time
each week for eight week to assist me with data collection. Thank you Jasmin, Emma,
Alex, Carder, Kelsey, Molly, and Brianna for all your help this semester with data
collection.

iv
Table of Contents
Dedication Page…………………………………………………………………………... ii
Acknowledgments………………………………………………………………………..iii
Table of Contents…………………………………………………………………………iv
List of Tables……………………………………………………………………………...v
Abstract…………………………………………………………………………...............vi
Chapter I…………………………………………………………………………...............1
Chapter II…………………………………………………………………………........... 10
Manuscript…………………………………………………………………………......... 16
Results…………………………………………………………………………................ 23
Discussion………………………………………………………………………….......... 28
References…………………………………………………………………………......... 32
Appendices…………………………………………………………………………......... 36

v
List of Tables
Table 1 Participant Characteristics…...……….…………………………………………23
Table 2 Program Activity Breakdown..….………………………………………………24
Table 3 Relationship between Extraneous Variables on Main
Variables.........................................………...……………………………………………25
Table 4 Correlation (r) between Main Variables..….……………………………………25
Table 5 Relationship of Enjoyment of Exercise and Perceived Exertion Across Activities
±SD………………………………………………………………………………………26
Table 6 Heart Rate Ranges for all Programs……….……………………………………27

vi
Abstract
Fiscella, N.A., Moran, T.E., Wigglesworth, J.K., and McKay, C.A. Relationship between
Perceived and Actual Exertion and Enjoyment of Exercise in Individuals with Autism.
Purpose: The purpose of this study was to examine the relationship between perceived
exertion, actual exertion and enjoyment of exercise in individuals with Autism Spectrum
Disorder (ASD). Methods: A total of 16 participants (12 males and 4 females) between
the ages of 5 and 38 who were diagnosed with ASD participated in the study. The
intervention lasted 10 weeks and consisted of participation in one of James Madison
University’s Overcoming Barriers hour long physical activity programs. Heart rate,
perceived exertion, and enjoyment of exercise were measured following three exercises
during the program. Results: There was no relationship between the three main variables
however, a significant relationship, was found between exercise exertion and perceived
exertion r = -0.151 (p = 0.66) and between enjoyment of exercise compared to perceived
exertion r = 0.23 (p < 0.05). Conclusion: Consistent with the literature, participants are
more likely to participate in exercises they enjoy, in addition we found hunger was related
to both perceived exertion as well as with enjoyment of exercise. Further research still
needs to be done between hunger and perceived exertion and enjoyment of exercise.
Keywords: AUTISM, PERCEIVED EXERTION, ACTUAL EXERTION,
ENJOYMENT, EXERCISE.

1
Chapter I
Introduction
Autism Spectrum Disorder (ASD) is a neurodevelopmental condition affecting 1 in
68 children in the United States making it the most prevalent neurological disorder in youth
(Christensen et al., 2016; Prupas & Reid, 2001). ASD is diagnosed by the individual’s
psychologist or psychiatrist using the Diagnostic and Statistical Manual of Mental
Disorders (DSM-V) Diagnostic Criteria (American Psychiatric Association, 2013). Prior
to the release of the DSM-V, those diagnosed under the DSM-IV with Asperger’s or
pervasive developmental disorder not otherwise specified have now been given the
diagnosis of ASD. There are five criteria the individual must display to be diagnosed with
ASD: (1) persistent deficits in communication/social interaction, (2) restricted or repetitive
behaviors, (3) symptoms present early in development, (4) clinically significant
impairments in social/occupational behavior and (5) behaviors that cannot be explained by
intellectual disability or other delays (Robbins, Pis, Pender, & Kazanis, 2004).
Movement Behaviors Among Individuals with Autism
While defining features of ASD focus on social impairment, individuals with ASD
may also exhibit poor motor development which can be categorized as “associated
symptoms” (Green et al., 2009; Moore et al., 2009; Strath et al., 2000). Areas of poor motor
development include upper and lower body coordination, which affect the individual’s
ability to perform dexterity related tasks and/or balance, agility and speed related activities
(Green et al., 2009; Ming, Brimacombe, & Wagner, 2007; Strath et al., 2000). Studies have
also shown that individuals with ASD have displayed deficits in gross and fine motor
movements, such as postural control, clumsiness, and reach-to-grasp movement. These
motor deficits are present as early as two to three years old and have the potential to

2
influence future activities based on the development of motor patterns. In the subsequent
paragraphs, this manuscript will outline how motor success, as well as motor deficits, can
have a positive or negative impact on individual’s enjoyment, perceived exertion, and
actual exertion during activity.
Enjoyment of Physical Activity
Research indicates the development of motor skills i.e. locomotor, object control,
etc. will either positively or negatively affect the individual's perception of competency
and, therefore, influence participation, enjoyment, and exertion in any given exercise
(Stanish et al., 2015). These perceptions can be tied to the development of their motor skills.
In children, fundamental motor skills, i.e. locomotor and object control skills such as
running, galloping and skipping, form the foundation for the child's future movement
(Obrusnikova & Cavalier, 2011). A study conducted by Stanish et al. (2015) compared
enjoyment, barriers, and beliefs about physical activity (PA) among adolescents with and
without ASD. Results indicated a higher number of adolescents with ASD perceived certain
activities as too hard to learn compared to their typically developing peers (16% vs. 0%),
bringing up the question, was their lack of competency negatively influenced by their
enjoyment of the activity?
Additionally, when comparing self-efficacy (the idea that the abilities one possesses
will influence their overall behavior) and enjoyment prior to, during, and after a bout of PA
in typically developing adolescents, attitudes prior to the start of PA positively or
negatively influenced enjoyment of the activity (Dishman et al, 2005; Robbins et al., 2004).
Subjects in a study conducted by Robbins et al. (2004), were asked to rate their enjoyment
during PA using the Physical Activity Enjoyment Scale (PACES) (Robbins et al., 2004).

3
In particular, Caucasian females and African American males had negative self-efficacy
prior to the activity resulting in a lack of enjoyment. It can be theorized negative self-
efficacy coupled with poor motor development can lead to an overall dissatisfaction with
PA. Another study examining the effect of self-efficacy on enjoyment of exercise
conducted by Moore et al. (2009) measured enjoyment of PA in 617 elementary school
children. Enjoyment was measured using the revised PACES while PA was measured using
The Physical Activity Questionnaire for Older Children. When age was controlled,
Caucasians enjoyed PA more than African American children (SE = .06 vs. SE = .04) which
support the results from Robbins et al.’s study (2004) (Moore et al., 2009). Just as self-
efficacy and perception of competency can influence enjoyment of exercise so can mood.
There is a high prevalence of depression and anxiety among individuals with ASD
compared to typically developing individuals, especially among those aged 9 - 14 (Kim,
Szatmari, Bryson, Streiner, & Wilson, 2000; Matson & Williams, 2014). Previous studies
assessed the negative implication and prevalence of depression/anxiety in individuals with
ASD finding (1) mood disorders such as anxiety and depression can lead to language and
social impairments, stereotypic behaviors and behavioral rigidity (Pine, Guyer, Goldwin,
Towbin, & Leibenluft, 2008), (2) extroversion and conscientiousness are lower in
individuals with Asperger’s (Kanai et al., 2011), (3) of 1390 children, 233 had high
functioning ASD and of that, 43 reported depression; 42% of the children had low
functioning ASD and depression (Mayes, Calhoun, Murray, Ahuja & Smith, 2011), (4) out
of 54 males and females with Asperger’s, 50% had recurring episodes of depression over
the course of a year while 70% only experienced one episode (Lugnegard, Hallerback, &
Gillberg, 2011), (5) out of 95 children diagnosed with ASD, 44% were borderline clinically

4
depressed and 56% were diagnosed with anxiety (Strong et al., 2012). In individuals with
intellectual disabilities and those with diagnosed depression, exercise improved symptoms
(Carraro & Gobbi, 2014).
Perceived Exertion Assessment During Physical Activity
Enjoyment of exercise can be influenced by perceived exertion, i.e. one’s
interpretation on their level of exertion during exercise/physical activity. More specifically,
perceived exertion typically describes strains and fatigue of the muscles, cardiovascular
and pulmonary systems during exercise (Groslambert & Mahon, 2006).
There are numerous scales available to assess perceived exertion across all ages
during exercise (Borg, 1982; Mahon, Gay, & Stolen 1998; Yelling, Lamb, & Swaine,
2002). One commonly used and accepted method of assessing exercise intensity for adults
is the Borg’s Rating of Perceived Exertion (RPE) which measures perceived exertion by
utilizing a range of 6 to 20, with a 6 corresponding to a heart rate of approximately 60
beats·min-1 (Borg, 1982; Yelling et al., 2002). This scale includes descriptors such as “very,
very light” or ‘somewhat hard” to create a more categorical scale and is used across the
globe as an easy and effective way to measure intensity. While this scale is appropriate for
adults (the population which it was tested on), it is not appropriate for children and
adolescents due to their lower level of cognitive development (Groslambert & Mahon,
2006). To correct for this, the Pictorial Children’s Effort Rating Table (PCERT) was
developed (Lamb & Eston, 1997). The scale replaces descriptors, such as ‘hard’ and ‘light’
with stick figures depicting the various stages. Additionally, the PCERT has five fewer
responses to select from which makes comprehension easier. According to Lamb and

5
Eston, (1997) one’s ability to comprehend their level of perception is influenced by their
experience with exercise.
Yelling et al. (2002) completed a study examining the validity of a pictorial
perceived exertion scale (PCERT) on 104 typically developing middle school children who
completed developmentally appropriate activities such as relay running, soccer, and
netball. For both males and females across age groups (8- 15) the pictorial perceived
exertion scale was accurate in matching perceived exertion with actual exertion levels.
More specifically, in females, HR across three levels of physical activity were significantly
correlated with PCERT scores (p <.05, 0.54 – 0.87), whereas with males, there was only
significance with the first stage of activity (p = 0.54). Furthermore, results showed the
younger children had higher heart rates compared to the older children and females had
higher heart rates compared to their age-matched males. Other commonly utilized scales
for children include Cart and Load Effort Rating Scale and the Children’s OMNI Scale of
Perceived Exertion both of which were tested using typically developing children.
No studies thus far have examined the effectiveness of these scales in individuals
with ASD as they are too complex for these individuals to comprehend. With many of these
RPE scales, i.e. PCERT and OMNI, the subject is given a range or a series of pictures and
asked to select the number or picture that most represents their level of exertion. Individuals
with ASD, when faced with open-ended questions such as selecting how they feel on a
scale, may repeat the question verbatim or provide and irrelevant response (Capps, Kehres,
and Sigman, 1998). When children with ASD were compared to age-matched children and
asked a series of direct and open-ended questions the children with ASD were less likely
to respond to an open-ended question than a direct one (Capps, Kehres, & Sigman, 1998).

6
While these scales (CERT and OMNI) are useful for a specific population (generally
because they have been extensively tested and validated with that population) they are not
ideal in their current form for the population of interest (individuals with ASD). By
reducing the number of responses (a positive of the PCERT) and utilizing closed-ended
questions, someone with ASD can better understand and appropriately answer the question.
Actual Exertion During Physical Activity
While RPE and pictorial scales are used to assess perceived exertion, heart rate
(HR) is one of the most common ways to assess levels of PA as it is an inexpensive,
noninvasive method that provides an index of absolute and relative intensity of the activity
being performed (Schmitz et al., 2017; Ueda & Kurokawa, 1991). One study in particular
conducted by Strath et al. (2000) examined the relationship between HR and maximal
oxygen consumption or (VO2max) during field and lab-based moderate-intensity activities.
Sixty-one males and females aged 19 - 74 were given one of seven moderate intensity
activities to perform at home and in the lab. Heart rate was measured via Polar HR
monitors. Results indicated HR took approximately two to three minutes to increase to a
rate representative of the activity being performed. Additionally, HR was shown to be
moderately correlated to VO2max (Strath et al., 2000). While a majority of studies have
examined the relationship HR has to exertion levels on land, one study by Ueda and
Kurokawa was conducted on children aged 10 - 12 in the pool while still finding a linear
relationship between HR and VO2max (Ueda et al., 1991). HR is commonly used in lieu of
VO2max as they are both effective indicators of intensity with HR being more cost-effective
and timely (Hui & Chan, 2006). In studies using both children and adults, HR is nearly
always closely related to exercise VO2max allowing the linear relationship between the two

7
to be used to prescribe exercise for any population using HR to monitor/measure intensity
(Hui & Chan, 2006).
Physical Activity Among Individuals With Autism
The physical activity level of individuals with ASD is influenced by many factors
and variables. In the aforementioned study conducted by Stanish et al. (2015) barriers to
PA were examined for typically developing children as well as children with ASD. The
most commonly expressed barriers across individuals with ASD ages 13-21 were being too
busy, exercise was not engaging enough, risk of injury, and outside temperature (Stanish
et al., 2015). These barriers have been noted as ones that limit individuals with ASD’s
participation in the recommended 60 minutes per day of moderate to vigorous PA (Stanish
et al., 2015). It is well documented that individuals with ASD are more inactive than
typically developing children (MacDonald, Esposito, & Ulrich, 2011; Obrusnikova &
Cavalier 2011; Pan, 2004). The relationship between barriers and facilitators of after-school
PA programs were examined to see if PA patterns were influenced by any of the above
barriers, i.e. TV watching, listening to music, disinterested in activity, etc. (Obrusnikova &
Cavalier, 2011). Males and females ages 8 - 14 with ASD were recruited for the study.
Participants received an accelerometer and questionnaire to fill out regarding time spent
being active or inactive following a school day. Top barriers reported were: playing video
games (27%), watching TV or listening to music (14%), too tired (14%), and bored with
exercise (14%). While these individuals noted they did not have time to partake in PA or
sports-related activities, many made time in their schedule after school to sit and play video
games or watch TV. Those that did participate in moderate to vigorous PA did so because
exercise equipment was readily available.

8
Time spent sedentary not only presents a barrier but can also negatively influence
behaviors. Stereotypic and self-stimulatory behaviors are repetitive behaviors that youths
with ASD often display, though the specific behaviors and their severity can vary from
child to child (Schmitz et al., 2017). Stereotypic and self-stimulatory behaviors include but
are not limited to, repetitive speech, hand flapping, body rocking, agitation when straying
from routine, and spinning in circles (Rapp et al., 2004). Aerobic exercise has been shown
to be highly effective in reducing stereotypic behaviors in addition to providing other health
benefits associated with exercise and increasing learning behavior after exercising
(Bahrami et al., 2012). Schmitz et al. (2017) conducted a study on the effects of exercise
dose on stereotypical behaviors in children with Autism. Subjects (N = 7) completed low
or high-intensity exercise for either 10 or 20 minutes on a treadmill, bike, or elliptical
machine. Self-stimulatory behaviors were monitored pre- and post-exercise in a control
room. Reductions in self-stimulatory behaviors were observed following shorter duration
lower intensity exercise compared to baseline up to an hour post-exercise. However,
adverse effects were seen following longer duration and higher intensities.
In a study conducted by Prupas and Reid, (2001) the effects of a single bout of 10-
minute moderate intensity walking/jogging compared to three 10-minute walk/jog sessions
were examined. Following the intervention, participants returned to the classroom where
their stereotypic behaviors were observed for 15-minutes. Between the single frequency
session and the multiple frequency sessions, stereotypic behaviors were reduced by a mean
of 7.3%. These findings lend themselves to the impact frequency has on reducing
stereotypic behaviors over a longer period. Results showed the effectiveness of repeated
bouts throughout the day in reducing behaviors at various time points more so than a single

9
bout. While these bouts of exercise are effective in reducing behaviors, further research
needs to be done to explore the activities that individuals with ASD not only enjoy
participating in but that also, demonstrate high levels of exertion in order to receive health
and wellness benefits.
Purpose of the Study
Therefore, the purpose of this study is to determine if there is a relationship between
exercise enjoyment, perceived exertion, and actual exertion levels in individuals with ASD.
It was hypothesized that as enjoyment scores for activities increased, both actual and
perceived exertion levels would decrease.
Significance
Findings of this study will benefit individuals with ASD as well as the
parent’s/guardians of individuals with ASD and allow professionals, as well as families, to
understand the feelings of individuals with ASD toward physical activity. Additionally,
findings will allow the researcher to provide a list of potential activities participants found
to be enjoyable while also increasing one’s heart rate to a moderate to vigorous level. The
results from this study will allow schools and communities to better understand how
individuals with ASD perceive exercise and how it relates to their enjoyment and exertion.
The findings will be beneficial to educators as well as community-based instructors as our
schools and communities attempt to become more inclusive in the programs being offered.
As the number of individuals diagnosed with ASD continues to increase along with their
likelihood of sedentary behavior and increased risk of obesity, there is a need for effective
physical activity programming (MacDonald, Esposito, & Ulrich, 2011).

10
Chapter II
Methods
Subjects
Thirty-one children and adults aged 5 - 38 years diagnosed with ASD were recruited
for the study through James Madison University’s Overcoming Barriers program. Of the
30 recruited, 16 were eligible. Written informed consent was obtained from
parents/guardians of the participants after obtaining verbal assent from children before
beginning the study. Participants 18 and older completed consent for individuals with
diminished capacities which presented the information at an appropriate comprehension
level (see Appendix A). The research design was approved by the James Madison
University's institutional review board. Subjects were recruited using the following
selection criteria: males and females, 5 - 40 years of age, an ASD classification based on
physician or psychologist/psychiatrist diagnosis using DSM-V criteria, primary diagnosis
of ASD with no other diagnosis of an intellectual disability, able to verbally or visually
(through picture communication) respond to basic questions on mood and enjoyment of
exercise, and be enrolled in at least one physical activity program through Overcoming
Barriers.
Research Design
Participants participated in at least one Overcoming Barriers physical activity
program i.e. master’s aquatics, Saturday aquatics (see Appendix B), fitness, basketball (see
Appendix C), I Can Do It, You Can Do It!, and kidnastics. Each program lasted one hour.
Participants were asked a series of pre- and post-exercise questions, which took no longer
than 10 minutes total. Upon arrival to the program, participants were asked a series of

11
questions regarding their day and current mood in addition to gathering resting heart rate
via radial pulse and pulse oximeters (see Appendix D). Participants were then asked two,
two-tiered questions regarding their enjoyment of the exercise and their perceived exertion.
Two different brands of pulse oximeter were used FaceLake FL400 (FaceLake, Lake Bluff,
IL) and Zacurate Pro Series 500Dl Fingertip Pulse Oximeter (Einstein Associates LLC,
Stafford, TX) and calibrated weekly prior to testing participants in order to ensure there
was no difference between heart rate readings
Pilot Testing
Prior to the start of data collection, a 10-week pilot study was conducted on five
subjects with varying degrees of intellectual disabilities such as Autism and Down
Syndrome. This study was used to develop an initial draft of the questionnaire and modify
it based on the PACES which was developed and tested on typically developing individuals
(More et al., 2009). The PACES was modified from the Children’s Understanding of
Exercise Scale (CUES) which was tested in a prior pilot study (Moran, 2017). This pilot
study began with the CUES going through four rounds of modifications. These
modifications were made to correct for readability by the data collector and question
comprehension by the participant as the researcher was finding participants were struggling
to provide valid and reliable responses giving no rationale for why they selected what they
did. The questionnaire used in this study was simplified from the CUES to the point where
the participant could comprehend the question while providing a more appropriate answer.

12
Protocol
Once participants enrolled in an Overcoming Barriers physical activity program of
their choosing, they were assigned a research assistant (who were trained by the main
researcher) for the duration of the eight weeks. Research protocol was as follows, when
participants arrived to program, their assigned research assistant would sit them down and
verbally asked them a series of questions regarding mood followed by taking resting heart
rate. Questions included, what were you doing prior to arriving to program, if they were
hungry or tired, and what their mood was. Depending on the program they enrolled in, the
activities performed differed, for example, basketball focused on shooting, passing, and
dribbling while freestyle, breaststroke, and backstroke were the foci of swimming.
Regardless of the activities performed, all participants were asked the same series of
questions at the same time point throughout their program (following the first, third, and
fifth activity) (see Appendix B). Once the initial questions were asked and the program
began, participants then engaged in the first activity with questions regarding enjoyment
of activity (question one on page two of data sheet – see Appendix D) and perceived
exertion (questions two) asked after completion of the activity. Post-activity heart rate was
also gathered via pulse oximeter using FaceLake FL400 (FaceLake, Lake Bluff, IL) and
Zacurate Pro Series 500Dl Fingertip Pulse Oximeter (Einstein Associates LLC, Stafford,
TX). The activities the participant engaged in from week to week varied, which allowed
the researcher to see the participants reposes across activities and across the same chosen
exercise from week to week.

13
Instruments
Extraneous Variables.
Additional variables collected prior to the start of each program include – mood
prior to exercise, what the participant was doing prior to the start of the program, and if
they were tired and/or hungry. This information was collected in order to account for any
confounding effects they may have on the primary variables of interest.
Actual Exertion.
The accuracy of pulse oximeters was tested by Iryiboz, Powers, Morrow, Ayers,
and Landry (1991) in males during treadmill running and cycling. When working at less
than 89% of VO2max the pulse oximeters were accurate in measuring heart rate when
compared to ear probes. All subjects worked at less than 89% of VO2max during the current
study (based on heart rate reserve calculations). When calculating their heart rates, the
researcher was able to determine their age-predicted max heart rate. Because resting heart
rate and age were gathered age predicted max heart rate was calculated using the Karvonen
heart rate reserve equation, it was determined not all subjects worked less than 89% of their
calculated target heart rate range (Camarda et al., 2008). Post-activity heart rate was
gathered via pulse oximeter using FaceLake FL400 (FaceLake, Lake Bluff, IL) and
Zacurate Pro Series 500Dl Fingertip Pulse Oximeter (Einstein Associates LLC, Stafford,
TX).

14
Enjoyment of Exercise.
Participants were asked a two-tiered question regarding enjoyment of exercise. The
question asked if they liked or disliked the exercise. The participants were then asked to
rate their enjoyment using a 4-part Likert scale (see Appendix D).
Perceived Exertion.
Participants were asked a two-tiered question regarding perceived exertion. Tier
one asked if they perceived the exercise as easy or hard. Tier two was a 4-part Likert scale
anchored by whether the exercise was perceived as too hard on one end and too easy on
the other (see Appendix D).
Statistical Analysis
Descriptive statistics were computed for each variable (actual exertion, perceived
exertion, and enjoyment of exercise). There were 258 individual bouts of activity across
16 participants. Each activity and the subsequent data collected was viewed and analyzed
as independent data points (as each participant’s heart rate, perceived exertion, and
enjoyment varied by specific exercise or activity, thus supporting the notion that each
should be treated independently). The level significance was tested at p < 0.05. Simple
linear regression was used to study the relationship between the response variable and the
predictor (Chatterjee and Hadi, 2013). Each main variable, perceived exertion, actual
exertion, and enjoyment of exercise acted as both the response variable and predictor.
There were three individual correlations analyzed; (1) Actual exertion (HR) to perceived
exertion (easy/hard); (2) actual exertion (HR) to enjoyment (like/dislike); and (3) perceived

15
exertion (easy/hard) to enjoyment (like/dislike). Analysis was completed using SPSS 24
statistical software (IBM, 2016).

16
Chapter III
Manuscript
Relationship between Perceived and Actual Exertion and Enjoyment of Exercise
in Individuals with Autism
Abstract:
Fiscella, N.A., Moran, T.E., Wigglesworth, J.K., and McKay, C.A. Relationship between
Perceived and Actual Exertion and Enjoyment of Exercise in Individuals with Autism.
Purpose: The purpose of this study was to examine the relationship between perceived
exertion, actual exertion and enjoyment of exercise in individuals with Autism Spectrum
Disorder (ASD). Methods: A total of 16 participants (12 males and 4 females) between
the ages of 5 and 38 who were diagnosed with ASD participated in the study. The
intervention lasted 10 weeks and consisted of participation in one of James Madison
University’s Overcoming Barriers hour long physical activity programs. Heart rate,
perceived exertion, and enjoyment of exercise were measured following three exercises
during the program. Results: There was no relationship between the three main variables
however, a significant relationship, was found between exercise exertion and perceived
exertion r = -0.151 (p = 0.66) and between enjoyment of exercise compared to perceived
exertion r = 0.23 (p < 0.05). Conclusion: Consistent with the literature, participants are
more likely to participate in exercises they enjoy, in addition we found hunger was related
to both perceived exertion as well as with enjoyment of exercise. Further research still
needs to be done between hunger and perceived exertion and enjoyment of exercise.
Keywords: AUTISM, PERCEIVED EXERTION, ACTUAL EXERTION,
ENJOYMENT, EXERCISE.
Introduction
Autism Spectrum Disorder (ASD) is the most common neurological disorder
diagnosed by psychologist or psychiatrist using the Diagnostic and Statistical Manual of
Mental Disorders 5th Edition, in the U.S. affecting 1 in 68 children (American Psychiatric
Association 2013; Christensen et al., 2016; Prupas and Reid, 2001). While defining
features of ASD focus on social impairment, individuals with ASD may also exhibit poor
motor development (Green et al., 2009; Moore et al., 2009’ Strath et al., 2000). These area
of poor motor development (present as early as two years old) include poor upper and lower

17
body coordination which negatively affect the individual’s ability to perform dexterity
related tasks and/or balance and speed related activities (Green et al, 2009; Ming et al.,
2007; Strath et al., 2000). In children, fundamental motor skills, i.e. locomotor and object
control form the foundation of the child’s future movement (Obrusnikova & Cavalier,
2011). Development of these motor patterns can play a major role in the individuals
engagement in activities. Enjoyment, barriers, and beliefs about physical activity (PA)
among adolescents with and without ASD was examined by Stanish et al. (2015). Results
indicated a higher number of adolescents with ASD perceived certain activities as too hard
to learn, bringing up the question, was their lack of competency in the activity negatively
influenced by their enjoyment. Furthermore, self-efficacy and enjoyment of exercise were
compared in a study by Moore et al. (2009) in 617 elementary school children using the
revised Physical Activity Enjoyment Scale (PACES) and The Physical Activity
Questionnaire for Older Children. Results showed a negative self-efficacy prior to exercise
resulted in a lack of enjoyment.
Just as self-efficacy and perception of competency can influence enjoyment of
exercise so can mood. Individuals with ASD are more likely to suffer from depression and
anxiety compared to typically developing individuals, especially those aged 9 - 14 (Kim et
al., 2000; Matson et al., 2014). Exercise has been shown to improve symptoms associated
with anxiety and depression (Carraro and Gobbi, 2014).
There are numerous scales available to assess perceived exertion, i.e. one’s
interpretation on their level of exertion during exercise/physical activity focusing on
fatigue of the muscles, cardiovascular and pulmonary systems (Groslambert and Mahon,
2006). While the Borg’s Rating of Perceived Exertion is a commonly utilized method for

18
assessing intensity it is not appropriate for children or individuals with ASD due to their
lower level of cognitive development (Borg, 1982; Yelling et al., 2002; Groslambert and
Mahon, 2006). As a result, the Pictorial Children’s Effort Rating Table (PCERT) which
replaces descriptors with stick figures and has five fewer responses to select from allowing
for easier comprehension. While these scales have been tested and validated in typically
developing individuals, no study has examined their effectiveness in individuals with ASD.
Furthermore, individuals with ASD are less likely to respond to an open ended question
than a direct one making it all the more imperative to develop a perceived exertion scale
they are able to comprehend and answer (Capps, Kehres, and Sigman, 1998).
RPE and perceived exertion scales are used to assess perceived exertion, heart rate
(HR) is one of the most common ways to assess actual levels of PA as it is an inexpensive
way of providing absolute and relative intensity (Schmitz et al., 2017; Ueda et al., 1991).
While bouts of exercise are effective in reducing behaviors (Stanish et al., 2015),
further research needs to be done to explore the specific activities individuals with ASD
not only enjoy participating but allow for high levels of exertion in order to receive health
and wellness benefits. Therefore, the purpose of this study is to determine if there is a
relationship between exercise enjoyment, perceived exertion, and actual exertion levels in
individuals with ASD. It was hypothesized that as enjoyment scores for activities
increased, both actual and perceived exertion levels would decrease.
Methods
Subjects
Thirty-one children and adults aged 5 - 38 years diagnosed with ASD were recruited
for the study through James Madison University’s Overcoming Barriers program. Written

19
informed consent was obtained from parents/guardians of the participants after obtaining
verbal assent from children before beginning the study. Participants 18 and older completed
consent for individuals with diminished capacities which presented the information at an
appropriate comprehension level (see Appendix A). The research design was approved by
the James Madison University's institutional review board. Subjects were recruited using
the following selection criteria: males and females, 5 - 40 years of age, an ASD
classification based on physician or psychologist/psychiatrist diagnosis using DSM-V
criteria, primary diagnosis of ASD with no other diagnosis of an intellectual disability, able
to verbally or visually (through picture communication) respond to basic questions on
mood and enjoyment of exercise, and be enrolled in at least one physical activity program
through Overcoming Barriers.
Research Design
Within Overcoming Barriers in the Spring 2018 semester there were 30 of
individuals with a primary diagnosis of ASD with 16 (12 male, 4 female) being eligible for
participation. All 16 agreed to participate.
Subjects participated in at least one Overcoming Barriers physical activity program
i.e. master’s aquatics, Saturday aquatics, fitness, basketball, I Can Do It! (ICDI), and
kidnastics. Each program lasted one hour. Participants were asked a series of pre- and post-
exercise questions, which took no longer than 10 minutes total. Upon arrival to the
program, participants were asked a series of questions regarding their day and current mood

20
in addition to gathering resting heart rate via radial pulse and pulse oximeters (see
Appendix D). Participants were then asked two, two-tiered questions regarding their
enjoyment of the exercise and their perceived exertion. Two different brands of pulse
oximeter were used and calibrated weekly prior to testing participants in order to ensure
there was no difference between heart rate readings.
Pilot Testing
Prior to the start of data collection, a 10-week pilot study was conducted on five
subjects with varying degrees of intellectual disabilities such as Autism and Down
Syndrome. This study was used to develop an initial draft of the questionnaire and modify
it based on the PACES which was developed and tested on typically developing
individuals. The PACES was modified for to the Children’s Understanding of Exercise
Scale (CUES) which was tested in a prior pilot study. This pilot study began with the CUES
going through four rounds of modifications. These modifications were made to correct for
readability by the data collector and question comprehension by the participant as the
researcher was finding participants were struggling to provide valid and reliable responses
giving no rationale for why they selected what they did. The current questionnaire was
simplified to the point where the participant could comprehend the question while
providing a more appropriate answer.
Protocol
Ten undergraduate research assistants completed a 30-minute training session led
by the researcher on administration of the questionnaire and how to monitor heart rate.

21
Each research assistant was assigned a participant to work with throughout the duration of
the study. A typical program had anywhere from six to ten activities throughout the
program. For example in the aquatic program began with a warm-up before completing:
(1) 300-meter freestyle, (2) treading water three times for 30 seconds, (3) 300-meter
backstroke, (4) 300-meter kicking with kickboard, (5) ten streamlines off the wall, (6) 300-
meter breaststroke and (7) treading water three times for 30 seconds. Questionnaires were
given following the first, third and fifth activity within each program.
Instruments
Extraneous Variables.
Several extraneous variables were collected prior to the start of each program in
order to account for any confounding effects they may have had on the primary variables
of interest. These extraneous variables included mood prior to exercise, what the
participant was doing prior to the start of the program, and if they were tired and/or hungry
(see Appendix D).
Actual Exertion.
Post-activity heart rate was gathered via pulse oximeter using FaceLake FL400
(FaceLake, Lake Bluff, IL) and Zacurate Pro Series 500Dl Fingertip Pulse Oximeter
(Einstein Associates LLC, Stafford, TX).
Enjoyment of Exercise.

22
Participants were asked a two-tiered question regarding enjoyment of exercise. The
question asked if they liked or disliked the exercise. The participants were then asked to
rate their enjoyment using a 4-part Likert scale (see Appendix D).
Perceived Exertion.
Participants were asked a two-tiered question regarding perceived exertion. Tier
one asked if they perceived the exercise as easy or hard. Tier two was a 4-part Likert scale
anchored by whether the exercise was perceived as too hard on one end and too easy on
the other (see Appendix D).
Statistical Analysis
Descriptive statistics were computed for each variable (actual exertion, perceived
exertion, and enjoyment of exercise). There were 258 individual bouts of activity across
16 participants. Each activity and the subsequent data collected was viewed and analyzed
as independent data points (as each participant’s heart rate, perceived exertion, and
enjoyment varied by specific exercise or activity, thus supporting the notion that each
should be treated independently). The level significance was tested at p < 0.05. Simple
linear regression was used to study the relationship between the response variable and the
predictor (Chatterjee and Hadi, 2013). Each main variable, perceived exertion, actual
exertion, and enjoyment of exercise acted as both the response variable and predictor.
There were three individual correlations analyzed; (1) Actual exertion (HR) to perceived
exertion (easy/hard); (2) actual exertion (HR) to enjoyment (like/dislike); and (3) perceived

23
exertion (easy/hard) to enjoyment (like/dislike). Analysis was completed using SPSS 24
statistical software (IBM, 2016).
Results
Sixteen participants with a primary diagnosis of ASD (12 males, 4 females)
between the ages of 5 and 38 completed the study. A summary of participant characteristics
are listed in Table 1. Target heart rate ranges were calculated for 60 – 75% of age-predicted
maximal heart rate using the Karvonen heart rate reserve equation (Camarda et al., 2008).
Table 1. Participant Characteristics (N=16)
Age (years) Gender Target Heart Rate
Range (bpm)
Age-Predicted Max
Heart Rate (bpm)
5 Male 157 - 178 215
8 Female 167 – 179 212
9 Male (n=3) 158 – 178 211
10 Male 163 - 180 210
11 Female 163 – 180 209
12 Female 148 – 171 208
15 Male (n=2) 147 – 168 205
18 Male 150 – 169 202
19 Male (n=2) 154 – 171 201
26 Male 152 – 168 194
28 Male 153 – 166 192
38 Female 134 – 172 182

24
Below are the programs participants could voluntarily enroll in within Overcoming
Barriers at the beginning of the semester. The number of activities completed and analyzed
within each program varied and are displayed in Table 2. These are the number of activities
performed within each program over the course of the study.
Table 2. Program Activity Breakdown
Several extraneous variables were collected prior to the start of each program in
order to determine if there was a relationship between and/or effect on the main variables.
These extraneous variables included mood prior to exercise, whether the participant was
having a good day, what the participant was doing prior to the start of the program (i.e.
eating, watching tv/playing video games, etc.), if the participant was tired and/or hungry
coming into the program. A negative significant relationship was found between hunger
and perceived exertion as well as with enjoyment of exercise. No significant relationship
was found between any other extraneous variable and perceived exertion, actual exertion,
and enjoyment of exercise (see Table 3). There were two significant relationships found
between extraneous variables themselves. The first significant relationship was between
tiredness and hunger, r = .384 (p < .05), with the second significant relationship being
between mood and tiredness, r = .137 (p < .05).
Aquatics
(Saturday
and
Master’s)
Basketball Fitness Kidnastics ICDI
Number of
participants 11 3 5 1 1
Number of
exercises
analyzed
19 11 21 5 3

25
Table 3. Relationship between Extraneous Variables on Main Variables
Variable Actual Exertion Perceived Exertion Enjoyment of
Exercise
Mood Prior to
Exercise 0.02 0.037 -0.033
Hunger -0.032 -.0161* -0.140*
Tiredness -0.074 -0.021 -0.046
Having a good
day/morning? 0.039 -0.019 0.007
*Significance set at p < 0.05
Correlations Between Perceived/Actual Exertion and Enjoyment
When analyzing each activity as an independent data point, the correlation between
exercise exertion and enjoyment r = -0.007 (p = 0.63) no significant relationship was found.
A significant relationship however, was found between exercise exertion and perceived
exertion r = -0.151 (p = 0.66) and between enjoyment of exercise compared to perceived
exertion r = 0.23 (p < 0.05) (see Table 4). These results indicate both a between subjects
and within subject correlation. For participants with ASD, the easier the activity, (i.e. he or
she perceived their exertion level to be low) the more the participant enjoyed the activity.
The enjoyment and perceived exertion scores listed in table five are the mean scores across
all specific tasks or exercises within an activity.
Table 4. Correlation (r) between Main Variables
Relationship between
Variables
N
(bouts of exercise) Pearson Correlations
Enjoyment – Perceived
Exertion 253 0.230**
Enjoyment – Actual
Exertion 250 -0.007
Perceived Exertion –
Actual Exertion 251 -0.151*
*Correlation is Significant at 0.05 level
**Correlation is significant at 0.01 level

26
Table 5. Relationship of Enjoyment of Exercise and Perceived Exertion Across Activities
±SD
Activity Sample Size
(N)
Exercise
bouts
Examined
Enjoyment
(mean
score)
Perceived
Exertion
Pearson’s
Correlation
(r)
Aquatics 11 128 3.24±.729 2.74±.916 0.28**
Basketball 3 44 3.50±.506 2.92±.625 0.18
Fitness 5 63 3.35±.600 2.80±.694 0.21
ICDI 1 3 3.33±.577 3.67±.577 0.50
Note. Mean enjoyment and perceived exertion ratings across activities. All activities had large positive
correlations between enjoyment and perceived exertion ratings.
*Correlation is Significant at 0.05 level
**Correlation is significant at 0.01 level
According to our participants in aquatics (N = 11) their mean score was 3.24 meaning they
enjoyed the activity and their perceived exertion score was 2.74 indicating participants
rated it closer to easy than hard for the 129 bouts of exercise performed. Conversely, the
participants in basketball (N = 3) rated the activities between easy and really easy while
stating their perceived exertion was a mean score of 2.92 closer to easy than hard in the 45
bouts of exercise performed.
Even though the findings of our study do not support the relationship between
actual exertion, perceived exertion, and enjoyment; the findings do suggest a significant
relationship between an individual’s enjoyment of an activity and their perceived exertion
during the activity as well as a negative relationship between their perceived exertion and
actual exertion.
Heart Rate
Heart rate was collected at the completion of each activity to determine which
activities allowed participants to reach their target heart rate zone during exercise. Table

27
five displays the heart rate ranges for all programs. Between males and females, males
consistently had a higher average heart rate compared to females (116 bpm vs. 101 bpm).
While individual exercises were not analyzed in terms of their significance, there were
several exercises that allowed the participant to reach their target heart rate zone. The
activities of aquatics, basketball, and fitness allowed participants to enter and remain in
their target heart rate zone, whereas the activities of kidnastics (i.e. balancing, rolling, and
jumping) and ICDI (i.e. kicking and throwing) did not allow participants to enter their
target heart rate zone.
Table 6. Heart Rate Ranges for all Programs (Min, Max)
Activity Heart Rate Range (bpm) Target Heart Zone
Master's Aquatics 70 – 213 Yes
Saturday Aquatics 67 – 157 Yes
Basketball 81 – 170 Yes
Fitness 70 – 180 Yes
ICDI 120 – 126 No
Kidnastics 88 – 110 No
Specific activities that elicited a heart rate are organized according to individual
activities vs. team activities. Master’s aquatics included: freestyle (129 bpm - 213 bpm),
flutter kick with kickboard (121 bpm - 175 bpm) and backstroke (125 bpm - 135 bpm);
Saturday aquatics activities included: submersion (116 bpm - 124 bpm) and flutter kicks
with kickboard (130 bpm - 157 bpm); fitness: cycling (129 bpm - 170 bpm), treadmill
jogging (120 bpm - 170 bpm), lateral raises (129 bpm - 144 bpm) and lunges (149 bpm -
155 bpm) and the team sport of basketball: dribbling (118 bpm - 132 bpm), passing (125
bpm - 150 bpm), shooting (136 bpm - 162 bpm), running (115 bpm - 127 bpm). Based on
our limited sample size, these could be suggested activities that would allow participants
with ASD to engage within their target heart rate zone.

28
Discussion
The purpose of this study was to determine if there was a relationship between
exercise enjoyment (i.e. like vs. dislike), perceived exertion (i.e. working hard vs. activity
was easy), and actual exertion levels in individuals with ASD. It was hypothesized that as
enjoyment scores for activities increased, both actual and perceived exertion levels would
decrease. The results of our study were unable to support this hypothesis.
Contrary to our hypothesis, the findings of this study do suggest there is a
significant positive relationship between a participant’s enjoyment of exercise and their
perceived level of exertion. Practically, the greater the level of enjoyment in an activity for
participants with ASD, the more likely he or she would be to engage in it. Since aquatics,
basketball, and fitness demonstrated the greatest likelihood of getting the participant into
the moderate to vigorous range of exercise, it is suggested individuals with ASD engage in
these programs to achieve health benefits. This is of high importance since individuals with
ASD are more inactive compared to their typically developing peers, with engaging in
sedentary behaviors such as watching TV being identified as a major barrier to PA in this
population (Stanish et al., 2015; Obrusnikova & Cavalier, 2011).
When compared to Stanish et al. (2015), we found similar results that participants
with ASD appear to enjoy individual activities more than team activities. In the present
study however, the team sport of basketball was enjoyed by participants. Additionally,
Stanish et al. (2015), indicated participants with ASD found physical activities to be hard
whereas the findings in the present study were contrary as participants rated the activities
to be easy (or closer to easy than hard).

29
The findings of this study are also in contrast to the results of a study by Raedeke
(2007) which examined the relationship between enjoyment and affective responses to
exercise in individuals participating in group fitness classes. That study found no
significant correlation between enjoyment and perceived exertion. While additional studies
have examined the relationship between exercise enjoyment and other psychological
factors, such as mood affect, the researchers were unable to find any studies looking at the
relationship between enjoyment and physical measures of exertion either in typically
developing participants or those with ASD.
A significant negative relationship was found between perceived exertion and
actual exertion (see Figure 1, Appendix E). Furthermore, measuring exertion during
activities allowed the researcher to determine each participant’s level of exercise exertion
(low, medium, and high). Additionally, the researcher wanted to determine which activities
allowed participants to stay in their target heart zone and thus receive the health benefits
from engaging in activity. The relationship between specific exercises (i.e. front crawl vs.
backstroke) and the variables of exertion, perceived exertion, and enjoyment were not
reported as the sample size was too low (N = 1). Due to the small sample size, a
participant’s scores during each exercise or task were combined under the name of the
activity we were unable to general from that one person and how exerting those two
activities were compared to the others. The relationship between a participant’s like or
dislike of an activity and their perceived level of exertion is for the activity overall and not
specific exercises or tasks within the program.
With regard to the relationship between the extraneous variables, mood prior to
exercise, whether the participant was having a good day, what the participant was doing

30
prior to the start of the program (i.e. eating or watching TV/playing video games), if the
participant was tired or hungry on the main variables, there were two significant
relationships one between hunger and perceived exertion and the second between hunger
and enjoyment of exercise. While research has identified sedentary behaviors as a major
problem among individuals with ASD, no studies have examined the relationship between
hunger and activity levels in this population nor did this study examine the relationship
between sedentary behaviors and how it impacted activity, simply it identified the
relationship between the two (Obrusnikova & Cavalier, 2011). Even though the current
study did not analyze anxiety or depression this study did examine their mood prior to
exercise to see the impact it had on engagement and exertion level. While the literature has
discussed the prevalence of anxiety and depression in individuals with ASD no studies
have examined the relationship between mood and tiredness nor have they discussed the
relationship between mood and hunger which was found in this study.
Assumptions, Limitations, Delimitations
During this study, it was assumed the participants were comprehending the
questions being asked and were responding with an appropriate answer. Accuracy of
measurement instruments and administration of researchers and all assistants were
assumed. ASD ranges in severity and may be accompanied by a secondary disability.
Because of this, this study cannot be generalized to those with severe ASD or those with
any additional disabilities. Furthermore, in this study, there was no distinction between the
severity to which ASD affects the individual. An additional limitation of the study was the
mode of exercise performed and the exercises selected during each program. As ASD is
more prevalent in males than females generally, the population in this study had a higher

31
proportion of males to females. Further limitations include, the individuals leading the
programs each week, environmental changes, consistent group sizes (1:1 to 3:3), and
working with a different mentor on occasion. A final limitation is the relationship
developed between the mentor and participant as this relationship could have positively or
negatively affected their enjoyment in the activity.
Future Directions/Studies
Future studies should use a larger sample size in order to better examine the
correlation between variables during specific exercises. Additionally, it is recommended
that this be explored further using a formal trial where the subjects are randomly distributed
into programs with standardized activities (i.e. participants in the current study were
allowed of select the activity of their choosing). This will control for any potential bias
from the participant in choosing activities which they are already likely to enjoy more.
Future studies should also examine the variety of heart rate monitors available to use to
monitor consistent heart rate throughout the program.

32
Manuscript References
American Psychiatric Association. (2013). Diagnostic and Statistical Manual of Mental
Disorders, 5th Edition (DSM-5). Diagnostic and Statistical Manual of Mental
Disorders 4th Edition TR., 280.
Bahrami, F., Movahedi, A., Marandi, S. M., & Abedi, A. (2012). Kata techniques training
consistently decreases stereotypy in children with autism spectrum disorder. Research
in Developmental Disabilities, 33(4), 1183–1193.
Borg, G. A. V. (1982). Psychophysical bases of perceived exertion. Medicine and Science
in Sports and Exercise, 14(5), 377–381.
Capps, L., Kehres, J., & Sigman, M. (1998). Conversational abilities among children with
autism and children with developmental delays. Autism, 2(4), 325–344.
Carraro, A., & Gobbi, E. (2014). Exercise Intervention to Reduce Depressive Symptoms
in Adults with Intellectual Disabilities. Perceptual and Motor Skills, 119(1), 1–5.
Camarda, S. R. D. A., Tebexreni, A. S., Páfaro, C. N., Sasai, F. B., Tambeiro, V. L.,
Juliano, Y., & Barros Neto, T. L. De. (2008). Comparison of maximal heart rate
using the prediction equations proposed by Karvonen and Tanaka. Arquivos
Brasileiros de Cardiologia, 91(5), 311–314.
Chambers, J. M. (2008). Software for Data Analysis Programming with R. Springer (Vol.
15).
Chatterjee, S., & Hadi, A. (2013). Regression Analysis by Example, Fifth Edition.
International Statistical Review, 81(2), 308. Retrieved from
Christensen, D. L., Baio, J., Braun, K. V. N., Bilder, D., Charles, J., Constantino, J. N.,
… Yeargin-Allsopp, M. (2016). Prevalence and Characteristics of Autism
Spectrum Disorder Among Children Aged 8 Years — Autism and Developmental
Disabilities Monitoring Network, 11 Sites, United States, 2012. MMWR. Surveillance
Summaries, 65(3), 1–23.
Dishman, R. K., Motl, R. W., Sallis, J. F., Dunn, A. L., Birnbaum, A. S., Welk, G. J., …
Jobe, J. B. (2005). Self-management strategies mediate self-efficacy and physical
activity. American Journal of Preventive Medicine, 29(1), 10–18.
Green, D., Carman, T., Pickles, A., Chandler, S., Loucas, T., Simonoff, A., & Baird, G.
(2009). Impairment in movement skills in children with autistic spectrum disorders.
Developmental Medicine and Child Neurology, 51.

33
Hui, S. S. Chuen, & Chan, J. W. sze. (2006). The relationship between heart rate reserve
and oxygen uptake reserve in children and adolescents. Research Quarterly for
Exercise and Sport, 77(1), 41–49.
IBM. (2016). IBM SPSS Advanced Statistics 24. Ibm, 184.
https://doi.org/10.1080/02331889108802322
Iyriboz, Y., Powers, S., Morrow, J., Ayers, D., & Landry, G. (1991). Accuracy of pulse
oximeters in estimating heart rate at rest and during exercise. British Journal of Sports
Medicine, 25(3), 162 LP-164. Retrieved from
Kanai, C., Iwanami, A., Hashimoto, R., Ota, H., Tani, M., Yamada, T., & Kato, N. (2011).
Clinical characterization of adults with Asperger’s syndrome assessed by self-report
questionnaires based on depression, anxiety, and personality. Research in Autism
Spectrum Disorders, 5(4), 1451–1458.
Kim, J. A., Szatmari, P., Bryson, S. E., Streiner, D. L., & Wilson, F. J. (2000). The
prevalence of anxiety and mood problems among children with autism and Asperger
syndrome. Autism, 4(2), 117–132.
Lugnegård, T., Hallerbäck, M. U., & Gillberg, C. (2011). Psychiatric comorbidity in young
adults with a clinical diagnosis of Asperger syndrome. Research in Developmental
Disabilities, 32(5), 1910–1917.
MacDonald, M., Esposito, P., & Ulrich, D. (2011). The physical activity patterns of
children with autism. BMC Research Notes, 4.
Mahon, a D., Gay, J. a, & Stolen, K. Q. (1998). Differentiated ratings of perceived exertion
at ventilatory threshold in children and adults. European Journal of Applied
Physiology and Occupational Physiology, 78(2), 115–120.
Matson, J. L., & Williams, L. W. (2014). Depression and mood disorders among persons
with Autism Spectrum Disorders. Research in Developmental Disabilities, 35(9),
2003–2007.
Mayes, S. D., Calhoun, S. L., Murray, M. J., Ahuja, M., & Smith, L. A. (2011). Anxiety,
depression, and irritability in children with autism relative to other neuropsychiatric
disorders and typical development. Research in Autism Spectrum Disorders, 5(1),
474–485.
Ming, X., Brimacombe, M., & Wagner, G. C. (2007). Prevalence of motor impairment in
autism spectrum disorders. Brain and Development, 29(9), 565–570.

34
Moore, J. B., Yin, Z., Hanes, J., Duda, J., Gutin, B., & Barbeau, P. (2009). Measuring
enjoyment of physical activity in children: Validation of the physical activity
enjoyment scale. Journal of Applied Sport Psychology, 21(SUPPL.1), 116–129.
Murayama, N., & Ohtsuka, R. (1999). Heart rate indicators for assessing physical activity
level in the field. American Journal of Human Biology, 11(5), 647–657.
Obrusnikova, I., & Cavalier, A. R. (2011). Perceived Barriers and Facilitators of
Participation in After-School Physical Activity by Children with Autism Spectrum
Disorders. Journal of Developmental and Physical Disabilities, 23(3), 195–211.
Pan, C.-Y., & Frey, G. C. (2006). Physical Activity Patterns in Youth with Autism
Spectrum Disorders. Journal of Autism and Developmental Disorders, 36(5), 597–
606.
Petrus, C., Adamson, S. R., Block, L., Einarson, S. J., Sharifnejad, M., & Harris, S. R.
(2008). Effects of exercise interventions on stereotypic behaviours in children with
autism spectrum disorder. Physiotherapy Canada. Physiothérapie Canada, 60(2),
134–45.
Pine, D. S., Guyer, A. E., Goldwin, M., Towbin, K. A., & Leibenluft, E. (2008). Autism
Spectrum Disorder Scale Scores in Pediatric Mood and Anxiety Disorders. Journal of
the American Academy of Child & Adolescent Psychiatry, 47(6), 652–661.
Prupas, A., & Reid, G. (2001). Effects of Exercise Frequency on Stereotypic Behaviors
of Children with Developmental Disabilities. Education and Training in Mental
Retardation and Developmental Disabilities, 36(2), 196-206.
Raedeke, T. D. (2007). The Relationship between enjoyment and affective responses to
exercise. Journal of Applied Sport Psychology, 19(1), 105–115.
Rapp, J. T., Vollmer, T. R., St Peter, C., Dozier, C. L., & Cotnoir, N. M. (2004). Analysis
of response allocation in individuals with multiple forms of stereotyped
behavior. Journal of Applied Behavior Analysis, 37(4), 481–501.
Robbins, L. B., Pis, M. B., Pender, N. J., & Kazanis, A. S. (2004). Exercise self-efficacy,
enjoyment, and feeling states among adolescents. Western Journal of Nursing
Research, 26(7), 699–715.
Schmitz Olin, S., McFadden, B. A., Golem, D. L., Pellegrino, J. K., Walker, A. J.,
Sanders, D. J., & Arent, S. M. (2017). The Effects of Exercise Dose on
Stereotypical Behavior in Children with Autism. Medicine and Science in Sports
and Exercise, 49(5), 983–990.

35
Sedgwick, P. (2012). Pearson's correlation coefficient. BMJ : British Medical Journal
(Online), 345
Stanish, H. I., Curtin, C., Must, A., Phillips, S., Maslin, M., & Bandini, L. G. (2015).
Enjoyment, Barriers, and Beliefs about Physical Activity among Adolescents With
and Without Autism Spectrum Disorder.
Stodden, D. F., Goodway, J. D., Langendorfer, S. J., Roberton, M. A., Rudisill, M. E.,
Garcia, C., & Garcia, L. E. (2008). A Developmental Perspective on the Role of Motor
Skill Competence in Physical Activity: An Emergent Relationship. Quest, 60(2), 290–
306.
Strath, S. J., Swartz, a M., Bassett, D. R., O’Brien, W. L., King, G. a, & Ainsworth, B. E.
(2000). Evaluation of heart rate as a method for assessing moderate intensity physical
activity. Medicine and Science in Sports and Exercise, 32(9 Suppl), S465-70.
Strong, J.F., Kenworthy, L., Daniolos, P., Case, L., Willis, M.C., Martin, A., et al. (2012).
Depression and anxiety symptoms in children and adolescents with autism spectrum
disorder without intellectual disability. Research in Autism Spectrum Disorders, 6(1),
406-412.
Ueda, T., & Kurokawa, T. (1991). Validity of heart rate and ratings of perceived exertion
as indices of exercise intensity in a group of children while swimming. European
Journal of Applied Physiology and Occupational Physiology, 63(3–4), 200–204.
Yelling, M., Lamb, K. L., & Swaine, I. L. (2002). Validity of a Pictorial Perceived Exertion
Scale for Effort Estimation and Effort Production During Stepping Exercise in
Adolescent Children. European Physical Education Review, 8(2), 157–175.

36
Appendix A
Individuals with Diminished Capacity Consent

37
Appendix B
Example Aquatics Program

38
Appendix C
Example Basketball Program

39
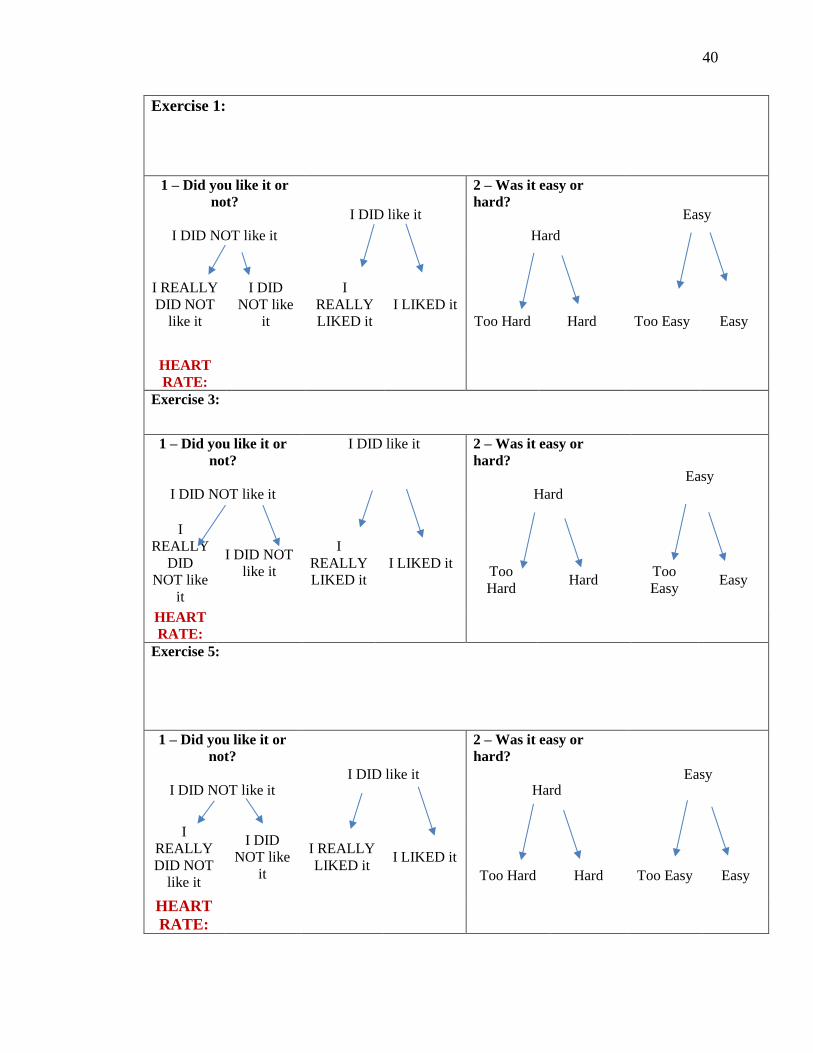
Appendix D
Data Collection Sheet
Participants Name: Data Collector: Program/Date:
Questions to ask as soon as participant arrives:
1 What were you doing prior to program?
2 Are you hungry?
Yes or No
3 Are you tired?
Yes or No
4 Did you have a good day/morning?
Yes or No
Mood
Mood:
Scaled Number:
Resting Heart Rate:
Radial Pulse Heart Rate:
40
Exercise 1:
1 – Did you like it or
not?
I DID NOT like it
I DID like it
2 – Was it easy or
hard?
Hard
Easy
I REALLY
DID NOT
like it
I DID
NOT like
it
I
REALLY
LIKED it
I LIKED it
Too Hard Hard Too Easy Easy
HEART
RATE:
Exercise 3:
1 – Did you like it or
not?
I DID NOT like it
I DID like it 2 – Was it easy or
hard?
Hard
Easy
I
REALLY
DID
NOT like
it
I DID NOT
like it
I
REALLY
LIKED it
I LIKED it Too
Hard Hard
Too
Easy Easy
HEART
RATE:
Exercise 5:
1 – Did you like it or
not?
I DID NOT like it I DID like it
2 – Was it easy or
hard?
Hard Easy
I
REALLY
DID NOT
like it
I DID
NOT like
it
I REALLY
LIKED it I LIKED it
Too Hard Hard Too Easy Easy
HEART
RATE:

41
Appendix E
Box Plot – Relationship between Heart Rate and Perceived Exertion
0
25
50
75
100
125
150
175
200
225
Too Hard Hard Easy Too Easy
He
art
Ra
te (
bp
m)
Figure 1. Relationship between Heart Rate and Perceived Exertion.


