Relation of Task Switching to Speed, Age, and Fluid Intelligence
17
Psychology and Aging Copyright 1998 by the American Psychological Association, Inc. 1998, Vol. 13, No. 3, 445-461 0882-7974/98/$3.00 Relation of Task Switching to Speed, Age, and Fluid Intelligence Timothy A. Salthouse, Nathanael Fristoe, Katheryn E. McGuthry, and David Z. Hambrick Georgia Institute of Technology Two studies were conducted to investigate whether a meaningful task-switchingconstruct could be identified and, if so, to determine how it was related to measures of higher order cognition and to adult age. Both studies revealed that measures of task switching were moderately correlated across differentcombinationsof tasks and that a switchingconstruct could be distinguished from a construct reflecting processing speed. The results of the 2nd study revealed that although the task-switching construct was related to age and to measures of episodic memory, inductive reasoning, and spatial visualization,most of the relations between the switching construct and both age and other measures of cognition were shared with other variables. There is considerable evidence that measures of perceptual speed share large proportions of age-related variance with many cognitive variables. It has even been postulated that processing speed, which is hypothesized to be a primary construct assessed by measures of perceptual speed, may be involved in the media- tion of much of the age-related influences on measures of cogni- tive functioning (Salthouse, 1993b, 1994, 1996). However, per- ceptual speed may not be the most primitive psychological vari- able responsible for age-related individual differences in processing efficiency. That is, because perceptual speed tasks are so simple, the primary way that performance can vary across people is in terms of the time needed to complete the activities, but this does not necessarily mean that alterations in the speed of executing cognitive operations are the cause of the individual differences observed on those tasks. Perceptual speed tasks involve a series of repetitive operations and responses. The nature of the operations varies according to the type of task because search, comparison, matching, and substitution operations have each been used in assessing percep- tual speed. However, all perceptual speed tasks seem to require multiple switching or attention-redirecting operations. For ex- ample, in perceptual comparison tasks the respondent needs to focus on the first element and encode it, switch attention to the second element and encode it, make a decision, switch attention to make a response, execute the response, and then switch atten- tion to the next item and repeat the sequence of operations. Switching ability could be an important cognitive primitive because nearly all cognitive tasks require processing to be con- trolled and reallocated across different components. To illustrate, TimothyA. Salthouse, Nathanael Fristoe, KatherynE. McGuthry,and David Z. Hambrick, School of Psychology, Georgia Institute of Technology. This research was supported by National Institute on Aging Grant R37 AG06826. We would like to acknowledge the valuable assistance in testing participants and scoring of data of Kellie Hocking, Stephanie Sherwood, and Michelle Wolbrette. Correspondence concerningthis article should be addressed to Timo- thy A. Salthouse, School of Psychology, Georgia Institute of Technol- ogy, Atlanta, Georgia 30332-0170. Electronic mail may be sent to tim.salthouse @psych.gatech.edu. working memory is often defined as simultaneous storage and processing, and thus some switching or redirection of attention between aspects of storage and processing is presumably neces- sary for successful functioning of working memory. Failure of this type of attentional control could also be manifested in prob- lems of perseveration, difficulties in dividing attention, etc. In fact, some theorists (e.g., Baddeley, 1996) believe that these processes are so important that they are considered to be pri- mary functions of a central executive system. These speculations raise the possibility that efficiency of switching may be a critical factor contributing to age-related differences in both perceptual speed and higher order cognitive abilities. In other words, it may not be individual operations that are slowed with increasing age, but rather the processes responsible for switching between operations. Speed differences associated with increasing age could therefore be restricted to an inertia related to altering the nature of the processing carried out and not necessarily to reductions in the efficiency of execut- ing a particular operation once it is selected and initiated. At least two possible approaches might be employed to inves- tigate the role of task switching on adult age differences in cognitive functioning. One approach could attempt to minimize or eliminate switching operations in the task to determine whether this would lead to smaller individual (and age-related) differences on the measures of performance and weaker relations between those measures and various cognitive variables. That is, if switching is a critical process contributing to age-related differences in cognitive functioning, then one would predict that measures from tasks with fewer switching requirements should be less related to age and to measures of performance in many cognitive tasks involving attentional control than measures from tasks with greater switching requirements. Some evidence relevant to this prediction is available from several previous studies. For example, a number of studies have administered digit digit and digit symbol reaction time tasks to participants of a wide range of ages. Both of these tasks require the respondent to make rapid binary decisions about pairs of items presented in the middle of a computer screen. In the digit symbol task a code table at the top of the screen contains pairs of digits and symbols, and the decision is whether the probe items are associated with one another according to the code 445
Transcript of Relation of Task Switching to Speed, Age, and Fluid Intelligence

Psychology and Aging Copyright 1998 by the American Psychological Association, Inc. 1998, Vol. 13, No. 3, 445-461 0882-7974/98/$3.00
Relation of Task Switching to Speed, Age, and Fluid Intelligence
Timothy A. Salthouse, Nathanael Fristoe, Katheryn E. McGuthry, and David Z. Hambrick Georgia Institute of Technology
Two studies were conducted to investigate whether a meaningful task-switching construct could be identified and, if so, to determine how it was related to measures of higher order cognition and to adult age. Both studies revealed that measures of task switching were moderately correlated across different combinations of tasks and that a switching construct could be distinguished from a construct reflecting processing speed. The results of the 2nd study revealed that although the task-switching construct was related to age and to measures of episodic memory, inductive reasoning, and spatial visualization, most of the relations between the switching construct and both age and other measures of cognition were shared with other variables.
There is considerable evidence that measures of perceptual speed share large proportions of age-related variance with many cognitive variables. It has even been postulated that processing speed, which is hypothesized to be a primary construct assessed by measures of perceptual speed, may be involved in the media- tion of much of the age-related influences on measures of cogni- tive functioning (Salthouse, 1993b, 1994, 1996). However, per- ceptual speed may not be the most primitive psychological vari- able responsible for age-related individual differences in processing efficiency. That is, because perceptual speed tasks are so simple, the primary way that performance can vary across people is in terms of the time needed to complete the activities, but this does not necessarily mean that alterations in the speed of executing cognitive operations are the cause of the individual differences observed on those tasks.
Perceptual speed tasks involve a series of repetitive operations and responses. The nature of the operations varies according to the type of task because search, comparison, matching, and substitution operations have each been used in assessing percep- tual speed. However, all perceptual speed tasks seem to require multiple switching or attention-redirecting operations. For ex- ample, in perceptual comparison tasks the respondent needs to focus on the first element and encode it, switch attention to the second element and encode it, make a decision, switch attention to make a response, execute the response, and then switch atten- tion to the next item and repeat the sequence of operations.
Switching ability could be an important cognitive primitive because nearly all cognitive tasks require processing to be con- trolled and reallocated across different components. To illustrate,
Timothy A. Salthouse, Nathanael Fristoe, Katheryn E. McGuthry, and David Z. Hambrick, School of Psychology, Georgia Institute of Technology.
This research was supported by National Institute on Aging Grant R37 AG06826. We would like to acknowledge the valuable assistance in testing participants and scoring of data of Kellie Hocking, Stephanie Sherwood, and Michelle Wolbrette.
Correspondence concerning this article should be addressed to Timo- thy A. Salthouse, School of Psychology, Georgia Institute of Technol- ogy, Atlanta, Georgia 30332-0170. Electronic mail may be sent to tim.salthouse @psych.gatech.edu.
working memory is often defined as simultaneous storage and processing, and thus some switching or redirection of attention between aspects of storage and processing is presumably neces- sary for successful functioning of working memory. Failure of this type of attentional control could also be manifested in prob- lems of perseveration, difficulties in dividing attention, etc. In fact, some theorists (e.g., Baddeley, 1996) believe that these processes are so important that they are considered to be pri- mary functions of a central executive system.
These speculations raise the possibility that efficiency of switching may be a critical factor contributing to age-related differences in both perceptual speed and higher order cognitive abilities. In other words, it may not be individual operations that are slowed with increasing age, but rather the processes responsible for switching between operations. Speed differences associated with increasing age could therefore be restricted to an inertia related to altering the nature of the processing carried out and not necessarily to reductions in the efficiency of execut- ing a particular operation once it is selected and initiated.
At least two possible approaches might be employed to inves- tigate the role of task switching on adult age differences in cognitive functioning. One approach could attempt to minimize or eliminate switching operations in the task to determine whether this would lead to smaller individual (and age-related) differences on the measures of performance and weaker relations between those measures and various cognitive variables. That is, if switching is a critical process contributing to age-related differences in cognitive functioning, then one would predict that measures from tasks with fewer switching requirements should be less related to age and to measures of performance in many cognitive tasks involving attentional control than measures from tasks with greater switching requirements.
Some evidence relevant to this prediction is available from several previous studies. For example, a number of studies have administered digit digit and digit symbol reaction time tasks to participants of a wide range of ages. Both of these tasks require the respondent to make rapid binary decisions about pairs of items presented in the middle of a computer screen. In the digit symbol task a code table at the top of the screen contains pairs of digits and symbols, and the decision is whether the probe items are associated with one another according to the code
445

446 SALTHOUSE, FRISTOE, McGUTHRY, AND HAMBRICK
table. In the digit digit task both items in the probe pair are digits and, because the decision is whether the two members of the pair are physically identical, there is no need to refer to the code table because it merely contains identical pairs of digits. The digit digit task almost certainly has fewer switching require- ments than the digit symbol task because there is no need to consult the code table, or to try and remember the pairings of digits and symbols. A consistent finding across several studies has been that the age relations are smaller on the digit digit measure than on the digit symbol measure and that there is significant residual age-related variance on the digit symbol measure after control of the digit digit measure (e.g., see Salt- house, 1996, for a review). The relations to various cognitive variables are also generally smaller with the digit digit measure than with the digit symbol'measure (e.g., Salthouse, 1994).
Although results with the digit digit and digit symbol tasks are consistent with the hypothesis that switching is a fundamental construct involved in age-cognition relations, they cannot be considered conclusive because the relevant tasks do not differ merely in the amount of switching that is required, but also in the amount of cognitive processing. That is, the additional operations in the digit symbol task are more cognitive in nature than the operations involved in the digit digit task (e.g., retrieval of learned associates, or search of the code table), and therefore the critical difference between the tasks may be with respect to the degree of cognitive involvement rather than the amount of switching. Attempts could be made to increase the complexity of the response to vary the amount of switching without increasing cognitive complexity. However, this would probably not be easy to achieve because the cognitive demands in the situation will likely increase whenever a more complex or extended response is required.
Another reason why the approach of varying the amount of required switching does not appear promising is that even the simplest repetitive tasks are likely to involve multiple switching requirements because there is always a need to switch from one item to the next and, within a given item, to switch between operations such as encoding and response. It might therefore be quite difficult to create a powerful contrast between tasks in which there were small and large amounts of attentional switching.
A second approach to investigating the role of switching in age-cognition relations is to attempt to measure the efficiency of switching directly. That is, a task (or tasks) might be adminis- tered in which it is possible to measure the time and accuracy costs of switching. Several studies have been reported with tasks that might be suitable for this purpose. For example, adult age differences in switching have been examined in tasks requiring alternations between two auditory or visual channels (e.g., Bar- rett, Mihal, Panek, Stems, & Alexander, 1977; Braune & Wick- ens, 1985; Stankov, 1988; Wickens, Braune, & Stokes, 1987). Most of these studies found reduced effectiveness of switching with increased age, although several of them only reported age relations on factor scores based on other variables in addition to those reflecting the efficiency of switching. A number of researchers have also compared performance on single and alter- nating versions of simple tasks such as addition and subtraction, or providing antonyms and synonyms (e.g., Botwinick, Brin- ley, & Robbin,1958; Brinley, 1965; Schaie, 1958). Each of these
studies reported that with increased age there was a greater increase in time for alternating problems than for the average of the single problems.
A great many age-comparative studies have examined the Trail Making Test (Reitan, 1992), in which the task is to connect a series of targets as rapidly as possible. There are two versions of the test. In Version A the targets are numbers (e.g., 1-2-3-4, etc.), and in Version B the targets are alternating letters and numbers (e.g., 1-A-2-B, etc.). The typical finding in studies with adults of different ages is much larger age-related differences on the time to complete the B version than the A version, which has been attributed, among other things, to a difficulty in alterna- tion or switching (see references in Salthouse & Fristoe, 1995).
In a recent study, Salthouse, Fristoe, and Rhee (1996) admin- istered a battery of different cognitive tests, including the Trail Making Test and several tests of perceptual speed, to 259 adults between 18 and 94 years of age. Because Trails B requires alternation between numbers and letters whereas Trails A does not, the time difference between the B and A versions of the Trail Making Test can be used as an index of switching time. The data from the Salthouse et al. (1996) study were therefore reanalyzed with structural equation models to examine the rela- tions among age, speed, switching, and measures of cognitive performance. Two models (Figure 1 ) were considered that were structurally identical except that in one case a path was specified from the switching measure to the speed construct, and in the other case the direction of this path was reversed. Both models had the same fit to the data; for example, X2(41, N = 259) = 147.09, NNFI = .90, CFI = .93, Std. RMR = .05.1 However, two of the three relations among age, speed, and the switching measure were stronger when the path was from the speed con- struct to the switching measure instead of from the switching measure to the speed construct. Further examination of the re- suits in Figure 1 reveals that statistical control of speed reduces the age-switch relation by 64% (from .53 to .19), whereas statistical control of the switching measure reduces the age- speed relation by only 22% (i.e., - .73 to - .57) . One possible implication of these results is that perceptual speed may be more fundamental with respect to relations between age and cognition than a construct related to switching.
Unfortunately, a weakness of this reanalysis is that the Salt- house et al. (1996) study had a very gross measure of switching. That is, the Trails B minus Trails A measure is crude because it includes many processes in addition to switching. As just one example, connecting the targets in alphabetic sequences is usually slower than connecting them in numeric sequences (Salthouse & Fristoe, 1995), and hence the B version relative to the A version involves both the requirement to switch between sequences and the introduction of a more difficult sequence.
The strategy employed in the current project involved admin- istering several sets of tasks in single and alternating versions.
1 The degree of fit in structural equation models can be evaluated in terms of the chi-square statistic assessing deviations of fit (i.e., smaller is better), in terms of the Non-Normed Fit Index (NNFI) and the Com- parative Fit Index (CFI) reflecting the extent to which the model repro- duces the covariance matrix (i.e., closer to 1.0 is better) and in terms of the standardized root mean square residual (Std. RMR) between the fitted and observed covariance matrices (i.e., closer to 0 is better).
TASK SWITCHING 447
Figure 1. TWo structural models based on data from Salthouse, Fristoe, and Rhee (1996). The variables in the analysis were letter comparison (LetCom), pattern comparison (PatCom), digit symbol substitution (DigSym), the difference between time on Trial Making versions B and A (Trails B-A), object assembly (ObjAssm), block design (BlkDes), number of categories in the ,Wisconsin Card Sorting Test (WCST), Shipley Abstraction Test (Shipley), Rey Auditory Verbal Learning Test (RVLT), and paired associates (PairAssoc). Note that the relation between age and speed was negative because speed was assessed in terms of paper-and-pencil tests in which performance was represented by the number of items completed in a fixed period of time. The top panel portrays the coefficients when there is a path from the Trails B- Trails A measure to perceptual speed, and the bottom panel portrays the coefficients when this path is reversed.
However, there are at least two reasons why performance could be slower when tasks must be performed in alternation compared to when they are performed in isolation (cf. Rogers & Monsell, 1995). First, the response time could be delayed whenever a switch between tasks is required (i.e., the direct costs of switch- ing), and second, the time could be slower even on nonswitch responses because of the uncertainty associated with expecting or preparing for a switch. An assumption of our approach is that it should be possible to distinguish between these processes with suitable reaction time procedures in which time and accu- racy are measured on each response.
The tasks in the studies to be described are related to those
used in several recent studies of task switching reported by Allport, Styles, and Hsieh (1994); Duncan, Emslie, Williams, Johnson, and Freer (1996); Kramer, Hahn, and Gopher (in press); Rogers and Monsell ( 1995 ); and Rubenstein, Meyer, and Evans (in press). In each set of tasks two different, but equally simple, decisions can be made to the same stimuli. The trials within the critical switching condition began with a set of re- sponses according to one decision rule, and then on some trials a signal was presented indicating that the responses should switch to the other decision rule. The time and accuracy of the initial and subsequent responses following the switch signal relative to the time and accuracy of responses prior to the switch

448 SALTHOUSE, FRISTOE, McGUTHRY, AND HAMBRICK
signal can be used as the measures of switching costs. Further- more, the time and accuracy of responses prior to the switch signal can be compared with the time and accuracy of responses when no switches occur to evaluate uncertainty costs, or what Rogers and Monsell (1995) describe as the time " to maintain two task-sets in an available state rather than one" (p. 216). Our procedure involved presenting a task with one version or decision rule, then a task involving the same stimuli with a second decision rule, then two blocks of alternating tasks, fol- lowed by the second and first tasks again.
A major limitation of much of the earlier research concerned with switching, and of the reanalysis of the Salthouse et al. (1996) data, was the use of only a single set of tasks. The theoretical construct of interest, in this case switching efficiency, is therefore confounded with a specific operationalization of it. This general problem has been recognized at least since the classic article by Garner, Hake, and Erikson (1956), who sug- gested that converging operations are needed to ensure that the constructs under investigation are not specific to the particular methods by which they are operationalized.
As a means of addressing this problem, each participant in the current studies performed three pairs of tasks involving different types of decisions. Figure 2 illustrates the three tasks, with responses based on the digits appearing on the right versus on the left (A) , responses based on more- less versus o d d - even decisions (B) , and responses based on addition versus subtraction (C) , In each case a box surrounding the target stimu- lus served as the signal to switch to the other response rule. Note that the tasks are structurally parallel to allow similar measures of switching performance to be derived from each.
Figure 3 illustrates possible measures of performance in these tasks. The description is in terms of time, but comparable mea- sures can be derived from error percentages. The dashed line labeled F refers to the average times across the single tasks in the first two and last two blocks of trials, when no switches are required. The remaining points refer to times in the switch condition for the switch response and for the three responses preceding and following the switch. The duration labeled A, corresponding to the difference between the reaction time on the switch trial and the average reaction time across the three immediately preceding trials, can be postulated to reflect the time to redirect attention to the new task and implement the relevant decision rule. Durations corresponding to B, C, and D reflect any residual costs of the switch on responses following the trial in which the switch was to have occurred.
Because of the interest in investigating the interrelations of measures from different tasks, correlations among the measures were examined. Two important prerequisites for the meaningful interpretation of correlations are adequate reliability and moder- ately large samples. Estimates of the reliability of the relevant measures should be obtained because they indicate the propor- tion of variance in the variables that is systematic and available to be associated with other variables. That is, if the reliability estimates, essentially representing the degree to which the vari- able correlates with itself, are not fairly high, then one cannot expect the variable to have high correlations with other vari- ables. Moderately large samples are needed to have narrow confidence intervals around the estimates of the correlations. Although correlations can be computed with any size sample,
(A) Start with RIGHT
Swit Switch to RiGHT II I I
Response
6
2
4
5
3
(B) st=t with MORE/LESS Response
Z
/
X
Z
(c) Start with ADDITION Response
5
1 SUBTRACTION ~ 3
Switch to 114 311 7 ADDITION I' I
Figure 2. Displays of the series of events in the Right/Left (A), More/ Odd (B), and Add/Subtract (C) switching tasks. Note that different sets of response keys were used for the more/less and odd/even tasks in panel (B).
the precision of the correlation is inversely related to the size of the sample on which it is based.
Two studies are reported in the current article. The purpose of the first study was to investigate the reliability of the various switching measures and to determine whether a switching con- struct can be identified that is distinct from speed. Because the initial study was focused on methodological issues, only college students served as participants. The second study was designed to investigate the mediational role of switching in age-cogni t ion relations, and thus the participants consisted of adults from a wide range of ages.
S tudy 1
Method
Participants. The sample of participants consisted of 100 college students (53 males, 47 females), with a mean age of 20.0 years and a standard deviation of 2.8 years. Each received credit for a course require- ment as compensation for participation.

TASK SWITCHING 449
t . .
LU (D
t - o
O EL ¢D E ° ~
t- O
13 ¢u
nr"
..... ............................................................... ~ F
A = Initial Switch Cost B = Switch + 1 Cost C = Switch + 2 Cost
D = Switch + 3 Cost E = Uncertainty Effect
F -- Performance with no switches
I I I I I I I -3 -2 -1 0 +1 +2 +3
Switch Position
Figure 3. Schematic illustration of possible measures of task switching.
Procedure. All participants performed the three sets of tasks in the same order (right-left , more-odd, and add-subtract) . The decision rules for the tasks were to press the key corresponding to the digit appearing on either the right (right) or left (left) of the display, press the slash (/) key if the digit was more than 5 and the Z key if it was less than 5 (more- less) , or press the period (.) key if the digit was even and the X key if the digit was odd (odd-even) , and press the digit corresponding to either the sum of (addition) or the difference between (subtraction) the two digits. The same digits were never repeated on successive trials, and the digit 5 never appeared in the more-less and odd-even tasks. When two digits were presented simultaneously, the one on the left was always greater than the one on the right, and all answers in the addition and subtraction tasks were between 1 and 9. Whenever the tasks were to be alternated an instruction as to which task was to be performed first was displayed prior to the initial trial in the block. Nine trials with a particular task occurred between presentations of the signal indicating a switch to the other task. 2
Each task was administered in a set of nine blocks of trials after the presentation of written instructions. The first two blocks each consisted of 10 trials of practice with one of the two tasks in the set. The next practice block consisted of 20 trials in which two switches were required. If there were no questions following the practice trials the sequence of experimental trials began. This consisted of 50 trials with one task (e.g., respond to the right digit), 50 trials with the other task (e.g., respond to the left digit), two blocks each of 100 trials with 10 switches in the alternating or switch condition, 50 trials with the second task (e.g., respond to the left digit), and 50 trials with the first task (e.g., respond to the right digit).
In each set of tasks the participants were instructed to respond, with the index fingers of each hand, as rapidly and accurately as possible. The stimuli resembled those illustrated in Figure 2, with each digit occupying a visual angle of approximately 10.2 degrees at a viewing distance of 50 cm; however, it should be noted that viewing distance was not constrained. A given stimulus was displayed until the occurrence of a response, and that response was followed immediately by the presen- tation of the next stimulus. The rectangle serving as the switch signal appeared simultaneously with the stimulus on the switch trials.
Results and Discussion
Assessment of switch costs. The median t imes and er ror percentages were c o m p u t e d in the two blocks o f each condi t ion
for each part ic ipant , and the values for the two b locks were averaged for subsequent analyses . F igure 4 i l lustrates the mean react ion t imes and er ror percentages for the re levant measures in the th ree tasks. The mean reac t ion t imes for the s ingle tasks in each task set were s imilar and highly cor re la ted wi th one another (i.e., r ight = 864, left = 856, r = .89; m o r e - l e s s = 596, o d d - e v e n = 633, r = .76; and add = 1,006, subtract = 1,080, r = .87) , and thus the two values were averaged to f o r m a s ingle base l ine reac t ion t ime measure for each pai r o f tasks. A s y m m e t r y o f swi tching was e x a m i n e d by compu t ing the me- dian t ime for swi tch r e sponses in each d i rec t ion (e .g . , add- to- subtract and sub t rac t - to -add) . The swi tch t imes were similar, and not s ignif icantly (p < .01) different , for both types o f swi tches in each task combina t ion (i .e. , r i g h t - l e f t = 1,415 ms, l e f t - f i g h t = 1,442 ms, t = 1.64, p > .10; m o r e - o d d = 1,567 ms, o d d - m o r e = 1,488 ms, t = 2.30, p > .02; a d d - s u b t r a c t = 1,516 ms, s u b t r a c t - a d d = 1,477 ms, t = 1.46, p > .15) . The sl ight a symmet r i e s may be at t r ibutable to d i f fe rences in the base l ine and pos t swi t ch react ion t imes in each task. In fact, when the swi tch t imes were exp res sed as rat ios o f med ian reac- t ion t ime on the swi tch trial to med ian react ion t ime on the pos t swi t ch task, the values were quite s imilar across types Of swi tch (i .e. , f i g h t - l e f t = 1.57, l e f t - f i g h t = 1.60; m o r e - o d d = 2.24, o d d - m o r e = 2.18; a d d - s u b t r a c t = 1.36, s u b t r a c t - a d d --- 1.37). All subsequent analyses were therefore based on the aver- age swi tch t imes across the two types o f swi tches in each task combina t ion .
It is apparent in Figure 4 that the reac t ion t imes, and to a lesser extent the er ror percentages , were substant ia l ly h igher on trials when a swi tch was requi red than on the three p reced ing trials. The swi tch cos ts in the react ion t ime measure were largest
2 Although it is conceivable that participants could have detected this regularity in the interval between switches, none of them reported doing so. Furthermore, the overall pattern of responding was very similar in a subsequent study in which the switch trials occurred randomly within a range of 5-15 intervening trials.

450 SALTHOUSE, FRISTOE, McGUTHRY, AND HAMBRICK
2,000 1,800 1,600
0
° ~
I.-- 1,000 i - o 800
° ~
n-
Right/Left More/Odd Add/Subtract
~ . . . . ~ . . . ~
Switch Position Switch Position Switch Position
2 k . . UJ q) C~ r "
8 k . 0) I1.
10 9 8 7 6 5 4 3 2 1
I . ~ ) I
Switch Position
. . . . . . . . . . . . . . . . . . . . . . . . . . .
Switch Position Switch Position
Figure 4. Mean reaction time (top panel) and error percentages (bottom panel) in the three tasks as a function of the position of the switch signal, Study 1.
2,000 1,800 1,600 1,400 1,200 1,000
8O0 6OO 4OO 2OO
10 9 8 7 6 5 4 3 2 1
in the more-odd task, which may be attributable to the necessity of changing both the decision rule and the response assignment in this set of tasks.
Table 1 contains the means, standard deviations, and estimates of reliability for the switching measures corresponding to the variables specified in Figure 3. Also present in Table 1 are the results of statistical significance tests evaluating whether the mean value was significantly different from zero. With the ex- ception of the baseline measure, all of the measures were created by subtracting one value from another (e.g., the Switch 0 mea- sure corresponds to the difference between the reaction time or error percentage on the switch trial and the average of those values on the three preceding trials). Estimates of reliability for all measures were computed by boosting the correlation between the estimates from the first three blocks of trials and the esti- mates from the second three blocks of trials by the Spearman- Brown formula. Inspection of the table reveals that the reliabili- ties were quite high for the baseline reaction time measures and in the moderate range for the Switch 0 reaction time measure. Reliabilities were generally low for the error percentage measures.
Analyses were also conducted on the differences in the reac- tion time switch costs (Switch 0) across the two blocks of trials in each task combination. Although the absolute magnitude of the switch cost was smaller in the second block of trials than in the first block of trials in two of the three tasks, in no case was the difference statistically significant (i.e., all ts < 1.84,
all ps > .06). The mean differences and the percentages of participants with a positive difference (indicating smaller switch costs on the second block) were right-left 32 ms, 59%; more- odd 98 ms, 71%; and add-subtract 0 ms, 57%.
It is noteworthy that the switch costs for the reaction time measures persist to at least one postswitch trial for each task. Although the costs on the Switch + 1 trial are much smaller than those on the switch trial, they were significantly greater than zero in every task combination. The negative values for the switch costs on the second and third responses following the switch in the more-odd task are surprising because they indicate that these postswitch responses were actually faster than the preswitch responses. This phenomenon may reflect an initial period of rapid responding after the shift to a new response assignment. However, it also may simply represent a chance anomaly because it was not apparent in the same task in the subsequent study, or in the other tasks in either study.
The patterns apparent in the means were also reflected in the percentages of participants with switch costs (in reaction time) greater than zero. These percentages for the switch trial and the three following trials were, respectively, 100, 78, 55, and 46 for the right-left task; 100, 79, 31, and 33 for the more-odd task; and 100, 64, 55, and 46 for the add-subtract task.
Interrelations of variables. As a means of investigating the pattern of interrelations among variables, an exploratory factor analysis (promax rotation) was conducted on the reaction time measures with the baseline measures from the three switch tasks

TASK SWITCHING 451
Table 1 Means, Standard Deviations, and Estimated Reliabilities for Switching Measures, Study 1
Reaction time % Error
Switching measure M SD Rel. M SD Rel.
Right-left
Baseline 860 ~ 93 .91 1.74 ~ 2.03 .26 Uncertainty 39 a 54 .35 1.82 8.71 0 Switch 0 518 ~ 162 .71 2.25 ~ 5.66 .18 Switch + 1 89 ~ 99 .47 0.60 3.51 .21 Switch + 2 8 61 .33 0.40 3.66 0 Switch + 3 - 2 67 .23 0.50 3.38 0
More-odd
Baseline 614 ~ 81 .94 4.87" 5.13 .21 Uncertainty 74 ~ 71 .62 0.85 8.13 .33 Switch 0 826 ~ 385 .46 1.33 7.09 .35 Switch + 1 93 a 144 .60 0.78 5.72 .15 Switch + 2 -25 ~ 84 .33 0.38 6.15 .25 Switch + 3 -26 ~ 79 .26 0.13 5.51 .21
Add - subtract
Baseline 1,043 a 139 .95 2.54" 2.10 .68 Uncertainty 56 ~ 69 .20 1.08 a 3.24 0 Switch 0 381 a 179 .61 2.43 a 6.72 .25 Switch + 1 71" 137 0 0.68 4.79 .04 Switch + 2 11 91 0 0.02 4.54 .45 Switch + 3 -10 90 0 0.03 4.36 .36
Note. Estimates of reliability less than zero are replaced by values of zero. Rel. = estimated reliability. a Value significantly different from zero at p < .01 by within-subjects t test.
as potential indicators for the speed construct, the three Switch 0 measures as potential indicators of the switching construct, and measures of uncertainty and postswitch costs. (The error measures were not analyzed in this fashion because few of them were significantly different from zero, and many had low estimated reliabilities.) The analysis yielded five factors with eigenvalues greater than 1, and the loadings on the factors and correlations among factors are reported in Table 2. The first factor corresponds to baseline reaction time or speed, the second through the fourth factors primarily seem to reflect uncertainty and postswitch times for each separate task, and the fifth factor can be interpreted as representing switching. The discovery that the three Switch 0 measures formed a factor distinct from those of the other measures is important because it suggests that a task-independent construct of switching can be identified.
The first (speed) and fifth (switching) factors were correlated - . 31 with one another, suggesting that faster baseline reaction time was associated with larger switch costs. However, this cor- relation is somewhat misleading and may largely represent task differences. This is because the baseline reaction times were fastest in the m o r e - o d d tasks and slowest in the add-subtract tasks, whereas the switch costs were largest in the m o r e - o d d tasks and smallest in the add-subtract tasks. Indeed, all correla- tions between the baseline reaction time and the Switch 0 costs
within each task set were positive (i.e., r igh t - le f t = .27; m o r e - odd = .33; and add-subtract = .07).
There are two major results from this initial study. First, despite the fact that all of the switching measures were based on difference scores and hence might be expected t o have low reliability (e.g., Cohen & Cohen, 1983), the Switch 0 reaction time measures had respectable reliabilities. Second, the various measures were correlated in a pattern consistent with the exis- tence of distinct constructs corresponding to speed (i.e., baseline reaction time) and task switching (i.e., the additional delay in responding when the decision rule is changed).
S tudy 2
The major focus of the second study was on the roles of task switching and speed as potential mediators of relations between age and measures of fluid cognition. As noted earlier, many studies have been reported in which statistical control of paper- and-pencil and reaction time measures of speed reduced or elim- inated the relations of age to various measures of higher order cognitive functioning, including episodic memory, inductive rea- soning, and spatial visualization. The primary interest in this study is whether task switching might be more fundamental than processing speed in terms of the relations to age and measures of cognition. If so, strong and independent relations of measures of switching to age and to cognition would be expected when measures of speed are controlled.
Three tests of cognitive functioning were administered to assess fluid or process aspects of cognition. These were a test of inductive reasoning (matrix reasoning), a test of spatial visu- alization (cube assembly), and a test of episodic memory (free recall). Increased age has frequently been associated with lower levels of performance on tests such as these, and thus they should provide a reasonable basis for examining the role of the switching and reaction time measures as potential mediators of the age-cogni t ion relations.
Finally, the data were also subjected to an analysis designed to identify variables with unique or independent age-related in- fluences. Baddeley (1996) has recently described why efforts of this type are desirable:
One problem in attempting to carry out theoretically driven studies on ageing stems from the fact that almost every physical and cogni- tive function shows some decline. Consequently, showing that the elderly perform poorly on any given task cannot be regarded as evidence for the task's peculiar vulnerability to aging, unless other factors are ruled out. (p. 19)
Although one could argue that the use of difference scores, that is, subtracting the reaction time on the three preswitch trials from the reaction time on the switch trial, provides a relevant comparison, this procedure merely indicates whether the abso- lute difference between the two measures varies as a function of age, and not whether the age-related influence on the derived measure was independent of, and distinct from, the age-related influences on other measures (see Salthouse & Coon, 1994). The following method was therefore used in the current study: First the variance that all variables had in common was deter- mined, and then the age-related effects on an estimate of those common aspects was statistically controlled before examining

452 SALTHOUSE, FRISTOE, McGUTHRY, AND HAMBRICK
Table 2
Results of Exploratory Factor Analysis on Switching Variables, Study 1
Factor
Variable Speed M o r e - o d d Right- lef t Add-subtrac t Switching
R L - R T 0.88 0.04 - 0 . 0 9 0.03 0.16 M O - R T 0.70 -0 .19 -0 .24 -0 .18 0.46 AS - R T 0.91 0.09 -0 .14 - 0 . 0 2 0.33 MO-Uncer t . 0.03 - 0 , 7 4 - 0 . 1 6 -0 .07 0.12 M O - S W + 1 0.36 0,45 -0 .21 -0 .47 0.01 M O - S W + 2 - 0 . 0 6 0,67 0.21 -0 .27 -0 .12 M O - S W + 3 -0 .04 0,78 0.06 0.17 -0 .07 RL-Uncer t . 0.14 -0 .18 -0 .77 -0 .25 -0 .09 R L - S W + 1 0.32 0.31 0.45 -0 .09 -0 .03 R L - S W + 2 -0 .05 0,03 0.85 0.09 -0 .14 R L - S W + 3 -0 .24 0,01 0.74 0.12 0.14 AS-Uncer t . 0.06 -0 ,11 -0 .40 - 0 . 7 2 -0 .01 A S - S W + 1 0.34 0.52 -0 .13 0.41 0.50 A S - S W + 2 0.23 0.33 -0 .18 0.60 0.18 A S - S W + 3 -0 .20 -0 .16 0.13 0.66 -0 .11 R L - S W 0 0.45 0.14 0.15 -0 .19 0.67 M O - S W 0 0.28 -0 .26 -0 .14 -0 .13 0.57 AS - S W 0 0.04 -0 .10 0.03 0.17 0.79
Proportion of variance .182 .154 .128 .094 .074 Cumulative variance .182 .336 .464 .558 .628
Factor correlations
Speed - - - . 1 6 .16 .13 - .31 More -odd - - - . 0 9 - . 0 8 .04 Right- lef t - - - . 05 .02 Add-subtract - - - . 1 2 Switching
Note. RL = right/left; RT = the baseline reaction time; MO = more/odd; AS = add/subtract; Uncert. = the difference between reaction time on the three preswitch trials and the baseline reaction time; SW0 through SW3 = the additional times on the switch and postswitch trials relative to the three preswitch trials.
the age - re la t ed e f fec t s on ind iv idua l var iables . A n a d v a n t a g e o f
this ana ly t ica l p r o c e d u r e is tha t it a l lows the d e t e r m i n a t i o n o f
the ex t en t to w h i c h the age - re la t ed in f luences on the sw i t ch ing
var iab les are sha red wi th o ther var iables .
Method
Participants. A total of 161 adults between 18 and 80 years of age contributed complete data, and their descriptive characteristics are summarized in Table 3. An additional 37 individuals performed some of the tasks but either did not complete all of them within the 2.5 hour time limit imposed on the session (n = 17), or apparently did not understand one or more of the tasks because they had accuracy of less than 75% on the three trials prior to the switch trial in the switch condition of at least one of the three tasks (n = 20). The individuals whose data were not analyzed were somewhat older than those included in the analyses (i.e., mean age = 52.8 years vs. 44.1 years), but no other distinguishing characteristics of those dropped from subsequent analyses were apparent.
Procedure. All participants received the tasks in the following order: background demographic questionnaire, synonym and antonym vocabu- lary, pattern comparison, letter comparison, number matching, pattern matching, free recall, matrix reasoning, cube assembly, digit digit reac- tion time, digit symbol reaction time, r ight- lef t switching, more -odd switching, and add-subtract switching.
The three switching tasks were administered in the same manner as in Study 1. The digit digit and digit symbol reaction time tasks were also administered on computers and were presented in the following sequence: 18 trials of practice on digit digit, 90 trials on digit digit, 18 trials of practice on digit symbol, two blocks of 90 trials each on digit
Table 3
Demographic Characteristics o f Participants in Study 2
Variable
Age range (years)
18-39 4 0 - 5 9 6 0 - 8 0 (n = 66) (n = 62) (n = 33)
M SD M SD M SD
Age 28.1 6.7 48.0 5.8 68.8 5.1 % Women 54.5 69.3 57.6 Self-rated health 2.0 1.0 2.2 0.8 2.2 1.0 Years of education 14.8 2.2 15.1 2.1 15.0 3.0 Synonym vocabulary 5.3 2.7 6.0 3.1 7.9 2.5 Antonym vocabulary 4.6 2.7 5.5 3.1 6.5 3.3
Note. Self-rated health is on a 5-point scale, ranging from 1 (excellent) to 5 (poor).

TASK SWITCHING 453
symbol, followed by a final 90 trials on digit digit. The stimulus displays in both tasks consisted of a code table at the top of the screen containing nine pairs of items and a probe pair in the middle Of the screen. The pairs of items in the digit symbol task consisted of digits and symbols, and thus the research participant had to refer to the code table to deter- mine whether the items in the digit symbol probe pair were associated with one another. All items in the digit digit task consisted of digits, and thus the research participant merely had to decide whether the probe digits were physically identical. The instructions were that responses (i.e., slash [/] for same and Z for different) should be made as rapidly and accurately as possible.
The remaining tasks, which were all developed locally, were adminis- tered with paper-and-pencil procedures. The vocabulary tests consisted of 10 five-alternative multiple-choice questions each for the antonym and synonym portions. A total of 5 min were allowed to complete both of these tests. Each of the perceptual speed tests (i.e., pattern compari- son, letter comparison, number matching, and pattern matching) involved an instruction page with several examples and two test pages for which participants were allowed 30 s each.
Items in the pattern comparison test consisted of 30 pairs of patterns composed of three to nine line segments, and items in the letter compari- son test consisted of 21 pairs of three to nine letters. Approximately one half of the pairs in each test page were identical, and one half differed in the identity of a single element. Participants were instructed to write an S between the pairs that were the same, to write a D between the pairs that were different, and to do so as rapidly and accurately as possible.
Items in the number-matching and pattern-matching tests consisted of a two-digit target number or target pattern on the left and five alternative numbers or patterns on the right. The task was to circle the alternative on the right that matched the target on the left and to do so as rapidly and accurately as possible. There were 30 items in each matching test.
The free-recall test was based on the Rey Auditory Verbal Learning Test (Schmidt, 1996) and consisted of five study-test trials of a list of 15 words presented in the same order (i.e., drum, curtain, bell, coffee, school, parent, moon, garden, hat, farmer, nose, turkey, color, house, river). The words were read by the examiner at a rate of about 1 word every 2 s, and 45 s was allowed for written recall after each list. Each recall attempt was written on a separate page in a booklet.
The matrix reasoning test resembles the Raven's Progressive Matrices Test (Raven, 1962) and was initially developed to be computer adminis- tered (i.e., Salthouse, 1993a, 1994). Each item in the test contained a 3 × 3 matrix of geometric patterns with the lower right cell blank. Immediately below the matrix was a set of eight alternatives representing possible completions of the matrix. The task for the participant was to mark the best completion of the matrix from the set of alternatives. The test began with two practice problems with the answers provided and then participants were allowed 10 min to complete as many of the 20 problems as possible.
The cube-assembly test was based on a test described by Shepard and Feng (1972). Items in the test consisted of displays of six connected squares that were to be assembled to form a cube. One of the squares was shaded to represent the base of the cube, and two of the squares contained arrows. The task for the participant was to decide whether the arrows would point at one another when the cube was assembled and to indicate the decision by marking Y for yes or N for no. Two illustrated practice problems preceded the test of 24 items, for which participants were allowed 10 min.
Resul ts and Discuss ion
Mean reaction times and error percentages for the relevant measures in the three switching tasks are portrayed in Figure 5. The data are separated into three age groups for purposes of
illustration, but most of the analyses were based on treating the sample as continuous with respect to age. As in Study 1, the means for the single tasks in each set of tasks were similar and highly correlated (i.e., r ight = 1,078 ms, left = 1,061 ms, r = .95; m o r e - l e s s = 728 ms, o d d - e v e n = 731 ms, r = .83; and add = 1,200 ms, subtract = 1,361 ms, r = .87), and thus the two values were averaged to form a single baseline measure. Asymmetry of switching was examined in the same manner described in Study 1. The switch times, and ratios of switch times to times in the new task, were: r i g h t - l e f t = 1,997 ms, r = 1.70; l e f t - r i gh t = 2,108 ms, r = 1.83; m o r e - o d d = 3,074 ms, r = 3.80; o d d - m o r e = 2,902 ms, r = 3.38; add - sub t r ac t = 1,982 ms, r = 1.39; and sub t r ac t - add = 1,903 ms, r = 1.47. As in Study 1, the two switch times within each task set were generally similar, particularly when expressed relative to the t ime in the new task. The averages of the two types of switches in each task combinat ion were therefore used in all subsequent analyses.
Again as in Study 1, analyses were conducted on the differ- ences in switch costs across the two blocks of switching trials. Unlike Study 1, significant reductions in the t ime costs of switching were evident f rom the first to the second block of trials in each set of tasks. The mean difference (i.e., switch cost for Block 1 minus switch cost for Block 2) and the percentage of participants with differences greater than zero were: r i g h t - left 112 ms, 68%; m o r e - o d d 444 ms, 76%; and add - sub t r ac t 108 ms, 67%. The discrepancy across studies may be attribut- able to the greater heterogeneity of the sample, and slower over- all responses, in the current study compared to the previous study. However, none of the correlations between age and the magnitude of the Block 1 minus Block 2 difference score were statistically significant (i.e., r igh t - le f t , r = .05; m o r e - o d d , r = . 12; and a d d - subtract, r = . 15).
Inspection of Figure 5 reveals that both reaction time and the error percentages were greater with increased age and that the age differences were larger on the switch trials than on the preswitch or baseline trials. This latter point is evident in the greater separation of the functions for the three age groups on the switch trials than on the three trials preceding the switch, or on the baseline functions. Analyses of variance with age (i.e., 1 8 - 3 9 , 4 0 - 5 9 , and 6 0 - 8 0 ) and trial type (i.e., Switch 0 trial vs. either average of the baseline trials or average of the three preswitch trials) were conducted on both the t ime and accuracy measures. The Age × Trial Type interactions were all statistically significant, as the F ratios for the Age x Trial Type interaction in the t ime comparisons all exceeded 15, and on ly one of the ratios in the accuracy comparisons was less than 5.3.
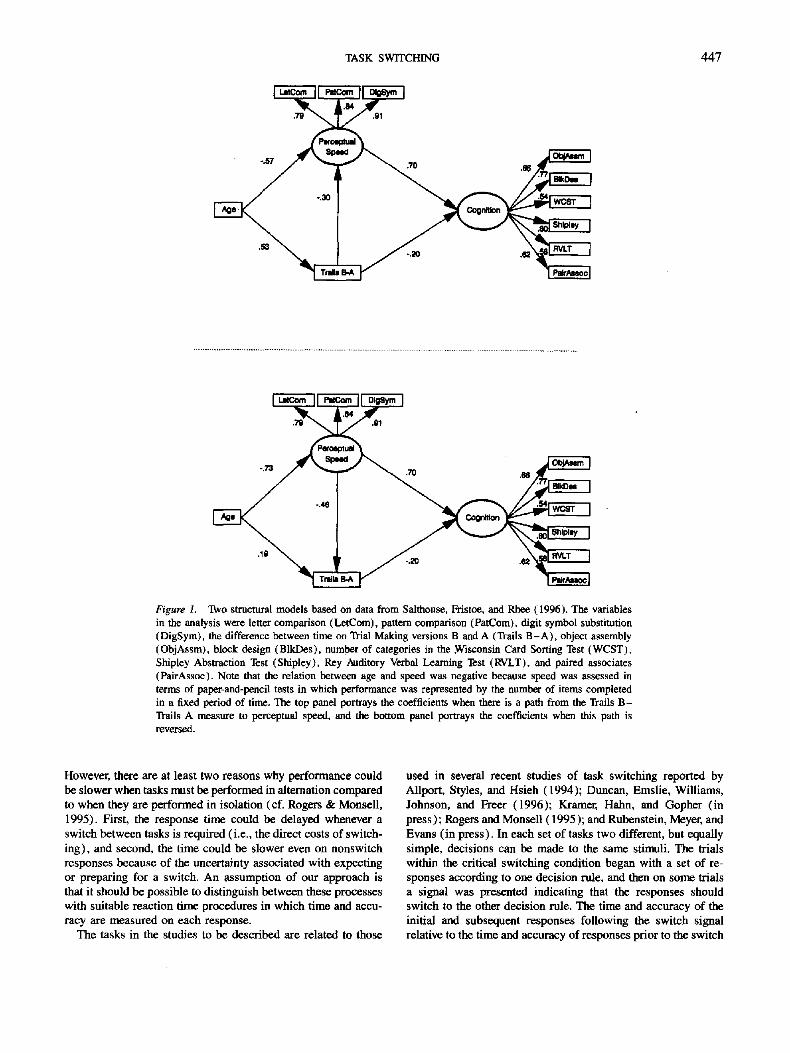
Means, standard deviations, reliabilities, significance tests, and age correlations for the switching measures are presented in Table 4. Notice that the reliabilities were high for the baseline reaction times, moderate for the Switch 0 reaction times, and moderate to low for the postswitch reaction times. The same overall pattern is evident in the error percentages, albeit with generally lower absolute values. The patterns of switch time costs evident in the means were also apparent in terms of the percentages of participants with switch costs ( in reaction t ime) greater than zero. For example, the percentages in the r i g h t - left task for the 0, + 1, +2, and +3 responses were, respectively, 100, 91.3, 66.5, and 55.3. Corresponding percentages in the

454
4,000
o 3,500 ¢/3
E 3,000
q) 2,500 ._E I-- 2,000 ¢ -
.0_ 1,500 15
1,000 n-
5OO
18
15 2 L . LU 12 19 O) ¢0 9 E 19 2 6 O a.
3
Right/Left
60-80
Switch Position
SALTHOUSE, FRISTOE, McGUTHRY, AND HAMBRICK
M o r e / O d d
6O-80
Switch Position
A d d / S u b t r a c t
6O8O
Switch Position
6O.8O
g : : : . . . . . I I I I
-3 -2 -1 0 1 2 3
Switch Position Switch Position
4O-59
Switch Position
Figure 5. Mean reaction time (top panel) and error percentages (bottom panel) in the three tasks as a function of the position of the switch signal and age group, Study 2.
4,000
3,500
3,000
2,500
2,000
1,500
1,000
5OO
18
15
12
9
6
3
m o r e - o d d task were 100, 85.1, 62,7, and 57.8, and those in the add-subtract task were 100, 77.6, 49.7, and 50.3.
It can also be seen in Table 4 that there were significant correlations between age and the baseline reaction time mea- sures in each task and between age and the Switch 0 and Switch + 1 measures. Increased age was also associated with signifi- cantly more errors on the switch trial in the m o r e - o d d tasks. However, with one exception there were no significant relations between age and the uncertainty measures, suggesting that adults of varying ages did not differ in the degree to which overall performance was affected by the requirement of switching be- tween tasks on some trials in the block. The age relations on the reaction time measures indicate that with increased age per- formance was slower in the baseline single task conditions, in the amount of additional time needed to respond on the trial in which the switch signal occurs, and on the immediately follow- ing trial. The age relations on the error measures may reflect difficulties in understanding the switch condition when it was first performed (i.e., the r igh t - le f t tasks were the first switching tasks performed in the session) and in remembering the change in response type (i.e., from Z and a slash mark [/] to X and a period [. ]) as well as the change in decision rule in the switch condition in the m o r e - o d d tasks.
Interrelations o f variables. Table 5 contains the correlation matrix for all of the primary variables in the study along with estimates of their respective reliabilities. Performance in the four perceptual speed tests was evaluated in terms of the number of
correct responses minus the number of incorrect responses, and the measures in the digit digit and digit symbol reaction time tasks Were the median reaction times in milliseconds. Scores on the cognitive tests correspond to the number of correct items in the matrix reasoning test, the difference between the number of correct and number of attempted but incorrect responses in the cube-assembly test, and the average number of words recalled across the five trials of the free-recall test.
Three points should be noted about the data in Table 5. First, all of the reliabilities are respectable, indicating that there was considerable systematic variance in each measure. Second, all of the measures were significantly correlated with age, and in every case except the two vocabulary measures, increased age was associated with poorer performance (i.e., lower scores in terms of number correct, or higher reaction times). Third, the highest correlations tended to be among measures of the same type. The two vocabulary measures were correlated .77, and the correlations among the three baseline reaction time measures in the switch tasks ranged between .62 and .72.
A more systematic method of exploring the interrelations among the measures consisted of performing a confirmatory factor analysis on all of the variables in Table 5 except age. The analysis specified five factors, defined according to the loading pattern in Table 6. This model provided a good fit to the data, X2(109, N = 161) = 175.17, NNFI = .95, CFI = .96, Std. RMR = .05, and the loadings on the factors and correlations among the factors are presented in Table 6. Notice that the
TASK SWITCHING 4 5 5
Table 4 Means, Standard Deviations, Estimated Reliabilities, and Age Correlations for Switching Measures, Study 2
Reaction time Switching measure M SD Rel. Age corr. M SD
% Error
Rel. Age corr.
Right-left
Baseline 1,069" 182 .96 .64* 1.57" 2.93 .52 .13 Uncertainty 73" 85 .37 .18 1.03" 4.21 .26 .30* Switch 0 898" 485 .71 .38* 8.27" 13.65 .76 .17 Switch + 1 243 a 301 .51 .26* 3.71" 10.99 .73 .10 Switch + 2 66" 170 .51 .23* 2.34" 6.49 .55 .04 Switch + 3 28 138 .43 .05 1.00 5.39 .54 .04
More-odd
Baseline 730 ~ 128 .86 .50* 3.95" 6.64 .68 .03 Uncertainty 85" 106 .51 .06 0.54 6.64 .37 - .06 Switch 0 2,197" 1,788 .89 .38* 6.50" 11.46 .62 .25* Switch + 1 214" 321 .31 .20* 2.53" 7.18 .28 .11 Switch + 2 88" 270 .54 .15 1.59" 6.67 .41 .10 Switch + 3 32" 121 .21 .21" 1.04 6.30 .18 .11
Add-subtract
Baseline 1,281" 259 .97 .36* 1.94 i 2.02 Uncertainty 64" 78 .13 - .04 0.57" 2.72 Switch 0 587" 319 .78 .41" 4.10" 8.91 Switch + 1 135' 211 .64 .29* 0.75 4.40 Switch + 2 11 121 .32 .04 0.59 4.41 Switch + 3 - 1 106 0 .01 0.31 4.13
Note. Estimates of reliability less than zero are replaced by values of zero. "Value significantly different from zero at p < .01 by within-subjects t test. * p < .01 .
.68 -.01
.23 .02
.59 .19 0 .12
.17 .08 0 .00
reaction t ime and perceptual speed constructs were very highly correlated with one another (i.e., - . 9 3 ) and that both were highly related to the cognit ion construct (i.e., - . 8 5 and .88). Perhaps the most interesting results f rom this table are that there is again evidence, as in Study 1, for the existence of a distinct switching construct, and all of the speed measures are highly correlated with one another and with the latent cognit ion cons t ruc t ) t '
Mediational models. The next set of analyses examined tffo different structural models in which the reaction t ime speed and task-switching constructs funct ioned as possible mediators of the relat ion between age and the construct representing fluid or process aspects of cognition. Only the baseline reaction t ime measures f rom the switch tasks were included in these analyses to provide the purest compar ison of the effects of reaction t ime speed and task switching. The initial model, portrayed in the top panel of Figure 6, assumed that switching was more funda- mental than speed, and thus the switching construct was postu- lated to mediate at least some of the relations between age and speed. The direct relat ion from age to cognit ion was not significant in any of the analyses to be considered. All of the postulated relations in this model were significantly different f rom zero, and the model provided a good fit to the data; X2(31, N = 161) = 54.14, NNFI = .95, CFI = .97, Std. R M R = .04.
However, a more parsimonious model, in the sense that there were fewer significant relations, resulted when the direction of
the relation between the switching and speed constructs was reversed. This model, which is portrayed in the bot tom panel of Figure 6, also provided a good fit to the data; X2(33, N = 161 ) = 60.14, NNFI = .95, CFI = .96, Std. R M R = .05. Notice that when task switching is assumed to be another manifestat ion of speed, by virtue of the relation f rom the speed construct to the switching construct, the switching construct is no longer significantly related either to age or to a latent construct repre- senting several measures of cognition. Moreover, even when switching is assumed to be more fundamental than speed by postulating a relat ion f rom the switching construct to the speed construct (as in the top panel of Figure 6 ) , there are still signifi- cant relations of age to speed, and the relations to the cognit ion construct are considerably stronger for the speed construct than for the switching construct.
Single common factor analysis. The final analysis consisted of a structural equation model in which each variable was re-
3 The correlation of .78 between the reaction time speed and switch factors in this analysis is considerably higher than, and in the opposite direction of, the correlation of -.31 in Study 1. In fact, when the same type of exploratory factor analysis on only the time measures from the switch tasks was performed on the data from this study, the baseline reaction time and Switch 0 measures loaded on the same factor. This pattern suggests that the reaction time speed and switch constructs may tend to converge in a sample with a wide range of ages.

4 5 6 SALTHOUSE, FRISTOE, McGUTHRY, AND HAMBRICK
I'N
III
. ~ . ~ . ~ - ~ ~ ~
. ~ ~ ~ ~
I l l l I I I
o ~ . ~ Z i ~ i ~
I1./
.= .= ~ .=
. ~ =
-~° ~
. p.~ J:= 0 C~
~ ~ . ~
~ ' ~ ~:
• ~ =~
~ 0 " ~
~,,~. ~e
o . ~

TASK SWITCHING 457
Table 6 Results of Confirmatory Factor Analysis, Study 2
Factor
Variable Vocab PPSpd RTSpd Switch Cognition
Syn. voc. Ant. voc. Pat. com. Let. com. Pat. mat. Num. mat. DDRT DSRT RL-RT MO-RT AS-RT RL-SW MO-SW AS-SW Matrix reasoning Cube assembly Free recall
.87
.91 .72 .75 .84 .66
.72
.84
.86
.81
.79 .67 .72 .69
.78
.44
.75
Correlations
Vocab - - .11 -.08 -.07 .32 PPSpd - - -.93 -.69 .88 RTSpd - - .78 -.85 Switch - - - .74 Cognition
Note. Vocab = vocabulary; PPSpd = perpetual speed; RTSpd = reac- tion time speed; Syn. voc. = synonym vocabulary; Ant. voc. = antonym vocabulary; Pat. com. = pattern comparison; Let. com. = letter compari- son; Pat. mat. = pattern matching; Num. mat. = number matching; DDRT = median digit digit reaction time; DSRT = median digit symbol reaction time; RL-RT, MO-RT, and AS-K'r = the baseline reaction times in the right-left, more-odd, and add-subtract tasks; RL-SW, MO-SW, and AS-SW = the switch costs on the switch trial in the right-left, more-odd, and add-subtract tasks.
lated to a single corrlmon factor that was related to age, and then it was determined if there were any significant direct relations of age to individual variables. The initial step in this procedure consisted of freely estimating the coefficients for the var iable- common and a g e - c o m m o n relations. These parameters were then fixed to the estimated values and the relations between age and each individual variable examined. If the coefficient for the age-var iable relation differed from zero by more than two standard errors, it was retained in the model and otherwise was dropped. The model resulting from these steps is illustrated in Figure 7.
Because the focus in this type of analysis is on the shared and unique relations of age to the variables, and not on the relations among all variables, the fit of the model to the complete data is only of secondary interest. Nevertheless, the fit of the model portrayed in Figure 7 was respectable; X2( 117, N = 161 ) = 234.30, NNFI = .92, CFI = .92, Std. RMR = .06. Three points should be noted about this figure. First, all of the variables had moderate to strong loadings on the common factor, indicat- ing that they shared considerable variance with one another. Second, there was a strong negative relation between age and the common factor, indicating that increased age was associated
with lower levels of what the variables had in common. Third, there were independent and distinct age-related influences only on the baseline reaction time measures in the r igh t - le f t and add-subtract tasks. The former relation, which was positive in direction, may reflect the additional difficulty associated with initially performing the tasks because the r igh t - le f t task was the first of these types of tasks performed during the session. The negative coefficient for the add-subtract baseline reaction time indicates that the age-related influences on that measure were overestimated from the effects through the common factor (i.e., the product of the coefficients for the relevant paths, - . 6 5 and - .83 , is .54, and the age correlation was .36). The fact that the age relations were smaller than expected on the basis of influences via the common factor on this measure may be an- other manifestation of the finding that age-related differences are often relatively small in measures of simple arithmetic (e.g., Geary, Salthouse, Chen, & Fan, 1996).
Genera l D i scus s ion
Before discussing the results it is useful to briefly summarize five important characteristics of the three sets of tasks used in these studies. First, each member of the pair of tasks had similar baseline reaction times when performed alone, suggesting that they were roughly comparable in terms of difficulty or familiar- ity. Second, in both tasks of the pair the same stimuli were used with different decision rules, such that the cueing of stimuli to responses was ambiguous. Third, each task within the pair had the same number of possible responses, with a total of nine in the r igh t - le f t and add-subtract tasks and two in the m o r e - o d d tasks. Fourth, switch and nonswitch trials were mixed together within the same trial blocks and thus were unlikely to differ with respect to general factors such as motivation, anxiety, and so forth. And fifth, the three pairs of tasks were structurally equivalent such that similar measures of switching performance could be derived from each combination of tasks.
A clear finding in both studies was that, with only one excep- tion, there were significant costs of switching from one task to another in both the time and error measures. Furthermore, these switch costs exhibited reliable individual differences, and the measures from different combinations of tasks were positively correlated with one another, indicating that people systemati- cally differ in the extent to which their performance is disrupted by the requirement to switch from one task to another. The discovery that there were significant correlations among the switch costs in the three sets of tasks suggests that similar processes were involved despite variations in the types of tasks and relations between them. The switch costs were operationally defined as the additional time and errors on trials when the decision rule has to be changed relative to the averages across the three preceding trials. They can therefore be interpreted as representing the difficulty, in either time or errors, of retrieving and implementing a different set of decision rules and/or map- ping of stimuli to responses.
Two additional findings in both studies provide further infor- mation about the nature of the switch costs. The first is that the switch costs were greater when both the decision rule and the response mapping changed (i.e., the m o r e - o d d tasks) than when only the decision rule changed (i.e., the r igh t - le f t and a d d -

4 5 8 SALTHOUSE, FRISTOE, McGUTI-IRY, AND HAMBRICK
Speed .34 / ~ \ / ~ - . ~
.54
.57 ~ . , / \ J -.a0
Switch
Figure 6. Two structural models with speed and switch constructs, Study 2. The top panel portrays the coefficients when there is a path from the switch construct to the speed construct, and the bottom panel portrays the coefficients when the direction of this path is reversed. The speed construct is assessed with reaction time measures scaled in units of time per response and thus the relation from age is positive rather than negative as in Figure 1. RL-RT = baseline reaction time in the right-left task; MO-RT = baseline reaction time in the more-odd task; AS-RT = baseline reaction time in the add-subtract task; RL-SW, MO-SW, and AS-SW = Switch 0 time costs in the right-left, more-odd,and add-subtract tasks; Cube Assm. = cube-assembly score; Mat. Reas. = matrix reasoning score; Free Recall = average number of words recalled across five lists.
subtract tasks) . This result makes sense if it is assumed that the switch costs are proportional to the magnitude of the required changes in the shift f rom one task to another. A second relevant finding is that the switch costs persisted for one to three re- sponses after the presentat ion of the switch signal. This result is inconsistent with results reported by Rogers and Monsell ( 1995, Experiment 6) , in which the switch costs were found to
be confined to the trial in which the switch was to occur. A variety of procedural differences, such as the use of sequences with alternations on every fourth trial and potentially low power due to a sample of only eight individuals in the Rogers and Monsell experiment, may have been responsible for this discrep- ancy. Regardless of the reasons for the different results, however, the data f rom the current studies indicate that at least some of

TASK SWITCHING 459
-.65
.08
.68 .75 .80 .65 .69 .69 .39 -.70 -.83
Figure 7. Structural model with a single common factor contributing to the age-related influences on all variables, Study 2. The variables in the analysis were pattern comparison (PatCom), letter comparison (LetCom), pattern matching (PatMat), number matching (NumMat), median digit digit reaction time (DDRT), median digit symbol reaction time (DSRT), baseline reaction time in the right-left task (RL- RT), baseline reaction time in the more-odd task (MO-RT), baseline reaction time in the add-subtract task (AS-RT), Switch 0 time costs in those same three tasks (i.e., RL-SW, MO-SW, and AS-SW), matrix reasoning score (Mat. Reas.), cube-assembly score (CubeAssm), and average number of words recalled across five lists (Recall).
the effects associated with changing from one task to another persist for several subsequent responses, as though there is some residual hesitancy in implementing the decision rules corre- sponding to the new task.
The results just described indicate that the phenomenon of costs of task switching is not specific to a single set of tasks and that there are reliable individual differences in a task-switching construct. The next question of interest concerned the relations of this switching construct to other variables. In particular, what are the relations of switching to age and to fluid or process aspects of cognition, and are those relations independent of other constructs, such as processing speed? The issue of the independence of age-related influences is particularly important because a very large number of cognitive variables have been reported to be significantly related to age, and they are not all necessarily independent of one another. When researchers focus on a single variable there is a tendency to emphasize task- specific interpretations of the age-related differences on that variable, but the validity of these types of interpretations can be examined only in the context of a broader range of variables.
Even when it has been established that there are coherent individual differences on the relevant measures, such that a con- struct can be identified that is distinct from other potentially related constructs, it could still be the case that most of the relations of that construct to other constructs are shared and are not distinct. As a somewhat fanciful example, a researcher might find distinct constructs corresponding to arm strength and to leg strength based on results that correlations among measures of arm strength and leg strength were higher among themselves
than with measures of the other limb. This pattern would be consistent with the existence of distinct arm strength and leg strength constructs, but there could still be almost complete overlap of the two constructs in terms of their relations to other variables, such as age and cognitive performance. Multivariate analytical methods are therefore needed to determine if, and to what extent, a given variable or construct has unique (i.e., independent) relations to other variables.
One type of multivariate method involves examining the fit of mediational models in which different relations among the variables are postulated. The models in Figures 1 and 6 are examples of this analytical technique. Although the structural relations in these models must be interpreted cautiously because they are based on data from a single point in time, they are nonetheless informative because the patterns of relations could be inconsistent with postulated relationships. Moreover, by com- paring alternative models differing in the relations between par- ticular constructs it is possible to draw inferences about which constructs are more encompassing or comprehensive with re- spect to the relations they have with other variables. It is in this latter respect that the contrast between the switch and speed constructs is relevant. Specifically, the discovery that there were fewer, but larger, direct relations among variables when in- creased age was postulated to affect speed, which in turn affects switching, compared to when increased age was postulated to affect switching, which then contributed to speed, suggests that, at least with respect to relations with age and with higher order cognition, the speed construct may be more fundamental than the switching construct.

460 SALTHOUSE, FRISTOE, McGUTHRY, AND HAMBRICK
The second type of multivariate analytical procedure used in these studies is the single common factor technique in which the age-related influences on what all the variables have in common are statistically controlled before examining the rela- tions of age to individual variables. The results of this procedure are portrayed in Figure 7. Several points should be noted about this figure. The first is that all variables had moderate to high loadings on the factor representing what is shared among the variables, with the highest loadings for the reaction time vari- ables and the lowest loading for the cube-assembly score. Be- cause many of the variables appear to have little resemblance to one another (e.g., reaction time to respond with the digit on the left or right of the display and the number of unrelated words recalled after an auditory presentation), the discovery that they all shared moderate amounts of variance with one another may be considered somewhat surprising. A second im- portant point about the model portrayed in Figure 7 is that there was a strong negative age-related influence on the common factor, but independent age-related influences were evident on only two variables. The negative age-common relation indicates that increased age was associated with lower levels of whatever all variables had in common, and the small number of indepen- dent or direct relations from age to individual variables suggests that for most of the variables almost all of the age-related influ- ences were shared with other variables. Inspection of Figure 7 reveals that this was also true for the three switch measures, which implies that there is apparently nothing special about these variables in terms of their age-related influences.
The two variables with independent or unique age-related influences in this analysis were the baseline reaction times in the right-left and add-subtract tasks. As noted earlier, the un- derestimation of the age relation for the RL-RT variable may be attributable to somewhat slower learning on the part of older adults because this was the first task of this type performed in the session, and the overestimation of the age relation for the AS-RT variable may be a reflection of the relative preservation of simple arithmetic skills on the part of older adults.
Different perspectives could obviously be adopted with re- spect to a construct like task switching. For example, one per- spective could focus on trying to understand the processes in- volved in the costs of switching between tasks and determining the relative contribution of each under different conditions. The studies by Allport et al. (1994), Rogers and Monsell (1995), and Rubenstein et al. (in press) are examples of this approach. However, an alternative perspective is concerned with under- standing the nature of individual differences in task switching and the relations of switching measures to other types of vari- ables. The current studies are obviously closer to this second perspective than to the first. Nevertheless, the results of the second study have an interesting implication with respect to components of switching. Assume that task switching consists of several different components or processes, such as realloca- tion of the focus of attention, change in mental set, reinstatement of a different mapping of decisions to responses, proactive inter- ference, etc. Now consider the results of Study 2 that the aggre- gate switch measures had little or no relation to age or to meat sures of higher order cognition when the measures of baseline reaction time, postulated to reflect a construct Of processing speed, were statistically controlled. This pattern of results sug-
gests that any component measures of switching are also un- likely to have independent relations with age or measures of cognitive functioning because the more global and inclusive measures do not have independent relations. Of course it is possible that complicated trade-offs could occur such that there were positive relations with one component and negative rela- tions with another component that precisely canceled one an- other to produce no overall relation in the aggregate variable, but additional evidence is probably needed before this possibil- ity could be considered plausible.
It is instructive to compare our results with those of three studies recently reported by Kramer et al. (in press) because in both cases adults of different ages were compared in measures of task switching. In the Kramer et al. (in press) studies only a single set of tasks was used, and the participants had an opportunity to prepare for the switch in advance of its occur- rence either because a signal was presented prior to the switch (Studies 1 and 2) or because the participants were informed that the switch occurred on every fifth trial. However, as in the current studies, the switching measures were found to have reliable individual variance independent of the other reaction time measures, suggesting that they represented a distinct con- struct. Furthermore, there were substantial age differences in the switch measures when the opportunities for advance preparation were limited by short intervals between trials. Kramer et al. reported significant reductions in the absolute magnitude of the switch costs with practice, but the amount of independent age- related variance in the switch measures increased with practice in each study and thus it is not clear how the practice effects in those studies should be interpreted.
To summarize, the results of these studies indicate that people differ in the ease with which they can shift from one task to another, in addition to the efficiency with which they can per- form each individual task. Task switching is therefore a mean- ingful theoretical construct and is not restricted to a particular set of tasks. Measures of task switching were found to be sig- nificantly related to adult age (i.e., older adults had more diffi- culty switching) and to measures of cognitive functioning (i.e., faster switchers had higher levels of cognitive performance). However, those relations were not independent of other con- structs. In particular, if measures of baseline reaction time were statistically controlled, there were no longer any significant rela- tions of switching either to age or to measures of higher order cognition. The implication is that although task switching can be identified as a distinct construct, most of the relations it has with other variables are shared and are not unique to switching.
References
Allport, A., Styles, E. A., & Hsieh, S. (1994). Shifting intentional set: Exploring the dynamic control of tasks. In C. Umilta & M. Moscovitch (Eds.), Attention and performance XV (pp. 421-452). Cambridge, MA: MIT Press.
Baddeley, A. (1996). Exploring the central executive. Quarterly Journal of Experimental Psychology, 49A, 5-28.
Barrett, G. B., Mihal, W. L., Panek, P.E., Sterns, H. L., & Alexander, R.A. (1977). Information processing skills predictive of accident involvement for younger and older commercial drivers. Industrial Ger- ontology, 4, 173-182.
Botwinick, J., Brinley J. E, & Robbin, J. S. (1958). Task alternation

TASK SWITCHING 461
time in relation to problem difficulty and age. Journal of Gerontology, 13, 414-417.
Braune, R., & Wickens, C. D. (1985). The functional age profile: An objective decision criterion for the assessment of pilot performance capacities and capabilities. Human Factors, 27, 549-554.
Brinley, J. E ( 1965 ). Cognitive sets, speed and accuracy of performance in the elderly. In A. T. Welford & J. E. Birren (Eds.), Behavior, aging, and the nervous system (pp. 114-149). Springfield, IL: Charles C Thomas.
Cohen, J., & Cohen, P. ( 1983 ). Applied multiple regression~correlation analysis for the behavioral sciences ( 2nd ed.). Hillsdale, N J: Edbaum.
Duncan, J., Emslie, H., Williams, P., Johnson, R., & Freer, C. (1996). Intelligence and the frontal lobe: The organization of goal-directed behavior. Cognitive Psychology, 30, 257-303.
Garner, W.R., Hake, H.W., & Erikson, C. W. (1956). Operationism and the concept of perception. Psychological Review, 63, 149-159.
Geary, D. C., Salthouse, T. A., Chen, G. P., & Fan, L. (1996). Are East Asian versus American differences in arithmetical ability a recent phenomenon? Developmental Psychology, 32, 254-262.
Kramer, A. E, Hahn, S., & Gopher, D. (in press). Task coordination and aging: Explorations of executive control processes in the task switch- ing paradigm. Acta Psychologica.
Raven, J. (1962). Advanced Progressive Matrices, Set I1. London: H. K. Lewis.
Reitan, R.M. (1992). Trail Making Test: Manual for administration and scoring. Tucson, AZ: Reitan Neuropsychology Laboratory.
Rogers, R.D., & Monsell, S. (1995). Costs of a predictable switch between simple cognitive tasks. Journal of Experimental Psychology: General, 124, 207-231.
Rubenstein, J., Meyer, D. E., & Evans, J. E. (in press). Executive control of cognitive processes in task switching. Journal of Experimental Psychology: Human Perception and Performance.
Salthouse, T. A. (1993a). Influence of working memory on adult age
differences in matrix reasoning. British Journal of Psychology, 84, 171-199.
Salthouse, T. A. (1993b). Speed mediation of adult age differences in cognition. Developmental Psychology, 29, 722-738.
Salthouse, T. A. (1994). The nature of the influence of speed on adult age differences in cognition. Developmental Psychology, 30, 240- 259.
Salthouse, T. A. (1996). The processing speed theory of adult age differ- ences in cognition. Psychological Review, 103, 403-428.
Salthouse, T.A., & Coon, V.E. (1994). Interpretation of differential deficits: The case of aging and mental arithmetic. Journal of Experi- mental Psychology: Learning, Memory, and Cognition, 20, 1172- 1182.
Salthouse, T. A., & Fristoe, N. M. (1995). Process analysis of adult age effects on a computer-administered trail making test. Neuropsychol- ogy, 9, 518-528.
Salthouse, T. A., Fristoe, N., & Rbee, S. H. (1996). How localized are age-related effects on neuropsychological measures? Neuropsychol- ogy, 10, 272-285.
Schaie, K.W. (1958). Rigidity-flexibility and intelligence: A cross- sectional study of the adult life span from 20 to 70. Psychological Monographs, 72(Whole No. 9).
Schmidt, M. (1996). Rey Auditory Verbal Learning Test: A Handbook. Los Angeles: Western Psychological Services.
Shepard, R. N., & Feng, C. (1972). A chronometric study of mental paper folding. Cognitive Psychology, 3, 228-243.
Stankov, L. (1988). Aging, attention, and intelligence. Psychology and Aging, 3, 59-74.
Wickens, C. D., Braune, R., & Stokes, A. (1987). Age differences in the speed and capacity of information processing: 1. A dual-task approach. Psychology and Aging, 2, 70-78.
Received November 24, 1997 Revision received February 17, 1998
Accepted February 25, 1998 •


![TOPICAL PROBLEMS OF FLUID MECHANICS 37 DOI: ...€¦ · This relation is representative of an ideal Bingham fluid as reported by several authors [8,10]. 2. Problem Description The](https://static.fdocuments.in/doc/165x107/5e3aaa316dfd31276c179a20/topical-problems-of-fluid-mechanics-37-doi-this-relation-is-representative.jpg)