Relation between roughness and processing conditions …mazeran/A26.pdf · Relation between...
11
Relation between roughness and processing conditions of AISI 316L stainless steel treated by ultrasonic shot peening J. Marteau a,n , M. Bigerelle b , P.-E. Mazeran a , S. Bouvier a a Laboratoire Roberval, UMR 7334, Université de Technologie de Compiègne, Centre de Recherches de Royallieu, BP 20529, 60205 Compiègne Cedex, France b Laboratoire Thermique, Energétique, Mise en forme, Production, UMR 8530, EA 4542, Université de Valenciennes et du Hainaut Cambrésis, Le Mont Houy, 59313 Valenciennes, France article info Article history: Received 23 July 2013 Received in revised form 12 June 2014 Accepted 16 July 2014 Keywords: Multiscale roughness Ultrasonic shot peening stainless steel abstract This article assessed the roughness induced by ultrasonic shot peening. Surface properties of AISI 316L steel specimens were modified through the variation of ultrasonic shot-peening parameters (shot material, shot diameter, sonotrode amplitude vibration and coverage). Each surface was characterized using fifty surface roughness parameters and two types of robust Gaussian filter (low pass and high pass) associated with twenty one cut-off lengths. For each type of processing parameter, the most relevant roughness parameter and its corresponding length scale and filter were found. A linear relationship was identified between the four ultrasonic shot-peening parameters and the mean density of furrows with a coefficient of determination equal to 0.97. & 2014 Elsevier Ltd. All rights reserved. 1. Introduction Shot peening is a mechanical surface treatment widely used in automotive and aerospace industries to enhance the fatigue life of mechanical parts [1,2]. In this process, many small and hard particles, called shots, are projected at high velocities onto the sample. The multiple impacts plastically deform the mate- rial surface and induce an in-plane compressive residual stress field near the surface. Several other surface deformation processes have been recently developed such as Surface Mechanical Attrition Treatment (SMAT) [3], ultrasonic impact peening, laser peening [4], ball and burnish- ing [5] or ultrasonic shot peening technique [6]. The latter, unlike conventional shot-peening, consists in energizing the shots using a sonotrode vibrating at ultrasonic frequency, instead of using compressed air or centrifugal effects. All these treatments aim at increasing the material fret- ting wear resistance [7,8] . However, the impacts usually induce increasing surface roughness that can accelerate crack nucleation and can thus decrease the fatigue life of the material [9] . As a consequence, many researchers have taken interest in the evolution of the material roughness after the surface mechanical treatment. Two main topics can be identified in the literature: (i) Some researchers try to assess the influence of various surface treatments on material roughness. For instance, Maawad et al. [10] compared the effects of shot peening, ball burnishing, laser shock peening and ultrasonic shot peening on the surface roughness of an α-titanium alloy, using the average absolute value of the five highest peaks and the five lowest valleys over the cut-off length. Gao [11] explored the effects of shot peening and laser peening on the fatigue life by determining the stress concentration factor K t , proposed by [12]. The latter is built using the maximum peak-to-valley height and the mean spacing of adjacent local peaks. (ii) Other researchers observe the impact of the surface treatment conditions on the material roughness. Arifvianto et al. [13] investigated the effect of SMAT on the roughness of AISI 316L stainless steel, using various combinations of processing para- meters (motor speed, treatment duration, ball diameter, ball number). Similarly, Mordyuk and Prokopenko [14] assessed the effect of the duration of ultrasonic impact peening on material roughness. The one-dimensional average roughness R a is the most widely used parameter to describe roughness, as shown in Table 1. However, the use of this sole parameter may not enable to thoroughly characterize all the features of the topography. Thus, some research- ers chose to use additional roughness parameters. For instance, the Contents lists available at ScienceDirect journal homepage: www.elsevier.com/locate/triboint Tribology International http://dx.doi.org/10.1016/j.triboint.2014.07.013 0301-679X/& 2014 Elsevier Ltd. All rights reserved. n Corresponding author. Tel.: þ33 3 44 23 73 34; fax: þ33 3 44 23 49 84. E-mail address: [email protected] (J. Marteau). Please cite this article as: Marteau J, et al. Relation between roughness and processing conditions of AISI 316L stainless steel treated by ultrasonic shot peening. Tribology International (2014), http://dx.doi.org/10.1016/j.triboint.2014.07.013i Tribology International ∎ (∎∎∎∎) ∎∎∎–∎∎∎
Transcript of Relation between roughness and processing conditions …mazeran/A26.pdf · Relation between...

Relation between roughness and processing conditions of AISI 316Lstainless steel treated by ultrasonic shot peening
J. Marteau a,n, M. Bigerelle b, P.-E. Mazeran a, S. Bouvier a
a Laboratoire Roberval, UMR 7334, Université de Technologie de Compiègne, Centre de Recherches de Royallieu, BP 20529, 60205 Compiègne Cedex, Franceb Laboratoire Thermique, Energétique, Mise en forme, Production, UMR 8530, EA 4542, Université de Valenciennes et du Hainaut Cambrésis, Le Mont Houy,59313 Valenciennes, France
a r t i c l e i n f o
Article history:Received 23 July 2013Received in revised form12 June 2014Accepted 16 July 2014
Keywords:Multiscale roughnessUltrasonic shot peeningstainless steel
a b s t r a c t
This article assessed the roughness induced by ultrasonic shot peening. Surface properties of AISI 316Lsteel specimens were modified through the variation of ultrasonic shot-peening parameters (shotmaterial, shot diameter, sonotrode amplitude vibration and coverage). Each surface was characterizedusing fifty surface roughness parameters and two types of robust Gaussian filter (low pass and high pass)associated with twenty one cut-off lengths. For each type of processing parameter, the most relevantroughness parameter and its corresponding length scale and filter were found. A linear relationship wasidentified between the four ultrasonic shot-peening parameters and the mean density of furrows with acoefficient of determination equal to 0.97.
& 2014 Elsevier Ltd. All rights reserved.
1. Introduction
Shot peening is a mechanical surface treatment widely usedin automotive and aerospace industries to enhance the fatiguelife of mechanical parts [1,2]. In this process, many small andhard particles, called shots, are projected at high velocities ontothe sample. The multiple impacts plastically deform the mate-rial surface and induce an in-plane compressive residual stressfield near the surface.
Several other surface deformation processes have been recentlydeveloped such as Surface Mechanical Attrition Treatment (SMAT)[3], ultrasonic impact peening, laser peening [4], ball and burnish-ing [5] or ultrasonic shot peening technique [6]. The latter, unlikeconventional shot-peening, consists in energizing the shots using asonotrode vibrating at ultrasonic frequency, instead of usingcompressed air or centrifugal effects.
All these treatments aim at increasing the material fret-ting wear resistance [7,8]. However, the impacts usuallyinduce increasing surface roughness that can accelerate cracknucleation and can thus decrease the fatigue life of thematerial [9].
As a consequence, many researchers have taken interest inthe evolution of the material roughness after the surface
mechanical treatment. Two main topics can be identified inthe literature:
(i) Some researchers try to assess the influence of various surfacetreatments on material roughness. For instance, Maawad et al.[10] compared the effects of shot peening, ball burnishing,laser shock peening and ultrasonic shot peening on the surfaceroughness of an α-titanium alloy, using the average absolutevalue of the five highest peaks and the five lowest valleys overthe cut-off length. Gao [11] explored the effects of shotpeening and laser peening on the fatigue life by determiningthe stress concentration factor Kt, proposed by [12]. The latteris built using the maximum peak-to-valley height and themean spacing of adjacent local peaks.
(ii) Other researchers observe the impact of the surface treatmentconditions on the material roughness. Arifvianto et al. [13]investigated the effect of SMAT on the roughness of AISI 316Lstainless steel, using various combinations of processing para-meters (motor speed, treatment duration, ball diameter, ballnumber). Similarly, Mordyuk and Prokopenko [14] assessedthe effect of the duration of ultrasonic impact peening onmaterial roughness.
The one-dimensional average roughness Ra is the most widelyused parameter to describe roughness, as shown in Table 1. However,the use of this sole parameter may not enable to thoroughlycharacterize all the features of the topography. Thus, some research-ers chose to use additional roughness parameters. For instance, the
Contents lists available at ScienceDirect
journal homepage: www.elsevier.com/locate/triboint
Tribology International
http://dx.doi.org/10.1016/j.triboint.2014.07.0130301-679X/& 2014 Elsevier Ltd. All rights reserved.
n Corresponding author. Tel.: þ33 3 44 23 73 34; fax: þ33 3 44 23 49 84.E-mail address: [email protected] (J. Marteau).
Please cite this article as: Marteau J, et al. Relation between roughness and processing conditions of AISI 316L stainless steel treated byultrasonic shot peening. Tribology International (2014), http://dx.doi.org/10.1016/j.triboint.2014.07.013i
Tribology International ∎ (∎∎∎∎) ∎∎∎–∎∎∎
maximum height Rz [8] or the maximum roughness depth Rmax [15]were added to the observation of the Ra. To better characterize theheight distribution of the peaks and the symmetry of the profile of ashot peened low alloy steel, Bagherifard et al. [16] also studied theevolution of the kurtosis Rku and skewness Rsk.
Roughness parameters are numerous but seem to remainuntapped. Furthermore, few studies question the relevance ofthe roughness parameters used to describe the effects of thetested surface treatment. Indeed, the choice of the roughnessparameter is analyzed more comprehensively only in few cases,such as the search for biocompatibility [17].
In this work, three-dimensional roughness measurements arescrupulously analyzed. The aim is to identify the most relevantroughness parameters for the description of the effects of theprocessing parameters on the measured roughness. The investi-gated processing parameters are the shot material, shot diameter,sonotrode amplitude vibration and coverage (i.e. the percentage ofthe surface impacted once of more). A relation linking theobtained roughness to the combination of parameters used forthe ultrasonic shot peening treatment is then searched.
This article is divided into four sections. Section 2 presents thematerial and the methods used in this study. Section 3 is devotedto the analysis of the roughness of the ultrasonically shot peenedspecimens: it discusses the identified relevant parameters andsuggests a relationship between the topography and the designparameters used for the surface treatment. Section 4 concludesthis work and suggests future topics related to this study.
2. Material and methods
2.1. Material and processing parameters
The material used in this study is AISI 316L stainless steel. Thesamples are cut from a 16 mm rod into 10 mm thick discs. This
material is composed of a single austenitic phase. The 316Lspecimens are mechanically polished using an automatic grindingmachine to get a mirror-like surface.
Ultrasonic shot peening was carried out using various proces-sing parameters that are: the shot diameter (1 or 2 mm), the shotmaterial (304L or 100C6), the coverage (100%, 1000% or 10,000%)and the amplitude vibration of the sonotrode (30, 60 or 80 mm).Coverage refers to the ratio of the surface area that is alreadyimpacted to the total surface area. Microscopic observations areused to assess coverage smaller than 100. Coverage larger than100% is calculated using the processing time needed to reach 100%coverage. As an example, coverage equal to 200% means that theprocessing time is equal to twice the one needed to reach 100%coverage.
Eight specimens were studied from the combination of the shotdiameter, the shot material, the coverage and the amplitudevibration of the sonotrode. The chosen processing parametersare presented in Table 2.
2.2. Roughness measurements
Surface roughness data were obtained using a three-dimen-sional non-contact optical profilometer (Zygo NewView™ 7300,Zygo Corp., USA). The white-light interferometer was used with a20� objective. Its lateral resolution is equal to 71 nm while itsvertical resolution is about 3 nm. Surfaces of 348 mm�262 mmwere measured. Using the stitching function, they were over-lapped with a percentage of 20% to obtain surfaces of 1.19 mm�0.891 mm (described by 2176�1632 points). Stitching enables tostudy large areas without decreasing the field of view. In thisstudy, twenty stitched surfaces were randomly acquired for eachspecimen in order to ensure a good representativeness of thespecimen roughness. Each 3D surface was flattened out using apolynomial of degree 3.
2.3. Multiscale roughness characterization
The surface topography resulting from the ultrasonic shotpeening treatment was characterized through the coupling of aroughness parameter with a cut-off length and a filter. Fiftyroughness parameters were calculated for each specimen in orderto find the most relevant one. Some of the most significantroughness parameters calculated in this investigation are listedin Table 3. The roughness parameters are amplitude ones [18] suchas the arithmetic mean deviation Sa, the root-mean-square devia-tion of the surface Sq. There are also hybrid parameters [18] likethe density of summits Sds, spatial parameters [19] like the textureaspect ratio Str or functional parameters [19] like the extreme peakheight Sxp.
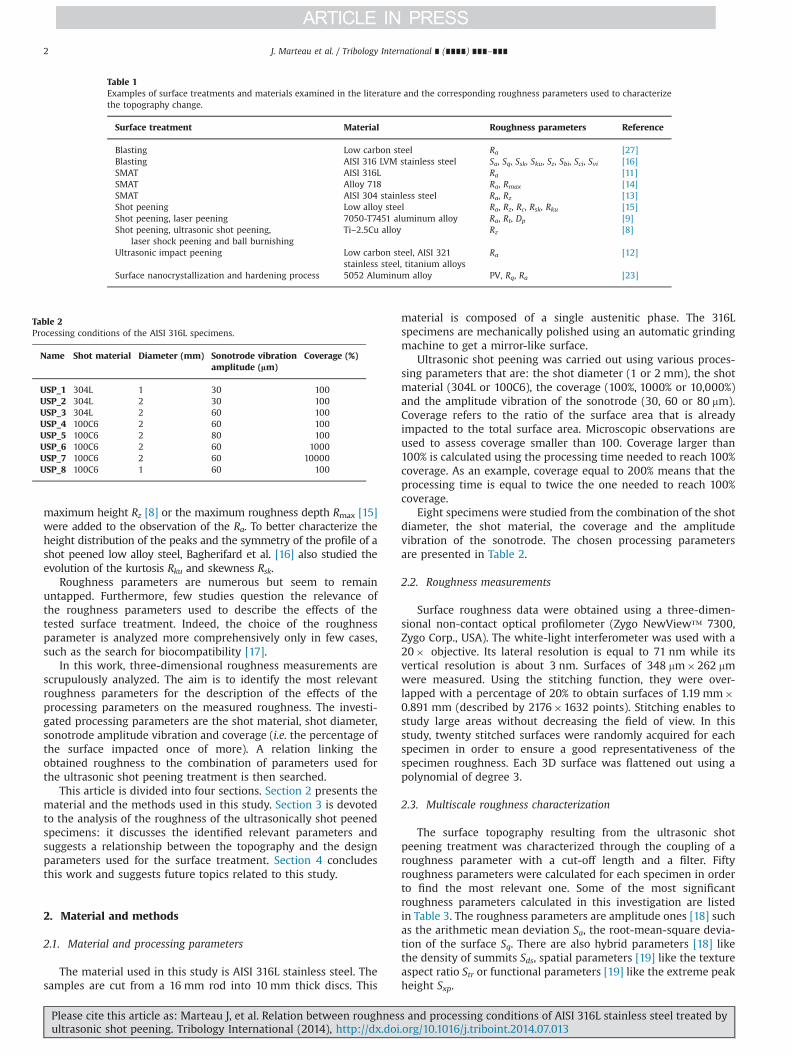
Table 1Examples of surface treatments and materials examined in the literature and the corresponding roughness parameters used to characterizethe topography change.
Surface treatment Material Roughness parameters Reference
Blasting Low carbon steel Ra [27]Blasting AISI 316 LVM stainless steel Sa, Sq, Ssk, Sku, Sz, Sbi, Sci, Svi [16]SMAT AISI 316L Ra [11]SMAT Alloy 718 Ra, Rmax [14]SMAT AISI 304 stainless steel Ra, Rz [13]Shot peening Low alloy steel Ra, Rz, Rc, Rsk, Rku [15]Shot peening, laser peening 7050-T7451 aluminum alloy Ra, Rt, Dp [9]Shot peening, ultrasonic shot peening,
laser shock peening and ball burnishingTi–2.5Cu alloy Rz [8]
Ultrasonic impact peening Low carbon steel, AISI 321stainless steel, titanium alloys
Ra [12]
Surface nanocrystallization and hardening process 5052 Aluminum alloy PV, Rq, Ra [23]
Table 2Processing conditions of the AISI 316L specimens.
Name Shot material Diameter (mm) Sonotrode vibrationamplitude (lm)
Coverage (%)
USP_1 304L 1 30 100USP_2 304L 2 30 100USP_3 304L 2 60 100USP_4 100C6 2 60 100USP_5 100C6 2 80 100USP_6 100C6 2 60 1000USP_7 100C6 2 60 10000USP_8 100C6 1 60 100
J. Marteau et al. / Tribology International ∎ (∎∎∎∎) ∎∎∎–∎∎∎2
Please cite this article as: Marteau J, et al. Relation between roughness and processing conditions of AISI 316L stainless steel treated byultrasonic shot peening. Tribology International (2014), http://dx.doi.org/10.1016/j.triboint.2014.07.013i

As the values of the roughness parameters are directly linkedwith the cut-off length [20,21], twenty-one cut-off lengths ran-ging from 5 mm to 1100 mm were tested with two types of robustGaussian filters [22]: a low-pass filter and a high pass filter. Theuse of these filters associated with different cut-offs allows toaccess to the waviness and roughness of the surfaces. Figs. 1and 2 illustrate the effects of the coupling of a filter with a cut-offlength.
2.4. Assessment of the relevance of the roughness parameters
The assessment of the most relevant parameter enabling thecharacterization of the effects of the different processing para-meters is based on the coupling of an analysis of variance (ANOVA)with a recent resampling technique called Bootstrap [23].
The main aim of bootstrapping is to provide a confidenceinterval that enables to integrate the variability of roughness datainto ANOVA. The idea of bootstrapping consists in generating alarge number N (N¼1000 in this study) of simulated bootstrapsets of samples of size K (K¼20), from an experimental data set ofthe same size K. Each simulated bootstrap sample is a set of size Kand is the result of the sampling of the experimental data set. Thebootstrap sample is formed from the experimental data set usingrandomly sampling with replacement [24]. Thus, the bootstrapsample is not identical to the original experimental set as itcontains different scores than the experimental set (some valuescan appear twice or more whereas others may not appear). Thisbootstrap set of 1000 values is then used to build an empiricalprobability density function for each roughness parameter Siassociated with a filter and a cut-off length.
This empirical probability density function is then used in theanalysis of variance. For each parameter Si, the F-statistic [25] iscalculated considering two or three classes of processing para-meters (e.g. for the material ball, the classes are 304L or 100C6whereas for the coverage, the classes are 100%, 1000% and10,000%). In addition to the average and median of the F-statistic,the percentile 5% and 95% are determined as they can be used tocompute a 90% confidence level. The F-statistic average is thenused to rank the different roughness parameter Si associated with
a filter and a cut-off regarding their ability to characterize the twoor three classes.
3. Results and discussion
3.1. Effect of the shot material
The shot material effect on roughness was studied using thespecimens called USP_3 and USP_4 as their processing conditionsare the same, except for the shot material. Using both specimens,the most relevant roughness parameter enabling to detect the shotmaterial effect on topography was searched using the ANOVAmethod. The association of a roughness parameter with a type offilter and its cut-off length gave 2100 combinations that wereclassified according to their F-statistic average value, as depictedby Fig. 3.
The first-ranked parameter is the density of summits Sdscomputed using a 19 mm cut-off with a high-pass filter. Thus, itis the most relevant parameter for the description of the shotmaterial effect. The Sds parameter belongs to the hybrid para-meters describing the amplitude and spacing characteristics of thesurface. It represents the number of peaks per unit area. Accordingto [18], the peaks taken into account for the calculation of the Sdsparameter are detected by local neighborhood. A point is con-sidered as a peak if it is higher than its eight neighbors.
Fig. 4 shows the distribution of this parameter for both types ofshots, at the relevant scale. It is worth noting that the histogramsare perfectly disconnected. It confirms the ability of this parameterto describe the shot effect on the specimen topography. If bothdistributions are assumed to be normal, then the average Sds valuefor the specimen impacted with 100C6 shots is equal to 19,180peaks/mm2 with a standard deviation equal to 150 peaks/mm2
while the Sds value is equal to 11,360 peaks/mm2 with a standarddeviation equal to 45 peaks/mm2 for the 304L shots. A lowerdensity of peaks for the 304L shots means that the valleys aresignificantly larger than the ones obtained with the 100C6 shots.
With regard to the roughness parameters relevance, the arith-metic mean deviation Sa parameter first appears at the 51thposition of the ranking composed of 2100 combinations. It alsogave two well separated distributions as in Fig. 5 thus enabling todetect the effect of the change of shot material.
The hardness of the 304L shots and 100C6 shots is respectivelyequal to 3.6 GPa and 7.6 GPa, while the hardness of the 316Lworkpiece is approximately equal to 3.5 GPa. As the hardness ofthe 304L shot is of the same order of magnitude as the workpiecehardness, the 304L shots probably tend to be more deformed thanthe 100C6 shots during the impacts. Thus, they induce largervalleys and a smaller density of peaks than the 100C6 shots, asconfirmed by the shapes of the profiles presented in Fig. 6.
Harada et al. [26] reported similar observations about the effectof the shot material on the surface roughness. They observed thatthe amount of plastic deformation generated after shot peeningcarburizing steel was considerably higher when using cementedcarbide microshots instead of cast steel microshots. The largerroughness was attributed to the difference of hardness: caststeel microshots have a smaller hardness than the workpiecewhile the cemented carbide shots are significantly harder thanthe workpiece.
The Sds parameter is statistically better than the Sa parameterbecause it collects more information thus enabling to betterexplain the effects of the shot material on the topography. Indeed,the Sds parameter is calculated after the segmentation of the initialimage of the topography, using the watershed algorithm. Thelatter was specifically designed to identify the significant hills anddales and remove the non-significant peaks and pits, as shown in
Table 3Examples of roughness parameters used inthis study.
Amplitude parametersSa Arithmetic mean deviationSq Root-mean-square deviationSsk Skewness of the height distributionSku Kurtosis of the height distribution
Feature parametersS5V Five point pit heightS5P Five point peak height
Hybrid parametersSds Density of summitsSfd Fractal dimension of the surface
Spatial parametersSal Auto-correlation lengthStr Texture-aspect ratio
Functional parametersSxp Extreme peak heightSmr Areal material ratioSmc Inverse areal material ratio
Functional volume parametersVv Void volumeVm Material volume
J. Marteau et al. / Tribology International ∎ (∎∎∎∎) ∎∎∎–∎∎∎ 3
Please cite this article as: Marteau J, et al. Relation between roughness and processing conditions of AISI 316L stainless steel treated byultrasonic shot peening. Tribology International (2014), http://dx.doi.org/10.1016/j.triboint.2014.07.013i

Fig. 7. Indeed, as indicated by Li et al. [27] when analyzingsandblasted pure titanium, a surface showing relatively sparsesummits has a lower Sds value. More specifically, the density ofsummits is proportional to the number of residual impacts causedby the shots. This link between the Sds parameter and the residualimpacts of the shots fully justifies the first position of the Sdsparameter in the relevance. Furthermore, the impact diameters
have a stochastic nature: they depend on the impact energy aswell as the surface state (i.e. its ability to work-harden). Thevariation of the impact diameters leads to a variation of thetopography that is detected in the ranking of the roughnessparameters. Indeed, the first eighteen positions of the rankingare held by the density of summits associated with a large range ofcut-off lengths. This large range of scales reflects the variation of
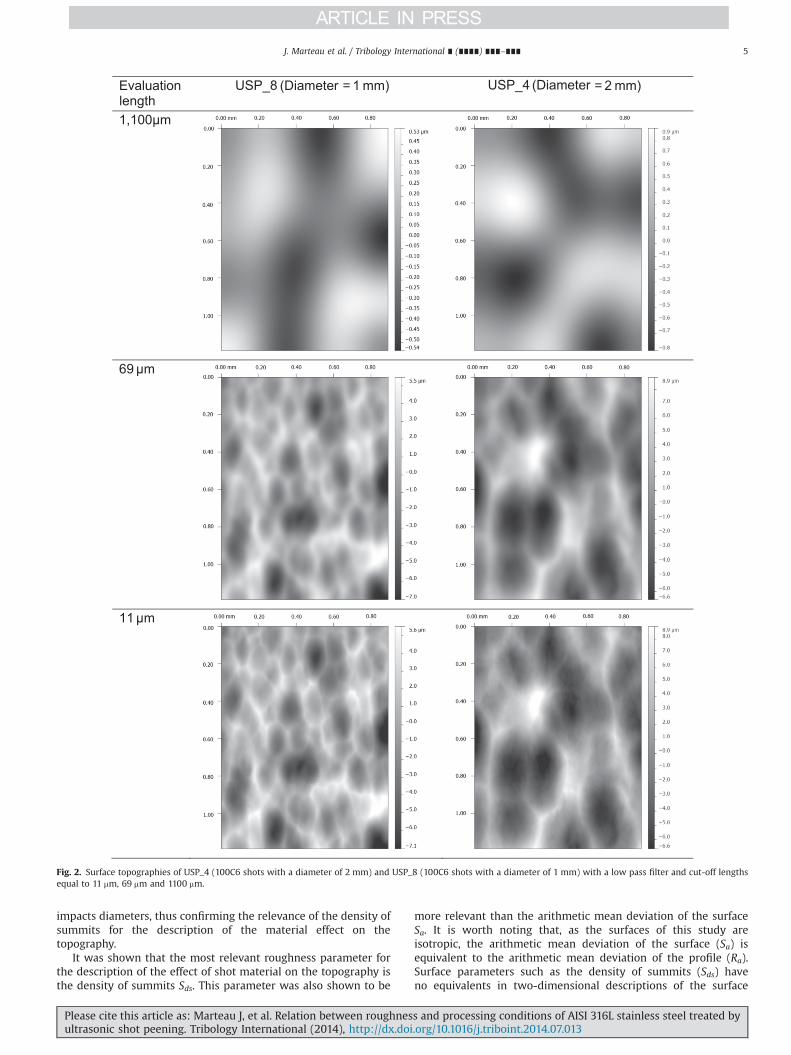
Fig. 1. Surface topographies of USP_4 (100C6 shots with a diameter of 2 mm) and USP_8 (100C6 shots with a diameter of 1 mm) with a high pass filter and cut-off lengthsequal to 11 mm, 69 mm and 1100 mm.
J. Marteau et al. / Tribology International ∎ (∎∎∎∎) ∎∎∎–∎∎∎4
Please cite this article as: Marteau J, et al. Relation between roughness and processing conditions of AISI 316L stainless steel treated byultrasonic shot peening. Tribology International (2014), http://dx.doi.org/10.1016/j.triboint.2014.07.013i
impacts diameters, thus confirming the relevance of the density ofsummits for the description of the material effect on thetopography.
It was shown that the most relevant roughness parameter forthe description of the effect of shot material on the topography isthe density of summits Sds. This parameter was also shown to be
more relevant than the arithmetic mean deviation of the surfaceSa. It is worth noting that, as the surfaces of this study areisotropic, the arithmetic mean deviation of the surface (Sa) isequivalent to the arithmetic mean deviation of the profile (Ra).Surface parameters such as the density of summits (Sds) haveno equivalents in two-dimensional descriptions of the surface
Fig. 2. Surface topographies of USP_4 (100C6 shots with a diameter of 2 mm) and USP_8 (100C6 shots with a diameter of 1 mm) with a low pass filter and cut-off lengthsequal to 11 mm, 69 mm and 1100 mm.
J. Marteau et al. / Tribology International ∎ (∎∎∎∎) ∎∎∎–∎∎∎ 5
Please cite this article as: Marteau J, et al. Relation between roughness and processing conditions of AISI 316L stainless steel treated byultrasonic shot peening. Tribology International (2014), http://dx.doi.org/10.1016/j.triboint.2014.07.013i

(i.e. using profiles). This fact emphasizes the specificities of surfaceroughness parameters compared to profile parameters.
3.2. Effect of the shot diameter
This section is dedicated to the analysis of the effect of the shotdiameter on the topography of the specimens. It was investigatedfor two types of shot material: 100C6 and 304L steels. For the 304Lsteel, the diameter effect on the roughness was assessed throughthe analysis of the specimens USP_1 and USP_2 that were peenedwith shots having a diameter of 1 mm and 2 mm, respectively. Theclassification found through the use of the F-values showed that
the mean density of furrows calculated with a cut-off length equalto 7 mm and a low pass filter is the most relevant roughnessparameter for the characterization of the diameter effect. Themean density of furrows calculation is based on the segmentationof the topography measurements, using the watershed algorithm[28]. The latter leads to a partition of the examined image into dalemotifs (as shown in Fig. 7) and locates their respective pits. Thisidentification provides a linear topography whose length is mea-sured and then divided by the considered area. The mean densityof furrows is thus a measurement of furrows created by the shotimpacts. An example of the determination of the mean density offurrows is given in Fig. 8.
The average value of the mean density of furrows is equal to232 cm/cm2 (with a standard deviation equal to 1 cm/cm2) for thespecimen peened with 2 mm diameter shots while it is about347 cm/cm2 (with a standard deviation of 1 cm/cm2) for the onepeened with 1 mm diameter shots. The arithmetic mean deviationSa is only ranked 33. The Sa parameter is equal to 0.081 mm with astandard deviation equal to 0.001 mm for the 2 mm shots and isequal to 0.150 mm with a standard deviation equal to 0.001 mm forthe 1 mm shots.
For the 100C6 shots, the roughness parameter that is rankednumber 1 is also the mean density of furrows but with the use of ahigh pass filter and for a cut-off length equal to 122 mm. The meandensity of furrows is approximately equal to 334 cm/cm2 (witha standard deviation of 1 cm/cm2) for the specimen peened
Fig. 3. Classification order of the relevance of the coupling of a roughnessparameter with a cut-off length and a filter to describe the shot material effecton the surface topography.
Fig. 4. Distribution of the density of summits Sds values for the specimen treatedwith 100C6 shots (USP_4) and the one treated with 304L shots (USP_3) for a cut-offlength of 19 mm, using a high-pass filter.
Fig. 6. Distribution of the arithmetic mean deviation Sa values for the specimentreated with 100C6 shots (USP_4) and the one treated with 304L shots (USP_3) for acut-off length of 19 mm, using a high-pass filter.
Fig. 5. Profiles of USP_3 and USP_4 with a cut-off length of 19 mm and a high pass filter.
J. Marteau et al. / Tribology International ∎ (∎∎∎∎) ∎∎∎–∎∎∎6
Please cite this article as: Marteau J, et al. Relation between roughness and processing conditions of AISI 316L stainless steel treated byultrasonic shot peening. Tribology International (2014), http://dx.doi.org/10.1016/j.triboint.2014.07.013i

with shots having a 1 mm diameter (USP_8) while it is equal to450 cm/cm2 (with a standard deviation of 2 cm/cm2) for the onepeened with 2 mm diameter shots (USP_4). The arithmetic meandeviation Sa is ranked 96 in the classification of the relevance. Theaverage Sa value is equal to 0.312 mm with a standard deviation of0.002 mm for the 2 mm shots and is equal to 0.355 mm with astandard deviation of 0.002 mm for the 1 mm shots.
According to the previous results, an increase of the shotdiameter tends to decrease the arithmetic mean deviation Sa,whatever the shot material. Conversely, the value of the meandensity of furrows depends on the shot material as an increase ofthe shot diameter leads to an increase of the mean density offurrows for the 100C6 shots while it leads to a decrease of themean density of furrows for the 304L shots.
The evolution of the Sa parameter can be easily understood:larger shot diameters induce larger dales and thus less peaks inaverage. Arifvianto et al. [13] found a similar trend when theytreated AISI 316L steel using balls having a diameter of 3.18, 4.76and 6.35 mm.
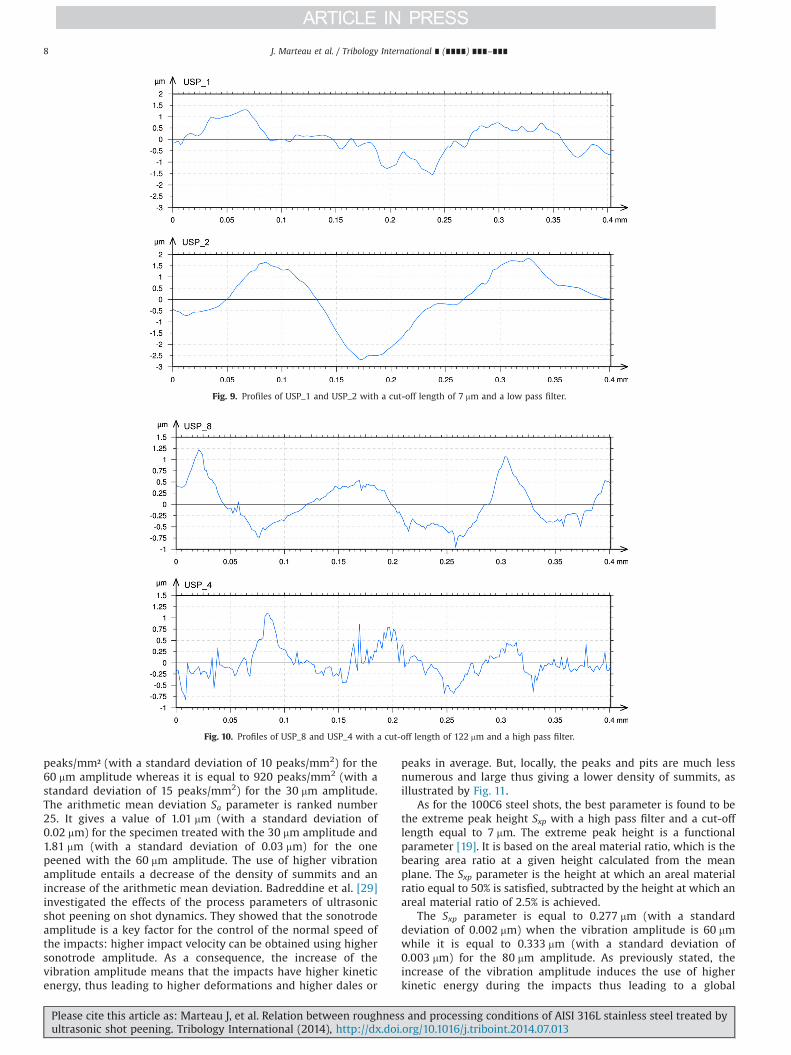
The mean density of furrows depicts the local variations of thetopography. Figs. 9 and 10 present profiles of the specimenspeened with 304L and 100C6 shots found using a cut-off lengthequal to 7 mm and a low-pass filter and a high-pass filter with acut-off length of 122 mm, respectively. In Fig. 9, it can be seen that
the specimen treated with 1 mm shots has more little peaks andpits than the one treated with 2 mm shots. In Fig. 10, this trend isreversed: the specimen treated with 100C6 shots having a dia-meter of 2 mm has more little variations than the one peened with1 mm shots. As stated above, the hardness of the 304L shots isroughly similar to the one of the specimens. As the specimen andthe 304L shots have similar hardness, the shots probably deformwhen they impact the treated material thus giving rise to smoothdales having few local peaks. On the contrary, the 100C6 shots aremuch harder than the specimens. Their shapes are thus lessaffected during the impacts, thus giving rise to higher deforma-tions and to local variations in the specimen topography.
3.3. Effect of the sonotrode vibration amplitude
The search of an appropriate roughness parameter for thedescription of the effect of the sonotrode vibration amplitude onthe specimen topography is successively made for the differentshot material. First, the effect of the sonotrode vibration ampli-tude is investigated for the specimens shot with 304L steel balls.Two values of amplitudes were tested in this study: 30 mm(specimen USP_2) and 60 mm (specimen USP_3). The best para-meter is the density of summits Sds calculated with a low-passfilter and a cut-off length equal to 7 mm. The Sds value is 530
Fig. 7. 3D topography of the surface of the specimen called USP_1 and the corresponding determination of the motifs (the dales).
Fig. 8. 3D topography of the surface of the specimen called USP_2 and the corresponding determination of the furrows.
J. Marteau et al. / Tribology International ∎ (∎∎∎∎) ∎∎∎–∎∎∎ 7
Please cite this article as: Marteau J, et al. Relation between roughness and processing conditions of AISI 316L stainless steel treated byultrasonic shot peening. Tribology International (2014), http://dx.doi.org/10.1016/j.triboint.2014.07.013i
peaks/mm² (with a standard deviation of 10 peaks/mm2) for the60 mm amplitude whereas it is equal to 920 peaks/mm2 (with astandard deviation of 15 peaks/mm2) for the 30 mm amplitude.The arithmetic mean deviation Sa parameter is ranked number25. It gives a value of 1.01 mm (with a standard deviation of0.02 mm) for the specimen treated with the 30 mm amplitude and1.81 mm (with a standard deviation of 0.03 mm) for the onepeened with the 60 mm amplitude. The use of higher vibrationamplitude entails a decrease of the density of summits and anincrease of the arithmetic mean deviation. Badreddine et al. [29]investigated the effects of the process parameters of ultrasonicshot peening on shot dynamics. They showed that the sonotrodeamplitude is a key factor for the control of the normal speed ofthe impacts: higher impact velocity can be obtained using highersonotrode amplitude. As a consequence, the increase of thevibration amplitude means that the impacts have higher kineticenergy, thus leading to higher deformations and higher dales or
peaks in average. But, locally, the peaks and pits are much lessnumerous and large thus giving a lower density of summits, asillustrated by Fig. 11.
As for the 100C6 steel shots, the best parameter is found to bethe extreme peak height Sxp with a high pass filter and a cut-offlength equal to 7 mm. The extreme peak height is a functionalparameter [19]. It is based on the areal material ratio, which is thebearing area ratio at a given height calculated from the meanplane. The Sxp parameter is the height at which an areal materialratio equal to 50% is satisfied, subtracted by the height at which anareal material ratio of 2.5% is achieved.
The Sxp parameter is equal to 0.277 mm (with a standarddeviation of 0.002 mm) when the vibration amplitude is 60 mmwhile it is equal to 0.333 mm (with a standard deviation of0.003 mm) for the 80 mm amplitude. As previously stated, theincrease of the vibration amplitude induces the use of higherkinetic energy during the impacts thus leading to a global
Fig. 9. Profiles of USP_1 and USP_2 with a cut-off length of 7 mm and a low pass filter.
Fig. 10. Profiles of USP_8 and USP_4 with a cut-off length of 122 mm and a high pass filter.
J. Marteau et al. / Tribology International ∎ (∎∎∎∎) ∎∎∎–∎∎∎8
Please cite this article as: Marteau J, et al. Relation between roughness and processing conditions of AISI 316L stainless steel treated byultrasonic shot peening. Tribology International (2014), http://dx.doi.org/10.1016/j.triboint.2014.07.013i
increase of the roughness. The Sxp parameter values followthis trend. This parameter is more relevant than commonly usedparameters such as the arithmetic mean deviation becauseit implies the use of thresholds. Based on the Abbot curve, thisparameter is computed by removing the largest peaks and valleysthus enabling to focus on the relevant peaks and valleys andeliminate outliers.
3.4. Effect of coverage
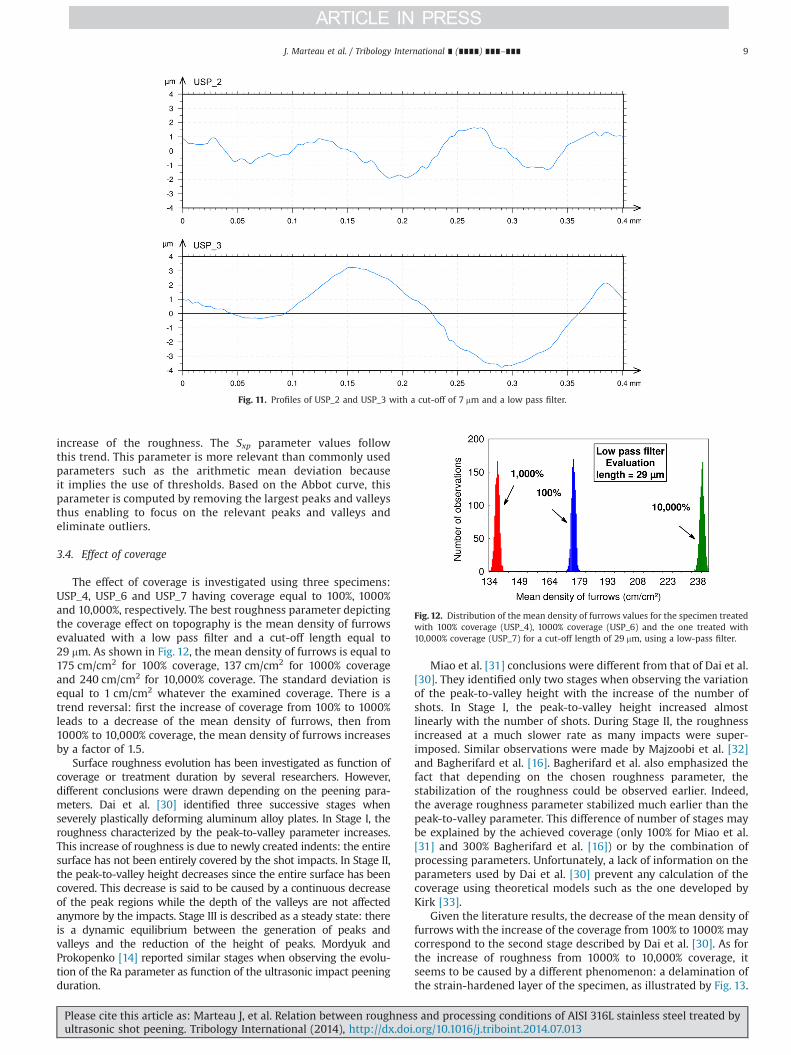
The effect of coverage is investigated using three specimens:USP_4, USP_6 and USP_7 having coverage equal to 100%, 1000%and 10,000%, respectively. The best roughness parameter depictingthe coverage effect on topography is the mean density of furrowsevaluated with a low pass filter and a cut-off length equal to29 mm. As shown in Fig. 12, the mean density of furrows is equal to175 cm/cm2 for 100% coverage, 137 cm/cm2 for 1000% coverageand 240 cm/cm2 for 10,000% coverage. The standard deviation isequal to 1 cm/cm2 whatever the examined coverage. There is atrend reversal: first the increase of coverage from 100% to 1000%leads to a decrease of the mean density of furrows, then from1000% to 10,000% coverage, the mean density of furrows increasesby a factor of 1.5.
Surface roughness evolution has been investigated as function ofcoverage or treatment duration by several researchers. However,different conclusions were drawn depending on the peening para-meters. Dai et al. [30] identified three successive stages whenseverely plastically deforming aluminum alloy plates. In Stage I, theroughness characterized by the peak-to-valley parameter increases.This increase of roughness is due to newly created indents: the entiresurface has not been entirely covered by the shot impacts. In Stage II,the peak-to-valley height decreases since the entire surface has beencovered. This decrease is said to be caused by a continuous decreaseof the peak regions while the depth of the valleys are not affectedanymore by the impacts. Stage III is described as a steady state: thereis a dynamic equilibrium between the generation of peaks andvalleys and the reduction of the height of peaks. Mordyuk andProkopenko [14] reported similar stages when observing the evolu-tion of the Ra parameter as function of the ultrasonic impact peeningduration.
Miao et al. [31] conclusions were different from that of Dai et al.[30]. They identified only two stages when observing the variationof the peak-to-valley height with the increase of the number ofshots. In Stage I, the peak-to-valley height increased almostlinearly with the number of shots. During Stage II, the roughnessincreased at a much slower rate as many impacts were super-imposed. Similar observations were made by Majzoobi et al. [32]and Bagherifard et al. [16]. Bagherifard et al. also emphasized thefact that depending on the chosen roughness parameter, thestabilization of the roughness could be observed earlier. Indeed,the average roughness parameter stabilized much earlier than thepeak-to-valley parameter. This difference of number of stages maybe explained by the achieved coverage (only 100% for Miao et al.[31] and 300% Bagherifard et al. [16]) or by the combination ofprocessing parameters. Unfortunately, a lack of information on theparameters used by Dai et al. [30] prevent any calculation of thecoverage using theoretical models such as the one developed byKirk [33].
Given the literature results, the decrease of the mean density offurrows with the increase of the coverage from 100% to 1000% maycorrespond to the second stage described by Dai et al. [30]. As forthe increase of roughness from 1000% to 10,000% coverage, itseems to be caused by a different phenomenon: a delamination ofthe strain-hardened layer of the specimen, as illustrated by Fig. 13.
Fig. 11. Profiles of USP_2 and USP_3 with a cut-off of 7 mm and a low pass filter.
Fig. 12. Distribution of the mean density of furrows values for the specimen treatedwith 100% coverage (USP_4), 1000% coverage (USP_6) and the one treated with10,000% coverage (USP_7) for a cut-off length of 29 mm, using a low-pass filter.
J. Marteau et al. / Tribology International ∎ (∎∎∎∎) ∎∎∎–∎∎∎ 9
Please cite this article as: Marteau J, et al. Relation between roughness and processing conditions of AISI 316L stainless steel treated byultrasonic shot peening. Tribology International (2014), http://dx.doi.org/10.1016/j.triboint.2014.07.013i

The patterns observed in the previous figure are similar to theones examined by Poorna Chander et al. [34] after over-blasting asteel substrate.
3.5. Creation of a predictive model
The method developed in this section consists in searching thebest relation between the processing parameters (i.e. the shotdiameter, the shot material, the sonotrode amplitude vibrationand the coverage) and a roughness parameter associated with afilter and a cut-off length. To achieve this, the relation between theprocessing parameters and the obtained roughness is supposedlinear as a first approximation. The relation giving the bestcoefficient of determination (0.97) is found using the Mean Depthof Furrows (MDF) with a high pass filter and a cut-off length of122 mm:
MDF¼ 0:7570:02þ0:2170:01dþ0:005270:0004cþ0:0770:01bþ0:014170:0003r ð1Þ
where d, c, b and r are respectively: the ball diameter, thesonotrode vibration amplitude, the ball material and the coverage.For the shot material, 304L steel is represented by 1 while 100C6steel is represented by 0.
Fig. 14 shows the distribution of the different coefficients of theprevious equation. It can be seen that an addition of 1 to thecoverage value increases the Mean Depth of Furrows of 0.014 mm.A 1 mm increase of vibration amplitude leads to a 0.0052 mmincrease of the Mean Depth of Furrows. Conversely, a 1 mmincrease of the ball diameter induces a 0.2 mm decrease and again of 1 for the ball material causes a drop of 0.08 mm.
The predicted Mean Depth of Furrows given by Eq. (1) isrepresented as a function of the measured Mean Depth of Furrowsin Fig. 15. Despite some scattering of the points that stand for thebootstrap values of the Mean Depth of Furrows, a good predictionis achieved. Indeed, a linear relation having a coefficient ofdetermination equal to 0.97 is found. It is worth noting that thecoefficients of the predictive model are specific to the studiedmaterial i.e. to AISI 316L stainless steel. Indeed, the values of the
Fig. 13. Scanning electron microscopy image of the delamination of the strain-hardened layer (USP_7).
Fig. 14. Distribution of the model coefficient values.
J. Marteau et al. / Tribology International ∎ (∎∎∎∎) ∎∎∎–∎∎∎10
Please cite this article as: Marteau J, et al. Relation between roughness and processing conditions of AISI 316L stainless steel treated byultrasonic shot peening. Tribology International (2014), http://dx.doi.org/10.1016/j.triboint.2014.07.013i

mean depth of furrows are dependent on the processing condi-tions as well as on the material behavior. As an example, Yin et al.[35] showed that the indented depth, which is proportional of themean depth of furrows, depends on the strain state of materials.An increase of accumulated plastic strain of the material leads to adecrease of the indented depth.
The identified relation can help choosing the processing para-meters when a certain roughness should be respected.
4. Conclusion
The multiscale analysis of roughness surfaces obtained by ultra-sonic shot peening was performed by studying the values of fiftyroughness parameters, 21 cut-off lengths and, high pass and low passfilters. The use of a statistical analysis enabled to identify a relevantparameter and its corresponding cut-off length and filter for eachtype of processing parameter. The effects of the variations of the shotdiameter and coverage on the specimen topography were found tobe best depicted by the mean density of furrows using a low passfilter and a cut-off length equal to 7 mm for 304L steel shots while ahigh pass filter and a cut-off length equal to 122 mmwere found to bemore relevant for 100C6 steel. As for the coverage, a cut-off lengthequal to 29 mm and a low pass filter were found to be moreappropriate. The impact of the shot material was best described bythe density of summits evaluated over 19 mm with a high pass filter.Finally, the effect of the vibration amplitude was found to bedependent on the shot material. Indeed, its effect was identifiedusing the peak extreme height (with high pass filter and a cut-offlength equal to 7 mm) for the 100C6 shots whereas the density ofsummits (with a low-pass filter and a cut-off length equal to 7 mm)was the relevant combination for the 304L balls.
Finally, the Mean Depth of Furrows, calculated using a cut-offlength of 122 mm with a high pass filter, enabled to build a linearfunction with the different processing parameter i.e. the shotdiameter, the shot material, the sonotrode vibration amplitudeand the coverage. Such model could help choosing the correctprocessing parameters that increase fretting wear resistance whilemonitoring roughness at the same time.
References
[1] Liu KK, Hill MR. The effects of laser peening and shot peening on frettingfatigue in Ti–6Al–4V coupons. Tribol Int 2009;42:1250–62.
[2] Gao YK, Wu XR. Experimental investigation and fatigue life prediction for7475-T7351 aluminum alloy with and without shot peening-induced residualstresses. Acta Mater 2011;59:3737–47.
[3] Roland T, Retraint D, Lu K, Lu J. Fatigue life improvement through surfacenanostructuring of stainless steel by means of surface mechanical attritiontreatment. Scr Mater 2006;54:1949–54.
[4] Masaki K, Ochi Y, Matsumura T, Sano Y. Effects of laser peening treatment onhigh cycle fatigue properties of degassing-processed cast aluminum alloy.Mater Sci Eng, A 2007;468–470:171–5.
[5] Hamadache H, Laouar L, Zeghib NE, Chaoui K. Characteristics of Rb40 steelsuperficial layer under ball and roller burnishing. J Mater Process Technol2006;180:130–6.
[6] Liu G, Lu J, Lu K. Surface nanocrystallization of 316L stainless steel induced byultrasonic shot peening. Mater Sci Eng, A 2000;286:91–5.
[7] Amanov A, Cho I-S, Kim D-E, Pyun Y-S. Fretting wear and friction reduction ofCP titanium and Ti–6Al–4V alloy by ultrasonic nanocrystalline surfacemodification. Surf Coat Technol 2012;207:135–42.
[8] Sun Y. Sliding wear behaviour of surface mechanical attrition treated AISI 304stainless steel. Tribol Int 2013;57:67–75.
[9] Curtis S, de los Rios ER, Rodopoulos CA, Levers A. Analysis of the effects ofcontrolled shot peening on fatigue damage of high strength aluminium alloys.Int J Fatigue 2003;25:59–66.
[10] Maawad E, Brokmeier HG, Wagner L, Sano Y, Genzel C. Investigation on thesurface and near-surface characteristics of Ti–2.5Cu after various mechanicalsurface treatments. Surf Coat Technol 2011;205:3644–50.
[11] Gao YK. Improvement of fatigue property in 7050–T7451 aluminum alloy bylaser peening and shot peening. Mater Sci Eng, A 2011;528:3823–8.
[12] Li JK, Mei Y, Duo W, Renzhi W. An analysis of stress concentrations caused byshot peening and its application in predicting fatigue strength. Fatigue FractEng Mater Struct 1992;15:1271–9.
[13] Arifvianto B, Suyitno, Mahardika M, Dewo P, Iswanto PT, Salim UA. Effect ofsurface mechanical attrition treatment (SMAT) on microhardness, surfaceroughness and wettability of AISI 316L. Mater Chem Phys 2011;125:418–26.
[14] Mordyuk BN, Prokopenko GI. Ultrasonic impact peening for the surfaceproperties’ management. J Sound Vib 2007;308:855–66.
[15] Anand Kumar S, Ganesh Sundara Raman S, Sankara Narayanan TSN, Gnana-moorthy R. Influence of counterbody material on fretting wear behaviour ofsurface mechanical attrition treated Ti–6Al–4V. Tribol Int 2013;57:107–14.
[16] Bagherifard S, Ghelichi R, Guagliano M. Numerical and experimentalanalysis of surface roughness generated by shot peening. Appl Surf Sci2012;258:6831–40.
[17] Pereda MD, Kang KW, Bonetto R, Llorente C, Bilmes P, Gervasi C. Impact ofsurface treatment on the corrosion resistance of ASTM F138-F139 stainlesssteel for biomedical applications. Proc Mater Sci 2012;1:446–53.
[18] Stout KJ, Matthia T, Sullivan PJ, Dong WP, Mainsah E, Luo N, et al. Thedevelopments of methods for the characterisation of roughness in threedimensions. Report EUR 15178 EN1993.
[19] Standardization IOf. ISO standard 25178. International Organization for Stan-dardization; 2012.
[20] Bigerelle M, Giljean S, Mathia TG. Multiscale characteristic lengths of abradedsurfaces: three stages of the grit-size effect. Tribol Int 2011;44:63–80.
[21] Marteau J, Mazeran PE, Bouvier S, Bigerelle M. Zero-point correction methodfor nanoindentation tests to accurately quantify hardness and indentation sizeeffect. Strain 2012;48:491–7.
[22] Standardization IOf. ISO standard TS 16610-31. International Organization forStandardization; 2010.
[23] Efron B. Bootstrap methods: another look at the Jackknife. Ann Stat 1979;7:1–26.
[24] Marteau J, Bigerelle M, Xia Y, Mazeran PE, Bouvier S. Quantification of firstcontact detection errors on hardness and indentation size effect measure-ments. Tribol Int 2013;59:154–62.
[25] Fisher RA. Statistical methods for research workers. London: Edinburgh Oliverand Boyd; 1928.
[26] Harada Y, Fukaura K, Haga S. Influence of microshot peening on surface layercharacteristics of structural steel. J Mater Process Technol 2007;191:297–301.
[27] Li S, Ni J, Liu X, Lu H, Yin S, Rong M, et al. Surface characteristic of puretitanium sandblasted with irregular zirconia particles and acid-etched. MaterTrans 2012;53:913–9.
[28] Beucher S, Lantuejoul C. Use of watersheds in contour detection. In: Interna-tional work-shop on image processing, real-time edge and motion detection/estimation. Rennes 1979.
[29] Badreddine J, Rouhaud E, Micoulaut M, Remy S. Simulation of shot dynamicsfor ultrasonic shot peening: effects of process parameters. Int J Mech Sci2014;82:179–90.
[30] Dai K, Villegas J, Stone Z, Shaw L. Finite element modeling of the surfaceroughness of 5052 Al alloy subjected to a surface severe plastic deformationprocess. Acta Mater 2004;52:5771–82.
[31] Miao HY, Larose S, Perron C, Lévesque M. On the potential applications of a 3Drandom finite element model for the simulation of shot peening. Adv EngSoftware 2009;40:1023–38.
[32] Majzoobi GH, Azadikhah K, Nemati J. The effects of deep rolling and shotpeening on fretting fatigue resistance of aluminum-7075-T6. Mater Sci Eng, A2009;516:235–47.
[33] Kirk D. Theoretical principles of shot peening coverage. Shot Peener2005;19:28–30.
[34] Poorna Chander K, Vashista M, Sabiruddin K, Paul S, Bandyopadhyay PP.Effects of grit blasting on surface properties of steel substrates. Mater Des2009;30:2895–902.
[35] Yin F, Hua L, Wang X, Rakita M, Han Q. Numerical modelling and experimentalapproach for surface morphology evaluation during ultrasonic shot peening.Comput Mater Sci 2014;92:28–35.
Fig. 15. Predicted mean depth of furrows as a function of the measured meandepth of furrows.
J. Marteau et al. / Tribology International ∎ (∎∎∎∎) ∎∎∎–∎∎∎ 11
Please cite this article as: Marteau J, et al. Relation between roughness and processing conditions of AISI 316L stainless steel treated byultrasonic shot peening. Tribology International (2014), http://dx.doi.org/10.1016/j.triboint.2014.07.013i