Reinvigorating Growth with a Dynamic Banking Sector AND ACRONYMS ABC African Banking Corporation...
82
Reinvigorang Growth with a Dynamic Banking Sector December 2013 | Edion No. 9 $104 $865 1963 Net Loans and Advances by banks KSh Billion 0 200 2005 337.5 1,491.8 400 800 1,000 1,200 1,400 1,600 2013 GDP per capita CREDIT SAVINGS LOANS CREDIT SAVINGS OVERDRAFT CREDIT SAVINGS LOANS CREDIT SAVINGS OVERDRAFT 2013 Public Disclosure Authorized Public Disclosure Authorized Public Disclosure Authorized Public Disclosure Authorized Public Disclosure Authorized Public Disclosure Authorized Public Disclosure Authorized Public Disclosure Authorized
Transcript of Reinvigorating Growth with a Dynamic Banking Sector AND ACRONYMS ABC African Banking Corporation...

Reinvigorating Growth with a Dynamic Banking Sector
December 2013 | Edition No. 9
$104
$865
1963
Net
Loa
ns a
nd A
dvan
ces b
y ba
nks K
Sh B
illio
n
0
200
2005
337.5
1,491.8
400
800
1,000
1,200
1,400
1,600
2013
GDP per capitaCREDITSAVINGSLOANS CREDITSAVINGS
OVERDRAFT
CRED
ITSAVINGS
LOANS CREDITSAVINGS
OVERDRAFT
2013
Pub
lic D
iscl
osur
e A
utho
rized
Pub
lic D
iscl
osur
e A
utho
rized
Pub
lic D
iscl
osur
e A
utho
rized
Pub
lic D
iscl
osur
e A
utho
rized
Pub
lic D
iscl
osur
e A
utho
rized
Pub
lic D
iscl
osur
e A
utho
rized
Pub
lic D
iscl
osur
e A
utho
rized
Pub
lic D
iscl
osur
e A
utho
rized
wb456288
Typewritten Text
wb456288
Typewritten Text
wb456288
Typewritten Text
83267
wb456288
Typewritten Text
wb456288
Typewritten Text


Reinvigorating Growth with a Dynamic Banking Sector


TABLE OF CONTENTS
ABBREVIATIONS AND ACRONYMS i
FOREWORD ii
ACKNOWLEDGEMENTS iii
MAIN MESSAGES AND KEY RECOMMENDATIONS iv
EXECUTIVE SUMMARY v
THE STATE OF KENYA’S ECONOMY 11. Economic Performance in 2013 22. Growth Outlook: 2014 and Beyond 24
Special Focus: Increasing Access to Credit 31
REFERENCES 44
ANNEXESAnnex 1: Macroeconomic environment 44Annex 2: GDP growth rates for Kenya SSA and EAC (2008-2013) 44Annex 3: Kenya annual GDP 45Annex 4.a: Broad sectors growth (half year, percent) 45Annex 4.b: Quarterly growth rates (percent) 46Annex 5: Inflation 47Annex 6: Tea production and exports 48Annex 7: Coffee production and exports 49Annex 8: Horticulture exports 50Annex 9: Local electricity generation by source 51Annex 10: Soft drinks and sugar production 52Annex 11: Tourism arrivals 53Annex 12: New vehicles registration 54Annex 13: Exchange rates 55Annex 14: Interest rates 56Annex 15: Credit to private sector 57Annex 16: Money aggregate 58Annex 17: Mobile payments 59Annex 18: Nairobi stock exchange (20 share index) and the Dow Jones (New York) 60Annex 19: Nominal and real exchange rate 61Annex 20: Fiscal position 62Annex 21: 12-months cumulative balance of payments 63Annex 22: Growth Outlook 64

LIST OF FIGURESFigure 1: Kenya’s macroeconomic environment is strong vFigure 2: Budget execution remains a challenge viiFigure 3: Kenya has made tremendous progress in financial inclusion viiFigure 4: Kenyan banks lend more to small and medium-size enterprises than banks in some viii other countries in the regionFigure 5: Overheads and profits account for the bulk of interest rate spreads in Kenya viiiFigure 1.1: Modest growth in the first half of 2013 represented Kenya’s best first-half 2 performance since 2008Figure 1.2: Average growth was lower in Kenya than in most of its neighbors and 3 Sub-Saharan Africa as whole between 2009 and 2013Figure 1.3: For decades, Kenya has been more globally integrated than its neighbors 3Figure 1.4: All sectors except services showed strong growth in the first half of 2013 3Figure 1.5: Performance in the services sector was mixed in 2013 4Figure 1.6: Kenyans continue to embrace information and communications technology products 5Figure 1.7: The mobile money (M-Pesa) transfer boom continued 5Figure 1.8: Tourism contracted—partly as a result of security concerns 5Figure 1.9: A good harvest led to lower food prices 7Figure 1.10: Food inflation rose after June 2013, driving overall inflation 7Figure 1.11: The contribution of food to overall inflation rose in 2013 8Figure 1.12: Inflationary trends in the regions are roughly similar 8Figure 1.13: Rwanda has much stronger Doing Business indicators than Kenya 8Figure 1.14: Implementation of the new constitution triggered expansionary spending 9Figure 1.15: After years of narrowing, the gap between recurrent and development expenditure 10 widenedFigure 1.16: Low execution rates reduced development expenditure 11Figure 1.17: Income tax revenues rose and VAT and excise duties fell between 1999 and 2012 12Figure 1.18: Total and domestic public debt as a percent of GDP increased, and external debt fell 12Figure 1.19: The upward movement in the yield curve reflects market concerns about 12 budget implementationFigure 1.20: To support economic activity, Kenya’s Central Bank increased the money supply 13Figure 1.21: Liquidity shortages in the banking system dampened the effect of monetary policy 13 on interest ratesFigure 1.22: Lending rates declined marginally, but interest spreads remained wide 14Figure 1.23: Banking sector credit expanded, but the level remains below historical levels 14Figure 1.24: Credit to the private sector has not grown as rapidly as GDP since 2011 15Figure 1.25: Credit flowed to private households, trade, and business services—but 15 not to productive sectorsFigure 1.26: Households, trade, and real estate received the lion’s share of loans from 16 the banking systemFigure 1.27: Asset quality deteriorated in most sectors 16

Figure 1.28: The Nairobi Stock Exchange outperformed the Dow Jones Industrial average 17Figure 1.29: Short-term capital inflows are financing the current account deficit 18Figure 1.30: The trade balance improved significantly, as oil imports declined 18Figure 1.31: Slower global activity and weak local conditions reduced Kenya’s exports and imports 18Figure 1.32: Remittances continued to rise 20Figure 1.33: Kenya is attracting more short-term than long-term flows 20Figure 1.34: The Kenya shilling stabilized 21Figure 1.35: Kenya’s trade-weighted exchange rates are starting to depreciate as the 22 global economy recoversFigure 2.1: Growth will pick up in 2014, driven by investment and public spending 25Figure 3.1: Ownership structure of Kenyan banks 31Figure 3.2: Deposits, loans, and credit to the private sector have grown steadily 32Figure 3.3: Kenyan banks lend more to SMEs than in banks in some other countries in the region 33Figure 3.4: Banks’ response to the monetary policy rate has been asymmetric 37Figure 3.5: Interest rate spreads in Kenya have fallen over time 38Figure 3.6: Spreads are made up largely of overheads and profits 38Figure 3.7: Large banks account for most deposits and loans in Kenya 38Figure 3.8: Large banks in Kenya have higher spreads than smaller banks 39Figure 3.9: Large banks in Kenya offer lower rates on deposits than small banks 39Figure 3.10: Average lending rates are higher and less volatile than Treasury-bill rates 39
LIST OF TABLESTable 1.1: Kenya’s Doing Business environment has deteriorated since 2008 10 Table 1.2: Government expenditure rose between 2008/09 and 2012/13 11Table 1.3: Shares of imports by broad economic category, 2009–2013 19Table 2.1: GDP is projected to grow by a little more than 5 percent through 2016 25 (annual percentage increase)Table 3.1: Large banks dominate both the share of deposits and net yield 35Table 3.2: Selected donor partnerships with Kenyan banks 36Table 3.3: Donors have partnered with Kenyan banks to increase lending to small and 42 medium-size enterprises
LIST OF BOXESBox 1.1: Tourism: A pillar for economic growth and job creation 6Box 1.2: Is Kenya’s real exchange rate over- or undervalued? 23Box 2.1: Lack of efficiency in education and health: Results from the World Bank’s 29 Service Delivery Indicators


ABBREVIATIONS AND ACRONYMS
ABC African Banking CorporationAML/CFT Anti-money Laundering - Combating the Financing of TerrorismCBA Commercial Bank of AfricaCBK Central Bank of KenyaCBR Central Bank RateCIF Cost Insurance FreightCOMESA Common Market for Eastern and Southern AfricaCoop Bank Cooperative BankCRB Credit Reference BureauDB Doing BusinessDEG Deutsche Investitions- und Entwicklungsgesellschaft (Germany Investment Corporation)DSA Debt Sustainability AnalysisEAC East African CommunityFDI Foreign Direct InvestmentFMO Financierings-Maatschappij voor Ontwikkelingslanden (Netherlands Development Finance Company)FSAP Financial Sector Assessment ProgramG2P Government to PersonGDP Gross Domestic ProductGEMS Growth Enterprise Market SegmentI&M Investments and MortgagesICT Information Communication and TechnologyIFMIS Integrated Financial Management Information SystemIMF International Monetary FundKCB Kenya Commercial BankKfW Kreditanstalt für Wiederaufbau (Reconstruction Credit Institute)MTPII Second Medium Term Plan NEO Net Errors and OmissionsNFS Non-factor ServicesNorfund Norwegian Investment FundNSE Nairobi Stock ExchangePFM Public Financial ManagementPROPARCO Promotion et Participation pour la Coopération EconomiqueREER Real Effective Exchange RateSACCOs Savings and Credit CooperativesSIDA Swedish International Development AgencySIM Subscriber Identity ModuleSMEs Small and Medium EnterprisesTTCI Travel and Tourism Competitiveness IndexUS United StatesUSAID United States Agency for International DevelopmentVAT Value Added Tax
December 2013 | Edition No. 9 i

It is my pleasure to present the ninth edition of the Kenya Economic Update, which coincides with Kenya’s 50th independence anniversary. There is much for Kenya to celebrate—economically, socially, and
institutionally. Kenya has a strong track record of macroeconomic management, with low inflation, low fiscal deficits, and sustainable debt levels. Economic growth has not been as high as in its peers, but Kenya’s market-oriented policies have paid dividends. Kenya’s private sector is more vibrant, its financial sector is now the third largest in terms of assets in Sub-Saharan Africa, and citizens have benefited enormously from the mobile revolution. In the social sectors, Kenya has made tremendous progress. Kenyans are living two decades longer than they did at independence, infant mortality has fallen by 50 percent, and primary school enrollment is now almost universal (and full gender parity almost achieved). What’s more, the new Constitution, passed in 2010, has created a strong foundation for better institutions. The jubilee year is a time for celebration. But it is also a time to reflect on the measures needed to transform the lives of the majority of Kenyans. Nearly 4 of every 10 Kenyans is poor; maternal mortality remains among the highest in Africa, with 488 deaths per 100,000 live births; secondary school enrollment is at a low 32 percent; and learning achievement levels, well below their potential for what is needed to fuel a modern market economy.
This report has three main messages. First, the economy is estimated to have grown at 5 percent in 2013, and Kenya will enter 2014 on a strong economic position. This is a major achievement, as Kenya’s growth usually collapses during election years. With a strong macroeconomic foundation and ongoing structural reforms, this growth momentum is expected to be maintained in 2014, when output is projected to grow by 5.1 percent. Second, an enabling framework for significant private sector–led growth is critical. Continued investment is needed in infrastructure, bottlenecks that increase the cost of doing business need to be addressed, and sound monetary and fiscal policies need to be maintained. Third, Kenyan banks are ahead of their counterparts in other African countries in many innovations, including lending to the SMEs but the cost of bank financing remains high,an issue the report discusses in some depth.
The World Bank remains a committed partner as Kenya celebrates its jubilee year and beyond. Its series of Economic Updates, published every six months, have become its main vehicle for analyzing development trends in Kenya. Through these reports and other knowledge products, the World Bank aims to support all those who want to improve economic management in Kenya. As in the past, we are proud to have worked with many Kenyan economic stakeholders during the preparation of this report. We hope that they will join us in debating the policy issues that are topical in Kenya and in contributing to helping Kenya grow, permanently reduce poverty, and bring shared prosperity to all Kenyans.
Diarietou GayeCountry Director for Kenya
World Bank
FOREWORD
December 2013 | Edition No. 9ii

ACKNOWLEDGEMENTS
This edition of the Kenya Economic Update was prepared by a team led by John Randa and Smita Wagh, supervised by Apurva Sanghi. The core team consisted of Angélique Umutesi, Kennedy Mukuna Opala,
Margaret Nyamumbo, Barbara Karni, and Sophie Rabuku. The team gratefully acknowledges contributions from Robert Waiharo.
The report benefitted from the insights of several peer reviewers, including Yira Mascaro, Ravi Ruparel, and Prof. Terry Ryan, as well as comments from Jane Kiringai, Gunhild Bergn, Maria Paulina Mogollon, and Evans Osano. The team also received guidance from Pablo Fajnzylber, Thomas O’Brien, and Diarietou Gaye.
Partnership with key Kenyan policy makers was instrumental in the production of this report. On December 3, 2013, a draft of the report was presented at the Quarterly Economic Roundtable. The meeting was attended by senior officials from the National Treasury, the Ministry of Devolution and Planning, the Central Bank of Kenya, the Kenya National Bureau of Statistics, the Kenya Revenue Authority, the Kenya Institute of Public Policy Research and Analysis, the International Monetary Fund, and the National Economic and Social Council.
December 2013 | Edition No. 9 iii

MAIN MESSAGES AND KEY RECOMMENDATIONS
Main Messages
• Macroeconomic conditions are favorable in Kenya, with the economy projected to grow 5.0 percent in 2013 and 5.1 percent in 2014. Inflation remains low, the fiscal deficit remains manageable, and the exchange rate remains stable.
• The government has maintained fiscal discipline, adopting domestic revenue-raising measures. However, execution of the budget, especially investment spending, leaves room for improvement. Higher execution rates would help promote the much sought after growth take-off.
• Small and medium-size enterprises (SMEs) cite the cost of credit as a barrier to bank financing. High lending rates can be traced to a range of factors, including the macroeconomic environment, high bank overheads and profits, information gaps, the structure of the banking sector, and the volatility of the risk-free return. A multipronged approach is needed to increase bank lending to this critical sector if growth and job creation are to take-off.
Key Recommendations for Reinvigorating the Economy
• Continue structural reforms to improve the ease of doing business environment and boost growth in the near term. Reductions in delays in the clearance of cargo at the Port of Mombasa and recent measures to address the challenges of transporting cargo along the northern corridor are steps in the right direction to promoting regional trade. The removal of all roadblocks along the routes of cargo destined to countries in the region as part of the wider initiative to curb trade bottlenecks is a major step. Scaling up Huduma centers, which provide one-stop-shop delivery of services, should enhance the business environment and reduce inefficiency, which encourages corruption.
• Improve budget absorption of development expenditures, which are key to growth. Execution of the budget, especially investment spending, needs improvement. Higher execution rates would help promote the much sought after growth take-off. As part of the transition to the new government, new procurement has been a challenge.
• Deepen reforms in public financial management (PFM) to increase savings and efficiency in the use of public resources. Adopting and operationalizing PFM regulations to entrench the PFM law would help ensure accountability, transparency, and the effective and efficient collection and utilization of public resources. Efforts should include making the Integrated Financial Management Information System (IFMIS) and the Treasury Single Account fully functional.
Key Recommendations for Increasing access to Credit to SMEs
• Study the factors that influence the way in which banks price loans, in order to develop a comprehensive policy agenda for reducing the cost of credit. The competitive structure of the banking sector in Kenya cannot be viewed in isolation. A host of other factors, such as the macroeconomic environment, government borrowing, bank overheads, risk premiums, and market maturity, all contribute to determining the interest structure, including the cost of credit, in an economy.
• Strengthen credit information systems and other parts of the financial infrastructure. Information asymmetries raise the pricing of loans to SMEs in Kenya. The high levels of informality within the sector and inadequate systems of collateral verification hinder lending. Banks, savings and credit cooperatives (SACCOs), payment service providers, and utility companies should be encouraged to share positive information about consumers. Effective collateral registries should be developed and creditor rights framework strengthened.
• Diversify funding sources and instruments for SMEs. It is important that at least some SMEs look beyond bank financing to meet their working capital needs if they are to fully realize their growth and job-creating potential. Efforts should be made to enable some SMEs to tap equity funding, either through private funds or through the Growth Enterprise Market Segment of the Nairobi Stock Exchange.
December 2013 | Edition No. 9iv

Growth has picked up, and prospects for 2014 are strong
After 50 years of independence, there is much for Kenya to celebrate. Kenyans are
living two decades longer; the fertility and infant mortality rates have been cut in half; and school enrollment, at both the primary and secondary level, has more than doubled. On the economic front, GDP per capita increased eightfold; the largest share of GDP is the services sector, not agriculture; and the financial sector is now the third largest in Sub-Saharan Africa (after South Africa and Nigeria). These accomplishments are extraordinary. But the country’s 50th anniversary is also the time to reflect on measures needed to transform the lives of the majority of Kenyans. Nearly 4 of every 10 Kenyans live in poverty; maternal mortality is among the highest in Africa, with 488 deaths per 100,000 live births, secondary school enrollment is at a low 32 percent; and learning achievement levels are well below their potential and what is needed to fuel a modern market economy. GDP growth, while solid, has yet to takeoff at the rapid, sustained rate needed to transform the lives of ordinary citizens.
Kenya’s overall macroeconomic conditions are favorable. Growth is picking up, inflation remains low, the fiscal deficit remains manageable, and the exchange rate remains stable. The economy is estimated to have grown by 5.0 percent in 2013, up from 4.6 percent in 2012—the highest level since 2010, when the economy grew by 5.8 percent. This performance, although weak for East Africa, is commendable given Kenya’s history of low growth during election years (during which output rose less than 3 percent on average). Growth was driven mainly by consumption and to some extent investment. There was little volatility in international oil prices, and rainfall was adequate, which helped stabilize both food and energy prices. Year-on-year inflation was 7.4 percent in November 2013, and average inflation was 5.6 percent, down from 9.6 percent in 2012. Netting out the impact of the recent VAT increases, the inflation rate is within the 2 percentage-point margin of the 5 percent medium-term target.
Kenya will enter 2014 from a strong economic position. With inflationary pressure subdued—underpinned by stable energy prices and
December 2013 | Edition No. 9 v
EXECUTIVE SUMMARY
Figure 1: Kenya’s macroeconomic environment is strong
Source: World Bank, based on data from the Kenya National Bureau of Statistics
-6
-4
-2
0
2
4
6
8
10
4 1 2 3 4 1 2 3 4 1 2 3 4 1 2 3 4 1 2 3 4 1 2 3 4 1 2 3 4 1 2
2006 2007 2008 2009 2010 2011 2012 2013
GDP growth is picking up
Total GDP Agriculture GDP Non-agriculture GDP
0
5
10
15
20
25
30
Feb
Mar
Apr
May Jun Jul
Aug
Sept
Oct
Nov De
cJa
nFe
bM
arAp
rM
ay Jun Jul
Aug
Sept
Oct
Nov De
cJa
nFe
bM
arAp
rM
ay Jun Jul
Aug
Sept
Oct
Nov De
cJa
nFe
bM
arAp
rM
ay Jun Jul
Aug
Sept
Oct
Nov
2010 2011 2012 2013
Perc
ent
Perc
ent
Inflation has remained within the target range
Food inflation Core inflation Overall inflation

Executive Summary
December 2013 | Edition No. 9vi
moderation in food inflation, a stable exchange rate, and supportive monetary policy—Kenya has the potential for a growth spurt in 2014 (Figure 1). The government has set a bold agenda of reform outlined in the second Medium Term Plan (MTP II). However, it is the structural reforms currently being implemented that will boost growth in the near term. Reductions in delays in the clearance of cargo at the Port of Mombasa and recent measures to address the challenges of transporting cargo along the northern corridor are steps in the right direction to promoting regional trade. The removal of all roadblocks along the routes of cargo destined to countries in the region as part of the wider initiative to curb trade bottlenecks is a major step. “Huduma” centers, which provide one-stop-shop delivery of services, should curb the inefficiency that encouraged corruption and enhance the business environment.
Kenya strengthened its external position substantially in recent years, accumulating international reserves to meet program targets under the successfully completed IMF program. At the same time, the financing of current account deficit presents challenges and risks. The current account deficit, which averaged more than 10 percent of GDP in 2011 and 2012, narrowed in 2013 to 7.5 percent of GDP by September 2013. The improvement reflected lower import demand and higher exports of services. However, there are risks that the current account will deteriorate when imports pick up as the economy regains strength. The current account deficit is expected to remain high partly because of the need for imports of capital goods to support the construction of large-scale infrastructural projects and exploration for gas and oil. Financing of the current account deficit is primarily through short-term flows, as
foreign investors look for higher yields on their portfolios. Such inflows help to build reserves at the Central Bank and to finance the current account deficit, but they also increase Kenya’s vulnerability, because they are prone to investor risk aversion and can change abruptly in response to political and economic events.
The government maintained fiscal discipline, adopting domestic revenue-raising measures. However, execution of the budget, especially investment spending, leaves room for improvement. Higher execution rates would help promote the much sought after growth take-off. As part of the transition to the new government,
new procurement was suspended in the first quarter of 2013, and spending by the government slowed dramatically. The result was two-fold. First, low spending meant that government deposits built up at both the Central Bank (draining the banking system of liquidity) and at commercial banks where government holds deposits
(skewing liquidity to few banks). As a result, liquidity was tight in the banking system, with some banks with excess cash and others short of liquidity causing interbank rates to sour and muting the impact of supportive monetary policy actions. Second, the freeze in spending before the election and the changes in administration after it, brought development spending almost to a halt. Concerns about governance during the electioneering period limited government procurement and payments and reduced capital spending in the second half of fiscal 2012/13. The effect on infrastructure projects slowed economic growth. Moreover, the new administration reduced the number of ministries from 44 to 18. This consolidation though commendable had the undesirable effect as new procedures delayed the disbursement of funds (Figure 2).
The government’s policy of avoiding nonconcessional
borrowing has been a key factor in sustainable
debt management
A more dynamic banking sector could accelerate growth
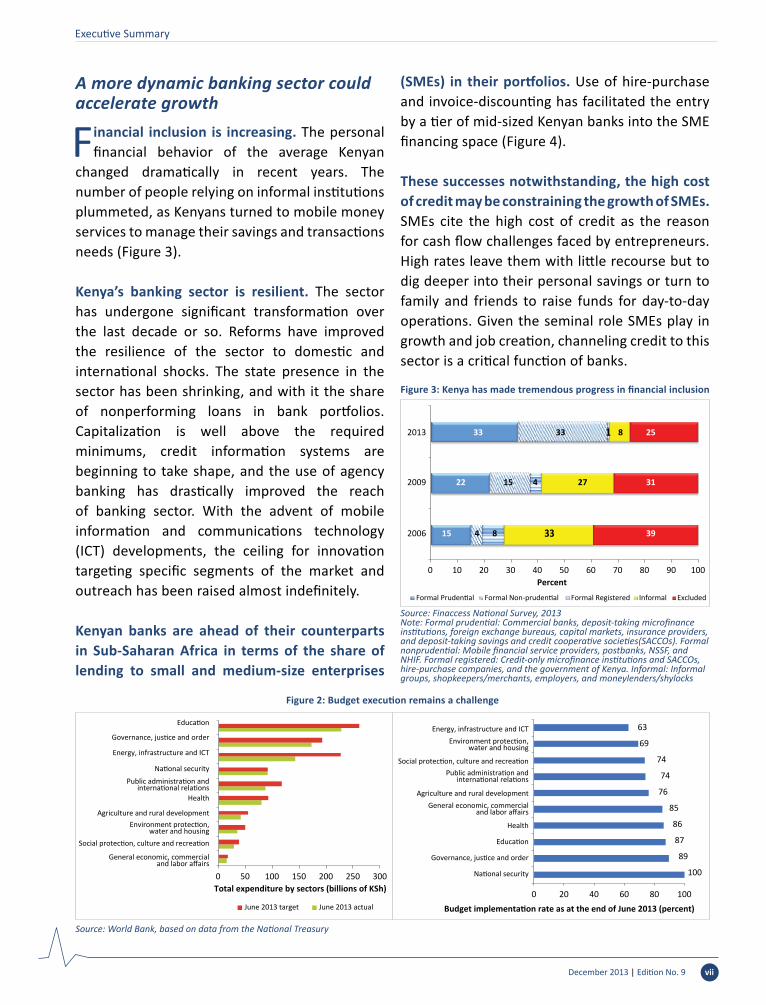
Financial inclusion is increasing. The personal financial behavior of the average Kenyan
changed dramatically in recent years. The number of people relying on informal institutions plummeted, as Kenyans turned to mobile money services to manage their savings and transactions needs (Figure 3).
Kenya’s banking sector is resilient. The sector has undergone significant transformation over the last decade or so. Reforms have improved the resilience of the sector to domestic and international shocks. The state presence in the sector has been shrinking, and with it the share of nonperforming loans in bank portfolios. Capitalization is well above the required minimums, credit information systems are beginning to take shape, and the use of agency banking has drastically improved the reach of banking sector. With the advent of mobile information and communications technology (ICT) developments, the ceiling for innovation targeting specific segments of the market and outreach has been raised almost indefinitely.
Kenyan banks are ahead of their counterparts in Sub-Saharan Africa in terms of the share of lending to small and medium-size enterprises
(SMEs) in their portfolios. Use of hire-purchase and invoice-discounting has facilitated the entry by a tier of mid-sized Kenyan banks into the SME financing space (Figure 4).
These successes notwithstanding, the high cost of credit may be constraining the growth of SMEs. SMEs cite the high cost of credit as the reason for cash flow challenges faced by entrepreneurs. High rates leave them with little recourse but to dig deeper into their personal savings or turn to family and friends to raise funds for day-to-day operations. Given the seminal role SMEs play in growth and job creation, channeling credit to this sector is a critical function of banks.
December 2013 | Edition No. 9 vii
Executive Summary
Figure 3: Kenya has made tremendous progress in financial inclusion
Source: Finaccess National Survey, 2013Note: Formal prudential: Commercial banks, deposit-taking microfinance institutions, foreign exchange bureaus, capital markets, insurance providers, and deposit-taking savings and credit cooperative societies(SACCOs). Formal nonprudential: Mobile financial service providers, postbanks, NSSF, and NHIF. Formal registered: Credit-only microfinance institutions and SACCOs, hire-purchase companies, and the government of Kenya. Informal: Informal groups, shopkeepers/merchants, employers, and moneylenders/shylocks
15
22
33
4
15
33
8
4
1
33
27
8
39
31
25
0 10 20 30 40 50 60 70 80 90 100
2006
2009
2013
Percent
Formal Prudential Formal Non-prudential Formal Registered Informal Excluded
Figure 2: Budget execution remains a challenge
Source: World Bank, based on data from the National Treasury
0 50 100 150 200 250 300Total expenditure by sectors (billions of KSh)
June 2013 target June 2013 actual
100
89
87
86
85
76
74
74
69
63
0 20 40 60 80 100
National security
National security
Governance, justice and order
Governance, justice and order
Education
Education
Health
HealthGeneral economic, commercial
and labor affairs
General economic, commercialand labor affairs
Agriculture and rural development
Agriculture and rural development
Public administration andinternational relationsPublic administration and
international relations
Social protection, culture and recreation
Social protection, culture and recreation
Environment protection,water and housing
Environment protection,water and housing
Energy, infrastructure and ICT
Energy, infrastructure and ICT
Budget implementation rate as at the end of June 2013 (percent)

Executive Summary
December 2013 | Edition No. 9viii
One criticism of the Kenyan banking sector is that the interest rate spread is high. The difference between the average rate of interest charged by banks on loans to customers and the average rate of interest banks pay on savings deposits remains persistently high, at the same time as banking sector profitability has grown (Figure 5). This perception of high spreads and growing profitability has left the industry open to repeated criticisms of collusive price-setting behavior. However, it is important to note that no hard rules prescribe the optimal interest spreads that correspond to specific market conditions; there is no definitive way to determine whether spreads are too high, too low, or just right, especially when information markets are incomplete.
Although it is difficult prima facie to determine whether spreads are “appropriate,” it is possible to dig deeper into the factors that affect the cost of credit in Kenya. Such factors include the overall macroeconomic and policy environment; market structure and price-setting behavior; the return on risk-free assets; the interest rate structure; and the risks (and perceived risks) associated with lending to SMEs, which are affected by information asymmetries, the level of informality, and the high costs of loan recovery in case of default.
Other challenges remain. The building blocks for the path forward are already falling into place, though some areas may need more effort than others. Recent improvements in the financial infrastructure through a better collateral registry system and a more effective creditor rights framework will plug some of the information gaps and enable banks to price risks at a lower level. A sound government debt management policy (essentially a regular issuance policy that lowers the volatility of the returns on the risk-free asset) that informs a stable interest rate structure will improve the transparency and predictability of the credit pricing models. Efforts to strengthen capital markets, pensions, and the insurance sector so that SMEs can access alternative sources and instruments for their financing needs will pay dividends. These developments will serve Kenya well in reaching its goal of attaining middle-income status. A mature banking sector—and more generally, a well-developed financial sector that supports a vibrant private sector—will be an important advantage to achieving the Vision 2030 goals.
The State of Kenya’s EconomyFigure 4: Kenyan banks lend more to small and medium-size enterprises than banks in some other countries in the region
Source: World Bank, 2013
0
2
4
6
8
10
12
14
16
18
20
Nigeria South Africa Tanzania Rwanda Kenya
Shar
e of
tota
l ban
k le
ndin
g th
at g
oes
to S
MEs
(per
cent
)Figure 5: Overheads and profits account for the bulk
of interest rate spreads in Kenya
Source: World Bank, based on data from the Central Bank of KenyaNote: Ex post spreads are calculated based on the actual balance sheets and profit and loss accounts (ex ante spreads are based on the difference between deposit and lending rates). The trends in the two measures are similar
0.6 0.6 0.7 0.9
4.5 4.0 4.34.7
0.80.9 0.4
0.5
4.2 5.0 5.75.6
0
2
4
6
8
10
12
2009 2010 2011 2012
Perc
ent
Reserves Overheads Provisions Profit

Executive Summary
The State of Kenya’s Economy

The State of Kenya’s Economy
December 2013 | Edition No. 92
The World Bank expects that Kenya’s GDP will grow 5.0 percent in 2013, marginally higher than the 4.6 percent growth achieved in 2012. Domestic factors played a role in the lower than expected
growth, reflecting a weakening investment climate, unsupportive fiscal environment at both the national and county level, and slow transmission of accommodative monetary policy stance into lower lending rates. There was good news in 2013, however: the current account deficit narrowed considerably, from more than 10 percent of GDP to 7.5 percent, reducing the economy’s vulnerability to external shock, and for the first time in years, the economy avoided the election-growth curse of lower growth in an election year.
1. Economic Performance in 2013
1.1 Growth Picked Up—Although It Remains below Potential
Growth accelerated in 2013. Macroeconomic conditions continued to improve, as
Kenya’s economy entered the third year of relative stability, with single-digit inflation and a stabilized exchange rate. GDP growth was lower than projected. However, despite the peaceful presidential election and smooth transfer of power in March 2013, the growth momentum generated in the last quarter of 2012 was lost in the second and third quarters of 2013, held down by lack of government spending and inadequate transmission of the monetary policy stance to the real economy.
The challenges facing government spending during the transition slowed growth, which is expected to reach 5.0 percent in 2013. Monetary policy efforts to stimulate the economy through accommodative monetary policy were thwarted by lack of liquidity in the banking system, which increased short-term rates, as government deposits accumulated at the Central Bank and the few commercial banks where the government had its deposits outside the Central Bank.
Monetary policy supported growth in 2013, as the Central Bank reduced its policy rate and provided liquidity support to the banking system. Intervention through repo operations prevented interbank rates from overshooting. Credit
activity remained subdued, as banks became more reluctant to lend during the transition and demand for credit waned in light of weaker business prospects.
GDP growth of 4.7 percent in the first half of 2013 was driven by the robust performance of agriculture and industry. Growth was higher than the 4.3 percent during the same period in 2012 and the highest growth in the first half of the year since 2008 (Figure 1.1). Abundant rain increased crop production and hydropower generation, which improved performance in both agriculture and industry. Low interest rates, low inflation, and a stable shilling created a better macroeconomic environment for industry and businesses in the first half of 2013.
Figure 1.1: Modest growth in the first half of 2013 represented Kenya’s best first-half performance since 2008
Source: World Bank calculations based on data from the Kenya National Bureau of Statistics.Note: Estimate for the second half of 2013 is based on revised annual growth projection of 5.0 percent.
1.7 1.4
4.0
1.6
3.7
7.8
4.24.5 4.3
4.8 4.75.3
0
1
2
3
4
5
6
7
8
9
H1 H2 H1 H2 H1 H2 H1 H2 H1 H2 H1 H2
Annu
al g
row
th (p
erce
nt)
2008 2009 2010 2011 2012 2013

December 2013 | Edition No. 9 3
The State of Kenya’s Economy
The economy is still underperforming compared to its neighbors. Average annual growth in Kenya was 4.4 percent in 2008-2013, much lower than in Uganda (5.6 percent), Tanzania (6.6 percent), Rwanda (7.3 percent), and Sub-Saharan Africa average as a whole (5.5 percent) (Figure 1.2).
Global volatility affected Kenya’s economic activity more than its neighbors’ because its economy is more integrated with the global economy (Figure 1.3). Average trade (exports plus imports) as a share of GDP stood at 66.6 percent during 2005-2011—a larger share than Tanzania (63.4 percent) or Uganda (51.5 percent).
The recent decline in global commodity prices constrained exports in the region as a whole; Kenya’s greater integration into the global economy leaves it particularly vulnerable to global oil price upsurges, exchange rate volatility, and global recession.
The first half of 2013 saw a rebound in agricultural output. Agriculture grew at an annual rate of 6.7 percent—three times the rate in the previous two years (Figure 1.4). Strong agricultural performance was the result of above-average rainfall, which boosted crop production. The uptick reflected much better climatic conditions than in 2012, when frost adversely affected tea production. Tea production rose from a low of 11 percent in the year ending July 2012 to a robust rate of growth of 38 percent during the same period in 2013, according to the Kenya National Bureau of Statistics. The production and export of tea increased despite civil unrest in Egypt, a major importer of Kenyan tea. Improved supply and continued low demand from Kenya’s trading partners caused commodity prices to fall. Despite the decline, exports from tea and horticulture exports increased, as a result of higher volume. The volume of tea production grew 42.6 percent in the first half of 2013, while the auction price dropped 7.6 percent. The volume of horticulture exports increased 12.2 percent,
Figure 1.2: Average growth was lower in Kenya than in most of its neighbors and Sub-Saharan Africa as a whole between 2008 and 2013
Source: World Bank, based on data from the Kenya National Bureau of Statistics and the World Bank.Note: 2013 projections are based on World Economic Prospects, except for Kenya, which was based on the revised projection of 5 percent.
4.04.4
5.5 5.6
6.67.3
0
1
2
3
4
5
6
7
8
Burundi Kenya Sub-Saharan Africa excluding
South Africa
Uganda Tanzania Rwanda
Annu
al g
row
th 2
009-
2013
(per
cent
)
Figure 1.3: For decades, Kenya has been more globallyintegrated than its neighbors
Source: World Development indicators database
0
10
1990
1991
1992
1993
1994
1995
1996
1997
1998
1999
2000
2001
2002
2003
2004
2005
2006
2007
2008
2009
2010
2011
20
30
40
50
60
70
80
Shar
e of
trad
e (e
xpor
ts +
impo
rts)
to G
DP (p
erce
nt)
Burundi Kenya Rwanda Uganda Tanzania
Figure 1.4: All sectors except services showed strong growth in the first half of 2013
Source: World Bank, based on data from the Kenya National Bureau of Statistics
2.0
3.5
4.3
5.2
2.11.8
4.9 4.8
6.7
4.2
8.8
4.0
0
1
2
3
4
5
6
7
8
9
Agriculture Manufacturing Other industries Services
Annu
al g
row
th ra
te (p
erce
nt)
2011 2012 2013

The State of Kenya’s Economy
December 2013 | Edition No. 94
and the value of exports grew 7.3 percent. Export volume expanded 38.5 percent for vegetables, 6.7 percent for fruits, and 2.6 percent for cut flowers. In contrast, the volume of coffee production decreased 8.8 percent and the value fell 32.1 percent, as both acreage under coffee and prices declined.
The industrial sector expanded. Manufacturing (which accounts for 9.8 percent of total GDP) grew by 4.2 percent, electricity and water by 7.9, construction by 9.8 percent, and mining and quarrying by 5.4 percent during the first half of 2013. Performance was attributed to above-average rainfall, a stable macroeconomic environment, improved access to credit, and lower energy costs. Significant hydropower generation increased the domestic electricity supply and reduced the cost associated with power losses. Hydropower generation increased 14.1 percent, and geothermal generation rose 10 percent. Thermal electricity generation contracted 10.8 percent, indicating the shift away from reliance on nonrenewable energy. Electricity consumption rose 3.2 percent. The construction subsector grew 9.8 percent, underpinned partly by growing domestic investment in buildings. The real value of buildings approved by the Nairobi City Council during the first half of 2013 rose to KSh 1.4 billion, up from KSh 1.3 billion during the same
period in 2012. Domestic cement production and consumption rose 3 percent. Recent data from the Kenya National Bureau of Statistics indicate that electricity generation grew 7.3 percent in the year ending August 2013, an increase over the 4.0 percent rise in 2012. Sugar production rose 0.6 percent in the year ending July 2013, up from 0.01 percent in 2012. For cement production, growth for the first seven months of 2013 stood at 3 percent, up from a 0.1 percent contraction in 2012, suggesting annual growth of 3.1 percent in 2013.
Growth of the services sector was subdued. Services have accounted for 47 percent of Kenya’s GDP since 2005. The sector grew at an annual rate of just 4.0 percent during the first half of 2013, down from 4.8 percent during the same period in 2012. The transport and communication subsectors (which accounted for 25 percent of total services output) contracted. Growth in financial intermediation wholesale and retail trade, which usually grow much faster, was modest (Figure 1.5). Other services continued to experience very limited growth, following high lending rates. Wholesale and retail trade grew by 1.3 percent; financial intermediation by 0.6 percent; real estate, renting, and business services by 0.4 percent; and public administration by 0.2 percent.
Figure 1.5: Performance in the services sector was mixed in 2013
Source: Kenya National Bureau of Statistics, Leading Economic Indicators
0.2
0.3
0.4
0.5
0.6
1.3
1.3
-0.5 0 0.5 1.0 1.5 2.0
Hotels and restaurants
Financial intermediationindirectly measured
Public administration
Other services
Real estate, renting,business services
Education
Financial intermediation
Wholesale and retail trade
Transport and communication
Weighted growth (percent)First half of 2013 First half of 2012
-2
-1
0
1
2
3
4
5
6
7
8
2006 2007 2008 2009 2010 2011 2012 2013
Wei
ghte
d gr
owth
(per
cent
)
Wholesale and retail trade Transport and communicationFinancial intermediation Services
December 2013 | Edition No. 9 5
The State of Kenya’s Economy
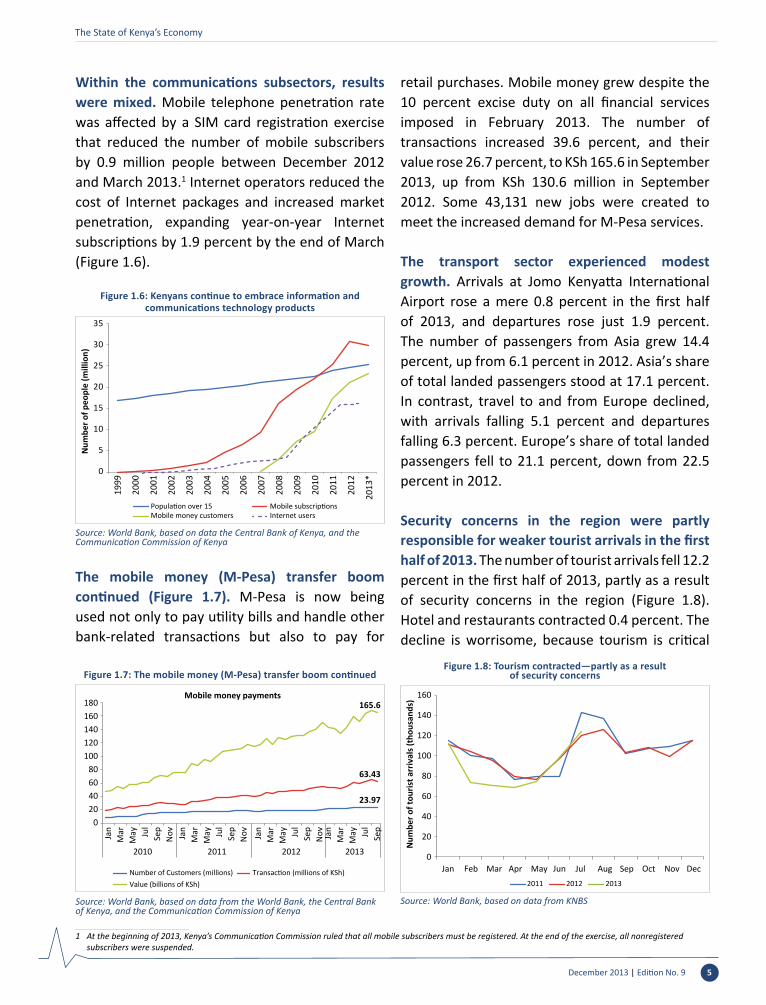
Within the communications subsectors, results were mixed. Mobile telephone penetration rate was affected by a SIM card registration exercise that reduced the number of mobile subscribers by 0.9 million people between December 2012 and March 2013.1 Internet operators reduced the cost of Internet packages and increased market penetration, expanding year-on-year Internet subscriptions by 1.9 percent by the end of March (Figure 1.6).
The mobile money (M-Pesa) transfer boom continued (Figure 1.7). M-Pesa is now being used not only to pay utility bills and handle other bank-related transactions but also to pay for
retail purchases. Mobile money grew despite the 10 percent excise duty on all financial services imposed in February 2013. The number of transactions increased 39.6 percent, and their value rose 26.7 percent, to KSh 165.6 in September 2013, up from KSh 130.6 million in September 2012. Some 43,131 new jobs were created to meet the increased demand for M-Pesa services.
The transport sector experienced modest growth. Arrivals at Jomo Kenyatta International Airport rose a mere 0.8 percent in the first half of 2013, and departures rose just 1.9 percent. The number of passengers from Asia grew 14.4 percent, up from 6.1 percent in 2012. Asia’s share of total landed passengers stood at 17.1 percent. In contrast, travel to and from Europe declined, with arrivals falling 5.1 percent and departures falling 6.3 percent. Europe’s share of total landed passengers fell to 21.1 percent, down from 22.5 percent in 2012.
Security concerns in the region were partly responsible for weaker tourist arrivals in the first half of 2013. The number of tourist arrivals fell 12.2 percent in the first half of 2013, partly as a result of security concerns in the region (Figure 1.8).Hotel and restaurants contracted 0.4 percent. The decline is worrisome, because tourism is critical
Figure 1.6: Kenyans continue to embrace information and communications technology products
Source: World Bank, based on data the Central Bank of Kenya, and the Communication Commission of Kenya
0
5
10
15
20
25
30
35
1999
2000
2001
2002
2003
2004
2005
2006
2007
2008
2009
2010
2011
2012
2013
*
Num
ber o
f peo
ple
(mill
ion)
Population over 15 Mobile subscriptionsMobile money customers Internet users
Figure 1.7: The mobile money (M-Pesa) transfer boom continued
Source: World Bank, based on data from the World Bank, the Central Bank of Kenya, and the Communication Commission of Kenya
23.97
63.43
165.6
020406080
100120140160180
Jan
Mar
May Ju
lSe
pN
ov Jan
Mar
May Ju
lSe
pN
ov Jan
Mar
May Ju
lSe
pN
ov
2010 2011 2012
Jan
Mar
May Ju
lSe
p
2013
Mobile money payments
Number of Customers (millions) Transaction (millions of KSh)Value (billions of KSh)
1 At the beginning of 2013, Kenya’s Communication Commission ruled that all mobile subscribers must be registered. At the end of the exercise, all nonregistered subscribers were suspended.
Figure 1.8: Tourism contracted—partly as a result of security concerns
Source: World Bank, based on data from KNBS
0
20
Jan Feb Jul Aug Sep Oct Nov DecMar Apr May Jun
40
60
80
100
120
140
160
Num
ber o
f tou
rist a
rriv
als (
thou
sand
s)
2011 2012 2013
The State of Kenya’s Economy
December 2013 | Edition No. 96
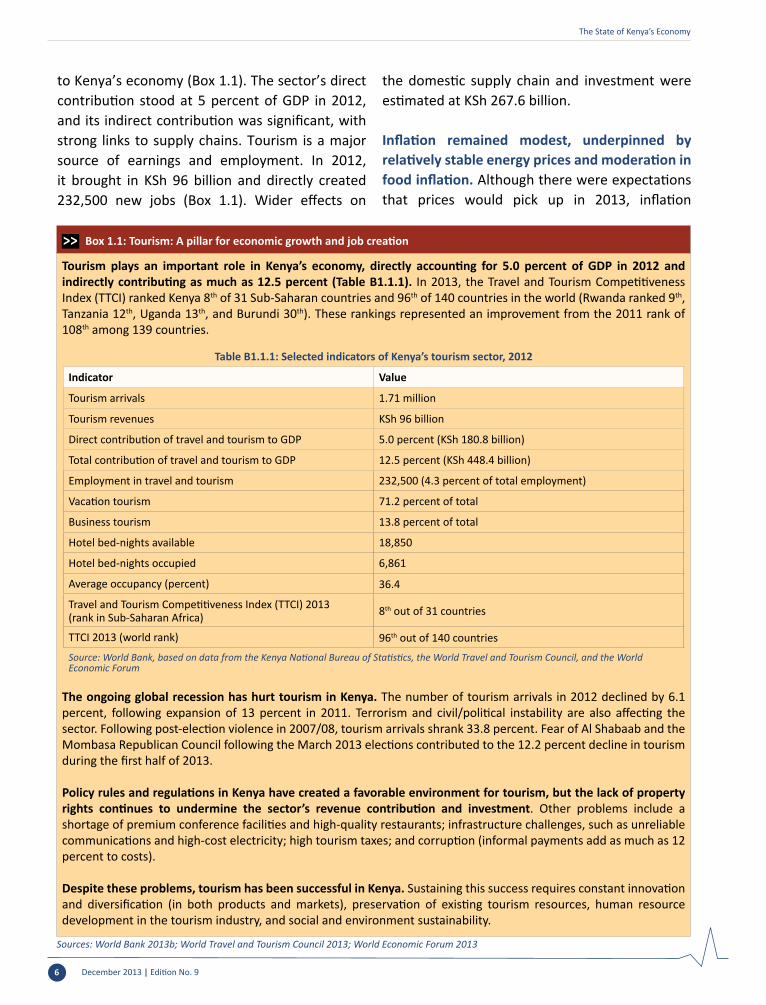
to Kenya’s economy (Box 1.1). The sector’s direct contribution stood at 5 percent of GDP in 2012, and its indirect contribution was significant, with strong links to supply chains. Tourism is a major source of earnings and employment. In 2012, it brought in KSh 96 billion and directly created 232,500 new jobs (Box 1.1). Wider effects on
the domestic supply chain and investment were estimated at KSh 267.6 billion.
Inflation remained modest, underpinned by relatively stable energy prices and moderation in food inflation. Although there were expectations that prices would pick up in 2013, inflation
Box 1.1: Tourism: A pillar for economic growth and job creation
Tourism plays an important role in Kenya’s economy, directly accounting for 5.0 percent of GDP in 2012 and indirectly contributing as much as 12.5 percent (Table B1.1.1). In 2013, the Travel and Tourism Competitiveness Index (TTCI) ranked Kenya 8th of 31 Sub-Saharan countries and 96th of 140 countries in the world (Rwanda ranked 9th, Tanzania 12th, Uganda 13th, and Burundi 30th). These rankings represented an improvement from the 2011 rank of 108th among 139 countries.
The ongoing global recession has hurt tourism in Kenya. The number of tourism arrivals in 2012 declined by 6.1 percent, following expansion of 13 percent in 2011. Terrorism and civil/political instability are also affecting the sector. Following post-election violence in 2007/08, tourism arrivals shrank 33.8 percent. Fear of Al Shabaab and the Mombasa Republican Council following the March 2013 elections contributed to the 12.2 percent decline in tourism during the first half of 2013.
Policy rules and regulations in Kenya have created a favorable environment for tourism, but the lack of property rights continues to undermine the sector’s revenue contribution and investment. Other problems include a shortage of premium conference facilities and high-quality restaurants; infrastructure challenges, such as unreliable communications and high-cost electricity; high tourism taxes; and corruption (informal payments add as much as 12 percent to costs).
Despite these problems, tourism has been successful in Kenya. Sustaining this success requires constant innovation and diversification (in both products and markets), preservation of existing tourism resources, human resource development in the tourism industry, and social and environment sustainability.
Table B1.1.1: Selected indicators of Kenya’s tourism sector, 2012
Indicator Value
Tourism arrivals 1.71 million
Tourism revenues KSh 96 billion
Direct contribution of travel and tourism to GDP 5.0 percent (KSh 180.8 billion)
Total contribution of travel and tourism to GDP 12.5 percent (KSh 448.4 billion)
Employment in travel and tourism 232,500 (4.3 percent of total employment)
Vacation tourism 71.2 percent of total
Business tourism 13.8 percent of total
Hotel bed-nights available 18,850
Hotel bed-nights occupied 6,861
Average occupancy (percent) 36.4
Travel and Tourism Competitiveness Index (TTCI) 2013 (rank in Sub-Saharan Africa) 8th out of 31 countries
TTCI 2013 (world rank) 96th out of 140 countries
Source: World Bank, based on data from the Kenya National Bureau of Statistics, the World Travel and Tourism Council, and the World Economic Forum
Sources: World Bank 2013b; World Travel and Tourism Council 2013; World Economic Forum 2013
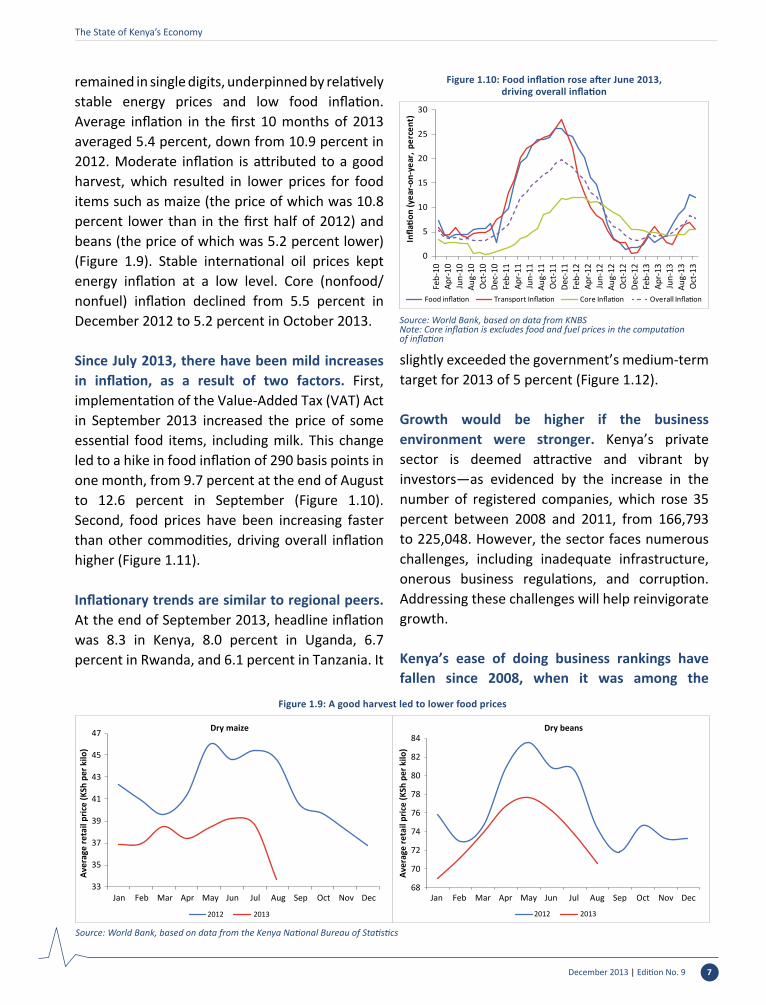
Figure 1.9: A good harvest led to lower food prices
Source: World Bank, based on data from the Kenya National Bureau of Statistics
33
35
37
39
41
43
45
47
Jan Feb Mar Apr May Jun Jul Aug Sep Oct Nov Dec
Aver
age
reta
il pr
ice
(KSh
per
kilo
)
Dry maize
2012 2013 2012 2013
68
70
72
74
76
78
80
82
84
Jan Feb Mar Apr May Jun Jul Aug Sep Oct Nov Dec
Aver
age
reta
il pr
ice
(KSh
per
kilo
)
Dry beans
December 2013 | Edition No. 9 7
The State of Kenya’s Economy
remained in single digits, underpinned by relatively stable energy prices and low food inflation. Average inflation in the first 10 months of 2013 averaged 5.4 percent, down from 10.9 percent in 2012. Moderate inflation is attributed to a good harvest, which resulted in lower prices for food items such as maize (the price of which was 10.8 percent lower than in the first half of 2012) and beans (the price of which was 5.2 percent lower)(Figure 1.9). Stable international oil prices kept energy inflation at a low level. Core (nonfood/nonfuel) inflation declined from 5.5 percent in December 2012 to 5.2 percent in October 2013.
Since July 2013, there have been mild increases in inflation, as a result of two factors. First, implementation of the Value-Added Tax (VAT) Act in September 2013 increased the price of some essential food items, including milk. This change led to a hike in food inflation of 290 basis points in one month, from 9.7 percent at the end of August to 12.6 percent in September (Figure 1.10).Second, food prices have been increasing faster than other commodities, driving overall inflation higher (Figure 1.11).
Inflationary trends are similar to regional peers. At the end of September 2013, headline inflation was 8.3 in Kenya, 8.0 percent in Uganda, 6.7 percent in Rwanda, and 6.1 percent in Tanzania. It
slightly exceeded the government’s medium-term target for 2013 of 5 percent (Figure 1.12).
Growth would be higher if the business environment were stronger. Kenya’s private sector is deemed attractive and vibrant by investors—as evidenced by the increase in the number of registered companies, which rose 35 percent between 2008 and 2011, from 166,793 to 225,048. However, the sector faces numerous challenges, including inadequate infrastructure, onerous business regulations, and corruption. Addressing these challenges will help reinvigorate growth.
Kenya’s ease of doing business rankings have fallen since 2008, when it was among the
Figure 1.10: Food inflation rose after June 2013, driving overall inflation
Source: World Bank, based on data from KNBSNote: Core inflation is excludes food and fuel prices in the computation of inflation
0
5
10
15
20
25
30
Infla
tion
(yea
r-on
-yea
r, pe
rcen
t)
Food inflation Transport Inflation Core Inflation Overall Inflation
Feb-
10Ap
r-10
Jun-
10Au
g-10
Oct
-10
Dec-
10Fe
b-11
Apr-
11Ju
n-11
Aug-
11O
ct-1
1De
c-11
Feb-
12Ap
r-12
Jun-
12Au
g-12
Oct
-12
Dec-
12Fe
b-13
Apr-
13Ju
n-13
Aug-
13O
ct-1
3
The State of Kenya’s Economy
December 2013 | Edition No. 98
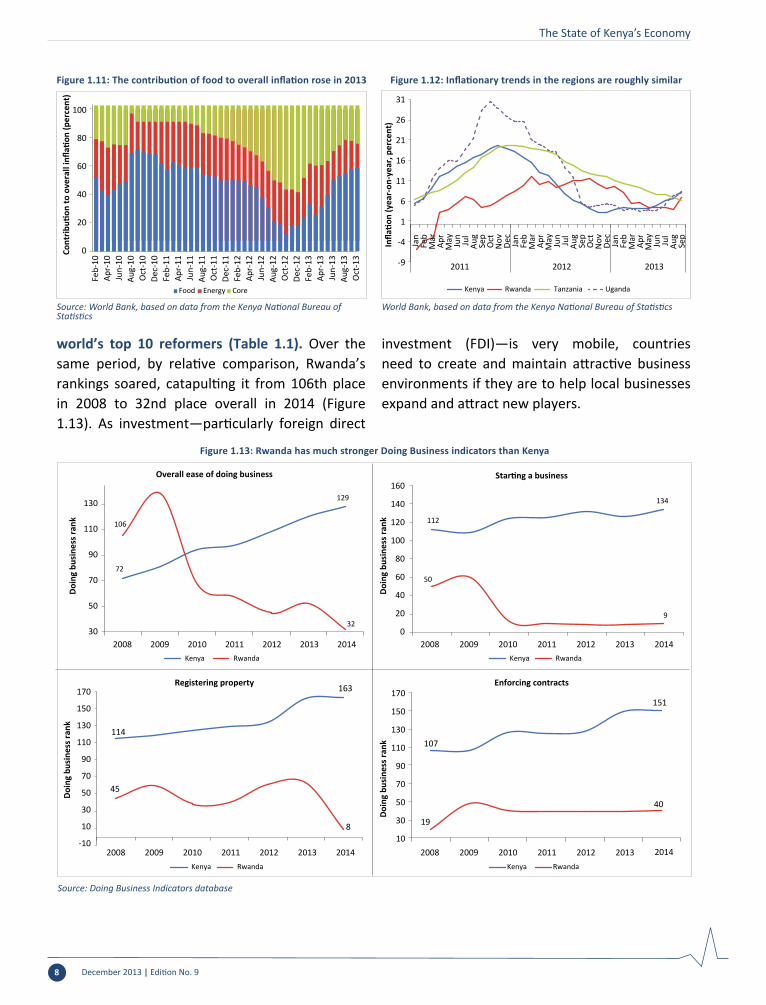
world’s top 10 reformers (Table 1.1). Over the same period, by relative comparison, Rwanda’s rankings soared, catapulting it from 106th place in 2008 to 32nd place overall in 2014 (Figure 1.13). As investment—particularly foreign direct
investment (FDI)—is very mobile, countries need to create and maintain attractive business environments if they are to help local businesses expand and attract new players.
Figure 1.11: The contribution of food to overall inflation rose in 2013
Source: World Bank, based on data from the Kenya National Bureau of Statistics
0
20
Feb-
10Ap
r-10
Jun-
10Au
g-10
Oct
-10
Dec-
10Fe
b-11
Apr-
11Ju
n-11
Aug-
11O
ct-1
1De
c-11
Feb-
12Ap
r-12
Jun-
12Au
g-12
Oct
-12
Feb-
13Ap
r-13
Jun-
13Au
g-13
Oct
-13
Dec-
12
40
60
80
100
Cont
ributi
on to
ove
rall
infla
tion
(per
cent
)
Food Energy Core
Figure 1.12: Inflationary trends in the regions are roughly similar
World Bank, based on data from the Kenya National Bureau of Statistics
-9
-4
1
6
11
16
21
26
31
Jan
Feb
Mar
Apr
May Jun
Jul
Aug
Sep
Oct
Nov De
cJa
nFe
bM
arAp
rM
ay Jun
Jul
Aug
Sep
Oct
Nov De
cJa
nFe
bM
arAp
rM
ay Jun
Jul
Aug
Sep
2011 2012 2013
Infla
tion
(yea
r-on
-yea
r, pe
rcen
t)
Kenya Rwanda Tanzania Uganda
Figure 1.13: Rwanda has much stronger Doing Business indicators than Kenya
Source: Doing Business Indicators database
72
129
106
3230
50
70
90
110
130
2008 2009 2010 2011 2012 2013 2014
Doin
g bu
sine
ss ra
nk
Overall ease of doing business
Kenya Rwanda
112
134
50
9
0
20
40
60
80
100
120
140
160
2008 2009 2010 2011 2012 2013 2014
Doin
g bu
sine
ss ra
nk
Starting a business
Kenya Rwanda
114
163
45
8
-10
10
30
50
70
90
110
130
150
170
2008 2009 2010 2011 2012 2013 2014
Doin
g bu
sine
ss ra
nk
Registering property
Kenya Rwanda
107
151
19
40
10
30
50
70
90
110
130
150
170
2008 2009 2010 2011 2012 2013 2014
Doin
g bu
sine
ss ra
nk
Enforcing contracts
Kenya Rwanda
December 2013 | Edition No. 9 9
The State of Kenya’s Economy
1.2 Fiscal Discipline Maintained Despite Emerging Pressures
Kenya maintained fiscal discipline despite spending pressures in 2012/13. The overall
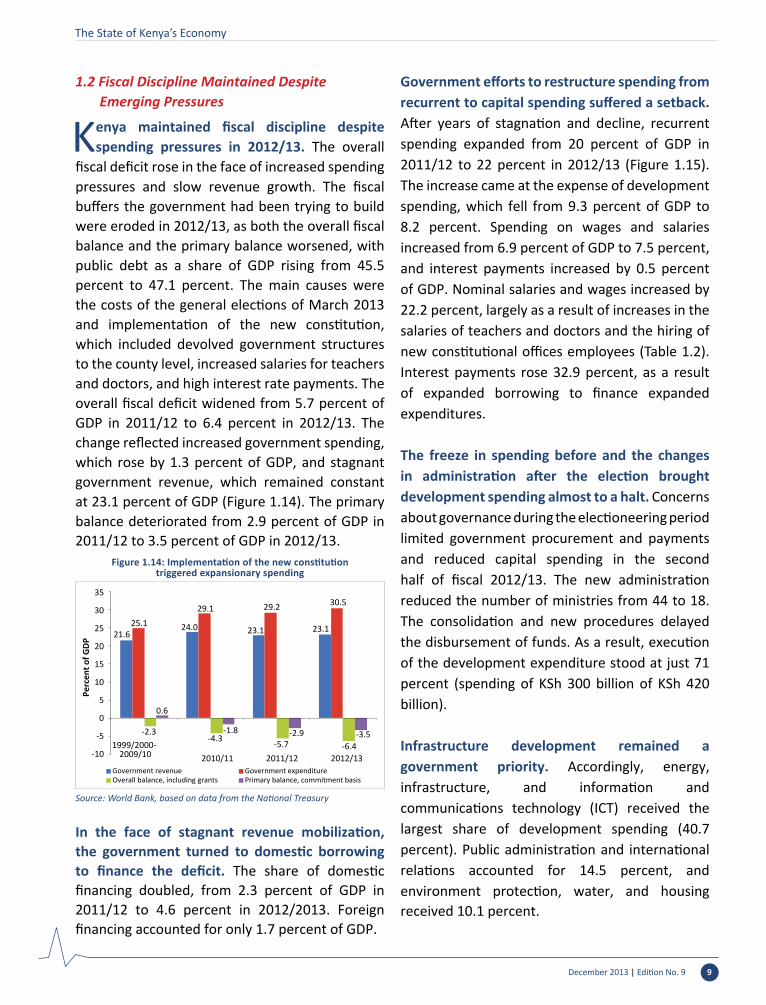
fiscal deficit rose in the face of increased spending pressures and slow revenue growth. The fiscal buffers the government had been trying to build were eroded in 2012/13, as both the overall fiscal balance and the primary balance worsened, with public debt as a share of GDP rising from 45.5 percent to 47.1 percent. The main causes were the costs of the general elections of March 2013 and implementation of the new constitution, which included devolved government structures to the county level, increased salaries for teachers and doctors, and high interest rate payments. The overall fiscal deficit widened from 5.7 percent of GDP in 2011/12 to 6.4 percent in 2012/13. The change reflected increased government spending, which rose by 1.3 percent of GDP, and stagnant government revenue, which remained constant at 23.1 percent of GDP (Figure 1.14). The primary balance deteriorated from 2.9 percent of GDP in 2011/12 to 3.5 percent of GDP in 2012/13.
In the face of stagnant revenue mobilization, the government turned to domestic borrowing to finance the deficit. The share of domestic financing doubled, from 2.3 percent of GDP in 2011/12 to 4.6 percent in 2012/2013. Foreign financing accounted for only 1.7 percent of GDP.
Government efforts to restructure spending from recurrent to capital spending suffered a setback. After years of stagnation and decline, recurrent spending expanded from 20 percent of GDP in 2011/12 to 22 percent in 2012/13 (Figure 1.15). The increase came at the expense of development spending, which fell from 9.3 percent of GDP to 8.2 percent. Spending on wages and salaries increased from 6.9 percent of GDP to 7.5 percent, and interest payments increased by 0.5 percent of GDP. Nominal salaries and wages increased by 22.2 percent, largely as a result of increases in the salaries of teachers and doctors and the hiring of new constitutional offices employees (Table 1.2). Interest payments rose 32.9 percent, as a result of expanded borrowing to finance expanded expenditures.
The freeze in spending before and the changes in administration after the election brought development spending almost to a halt. Concerns about governance during the electioneering period limited government procurement and payments and reduced capital spending in the second half of fiscal 2012/13. The new administration reduced the number of ministries from 44 to 18. The consolidation and new procedures delayed the disbursement of funds. As a result, execution of the development expenditure stood at just 71 percent (spending of KSh 300 billion of KSh 420 billion).
Infrastructure development remained a government priority. Accordingly, energy, infrastructure, and information and communications technology (ICT) received the largest share of development spending (40.7 percent). Public administration and international relations accounted for 14.5 percent, and environment protection, water, and housing received 10.1 percent.
Figure 1.14: Implementation of the new constitutiontriggered expansionary spending
Source: World Bank, based on data from the National Treasury
21.624.0 23.1 23.125.1
29.1 29.2 30.5
-2.3-4.3 -5.7 -6.4
0.6
-1.8 -2.9 -3.5
-10
-5
0
5
10
15
20
25
30
35
1999/2000-2009/10 2010/11 2011/12 2012/13
Perc
ent o
f GDP
Government revenue Government expenditureOverall balance, including grants Primary balance, commitment basis
The State of Kenya’s Economy
December 2013 | Edition No. 910
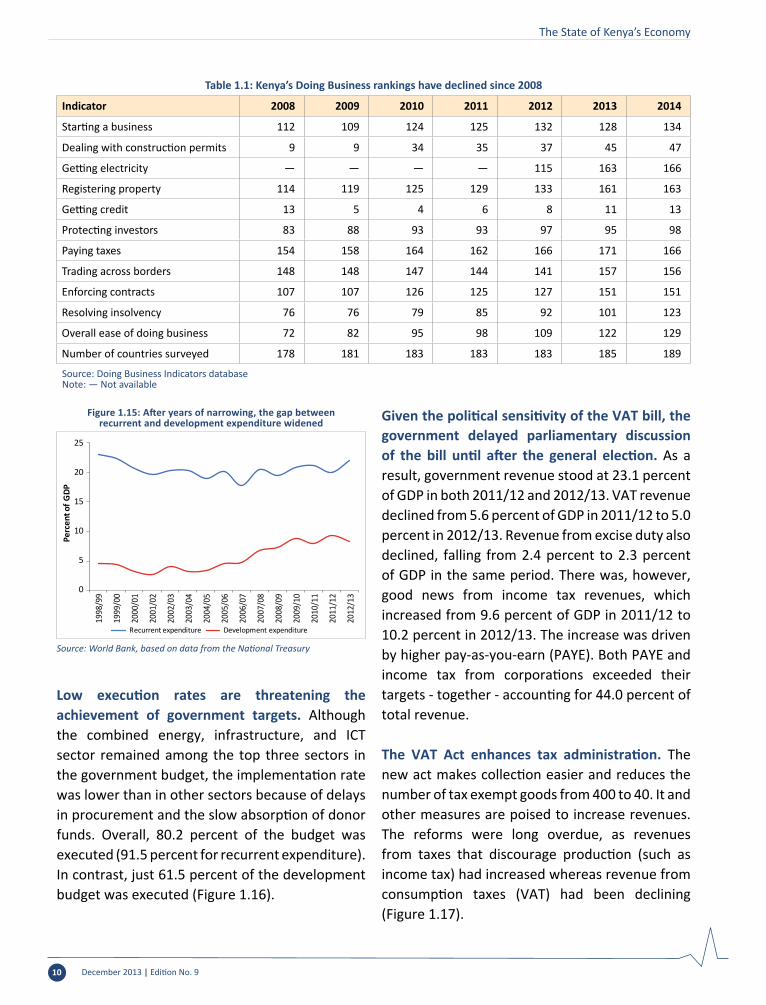
Low execution rates are threatening the achievement of government targets. Although the combined energy, infrastructure, and ICT sector remained among the top three sectors in the government budget, the implementation rate was lower than in other sectors because of delays in procurement and the slow absorption of donor funds. Overall, 80.2 percent of the budget was executed (91.5 percent for recurrent expenditure).In contrast, just 61.5 percent of the development budget was executed (Figure 1.16).
Given the political sensitivity of the VAT bill, the government delayed parliamentary discussion of the bill until after the general election. As a result, government revenue stood at 23.1 percent of GDP in both 2011/12 and 2012/13. VAT revenue declined from 5.6 percent of GDP in 2011/12 to 5.0 percent in 2012/13. Revenue from excise duty also declined, falling from 2.4 percent to 2.3 percent of GDP in the same period. There was, however, good news from income tax revenues, which increased from 9.6 percent of GDP in 2011/12 to 10.2 percent in 2012/13. The increase was driven by higher pay-as-you-earn (PAYE). Both PAYE and income tax from corporations exceeded their targets - together - accounting for 44.0 percent of total revenue.
The VAT Act enhances tax administration. The new act makes collection easier and reduces the number of tax exempt goods from 400 to 40. It and other measures are poised to increase revenues. The reforms were long overdue, as revenues from taxes that discourage production (such as income tax) had increased whereas revenue from consumption taxes (VAT) had been declining (Figure 1.17).
Table 1.1: Kenya’s Doing Business rankings have declined since 2008
Indicator 2008 2009 2010 2011 2012 2013 2014
Starting a business 112 109 124 125 132 128 134
Dealing with construction permits 9 9 34 35 37 45 47
Getting electricity — — — — 115 163 166
Registering property 114 119 125 129 133 161 163
Getting credit 13 5 4 6 8 11 13
Protecting investors 83 88 93 93 97 95 98
Paying taxes 154 158 164 162 166 171 166
Trading across borders 148 148 147 144 141 157 156
Enforcing contracts 107 107 126 125 127 151 151
Resolving insolvency 76 76 79 85 92 101 123
Overall ease of doing business 72 82 95 98 109 122 129
Number of countries surveyed 178 181 183 183 183 185 189
Source: Doing Business Indicators databaseNote: — Not available
Figure 1.15: After years of narrowing, the gap between recurrent and development expenditure widened
Source: World Bank, based on data from the National Treasury
0
5
10
1998
/99
1999
/00
2000
/01
2001
/02
2002
/03
2003
/04
2004
/05
2005
/06
2006
/07
2007
/08
2008
/09
2009
/10
2010
/11
2011
/12
2012
/13
15
20
25
Perc
ent o
f GDP
Recurrent expenditure Development expenditure

December 2013 | Edition No. 9 11
The State of Kenya’s Economy
More tax revenues streams have been identified to expand the base. The government targeted new revenue streams by imposing a 10 percent excise tax on mobile banking and other financial services and a 1.5 percent import levy on railway development. Both of these measures will significantly raise revenue and expand the tax base. These measures are a step in the right direction, as they rebalance tax composition away from taxation of sources of production toward taxation of consumption.
Public debt as a ratio of GDP increased, reducing the fiscal space Kenya had built up. The share of net public debt in GDP increased from 45.5
percent of GDP in 2011/12 to 47.1 percent in 2012/13. The increase was financed mainly from domestic resources, with domestic debt rising from 26.5 percent of GDP to 28.7 percent. External debt declined, falling from 23.9 of GDP to 23.0 percent (Figure 1.18). Kenya is set to tap into the international financial market by issuing a US$ 1.5 billion of Eurobonds in January 2014. Although the issuance will increase its external indebtedness, the overall debt sustainability outlook remains favorable: the 2013 joint Word Bank/IMF Debt Sustainability Analysis shows that Kenya’s debt distress rating remains low, thanks partly to the government’s policy of avoiding nonconcessional borrowing.
Table 1.2: Government expenditure rose between 2008/09 and 2012/13
Item 2008/09 2009/10 2010/11 20011/12 2012/13
Recurrent spending 19.5 20.8 21.3 20.0 22.1
Wages and salaries 6.9 7.0 7.1 6.9 7.5
Interest payments 2.3 2.6 2.7 2.8 3.3
Domestic Interest 2.1 2.3 2.5 2.5 3.0
Foreign Interest 0.3 0.3 0.3 0.3 0.3
Pensions 1.2 1.2 0.9 0.8 0.7
Operations and maintenance 9.0 10.0 10.5 9.4 10.5
Transitional transfer to counties n.a. n.a. n.a. n.a. 0.3
Development expenditure and net lending 7.2 8.7 7.9 9.3 8.2
Total expenditure and net lending 26.6 29.5 29.1 29.2 30.5
Source: National Treasury, 2013Note: n.a. Not applicable
Figure 1.16: Low execution rates reduced development expenditure
Source: World Bank, based on data from the National Treasury
0 50 100 150 200 250 300
General economic, commercialand labor affairs
Social protection, cultureand recreation
Environment protection and water
Agriculture andrural development
Health
Public administrationand international
National security
Energy, infrastructure and ICT
Governance, justice and order
Education
Total expenditure by sectors (billions of KSh)
June 2013 target June 2013 actual
100
89
87
86
85
76
74
74
69
63
0 20 40 60 80 100
National security
Governance, justice and order
Education
Health
General economic, commercialand labor affairs
Agriculture and rural development
Public administration andinternational relations
Social protection, cultureand recreation
Environment protection, waterand housing
Energy, infrastructure and ICT
Budget implementation rate as at the end of June 2013 (percent)

December 2013 | Edition No. 912
The State of Kenya’s Economy
The upward movement of the yield curve reflects recent uncertainty over fiscal policy. The downward movement in the yields on government securities between December 2011 and December 2012 reflected the improved economic environment after the 2011 economic crisis, when inflation reached a peak of more than 19 percent a year and the exchange rate was volatile. The peaceful election, smooth transfer of power, and enthusiasm among investors that followed pushed the yield curve further down in June 2013 (Figure 1.19). However, challenges in implementing the budget combined with the slow absorption by ministries and the standoff between the national and county governments have disappointed the
market. Worries about fiscal risks and the strength of the economy pushed the yield curve upward, especially at short maturities.
1.3 Monetary Policy Remained Supportive
The Central Bank’s Monetary Policy Committee eased monetary conditions to boost economic
activity. To spur credit to the private sector, the Central Bank lowered its policy rate 250 basis points to 8.5 percent in September 2013, down from 11.0 percent in December 2012. As a result, interest rates at both the short and long ends of the market declined in 2013 from the high rates of December 2012.
The Central Bank operationalized its monetary policy stance by allowing monetary aggregates to expand. Between July 2012 and July 2013, M0 increased 12.2 percent to 15.2 percent, and M1 increased 16.2 percent to 18.7 percent (Figure 1.20). However, because of a build-up in liquidity at the Central Bank, M2 increased just 13.8 percent in July 2013, to the same level as in 2012.
Kenya’s monetary policy stance has kept inflation in check and spurred economic activity. Inflationary pressure eased in 2013, with core inflation declining from an average rate of 9.5 percent in 2012 to 4.7 percent in 2013. Economic
Figure 1.17: Income tax revenues rose and VAT and excise duties fell between 1999 and 2012
Source: World Bank, based on data from the National Treasury
7.0
9.3 9.610.2
5.46.2 5.7
5.0
2.01.7 1.6 1.6
3.2 2.92.4 2.3
0
2
4
6
8
10
12
Perc
ent o
f GDP
Income tax VAT Import duty Excise duty
2010/111999/2000-2009/10
2011/12 2012/13
Figure 1.18: Total and domestic public debt as a percent of GDP increased, and external debt fell
Source: World Bank, based on data from the National Treasury
35.822.6 24.2 23.2 25.9 23.9 23.0
24.2
21.9 23.3 26.9 27.4 26.5 28.7
55.5
39.5 42.2 44.948.3 45.5 47.1
0
10
20
30
40
50
60
70
Perc
ent o
f GDP
Kenya's public debt
External debt Domestic debt
2007/081999/2000-2006/07
2008/09 2009/10 2010/11 2011/12 2012/13
Figure 1.19: The upward movement in the yield curve reflects market concerns about budget implementation
Source: Africa Alliance Kenya Investment Bank
0
5
10
15
20
25
3 months
6 months
1 year
2 years
5 years
10 years
15 years
20 years
25 years
30 years
Inte
rest
rate
(per
cent
)
TenorDecember 2011 December 2012 June 2013 October 2013

The State of Kenya’s Economy
December 2013 | Edition No. 9 13
activity also increased. Growth also increased in the first half of the year, to 4.7 percent, up from 4.3 percent during the same period in 2012.
Several factors dampened the transmission of the Central Bank’s monetary stance to short-term rates. Although the Central Bank rate was reduced by 250 basis points, interbank rates rose 168 basis points and 91-day Treasury bill rates rose 128 basis points between December 2012 and the end of September 2013 (Figure 1.21). As part of the transition to the new government, new procurement was suspended in the first quarter of 2013, and spending by the government slowed dramatically. Low spending meant that government deposits built up at both the Central Bank and commercial banks where government
holds deposits. As a result, liquidity was tight in the banking system, with some banks with excess cash and others short of liquidity. As a result, interbank rates soared. Government deposits at the Central Bank also increased, draining the banking system of liquidity. Short-term rates were nevertheless lower than the peak in 2012, with interbank rates down by 1,650 basis points and 91-day Treasury bill rates down by 1,098 basis points by the end of September of 2013.
Long-term rates declined in 2013, as lending rates corrected for the overshooting in 2012. The decline reflects not the transmission mechanism from short-term rates but the reduction in commercial banks’ perceptions of risks following the general election and the smooth transfer of power. Average weighted lending rates declined by 119 basis points and overdraft lending rates by 90 basis points between December 2012 and the end of September 2013. Had liquidity concerns not hindered the transmission from the Central Bank rate to short-term rates, lending rates might have fallen further.
Interest rate spreads remained high, despite improved economic conditions. Spreads (lending minus deposit rates) remained in double digits in 2013, despite an improved economic environment and lower political risk. Measured as the difference
Figure 1.20: To support economic activity, Kenya’s Central Bank increased the money supply
Source: World Bank, based on data from the Central Bank of Kenya
-5
0
Mar
-07
May
-07
Jul-0
7
Sep-
07
Nov
-07
Mar
-08
May
-08
Jul-0
8
Sep-
08
Nov
-08
Jan-
08
Mar
-09
May
-09
Jul-0
9
Sep-
09
Nov
-09
Jan-
09
Mar
-10
May
-10
Jul-1
0
Sep-
10
Nov
-10
Jan-
10
Mar
-11
May
-11
Jul-1
1
Sep-
11
Nov
-11
Jan-
11
Mar
-12
May
-12
Jul-1
2
Sep-
12
Nov
-12
Jan-
12
Mar
-13
May
-13
Jul-1
3
Jan-
13
5
10
15
20
25
30
35
40Ch
ange
in m
oney
supp
ly (p
erce
nt)
Reserve money M0 M1
Figure 1.21: Liquidity shortages in the banking system dampened the effect of monetary policy on interest rates
Source: World Bank, based on data from the Central Bank of Kenya
0
5
10
15
20
25
30
Jan-
07M
ay-0
7Se
p-07
Jan-
08M
ay-0
8Se
p-08
Jan-
09M
ay-0
9Se
p-09
Jan-
10M
ay-1
0Se
p-10
Jan-
11M
ay-1
1Se
p-11
Jan-
12M
ay-1
2Se
p-12
Jan-
13M
ay-1
3Se
p-13
Inte
rest
rate
(per
cent
)
Interbank 91-day Tbill Central bank rate

December 2013 | Edition No. 914
The State of Kenya’s Economy
between lending and deposit rates, the spread averaged about 11 percent (Figure 1.22). Measured as the difference between the lending rate and the 91-day Treasury bill rate, the spread averaged 9 percent. Spreads capture perceived risk by lenders of borrowers’ ability to pay; they can also capture inefficiency in the banking system (as examined in the special topic section of this update).
Private sector credit is flowing again to finance economic activity, but the growth level of credit is still below recent historical levels. There was a significant increase in credit uptake in 2013, following the easing of monetary policy (Figure 1.23). Credit to the private sector grew 17.4 percent in 2013, up from 7.7 percent growth in 2012. Credit growth in 2013 was still well below normal, however. Private credit as a share of GDP increased from 23.0 percent in 2003 to 37.6 percent in 2013. Since 2011, the growth in private sector credit has not kept pace with GDP growth (Figure 1.24). Credit activity remains subdued, as banks have become more reluctant to lend given weaker economic activity during the government transition. At the same time, demand for credit has waned in light of weaker business prospects. Efforts to stimulate the economy through accommodative monetary policy were thwarted by lack of liquidity in the banking system,
which increased short-term rates. Under such circumstances, monetary easing had only limited impact on growth.
Credit to households and to trade and business services rose significantly. In contrast, the increase in credit to the more productive sectors—agriculture and manufacturing—was minimal (Figure 1.25). Between the end of December 2012 and the end of September 2013, commercial banks lent KSh 169 billion to the private sector. The other main beneficiaries were: households (32 percent of lending), trade (19 percent), business services (18 percent), and real estate (12 percent). A number of sectors made net repayments to the banking system. They included
Figure 1.22: Lending rates declined marginally, but interest spreads remained wide
Source: World Bank, based on data from the Central Bank of Kenya
0
2
4
6
8
10
12
14
16
18
Jan-
07Ap
r-07
Jul-0
7O
ct-0
7Ja
n-08
Apr-
08Ju
l-08
Oct
-08
Jan-
09Ap
r-09
Jul-0
9O
ct-0
9Ja
n-10
Apr-
10Ju
l-10
Oct
-10
Jan-
11Ap
r-11
Jul-1
1O
ct-1
1Ja
n-12
Apr-
12Ju
l-12
Oct
-12
Jan-
13Ap
r-13
Jul-1
3
Inte
rest
rate
spre
ads (
perc
ent)
Spread (lending rate-deposit Rate) Spread (lending rate-91 Treasury bill rate)
0
5
10
15
20
25
30
Jan-
07M
ay-0
7Se
p-07
Jan-
08M
ay-0
8Se
p-08
Jan-
09M
ay-0
9Se
p-09
Jan-
10M
ay-1
0Se
p-10
Jan-
11M
ay-1
1Se
p-11
Jan-
12M
ay-1
2Se
p-12
Jan-
13M
ay-1
3Se
p-13
Perc
ent
Long-term rates
Deposit Savings Lending Overdraft
Figure 1.23: Banking sector credit expanded, but the level remains below historical levels
Source: World Bank, based on data from the Central Bank of Kenya
0
5
10
15
20
25
30
35
40
Perc
ent
Private sector credit growth M0 M1
Jan-
11
Mar
-11
May
-11
Jul-1
1
Jan-
11
Sep-
11
Jan-
12
Mar
-12
May
-12
Jul-1
2
Sep-
12
Nov
-12
Jan-
13
Mar
-13
May
-13
Jul-1
3
Sep-
13

December 2013 | Edition No. 9 15
The State of Kenya’s Economy
finance and insurance (KSh 4.9 billion), agriculture (KSh 1.4 billion), and mining and quarrying (KSh 0.8 billion). Significant increases in credit growth were seen in the business services (35.5 percent), household (32.0 percent), and trade (20.0 percent) subsectors. Agriculture as a whole made a net repayment to the banking system of KSh 1.4 billion, and manufacturing grew a paltry 6.8 percent. When these growth numbers are weighted by the percentage of total credit each sector receives, credit rose 4.6 percent to private households, 3.3 percent to trade, and 2.5 percent to business services.
The banking sector remained healthy and experienced significant growth in 2013. Gross loans increased by 14 percent between December
2012 and September 2013, reaching KSh 1.52 trillion. Most of the KSh 192 billion increase went to households (32 percent), trade (25 percent), real estate (16 percent), and manufacturing (9 percent) (Figure 1.26). The banking sector’s aggregate balance sheet size expanded by 12.4 percent, from KSh 2.33 trillion in December 2012 to KSh 2.63 trillion by the end of September 2013. Total assets included loans and advances (56 percent of total assets), government securities (22 percent), and placements (6 percent).
Despite a difficult economic environment, the quality of assets in aggregate terms did not deteriorate in real terms. Despite challenging economic times, the quality of bank assets remained resilient. The ratio of nonperforming
Figure 1.24: Credit to the private sector has not grown as rapidly as GDP since 2011
Source: World Bank, based on data from the Central Bank of Kenya and the Kenya National Bureau of Statistics
26.5
23.3
34.838.1
37.6
0
5
10
15
20
25
30
35
40
45
0
0.5
1.0
1.5
2.0
2.5
3.0
3.5
4.0
4.520
00
2001
2002
2003
2004
2005
2006
2007
2008
2009
2010
2011
2012
2013
Jan-
11Fe
b-11
Mar
-11
Apr-
11M
ay-1
1Ju
n-11
Jul-1
1Au
g-11
Sep-
11O
ct-1
1N
ov-1
1De
c-11
Jan-
12Fe
b-12
Mar
-12
Apr-
12M
ay-1
2Ju
n-12
Jul-1
2Au
g-12
Sep-
12
Jan-
13Fe
b-13
Mar
-13
Apr-
13M
ay-1
3Ju
n-13
Jul-1
3Au
g-13
Sep-
13
Oct
-12
Nov
-12
Dec-
12
Perc
ent
KSh
billi
on
Credit GDP Credit to GDP ratio
0
5
10
15
20
25
30
35
40
Cred
it to
priv
ate
sect
or g
row
th (p
erce
nt)
Figure 1.25: Credit flowed to private households, trade, and business services—but not to productive sectors
Source: World Bank, based on data from the Central Bank of Kenya
20.318.818.3
17.415.014.7
13.513.1
6.8
0.85.9
3.2
8.07.7
11.223.7
25.9
7.10.7
20.3
-20 -10 0 10 20 30 40
Business servicesPrivate households
TradeMining & quarryingConsumer durablesTotal private Sector
Other activitiesReal estate
Building & constructionTransport & communication
ManufacturingAgriculture
Finance and insurance
Percent
Sectoral growth of credit to the private sector (unweighted)
2012 2013
4.63.3
2.51.9
1.61.2
0.90.8
0.7
0.3
0.80.5
0.12.6
1.10.5
0.9
1.1
0.00.5
-1 0 1 2 3 4 5
Private householdsTrade
Business servicesReal estate
Other activitiesConsumer durables
ManufacturingTransport & communication
Building & constructionMining & quarrying
AgricultureFinance and insurance
Percent
Sectoral growth of credit to the private sector (weighted)
2012 2013

December 2013 | Edition No. 916
The State of Kenya’s Economy
to gross loans improved marginally, from 5.3 percent in December 2012 to 5.2 percent in 2013. However, 7 out of 10 subsectors experienced deterioration in asset quality (Figure 1.27). The exceptions were finance and insurance, where the decline was 19.6 percent; mining and quarrying, where the decline was 0.8; and households, where the decline was 0.7 percent. In nominal terms, the volume of nonperforming loans rose 13 percent, from KSh 72 billion to KSh 80 billion. The increase was experienced in all sectors, with more than half of the deterioration experienced by households, trade, and real estate.
The equities market is booming, with the Nairobi Stock Exchange (NSE) market index rising 20 percent between December 2012 and the end
of October 2013, increasing from 4,133 to 4,970 (Figure 1.28). Market capitalization increased 41 percent in the same period, rising from KSh 1.3 trillion to KSh 1.8 trillion. The NSE outperformed the Dow Jones Industrial average, which rose 18.6 percent over the same period. A number of factors explain the boom in the equities market. First, the political risk and uncertainties associated with the elections declined as the elections were peaceful. Second, the equities market fell significantly from its peak value of 5,774 in January 2007. The steep decline was associated with concerns about governance at the NSE that have since been resolved. The regulator (the Capital Markets Authority) implemented deep reforms to streamline operations. Returns on equities increased significantly, given the bullish forecast.
Figure 1.26: Households, trade, and real estate received the lion’s share of loans from the banking system
Source: World Bank, based on data from the Central Bank of Kenya
14 3251 52 65 69
99
180 177
264
327
15 3754 62 67 77
105
197 208
312
389
0
50
100
150
200
250
300
350
400
450
Billi
on K
Sh
December 2012 September 2013
Mining andquarrying
Tourism, restaurantand hotels
Financialservices
Energy and water
Agriculture Buildingand
construction
Transport and
communication
Manufacturing Realestate
Trade Households
Figure 1.27: Asset quality deteriorated in most sectors
Source: World Bank, based on data from the Central Bank of Kenya
0
5
10
15
20
25
Billi
on K
Sh
Perc
ent
Non-performing loans
December 2012 September 2013
0
1
2
3
4
5
6
7
8Ratio of non-performing loans to gross loans
December 2012 September 2013
Mini
ng an
dqu
arry
ing
Tour
ism,
resta
uran
tan
d hot
els
Finan
cial
serv
ices
Ener
gyan
d wat
er
Agric
ultur
e
Build
ing and
constru
ction
Tran
spor
tan
d com
m.
Man
ufac
turin
g
Real
esta
te
Trad
e
Hous
ehold
s
Mini
ng an
dqu
arry
ing
Tour
ism,
resta
uran
tan
d hot
els
Finan
cial
serv
ices
Ener
gyan
d wat
er
Agric
ultur
e
Build
ing and
constru
ction
Tran
spor
tan
d com
m.
Man
ufac
turin
g
Real
esta
te
Trad
e
Hous
ehold
s

December 2013 | Edition No. 9 17
The State of Kenya’s Economy
Foreign participation in the Kenyan stock market remains as high as 50 percent of equity turnover. The market’s performance and the significant increase in market capitalization signal investors’ confidence in the real economy and could herald better economic performance. It also signal the confidence of nonresidents in Kenya’s equities market. However, the foreign dominance also poses a significant risk to the NSE as nonresidents can quickly offload their assets if U.S. interest rates rise or a version to equities of emerging markets increases.
1.4 The External Position Strengthened
Kenya’s current account balance improved considerably in 2013. Imports fell from 41.8
percent of GDP in December 2012 to 36.5 percent in September 2013. The decline is attributed to sluggish private sector credit growth; lower capital spending, as the government was slow in paying contractors for various capital projects; and lower demand for oil, as the country had adequate rainfall to generate power. As a result, external vulnerability declined significantly. The cumulative 12-month current account deficit increased from US$ 4.27 billion (10.7 percent of GDP) in September 2012 and US$ 4.25 billion (10.6 percent of GDP) in December 2012 but fell by 3.2 percent of GDP to US$ 3.35 billion (7.5 percent of GDP) in September 2013. The decline,
in both nominal terms and as a share of GDP, is a great relief for Kenya’s economy, which had been facing considerable pressure from growing external imbalances.
Threats to Kenya’s external vulnerability still exist, however. The inherent structural weaknesses that drove the current account deficit to unsustainable levels have not been dealt with. The external balance fell to sustainable levels in 2013, but the improvement seems temporary. A healthier improvement would have been caused by an increase in exports or a reduction in nonessential imports. However, despite poor performance in exports in the last five years, the ratio of exports to GDP declined, dropping 2.1 percent in 2013 from 2012. Between 2005 and 2013, exports grew at an average annual rate of 10.1 percent in nominal terms, while imports grew 16.1 percent a year. The importance of exports growth becomes particularly salient in the context of Kenya’s large current account deficit and significant external vulnerability. Weather-induced shocks, a pick-up in government capital spending, and an increase in private sector credit pose risks for further deterioration of the current account.
The balance of payments remained in surplus in 2013. The balance of payments declined in nominal terms by almost 50 percent, falling from US$ 1.2 billion in December 2012 to US$ 0.6 billion in October 2013. As a percentage of GDP, the surplus fell from 3.2 percent in 2012 to 1.4 percent in 2013 (Figure 1.29). The softening of the balance of payments was attributed to a decline in project loans (including defense loans), which decreased from 3.6 percent in 2012 to 2.1 percent in 2013, and net flows to commercial banks in the financial account, which decreased from 2.3 percent to 1.1 percent. Short-term flows remained the main source of current account financing, contributing about 63 percent, excluding net errors and omissions (66 percent when they are included).
Figure 1.28: The Nairobi Stock Exchange outperformed the Dow Jones Industrial average
Source: World Bank, based on data from the Nairobi Stock Exchange
0
2,000
4,000
6,000
8,000
10,000
12,000
14,000
16,000
18,000
0
1,000
2,000
3,000
4,000
5,000
6,000
7,000Ja
n-07
Apr-
07Ju
l-07
Oct
-07
Jan-
08Ap
r-08
Jul-0
8O
ct-0
8Ja
n-09
Apr-
09Ju
l-09
Oct
-09
Jan-
10Ap
r-10
Jul-1
0O
ct-1
0Ja
n-11
Apr-
11Ju
l-11
Oct
-11
Jan-
12Ap
r-12
Jul-1
2O
ct-1
2Ja
n-13
Apr-
13Ju
l-13
Oct
-13
Dow
Jone
s
NSE
inde
x (1
966
= 10
0)
NSE 20 share index, End-month Dow Jones industrial average
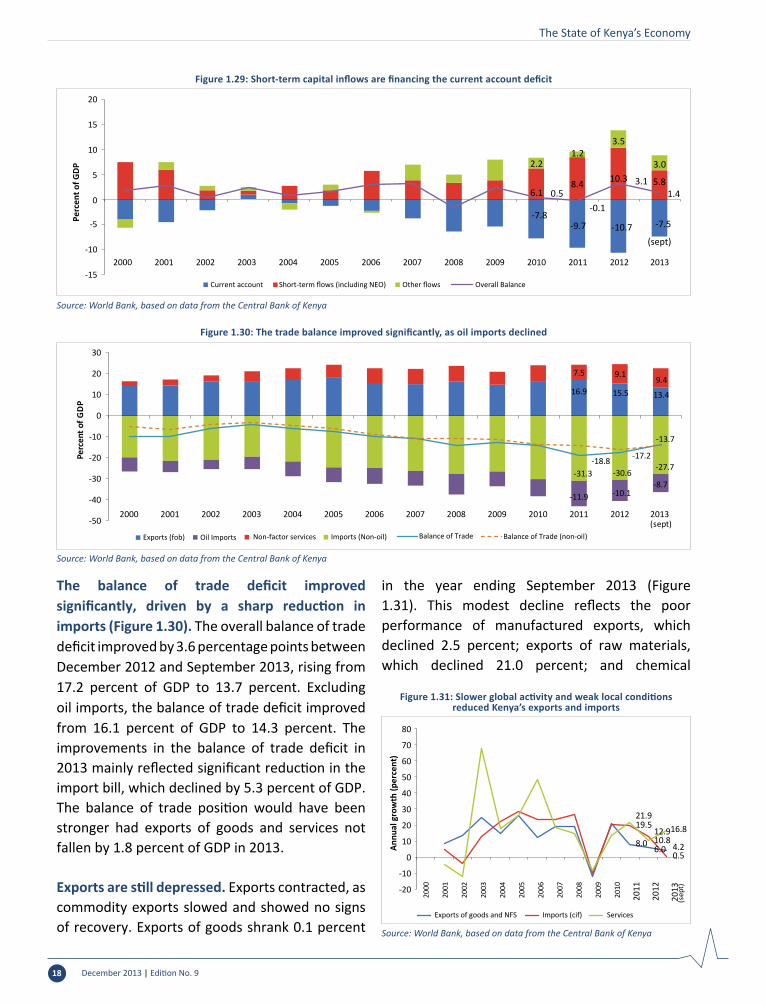
The State of Kenya’s Economy
December 2013 | Edition No. 918
The balance of trade deficit improved significantly, driven by a sharp reduction in imports (Figure 1.30). The overall balance of trade deficit improved by 3.6 percentage points between December 2012 and September 2013, rising from 17.2 percent of GDP to 13.7 percent. Excluding oil imports, the balance of trade deficit improved from 16.1 percent of GDP to 14.3 percent. The improvements in the balance of trade deficit in 2013 mainly reflected significant reduction in the import bill, which declined by 5.3 percent of GDP. The balance of trade position would have been stronger had exports of goods and services not fallen by 1.8 percent of GDP in 2013.
Exports are still depressed. Exports contracted, as commodity exports slowed and showed no signs of recovery. Exports of goods shrank 0.1 percent
in the year ending September 2013 (Figure 1.31). This modest decline reflects the poor performance of manufactured exports, which declined 2.5 percent; exports of raw materials, which declined 21.0 percent; and chemical
Figure 1.29: Short-term capital inflows are financing the current account deficit
Source: World Bank, based on data from the Central Bank of Kenya
-7.8-9.7 -10.7 -7.5
6.18.4 10.3 5.8
2.21.2
3.5
3.0
0.5-0.1
3.11.4
-15
-10
-5
0
5
10
15
20
2000 2001 2002 2003 2004 2005 2006 2007 2008 2009 2010 2011 2012 2013
(sept)
Perc
ent o
f GDP
Current account Short-term flows (including NEO) Other flows Overall Balance
Figure 1.30: The trade balance improved significantly, as oil imports declined
Source: World Bank, based on data from the Central Bank of Kenya
16.9 15.5 13.4
7.5 9.19.4
-31.3 -30.6-27.7
-11.9 -10.1-8.7
-18.8 -17.2
-13.7
-50
-40
-30
-20
-10
0
10
20
30
2000 2001 2002 2003 2004 2005 2006 2007 2008 2009 2010 2011 2012 2013 (sept)
Perc
ent o
f GD
P
Exports (fob) Non-factor services Imports (Non-oil)Oil Imports Balance of Trade Balance of Trade (non-oil)
Figure 1.31: Slower global activity and weak local conditions reduced Kenya’s exports and imports
Source: World Bank, based on data from the Central Bank of Kenya
8.0 6.0 4.2
19.512.9
0.5
21.9
10.816.8
-20
-10
0
10
20
30
40
50
60
70
80
2000
2001
2002
2003
2004
2005
2006
2007
2008
2009
2010
2011
2012
2013
(sep
t)
Annu
al g
row
th (p
erce
nt)
Exports of goods and NFS Imports (cif) Services

December 2013 | Edition No. 9 19
The State of Kenya’s Economy
exports, which declined 14.8 percent. The only good news coming from the export sector was tea exports, the value of which increased 11.2 percent as a result of favorable weather conditions in the highlands. Tea volume increased 42 percent, but its price declined 7.6 percent. Horticulture exports increased 7.2 percent, the largest increase since 2006. As a share of GDP, Kenya’s exports declined from 23.2 percent in September 2012 and 24.6 percent in December 2012 to 22.8 percent in September 2013.
The structure of exports remained unchanged in 2013. Kenya’s main exports are tea (21 percent of total exports), manufacturing (12 percent), and horticulture (12 percent). Tea is exported mainly to Egypt and Pakistan, horticulture products are exported mainly to Western Europe, and manufacturing exports go largely to the Common Market for Eastern and Southern Africa (COMESA).
Exports are critical to reinvigorating Kenya’s growth prospects, but policy makers have not explicitly prioritized them. Increasing exports, particularly in the manufacturing sector, is crucial for low-skilled job creation of the magnitude needed to reduce high unemployment, particularly among young people, whose unemployment poses a threat to social stability. The Second Medium-Term Plan (2013-2017) does not even
identify exports as a key driver of faster growth and sets no targets for export diversification or growth.
Import growth slowed significantly in 2013, as the oil import bill declined. Year-on-year imports grew 0.5 percent in September 2013, down from 12.3 percent in 2012. However, there was a decline in imports of about 2 percent between December 2012 and September 2013, compared with 12.3 percent growth in the same period in 2012 (Table 1.3). Oil imports fell 4.9 percent, from US$ 4.1 billion in 2012 to US$ 3.9 billion in 2013. The decline reflects a slight reduction in international oil prices and an increase in the production of hydropower in 2013, which reduced demand for oil to generate thermal power. Imports of manufactured goods rose 10.4 percent, machinery and transport rose 7.6 percent, and chemicals rose 6.1 percent for the 12 months ending in September 2013.
Imports as a share of GDP declined significantly, falling from a peak of 43.2 percent of GDP in 2011 to 40.7 percent in 2012 and 36.5 percent in September 2013. The drop reflects 3 percent declines in imports of both fuel and lubricants (primarily as a result of the decline in international oil prices) and industrial nonfood supplies. The shares of machinery, capital equipment, and
Table 1.3: Shares of imports, by broad economic category, 2009-2013
CategoryAs percent of total imports As percent of GDP
2010 2011 2012 2013 2010 2011 2012 2013 (Aug)
Food and beverages 8.7 6.9 8.7 7.3 3.2 3.8 3.6 2.6
Industrial supplies (non-food) 30.6 32.0 30.1 29.9 13.3 15.2 13.4 10.8
Fuel and lubricants 23.2 24.4 26.3 23.4 9.3 13.2 11.1 8.4
Machinery and other capital equipment 17.1 17.8 16.7 18.4 7.9 7.8 8.3 6.6
Transport equipment 13.0 11.1 10.6 12.9 5.8 4.9 5.4 4.6
Consumer goods not elsewhere specified 7.2 7.5 6.9 6.8 3.2 3.5 3.2 2.5
Goods not elsewhere specified 0.2 0.4 0.7 1.3 0.1 0.4 0.3 0.5
Source: Kenya National Bureau of Statistics 2013Note: Data are for 12 months ending in July of each year

The State of Kenya’s Economy
December 2013 | Edition No. 920
transport equipment continue to increase (see Table 1.3). Together with industrial supplies (mainly intermediate goods), imports of these goods accounted for more than 60 percent of Kenya’s total imports (including oil increases their share to more than 80 percent). This large share signals the importance of imports to Kenya’s economic activity and the narrow policy space policy makers have to deal with external balance problem.
Remittances were strong, with inflows of US$ 1.23 billion (2.7 percent of GDP) for the 12 months ending August 2013, a 7.7 percent increase in U.S. dollar terms over the same period in 2012 (Figure 1.32). In the first eight months of 2013, US$ 844 million in remittances flowed into Kenya, a 10.3 percentage increase over the same period in 2012. The boom in remittances reflects both improved data collection by the Central Bank of Kenya and improved economic activity in North America (the source of 50 percent of remittances) and Europe (the source of 27 percent).
FDI flows improved marginally but remain low. Kenya is still unable to attract significant FDI to finance economic activity and power its growth, with average inflows remaining below 1 percent of GDP. FDI increased from US$ 177 million
(0.6 percent of GDP) in December 2012 to US$ 249 million (0.6 percent of GDP) in September 2013. In the first three quarters of 2013, Kenya managed to attract just US$186 million. The inability to attract FDI is closely associated with the regulatory environment, which is hostile to investment, as summarized by the ease of doing business indicators outlined in Table 1.1.
Net capital flows to Kenya have grown very rapidly. With the growth pick-up after 2003 and improved economic prospects, Kenya has been a major beneficiary of the surge in private capital flows. Net capital flows more than doubled, from an average of 4.3 percent of GDP in 2000–08 to 9.7 percent in 2009 (Figure 1.33).
Figure 1.32: Remittances continued to rise
Source: World Bank, based on data from the Central Bank of Kenya
0.0
0.5
1.0
1.5
2.0
2.5
3.0
3.5
0
200
400
600
800
1,000
1,200
1,400
Jan-
05M
ay-0
5Se
p-05
Jan-
06M
ay-0
6Se
p-06
Jan-
07M
ay-0
7Se
p-07
Jan-
08M
ay-0
8Se
p-08
Jan-
09M
ay-0
9Se
p-09
Jan-
10M
ay-1
0Se
p-10
Jan-
11M
ay-1
1Se
p-11
Jan-
12M
ay-1
2Se
p-12
Jan-
13M
ay-1
3
Perc
ent o
f GD
P
Mill
ion
US$
12 month cumulative Percent of GDP
0
20
40
60
80
100
120
Mill
ion
US$
Monthly 12-month average
Jan-
04Ju
n-04
Nov
-04
Apr-
05Se
p-05
Feb-
06Ju
l-06
Dec-
06M
ay-0
7O
ct-0
7M
ar-0
8Au
g-08
Jan-
09Ju
n-09
Nov
-09
Apr-
10Se
p-10
Feb-
11Ju
l-11
Dec-
11M
ay-1
2O
ct-1
2M
ar-1
3Au
g-13
Figure 1.33: Kenya is attracting more short-term than long-term flows
Source: World Bank, based on data from the Central Bank of Kenya
3,053
5,278
3,768
1,678 2,438
2,480
1,213 923
140
(1,000)
0
1,000
2,000
3,000
4,000
5,000
6,000
Mill
ions
US$
Capital accountFinancial Account
Official, medium & long-termPrivate, medium & long-term
Short Term (incl. portfolio flows)Net Errors and Omissions (NEO)
2000
2001
2002
2003
2004
2005
2006
2007
2008
2009
2010
2011
2012
2013
(Sep
)
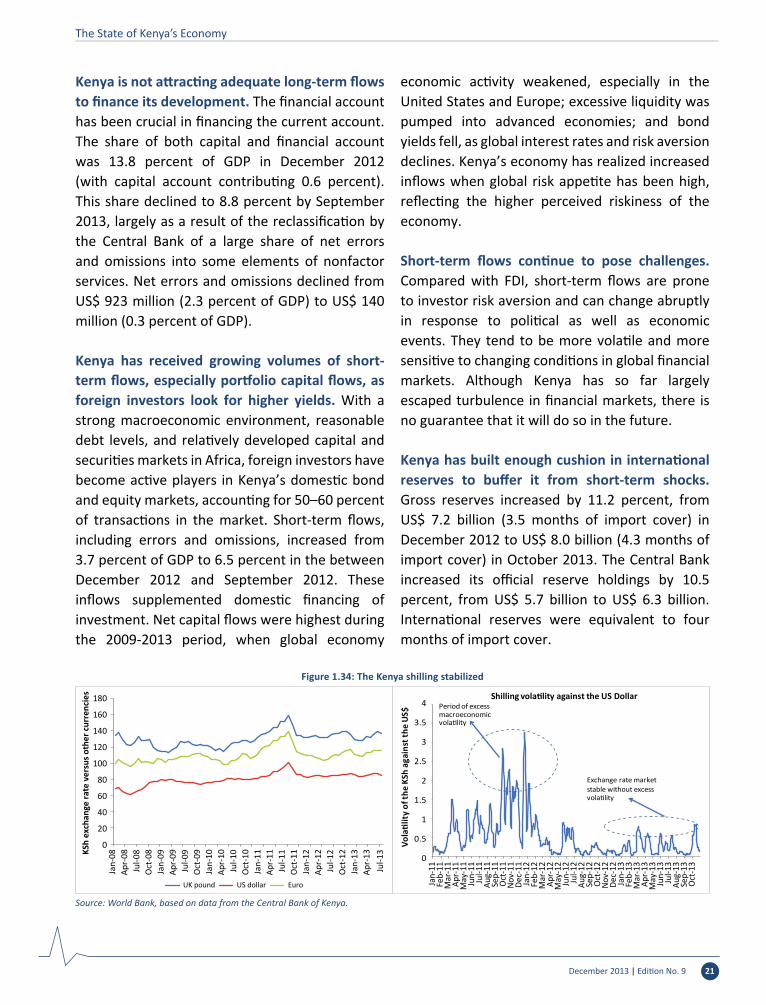
The State of Kenya’s Economy
December 2013 | Edition No. 9 21
Kenya is not attracting adequate long-term flows to finance its development. The financial account has been crucial in financing the current account. The share of both capital and financial account was 13.8 percent of GDP in December 2012 (with capital account contributing 0.6 percent). This share declined to 8.8 percent by September 2013, largely as a result of the reclassification by the Central Bank of a large share of net errors and omissions into some elements of nonfactor services. Net errors and omissions declined from US$ 923 million (2.3 percent of GDP) to US$ 140 million (0.3 percent of GDP).
Kenya has received growing volumes of short-term flows, especially portfolio capital flows, as foreign investors look for higher yields. With a strong macroeconomic environment, reasonable debt levels, and relatively developed capital and securities markets in Africa, foreign investors have become active players in Kenya’s domestic bond and equity markets, accounting for 50–60 percent of transactions in the market. Short-term flows, including errors and omissions, increased from 3.7 percent of GDP to 6.5 percent in the between December 2012 and September 2012. These inflows supplemented domestic financing of investment. Net capital flows were highest during the 2009-2013 period, when global economy
economic activity weakened, especially in the United States and Europe; excessive liquidity was pumped into advanced economies; and bond yields fell, as global interest rates and risk aversion declines. Kenya’s economy has realized increased inflows when global risk appetite has been high, reflecting the higher perceived riskiness of the economy.
Short-term flows continue to pose challenges. Compared with FDI, short-term flows are prone to investor risk aversion and can change abruptly in response to political as well as economic events. They tend to be more volatile and more sensitive to changing conditions in global financial markets. Although Kenya has so far largely escaped turbulence in financial markets, there is no guarantee that it will do so in the future.
Kenya has built enough cushion in international reserves to buffer it from short-term shocks. Gross reserves increased by 11.2 percent, from US$ 7.2 billion (3.5 months of import cover) in December 2012 to US$ 8.0 billion (4.3 months of import cover) in October 2013. The Central Bank increased its official reserve holdings by 10.5 percent, from US$ 5.7 billion to US$ 6.3 billion. International reserves were equivalent to four months of import cover.
Figure 1.34: The Kenya shilling stabilized
Source: World Bank, based on data from the Central Bank of Kenya.
0
20
40
60
80
100
120
140
160
180
KSh
exch
ange
rate
ver
sus o
ther
cur
renc
ies
UK pound US dollar Euro
Jan-
08Ap
r-08
Jul-0
8O
ct-0
8Ja
n-09
Apr-
09Ju
l-09
Oct
-09
Jan-
10Ap
r-10
Jul-1
0O
ct-1
0Ja
n-11
Apr-
11Ju
l-11
Oct
-11
Jan-
12Ap
r-12
Jul-1
2O
ct-1
2Ja
n-13
Apr-
13Ju
l-13
0
0.5
Jan-
12Fe
b-12
Mar
-12
Apr-
12M
ay-1
2Ju
n-12
Jul-1
2Au
g-12
Sep-
12O
ct-1
2No
v-12
Dec-
12
Jan-
11Fe
b-11
Mar
-11
Apr-
11M
ay-1
1Ju
n-11
Jul-1
1Au
g-11
Sep-
11O
ct-1
1No
v-11
Dec-
11
Jan-
13Fe
b-13
Mar
-13
Apr-
13M
ay-1
3Ju
n-13
Jul-1
3Au
g-13
Sep-
13O
ct-1
3
1
1.5
2
2.5
3
3.5
4
Volatil
ity o
f the
KSh
aga
inst
the
US$
Shilling volatility against the US Dollar Period of excess macroeconomic volatility
volatility
Exchange rate market stable without excess

The State of Kenya’s Economy
December 2013 | Edition No. 922
Nominal exchange rates remained stable as inflation declined. The exchange rate remained stable in 2013, despite the political uncertainties of the general election. The shilling traded at an average rate of US$ 86.1, € 113.0, and £133.7 between January and October 2013 (Figure 1.34). These rates represented depreciations of 2.2 percent with respect to the dollar, 5.2 percent with respect to the euro, and 0.3 percent with respect to the pound. In terms of volatility, the shilling remained relatively stable, fluctuating by less than 1 percent in 2013.
Improved economic activity in the European Union and the United States strengthened their currencies with respect to the shilling. Kenya’s trade-weighted exchange rate depreciated in both nominal and real terms. The nominal effective exchange rate depreciated by 1.2 percent between December 2012 and July 2013, driven mainly by a strengthening euro following a mild recovery in Europe and stronger growth performance in the United States. As domestic inflationary pressures remained subdued, these nominal changes
translated into a real depreciation of 3.9 percent (Figure 1.35).
There is no evidence of persistent over- or undervaluation of the shilling. Because of the free floating exchange rate policy, the shilling always oscillates around its equilibrium level. It has gone through periods of overvaluation and undervaluation, however, associated with shocks (Box 1.2).
Figure 1.35: Kenya’s trade-weighted exchange rates are starting to depreciate as the global economy recovers
Source: World Bank, based on data from the Central Bank of Kenya
60
70
80
90
100
110
120
130
140
150
Jan-
00Ju
l-00
Jan-
01Ju
l-01
Jan-
02Ju
l-02
Jan-
03Ju
l-03
Jan-
04Ju
l-04
Jan-
05Ju
l-05
Jan-
06Ju
l-06
Jan-
07Ju
l-07
Jan-
08Ju
l-08
Jan-
09Ju
l-09
Jan-
10Ju
l-10
Jan-
11Ju
l-11
Jan-
12Ju
l-12
Jan-
13Ju
l-13
Janu
ary
2003
= 1
00
Nominal effective exchange rate Real effective exchange rate
Kenya’s real exchange rate appreciated by more than 30 percent since 2003. It has been assumed that this appreciation hurt exports, by making Kenya’s goods less competitive abroad. Real appreciation was accompanied by higher current account deficits, raising questions as to whether the shilling was overvalued in real terms.
Sichei and Randa (2013) conducted an in-depth study of this policy issue. They developed a model of the fundamental real effective exchange rate (REER) and estimated Kenya’s long-run REER equation to obtain a long-run relationship between it and its fundamentals (Figure B1.2.1). They simulated various scenarios of under- and overvaluation and estimated their potential effects on Kenya’s growth rate. Their findings suggest that there is an optimal level of REER misalignment.
The study finds that the long-run real exchange rate is driven by investment, net foreign assets, the terms of trade, productivity, openness, and the stock of FDI. Using the estimation results in Table B.1.2.1, the authors computed misalignment by feeding the
Box 1.2: Is Kenya’s real exchange rate over- or undervalued?
Figure B1.2.1: The actual and equilibrium real effective exchange rate in Kenya fell between 1998 and 2012
60
Actual REER Equilibrium REER
70
80
90
100
110
Inde
x (Ja
n. 2
003=
100)
Period
120
1998:1 2000:1 2002:1 2004:1 2006:1 2008:1 2010:1 2012:1
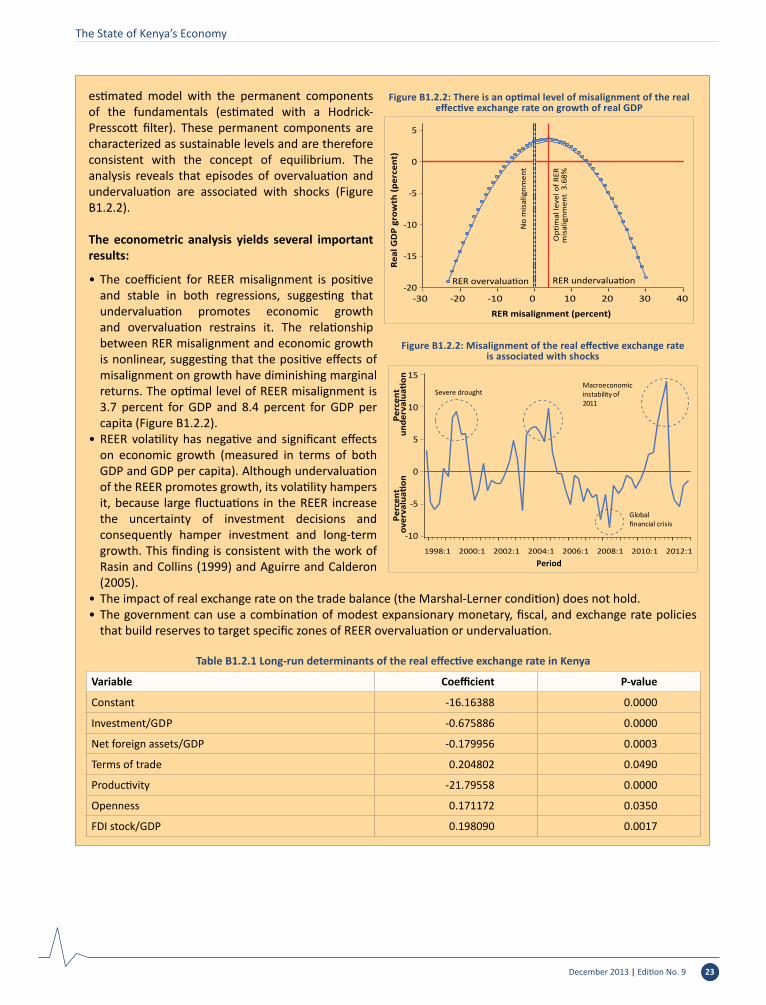
estimated model with the permanent components of the fundamentals (estimated with a Hodrick-Presscott filter). These permanent components are characterized as sustainable levels and are therefore consistent with the concept of equilibrium. The analysis reveals that episodes of overvaluation and undervaluation are associated with shocks (Figure B1.2.2).
The econometric analysis yields several important results:
• The coefficient for REER misalignment is positive and stable in both regressions, suggesting that undervaluation promotes economic growth and overvaluation restrains it. The relationship between RER misalignment and economic growth is nonlinear, suggesting that the positive effects of misalignment on growth have diminishing marginal returns. The optimal level of REER misalignment is 3.7 percent for GDP and 8.4 percent for GDP per capita (Figure B1.2.2).
• REER volatility has negative and significant effects on economic growth (measured in terms of both GDP and GDP per capita). Although undervaluation of the REER promotes growth, its volatility hampers it, because large fluctuations in the REER increase the uncertainty of investment decisions and consequently hamper investment and long-term growth. This finding is consistent with the work of Rasin and Collins (1999) and Aguirre and Calderon (2005).
• The impact of real exchange rate on the trade balance (the Marshal-Lerner condition) does not hold.• The government can use a combination of modest expansionary monetary, fiscal, and exchange rate policies
that build reserves to target specific zones of REER overvaluation or undervaluation.
The State of Kenya’s Economy
December 2013 | Edition No. 9 23
Table B1.2.1 Long-run determinants of the real effective exchange rate in Kenya
Variable Coefficient P-value
Constant -16.16388 0.0000
Investment/GDP -0.675886 0.0000
Net foreign assets/GDP -0.179956 0.0003
Terms of trade 0.204802 0.0490
Productivity -21.79558 0.0000
Openness 0.171172 0.0350
FDI stock/GDP 0.198090 0.0017
Figure B1.2.2: Misalignment of the real effective exchange rate is associated with shocks
-10
-5
0
5
10Pe
rcen
t u
nder
valu
ation
Perc
ent
over
valu
ation
15
1998:1 2000:1 2002:1 2004:1 2006:1 2008:1 2010:1 2012:1
Global
Severe drought
financial crisis
Macroeconomic instability of 2011
Period
Figure B1.2.2: There is an optimal level of misalignment of the real effective exchange rate on growth of real GDP
-20
-15
-10
Real
GD
P gr
owth
(per
cent
)
RER misalignment (percent)
RER overvaluation RER undervaluation
No
mis
alig
nmen
t
Opti
mal
leve
l of R
ER m
isal
ignm
ent
3.68
%
-5
0
5
-30 -20 -10 0 10 20 30 40

The State of Kenya’s Economy
December 2013 | Edition No. 924
2.1 Growth Prospects Are Solid
The World Bank estimates that Kenya’s economy will grow 5.0 percent in 2013 and
5.1 percent in 2014. Performance this year and next will be the strongest since 2010, when the economy grew 5.8 percent. It will be well below the 7.0 percent growth achieved in 2007. However, these projections are lower than the projections made in June, because they reflect two important domestic factors that slowed economic activity. First, transmission of the accommodative monetary policy stance into the real sector has been weak: real lending rates remain high, hindering growth in private sector credit and failing to inspire confidence among investors. Credit activity remained subdued, as weaker economic activity during the government transition increased banks’ reluctance to lend and reduced demand for credit. Second, the new government faced difficulty implementing the budget during the transition period. Given Kenya’s history of low growth following general elections, annual growth of 5.0 percent is commendable.
Challenges in implementing the government budget constrained economic activity. The economy started on a strong footing in the first quarter of the year, as a result of the momentum gathered in the fourth quarter of 2012, when
output rose 5.2 percent. It lost steam in the second quarter, however, growing just 4.3 percent. The slowdown reflected the strong and high correlation between government spending on the one hand and private spending and economic activity on the other. Low absorption of development spending curtailed economic activity, as actual development spending fell 29 percent short of its target of KSh 420.4 billion, a shortfall of KSh 121.4 billion. Development spending declined 0.6 percent in nominal terms (7.6 percent in real terms), falling from KSh 301 billion in 2011/12 to KSh 299 billion in 2012/13.
Aggregate demand will increase in 2014 (Table 2.1). The government will soon overcome the transitional challenges of implementing the budget, putting its spending program back on track. In addition, credit to the private sector will pick up, as commercial bank loans that are in the pipeline are processed and reach businesses.
The baseline scenario for 2014 remains the same as in the June Kenya Economic Update. The increase in credit flows to the economy will support an investment-led recovery. The government is assumed to maintain a prudent fiscal stance, consolidating fiscal policy to reduce public debt, which increased significantly in
2. Growth Outlook: 2014 and Beyond
With ample slack remaining in the economy as inflation remains anchored at a lower level, Kenya is well positioned for stronger growth in 2014. Assuming that it overcomes the transitional
issues that hindered spending in 2013 and continues to implement structural reforms that make it easier to do business, it should growth at 5.1 percent in 2014 and 6.0 percent over the medium term. Two significant downside risks threaten this outlook. On the external front, the tapering of the liquidity injection by the U.S. Federal Reserve will cause volatility in Kenya’s exchange rate and increase domestic interest rates, as Kenya is a major recipient of short-term flows, which finance the current account. Domestically, the fiscal risk emanating from the burgeoning wage bill; inadequate implementation of the devolution process, and poor absorption of budget funds could dampen GDP growth.

2013. Capital spending is expected to increase in line with the ambitious development program outlined in the Second Medium-Term Plan (2013-2017). Exports are assumed to grow in line with the strengthening of the economies of Kenya’s trading partners. Imports depend on the strength of domestic demand, particularly for capital goods. Performance of the agricultural sector is expected to be strong. Based on these assumptions, the World Bank forecasts accelerated growth in the first half of 2014.
In the high-growth case, GDP is projected to increase 5.9 percent in 2014 (Figure 2.1). Under this scenario, investment is much stronger than in the baseline, thanks to stronger domestic investment (both private and public) and greater than expected inflows of FDI. Much of the increased investment is projected to be used to purchase imported equipment, leading to strong growth in imports. Reforms at the Port of Mombasa, creation of a single customs window, expansion of the Huduma centers, enhanced service delivery, reductions in the cost of doing business, and operationalization of the Treasury Single Account are expected to improve the business environment. The high-growth scenario also assumes that macroeconomic stability will be sustained and agriculture harvests will be favorable, supporting household incomes.
In the low-growth scenario, GDP grows at 4.2 percent. This scenario assumes that capacity constraints in implementing the budget continue and growing pains in implementing decentralization prevent local governments from executing public spending. It also assumes tightening of liquidity in global markets, leading to volatility in the exchange rate and higher interest rates, which hinder economic activity. The high correlation between public and private spending as well as the weak response of private sector credit to an accommodative monetary policy stance hold back private investment.
The Central Bank’s monetary policy stance boosted economic activity in 2013 and counteracted the deleterious effects of weak
The State of Kenya’s Economy
December 2013 | Edition No. 9 25
Table 2.1: GDP is projected to grow by a little more than 5 percent through 2016 (annual percentage increase)
Item 2008 2009 2010 2011 2012 2013 2014 2015 2016
GDP 1.5 2.7 5.8 4.4 4.6 5.0 5.1 5.2 5.3
Private consumption -1.3 5.0 7.2 3.0 5.5 4.0 3.1 3.1 3.1
Government consumption 2.5 3.8 6.3 5.2 9.3 4.6 5.5 4.0 4.0
Gross fixed investment 9.5 2.8 7.7 12.6 11.5 15.6 9.7 11.0 11.7
Gross domestic expenditure 1.0 5.0 6.7 5.8 6.8 6.5 4.9 5.1 5.3
Exports of goods and nonfactor services 7.2 –9.3 17.5 6.6 4.7 6.4 6.1 6.3 6.0
Imports of goods and nonfactor services 6.6 2.8 6.1 15.6 12.5 9.6 5.1 5.5 5.8
Source: World Bank staff projectionNote: Figures for 2013 estimates. Figures for 2014-2016 are forecasts
Figure 2.1: Growth will pick up in 2014, driven by investment and public spending
Source: World Bank staff projections
5.15.2 5.3
4.24.4
4.3
5.0
5.9 6.1 6.1
3.0
3.5
4.0
4.5
5.0
5.5
6.0
6.5
2011 2012 2013 2014 2015 2016
Annu
al g
row
th (p
erce
nt)
High
Baseline
Low
spending by the government. Supportive monetary policy helped buffer the decline in demand. Uncertainty about fiscal spending at both the national and county level, low inflation, continued weakness in the export sector, and the potential impact of higher Central Bank rates on household budgets argue for a continuation of the current monetary policy stance to support growth in the short term. Room for further easing remains, as inflationary expectations are still anchored at a low level. The challenge for the Central Bank going forward is to support growth while keeping inflation low.
Economic activity will move into higher gear as the government ramps up spending. Although fiscal policy space is narrowing, there is still room to maintain infrastructure and social sector spending. However, the government should reduce the burgeoning wage bill, which threatens macroeconomic stability. On the revenue side, the reforms in taxation ushered in by the VAT Act 2013 enhance tax administration and improve efficiency, reducing the list of exemptions from 400 to 40 and reorienting taxation toward consumption rather than production.
Putting public debt on a sustainable path over the medium term while supporting near-term growth requires fiscal consolidation. Gross debt increased to more than 50 percent of GDP in 2012/13, up from 45 percent in 2011/12. This debt level is sustainable, according to 2013 IMF/World Bank debt sustainability analysis (DSA). Issuance of a Eurobond in 2014 will raise the level, however, potentially reducing Kenya’s ability to finance larger fiscal deficits without creating pressure on the economy. Higher levels of debt could raise fears among private investors about inflation and depreciation, resulting in volatility in the money
and capital markets. Lower debt levels would calm these fears and bring Kenya’s debt levels closer to those of its peers.
Consolidation of the fiscal space ought to be possible without reducing infrastructure spending. Fiscal buffers could be rebuilt by monitoring the new wage and salary structures related to the constitutionally mandated devolution process; managing and rationalizing the number of county staff; implementing the Civil Servants Pension Act, to reduce the contingent liability of the government; increasing public investment in infrastructure, to stimulate private investment; and increasing the efficiency of
public spending, to create space for increased infrastructure investment.
2.2 Risks Remain Unchanged
The risks to the outlook remain the same as they were in the June
update. On the external front, the winding down of the liquidity injection
into the global economy by the U.S. Federal Reserve will cause volatility in Kenya’s exchange rate and increase domestic interest rates, as Kenya is a major recipient of short-term flows, which finance the current account. Reversals of capital flows when global liquidity tightens could lead to significant deterioration of domestic financial conditions and slow economic activity. Increased volatility could hurt investment and growth.
On the domestic front, the government could fail to absorb funds at both the county and national level, stifling aggregate demand and economic activity. Lack of capacity at the county level poses a significant risk to budget implementation that might subdue economic activity. Alternatively, county government could receive larger budget allocations, crowding out financing for national functions, which would have to be financed by additional borrowing, creating macroeconomic
The State of Kenya’s Economy
December 2013 | Edition No. 926
Gross debt increased to more than 50 percent of GDP in 2012/13, up
from 45 percent in 2011/12

The State of Kenya’s Economy
December 2013 | Edition No. 9 27
stability. Without a human resource audit of staff at both the county and national levels, Kenya’s wage bill is poised to significantly increase. A staff rationalization exercise could indicate where cuts could be made.
Risks related to the external imbalance remain. The improvements in the external account appear temporary, because imports are expected to pick up once the economy regains strength. The deficit in the current account balance fell to 7.5 percent of GDP by September 2013, down from more than 10 percent in 2012. This improvement cannot be attributed to conscious policy actions, however. Increases in private sector credit, FDI, or demand for oil (as a result of drought) would reignite pressure on the external account, creating exchange rate volatility. Current account balances are projected to weaken in the near to short term, thanks in part to the need for imported capital goods to support large-scale infrastructure projects, as credit increases to the private sector and FDI–financed investment in infrastructure and natural resources flow in.
A drought could slow growth by up to 3 percent. Inadequate rainfall would force Kenya to increase food imports. It would also reduce the generation of hydropower electricity and increase the need for thermal power, raising oil imports. Both effects would have an impact on inflation and the current account balance.
Security poses significant challenges to Kenya’s prospects. The operations of Al Shabaab terrorists and the associated travel advisories diminish the allure of Kenya as a tourist destination. Security concerns, if pervasive, could then deter foreign investors from doing business not only in certain counties perceived as dangerous but in Kenya as a whole.
2.3 What Can Policy Makers Do to Spur High and Sustainable Growth?
The immediate priority is to continue to establish a strong foundation for high and
sustainable growth while advancing structural reforms and reducing both domestic and external vulnerabilities. Preserving and enhancing service delivery and preventing waste could help reduce fiscal risks at both the national and the county level. Doing so will require structural reforms to improve the domestic regulatory environment as well as efforts to achieve efficiency savings at big-spending ministries. A reform program could rapidly improve the business regulatory environment. Similar efforts in 2007 yielded fruit as Kenya’s ranking vaulted Kenya to the top 10 most improved countries. A weak regulatory
and business environment continues to shackle investment activity in Kenya. Strengthening competitiveness and raising productivity remain the most critical medium-term challenges if growth is to accelerate, as envisioned in Vision 2030 (Kenya’s
blueprint for economic and human development) and the Second Medium-Term Plan. A new round of structural reforms, including investment in public infrastructure and removal of barriers to entry in product and services markets, could be useful.
Reducing fiscal risks, rebuilding policy buffers, and creating fiscal space to withstand future shocks are critical. The urgent fiscal policy priority is to put in place a fiscal consolidation plan to place public debt on a sustainable path over the medium term while supporting near-term growth. This priority could be implemented by increasing public investment in infrastructure to stimulate private investment and improving the efficiency of public spending to create space for increased infrastructure investment in support of long-term
A weak regulatory and business environment continues to shackle investment activity
in Kenya
The State of Kenya’s Economy
December 2013 | Edition No. 928
growth objectives. Savings could also come from reductions in recurrent spending.
Reforms in public financial management (PFM) will increase efficiency in public resources and savings. Quick adoption and operationalization of PFM regulations would entrench the PFM law and help ensure accountability, transparency, and the effective and efficient collection and utilization of public resources. The government also needs to make the Integrated Financial Management Information System (IFMIS) and the Treasury Single Account fully functional. Roll-out of the IFMIS has been going on for some time, but its operationalization still faces challenges. This tool has the potential to substantially support the control process, significantly improving accountability and transparency in budgeting, and reporting. The Treasury Single Account will improve the management of government deposits, which lie in different accounts at the Central Bank and are allocated to government ministries and departments only when funds are ready to be absorbed.
Going forward, a focus on generating higher, sustained, and more inclusive growth will have payoffs in terms of more and better jobs and reducing poverty. Creating such growth will involve stepping up investment in physical and human capital, promoting agriculture, improving the business climate, and encouraging economic diversification. These goals can be achieved with reforms that enhance competition; protect property rights; simplify regulations; and increase
investment in infrastructure, education, and health. However, this journey cannot start before the government provides the Kenya National Bureau of Statistics with the financial resources to undertake the second Integrated Household Survey (the first one was conducted in 2005/06). Together with other surveys (including the labor force survey), this survey would help identify the level of poverty and income inequality and support the
monitoring and evaluation of government policy on the welfare of Kenya’s people.
Creating such growth will involve stepping up investment in physical
and human capital, promoting agriculture,
improving the business climate, and
encouraging economic diversification

Special Focus: Increasing Access to Credit

Special Focus: Increasing Access to Credit
December 2013 | Edition No. 930
Kenya frequently grabs headlines for its success in leveraging ICT to spur financial deepening.
The story of mobile money is often seen as the story of financial access in Kenya. And there is no doubt that the numbers are impressive: as of the end of April 2013, there were 96,319 mobile money agents and more than 23 million registered users of mobile payment services in Kenya—74 percent of the adult population. The number of transactions reached 56 million, with an average transaction value of US$ 29.3 and a total value of KSh 142 billion mobile money transactions per month. These technology-driven innovations have led to significant differences in the personal savings, borrowing and transacting behaviors of typical Kenyans, especially the unbanked.
The primary function of a well-developed banking system is financial intermediation—channeling savings into investment. This part of the report take a closer look at the borrowing environment for businesses, focusing on access to bank financing for SMEs. A sound accessible banking system is the backbone of a vibrant private sector. The seminal role SMEs play globally in the development of the private sector and the economy as a whole is well documented, as are the constraints they face in raising adequate finance.
Kenyan banks are ahead of their counterparts in lending to SMEs, but there have been concerns on the high cost. In Kenya, 17.4 percent of bank lending goes to SMEs—a much larger share than in Nigeria (5 percent) or South Africa (8 percent)
(World Bank 2013). These numbers are supported by innovations in the banking sector that suggest a strong appetite for SME lending.
There have been concerns, however, that the high cost of credit from the banking sector maybe constraining businesses, especially SMEs. Such concerns have been part of the policy debate since the macroeconomic turbulence of late 2011 and the asymmetric response from banks to changes in the monetary policy rate, in which bank lending rates seem to track hikes in the Central Bank rate more closely than reductions. SMEs often cite the cost of credit as a stumbling block in getting access to formal credit.
3.1 Reforms Strengthened the Banking Sector over the Last Decade
Kenya’s banking sector has established itself as one of the pillars of the economy, both in
Kenya and in the East African Community. This achievement is remarkable given the problems that plagued the sector just over a decade ago, when competition was constrained, the quality of loan portfolios was poor, and outreach to rural areas and SMEs was limited.
Kenya’s financial sector is the third largest in Sub-Saharan Africa, after South Africa and Nigeria. It has been relatively stable in the face of recent slowdowns and shocks, both domestic and global. The sector comprises a large banking sector, which has leveraged its resilience and growth to establish
The Kenyan banking sector underwent significant transformation over the last decade or so. Reforms improved the resilience of the sector to domestic and international shocks, and technology brought
retail banking to millions of Kenyans. Small and medium-size enterprises still find it difficult to obtain bank loans, however, which are often priced beyond their reach. Channeling credit to this sector is critical to spurring growth and job creation.
3. Increasing Access to Credit
2 At the end of December 2012, Kenya’s banking sector comprised 44 banking institutions. This review covers 43 banks. It excludes Charterhouse Bank Ltd., which is under Central Bank statutory management.

December 2013 | Edition No. 9 31
Special Focus: Increasing Access to Credit
a strong subregional presence; a relatively well-developed securities market (the third largest in Sub-Saharan Africa in terms of capitalization); and a relatively large pension and growing insurance sector.
The banking sector dominates Kenya’s financial sector. As of the end of June 2013, it comprised 43 commercial banks, 1 mortgage finance company, 9 deposit-taking microfinance institutions, 7 representative offices of foreign banks, 107 foreign exchange bureaus, and 2 credit bureaus.3 Of the 44 commercial banks and mortgage finance institutions, 31 are locally owned. The locally owned financial institutions include 3 banks with
significant shareholding by the government and state-owned corporations, 27 commercial banks, and 1 mortgage finance institution (Figure 3.1).
Banking sector reforms have been ongoing for more than a decade. These reforms have increased the resilience of the sector despite both domestic shocks (postelection violence in 2008 and subsequent lower economic growth) and international shocks (in particular the global financial crisis and the rising prices of food and fuels).
The sector is more than adequately capitalized. The ratio of total capital to total risk-weighted
Figure 3.1: Ownership structure of Kenyan banks
Source: www.centralbank.go.keNote: The shareholding by the government and state corporations in public financial institutions is indicated in parenthesis
Commercial Banks27
Mortgage Financial
Commercial Banks13
Consolidated Bank of Kenya (78%)
Development Bank of Kenya (100%)
National Bank of Kenya (71%)
Commercial Banks and Morgage Financial Institutions
Private FinancialInstitutions
LocalForeign
(Over 50% of Ownership)
Public Financial Institutions*
3 At the end of December 2012, Kenya’s banking sector comprised 44 banking institutions. This review covers 43 banks. It excludes Charterhouse Bank Ltd., which is under Central Bank statutory management.

Special Focus: Increasing Access to Credit
December 2013 | Edition No. 932
assets was 22.9 percent in September 2013 (well above the required minimum of 12 percent), and the ratio of core capital to total risk-weighted assets stood at 19.5 percent (well above the required minimum of 8 percent). The Central Bank of Kenya increased the minimum capital requirement for commercial banks from KSh 250 million to KSh 1 billion, effective January 2013.4 As of December 2012, all institutions had met the requirement.
The asset quality of banking sectors remains high. As state ownership in the sector declined, the quality of assets improved, as the proportion of bad loans plummeted. Just 5.2 percent of gross loans were nonperforming loans at the end of September 2013, down from 30 percent in 2003, when the high level of nonperforming loans, mainly as a result of loans extended by state-owned banks, presented a risk to the system.
The expansion of retail banks into lower-income markets has led to an expansion in deposit accounts, bank branches, and agents (Figure 3.2). Deposits, which constitute the main source of funding for the banking sector, accounted
for 73 percent of total funding liabilities as of September 2013. The number of deposit accounts in commercial banks increased from 4.7 million in 2007 to 22.1 million as of October 2013. The increase mostly comprised micro accounts and is attributable in a large part in the increase in the number of bank branches, which rose from 740 in 2007 to 1,272 in 2012.
Technological innovations and the emergence of financial institutions and initiatives that target traditionally underserved segments of the market have also expanded the reach of the banking sector. Banks have leveraged developments in ICT by introducing agency banking, facilitated by the introduction of regulation to permit the use of agents. As a result, the costs of providing financial services in sparsely populated areas have fallen and outreach increased. As of June 30, 2013, the Central Bank had authorized 13 banks to offer banking services through agents. Since its launch in 2010, 22,423 agents have been contracted, facilitating 73.8 million transactions valued at KSh 376.6 billion as of October 2013.5
The success of M-Shwari (the savings and loan product it offers Safaricom M-Pesa users) vaulted the Commercial Bank of Africa (CBA) into second place in retail banking in Kenya.6 The uptake of M-Shwari increased the number of CBA’s deposit accounts from 34,884 in 2011 to more than 5 million in September 2013, leaving it second only to Equity Bank, which has more than 7 million deposit accounts.
Kenya’s credit information system significantly improved after approval of the 2008 banking regulations, which govern the licensing, operation, and supervision of credit bureaus
4 In 2008, the Central Bank announced a phased increase in banks’ minimum capital requirements, from KSh 250 million to KSh 1 billion at the end of 2012. In addition to the requirement for a capital adequacy ratio of 12 percent and a core capital ratio of 8 percent, it introduced a capitalization buffer of an additional 2.5 percent, effective January 2013.
5 The banking agency network is nevertheless dwarfed by the network of mobile payment agents.6 In 2011, Safaricom (the mobile network operator behind M-Pesa) and Cooperative Bank launched a joint product, M-Shwari, which allows customers to save and
borrow through their mobile phone. Airtel and Faulu jointly launched a similar product. Safaricom and Airtel share the transactional data they collect exclusively with their banking partners.
Figure 3.2: Deposits, loans, and credit to the private sectorhave grown steadily
Source: World Bank, based on data from the Central Bank of Kenya and World Development Indicators 2012
0
5
10
15
20
25
30
35
40
0
200
400
600
800
1,000
1,200
1,400
1,600
1,800
2007 2008 2009 2010 2011 2012
Perc
ent
KSh
billi
ons
YearsDeposits Net Loans and Advances Private sector credit (percent of GDP)

December 2013 | Edition No. 9 33
Special Focus: Increasing Access to Credit
by the Central Bank of Kenya. The legislation allows banks to share negative credit information with one another. The new regulations obligate banks to report all nonperforming loans on their books each month. The regulations pertain to all institutions regulated by the Central Bank. Two credit bureaus are operating: Credit Reference Bureau (CRB) Africa, which started operations in 2010, and Metropol Credit Reference Bureau, which opened in 2011. They cover about 5 percent of potential borrowers, or about 200,000 of the 5 million consumers who have loans with financial institutions, according to the Central Bank of Kenya. They also provide information on about 10,000 businesses. Credit bureaus receive 80,000-100,000 inquiries a month. The existence of unique personal identification numbers in Kenya has helped them identify individuals and match data.
The recent initiative by the Central Bank and the Treasury to revise the regulations to allow information sharing of positive data is a welcome development that will broaden the scope of the credit bureaus. Incorporating information collected from microfinance institutions and savings and credit cooperatives (SACCOs) as well as other providers is equally important to allow customers without access to banking products to establish a credit history. In particular, adding the information from the more than 20 million M-Pesa users would lead to a significant expansion of the database. One problem with including other providers is the quality and reliability of data, which need to be carefully assessed. Case-by-case inclusion of other providers therefore appears to be appropriate.
The number of SMEs that turned to lenders has increased significantly. Despite a range of institutions, including banks, nonbank financial institutions, SACCOs, and microfinance institutions
that provide financial services for SMEs, access to credit is still an issue. An analysis of firms that made it into this year’s Top 100 Mid-Sized Companies survey shows that the number of SMEs that turned to lenders for credit lines and overdrafts increased to 67 percent, up from 57 percent in 2012.7 Most of the surveyed entrepreneurs cited the high cost of credit as the reason for cash flow challenges, leaving them with no recourse but to dig deeper into their personal savings or turn to family and friends to raise funds for day-to-day operations.
3.2 Kenyan Banks Show an Encouraging Interest in SME Lending
The involvement of Kenyan banks in the SME segment is growing, in terms of both size and
the diversity of their approaches to the SME client relationship. Commercial banks have embraced SME financing as an integral part of their strategy.
Kenyan banks lend more to SMEs than their counterparts in Nigeria and South Africa. The share of commercial bank lending to SMEs is larger in Kenya (17.4 percent) than in other major markets in Sub-Saharan Africa, including Nigeria, where SME loans account for 5 percent of total loan portfolios, and South Africa, where they account for 8 percent (Figure 3.3).8 Kenya’s
7 Top 100 Mid-Sized Companies is an annual survey by auditing firm KPMG East Africa and the Nation Media Group.8 The surveys were conducted in different years. Some of the differences may reflect the difference in the year the survey was conducted.
Figure 3.3: Kenyan banks lend more to SMEs than in banks in some other countries in the region
Source: World Bank, based on data from Central Bank of Kenya
0
2
4
6
8
10
12
14
16
18
20
Nigeria South Africa Tanzania Rwanda Kenya
Shar
e of
tot
al b
ank
lend
ing
that
goe
s to
SM
Es (p
erce
nt)
Special Focus: Increasing Access to Credit
December 2013 | Edition No. 934
ratio is comparable to that of Rwanda, which is a smaller market with a relatively small presence of large-scale firms (Aziz and Berg 2012). Banks are interested in lending to SMEs despite the fact that elements of the enabling environment for SMEs are still under construction.
Kenyan banks are also ahead of their counterparts in other African countries in innovations targeting this market. These innovations started when microfinance-rooted institutions scaled up to become commercial banks. They now include innovative lending models and technology in the retail banking segment. In addition, there are other active markets for financial products suited to SMEs, such as hire-purchase and invoice discounting, which deliver to government and larger enterprises with reputable payment histories. Adoption of these instruments has facilitated entry by a tier of midsize Kenyan banks into the SME financing space.
Kenyan banks tend to provide more working capital than investment loans. Demand factors play a role: Kenyan firms cite working capital shortages as the primary reason for approaching banks. The distribution of loans may also reflect banks’ assessment that long-term loans are too risky. According to banks interviewed, on average it takes 190 days to recover bad loans in Kenya, with a rate of recovery of about 80 percent; the cost is about 40 percent of the amount of the loan. The situation seems somewhat better in Rwanda, where on average it takes 135 days to recover loans, the rate of recovery is about 85 percent, and the cost is about 10 percent of the loan. Nigerian banks operate in the most difficult environment: on average they need 246 days to recover a loan and are able to recover only 30 percent of the loan.
Most Kenyan banks have dedicated units serving SMEs. At most institutions, however, the unit is a sub-unit of the retail banking unit or the business/commercial banking unit rather than a division. Products are largely standardized, although a number of banks—including Equity Bank, Cooperative Bank, and K-Rep Bank—are producing customized loan products for the SME sector (Table 3.1). Some banks provide training to their clients to improve their management skills and financial reporting. Lending remains based on collateral. Risk management is increasingly automated, although domestically owned banks have not yet embraced the use of scoring and risk-rating technologies on a large scale.
Banks prefer to engage with formal firms. As part of the loan application, they require SMEs to present a variety of documents certifying their compliance with government regulations and providing details about their finances. The most common documents required include the registration certificate from the
Business Registrar (Attorney General’s Office); the Single Business Permit, obtained from city councils; and sometimes a certificate of compliance from the Kenya Revenue Authority. These filing requirements can be onerous and often discourage SMEs from seeking bank financing.
Kenyan banks are partnering with donor agencies to expand their SME lending portfolios (Table 3.2). USAID operates the largest credit guarantee scheme in Kenya, a US$ 70 million program. ARIZ, a risk-sharing program funded by the African Development Bank, guarantees 50 percent of all loans in the portfolio. Other donors that are encouraging lending to SMEs include the European Investment Bank, Proparco, FMO, DEG, SIDA, KfW, Norfund, and the China Development Bank.
According to banks interviewed, on average
it takes 190 days to recover bad loans in Kenya, with a rate of recovery of about 80
percent

December 2013 | Edition No. 9 35
Special Focus: Increasing Access to Credit
Across Sub-Saharan Africa, donors are encouraging banks to engage in SME financing, providing bank-specific lines of credit and partial credit guarantees. Donors prefer this targeted bank-specific approach to establishing schemes that are open to all qualified institutions, although a more open approach would be better suited to encouraging competition. In markets where SME financing is in its infancy, schemes can augment banks’ willingness to push the frontier and
demonstrate that lending to SMEs can be a viable and profitable business line.
Partial credit guarantees combined with technical assistance make improves SME lending. Donor and government support programs such as partial credit guarantees or credit lines can be useful, especially if combined with technical assistance for financial institutions to develop new SME lending technologies. However, more often than
Table 3.1: Kenyan banks are increasingly tailoring their products for SMEs
Bank Product Target customer Amount
CfC Stanbic SME quick loan SMEs KSh 50,000 to KSh 2 million
SME bizna loan All SMEs Less than KSh 3 million
Coop Bank
Bizwise loan All SMEs Less than KSh 50 million
Maziwa loan All SMEs
Msamaria women’s loan Women entrepreneurs with legal businesses who are seeking working and investment capital
KSh 5,000 to KSh 10 million
Construction loan Less than KSh 50 million
Unsecured loan for schools Schools 25 percent of expected school fees per term
Distributor financing SMEs KSh 100,000 to KSh 50 million
Overdrafts SMEs
Guarantees and bonds SMEs
Equity Bank
Kilimo Supa Agricultural traders, microenterprises
KSh 5,000 to KSh 500,000
Kilimo Biashara Agro-input dealers, commercial crop farmers
Tier 1 (small scale):KSh 1,000 to KSh 100,000Tier 2 (large scale): More than KSh 100,000 Tier 3 (agribusiness):Loan amount varies
SME business loan SMEs operating in transport, trade and commerce, construction, manufacturing, education, health, and other services sector
KSh 1 to KSh 50 million
Microbusiness loan Youth
KCB Overdrafts Businesses with three years’ audited accounts with annual revenues of more than KSh 3 million
SME term loan SMEs Less than KSh 50 million
Source: Various Kenyan commercial bank websites

Special Focus: Increasing Access to Credit
December 2013 | Edition No. 936
not these schemes are underutilized and can even distort the market. Their success depends on their design and conditions in the market. Their impact is best evaluated on a case-by-case basis.
A number of general factors continue to constrain SME lending in Kenya. They include the macroeconomic environment (including inflation and foreign exchange risk), the legal and regulatory framework, the infrastructure of the financial sector, and the capacity and technology of banks. SME–specific factors include the poor quality of financial records and collateral, the high level of informality and the high cost of credit.
3.3 A Range of Factors Affects the Cost of Credit and Spreads
Several factors drive lending rates. The lending rates banks charge depend on a number of
factors, including general market conditions, the risk premium, and the creditworthiness of the borrower. One key factor is the cost at which banks raise funds—that is, the interest rate on deposits. As it is difficult to judge the appropriateness of a given lending rate, the discussion often centers on
the difference between the rate at which banks mobilize savings and the rate at which they lend these savings—the interest rate spread.
Efficiency in the banking sector could be improved. One of the key criticisms of the Kenyan banking sector is that efficiency—as measured by the interest rate spread—remains low. Following the macroeconomic turbulence of late 2011, the spread moved above the average 10.4 percentage points that had been maintained from 2000 to 2010. Both deposit and lending rates rose in response to a sharp hike in the Central Bank rate, effected to control inflation and stem currency depreciation. Since then, despite improvement in the macroeconomic situation and a decline in the policy rate, the spread has remained above the long-term trend. The spread between the average yield on performing advances and the average interest paid on customer deposits was 11.8 percentage points in 2012, up from 11.3 percentage points in 2011. The net yield—the difference between the average yield on interest-bearing investments and advances and the cost of funds—was 9.3 percentage points, up from 8.8 percentage points in 2011.
Table 3.2: Selected donor partnerships with Kenyan banks
Donor Partner Amount
African Guarantee Fund I & M Bank US$ 1.1 million
Dutch Development Bank Bank of Africa (Kenya) US$ 25 million
European Investment Bank
Chase Bank East Africa Development Bank
€ 25 million
Cooperative Bank of Kenya € 70 million
Housing Finance € 20 million
ABC KSh 770 million
Consolidated Bank KSh 715 million
Faulu Kenya € 4 million
KfWEquity Bank KSh 2 billion
I & M Bank US$ 15 million
Sources: www.africaguaranteefund.com; http://www.chasebankkenya.co.ke/news-item/chase-bank-receives-part-eur-1015-million-european-investment-bank-support-smes; http://www.businessdailyafrica.com/Bank-of-Africa-signs-Sh2bn-deal-to-fund-expansion-retail-lending/-/539552/1853500/-/uh4p5h/-/index.html (accessed November 1, 2013).
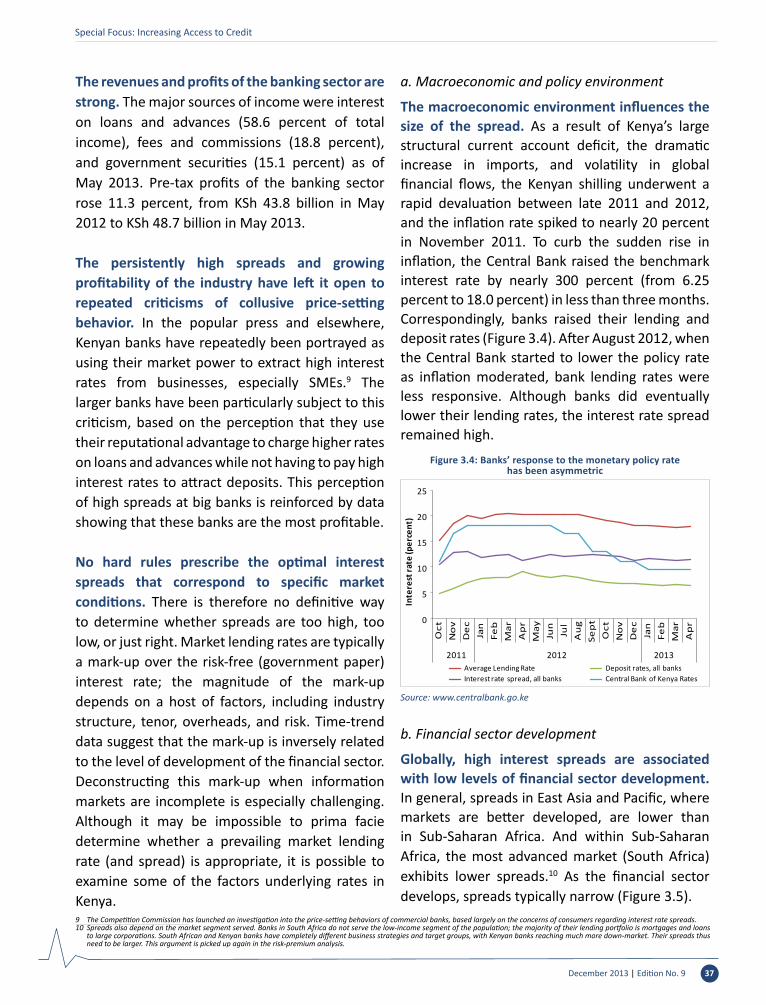
December 2013 | Edition No. 9 37
Special Focus: Increasing Access to Credit
The revenues and profits of the banking sector are strong. The major sources of income were interest on loans and advances (58.6 percent of total income), fees and commissions (18.8 percent), and government securities (15.1 percent) as of May 2013. Pre-tax profits of the banking sector rose 11.3 percent, from KSh 43.8 billion in May 2012 to KSh 48.7 billion in May 2013.
The persistently high spreads and growing profitability of the industry have left it open to repeated criticisms of collusive price-setting behavior. In the popular press and elsewhere, Kenyan banks have repeatedly been portrayed as using their market power to extract high interest rates from businesses, especially SMEs.9 The larger banks have been particularly subject to this criticism, based on the perception that they use their reputational advantage to charge higher rates on loans and advances while not having to pay high interest rates to attract deposits. This perception of high spreads at big banks is reinforced by data showing that these banks are the most profitable.
No hard rules prescribe the optimal interest spreads that correspond to specific market conditions. There is therefore no definitive way to determine whether spreads are too high, too low, or just right. Market lending rates are typically a mark-up over the risk-free (government paper) interest rate; the magnitude of the mark-up depends on a host of factors, including industry structure, tenor, overheads, and risk. Time-trend data suggest that the mark-up is inversely related to the level of development of the financial sector. Deconstructing this mark-up when information markets are incomplete is especially challenging. Although it may be impossible to prima facie determine whether a prevailing market lending rate (and spread) is appropriate, it is possible to examine some of the factors underlying rates in Kenya.
a. Macroeconomic and policy environment
The macroeconomic environment influences the size of the spread. As a result of Kenya’s large structural current account deficit, the dramatic increase in imports, and volatility in global financial flows, the Kenyan shilling underwent a rapid devaluation between late 2011 and 2012, and the inflation rate spiked to nearly 20 percent in November 2011. To curb the sudden rise in inflation, the Central Bank raised the benchmark interest rate by nearly 300 percent (from 6.25 percent to 18.0 percent) in less than three months. Correspondingly, banks raised their lending and deposit rates (Figure 3.4). After August 2012, when the Central Bank started to lower the policy rate as inflation moderated, bank lending rates were less responsive. Although banks did eventually lower their lending rates, the interest rate spread remained high.
b. Financial sector development
Globally, high interest spreads are associated with low levels of financial sector development. In general, spreads in East Asia and Pacific, where markets are better developed, are lower than in Sub-Saharan Africa. And within Sub-Saharan Africa, the most advanced market (South Africa) exhibits lower spreads.10 As the financial sector develops, spreads typically narrow (Figure 3.5).
Figure 3.4: Banks’ response to the monetary policy rate has been asymmetric
Source: www.centralbank.go.ke
0
5
10
15
20
25
Oct
No
vD
ec
Jan
Feb
Mar
Ap
rM
ayJu
nJu
lA
ug
Sep
tO
ctN
ov
De
cJa
nFe
bM
arA
pr
2011 2012 2013
Inte
rest
rate
(per
cent
)
Average Lending Rate Deposit rates, all banksInterest rate spread, all banks Central Bank of Kenya Rates
9 The Competition Commission has launched an investigation into the price-setting behaviors of commercial banks, based largely on the concerns of consumers regarding interest rate spreads. 10 Spreads also depend on the market segment served. Banks in South Africa do not serve the low-income segment of the population; the majority of their lending portfolio is mortgages and loans
to large corporations. South African and Kenyan banks have completely different business strategies and target groups, with Kenyan banks reaching much more down-market. Their spreads thus need to be larger. This argument is picked up again in the risk-premium analysis.

Special Focus: Increasing Access to Credit
December 2013 | Edition No. 938
Banks in developing countries cite high overheads as one of the main reasons for the high lending rates they charge. Salaries and other forms of labor compensation make up a large part of their overheads, as the scarcity of skilled financial sector workers leads to high turnover and compensation packages geared to retain scarce skills. Gaps in physical infrastructure also increase overheads.
Bank profits and overheads constitute a large portion of spreads. Even though they have narrowed since the mid-1990s profits and overheads still play an important role in explaining spreads in Kenya, accounting for 48 percent and 40 percent of spreads in 2012 (Figure 3.6). Both contributed to the rising spreads since the macroeconomic disruption of 2011.
c. Bank-specific factors
Despite the large number of banks in the market, the Kenyan banking sector is quite segmented. Kenya’s top banks held 61 percent of total deposits and accounted for 73 percent of the profitability of the banking sector in 2012. Their shares of nonperforming loans are significantly lower than those of the smallest banks. At the other end of the spectrum, 21 banks with deposit bases of less than KSh 15 billion accounted for 9 percent of customer deposits and just 3 percent of total profitability (Figure 3.7).
Large banks have higher spreads than medium-size and small banks (Figure 3.8). The gap can be attributed to differences in the cost of raising capital. Small and poorly capitalized banks find it more difficult to raise funds. They have to offer higher deposit rates to attract funds and compensate for the perception that they are riskier than large, more liquid, better-capitalized banks, which are perceived to be “too big to fail.” Consequently, big banks are able to mobilize more deposits even at relatively low or near-zero deposit rates while at the same time attracting more loan applications despite charging higher rates (Figure 3.9).
Figure 3.5: Interest rate spreads in Kenya have fallen over time
Source: World Development Indicators
0
2
4
6
8
10
12
14
16
18
2000 2001 2002 2003 2004 2005 2006 2007 2008 2009 2010 2011 2012
Perc
ent
Botswana East Asia & Pacific (all income levels)Kenya RwandaSouth Africa Sub-Saharan Africa (all income levels)Tanzania Uganda
Figure 3.6: Spreads are made up largely of overheads and profits
Source: Central Bank of Kenya
0.6 0.6 0.7 0.9
4.5 4.0 4.34.7
0.80.9 0.4
0.5
4.2 5.0 5.75.6
0
2
4
6
8
10
12
2009 2010 2011 2012
Perc
ent
Reserves Overheads Provisions Profit
Figure 3.7: Large banks account for most deposits and loans in Kenya
Source: Central Bank of KenyaNote: Banks are categorized by customer deposits, as follows: Category 1: More than KSh75 billion. Category 2: KSh 50–KSh75 billion. Category 3: KSh 15–KSh50 billion. Category 4: Less than KSh 15 billion
61
1119
9
63
1118
8
73
1014
34.1 2.7 5.210.0
0
10
20
30
40
50
60
70
80
Category 1 Category 2 Category 3 Category 4
Shar
e of
tota
l (pe
rcen
t)
Percent of total deposits Percent of advancesPercent of profit before tax Gross non-performing advances to gross advances

Figure 3.9: Large banks in Kenya offer lower rates on depositsthan small banks
Source: Central Bank of KenyaNote: For size categories, see note to Figure 3.8
2468
101214161820
Oct
Nov De
cJa
nFe
bM
ar Apr
May Jun Jul
Aug
Sept Oct
Nov De
cJa
nFe
bM
ar Apr
2011 2012 2013
Perc
ent
Deposit rates, all banks Deposit rates, small banksDeposit rates, medium banks Deposit rates, large banksCentral Bank of Kenya Rates
December 2013 | Edition No. 9 39
Special Focus: Increasing Access to Credit
The banking system is characterized by oligopolistic structure and market segmentation. The data in Figures 3.8 and Figures 3.9 indicate that larger banks control a large share of the market (deposits and loans), partly as a result of their reputation and customer loyalty. Customers seem to be motivated more by finding a safe parking place for their savings than by earning a high return. According to Radha (2011), different segments of the banking sector in Kenya face clients of significantly different size and type; this segmentation affects lending decisions, deposit mobilization, and the governance of banks. Segmentation is based on size but shaped largely by social factors that determine the level of trust between banks and their clients. Mwega (2012)suggests that monopolistic competition best characterizes the behavior of banks in Kenya.
d. Lending risk premiums
The difference between market lending rates and short-term T-bill rates (the proxy for the perceived risk-free return) can be interpreted as the risk premium. Calculated as the post facto difference between the two rates, it should reflect the market’s perception of risk factors. Over and above the actual risk perception, where there are information gaps on credit history or market conditions and other deficiencies in the financial
infrastructure, banks are likely to price these deficiencies through a higher risk premium.
The increase in 91-day T-bill rates in 2011 substantially reduced the difference between effective lending and T-bill rates (Figure 3.10). The risk-free return may provide an alternative explanation of why lending rates have not tracked the policy rate with the return of relative macroeconomic stability. If banks do indeed use the risk-free rate as the floor rate in their pricing model given a stable risk premium, then rising and increasingly volatile returns on government paper could explain why lending rates did not fall as expected when the Central Bank rate was lowered. A thorough understanding of banks’
Figure 3.8: Large banks in Kenya have higher spreads than smaller banks
Source: Central Bank of Kenya
8
10
12
14
16
18
20O
ctNo
vDe
cJa
nFe
bM
arAp
rM
ay Jun Jul
Aug
Sep
Oct
Nov
Dec
Jan
Feb
Mar
Apr
2011 2012 2013
Perc
ent
Interest rate spread, all banks Interest rate spreads, small banksInterest rate spread, medium banks Interest rate spread, large banksCentral Bank of Kenya Rates
Figure 3.10: Average lending rates are higher and less volatilethan Treasury-bill rates
Source: Central Bank of Kenya
7
9
11
13
15
17
19
21
23
Oct
Nov
Dec
Jan
Feb
Mar
Apr
May Jun Jul
Aug
Sept Oct
Nov
Dec
Jan
Feb
Mar
Apr
2011 2012 2013
Perc
ent
Average Lending Rate 91-day T-bill rates 182-day T-bill rate 364 day T-bill rate

Special Focus: Increasing Access to Credit
December 2013 | Edition No. 940
pricing behavior would entail an analysis of the entire interest rate structure, not just the monetary policy rate.
e. Borrower-specific characteristics
Banks express an interest in growing their business with SMEs, but they have reservations about the sector, largely relating to the high degree of informality. Faced with a lack of reliable information from SMEs, banks tend to price their loans higher than they would for corporate clients. SMES are on average riskier prospects than large firms, so the information difference accounts for only some of the premium banks charge them.
3.4 The Way Forward…
A mature banking sector—or more generally, a well-developed financial sector—will play
a critical role in helping Kenya reach its goal of attaining middle-income status. Increasing domestic financial intermediation, mobilizing domestic savings, and making these savings available for domestic investment are critical components of achieving the Vision 2030 growth targets. Ensuring adequate financing for SMEs, the dominant form of business organization in Kenya, is an important part of this equation.
Several of the building blocks for this path are already in place. Improvements in the financial infrastructure that fill information gaps and lower risk pricing are already underway. The increase in the coverage of the two licensed credit bureaus currently operating has been impressive. Encouraging the sharing of positive information by banks and other credit providers, including deposit-taking microfinance institutions, SACCOs, payment service providers, and utility companies,
will also ease these information constraints. An efficient collateral registry and effective creditor rights framework would help increase SME access to financing.
Many of the policies that could increase SMEs’ access to affordable bank financing lie outside the sector. As the discussion of the risk premium indicates, developments in the government debt market can affect the pricing behavior of banks. A sound debt management policy—a regular issuance policy that lowers the volatility of the returns on the risk-free asset—informs the interest structure. Sound macroeconomic policies are also key. Frequent spikes in inflation and depreciation make it more likely that banks will hedge against unpredictability with prices that are sticky downward.
As the financial sector matures, a variety of new instruments will ease the reliance on banks. With the availability of attractive, convenient alternatives to bank deposits, likely intermediated through the mobile money platform, the advantage that big banks have in raising low cost funds will erode over time. The savings behavior of Kenyans has already undergone a sea change
in just the last few years, and the market is rife with new ideas for mobilizing savings directly from retail savers.
Tapping the full growth and job-creation potential of the SME sector will have to entail a move toward providing growth capital, not just working capital. A growing number of private equity providers are active in East Africa in general and in Kenya in particular. Few of them are interested in SMEs, however. A number of new entrants cite lack of information and expertise as a
Increasing domestic financial intermediation,
mobilizing domestic savings, and making
these savings available for domestic investment are critical components of achieving the Vision
2030 growth targets

December 2013 | Edition No. 9 41
Special Focus: Increasing Access to Credit
deterrent to venturing into this market. Technical assistance could help bridge the distance between the demand for and supply of private equity.
Improving the listability of SMEs could increase their access to equity finance. Kenyan SMEs have shown some interest in tapping equity financing to grow, by turning to the growing number of private
equity funds or by issuing shares on the stock market. In fact, about 28 percent of firms surveyed in this year’s Top 100 Mid-Sized Companies survey said they were considering listing on the Nairobi exchange, which now has a special segment—the Growth Enterprise Market Segment (GEMS)—for SMEs.

December 2013 | Edition No. 942
REFERENCES
▪ Ayyagari, M., T. Beck, and Asli Demirgüç-Kunt. 2007. “Small and Medium Enterprises across the Globe. Small Business Economics.” 29 (4): 415–34.
▪ Aziz, A.T., and Berg, G. 2012. “Financing Small- and Medium-Sized Enterprises in Rwanda”. World Bank. Washington, DC. Mimeo.
▪ Beck, T., and A. Demirguc-Kunt, 2006. “Small and Medium-Size Enterprises: Access to Finance As a Growth Constraint.” Journal of Banking and Finance 30: 2931–43.
▪ Beck, T., A. Demirguc-Kunt, L. Laeven, and V. Maksimovic, 2006. “The Determinants of Financing Obstacles.” Journal of International Money and Finance 25: 932–52.
▪ Central Bank of Kenya. 2011. “Annual Supervision Report, 2011”. Nairobi.
▪ Central Bank of Kenya. 2013. “Monthly Economic Review, June”. Nairobi.
▪ De la Torre, A., M. Martinez Peria, and S. Schmukler, 2010. “Bank Involvement with SMEs: Beyond Relationship Lending.” Journal of Banking and Finance 34: 2280–93.
▪ Doing Business Indicators (database). World Bank, Washington, DC. http://www.doingbusiness.org/data.
▪ Fuchs, M., L. Iacovone, T. Jaeggi, M. Napier, R. Pearson, G. Pellegrini and C. Villegas Sanchez, 2011. “Financing Small and Medium Enterprises in the Republic of South Africa”. World Bank. Washington, DC.
▪ KNBS (Kenya National Bureau of Statistics). 2013. “Leading Economic Indicators, August”. Nairobi.
▪ KNBS (Kenya National Bureau of Statistics). 2013. “Gross Domestic Product: Second Quarter, 2013”. Nairobi.
▪ Mwega, F. M. 2012. “Regulatory Reforms and their Impact on the Competiveness ad Efficiency of the Banking Sector: A Case Study of Kenya.” In Bank Regulatory Reforms in Africa, ed. V. Murinde. London: Palgrave Macmillan.
▪ The National Treasury. 2013. “QBER Fourth Quarter 2012/13”. Nairobi.
▪ The National Treasury. 2013. “QBER First Quarter 2013/2014”. Nairobi.
▪ Radha, U. 2011. “Analysing the Sources and Impact of Segmentation in the Banking Sector: A Case Study of Kenya. Economics.” PhD diss., Department of Economics, School of Oriental and African Studies (SOAS), University of London.
▪ RSM Ashvir. 2013. “RSM Ashvir Communiqué: Kenya’s Banking Sector Performance in 2012”. www.rsmashvir.com
▪ UNCTAD (United Nations Conference on Trade and Development). “2012 Handbook of Statistics”. Geneva.
▪ World Bank. 2013. “Tourism in Africa: Harnessing Tourism for Growth and Improved Livelihoods”. Washington, DC.
▪ World Economic Forum. 2013. “The Travel and Tourism Competitiveness Report 2013: Reducing Barriers to Economic Growth and Job Creation”. Geneva.
▪ WTTC (World Travel and Tourism Council). 2013. “Travel and Tourism Economic Impact 2013: Kenya”. London.

ANNEXES
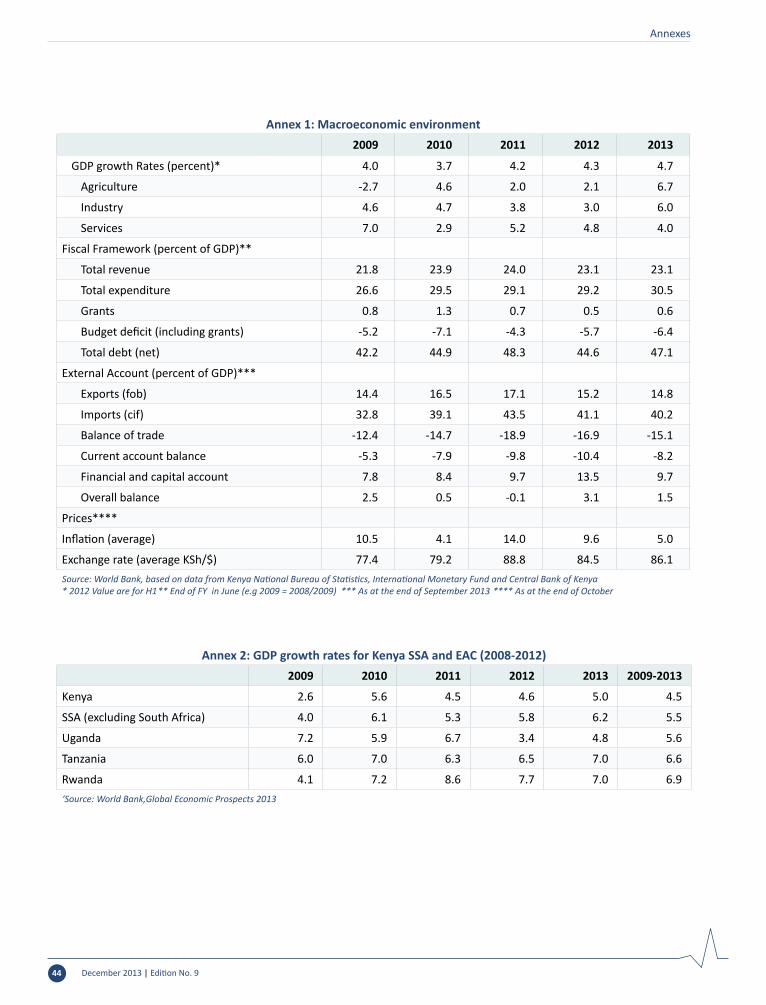
Annexes
December 2013 | Edition No. 944
Annex 1: Macroeconomic environment2009 2010 2011 2012 2013
GDP growth Rates (percent)* 4.0 3.7 4.2 4.3 4.7
Agriculture -2.7 4.6 2.0 2.1 6.7
Industry 4.6 4.7 3.8 3.0 6.0
Services 7.0 2.9 5.2 4.8 4.0
Fiscal Framework (percent of GDP)**
Total revenue 21.8 23.9 24.0 23.1 23.1
Total expenditure 26.6 29.5 29.1 29.2 30.5
Grants 0.8 1.3 0.7 0.5 0.6
Budget deficit (including grants) -5.2 -7.1 -4.3 -5.7 -6.4
Total debt (net) 42.2 44.9 48.3 44.6 47.1
External Account (percent of GDP)***
Exports (fob) 14.4 16.5 17.1 15.2 14.8
Imports (cif) 32.8 39.1 43.5 41.1 40.2
Balance of trade -12.4 -14.7 -18.9 -16.9 -15.1
Current account balance -5.3 -7.9 -9.8 -10.4 -8.2
Financial and capital account 7.8 8.4 9.7 13.5 9.7
Overall balance 2.5 0.5 -0.1 3.1 1.5
Prices****
Inflation (average) 10.5 4.1 14.0 9.6 5.0
Exchange rate (average KSh/$) 77.4 79.2 88.8 84.5 86.1Source: World Bank, based on data from Kenya National Bureau of Statistics, International Monetary Fund and Central Bank of Kenya * 2012 Value are for H1 ** End of FY in June (e.g 2009 = 2008/2009) *** As at the end of September 2013 **** As at the end of October
Annex 2: GDP growth rates for Kenya SSA and EAC (2008-2012)2009 2010 2011 2012 2013 2009-2013
Kenya 2.6 5.6 4.5 4.6 5.0 4.5
SSA (excluding South Africa) 4.0 6.1 5.3 5.8 6.2 5.5
Uganda 7.2 5.9 6.7 3.4 4.8 5.6
Tanzania 6.0 7.0 6.3 6.5 7.0 6.6
Rwanda 4.1 7.2 8.6 7.7 7.0 6.9‘Source: World Bank,Global Economic Prospects 2013

December 2013 | Edition No. 9 45
Annexes
Annex 3: Kenya annual GDP
Years GDP, current pricesKSh Billions
GDP, constant pricesKSh Billions
GDP/capita, current prices US$
GDP growthPercent
2000 968 965 399 0.6
2001 1026 1011 413 4.7
2002 1039 1014 408 0.3
2003 1142 1042 456 2.8
2004 1274 1090 478 4.6
2005 1416 1156 547 6.0
2006 1623 1229 637 6.3
2007 1834 1315 749 7.0
2008 2108 1357 813 1.5
2009 2367 1394 793 2.7
2010 2554 1475 810 5.8
2011 3049 1540 833 4.4
2012 3440 1610 991 4.6Source: World Bank, based on data from Kenya National Bureau of Statistics
Annex 4.a: Broad sectors growth (half year, percent)Year Half Agriculture Industry Services GDP
2006H1 2.5 4.7 8.0 6.1
H2 6.1 5.3 5.1 6.5
2007H1 5.5 6.6 7.4 7.7
H2 -0.1 7.6 8.8 6.3
2008H1 -2.7 4.6 2.6 1.7
H2 -5.6 4.8 2.8 1.4
2009H1 -2.7 4.6 7.0 4.0
H2 -2.3 1.1 3.0 1.6
2010H1 4.6 4.7 2.9 3.7
H2 7.8 6.0 8.2 7.8
2011H1 2.0 3.8 5.2 4.2
H2 1.2 2.0 5.2 4.5
2012H1 2.1 3.0 4.8 4.3
H2 5.2 5.9 4.5 4.8
2013 H1 6.7 6.0 4.0 4.7Source: World Bank, based on data from Kenya National Bureau of Statistics Agriculture = Agriculture and forestry + Fishing Industry = Mining and Quarrying + Manufacturing + Electricity and Water + Construction Services = Wholesale and retail trade + Hotels and restaurants + Transport and Communication + Financial intermediation + Real estate, renting and business services + Public administration + Education + Other services + FISIM

Annexes
December 2013 | Edition No. 946
Anne
x 4.
b: Q
uart
erly
gro
wth
rate
s (pe
rcen
t)AG
RICU
LTU
REIN
DUST
RYSE
RVIC
ESG
DP
Year
sQ
uart
ers
Q/Q
-1Q
/Q-4
(Q:Q
-3)/
(Q-4
:Q-7
)Q
/Q-1
Q/Q
-4(Q
:Q-3
)/(Q
-4:Q
-7)
Q/Q
-1Q
/Q-4
(Q:Q
-3)/
(Q-4
:Q-7
)Q
/Q-1
Q/Q
-4(Q
:Q-3
)/(Q
-4:Q
-7)
2009
1-1
6.0
-1.5
-3.4
-1.4
7.5
5.8
5.1
10.3
4.6
-2.1
6.2
2.7
2-6
.9-3
.9-4
.33.
61.
94.
7-2
.63.
84.
9-2
.91.
92.
7
318
.9-3
.3-3
.80.
2-1
.32.
78.
36.
45.
59.
51.
92.
5
46.
2-1
.3-2
.51.
43.
72.
8-1
0.3
-0.5
4.9
-2.8
1.2
2.7
2010
1-9
.95.
9-0
.8-0
.74.
42.
15.
90.
22.
5-1
.91.
41.
6
2-9
.23.
30.
84.
25.
02.
92.
75.
72.
91.
56.
12.
6
325
.08.
64.
02.
27.
25.
18.
86.
12.
910
.77.
24.
0
44.
67.
06.
3-0
.84.
85.
4-6
.610
.55.
5-1
.88.
35.
8
2011
1-1
5.6
0.2
4.9
-0.6
4.9
5.5
1.5
5.9
7.0
-5.0
4.8
6.6
2-5
.74.
15.
11.
92.
74.
91.
34.
56.
70.
33.
56.
0
320
.50.
32.
90.
51.
03.
39.
55.
26.
411
.24.
05.
1
46.
42.
01.
51.
33.
12.
9-6
.65.
25.
2-0
.85.
14.
4
2012
1-1
5.5
2.2
2.0
-0.5
3.3
2.5
1.3
5.0
5.0
-5.9
4.1
4.2
2-5
.82.
11.
61.
32.
72.
50.
94.
65.
00.
64.
44.
4
324
.95.
83.
11.
33.
53.
19.
04.
24.
711
.34.
54.
6
45.
34.
73.
86.
08.
34.
5-6
.04.
84.
6-0
.25.
14.
6
2013
1-1
2.7
8.2
5.2
-2.6
6.0
5.1
-0.3
3.2
4.2
-5.9
5.2
4.8
2-8
.45.
25.
91.
26.
06.
02.
64.
94.
3-0
.24.
34.
8So
urce
: Wor
ld B
ank,
bas
ed o
n da
ta fr
om K
enya
Nati
onal
Bur
eau
of S
tatis
tics

December 2013 | Edition No. 9 47
Annexes
Annex 5: Inflation Year Month Overall inflation Food inflation Energy inflation Core inflation
2011
January 5.4 8.6 5.7 1.4
February 6.5 9.8 7.8 1.8
March 9.2 15.1 9.6 2.5
April 12.1 19.1 12.7 3.6
May 13.0 20.1 14.4 4.0
June 14.5 22.5 15.5 4.8
July 15.5 24.0 16.2 5.6
August 16.7 23.9 16.8 8.5
September 17.3 24.4 17.6 9.1
October 18.9 26.2 19.2 10.4
November 19.7 26.2 20.6 11.8
December 18.9 25.0 19.7 11.6
2012
January 18.3 24.6 17.3 12.1
February 16.7 22.1 14.8 12.1
March 15.6 20.3 13.0 12.0
April 13.1 16.2 11.1 11.0
May 12.2 14.6 10.0 11.3
June 10.1 10.5 9.0 10.7
July 7.7 6.6 7.4 9.7
August 6.1 3.6 6.7 9.0
September 5.3 2.9 6.0 8.3
October 4.1 1.4 5.0 7.0
November 3.3 1.7 3.1 5.5
December 3.2 1.7 2.8 5.5
2013
January 3.7 2.4 3.9 5.2
February 4.5 4.0 4.6 4.9
March 4.1 2.9 5.3 4.8
April 4.1 3.6 4.3 4.6
May 4.1 4.3 3.5 4.1
June 4.9 6.5 3.5 4.1
July 6.0 8.4 4.6 4.4
August 6.7 9.7 5.3 4.3
September 8.3 12.6 5.7 5.4
October 7.8 12.0 4.8 5.4Source: World Bank, based on data from Kenya National Bureau of Statistics

Annexes
December 2013 | Edition No. 948
Annex 6: Tea production and exports
Year Month Production MT Price KSh/Kg Exports MT Exports value KSh million
2011
January 35,999 256 31,110 7,871
February 26,711 251 28,814 7,223
March 22,459 243 35,852 8,890
April 31,482 241 32,084 7,900
May 32,856 245 31,898 7,825
June 28,955 264 34,957 7,825
July 26,343 283 33,629 8,907
August 24,471 294 32,693 9,266
September 30,493 292 26,430 9,333
October 39,926 291 29,422 7,686
November 36,825 269 33,353 8,855
December 41,393 251 35,187 9,334
2012
January 36,205 250 35,382 9,145
February 18,412 245 37,656 9,123
March 17,859 251 31,280 9,415
April 18,118 256 26,816 7,804
May 37,383 264 25,060 6,445
June 30,197 279 29,148 7,770
July 24,306 288 28,054 7,813
August 31,920 288 30,996 8,798
September 33,549 280 30,689 8,771
October 40,235 272 33,167 9,448
November 39,977 277 38,681 10,840
December 41,401 281 30,067 8,463
2013
January 45,390 284 40,190 11,383
February 38,503 271 34,585 10,071
March 33,368 241 32,534 8,619
April 38,230 210 33,662 8,012
May 39,600 215 40,936 9,463
June 30,530 209 37,783 8,515
July 26,229 212 43,761 9,911
August 26,338 208 36,175 8,236Source: World Bank, based on data from Kenya National Bureau of Statistics

December 2013 | Edition No. 9 49
Annexes
Annex 7: Coffee production and exports
Year Month Production MT Price KSh/Kg Exports MT Exports value KSh million
2011
January 3,774 682 3,067 1,282
February 3,851 640 3,261 1,671
March 3,639 587 4,204 2,155
April 2,298 474 4,254 2,294
May 0 0 3,878 1,963
June 1,136 596 2,677 1,322
July 3,305 592 2,857 1,749
August 4,558 582 3,096 1,955
September 2,904 593 3,317 2,161
October 1,388 543 3,298 2,134
November 1,331 541 1,990 1,173
December 1,800 603 1,672 940
2012
January 4,770 544 3,094 1,454
February 6,505 369 3,668 1,937
March 3,317 389 5,069 2,550
April 4,801 342 4,625 2,369
May 5,472 303 4,924 2,275
June 3,884 258 4,887 2,098
July 3,086 298 5,727 2,397
August 3,948 277 4,484 1,712
September 4,474 265 4,421 1,596
October 2,924 263 4,482 1,690
November 1,794 272 4,110 1,453
December 1,075 308 2,223 740
2013
January 3,938 344 2,790 1,062
February 4,825 320 3,955 1,429
March 4,074 327 3,179 1,188
April 6,038 279 3,986 1,362
May 4,943 230 5,164 1,790
June 2,410 208 5,238 1,778
July 830 250 4,652 1,556
August 3,411 297 4,741 1,409
September 2,442 286 - -Source: Kenya National Bureau of Statistics
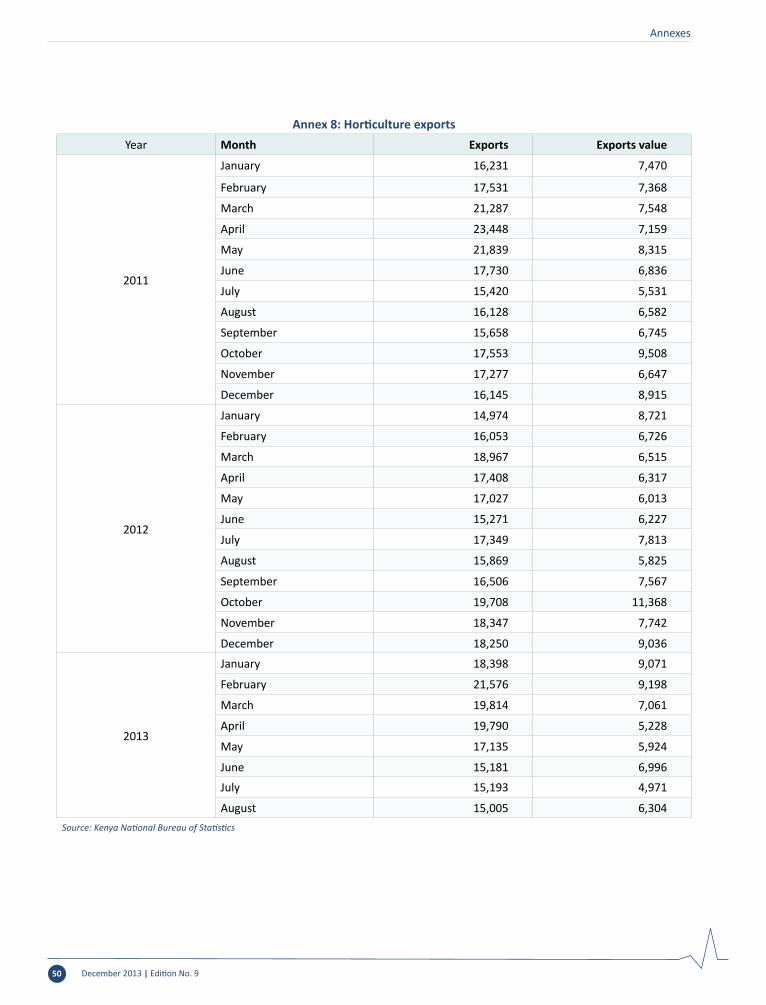
Annexes
December 2013 | Edition No. 950
Annex 8: Horticulture exportsYear Month Exports Exports value
2011
January 16,231 7,470
February 17,531 7,368
March 21,287 7,548
April 23,448 7,159
May 21,839 8,315
June 17,730 6,836
July 15,420 5,531
August 16,128 6,582
September 15,658 6,745
October 17,553 9,508
November 17,277 6,647
December 16,145 8,915
2012
January 14,974 8,721
February 16,053 6,726
March 18,967 6,515
April 17,408 6,317
May 17,027 6,013
June 15,271 6,227
July 17,349 7,813
August 15,869 5,825
September 16,506 7,567
October 19,708 11,368
November 18,347 7,742
December 18,250 9,036
2013
January 18,398 9,071
February 21,576 9,198
March 19,814 7,061
April 19,790 5,228
May 17,135 5,924
June 15,181 6,996
July 15,193 4,971
August 15,005 6,304Source: Kenya National Bureau of Statistics

December 2013 | Edition No. 9 51
Annexes
Annex 9: Local electricity generation by source
Year Month Hydro Geothermal Thermal Total
2011
January 296 119 188 603
February 246 105 200 551
March 259 126 225 610
April 237 120 224 582
May 264 124 222 610
June 268 118 200 586
July 263 122 226 611
August 254 125 234 614
September 249 121 224 595
October 253 122 225 601
November 263 115 208 587
December 331 125 156 613
2012
January 330 129 169 627
February 332 125 159 616
March 293 134 194 620
April 273 124 175 572
May 323 132 159 615
June 342 129 147 618
July 358 119 168 646
August 348 122 176 645
September 358 119 168 646
October 360 129 166 654
November 372 121 159 652
December 369 130 148 647
2013
January 377 129 169 675
February 333 113 160 606
March 348 135 163 645
April 345 152 140 637
May 377 159 133 668
June 378 162 131 671
July 386 158 157 701
August 377 158 182 717
September 377 153 175 705Source: Kenya National Bureau of Statistics

Annexes
December 2013 | Edition No. 952
Annex 10: Soft drinks and sugar production
Year Month Soft drinks litres (thousands) Sugar (MT) Galvanized sheets
(MT) Cement (MT)
2011
January 34,446 55,974 22,094 364,432
February 32,457 52,069 22,386 335,247
March 36,156 53,842 22,928 355,858
April 31,162 52,061 20,957 363,035
May 26,622 49,130 24,744 376,246
June 28,910 38,818 24,677 365,494
July 28,478 25,884 24,906 393,149
August 28,580 26,060 24,659 405,546
September 29,674 22,815 17,988 407,838
October 28,540 28,990 16,619 361,941
November 27,366 32,689 22,104 364,789
December 38,962 36,729 24,033 384,853
2012
January 34,317 53,852 22,940 350,615
February 32,009 49,480 19,655 378,453
March 37,363 52,342 21,507 397,009
April 29,331 44,914 20,892 360,540
May 24,359 40,503 22,197 381,026
June 27,391 45,111 17,180 396,951
July 22,073 41,607 21,411 398,458
August 24,458 37,058 23,040 399,873
September 31,113 32,503 23,268 382,141
October 32,540 30,123 20,473 421,579
November 31,497 31,886 21,969 415,866
December 33,067 34,651 21,283 357,212
2013
January 34,246 49,046 22,925 393,921
February 32,026 50,036 20,514 383,683
March 41,694 43,647 25,122 379,114
April 40,207 39,151 22,080 368,067
May 43,021 36,529 21,228 400,690
June 31,777 49,512 22,108 402,621
July 28,705 61,802 - 415,636
August - 58,687 - 407,074Source: Kenya National Bureau of Statistics

December 2013 | Edition No. 9 53
Annexes
Annex 11: Tourism arrivals Year Month JKIA MIA Total
2011
January 79,142 35,770 114,912
February 69,221 31,211 100,432
March 71,734 26,027 97,761
April 66,276 10,181 76,457
May 74,148 5,167 79,315
June 72,944 6,676 79,620
July 131,519 12,037 143,556
August 113,438 23,402 136,840
September 85,397 17,317 102,714
October 88,918 18,741 107,659
November 89,394 19,641 109,035
December 94,355 21,624 115,979
2012
January 83,450 28,134 111,584
February 80,405 24,636 105,041
March 75,668 19,965 95,633
April 72,023 7,531 79,554
May 71,287 4,830 76,117
June 90,972 5,934 96,906
July 108,136 12,671 120,807
August 108,869 17,771 126,640
September 90,153 13,312 103,465
October 95,911 12,942 108,853
November 83,122 16,135 99,257
December 92,365 23,290 115,655
2013
January 85,838 26,446 111,984
February 48,970 24,031 73,001
March 52,103 17,850 69,953
April 61,685 6,739 68,424
May 69,751 4,772 74,523
June 91,083 6,692 97,775
July 112,332 11,480 123,812Source: Kenya National Bureau of Statistics

Annexes
December 2013 | Edition No. 954
Annex 12: New vehicles registrationYear Month All body types
2011
January 18,805
February 16,190
March 16,497
April 12,560
May 15,115
June 21,546
July 19,128
August 18,797
September 16,802
October 17,202
November 17,640
December 15,559
2012
January 13,730
February 12,693
March 13,066
April 8,257
May 16,652
June 15,091
July 22,577
August 16,970
September 12,003
October 15,449
November 14,867
December 11,689
2013
January 20,997
February 16,928
March 17,061
April 20,203
May 25,070
June 23,527
July 23,223
August 15,224
September 15,749
October -Source: Kenya National Bureau of Statistics
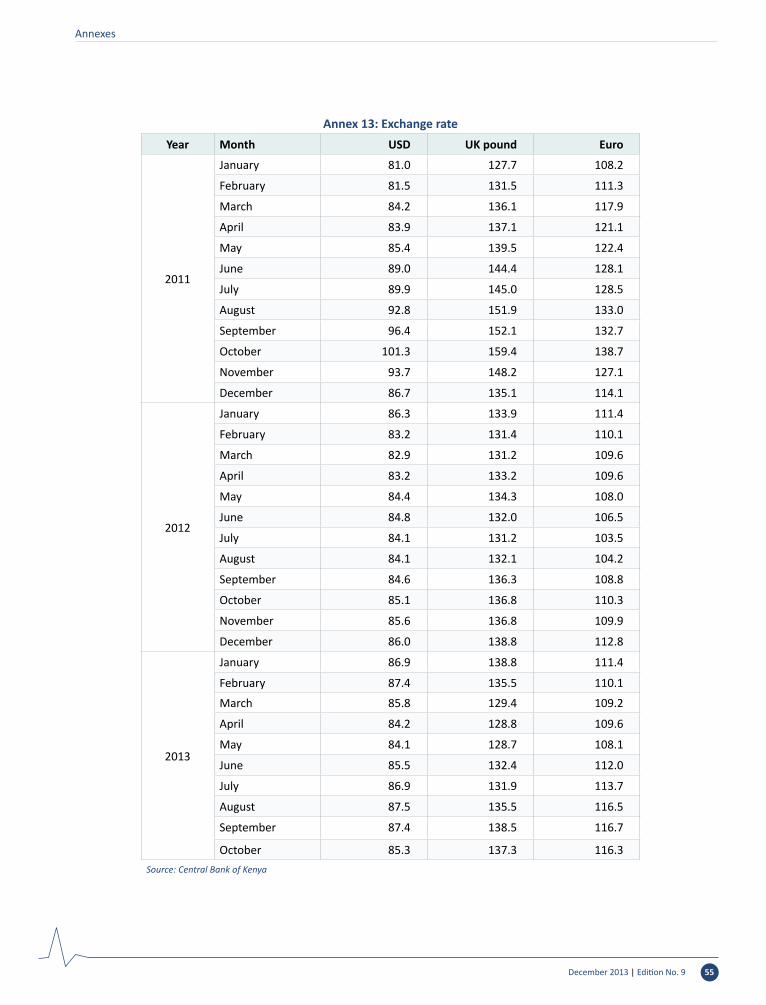
December 2013 | Edition No. 9 55
Annexes
Annex 13: Exchange rate Year Month USD UK pound Euro
2011
January 81.0 127.7 108.2
February 81.5 131.5 111.3
March 84.2 136.1 117.9
April 83.9 137.1 121.1
May 85.4 139.5 122.4
June 89.0 144.4 128.1
July 89.9 145.0 128.5
August 92.8 151.9 133.0
September 96.4 152.1 132.7
October 101.3 159.4 138.7
November 93.7 148.2 127.1
December 86.7 135.1 114.1
2012
January 86.3 133.9 111.4
February 83.2 131.4 110.1
March 82.9 131.2 109.6
April 83.2 133.2 109.6
May 84.4 134.3 108.0
June 84.8 132.0 106.5
July 84.1 131.2 103.5
August 84.1 132.1 104.2
September 84.6 136.3 108.8
October 85.1 136.8 110.3
November 85.6 136.8 109.9
December 86.0 138.8 112.8
2013
January 86.9 138.8 111.4
February 87.4 135.5 110.1
March 85.8 129.4 109.2
April 84.2 128.8 109.6
May 84.1 128.7 108.1
June 85.5 132.4 112.0
July 86.9 131.9 113.7
August 87.5 135.5 116.5
September 87.4 138.5 116.7
October 85.3 137.3 116.3Source: Central Bank of Kenya
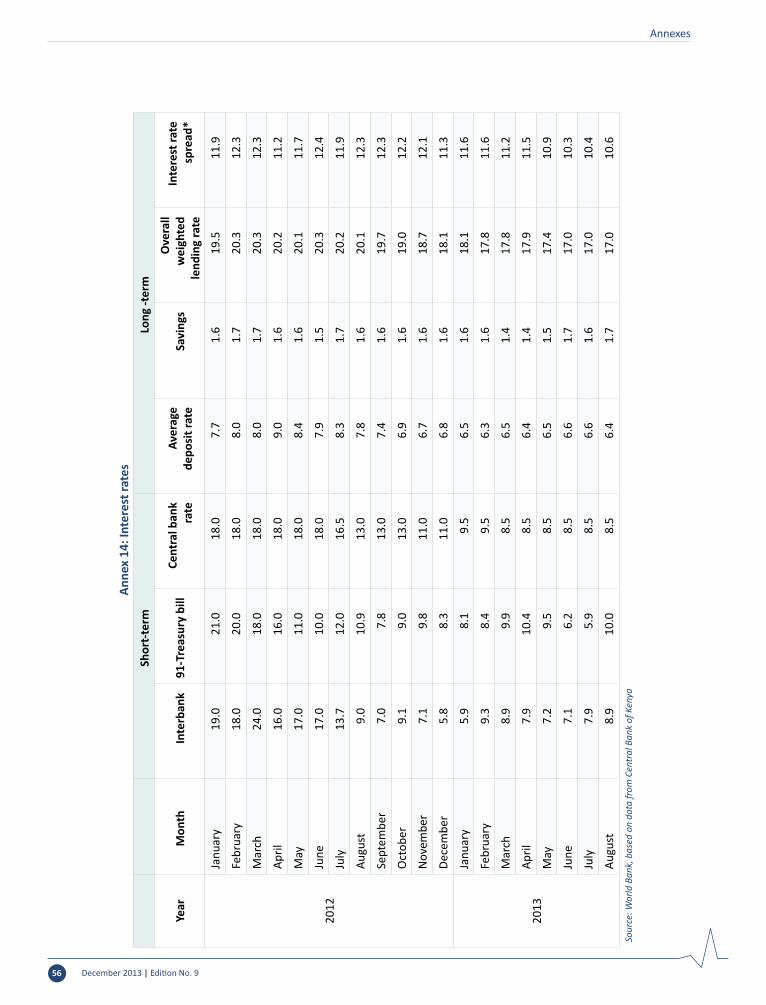
Annexes
December 2013 | Edition No. 956
Anne
x 14
: Int
eres
t rat
esSh
ort-t
erm
Long
-ter
m
Year
Mon
thIn
terb
ank
91-T
reas
ury
bill
Cent
ral b
ank
rate
Aver
age
depo
sit r
ate
Savi
ngs
Ove
rall
wei
ghte
d le
ndin
g ra
te
Inte
rest
rate
sp
read
*
2012
Janu
ary
19.0
21.0
18.0
7.7
1.6
19.5
11.9
Febr
uary
18.0
20.0
18.0
8.0
1.7
20.3
12.3
Mar
ch24
.018
.018
.08.
01.
720
.312
.3
April
16.0
16.0
18.0
9.0
1.6
20.2
11.2
May
17.0
11.0
18.0
8.4
1.6
20.1
11.7
June
17.0
10.0
18.0
7.9
1.5
20.3
12.4
July
13.7
12.0
16.5
8.3
1.7
20.2
11.9
Augu
st9.
010
.913
.07.
81.
620
.112
.3
Sept
embe
r7.
07.
813
.07.
41.
619
.712
.3
Oct
ober
9.1
9.0
13.0
6.9
1.6
19.0
12.2
Nov
embe
r7.
19.
811
.06.
71.
618
.712
.1
Dece
mbe
r5.
88.
311
.06.
81.
618
.111
.3
2013
Janu
ary
5.9
8.1
9.5
6.5
1.6
18.1
11.6
Febr
uary
9.3
8.4
9.5
6.3
1.6
17.8
11.6
Mar
ch8.
99.
98.
56.
51.
417
.811
.2
April
7.9
10.4
8.5
6.4
1.4
17.9
11.5
May
7.2
9.5
8.5
6.5
1.5
17.4
10.9
June
7.1
6.2
8.5
6.6
1.7
17.0
10.3
July
7.9
5.9
8.5
6.6
1.6
17.0
10.4
Augu
st8.
910
.08.
56.
41.
717
.010
.6So
urce
: Wor
ld B
ank,
bas
ed o
n da
ta fr
om C
entr
al B
ank
of K
enya

December 2013 | Edition No. 9 57
Annexes
Anne
x 15
: Cre
dit t
o pr
ivat
e se
ctor
Year
Month
Total private sector annual growth rates
Agriculture
Manufacturing
Trade
Building and construction
Transport and communication
Finance and insurance
Real estate
Mining and quarrying
Private households
Consumer durables
Business services
Other activities
2012
Janu
ary
28.0
24
.7
24.8
27
.4
54.2
40
.9
14.1
38
.3
93.7
24
.4
21.3
-1
5.4
53.7
Febr
uary
26.0
21
.1
22.2
26
.3
65.2
31
.1
22.9
39
.4
28.3
17
.4
19.2
-0
.5
40.2
Mar
ch24
.0
16.6
30
.5
24.0
54
.4
36.3
28
.4
36.7
18
.0
17.4
19
.9
-5.0
23
.7
April
22.6
14
.5
29.7
27
.4
59.4
25
.0
19.3
29
.0
37.9
15
.7
-7.4
-5
.7
47.6
May
21.8
14
.3
26.9
25
.4
51.8
28
.7
17.9
29
.7
10.0
13
.0
16.3
0.
0 25
.0
June
16.1
10
.1
23.4
21
.4
49.9
10
.3
10.0
27
.8
1.8
7.0
14.7
-5
.1
16.2
July
13.5
3.
6 19
.0
10.5
36
.7
-2.9
10
.7
26.4
3.
3 7.
7 13
.7
-1.3
27
.0
Augu
st11
.9
3.9
14.8
7.
8 35
.2
-2.7
16
.2
26.2
-1
0.4
8.1
12.5
0.
5 21
.7
Sept
embe
r7.
7 0.
7 7.
3 3.
2 27
.8
-4.3
20
.3
24.8
-1
3.7
6.0
8.0
0.9
8.8
Oct
ober
7.1
3.7
3.6
2.8
32.5
-2
.6
21.9
22
.7
-24.
0 5.
4 4.
5 2.
2 11
.0
Nov
embe
r9.
1 6.
7 10
.2
4.8
37.0
-1
0.3
15.4
21
.1
-23.
8 7.
6 6.
7 8.
2 15
.0
Dece
mbe
r10
.4
8.1
15.8
10
.6
36.2
-1
3.3
9.3
17.9
-0
.9
8.2
9.4
7.5
10.8
2013
Janu
ary
12.0
13
.3
16.9
9.
0 33
.6
-11.
3 29
.9
16.9
5.
2 7.
3 9.
8 23
.1
10.0
Febr
uary
11.5
8.
0 15
.1
10.1
22
.4
-12.
9 -2
.6
17.3
8.
6 14
.0
8.3
24.5
10
.3
Mar
ch11
.2
11.0
12
.6
10.2
23
.9
-15.
3 -9
.5
15.8
4.
3 11
.0
6.7
24.0
19
.6
April
10.4
4.
2 11
.6
7.6
17.5
-1
2.1
-2.4
13
.9
-17.
7 16
.5
8.2
28.3
15
.4
May
9.5
2.0
4.9
7.3
13.2
-1
3.2
4.0
14.0
-9
.8
24.8
7.
7 37
.4
-0.3
June
12.7
1.
9 5.
5 10
.3
11.1
-7
.2
11.0
17
.2
-16.
0 27
.1
13.5
45
.6
5.2
July
13.5
6.
5 6.
4 11
.0
9.6
6.3
-0.8
17
.5
-13.
4 27
.3
13.6
36
.0
7.3
Augu
st16
.2
3.6
9.6
15.4
11
.4
9.8
-3.5
16
.9
17.4
26
.6
13.3
42
.1
10.9
Sept
embe
r17
.4
-0.5
6.
8 20
.3
13.5
13
.1
-12.
4 14
.7
18.8
32
.9
18.3
35
.5
15.0
Oct
ober
‘Sou
rce:
Cen
tral
Ban
k of
Ken
ya

December 2013 | Edition No. 958
Annexes
Annex 16: Money aggregate
Year Growth rates (yoy) Broad money supply ( M2 ) Money ( M1 ) Money ( M0 ) Reserve money
2011
January 21.5 24.3 18.0 16.1
February 20.5 28.0 17.5 19.7
March 19.4 29.7 18.5 18.0
April 18.2 24.3 19.0 20.1
May 16.6 23.3 17.3 7.9
June 14.5 21.2 17.4 4.8
July 14.7 19.6 19.2 11.5
August 15.2 20.4 19.7 14.8
September 14.3 16.9 18.2 12.5
October 14.0 19.6 16.2 8.1
November 13.8 12.4 16.3 9.5
December 14.1 7.9 11.4 14.5
2012
January 10.6 5.3 13.0 17.2
February 11.2 5.7 12.5 10.4
March 11.5 1.4 13.1 23.2
April 13.0 6.1 8.1 14.7
May 12.5 1.7 10.6 13.2
June 13.1 0.6 6.6 16.7
July 13.9 2.3 3.6 15.6
August 15.0 4.1 5.7 8.4
September 14.3 6.3 5.4 9.7
October 15.8 5.6 3.8 6.7
November 18.1 9.3 7.7 14.0
December 17.2 14.1 7.8 15.1
2013
January 18.2 16.0 11.4 12.2
February 17.0 15.5 17.5 23.9
March 15.7 17.8 15.9 11.5
April 18.5 19.9 13.5 9.5
May 17.8 22.1 14.8 18.9
June 15.6 20.9 16.6 11.7
July 13.9 18.7 15.5 10.3Source: Central Bank of Kenya

December 2013 | Edition No. 9 59
Annexes
Annex 17: Mobile payments
Year Month Number of agents
Number of customers (Millions)
Number of transactions
(Millions)
Value of transactions
(Millions)
2011
January 33,968 16.7 28.2 75.4
February 34,572 16.9 28.5 76.3
March 36,198 17.5 32.7 89.0
April 37,309 17.8 32.4 86.1
May 38,485 17.9 35.3 94.4
June 42,840 18.1 35.8 92.6
July 43,577 18.3 38.0 99.7
August 44,762 18.6 39.3 107.4
September 46,234 18.9 39.2 108.6
October 47,874 19.2 40.6 109.1
November 49,091 19.5 41.2 112.3
December 50,471 19.2 41.7 118.1
2012
January 52,315 18.8 40.2 114.1
February 53,685 18.8 41.8 116.7
March 55,726 19.2 45.8 126.1
April 56,717 19.5 44.4 117.4
May 59,057 19.7 48.0 128.4
June 61,313 19.8 47.9 124.0
July 63,165 19.6 49.4 129.3
August 64,439 19.4 49.7 131.4
September 67,301 19.7 48.9 130.7
October 70,972 20.0 51.9 137.7
November 75,226 20.3 53.6 139.0
December 76,912 21.1 56.0 150.2
2013
January 85,548 21.4 53.4 142.7
February 88,393 21.8 53.5 141.1
March 93,211 22.3 52.4 134.4
April 96,319 23.0 56.0 142.6
May 100,584 23.5 60.3 158.8
June 103,165 23.8 60.0 152.5
July 105,669 24.3 62.7 162.8
August 108,559 23.9 64.7 168.1
September 110,432 24.0 63.4 165.6Source: Central Bank of Kenya.
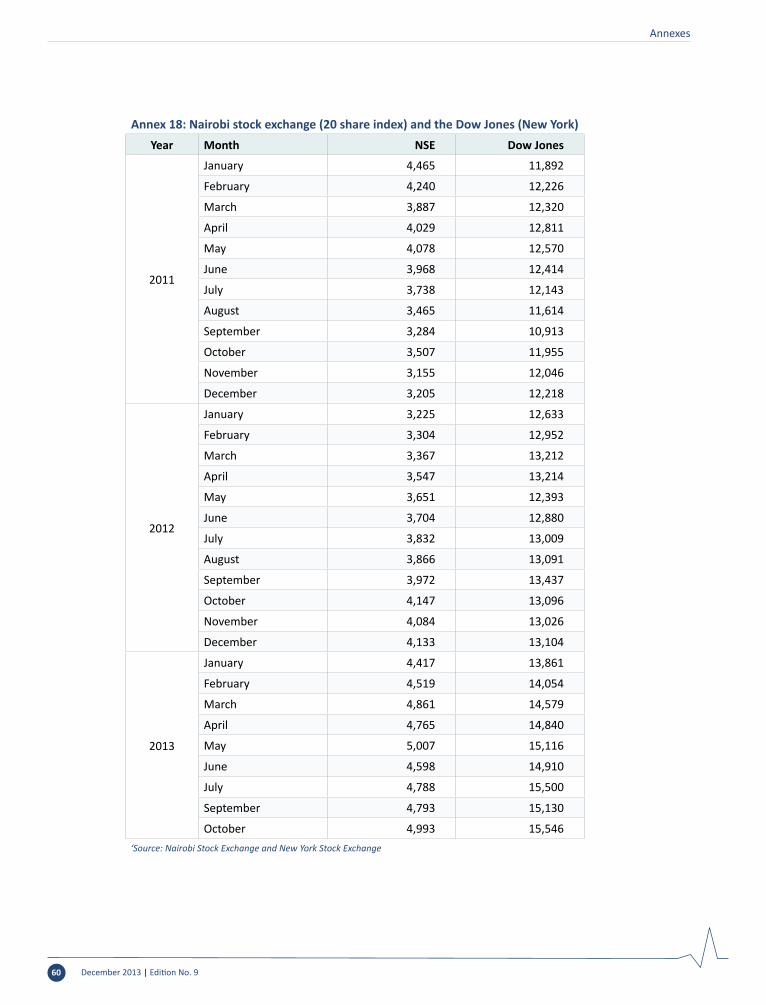
December 2013 | Edition No. 960
Annexes
Annex 18: Nairobi stock exchange (20 share index) and the Dow Jones (New York)Year Month NSE Dow Jones
2011
January 4,465 11,892
February 4,240 12,226
March 3,887 12,320
April 4,029 12,811
May 4,078 12,570
June 3,968 12,414
July 3,738 12,143
August 3,465 11,614
September 3,284 10,913
October 3,507 11,955
November 3,155 12,046
December 3,205 12,218
2012
January 3,225 12,633
February 3,304 12,952
March 3,367 13,212
April 3,547 13,214
May 3,651 12,393
June 3,704 12,880
July 3,832 13,009
August 3,866 13,091
September 3,972 13,437
October 4,147 13,096
November 4,084 13,026
December 4,133 13,104
2013
January 4,417 13,861
February 4,519 14,054
March 4,861 14,579
April 4,765 14,840
May 5,007 15,116
June 4,598 14,910
July 4,788 15,500
September 4,793 15,130
October 4,993 15,546‘Source: Nairobi Stock Exchange and New York Stock Exchange

December 2013 | Edition No. 9 61
Annexes
Annex 19: Nominal and real exchange rateYear Month NEER 2003=100 REER 2003=100
2011
January 114 74
February 115 73
March 119 76
April 120 74
May 122 75
June 127 77
July 128 77
August 133 79
September 135 80
October 141 82
November 130 75
December 119 68
2012
January 119 67
February 116 66
March 115 65
April 115 65
May 115 65
June 115 65
July 114 65
August 114 66
September 116 67
October 117 67
November 117 67
December 118 67
2013
January 119 66
February 119 67
March 116 64
April 114 63
May 113 63
June 115 63
July 116 64Source: Central Bank of Kenya

December 2013 | Edition No. 962
Annexes
Anne
x 20
: Fis
cal p
ositi
on
Actu
al (p
erce
nt o
f GDP
)20
04/0
520
05/0
620
06/0
720
07/0
820
08/0
920
09/1
020
10/1
120
11/1
220
12/1
3*
Reve
nue
and
gran
ts22
.721
.822
.523
.322
.625
.124
.623
.523
.7
Tota
l rev
enue
21.6
20.5
21.6
22.0
21.8
23.9
24.0
23.1
23.1
Tax
reve
nue
19.7
618
.66
19.7
220
.20
20.3
721
.92
21.8
621
.29
21.2
8
Inco
me
tax
7.00
7.17
7.24
7.99
8.24
8.82
9.28
9.63
10.2
0
VAT
5.65
5.02
5.58
5.70
5.67
5.97
6.17
5.65
5.04
Impo
rt d
uty
1.75
1.35
1.60
1.68
1.62
1.68
1.65
1.59
1.57
Exci
se d
uty
3.28
3.31
3.27
3.15
3.12
3.04
2.89
2.4
2.33
Oth
er re
venu
es2.
081.
812.
031.
681.
722.
411.
872.
02.
14
Appr
opria
tion-
in-a
id1.
791.
831.
921.
821.
431.
932.
091.
81.
85
Gran
ts1.
11.
30.
91.
30.
81.
30.
70.
470.
57
Expe
nditu
re a
nd n
et le
ndin
g22
.56
25.2
024
.33
27.2
526
.62
29.5
029
.13
29.2
30.5
Recu
rren
t19
.01
20.1
817
.80
20.5
519
.46
20.7
721
.25
20.0
22.0
7
Wag
es a
nd sa
larie
s7.
857.
397.
387.
446.
947.
027.
126.
97.
49
Inte
rest
pay
men
ts2.
272.
722.
472.
442.
332.
582.
732.
83.
31
Deve
lopm
ent a
nd n
et le
ndin
g3.
394.
464.
666.
707.
168.
737.
879.
38.
16
Defic
it (c
omm
itmen
t bas
is)
Excl
udin
g gr
ants
-1.0
1-4
.71
-2.7
0-5
.23
-4.8
2-5
.65
-5.1
8-6
.15
-7.3
7
Incl
udin
g gr
ants
0.10
-3.3
9-1
.78
-3.9
3-4
.01
-4.3
8-4
.50
-5.6
8-6
.79
Fina
ncin
g-0
.54
2.40
2.10
-0.3
95.
237.
094.
265.
296.
35
Fore
ign
-0.0
50.
08-0
.14
0.32
1.84
0.93
1.02
3.04
1.71
Dom
estic
bor
row
ing
-0.5
02.
322.
24-0
.71
3.39
6.16
3.24
2.26
4.64
Publ
ic d
ebt t
o GD
P (n
et)
`42
.639
.542
.244
.948
.344
.647
.1
Exte
rnal
deb
t23
.322
.624
.223
.225
.923
.423
.0
Dom
estic
deb
t23
.521
.923
.326
.927
.426
.028
.7So
urce
: Nati
onal
Tre
asur
y, 2
013
*As a
t the
end
of J
une
2013
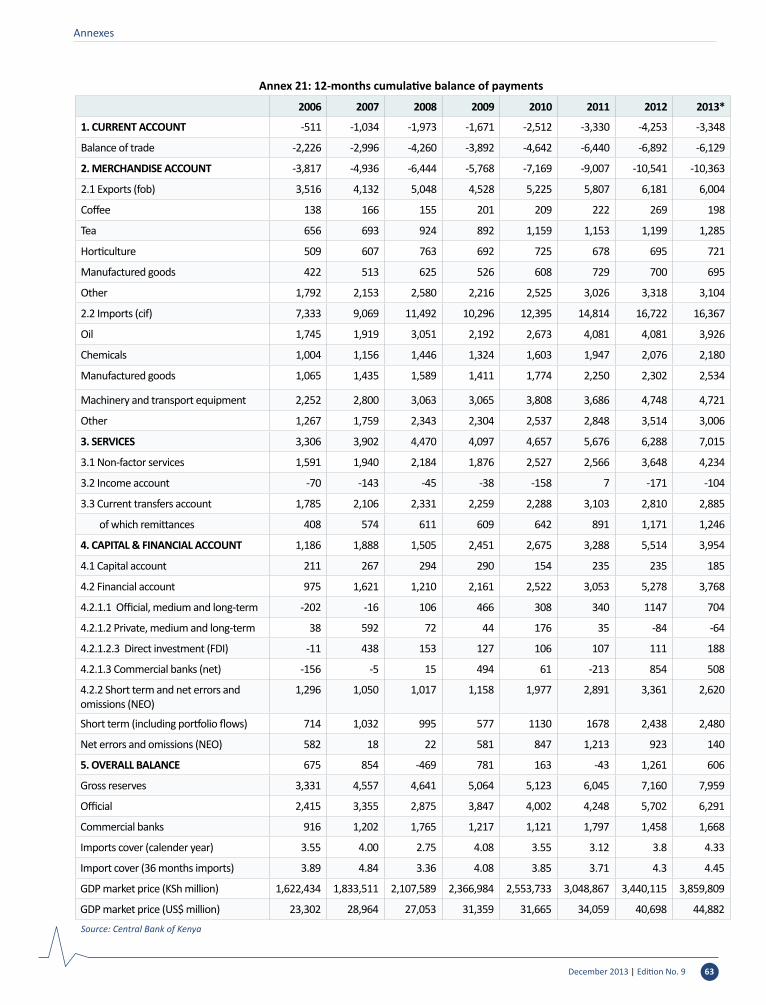
December 2013 | Edition No. 9 63
Annexes
Annex 21: 12-months cumulative balance of payments
2006 2007 2008 2009 2010 2011 2012 2013*
1. CURRENT ACCOUNT -511 -1,034 -1,973 -1,671 -2,512 -3,330 -4,253 -3,348
Balance of trade -2,226 -2,996 -4,260 -3,892 -4,642 -6,440 -6,892 -6,129
2. MERCHANDISE ACCOUNT -3,817 -4,936 -6,444 -5,768 -7,169 -9,007 -10,541 -10,363
2.1 Exports (fob) 3,516 4,132 5,048 4,528 5,225 5,807 6,181 6,004
Coffee 138 166 155 201 209 222 269 198
Tea 656 693 924 892 1,159 1,153 1,199 1,285
Horticulture 509 607 763 692 725 678 695 721
Manufactured goods 422 513 625 526 608 729 700 695
Other 1,792 2,153 2,580 2,216 2,525 3,026 3,318 3,104
2.2 Imports (cif) 7,333 9,069 11,492 10,296 12,395 14,814 16,722 16,367
Oil 1,745 1,919 3,051 2,192 2,673 4,081 4,081 3,926
Chemicals 1,004 1,156 1,446 1,324 1,603 1,947 2,076 2,180
Manufactured goods 1,065 1,435 1,589 1,411 1,774 2,250 2,302 2,534
Machinery and transport equipment 2,252 2,800 3,063 3,065 3,808 3,686 4,748 4,721
Other 1,267 1,759 2,343 2,304 2,537 2,848 3,514 3,006
3. SERVICES 3,306 3,902 4,470 4,097 4,657 5,676 6,288 7,015
3.1 Non-factor services 1,591 1,940 2,184 1,876 2,527 2,566 3,648 4,234
3.2 Income account -70 -143 -45 -38 -158 7 -171 -104
3.3 Current transfers account 1,785 2,106 2,331 2,259 2,288 3,103 2,810 2,885
of which remittances 408 574 611 609 642 891 1,171 1,246
4. CAPITAL & FINANCIAL ACCOUNT 1,186 1,888 1,505 2,451 2,675 3,288 5,514 3,954
4.1 Capital account 211 267 294 290 154 235 235 185
4.2 Financial account 975 1,621 1,210 2,161 2,522 3,053 5,278 3,768
4.2.1.1 Official, medium and long-term -202 -16 106 466 308 340 1147 704
4.2.1.2 Private, medium and long-term 38 592 72 44 176 35 -84 -64
4.2.1.2.3 Direct investment (FDI) -11 438 153 127 106 107 111 188
4.2.1.3 Commercial banks (net) -156 -5 15 494 61 -213 854 508
4.2.2 Short term and net errors and omissions (NEO)
1,296 1,050 1,017 1,158 1,977 2,891 3,361 2,620
Short term (including portfolio flows) 714 1,032 995 577 1130 1678 2,438 2,480
Net errors and omissions (NEO) 582 18 22 581 847 1,213 923 140
5. OVERALL BALANCE 675 854 -469 781 163 -43 1,261 606
Gross reserves 3,331 4,557 4,641 5,064 5,123 6,045 7,160 7,959
Official 2,415 3,355 2,875 3,847 4,002 4,248 5,702 6,291
Commercial banks 916 1,202 1,765 1,217 1,121 1,797 1,458 1,668
Imports cover (calender year) 3.55 4.00 2.75 4.08 3.55 3.12 3.8 4.33
Import cover (36 months imports) 3.89 4.84 3.36 4.08 3.85 3.71 4.3 4.45
GDP market price (KSh million) 1,622,434 1,833,511 2,107,589 2,366,984 2,553,733 3,048,867 3,440,115 3,859,809
GDP market price (US$ million) 23,302 28,964 27,053 31,359 31,665 34,059 40,698 44,882
Source: Central Bank of Kenya

December 2013 | Edition No. 964
Annexes
Annex 22: Growth Outlook2012 2013* 2014* 2015* 2016*
BASELINE
GDP 4.6 5.0 5.1 5.2 5.3
Private consumption 9.0 4.0 3.1 3.1 3.1
Government consumption 5.3 4.6 5.5 4.0 4.0
Gross Fixed investment 0.0 15.6 9.7 11.0 11.7
Exports, GNFS 6.5 6.4 6.1 6.3 6.0
Imports, GNFS 9.0 9.6 5.1 5.5 5.8
Output gap (percent of potential GDP) -0.3 -0.1 0.3 0.8 1.6
HIGH CASE SCENARIO
GDP 4.6 5.0 5.9 6.1 6.1
Private consumption 9.0 4.0 3.1 3.1 3.1
Government consumption 5.3 4.6 7.0 5.5 5.5
Gross fixed investment 0.0 15.6 13.7 15.0 15.0
Exports, GNFS 6.5 6.4 6.0 6.3 6.0
Imports, GNFS 9.0 9.6 6.1 6.7 7.0
Output gap (percent of potential GDP) -0.3 -0.1 0.9 2.0 3.1
LOW CASE SCENARIO
GDP 4.6 5.0 4.2 4.4 4.3
Private consumption 9.0 4.0 3.1 3.1 3.1
Government consumption 5.3 4.6 3.0 3.0 3.0
Gross Fixed investment 0.0 15.6 5.7 7.0 7.0
Exports, GNFS 6.5 6.4 6.0 6.3 6.0
Imports, GNFS 9.0 9.6 4.0 4.4 4.5
Output gap (percent of potential GDP) -0.3 -0.1 -0.4 -0.4 -0.1Source: World Bank*Projections


Produced by Poverty Reduction and Economic Management Unit Africa Region Design by Robert Waiharo
Macroeconomic conditions are favorable in Kenya. Growth is picking up, inflation remains low, the fiscal deficit remains manageable, and the exchange rate remains stable. The economy is estimated to have grown by 5.0 percent in 2013, up from 4.6 percent in 2012, and it is poised to grow 5.1 percent in 2014.
The government has set a bold agenda of reform, outlined in its second Medium Term Plan (MTP II). However, it is the structural reforms currently being implemented that will boost growth in the near term. Reductions in delays in the clearance of cargo at the Port of Mombasa and measures to address the challenges of transporting cargo along the northern corridor will help promote regional trade. Huduma centers, which provide one-stop-shop delivery of services, should enhance the business environment and curb the inefficiency that encourages corruption.
Kenyan banks are leaders in innovation, and they lead many of their counterparts in Africa in the share of lending to small and medium-size enterprises (SMEs) in their portfolios. Nevertheless, SMEs cite the high cost of credit as an obstacle to bank financing. The report looks at the factors behind the high cost of credit and makes recommendations on increasing access to finance by this critical sector.
Join the conversation!
KENYA ECONOMIC UPDATE@KEconomicUpdate
The World BankDelta CenterMenengai Road, Upper HillP. O. Box 30577 – 00100Nairobi, KenyaTelephone: +254 20 2936000Fax: +254 20 2936382Website: www.worldbank.org
Reinvigorating Growth with a Dynamic Banking Sector