ReinSuRance maRket outlook - Health | Aon€¦ · soft market. Reinsurance pricing will remain...
28
September 2009 REINSURANCE MARKET OUTLOOK Resilient Without Assistance reDEFINING Capital | Access | Advocacy | Innovation
Transcript of ReinSuRance maRket outlook - Health | Aon€¦ · soft market. Reinsurance pricing will remain...
September 2009
ReinSuRance maRket outlookResilient Without assistance
reDEFININGCapital | Access | Advocacy | Innovation

2
About Aon Benfield
as the industry leader in treaty, facultative and capital markets, aon Benfield is redefining the role of the reinsurance intermediary
and capital advisor. through our unmatched talent and industry-leading proprietary tools and products, we help our clients to
redefine themselves and their success. aon Benfield offers unbiased capital advice and customized access to more reinsurance and
capital markets than anyone else. as a trusted advocate, we provide local reach to the world’s markets, an unparalleled investment
in innovative analytics, including catastrophe management, actuarial, and rating agency advisory, and the right professionals
to advise clients in making the optimal capital choice for their business. With an international network of more than 4,000
professionals in 50 countries, our worldwide client base is able to access the broadest portfolio of integrated capital solutions and
services. learn more at aonbenfield.com.
3
executive Summary — Resilient Without assistance
the reinsurance market proved resilient in the depths of the credit and liquidity crisis. instead of shrinking, requiring government assistance and canceling commitments to provide critical liquidity to customers as many other financial institutions did near the end of 2008 and in the first half of 2009, reinsurers stood by their cedents and renewed all core reinsurance programs. Reinsurance continued to provide material and accretive capital to insurers - most of whom were suffering from the effects of the credit and liquidity crisis. the pricing of these renewals was less than anticipated and the firming that did occur was focused appropriately on lines that represent peak reinsurer exposures such as u.S. hurricane, u.S. earthquake, european wind, and Japanese typhoon and earthquake. indeed, we did not have a hard market even though the capital of the reinsurance sector was strained more severely from the credit and liquidity crisis than it had been in the wake of Hurricanes andrew in 1992, katrina, Rita and Wilma in 2005 or the terrorist attacks of 2001.
the reinsurance market performed at this exceptionally resilient level without the assistance of any government or any material new flows of capital from its traditional post-loss sources such as private equity firms, hedge funds or strategic investors. this exceptional and unassisted performance demonstrates the high quality of reinsurer capital and liquidity management processes. Still with this exceptional performance, there are calls for actions that produce greater government involvement to provide subsidized reinsurance, insurance or liquidity facilities. Yet, the historical record demonstrates that greater government involvement brings greater reinsurance price volatility rather than stability.
the world’s economies appear to be stabilizing and confidence in future earnings growth, corporate credit worthiness and employment are returning. this confidence has rallied financial markets and partially reinstated both insurer and reinsurer balance sheets. at a macro economic level, this means that reinsurance capacity has increased in 2009 and insurers are incrementally better capitalized than they were at the beginning of the year. the reinsurance market, barring any significant catastrophic events during the balance of the year will soften globally. Just as the credit and liquidity crisis did not cause a hard market, the easing of the crisis will not create a soft market. Reinsurance pricing will remain disciplined at January 1, 2010. increased capacity may be taken up by cedents that did not wish to increase the size of their programs in the face of a firm 2009 reinsurance market. We expect reinsurer share repurchases to return to significant levels in 2010 as they are challenged to fully utilize their capital in businesses that provide the opportunity for reasonable incremental returns.
Expectations for Upcoming Property Catastrophe Renewalsthe speed of the recovery in the equity, corporate debt and hybrid markets has surprised market observers and many still question the sustainability of the current valuations. nevertheless, the recovery has meant that both reinsurance buyers and sellers have seen their capital bases partially restored with both generally holding much greater liquidity positions than they have traditionally. insurer capital bases have grown by eight percent through the first half of 2009 after decreasing by 29 percent in 2008. over the same period, reinsurer capital bases increased by nine percent after decreasing by 15 percent in 2008. With both reinsurance buyer and seller capital bases improving, we expect an orderly renewal of core reinsurance programs at January 1, 2010. an orderly market is defined as one in which cedents can syndicate and place their desired (including 10 to 20 percent incremental) capacity at reasonable prices, terms and conditions. of course the occurrence of catastrophe events before the January negotiations are completed can lead to changes in market conditions.
Because the united States continues to represent the reinsurance industry’s peak aggregation for both hurricanes and earthquakes, we provide our views on how the reinsurance market may change at January 1, 2010 given light, medium and heavy u.S. catastrophe loss outcomes for the full 2009 year. modifications to frequency for hurricane models and those reflecting the recent uSGS updates are likely to have varying impacts to individual insurer portfolios in the u.S. for January 2010 renewals. While reinsurance rates for property catastrophe protection are still expected to decline in a light loss scenario, these modifications should assist clients in securing capacity at favorable pricing levels.
REINSURANCE MARKET OUTLOOK
4
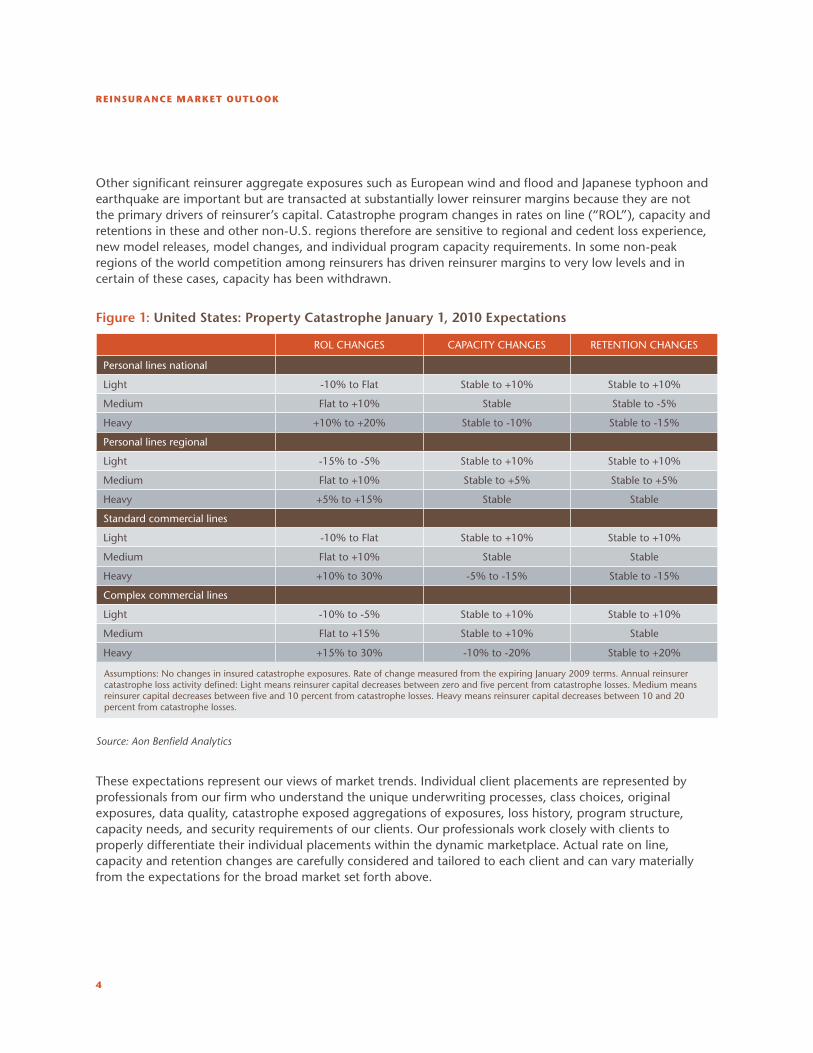
other significant reinsurer aggregate exposures such as european wind and flood and Japanese typhoon and earthquake are important but are transacted at substantially lower reinsurer margins because they are not the primary drivers of reinsurer’s capital. catastrophe program changes in rates on line (“Rol”), capacity and retentions in these and other non-u.S. regions therefore are sensitive to regional and cedent loss experience, new model releases, model changes, and individual program capacity requirements. in some non-peak regions of the world competition among reinsurers has driven reinsurer margins to very low levels and in certain of these cases, capacity has been withdrawn.
Figure 1: United States: Property Catastrophe January 1, 2010 Expectations
Rol cHanGeS caPacitY cHanGeS Retention cHanGeS
Personal lines national
light -10% to Flat Stable to +10% Stable to +10%
medium Flat to +10% Stable Stable to -5%
Heavy +10% to +20% Stable to -10% Stable to -15%
Personal lines regional
light -15% to -5% Stable to +10% Stable to +10%
medium Flat to +10% Stable to +5% Stable to +5%
Heavy +5% to +15% Stable Stable
Standard commercial lines
light -10% to Flat Stable to +10% Stable to +10%
medium Flat to +10% Stable Stable
Heavy +10% to 30% -5% to -15% Stable to -15%
complex commercial lines
light -10% to -5% Stable to +10% Stable to +10%
medium Flat to +15% Stable to +10% Stable
Heavy +15% to 30% -10% to -20% Stable to +20%
assumptions: no changes in insured catastrophe exposures. Rate of change measured from the expiring January 2009 terms. annual reinsurer catastrophe loss activity defined: light means reinsurer capital decreases between zero and five percent from catastrophe losses. medium means reinsurer capital decreases between five and 10 percent from catastrophe losses. Heavy means reinsurer capital decreases between 10 and 20 percent from catastrophe losses.
Source: Aon Benfield Analytics
these expectations represent our views of market trends. individual client placements are represented by professionals from our firm who understand the unique underwriting processes, class choices, original exposures, data quality, catastrophe exposed aggregations of exposures, loss history, program structure, capacity needs, and security requirements of our clients. our professionals work closely with clients to properly differentiate their individual placements within the dynamic marketplace. actual rate on line, capacity and retention changes are carefully considered and tailored to each client and can vary materially from the expectations for the broad market set forth above.

AON BENfIELd
5
United Kingdomthe u.k. property catastrophe market has seen prices soften slightly since the first quarter of 2009. Several factors have contributed to this including a (thus far) benign hurricane season, improving reinsurer results, and an excess of open market capacity, particularly at July 1.
Prices in the first quarter were up between zero and five percent on a risk adjusted basis. at July 1, prices were flat or witnessed slight reductions. increasing confidence in lower estimates of catastrophe losses from recent releases of catastrophe models has encouraged a trend of reduced ground-up coverage. Retention levels in the market remain relatively constant.
Germanythe economic capital base of insurers in Germany – particularly life companies – has been negatively affected by the financial market crisis, but only in isolated cases have solvency margins reduced to levels close to the required minimum. However, lower earnings on investments and reduced sales of life policies, together with continuing price competition in the non-life sector, has affected the players in those segments.
We expect a modest nominal increase in demand for non-life catastrophe reinsurance cover, mainly to protect balance sheets and, to a lesser extent, to help stabilize earnings. Retention levels are expected to be mostly stable.
current indications are that there will be sufficient capacity for wind risk with broadly stable pricing on a risk-adjusted basis. this assumes an average wind season for the hurricane exposed markets in the u.S.
For the casualty market, with the exception of D&o for financial institutions as well as property per-risk covers, there is again sufficient capacity available. We expect rates and retentions generally to be stable.
FranceDemand for vertical capacity is expected to remain broadly unchanged. increases, if any, are expected to be modest. losses from Windstorm klaus are expected to generate some modest price increases on lower layers, although the positive results of the last five years should mitigate any major increases. client retention levels should be mostly unchanged, however there may be increases on some loss-exposed programs where clients seek to offset price increases from reinsurers. Reinsurance capacity is expected to be stable, although additional capacity could be attracted if higher prices are carried by the market.

REINSURANCE MARKET OUTLOOK
6
Sector analysis
While property catastrophe reinsurance capacity and pricing are discussed earlier, the following provides updates in a variety of other significant reinsurance market segments.
Property Per Risku.S. and global program property per risk reinsurance pricing continues to focus on minimizing property catastrophe exposure to treaties. Pricing remains based on experience and those programs with relatively low catastrophe exposure and good experience should see margins flat to down and ceding commissions flat to up for 2010. in both the primary and reinsurance segment, pricing has yet to turn a corner as a few companies have continued to provide significant capacity at terms at (or below) renewal pricing in each segment. this has led many insurers and reinsurers to significantly reduce participations or walk away from policies/programs where final terms and pricing are less than prices they had quoted.
Medical Professional Liabilitythe 2009 reinsurance market for u.S. medical professional liability business can be characterized as very stable. insurance rates for physician and surgeon classes have largely stabilized after a number of consecutive years of rate decreases. Healthcare facility premiums, especially for excess layers, continue to decrease but at a more moderate pace. loss frequency remains at all-time low levels, while loss severity continues to increase moderately. the marketplace is extremely competitive with specialty insurers, commercial insurers, risk retention groups, and captives all actively writing these classes.
Reinsurance rates have been stable during 2009, with a slight increase in ceding commissions for pro rata placements with good experience. Reinsurers have generally followed the primary rate reductions implemented by insurers over the past number of years. Reinsurance capacity is abundant, with reinsurers in each of the united States, london, europe, and Bermuda markets actively pursuing the business.
the current outlook for 2010 is an ongoing stable market, with the possibility for modest insurance and reinsurance rate increases to address diminished investment returns.
Directors and Officers Liabilitythe first half of 2009 market for u.S. and global corporation D&o liability saw relatively stable supply with slightly increased demand. this was driven in part by reinsurance programs for new entrants and increased placements on existing reinsurance programs.
Reinsurance pricing in general was flat to slightly up for ceding companies as measured by actual costs plus other terms and conditions. characteristics of underlying portfolios, historical experience and classes of business written are taken into account when measuring pricing changes.
Reinsurance markets now recognize results from 2003 through 2006 accident years as being positive yet are carefully watching sub-prime, madoff and other systemic types of exposures to see if they ultimately translate into a meaningful loss ratio impact to 2007 and 2008 accident years.
underlying insurance rates are up in the financial institutions area and essentially flat in commercial lines.
our forecast for 2010 is that demand will be stable and supply will be influenced by a combination of underlying rate levels and views of the ultimate settlement values of sub-prime, credit and madoff events. absent significant rate hardening, capacity is expected to be stable. individual portfolio characteristics are understood and differentiated by reinsurers.

AON BENfIELd
7
Workers’ Compensationthe u.S. workers’ compensation reinsurance market remains stable. While capacity for working layer and catastrophe protections are provided by two distinct reinsurance communities, ample supply is available in both markets and we expect this to continue through January placements.
Working layer business has been pressed by reinsurers with five to 10 percent rate increases resulting from the lower investment yields available in the marketplace. these rate increase requests have only been successful when account loss ratios have indicated a need. Rate decreases, however, have been few as reinsurers feel they are near technical minimum rate levels.
the worker’s compensation catastrophe reinsurance market has been competitive in terms of both price and conditions. another year of relatively quiet multi-person losses has seen the Rol decrease on most business. maximum limits for any one life have, in general, increased and the capacity for terrorism and nuclear, biological, chemical, and radioactive protection has increased substantially.
the new workers’ compensation model changes released in august 2009 may well place additional downward pressure on catastrophe rates for the January 1 renewal season.
Motororiginal rates for u.k. motor are increasing steadily as the impact of a poor investment environment and unexciting underwriting results continues to bite. insurers are also still grappling with the impact of an increasing number of Periodical Payment order settlements on original claims – how these are treated and the impact on claims reserves is a continuing debate with reinsurers. Reinsurance renewals during 2009 have been mixed – accounts that have shown loss deterioration have attracted price increases between five and 10 percent. accounts showing better experience have generally renewed flat with some small reductions achieved where merited. market capacity remains plentiful and the combination of new market entrants and a lessening concern about the dominance of a few major market players will continue to put pressure on prices. Deductible levels have remained stable.
Structure of placements in France is expected to be stable. Some price increases are expected, but loss-affected programs might suffer further experience-related price rises over and above the market trend in the range of five to 10 percent.
in Germany, the markedly lower investment income on reserves held by reinsurers is a driver for price increases or at least a tightening of terms. We expect that well-rated, new market participants may start to become interested in this segment if terms for reinsurers improve for January 1, 2010.
Life Variable Annuities and Other Guaranteed Retirement ProductsVariable annuity (“Va”) reinsurance capacity dried up as key players exited the market as a result of the financial crisis. For some direct writers, reinsurance was the risk management solution of choice and of practice. increasingly, direct writers have grown to rely on internal dynamic and static hedging programs to mitigate the economic, accounting and capital risks associated with Va’s. the operational challenges associated with internal hedging programs are numerous. Given recent hedge program results and volatility in the financial markets, several direct writers have looked for external expertise and third party review to improve hedge program effectiveness and to protect capital in these uncertain times. in response to the market conditions, direct writers have retooled their product offerings at the margin, by: raising prices, in some cases several times over the past year; reducing the richness of the offered financial guarantee; substituting index funds for actively managed funds to reduce basis risk; or exiting the marketplace entirely in some cases.
REINSURANCE MARKET OUTLOOK
8
We believe that a radical change in Va product design must occur before Va reinsurance capacity will be restored in the marketplace. this means that direct writers will have to use cutting-edge, high performance computing and quantitative modeling to better and more thoroughly measure and test the profitability and risks associated with such products. Reinsurers will certainly need these tools, as they are more likely to put treaty provisions such as annual aggregate limits into their reinsurance agreements, which are notoriously difficult to model but nevertheless need to be properly modeled and priced. the upcoming regulatory changes, such as Variable annuities commissioners’ annuity Reserve Valuation methods (VacaRVm) and Solvency ii, will also put pressure on direct writers and reinsurers, in terms of modeling and computing power, given the need for adequate runtimes and the required nested stochastic simulations.
Credit the global economic crisis caused credit insurers and reinsurers to report net losses in 2008. it is likely that 2009 will also be a difficult year, although the significant improvements to reinsurance terms at the last renewal mean that reinsurers may fare better than insurers.
the severity of the economic crisis has required credit insurers to take drastic portfolio action to reduce claims levels, but the run-off of cancelled exposures during 2009 has produced significant (although not catastrophic) worsening of loss ratios for the large whole turnover credit insurers. media, rating agency and, in some cases, government comment and speculation have added to the general unease surrounding credit insurance. nevertheless, credit insurance like other lines, is a cyclical business that produced excellent loss ratios in the period 2003 through 2007. Furthermore, the underwriting measures introduced have begun to have an impact on all the key performance indicators and reducing loss ratios are anticipated. insurers therefore believe that 2010 will be a profitable year, at the underlying level. this current cycle is unlikely to be different from most others in that a five year period of profit is followed by two years of losses.
the good results in the years 2003 through 2007 attracted substantial capacity to the market, but this was reversed by the losses of 2008. Renewals in 2009 saw lower capacity and tighter terms and conditions. Swiss Re, formerly a major writer, recently announced a dramatic reduction of its aggregate exposure to credit. as a result, many believe there will be a shortage of reinsurance capacity in 2010 forcing further improvements in terms.
While many writers of credit, political risk and surety continue to show good results, the poor economic climate, the recent correlation between credit insurance losses and depletion of asset values, and stories of potential losses in emerging market credits, continue to draw negative attention to these lines of business. Despite the fact that results of the largest writers are anticipated to return to profit in 2010, it is highly unlikely there will be any premature easing of either primary or reinsurance terms.
Marine and Energya disproportionately large share of 2008’s Hurricane ike losses in the Gulf of mexico fell on reinsurers, causing price increases and a significant reduction in capacity for 2009. With a limited miss-factor in offshore compared with regional property catastrophe, some reinsurers have looked to redeploy capital in other areas to achieve risk diversification. at the same time, some offshore underwriters considerably reduced purchase of wind cover.

AON BENfIELd
9
looking to 2010, renewal pricing will be heavily influenced by the windstorm activity within the Gulf of mexico during the remainder of the year. if it continues to be a benign season, rates are unlikely to harden and any reduction in demand may lead to some softening if client retentions increase. conditions are expected to remain stable for non-energy-exposed business. capacity may contract further for Gulf of mexico wind-exposed programs but should remain broadly unchanged for all other classes.
Reduction in the transportation of commodities has resulted in the laying up of vessels and the reduction in cargo insured values. However, cargo values have recently begun to increase, with a recovery in activity levels leading to some uncertainties for insurers when making 2010 business plans. Reinsurance capacity requirements and structures therefore are still being considered.
Facultativethus far in 2009, facultative rates achieved by our clients have been better than they had been led to believe by the markets, as evidenced by the aon Benfield Fac index (“aBFi”). the interesting dynamic that manifested itself in the second quarter of 2009 was the continued battle for market share resulting in a divergence in global pricing. Rates continued to fall in regional markets as they fought to keep the business local, while the business that needed to access global capacity via london saw modest rate increases.
the market has seen a wide variation in rates in different european countries during 2009. While rates were flat in the French and Dutch domestic markets, they moved down a further five percent in the nordic markets but up 10 percent in Germany. all of these countries paid increased rates of up to five percent when placed in london. the third quarter in europe is predicted to yield flat rates (other than Germany, which still indicates a 10 percent increase).
an abundance of capacity and competition for u.k. business has again driven rates down in the u.k. by five percent. Data reported to the aBFi suggests a flat third quarter before the major end-of-year renewals season kicks in.
While data received to date suggests that u.S. property catastrophe rates will see double digit increases both in the domestic and london markets, the abundant capacity in the overall market may soften the level of price increase achieved.
REINSURANCE MARKET OUTLOOK
10
Reinsurers Rebuilding Supply
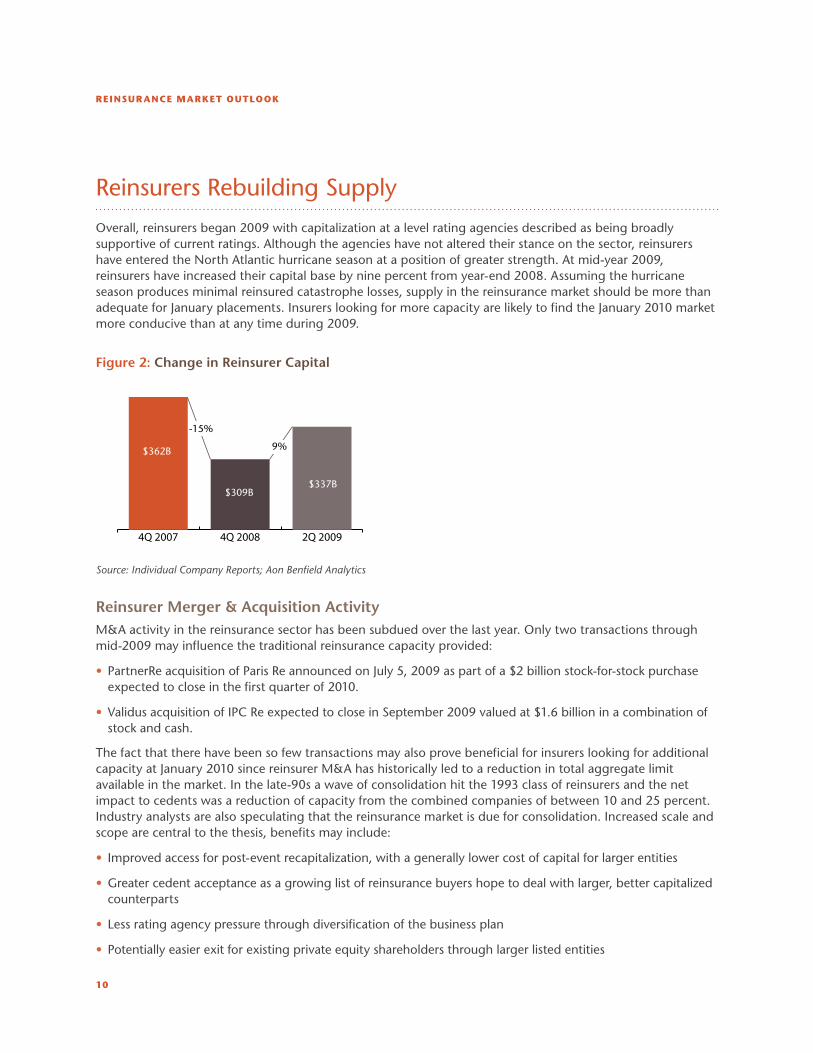
overall, reinsurers began 2009 with capitalization at a level rating agencies described as being broadly supportive of current ratings. although the agencies have not altered their stance on the sector, reinsurers have entered the north atlantic hurricane season at a position of greater strength. at mid-year 2009, reinsurers have increased their capital base by nine percent from year-end 2008. assuming the hurricane season produces minimal reinsured catastrophe losses, supply in the reinsurance market should be more than adequate for January placements. insurers looking for more capacity are likely to find the January 2010 market more conducive than at any time during 2009.
Figure 2: Change in Reinsurer Capital
2Q 20094Q 20084Q 2007
-15%
9%$362B
$309B$337B
Source: Individual Company Reports; Aon Benfield Analytics
Reinsurer Merger & Acquisition Activitym&a activity in the reinsurance sector has been subdued over the last year. only two transactions through mid-2009 may influence the traditional reinsurance capacity provided:
PartnerRe acquisition of Paris Re announced on July 5, 2009 as part of a $2 billion stock-for-stock purchase •expected to close in the first quarter of 2010.
Validus acquisition of iPc Re expected to close in September 2009 valued at $1.6 billion in a combination of •stock and cash.
the fact that there have been so few transactions may also prove beneficial for insurers looking for additional capacity at January 2010 since reinsurer m&a has historically led to a reduction in total aggregate limit available in the market. in the late-90s a wave of consolidation hit the 1993 class of reinsurers and the net impact to cedents was a reduction of capacity from the combined companies of between 10 and 25 percent. industry analysts are also speculating that the reinsurance market is due for consolidation. increased scale and scope are central to the thesis, benefits may include:
improved access for post-event recapitalization, with a generally lower cost of capital for larger entities•
Greater cedent acceptance as a growing list of reinsurance buyers hope to deal with larger, better capitalized •counterparts
less rating agency pressure through diversification of the business plan•
Potentially easier exit for existing private equity shareholders through larger listed entities•
AON BENfIELd
11
moody’s commented “recent consolidation activity has placed more pressure on smaller reinsurers… to increase scale to remain strongly positioned with brokers and clients… and to maintain strong credit fundamentals.” the agency also said “smaller reinsurers may also find accessing capital more challenging following recent market turmoil.” it further observed that smaller reinsurers “may have less opportunity to diversify their business, as buyers of longer-tail reinsurance tend to be more sensitive to size.”1
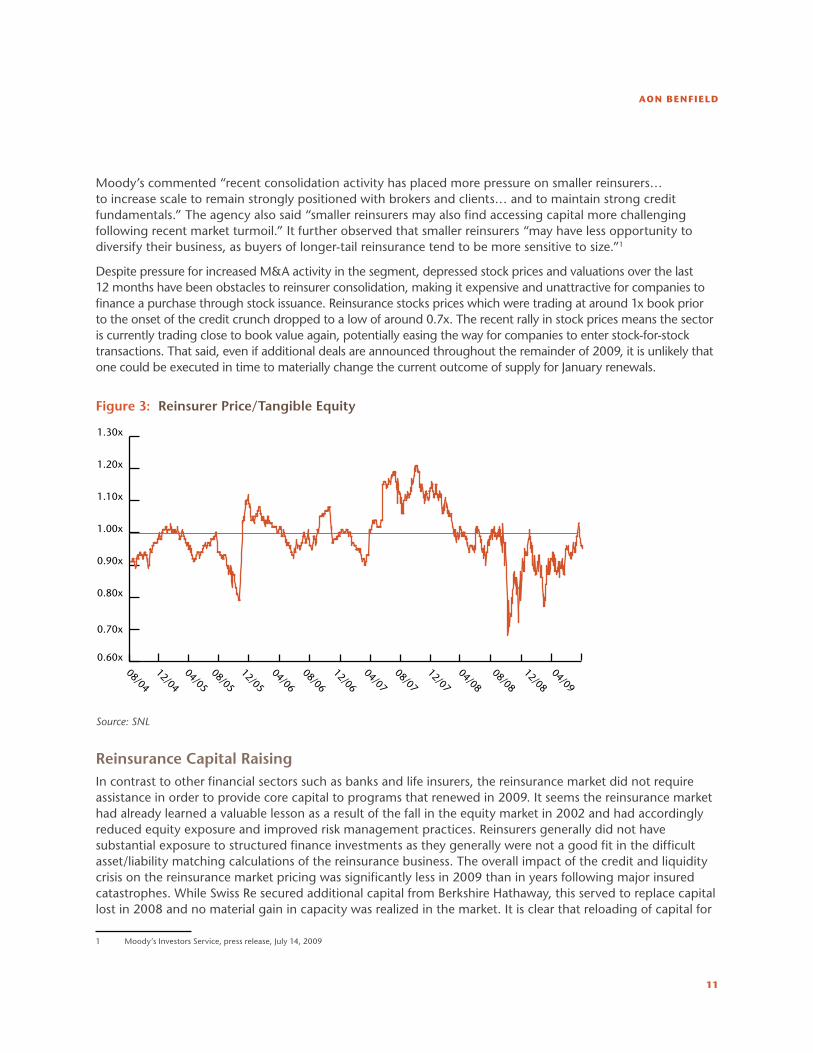
Despite pressure for increased m&a activity in the segment, depressed stock prices and valuations over the last 12 months have been obstacles to reinsurer consolidation, making it expensive and unattractive for companies to finance a purchase through stock issuance. Reinsurance stocks prices which were trading at around 1x book prior to the onset of the credit crunch dropped to a low of around 0.7x. the recent rally in stock prices means the sector is currently trading close to book value again, potentially easing the way for companies to enter stock-for-stock transactions. that said, even if additional deals are announced throughout the remainder of 2009, it is unlikely that one could be executed in time to materially change the current outcome of supply for January renewals.
Figure 3: Reinsurer Price/Tangible Equity
0.60x
0.70x
0.80x
0.90x
1.00x
1.10x
1.20x
1.30x
08/04
12/04
04/05
08/05
12/05
04/06
08/06
12/06
04/07
08/07
12/07
04/08
08/08
12/08
04/09
Source: SNL
Reinsurance Capital Raisingin contrast to other financial sectors such as banks and life insurers, the reinsurance market did not require assistance in order to provide core capital to programs that renewed in 2009. it seems the reinsurance market had already learned a valuable lesson as a result of the fall in the equity market in 2002 and had accordingly reduced equity exposure and improved risk management practices. Reinsurers generally did not have substantial exposure to structured finance investments as they generally were not a good fit in the difficult asset/liability matching calculations of the reinsurance business. the overall impact of the credit and liquidity crisis on the reinsurance market pricing was significantly less in 2009 than in years following major insured catastrophes. While Swiss Re secured additional capital from Berkshire Hathaway, this served to replace capital lost in 2008 and no material gain in capacity was realized in the market. it is clear that reloading of capital for
1 moody’s investors Service, press release, July 14, 2009
REINSURANCE MARKET OUTLOOK
12
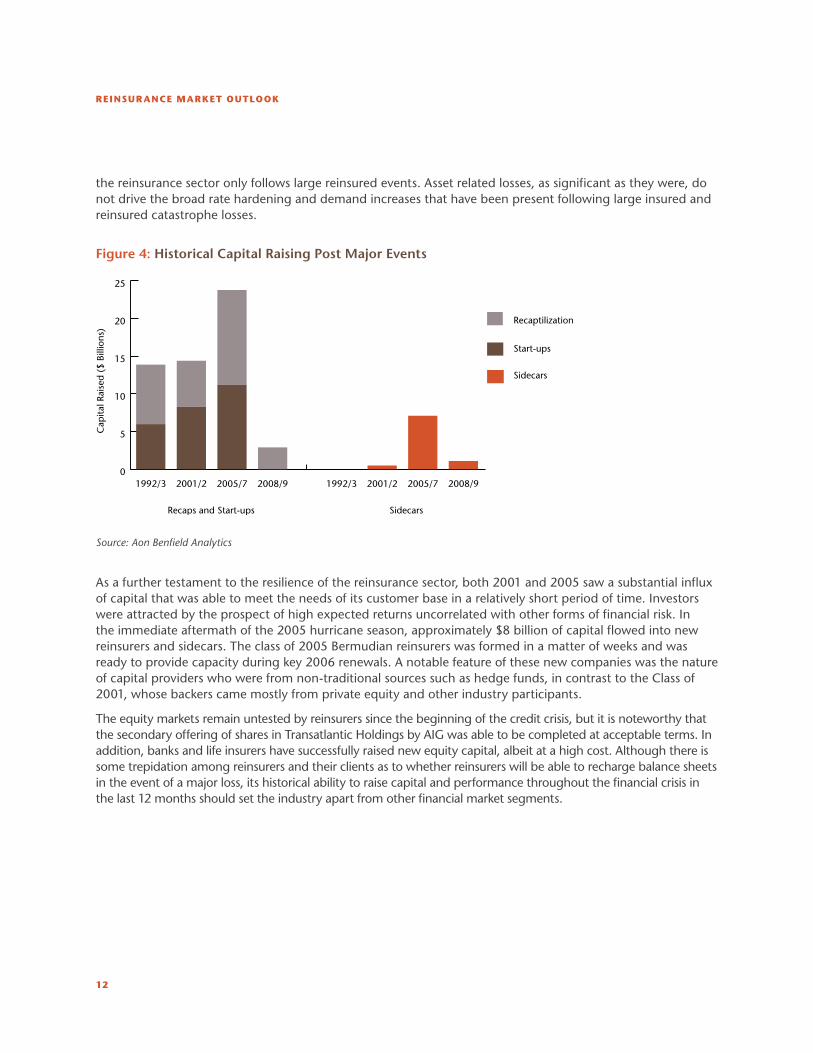
the reinsurance sector only follows large reinsured events. asset related losses, as significant as they were, do not drive the broad rate hardening and demand increases that have been present following large insured and reinsured catastrophe losses.
Figure 4: Historical Capital Raising Post Major Events
0
5
10
15
20
25
Sidecars
Recaptilization
Start-ups
2008/92005/72001/21992/32008/92005/72001/21992/3
Cap
ital R
aise
d (
$ Bi
llion
s)
Recaps and Start-ups Sidecars
Source: Aon Benfield Analytics
as a further testament to the resilience of the reinsurance sector, both 2001 and 2005 saw a substantial influx of capital that was able to meet the needs of its customer base in a relatively short period of time. investors were attracted by the prospect of high expected returns uncorrelated with other forms of financial risk. in the immediate aftermath of the 2005 hurricane season, approximately $8 billion of capital flowed into new reinsurers and sidecars. the class of 2005 Bermudian reinsurers was formed in a matter of weeks and was ready to provide capacity during key 2006 renewals. a notable feature of these new companies was the nature of capital providers who were from non-traditional sources such as hedge funds, in contrast to the class of 2001, whose backers came mostly from private equity and other industry participants.
the equity markets remain untested by reinsurers since the beginning of the credit crisis, but it is noteworthy that the secondary offering of shares in transatlantic Holdings by aiG was able to be completed at acceptable terms. in addition, banks and life insurers have successfully raised new equity capital, albeit at a high cost. although there is some trepidation among reinsurers and their clients as to whether reinsurers will be able to recharge balance sheets in the event of a major loss, its historical ability to raise capital and performance throughout the financial crisis in the last 12 months should set the industry apart from other financial market segments.
AON BENfIELd
13
capital markets Stay the course
While capital markets have suffered their first decline in issuance in 2009, this trend is not expected to continue. Structural issues related to the lehman bankruptcy have been resolved for new issues and investors continue to see the diversification value of the asset class.
in addition to a potential decrease in traditional capacity through mergers and acquisitions in the reinsurance market, an increasing number of customers are seeking to further diversify their counterparty risk and are looking to the capital markets for that capacity.
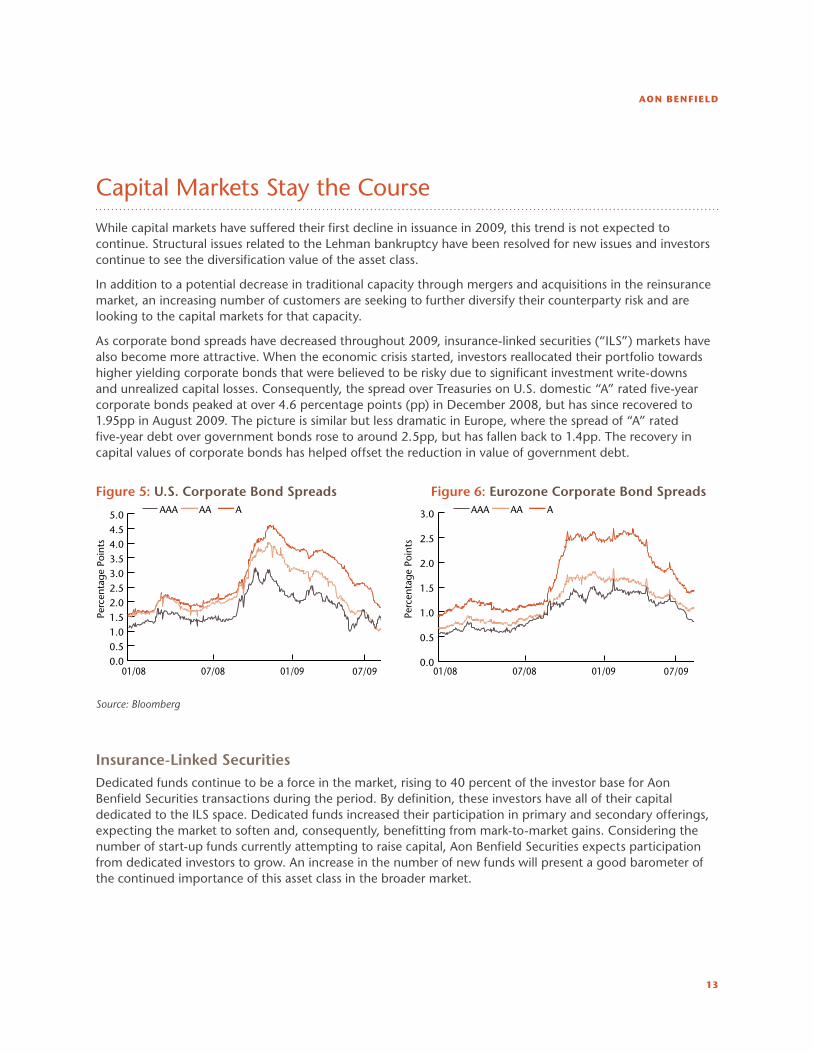
as corporate bond spreads have decreased throughout 2009, insurance-linked securities (“ilS”) markets have also become more attractive. When the economic crisis started, investors reallocated their portfolio towards higher yielding corporate bonds that were believed to be risky due to significant investment write-downs and unrealized capital losses. consequently, the spread over treasuries on u.S. domestic “a” rated five-year corporate bonds peaked at over 4.6 percentage points (pp) in December 2008, but has since recovered to 1.95pp in august 2009. the picture is similar but less dramatic in europe, where the spread of “a” rated five-year debt over government bonds rose to around 2.5pp, but has fallen back to 1.4pp. the recovery in capital values of corporate bonds has helped offset the reduction in value of government debt.
Figure 5: U.S. Corporate Bond Spreads Figure 6: Eurozone Corporate Bond Spreads
01/08 07/08 01/09 07/09
AAAAAA
0.00.51.01.52.02.53.03.54.04.55.0
Perc
enta
ge
Poin
ts
01/08 07/08 01/09 07/09
AAAAAA
Perc
enta
ge
Poin
ts
0.0
0.5
1.0
1.5
2.0
2.5
3.0
Source: Bloomberg
Insurance-Linked SecuritiesDedicated funds continue to be a force in the market, rising to 40 percent of the investor base for aon Benfield Securities transactions during the period. By definition, these investors have all of their capital dedicated to the ilS space. Dedicated funds increased their participation in primary and secondary offerings, expecting the market to soften and, consequently, benefitting from mark-to-market gains. considering the number of start-up funds currently attempting to raise capital, aon Benfield Securities expects participation from dedicated investors to grow. an increase in the number of new funds will present a good barometer of the continued importance of this asset class in the broader market.
REINSURANCE MARKET OUTLOOK
14
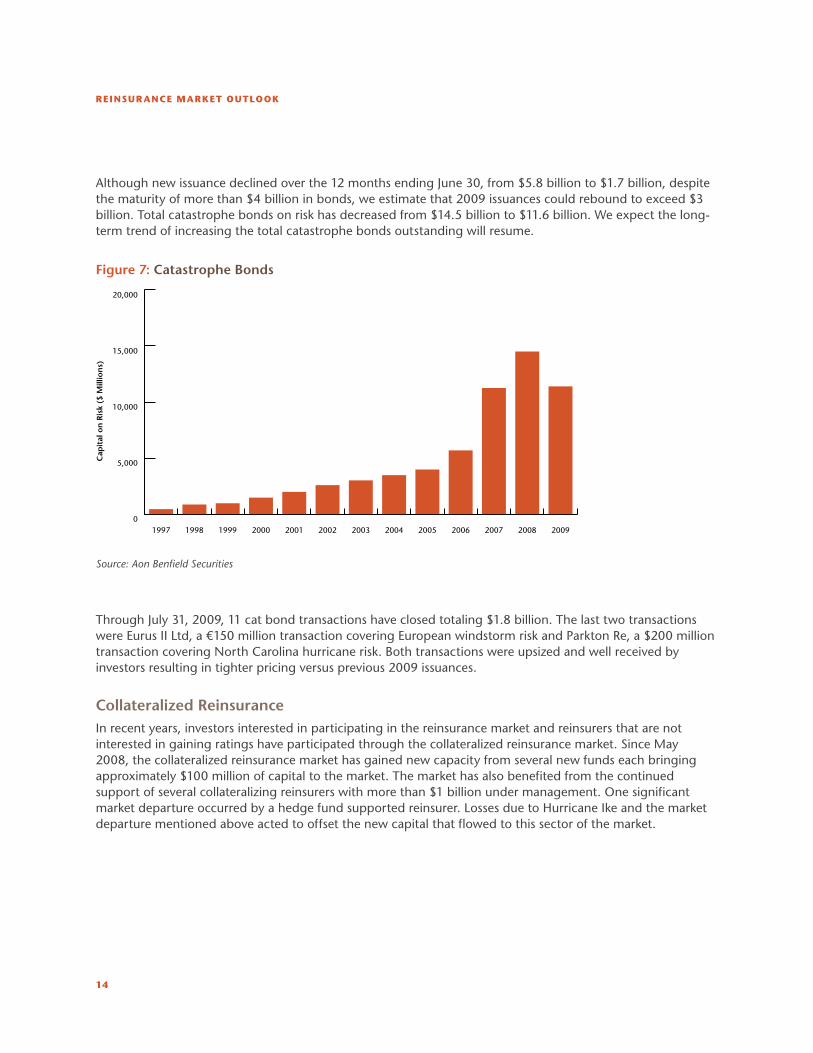
although new issuance declined over the 12 months ending June 30, from $5.8 billion to $1.7 billion, despite the maturity of more than $4 billion in bonds, we estimate that 2009 issuances could rebound to exceed $3 billion. total catastrophe bonds on risk has decreased from $14.5 billion to $11.6 billion. We expect the long-term trend of increasing the total catastrophe bonds outstanding will resume.
Figure 7: Catastrophe Bonds
0
5,000
10,000
15,000
20,000
2009200820072006200520042003200220012000199919981997
Cap
ital
on
Ris
k ($
Mill
ion
s)
Source: Aon Benfield Securities
through July 31, 2009, 11 cat bond transactions have closed totaling $1.8 billion. the last two transactions were eurus ii ltd, a €150 million transaction covering european windstorm risk and Parkton Re, a $200 million transaction covering north carolina hurricane risk. Both transactions were upsized and well received by investors resulting in tighter pricing versus previous 2009 issuances.
Collateralized Reinsurance in recent years, investors interested in participating in the reinsurance market and reinsurers that are not interested in gaining ratings have participated through the collateralized reinsurance market. Since may 2008, the collateralized reinsurance market has gained new capacity from several new funds each bringing approximately $100 million of capital to the market. the market has also benefited from the continued support of several collateralizing reinsurers with more than $1 billion under management. one significant market departure occurred by a hedge fund supported reinsurer. losses due to Hurricane ike and the market departure mentioned above acted to offset the new capital that flowed to this sector of the market.
AON BENfIELd
15
accretive Reinsurance Still in Demand
While insurance companies have also rebuilt capital relative to their low point in first quarter 2009, companies remain more exposed to net risk relative to their positions prior to the credit and liquidity crisis. a soft primary market pricing environment in most regions, coupled with minimal, if any, rate change prompted by increasing reinsurance rates, and lower investment yields, have all impacted insurers ability to fund reinsurance purchases. unless there is movement in these areas in the balance of 2009 and current retention trends continue, it is likely that insurers will continue to retain more risk per unit of capital than they had prior to the credit and liquidity crisis.
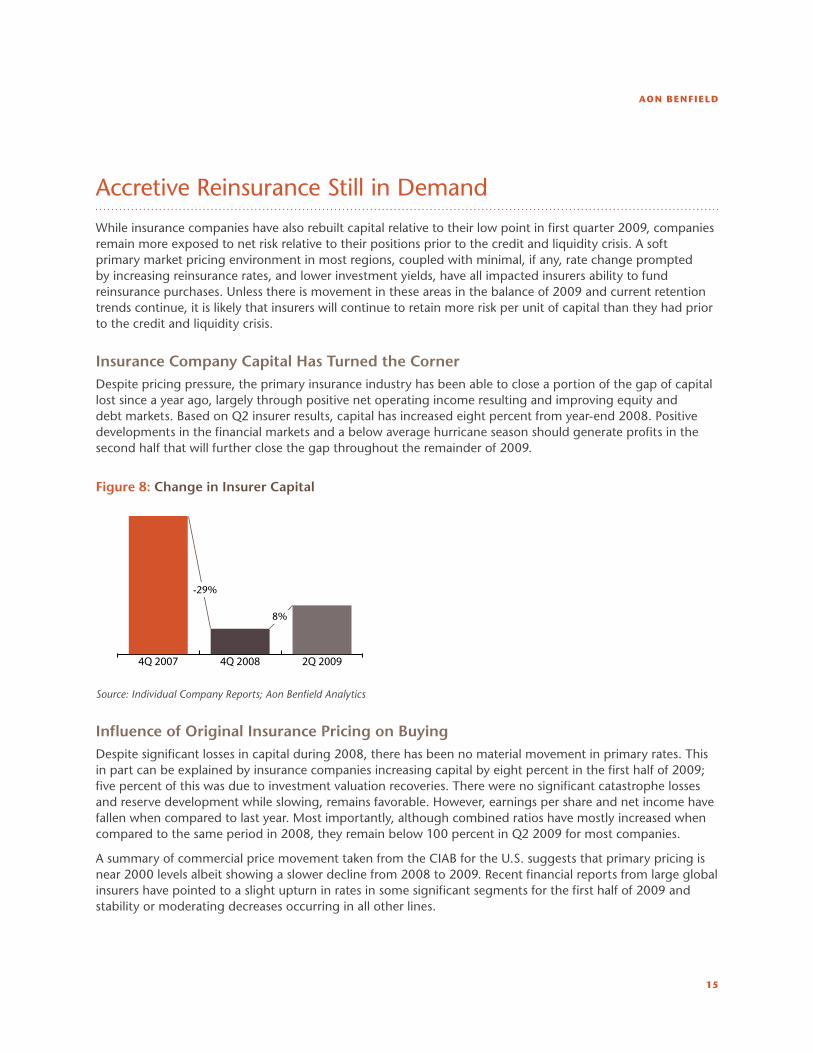
Insurance Company Capital Has Turned the CornerDespite pricing pressure, the primary insurance industry has been able to close a portion of the gap of capital lost since a year ago, largely through positive net operating income resulting and improving equity and debt markets. Based on Q2 insurer results, capital has increased eight percent from year-end 2008. Positive developments in the financial markets and a below average hurricane season should generate profits in the second half that will further close the gap throughout the remainder of 2009.
Figure 8: Change in Insurer Capital
2Q 20094Q 20084Q 2007
-29%
8%
Source: Individual Company Reports; Aon Benfield Analytics
Influence of Original Insurance Pricing on Buying Despite significant losses in capital during 2008, there has been no material movement in primary rates. this in part can be explained by insurance companies increasing capital by eight percent in the first half of 2009; five percent of this was due to investment valuation recoveries. there were no significant catastrophe losses and reserve development while slowing, remains favorable. However, earnings per share and net income have fallen when compared to last year. most importantly, although combined ratios have mostly increased when compared to the same period in 2008, they remain below 100 percent in Q2 2009 for most companies.
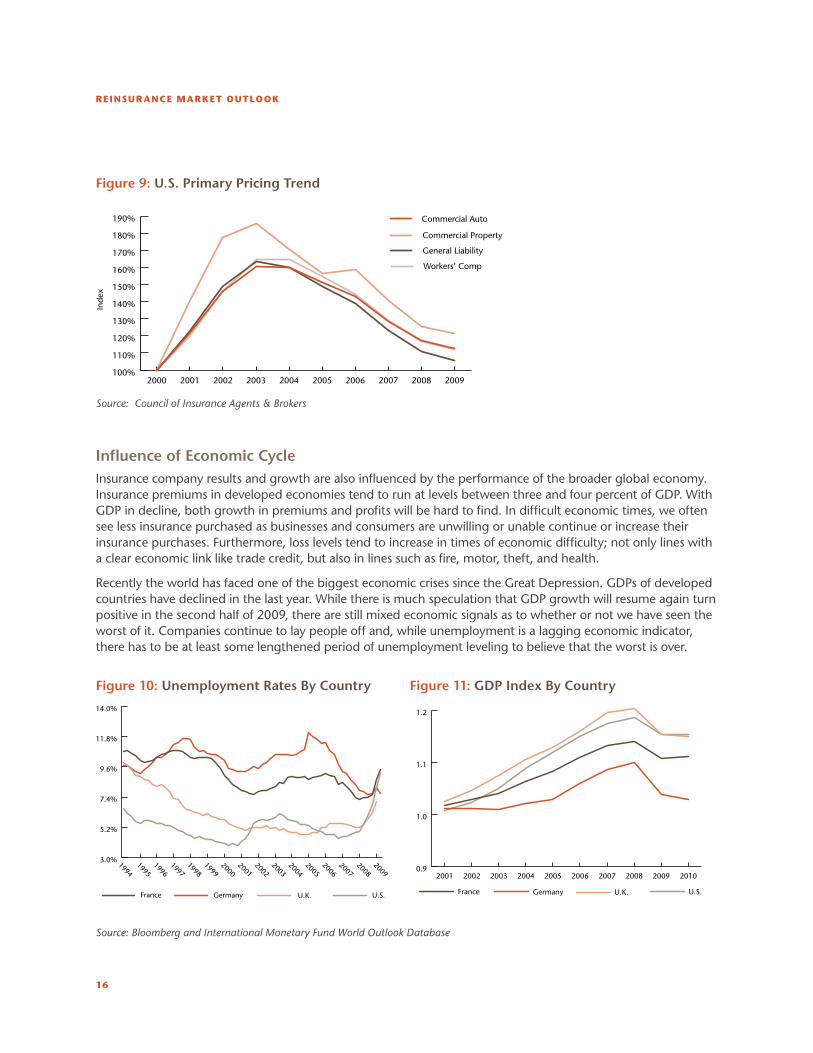
a summary of commercial price movement taken from the ciaB for the u.S. suggests that primary pricing is near 2000 levels albeit showing a slower decline from 2008 to 2009. Recent financial reports from large global insurers have pointed to a slight upturn in rates in some significant segments for the first half of 2009 and stability or moderating decreases occurring in all other lines.
REINSURANCE MARKET OUTLOOK
16
Figure 9: U.S. Primary Pricing Trend
100%
110%
120%
130%
140%
150%
160%
170%
180%
190%
Workers’ Comp
General Liability
Commercial Property
Commercial Auto
2009200820072006200520042003200220012000
Ind
ex
Source: Council of Insurance Agents & Brokers
Influence of Economic Cycle insurance company results and growth are also influenced by the performance of the broader global economy. insurance premiums in developed economies tend to run at levels between three and four percent of GDP. With GDP in decline, both growth in premiums and profits will be hard to find. in difficult economic times, we often see less insurance purchased as businesses and consumers are unwilling or unable continue or increase their insurance purchases. Furthermore, loss levels tend to increase in times of economic difficulty; not only lines with a clear economic link like trade credit, but also in lines such as fire, motor, theft, and health.
Recently the world has faced one of the biggest economic crises since the Great Depression. GDPs of developed countries have declined in the last year. While there is much speculation that GDP growth will resume again turn positive in the second half of 2009, there are still mixed economic signals as to whether or not we have seen the worst of it. companies continue to lay people off and, while unemployment is a lagging economic indicator, there has to be at least some lengthened period of unemployment leveling to believe that the worst is over.
Figure 10: Unemployment Rates By Country Figure 11: GDP Index By Country
3.0%
5.2%
7.4%
9.6%
11.8%
14.0%
GermanyFrance U.K. U.S.
20092008
20072006
20052004
20032002
20012000
19991998
19971996
19951994
0.9
1.0
1.1
1.2
U.S.U.K.Germany France
2010200920082007200620052004200320022001
GermanyFrance U.K. U.S.
Source: Bloomberg and International Monetary Fund World Outlook Database

AON BENfIELd
17
insurance and reinsurance industries have not been immune to these difficult times. unlike other recessions, the biggest impact to most (re)insurers in 2008 and early 2009 has not been material deterioration in underwriting results but rather asset value declines. in addition to decreased asset values, insurers and reinsurers have faced a soft primary pricing market as discussed above.
although balance sheets have strengthened in the first half of 2009 and asset values have recovered somewhat as equity markets have rallied and credit spreads tightened, assets arguably still pose insurers’ greatest economic risk in the short term, with possible further value declines. Government policy response in cutting interest rates poses further strain as falling investment income puts even more pressure on underwriting results and loss ratios that are no longer sustainable.
it is uncertain how the economy will perform in the short and medium term; however, it likely will not be uniform. Some developing economies, notably china, have bounced back quickly and are again showing strong, though slightly diminished, growth. By contrast, a number of developed economies are showing little signs of improvement. of particular concern are economies with a high level of personal and public debt and weakened banks. there remains a risk of a continued downward spiral, as the impact of reduced bank lending combined with reduced consumer spending induces more company failures.
a real concern is the possible reduction in the market value of government debt as governments increase borrowing to cover growing budget deficits. We have already seen demand at debt auctions reducing and some offerings being under-placed. market values will be severely affected if any leading government is downgraded. one indication that this may happen occurred in may 2009, when Standard & Poor’s affirmed its “aaa” sovereign rating of the u.k. government debt, but lowered the outlook to negative. Further, market values of developed world government debt are highly dependent on sovereign wealth funds, such as china, appetite for such debt, particularly if linked to a currency adjustment. a reduction in the value of government debt holdings would cause a systemic weakening of insurance company balance sheets. this is a particular concern to insurers, as most have “de-risked” their investment portfolios retreating to safe investments such as government securities, many bought at the top of the market.
a further worry raised by some economists is the return of “stagflation,” low or negative economic performance coupled with high inflation. Strengthening commodity prices, typified by the price of oil (currently oil prices have almost doubled from the start of the year), could trigger a prolonged period of economic stagnation while prices rise. this is arguably the worst case for insurers; government security values remain depressed (although yields increase) and it is difficult to increase premium rates in line with inflation (and the possibility of governmental interference in pricing increases), while economic factors hit loss ratios.
on a positive note, the core insurance products remain valued regardless of the underlying economic condition. Reinsurance remains an attractive, reliable, open source of capital for insurers, particularly in times of uncertainty. So despite the harsh economic conditions, the insurance and reinsurance markets have performed admirably.
REINSURANCE MARKET OUTLOOK
18
Government involvement in (Re)insurance not all Positive
the (re)insurance industry has experienced significant changes in the levels of involvement in the sector by both state and national governments throughout the past few years. While governments might argue that this involvement has resulted in lower prices for primary policyholders, the increased volatility that these movements initiate in the private reinsurance market ultimately may not benefit primary policyholders at all.
Added Volatility in Reinsurance Marketa number of examples exist that suggest government involvement, and, more specifically, the significant changes in annual capacity provided over the last few years, adds volatility to the market that ultimately doesn’t help the primary policyholder. in Florida, the private reinsurance market stepped in during the peak of the reinsurance market cycle in 2006 and was able to immediately provide additional dedicated capital that directly supported a number of Florida reinsurance programs. While the government sponsored an additional $12 billion in post-event debt financed capital in 2007 through the implementation of the temporary increase in coverage limit (“ticl”) of the Florida Hurricane catastrophe Fund (“FHcF”), the protection came at a time when the (re)insurance market was already seeing a declining trend in rates. in fact, the lack of creditworthiness of the capacity two years later forced reinsurers to immediately fill a gap of more than $5 billion in forgone ticl reinsurance coverage in a much more constrained capital environment where primary rates remain above the pre-hurricane levels.
in contrast, little government assistance has been provided for commercial property business. While, the commercial insurance market saw significant increases in both primary and reinsurance rates following Hurricane katrina, pricing has largely receded to pre-event levels with both insurers and reinsurers reflecting positive earnings results and continuing to compete for the business.
additional volatility also came from texas this year where the texas Windstorm insurance association did not purchase reinsurance this year as a result of the lack of surplus and a new funding mechanism provided by the 2009 texas legislation. this discontinuity will have a direct and potentially long-lasting impact on the pricing and availability of the Wind Pool’s reinsurance in the future further affecting coastal policyholders and assessable insurers and triggering instability of the regional capacity in the short to medium term.
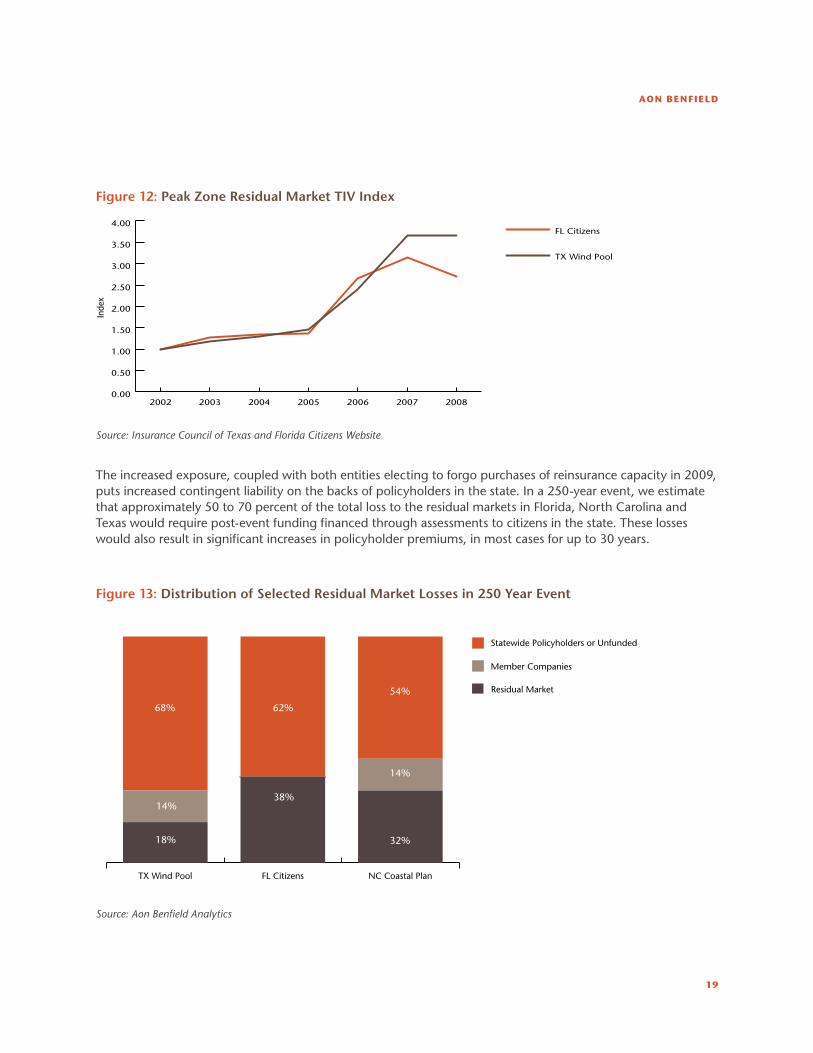
Residual Markets Put Increasing Contingent Pressure on PolicyholdersWith increasing pressure from policyholders to lower insurance premiums, many of the residual market mechanisms have increased exposure dramatically over the last few years. With six of the top 10 insured catastrophe losses stemming from hurricane activity in 2004, 2005 and 2008, insurance companies have been forced to file for significant rate increases in order to maintain required returns on capital resulting in a significant transfer of insured risk to each state’s residual market entity. as of December 31, 2008, texas insured exposure is more than 3.5 times its 2002 level. although Florida seems to have peaked in 2007, it also has more than 2.5 times the exposure it had in 2002.
AON BENfIELd
19
Figure 12: Peak Zone Residual Market TIV Index
0.00
0.50
1.00
1.50
2.00
2.50
3.00
3.50
4.00FL Citizens
TX Wind Pool
2008200720062005200420032002
Inde
x
Source: Insurance Council of Texas and Florida Citizens Website
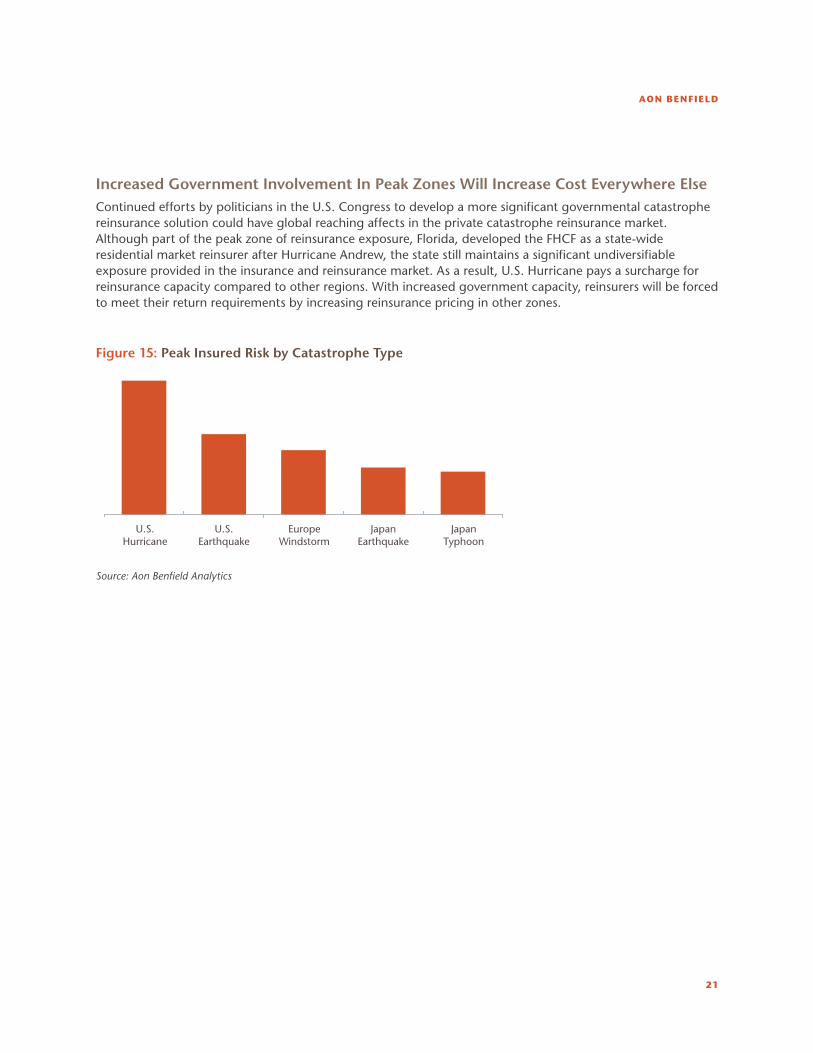
the increased exposure, coupled with both entities electing to forgo purchases of reinsurance capacity in 2009, puts increased contingent liability on the backs of policyholders in the state. in a 250-year event, we estimate that approximately 50 to 70 percent of the total loss to the residual markets in Florida, north carolina and texas would require post-event funding financed through assessments to citizens in the state. these losses would also result in significant increases in policyholder premiums, in most cases for up to 30 years.
Figure 13: Distribution of Selected Residual Market Losses in 250 Year Event
Statewide Policyholders or Unfunded
Member Companies
Residual Market
NC Coastal PlanFL CitizensTX Wind Pool
68% 62%
54%
14%
18%
38%
32%
14%
Source: Aon Benfield Analytics

REINSURANCE MARKET OUTLOOK
20
Uninsured Catastrophe Risk Remains Significantin many global areas, significant amounts of catastrophe risk remain uninsured. Potential earthquake losses in california and china remain two of the most significant worldwide exposures. in contrast to Florida where hurricane insurance penetration is high and the ultimate statewide unfunded loss is backed by an insurance mechanism, california policyholders continue to elect not to purchase earthquake insurance. aon Benfield’s impact Forecasting team published a report in January that estimated that a repeat of the 1906 earthquake would result in $230 billion in economic loss today with insured losses between $40 billion to $60 billion, leaving $170 billion to $190 billion without coverage. this is about 2.5 times california’s annual revenue and would likely cripple the state without federal assistance.
Figure 14: Distribution of California EQ Losses in 250 Year Event
Statewide Policyholders or Unfunded
Member Companies
Residual Market (CEA)
Total EQ LossInsured EQ Loss
58%
7%
88%42%
5%
Source: Aon Benfield Analytics
in china, the government announced in november of 2008 that it would spend close to $150 billion to rebuild the region devastated by the Sichuan earthquake. this compares with estimates of insurance penetration ranging between two and five percent and a total insured loss for the event of approximately $1 billion.
AON BENfIELd
21
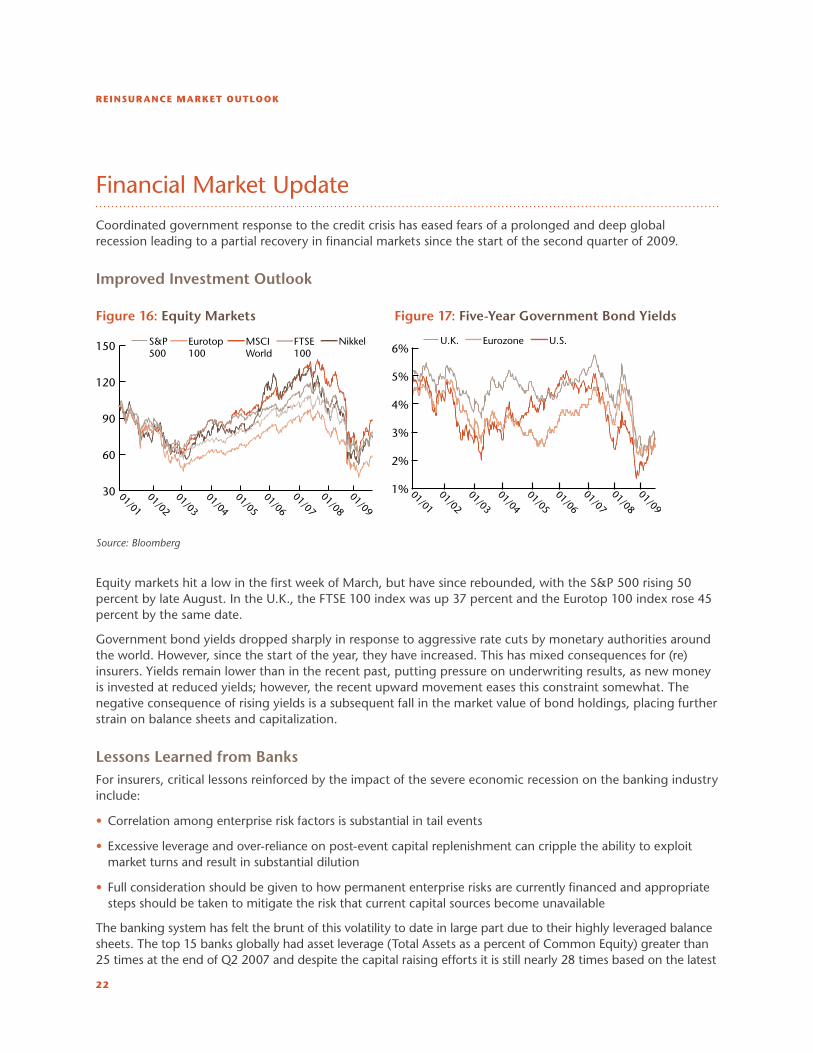
Increased Government Involvement In Peak Zones Will Increase Cost Everywhere Elsecontinued efforts by politicians in the u.S. congress to develop a more significant governmental catastrophe reinsurance solution could have global reaching affects in the private catastrophe reinsurance market. although part of the peak zone of reinsurance exposure, Florida, developed the FHcF as a state-wide residential market reinsurer after Hurricane andrew, the state still maintains a significant undiversifiable exposure provided in the insurance and reinsurance market. as a result, u.S. Hurricane pays a surcharge for reinsurance capacity compared to other regions. With increased government capacity, reinsurers will be forced to meet their return requirements by increasing reinsurance pricing in other zones.
Figure 15: Peak Insured Risk by Catastrophe Type
U.S.Hurricane
U.S.Earthquake
EuropeWindstorm
JapanEarthquake
JapanTyphoon
Source: Aon Benfield Analytics
REINSURANCE MARKET OUTLOOK
22
Financial market update
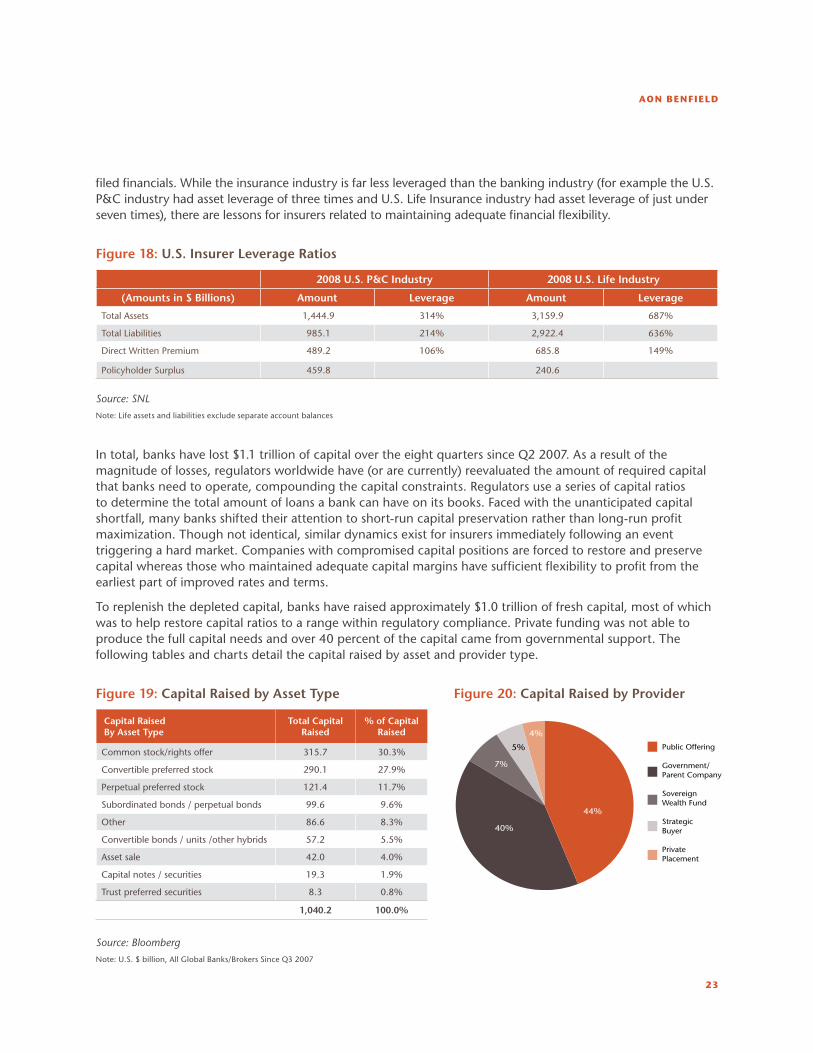
coordinated government response to the credit crisis has eased fears of a prolonged and deep global recession leading to a partial recovery in financial markets since the start of the second quarter of 2009.
Improved Investment Outlook
Figure 16: Equity Markets Figure 17: Five-Year Government Bond Yields
30
60
90
120
150
01/01
01/02
01/03
01/04
01/05
01/06
01/07
01/08
01/09
MSCIWorld
Eurotop100
S&P500
FTSE100
Nikkel
01/01
01/02
01/03
01/04
01/05
01/06
01/07
1%
2%
3%
4%
5%
6%U.S.EurozoneU.K.
01/08
01/09
Source: Bloomberg
equity markets hit a low in the first week of march, but have since rebounded, with the S&P 500 rising 50 percent by late august. in the u.k., the FtSe 100 index was up 37 percent and the eurotop 100 index rose 45 percent by the same date.
Government bond yields dropped sharply in response to aggressive rate cuts by monetary authorities around the world. However, since the start of the year, they have increased. this has mixed consequences for (re)insurers. Yields remain lower than in the recent past, putting pressure on underwriting results, as new money is invested at reduced yields; however, the recent upward movement eases this constraint somewhat. the negative consequence of rising yields is a subsequent fall in the market value of bond holdings, placing further strain on balance sheets and capitalization.
Lessons Learned from BanksFor insurers, critical lessons reinforced by the impact of the severe economic recession on the banking industry include:
correlation among enterprise risk factors is substantial in tail events•
excessive leverage and over-reliance on post-event capital replenishment can cripple the ability to exploit •market turns and result in substantial dilution
Full consideration should be given to how permanent enterprise risks are currently financed and appropriate •steps should be taken to mitigate the risk that current capital sources become unavailable
the banking system has felt the brunt of this volatility to date in large part due to their highly leveraged balance sheets. the top 15 banks globally had asset leverage (total assets as a percent of common equity) greater than 25 times at the end of Q2 2007 and despite the capital raising efforts it is still nearly 28 times based on the latest
AON BENfIELd
23
filed financials. While the insurance industry is far less leveraged than the banking industry (for example the u.S. P&c industry had asset leverage of three times and u.S. life insurance industry had asset leverage of just under seven times), there are lessons for insurers related to maintaining adequate financial flexibility.
Figure 18: U.S. Insurer Leverage Ratios
2008 U.S. P&C Industry 2008 U.S. Life Industry
(Amounts in $ Billions) Amount Leverage Amount Leverage
total assets 1,444.9 314% 3,159.9 687%
total liabilities 985.1 214% 2,922.4 636%
Direct Written Premium 489.2 106% 685.8 149%
Policyholder Surplus 459.8 240.6
Source: SNL
note: life assets and liabilities exclude separate account balances
in total, banks have lost $1.1 trillion of capital over the eight quarters since Q2 2007. as a result of the magnitude of losses, regulators worldwide have (or are currently) reevaluated the amount of required capital that banks need to operate, compounding the capital constraints. Regulators use a series of capital ratios to determine the total amount of loans a bank can have on its books. Faced with the unanticipated capital shortfall, many banks shifted their attention to short-run capital preservation rather than long-run profit maximization. though not identical, similar dynamics exist for insurers immediately following an event triggering a hard market. companies with compromised capital positions are forced to restore and preserve capital whereas those who maintained adequate capital margins have sufficient flexibility to profit from the earliest part of improved rates and terms.
to replenish the depleted capital, banks have raised approximately $1.0 trillion of fresh capital, most of which was to help restore capital ratios to a range within regulatory compliance. Private funding was not able to produce the full capital needs and over 40 percent of the capital came from governmental support. the following tables and charts detail the capital raised by asset and provider type.
Figure 19: Capital Raised by Asset Type Figure 20: Capital Raised by Provider
Capital Raised By Asset Type
Total CapitalRaised
% of CapitalRaised
common stock/rights offer 315.7 30.3%
convertible preferred stock 290.1 27.9%
Perpetual preferred stock 121.4 11.7%
Subordinated bonds / perpetual bonds 99.6 9.6%
other 86.6 8.3%
convertible bonds / units /other hybrids 57.2 5.5%
asset sale 42.0 4.0%
capital notes / securities 19.3 1.9%
trust preferred securities 8.3 0.8%
1,040.2 100.0%
Source: Bloomberg
note: u.S. $ billion, all Global Banks/Brokers Since Q3 2007
44%
40%
7%
5%
4%
Public Offering
Government/Parent Company
Sovereign Wealth Fund
StrategicBuyer
Private Placement
REINSURANCE MARKET OUTLOOK
24
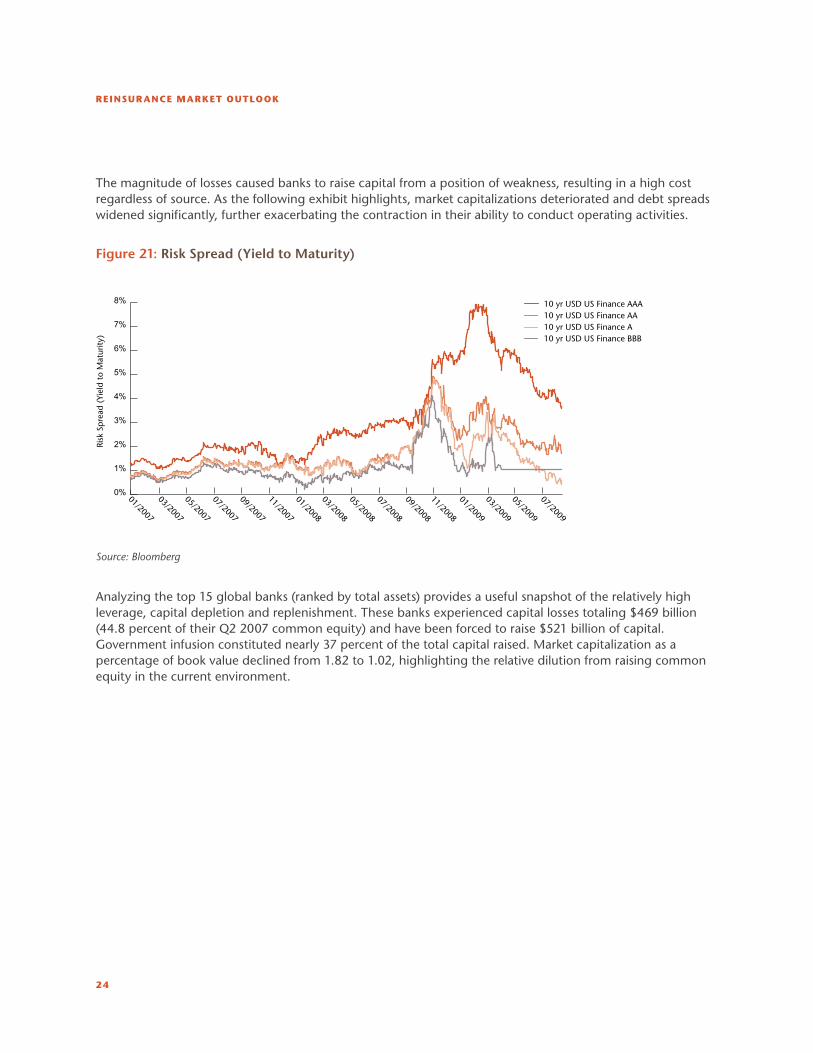
the magnitude of losses caused banks to raise capital from a position of weakness, resulting in a high cost regardless of source. as the following exhibit highlights, market capitalizations deteriorated and debt spreads widened significantly, further exacerbating the contraction in their ability to conduct operating activities.
Figure 21: Risk Spread (Yield to Maturity)
0%
1%
2%
3%
4%
5%
6%
7%
8%
Risk
Sp
read
(Yi
eld
to
Mat
urity
)
10 yr USD US Finance AAA10 yr USD US Finance AA10 yr USD US Finance A10 yr USD US Finance BBB
01/2007
03/2007
05/2007
07/2007
09/2007
11/2007
01/2008
03/2008
05/2008
07/2008
09/2008
11/2008
01/2009
03/2009
05/2009
07/2009
Source: Bloomberg
analyzing the top 15 global banks (ranked by total assets) provides a useful snapshot of the relatively high leverage, capital depletion and replenishment. these banks experienced capital losses totaling $469 billion (44.8 percent of their Q2 2007 common equity) and have been forced to raise $521 billion of capital. Government infusion constituted nearly 37 percent of the total capital raised. market capitalization as a percentage of book value declined from 1.82 to 1.02, highlighting the relative dilution from raising common equity in the current environment.

AON BENfIELd
25
Figure 22: Global Bank Statistics
Source: Bloomberg
note: u.S. $ billion; ‘total capital Raised’ is gross (not adjusted for repayments to Government). JPm has repaid $25 billion & lloyds Banking has repaid $2.6 billion to Govt.
it is clear that a sizable component of the bank’s capital was provided by short-term borrowings (Q2 2007 short-term borrowings were 4.6 times Q2 2007 common equity and 48 percent Q2 2007 total debt). Given the amount of asset leverage, these perpetual risks were heavily reliant on the availability of short-term debt at accretive terms to maintain operations. Since then, the global banks are less reliant on short-term borrowings with latest filed short-term borrowings being 3.9 times common equity and 39 percent total debt. insurance companies who wish to mitigate their own risk of a capital squeeze might view accretive reinsurance in the same way and should push to extend the terms of these contracts past one year. certain insurance enterprise risks such as catastrophe exposure are long-term if not perpetual, and most are currently mitigated through annually negotiated reinsurance contracts. although peak zone areas in the u.S. might not be willing to make the tradeoff between long-term stability and the cost increase that would be necessary, non-peak regions where capacity is more abundant and competitively priced should view this as a significant advantage over current annual contracts. Such an action could serve to mitigate the impact of an event occurring that would contract capacity and increase the cost of critical reinsurance capital.
Q2 2007 Activity Since Q2 2007 Latest Filed
Rank by
LF Total
Assets
Bank Total
Assets
Common
Equity
Leverage ST
Brrwng
Mkt Cap Price/
Book
Total
Losses
Total
Capital
Raised
Other
Losses/
Gains
Total
Assets
Common
Equity
Leverage ST
Brrwng
Mkt Cap
as of
08/10/09
Price/
Book
1 RoYal Bk ScotlanD
2,029.7 83.4 24.3 279.8 120.5 1.45 28.8 57.8 -26.6 3,499.2 85.8 40.8 281.5 42.0 0.49
2 BnP PaRiBaS 2,252.2 70.7 31.9 1,302.1 107.6 1.52 16.8 6.6 -0.9 2,895.9 59.6 48.6 341.1 83.1 1.39
3 BaRclaYS Plc 2,324.7 42.1 55.2 175.5 91.4 2.17 23.5 31.4 12.0 2,544.2 62.1 41.0 174.1 66.3 1.07
4 DeutScHe Bank-RG
2,623.9 49.1 53.4 64.5 76.5 1.56 18.5 6.0 11.6 2,434.7 48.2 50.5 62.9 41.4 0.86
5 HSBc HlDGS Plc
2,150.4 119.8 18.0 128.8 215.1 1.80 50.1 26.0 22.7 2,421.8 118.4 20.5 129.2 190.4 1.61
6 cReDit aGRicole
1,884.3 56.7 33.2 231.6 66.8 1.18 8.7 13.2 -3.0 2,306.7 58.2 39.6 1,069.9 37.4 0.64
7 Bank oF ameRica
1,534.4 132.9 11.5 455.7 216.9 1.63 69.6 99.3 33.9 2,254.4 196.5 11.5 413.3 142.1 0.72
8 JPmoRGan cHaSe
1,458.0 119.2 12.2 354.3 164.7 1.38 49.2 49.7 26.9 2,026.6 146.6 13.8 417.6 166.2 1.13
9 mitSuBiSHi uFJ F
1,565.4 62.4 25.1 188.5 130.2 2.09 4.1 24.2 -20.4 2,000.4 62.1 32.2 366.7 73.1 1.18
10 citiGRouP inc
2,220.9 127.2 17.5 778.6 255.1 2.01 112.2 109.4 -46.4 1,848.5 78.0 23.7 382.4 44.7 0.57
11 lloYDS BankinG
708.7 22.8 31.0 80.3 63.0 2.76 3.6 15.0 20.8 1,750.3 55.0 31.8 185.9 43.9 0.80
12 Banco SantanDeR Sa
1,198.9 62.1 19.3 70.6 115.9 1.87 10.9 19.9 19.1 1,613.6 90.1 17.9 122.1 117.4 1.30
13 Soc GeneRale 1,519.4 38.9 39.1 228.9 80.0 2.06 12.1 15.0 8.6 1,576.6 50.3 31.3 147.5 44.9 0.89
14 miZuHo Financial
1,262.2 20.1 62.8 295.3 90.1 4.48 8.4 9.5 -9.3 1,537.3 11.9 128.7 289.4 34.4 2.88
15 uBS aG-ReG 2,078.9 42.0 49.5 243.2 116.3 2.77 53.1 38.2 3.8 1,474.5 30.9 47.7 110.2 48.6 1.57
Total 26,812.0 1,049.3 25.6 4,877.7 1,910.1 1.82 469.6 521.3 52.9 32,184.7 1,153.8 27.9 4,493.8 1,175.8 1.02
REINSURANCE MARKET OUTLOOK
26
July 2009 Renewals
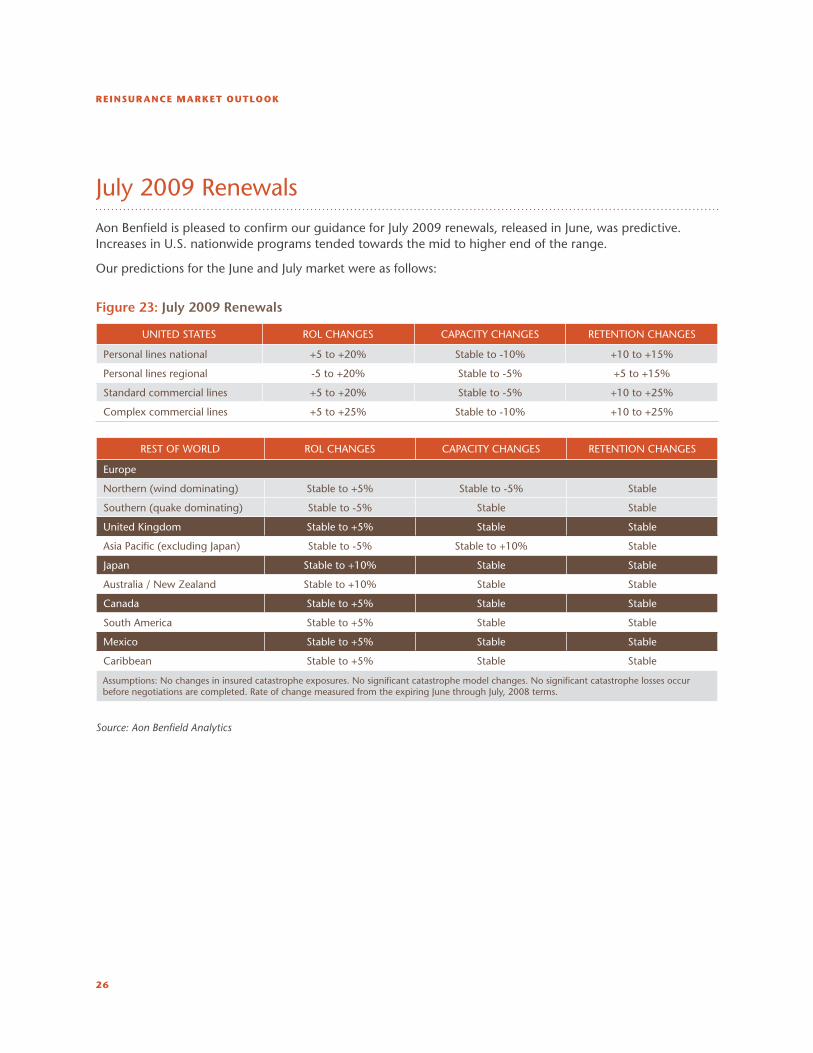
aon Benfield is pleased to confirm our guidance for July 2009 renewals, released in June, was predictive. increases in u.S. nationwide programs tended towards the mid to higher end of the range.
our predictions for the June and July market were as follows:
Figure 23: July 2009 Renewals
uniteD StateS Rol cHanGeS caPacitY cHanGeS Retention cHanGeS
Personal lines national +5 to +20% Stable to -10% +10 to +15%
Personal lines regional -5 to +20% Stable to -5% +5 to +15%
Standard commercial lines +5 to +20% Stable to -5% +10 to +25%
complex commercial lines +5 to +25% Stable to -10% +10 to +25%
ReSt oF WoRlD Rol cHanGeS caPacitY cHanGeS Retention cHanGeS
europe
northern (wind dominating) Stable to +5% Stable to -5% Stable
Southern (quake dominating) Stable to -5% Stable Stable
united kingdom Stable to +5% Stable Stable
asia Pacific (excluding Japan) Stable to -5% Stable to +10% Stable
Japan Stable to +10% Stable Stable
australia / new Zealand Stable to +10% Stable Stable
canada Stable to +5% Stable Stable
South america Stable to +5% Stable Stable
mexico Stable to +5% Stable Stable
caribbean Stable to +5% Stable Stable
assumptions: no changes in insured catastrophe exposures. no significant catastrophe model changes. no significant catastrophe losses occur before negotiations are completed. Rate of change measured from the expiring June through July, 2008 terms.
Source: Aon Benfield Analytics

27
Aon Benfield Analytics: Unique Forward Looking Insights for Clients
aon Benfield believes it delivers more value to insurers by identifying changes to the reinsurance markets in advance of key industry
renewal dates, rather than merely reporting on the varied results of actual renewals following key renewal dates. We work with each
of our clients to help them understand how these global market factors will affect their property catastrophe reinsurance renewal.
Factors such as insurer underwriting methods, data quality, capacity required, experience, and current modeled margin levels can
combine to create a better or worse outcome.
this document is intended for general information purposes only and should not be construed as advice or opinions on any specific facts or circumstances. the analysis
and comments in this paper are based upon aon Benfield’s general observations of reinsurance market conditions as of January 2009. Forward looking statements are
based on existing conditions in the marketplace which are always subject to change, therefore, actual future market conditions may be materially different from the
opinions expressed in this paper. the content of this document is made available on an “as is” basis, without warranty of any kind. aon Benfield disclaims any legal liability
to any person or organization for loss or damage caused by or resulting from any reliance placed on that content. aon Benfield reserves all rights to the content of this
document. members of the aon Benfield analytics team will be pleased to consult on any specific situations and to provide further information regarding the matters
discussed herein.

200 e. Randolph Street, chicago, illinois 60601 t: +1 312 381 5300 | f: +1 312 381 0160 | www.aonbenfield.com
copyright aon Benfield inc. 2009 | #2830 - 08/2009