Reinforced pavement above trench under urban traffic load ...
17
Scientific Research and Essays Vol. 5(21), pp. 3313-3329, 4 November, 2010 Available online at http://www.academicjournals.org/SRE ISSN 1992-2248 ©2010 Academic Journals Full Length Research Paper Reinforced pavement above trench under urban traffic load: Case study and finite element (FE) analysis Sina Kazemian* 1 , Maassoumeh Barghchi 1 , Arun Prasad 2 , Hossein Maydi 3 and Bujang B. K. Huat 3 1 Department of Civil Engineering, Bojnourd Branch, Islamic Azad University, Bojnourd, Iran. 2 Department of Civil Engineering, Banaras Hindu University, Varanasi, India. 3 Department of Civil Engineering, University Putra Malaysia, Serdang, Selangor, Malaysia. Accepted 5 October, 2010 Every year, 2000 km length of trench is being excavated through an existing pavement in Iran for installing urban waste water pipelines. Many a times, these trenches are not filled back properly resulting in large permanent settlement in the pavement constructed above the trench. Geogrids have been used at the top of the base course to decrease the settlement. This article presents the observed settlements of unreinforced and geogrid reinforced pavement, monitored over a period of 12 months under the urban traffic load. Finite element (FE) analysis of the trench and the pavement, unreinforced and reinforced, under a transient pulse load is also carried out by using PLAXIS. It is observed that the vertical settlement can be greatly reduced by using geogrids in the pavement. The results obtained from case study and PLAXIS show that the geogrids improve the stiffness and strength of asphalt pavement and control the rut formation in the pavement. Key words: Pavement, trench, geogrid, finite element analysis, transient pulse load. INTRODUCTION It is well known that geogrids can remarkably improve foundation structures behavior (Cancelli et al., 1996) by means of their confining effect and, at the same time, of the tensioned membrane effect (Giroud and Noiray, 1981; Koerner, 1990). In the last three decades, geogrids have been increasingly utilized to improve the structural performance of both newly constructed and rehabilitated pavement systems. Geogrids can be placed in the asphalt and/or in granular layers of pavement in order to enhance the tension carrying characteristics of the material. For flexible pavement, the soil sub-grade is usually stronger than that of unpaved road and there is no immediate bearing capacity problem. However, the asphalt pavement may crack under repeated loading, due to fatigue or environmental factors. Geosynthetic materials are being used to inhibit reflective cracking by acting as *Corresponding author. E-mail: [email protected]. an interlayer between the old pavement and the overlay (Rigo et al., 1993). Full-scale application related to reflective cracking has been reported by Roschen (1997). The use of geosynthetics in the overlays may provide an alternative to the removal and replacement of the deteriorated rigid pavements. This paper presents the case study of large settlement taking place in an unreinforced pavement constructed over an excavated trench in Shiraz, Iran. The results of the effect of geogrids on the settlement of the pavement under traffic load are presented. The pavement was renovated using geogrid of two stiffnesses in two different sections while the third section was left unreinforced. The settlements were recorded at the end of one, three, six and twelve months. Finite element analysis has also carried out using commercially available software (PLAXIS) to study the settlement of the unreinforced and reinforced pavement, as well as the stresses developed in the geogrid reinforcement under a transient pulse load. Although PLAXIS cannot simulate the long term settlement behavior of the pavement under a traffic load,
Transcript of Reinforced pavement above trench under urban traffic load ...

Scientific Research and Essays Vol. 5(21), pp. 3313-3329, 4 November, 2010 Available online at http://www.academicjournals.org/SRE ISSN 1992-2248 ©2010 Academic Journals Full Length Research Paper
Reinforced pavement above trench under urban traffic load: Case study and finite element (FE) analysis
Sina Kazemian*1, Maassoumeh Barghchi1, Arun Prasad2, Hossein Maydi3 and
Bujang B. K. Huat3
1Department of Civil Engineering, Bojnourd Branch, Islamic Azad University, Bojnourd, Iran. 2Department of Civil Engineering, Banaras Hindu University, Varanasi, India.
3Department of Civil Engineering, University Putra Malaysia, Serdang, Selangor, Malaysia.
Accepted 5 October, 2010
Every year, 2000 km length of trench is being excavated through an existing pavement in Iran for installing urban waste water pipelines. Many a times, these trenches are not filled back properly resulting in large permanent settlement in the pavement constructed above the trench. Geogrids have been used at the top of the base course to decrease the settlement. This article presents the observed settlements of unreinforced and geogrid reinforced pavement, monitored over a period of 12 months under the urban traffic load. Finite element (FE) analysis of the trench and the pavement, unreinforced and reinforced, under a transient pulse load is also carried out by using PLAXIS. It is observed that the vertical settlement can be greatly reduced by using geogrids in the pavement. The results obtained from case study and PLAXIS show that the geogrids improve the stiffness and strength of asphalt pavement and control the rut formation in the pavement. Key words: Pavement, trench, geogrid, finite element analysis, transient pulse load.
INTRODUCTION It is well known that geogrids can remarkably improve foundation structures behavior (Cancelli et al., 1996) by means of their confining effect and, at the same time, of the tensioned membrane effect (Giroud and Noiray, 1981; Koerner, 1990). In the last three decades, geogrids have been increasingly utilized to improve the structural performance of both newly constructed and rehabilitated pavement systems.
Geogrids can be placed in the asphalt and/or in granular layers of pavement in order to enhance the tension carrying characteristics of the material. For flexible pavement, the soil sub-grade is usually stronger than that of unpaved road and there is no immediate bearing capacity problem. However, the asphalt pavement may crack under repeated loading, due to fatigue or environmental factors. Geosynthetic materials are being used to inhibit reflective cracking by acting as *Corresponding author. E-mail: [email protected].
an interlayer between the old pavement and the overlay (Rigo et al., 1993). Full-scale application related to reflective cracking has been reported by Roschen (1997). The use of geosynthetics in the overlays may provide an alternative to the removal and replacement of the deteriorated rigid pavements.
This paper presents the case study of large settlement taking place in an unreinforced pavement constructed over an excavated trench in Shiraz, Iran. The results of the effect of geogrids on the settlement of the pavement under traffic load are presented. The pavement was renovated using geogrid of two stiffnesses in two different sections while the third section was left unreinforced. The settlements were recorded at the end of one, three, six and twelve months. Finite element analysis has also carried out using commercially available software (PLAXIS) to study the settlement of the unreinforced and reinforced pavement, as well as the stresses developed in the geogrid reinforcement under a transient pulse load. Although PLAXIS cannot simulate the long term settlement behavior of the pavement under a traffic load,

3314 Sci. Res. Essays
Figure 1. Map showing the site location (http://www.infoplease.com/atlas/country/iran.html).
nevertheless it can satisfactorily analyze the dynamic response of a geogrid reinforced multi layer pavement system due to a transient pulse load (Al-Khoury et al., 2001). Case study The details of the site and renovation of the pavement using geogrids are presented in the following sections. Major roads in other cities in Iran were also reported to have the same problem of large trench settlement. The present investigation was undertaken in Shiraz, south of Iran (Figure 1). Geology of site The rock masses in the foundation, which exposed in cores of anticlines, are dominantly made of the calcareous (Albian-Turonian period), underlain and overlain by impermeable shale (Aptian-Cenemonian period). The main structural geology features are thrust, normal and strike-slip faults which have created suitable conditions for extensive karstification. This area is mainly covered by Quaternary deposits, the thickness of which exceeds 300 m in some areas. Sedimentological
measurements in the studied boreholes indicate the thickening of sediments southward. The upper parts of the sediments (average 35 m thick) are considered as early Holocene deposits developed by fluvial systems. They are made up of fine-grained terrigenous sediments (Ajalloeian and Moein, 2009). Geologically, this area is represented by several stratigraphic units, including: Sarvak, Kazhdomi and Dariyan formations. The Sarvak unit starts from bottom with grey, calcareous breccia passing to pelagic dark medium bedded grey limestone and pelagic grey argillaceous limestone containing Rotalipora. It overlies conformably the Kazhdomi formation and is underlained by the Ilam formation. Kazhdomi formation is composed of grey medium-thin bedded limestones and yellow marly limestones with abundant pelecypods, echinoderms and genus of the ammonite Knemiceras and ends with grey marly limestones containing Orbitolinids. Dariyan Formation is composed of medium bedded grey limestones in the lower part. In the part, it consists of medium-thick bedded brownish to grey limestones in colour with pelecypods (Shirazi, 2008). EXPERIMENTAL SITE Since around 2000 km length of trench is being excavated every
Site Location

Kazemian et al. 3315
Figure 2(a). Newly excavated trench.
year for installing urban waste water pipelines, the lack of good compaction procedure and the compressibility of the backfill material results in large settlements occurring in the paved road.
These types of trenches are commonly used for laying sewer pipelines and are normally one meter wide and three meters deep. In fact, the problem starts shortly after the pavement is constructed, as in most of the cases the backfill material is compressible leading to a large settlement in the pavement and also development of wide cracks in the asphalt layer. Figure 2(a) shows the trench that has been excavated for the installation of the sewer pipeline. Lateral collapsing of the initial sub-grade materials can be distinctly observed.
It is worth noting that the excavator and the excavated materials are placed very close to the trench [Figure 2 (a)] which acts as a surcharge load on the excavated pavement that is deprived of any lateral support. This may be the reason for the collapse of the sub-grade materials. It is quite likely that these voids will result in large settlement in paved road after it is backfilled and opened to the traffic.
The process normally adopted by the local construction agency for backfilling the trench is putting the sewer pipe in the trench under a cushion of sand (50 mm) and then filling sand up to the top of the pipe. The excavated backfill material is then placed over the pipeline as the first layer. Thereafter, enough water is put in the trench to saturate the backfill [Figure 2(b)]. Afterwards, crushed rock is used to fill the remaining part of the trench. In the absence of any mechanized equipment, the backfilled materials are compacted manually using some hand-held tools. The lack of compaction techniques, especially for backfill, has produced large settlements of paved roads.
The behavior of the unreinforced pavement during the final stage of repair is shown in Figure 2(c). The collapse of the pavement, very close to the newly backfilled material is visible and it shows the lack of support for the pavement.
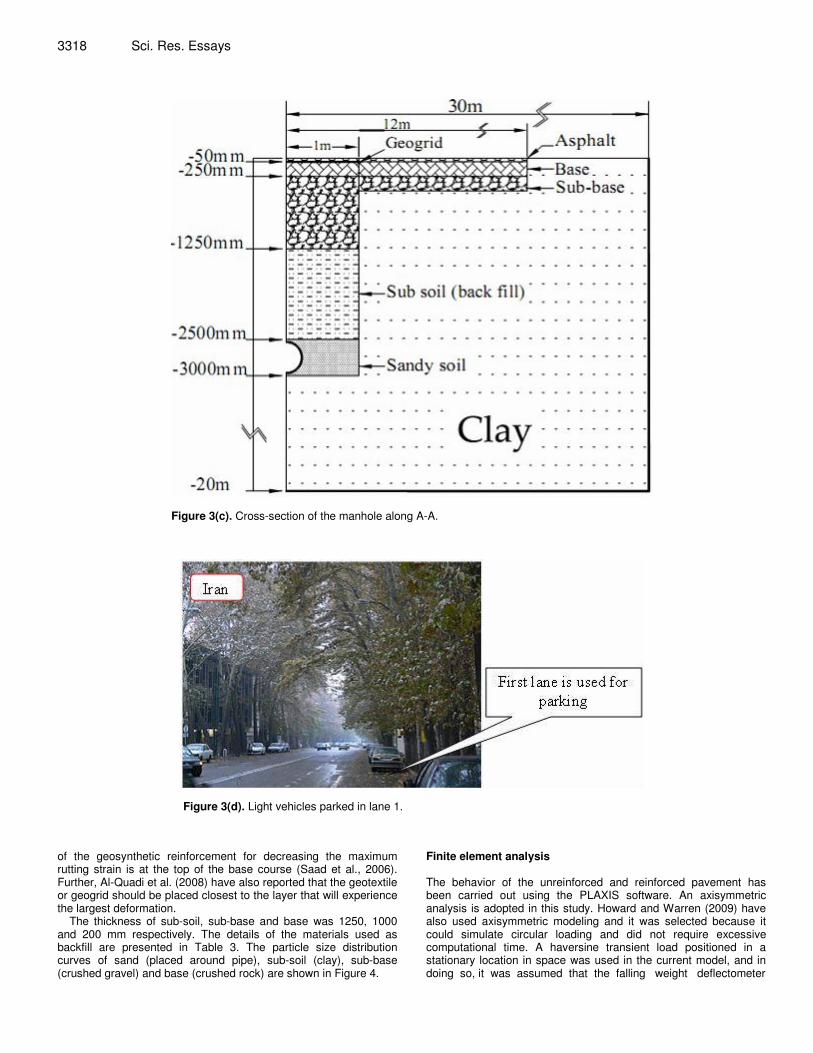
Effect of geogrid stiffness on settlement In this study, the trench and the pavement were rehabilitated using two types of geogrid to study the effect of reinforcement and its stiffness on the settlement. The layout of the lanes, trench and manholes are shown in Figures 3(a) and (b). The trench, 1000 mm wide and 3000 mm deep, is excavated along the junction of lanes 1 and 2. Sewer pipes of diameter 450 mm were laid at 3000 mm from the ground surface [Figure 3 (c)]. Manholes are provided every 100 m along the trench and the size of excavation around the manhole is 2000 x 2000 mm in plan. The properties of PVC pipe are presented in Table 1.
To study the benefits of reinforcement, the pavement was laid in three sections; the first section was unreinforced, the second section was reinforced with BX 1100 and the third section with BX 1500 as shown in Figure 3(a). It should be mentioned that, although the three sections had different layouts in the pavement, they were analyzed for the same transient loading and, being in one straight alignment, were subjected to the same vehicular load. Geogrids, a stiff structure, differ from geotextiles in that they have large apertures, typically 10 - 100 mm between ribs. They may be run through rollers with different rotational speeds or placed in a stretcher to elongate the polymers. The benefit of polymer elongation is that the polymer goes into a post-yield state, which increases the material strength, modulus, and resistance to creep. The grids used in the trial had an aperture size of 25 x 33 mm and 25 x 30.5 mm, which were higher than the maximum size (15 mm) of the crushed rock (Figure 4). The properties of the geogrids are presented in Table 2.
Fine sand was placed around and up to the top of the sewer pipe. The excavated material (clay) was then backfilled as sub-soil, followed by sub-base (crushed gravel) and base (crushed rock). The geogrid was placed at the top of the base course. The results reported for weak base systems demonstrate that the ideal location

3316 Sci. Res. Essays
Figure 2(b). Flooding with water.
Figure 2(c). Collapse of the pavement close to the excavation during backfilling.

Kazemian et al. 3317
Table 1. Properties of PVC pipe. Parameter Value Diameter (mm) 450 Tensile strength (MPa) 50 Tensile modulus of elasticity (MPa) 2895 Flexural strength (MPa) 99 Flexural modulus (MPa) 2482 Compressive strength (MPa) 66
Figure 3(a). Layout of lanes, trench and manholes.
Figure 3(b). Points for measuring settlements.
3318 Sci. Res. Essays
Figure 3(c). Cross-section of the manhole along A-A.
Figure 3(d). Light vehicles parked in lane 1.
of the geosynthetic reinforcement for decreasing the maximum rutting strain is at the top of the base course (Saad et al., 2006). Further, Al-Quadi et al. (2008) have also reported that the geotextile or geogrid should be placed closest to the layer that will experience the largest deformation.
The thickness of sub-soil, sub-base and base was 1250, 1000 and 200 mm respectively. The details of the materials used as backfill are presented in Table 3. The particle size distribution curves of sand (placed around pipe), sub-soil (clay), sub-base (crushed gravel) and base (crushed rock) are shown in Figure 4.
Finite element analysis The behavior of the unreinforced and reinforced pavement has been carried out using the PLAXIS software. An axisymmetric analysis is adopted in this study. Howard and Warren (2009) have also used axisymmetric modeling and it was selected because it could simulate circular loading and did not require excessive computational time. A haversine transient load positioned in a stationary location in space was used in the current model, and in doing so, it was assumed that the falling weight deflectometer

Kazemian et al. 3319
Figure 4. Particle size distribution curves of clay, sand, crushed gravel, and crushed rock.
Table 2. Properties of geogrid.
Parameter Value Geogrid type (TENSAR) BX 1100 BX 1500 Polymer Polypropylene Aperture shape Rectangle Aperture size (MD/XD) (mm) 25/33 25/30.5 Rib thickness (mm) 0.75 1.78 Tensile strength at 5% strain (kN/m) MD 8.46 17.5 XD 13.42 20.0 Initial modulus (kN/m) MD 226.4 407.5 XD 360.1 465.1 MD = machine direction XD = cross machine direction
(FWD) load pulse was representative of traffic. The dynamic response of this multi-layer system pavement is evaluated due to a transient load pulse as for such a system, no analytical solution exits. To simulate the traffic load, the FWD applies an impact load to the pavement surface and its response in terms of deflection is measured as several locations from the load center (Al Hakim et al., 2000; Al-Khoury et al., 2001).
There are a limited number of case studies that focus on the reinforcement effect of a geosynthetic in the asphalt pavement monitored over a long time. Finite-element modeling, using PLAXIS, has shown potential to improve the state of practice in pavement design and construction (Howard and Warren, 2009). McDowell et al. (2006) have used discrete element modeling to simulate the behavior of geogrid-reinforced aggregates. Haversine pulse has been used by many researchers to represent a
compressive stress pulse. Zaghloul and White (1993) simulated moving loads by translating contact areas on the finite-element mesh between the load and pavement surface. Chatti and Yun (1996) used moving haversine pulses to model the load, while White et al. (2002) have used a single step load function. Saad et al. (2006) incorporated a triangular wave of 0.1 sec duration to characterize the wheel load. Elseifi and Al-Qadi (2005) used measured pressures at the bottom of the surface layer to discretize the measured pulse into rectangular blocks to simulate the moving load. Loulizi et al. (2002) showed that a haversine function provided a representative compressive stress pulse for a moving vehicle and observed that 0.03s duration was adequate under falling weight deflectometer (FWD) conditions. Al-Khoury et al. (2001) have used a dynamic spectral analysis technique under FWD loading.
In this study, a peak load of 707 kPa stress amplitude with a

3320 Sci. Res. Essays
Table 3. Parameters of materials used in modeling.
Materials Asphalt Base
(Crushed rock)
Sub-base (crushed gravel)
Sub soil and soil under trench (backfill clay)
Sand around
pipe line Thickness (mm) 50 200 1000 1250 500 Elastic modulus (MPa) 340 120 75 35 80 Poisson's ratio 0.3 0.35 0.35 0.35 0.35 Unit weight (kN/m3) 25 21.0 19.6 17.5 17.5 Cohesion (kPa) - 0.22 0.14 9.0 0.1 Friction angle (°) - 39 39 24 34 Dilatation angle (°) - 0 0 0 0 Increase in modulus (Eincrement), MPa - 6 3.7 1.7 4
Rayleigh damping (�R; �R) 0.9659; 0.00021
0.9479; 0.00028
0.9402; 0.00032
0.7356; 0.00061
0.9002; 0.0004
Figure 5. Haversine pulse load.
pulse load period of 0.025s (Figure 5) is applied over a loaded area of 150 mm radius to simulate the FWD load pulse (Al-Khoury et al., 2002). A similar configuration was also adopted
by Howard and Warren (2009) to model the FWD load on the pavement as shown in Figure 6. The load is considered to be at the center of the road cross section for numerical modeling purposes.

Figure 6(a). Axis symmetric finite-element model.
Figure 6(b). Material layers and boundary conditions for the 2D rectangular axis symmetric half-space (After, Howard and Warren, 2009).
For a given point in the pavement system, the effect of the wheel load passage at that point can be reflected by a stress pulse (Terrel et al., 1974). The magnitude, shape, and duration of such a pulse vary with the stiffness of pavement, wheel load magnitude, its speed, and the depth of the studied point.
The materials were analyzed for drained behavior without any pore water pressure changes. This behavior is justified for the fact that it is assumed that water-table is not encountered in the zone of modeling. The initial vertical stress due to gravity load has also been considered in the present analysis.
All natural dynamic systems show some degree of damping when subjected to dynamic loads. In soils, damping is mainly due to loss of energy resulting from internal friction in the material and
viscous properties. Rayleigh damping parameters Rα , Rβ are
Kazemian et al. 3321 used in PLAXIS to account for natural damping. These Rayleigh damping parameters were calculated from the results (damping ratios and natural frequency) of the resonant column tests (Aggour and Zhang, 2006; Ju and Ni, 2007; Khan et al., 2008; Kramer, 1996; Vucetic, 2004; Wang and Santamarina, 2007) performed on the materials used in the modeling and are presented in Tables 1, 2 and 3.
Conventional kinematic boundary conditions were adopted, i.e., roller support on all four vertical boundaries of the mesh and fixed support at the bottom of the mesh. The modeled domain must be large enough to avoid any edge error. On the other hand, the mesh size should not be increased significantly in order to keep the problem size manageable for computation time and storage requirements. The element’s size must be chosen accurately to adequately represent the deformed shape associated with the wave lengths (λ ) at different harmonic frequencies ( f ) and the dimensions of the mesh elements should satisfy the following relation (Di Mino et al., 2009):
max
min
. fk
V
kd j=≤ λ
Where, jV is the propagation speed of the waves (P-waves; S-
waves; or R-waves), k is a coefficient ranging from 4 to 10
according to the shape function, and maxf is the greatest
frequency of the Fourier spectrum. In the present case, jV = 170
m/s; k = 6; and maxf = 100 Hz. Based on the above
consideration, the maximum element size close to the geogrid, where the response was significant to the aim of the study, was found to be 0.28 m. However, due to the limited choice in choosing the mesh size, the lower available size of element, i.e., 0.025 m was adopted.
When performing a dynamic analysis, it is also important to choose a model size having dimensions covering a significant distance away from the vibration source. This helps to avoid unwanted and unrealistic reflection of ground shock waves (Yang, 1997). Hence, to avoid these spurious reflections, absorbent boundaries were specified at the bottom and right-hand side boundary. Along with the absorbent boundaries, relaxation coefficients C1 and C2 were used which help to improve the wave absorption on the absorbent boundaries. Dissipation of waves in the direction normal to the boundary is corrected by C1, while C2 corrects for wave dissipation in the tangential direction. The absorbent boundaries used in PLAXIS are viscous boundaries, or dampers. As recommended by PLAXIS, the values of Cl and C2 were kept equal to 1 and 0.25 respectively. The use of absorbent boundaries in PLAXIS is based on the method described by Lysmer and Kuhlmeyer (1969). The normal and shear stress components absorbed by a damper in x-direction are:
xpn uVc.
1 ..ρσ −=
And, ys uVc.
2 ..ρτ −=
Where, ρ is the density of the materials, pV and sV are the
pressure wave velocity and the shear wave velocity, respectively.
xu.
and yu.
are the velocities in the x and y direction
respectively. pV and sV are determined using the following

3322 Sci. Res. Essays
Figure 7. Close-up view of the deformed mesh of the reinforced model. equations:
ρoed
p
EV = , where,
)21)(1()1(
ννν
−+−= E
Eoed and,
gγρ =
In which E = Young’s modulus, ν = Poisson’s ratio, γ = total unit weight and g is the acceleration due to gravity. A similar expression is used to calculate the shear wave velocity,
sV :
ρG
Vs = , where )1(2 ν+
= EG
Further, according to PLAXIS, radiation (geometry) damping, which will happen naturally in a numerical calculation, is the dominant damping effect for a single source problem with an axisymmetric model, and Rayleigh damping can be ignored. This statement agrees with the findings by other researchers (Chow, 1981). Due to the symmetry of geometry, boundary conditions, only half of the model was considered. The left boundary is an axis of symmetry
and the upper boundary is a free surface (Figure 7).
The analysis was carried out using the Mohr-Coulomb material model for sand, clay, crushed rock and asphalt. The model (soil) consisted of 15-noded triangular elements. Pipes are modeled using the tunnel feature (beam element) and the behavior of each element is defined as flexural rigidity, normal stiffness and/or ultimate bending moment. PLAXIS has the provision for providing interface elements to the beam elements. Geogrid elements have been modeled using 5-noded tension elements. Since, it was necessary to model the soil-geogrid interaction; 5-noded interface elements have also been used. An interface strength reduction factor was used to simulate the reduced friction angle along the interface between the asphalt layer and the geogrid; and also between the geogrid and the crushed stone. This factor relates the interface strength between the asphalt layer and the geogrid; and also between the geogrid and the crushed stone. Hence, a reduced value of interface friction angle (two-third) was assigned to these elements. This was achieved by setting the interface reduction factor ( erRint ) equal to 0.67. Cancelli et al. (1992) and Cancelli et
al. (2000) have also used a similar reduced friction angle for modeling the geogrid and the base course. A typical model had about 1275 elements and 10563 nodes. To simulate the stress dependency of the moduli, the structural layers were divided into sub-layers with the same strength parameters, but different moduli (using the modulus increment option). When soil plasticity is involved in a finite element calculation, the equations become non-linear. This means that each calculation phase needs to be solved in a series of calculation steps (load steps). In Plaxis, during each load step, the equilibrium errors in the solution are successively reduced using a series of iterations, and the iteration procedure is based on an accelerated initial stress method. Plaxis uses various procedures like, load advancement ultimate level, load advancement number of steps, and automatic time stepping, for the solution of non-linear plasticity problems. All procedures are based on an automatic step size selection. The software automatically uses the most appropriate procedure by itself to guarantee optimum performance. To reduce the number of iterations needed for convergence, Plaxis makes use of an over-relaxation procedure. The element mesh and boundary conditions of the reinforced structure are shown in Figure 7.
The geogrid was placed at the base-asphalt concrete interface as it leads to the highest reduction in rutting strain (Saad et al., 2006; Technical guide, 2008). Ling and Liu (2001) have also used geogrids below the asphalt layer with improved performance of the pavement. In these models, the attention was paid to the stress distributions and in the resilient deformations. RESULTS Figure 8(a) shows the construction of the manhole. Two different sections of the rehabilitated pavement using geogrids BX 1100 and BX 1500 are shown in Figures 8(b) and (c). No apparent distress or settlement is visible in the pavement reinforced with geogrid. However, the section without any reinforcement shows large settlement [Figure 8 (d)]. The settlement of the pavement around the manhole was measured at the end of one, three, six and twelve months at four locations around the manhole as shown in Figure 3 (b). The same types of traffic loads ply in lane 1 for the points 1 and 2; lane 2 for the points 3 and 4. Hence, it was decided to monitor the vertical settlements at two points (1 and 2) in lane 1, and another two points (3 and 4) in lane 2 as shown in Figures 3(a)

Kazemian et al. 3323
Figure 8(a). Construction of manhole.
Figure 8(b). Pavement with geogrid (BX 1100).

3324 Sci. Res. Essays
Figure 8(c). Pavement with BX 1500.
Figure 8(d). Pavement without reinforcement.
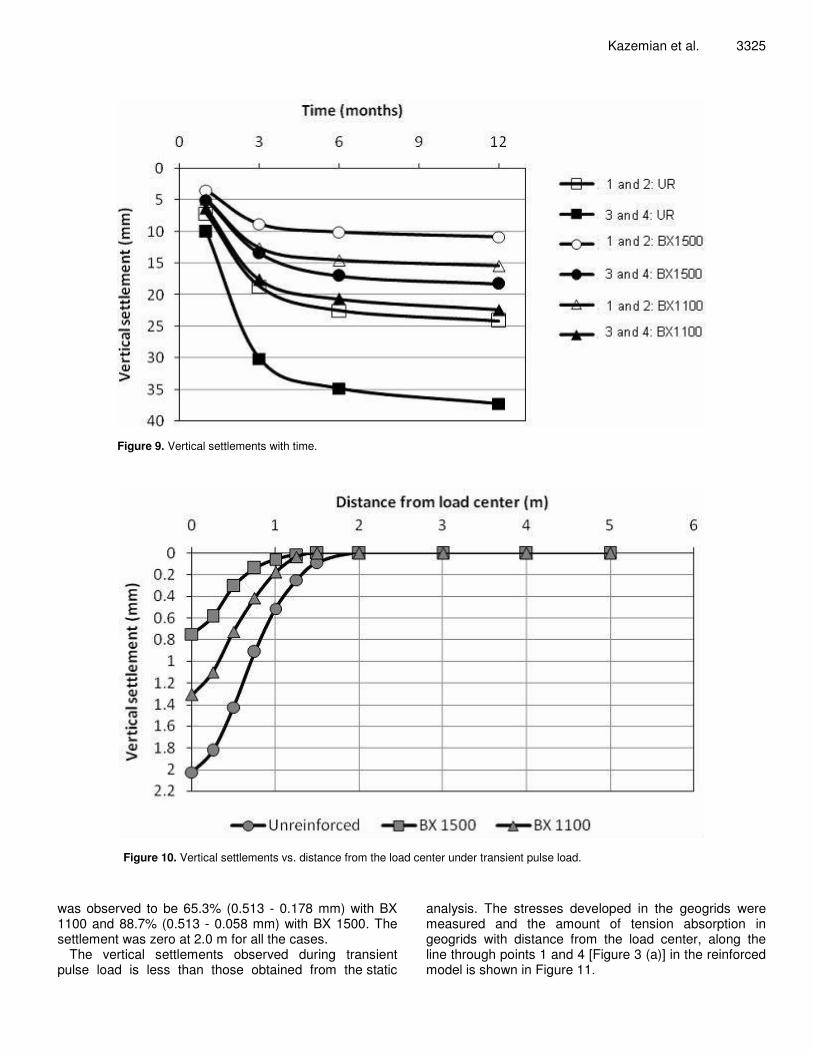
and (b). The vertical settlements (average of points 1 and 2; 3 and 4) in the unreinforced and reinforced sections of the pavement measured over a period of 12 months are shown in Figure 9.
The settlement for the points 1 and 2 in the unreinforced section is 7.13 mm at the end of one month and increases rapidly to 18.7 mm at the end of three months and finally is 24.1 mm at the end of 12 months. The corresponding settlements for the points 3 and 4 are higher than points 1 and 2 at 10.03, 30.1 and 37.25 mm
for the same time period. With the use of the geogrid (BX 1100), the settlement of the points 1 and 2 reduces to 4.83 mm at the end of one month, 12.6 mm at the end of three months and 15.38 mm at the end of 12 months. It further reduces to 3.48 mm at the end of one month, 8.8 mm at the end of three months and finally to 10.83 at the end of 12 months with the geogrid having higher stiffness (BX1500). The reduction in settlement under points 1 and 2 is 36.18 and 55.06% with geogrids BX 1100 and BX 1500 respectively. Similarly, the reduction under points 3 and 4 is 39.86 and 50.1% with geogrid BX 1100 and BX 1500 respectively.
The behavior of the pavement under transient pulse load was also studied by the finite element analysis using the commercially available software PLAXIS. The settlements of the unreinforced and reinforced pavement under transient load pulse are presented in Figure 10. As expected, the settlement of the unreinforced pavement is very high under the load but reduces significantly with the geogrid BX 1100 and further with BX 1500. The settlement of the pavement under the load is 2.025 mm for unreinforced case, 1.309 mm with BX 1100, and 0.82 mm with BX 1500. This translates to a reduction in settlement under the load by 44.1% with BX 1100 and 62.96% with BX 1500. Similarly the reduction in settlement at a distance of 1.0 m from the load center
Kazemian et al. 3325
Figure 9. Vertical settlements with time.
Figure 10. Vertical settlements vs. distance from the load center under transient pulse load.
was observed to be 65.3% (0.513 - 0.178 mm) with BX 1100 and 88.7% (0.513 - 0.058 mm) with BX 1500. The settlement was zero at 2.0 m for all the cases.
The vertical settlements observed during transient pulse load is less than those obtained from the static
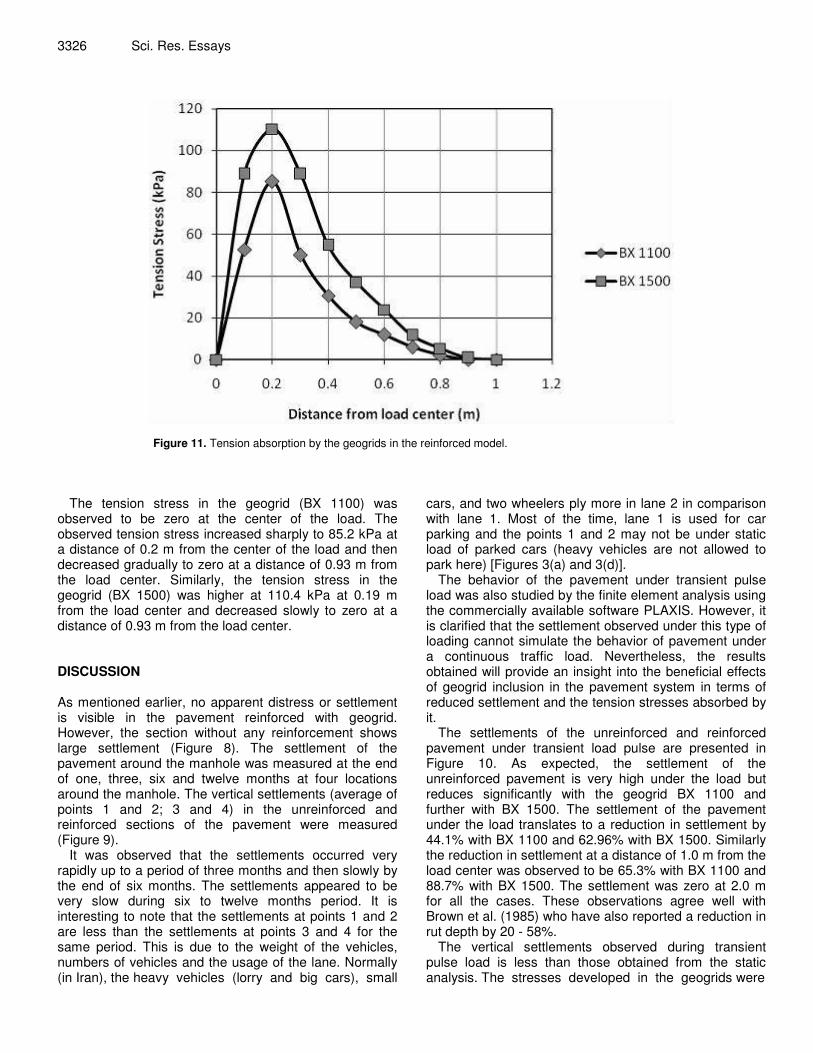
analysis. The stresses developed in the geogrids were measured and the amount of tension absorption in geogrids with distance from the load center, along the line through points 1 and 4 [Figure 3 (a)] in the reinforced model is shown in Figure 11.
3326 Sci. Res. Essays
Figure 11. Tension absorption by the geogrids in the reinforced model.
The tension stress in the geogrid (BX 1100) was observed to be zero at the center of the load. The observed tension stress increased sharply to 85.2 kPa at a distance of 0.2 m from the center of the load and then decreased gradually to zero at a distance of 0.93 m from the load center. Similarly, the tension stress in the geogrid (BX 1500) was higher at 110.4 kPa at 0.19 m from the load center and decreased slowly to zero at a distance of 0.93 m from the load center. DISCUSSION As mentioned earlier, no apparent distress or settlement is visible in the pavement reinforced with geogrid. However, the section without any reinforcement shows large settlement (Figure 8). The settlement of the pavement around the manhole was measured at the end of one, three, six and twelve months at four locations around the manhole. The vertical settlements (average of points 1 and 2; 3 and 4) in the unreinforced and reinforced sections of the pavement were measured (Figure 9).
It was observed that the settlements occurred very rapidly up to a period of three months and then slowly by the end of six months. The settlements appeared to be very slow during six to twelve months period. It is interesting to note that the settlements at points 1 and 2 are less than the settlements at points 3 and 4 for the same period. This is due to the weight of the vehicles, numbers of vehicles and the usage of the lane. Normally (in Iran), the heavy vehicles (lorry and big cars), small
cars, and two wheelers ply more in lane 2 in comparison with lane 1. Most of the time, lane 1 is used for car parking and the points 1 and 2 may not be under static load of parked cars (heavy vehicles are not allowed to park here) [Figures 3(a) and 3(d)].
The behavior of the pavement under transient pulse load was also studied by the finite element analysis using the commercially available software PLAXIS. However, it is clarified that the settlement observed under this type of loading cannot simulate the behavior of pavement under a continuous traffic load. Nevertheless, the results obtained will provide an insight into the beneficial effects of geogrid inclusion in the pavement system in terms of reduced settlement and the tension stresses absorbed by it.
The settlements of the unreinforced and reinforced pavement under transient load pulse are presented in Figure 10. As expected, the settlement of the unreinforced pavement is very high under the load but reduces significantly with the geogrid BX 1100 and further with BX 1500. The settlement of the pavement under the load translates to a reduction in settlement by 44.1% with BX 1100 and 62.96% with BX 1500. Similarly the reduction in settlement at a distance of 1.0 m from the load center was observed to be 65.3% with BX 1100 and 88.7% with BX 1500. The settlement was zero at 2.0 m for all the cases. These observations agree well with Brown et al. (1985) who have also reported a reduction in rut depth by 20 - 58%.
The vertical settlements observed during transient pulse load is less than those obtained from the static analysis. The stresses developed in the geogrids were

measured and the amount of tension absorption in geogrids with distance from the load center, along the line through points 1 and 4 [Figure 3 (a)] in the reinforced model (Figure 11). It is apparent that the geogrids play a very important role in absorbing the stresses developed in the pavement.
The tension stress in the geogrid (BX 1100) was observed to be zero at the center of the load. However, this observation does not agree with the published results by researchers (Haas, 1984, 1985; Saad et al., 2006; Zaghloul and White, 1993) who reported measuring tensile stresses in the geogrid under the load. The reason for this behavior is probably due to the fact that normally the geogrid is placed somewhere in the base layer (mid level or 1/3 of thickness of base from its bottom) or at its bottom; but in the present study, it was placed at the top of the base layer. It is obvious from the results that the geogrids placed in the bottom of asphalt layer were capable of absorbing the shear stresses at the interface as tension stress and that the geogrid (BX 1500) was better in performance than BX 1100. These tension stresses give rise to tensile strain in the geogrid reinforcement. Also, the confinement effect of reinforcement can restrain the lateral deformation or potential tensile strain of the soil.
The settlements observed from the case study have proved the effectiveness of the geogrids in reducing the settlement in the pavement. In fact, the results obtained from the finite element analysis show that the tensile forces carried by the geogrids are a function of its vertical transient settlement. This establishes its crucial role in reducing the vertical settlement and also corresponds well with Dondi (1997) and Perkins et al. (1998). Dondi (1997) reported that the geosynthetic does not provide improvement in the stiffness until the occurrence of cracking, but the interlayer reduced the displacements and rut depths under dynamic loading. However, in the present study, the geogrid is provided at the top of the base. In this case the geogrid is very useful in reducing the transient settlement (Plaxis) and plastic settlement (field measurement). The reduced settlement is probably due to the increase in the stiffness of the pavement. Perkins et al. (1998) have used the geogrid and woven geotextile to reinforce the pavement. The load was applied through a circular rigid plate overlying a rubber pad and an improvement in the pavement performance was observed in the presence of the geosynthetics.
The reduced settlement observed in the pavement is because the geogrids are able to distribute wheel loads due to the friction developed between the geogrid and the granular material (Kim and Buttlar, 2002; Ling and Liu, 2001; Ling and Liu, 2003). This friction is much greater than between geotextiles and granular material. The tension necessary to increase structural support is not immediately developed; the amount of displacement necessary for the tensile stress to develop is a function of the properties of the soils, geogrid, and loading. Three fundamental reinforcement mechanisms involving the use
Kazemian et al. 3327 of geogrids to reinforce pavement materials are; lateral restraint, improved bearing capacity and tensioned membrane effect (Perkins et al., 1998). Lateral restraint refers to the confinement of the aggregate material during loading, which restricts lateral flow of the material from beneath the load. Since most aggregates used in pavement systems are stress-dependent materials, improved lateral confinement results in an increase in the modulus of the base course material. The improved bearing capacity is achieved by shifting the failure envelope of the pavement system from the relatively weak sub-grade to the relatively strong base course material and the reinforcement mechanism has been termed the “tensioned membrane effect.” The tensioned membrane effect is based upon the concept of an improved vertical stress distribution resulting from tensile stress in a deformed membrane. It has been shown that reinforcement benefits are obtained without significant deformation of the pavement section. Thus, lateral restraint has been identified as the primary reinforcement mechanism, followed by the improved bearing capacity concept and the tensioned membrane effect. The actual contribution of each of these mechanisms to the overall reinforcement provided to the pavement system has yet to be quantified (Beranek, 2003).
Further, it can be said that when the load is applied to the surface of the pavement, a zone of tension is developed at the lower section of the asphalt concrete layer. To improve the rigidity of the asphalt concrete layer, which may be considered as a beam, the geogrid is included as tensile reinforcement. The tensile stress acting in the asphalt concrete is thus transferred to the geogrid as tensile force. The overall performance of the asphalt pavement is improved if an effective bonding is maintained between the asphalt concrete and geogrid. Therefore, the stiffness of geogrids can play an important role in control of the rut formation in the pavement system. The degree of improvement in both resilient and permanent strains is mainly related to the soil type and the stiffness of the geogrid. Further, the geogrid reinforcement also contributes to an improvement in the stiffness and strength of asphalt pavement. Haas (1984) showed that the use of geogrids could significantly reduce deformation and improve the durability of paved roads. The greater resistance to failure is due primarily to an increase in the stiffness and the load spreading ability of the geogrids (Haas, 1984; Skok et al., 2003). The settlement over the loading area of the reinforced pavement reduced significantly when compared with unreinforced pavement. Conclusions This paper discusses the results of the case study of large settlement taking place in an unreinforced pavement constructed over an excavated trench in Shiraz, Iran. The results of the effect of geogrids on the

3328 Sci. Res. Essays settlement of the pavement under traffic load are presented. The pavement was laid using geogrid of two stiffnesses in two different sections while the third section was left unreinforced. The settlements were recorded for twelve months. Finite element analysis has also been carried out using PLAXIS to simulate the behavior of the unreinforced and reinforced pavement under transient pulse loading. The following conclusions are made based on the study: 1. The stiffness of geogrids plays an important role in control of the rut formation in the pavement system. The settlement of the reinforced pavement, under actual traffic load reduced significantly when compared with the unreinforced pavement. 2. The decrease in settlement in the reinforced pavement under transient pulse load was also evaluated from the results of the finite element analysis. Although the case study measures plastic deformation rather than transient deformations computed by the finite element analysis, nevertheless the trend of the two types of settlement of the pavement is similar. 3. The degree of improvement in permanent strains appears to be related to the stiffness of the geogrid. ACKNOWLEDGEMENTS The authors would like to thank the Sepehr Andishan Sanabad Consultant Company (Iran) and Dr. Vahid Galavi for providing the data and extending all help in this study. REFERENCES Aggour MS, Zhang JX (2006). Degradation of sands due to combined
sinusoidal loading. J. Geotech. Geoenviron. Eng., 132(12): 1628–1632.
Ajalloeian R, Moein F (2009). Evaluation of Damsites Groutability Using Secondary Permeability Index, Rock Classification (Case Studies). Am. J. Appl. Sci., 6(6): 1235-1241.
Al Hakim B, Cheung LW, Armitage RJ (2000). Use of FWD data for prediction of bonding between pavement layers. Int. J. Pavement Eng., 1(1): 49-59.
Al-Khoury R, Scarpas A, Kasbergen C, Blaauwendraad J (2001). Spectral element technique for efficient parameter identification of layered media. Part I: forward calculation. Int. J. Solids Struct., 38: 1605-1623.
Al-Khoury R, Scarpas A, Kasbergen C, Blaauwendraad J (2002). Spectral element technique for efficient parameter identification of layered media. Part III: viscoelastic aspect. Int. J. Solids Struct., 39: 2189-2201.
Al-Quadi IL, Morian DA, Stoffels SM, Elseifi M, Chehab G, Stark T (2008). Synthesis on use of geosynthetics in pavements and development of a roadmap to geosynthetically-modified pavements. Federal Highway Administration, McLean, VA, Report No. FHWA-HRT, pp. 1-195.
Beranek DA (2003). Use of geogrids in pavement construction. Department of the Army, US Army Corps of Engineers, Washington D.C., Technical Letter No. ETL 1110-1-189.
Brown SF, Brunton JM, Hughes DAB, Brodrick BV (1985). Polymer grid reinforcement of asphalt. Proceedings of the Association of Asphalt Technology, 54: 18-41.
Cancelli P, Doh SR, Recalcati P (2000). Reducing differential
settlements under a road embankment in Korea by use of geosynthetics: a finite element analysis. Proceedings of the 2nd Asian Geosynthetics Conference, IGS, Kuala Lumpur, Malaysia.
Cancelli A, Montanelli F, Rimoldi P, Zhao A (1996). Full scale laboratory testing on geosynthetics reinforced paved roads. Ochiai H, Yasufuku N, Omine K (Ed.), Balkema, Proceedings of the International Symposium on Earth Reinforcement, Fukuoka, Kyushu, Japan, pp. 573-578.
Cancelli A, Rimoldi P, Togni A (1992). Frictional characteristics of geogrids by means of direct shear and pull-out tests, Proc. of IS Kyushu 92 Int. Symposium on Earth Reinforcement Practice, Fukuoka, Japan, pp. 51-56.
Chatti K, Yun KK (1996). SAPSI-M: computer program for analyzing asphalt concrete pavements under moving arbitrary loads. Transportation Research Board, Washington, D.C., Transportation Research Record 1539, 88–95.
Chow YK (1981). Dynamic behavior of piles. PhD Thesis, University of Manchester. UK.
Di Mino G, Giunta M, Di Liberto CM (2009). Assessing the open trenches in screening railway ground-borne vibrations by means of artificial neural netwoks. Advances in Acoustics and Vibrations Article ID 942787, pp. 1-12.
Dondi G (1997). Full scale dynamical testing on reinforced bituminous pavements. Proceedings of the Geosynthetics’97. Industrial Fabrics Association International, Rosville, Minn., pp. 749-762.
Elseifi MA, Al-Qadi IL (2005). Effectiveness of steel reinforcing nettings in combating fatigue cracking in new flexible pavement systems. J. Transportation Eng. 131(1): 37-45.
Giroud JP, Noiray L (1981). Geotextile-reinforced unpaved road design. Journal of the Geotechnical Engineering Division ASCE, 107(GT9): 1231-1254.
Haas R (1984). Structural behavior of Tensar reinforced pavements and some field applications. Proceedings of the Symposium on Polymer Grid Reinforcement in Civil Engineering, London, pp. 166-170.
Howard IL, Warren KA (2009). Finite-element modeling of instrumented flexible pavements under stationary transient loading. J. Transportation Eng. ASCE, 135(2): 53-61.
http://www.infoplease.com/atlas/country/iran.html. Ju SH, Ni SH (2007). Determining Rayleigh damping parameters of
soils for finite element analysis. Int. J. Numerical and Anal. Methods in Geomech, 31(10): 1239-1255.
Khan ZH, Cascante G, El Naggar MH, Lai CG (2008). Measurement of frequency-dependent dynamic properties of soils using the resonant-column device. J. Geotech. Geoenviron. Eng., 134(9): 1319-1326.
Kim J, Buttlar WG (2002). Analysis of reflective crack control system involving reinforcing grid over base-isolating interlayer mixture. J. Transportation Eng., 128(4): 375-384.
Koerner RM (1990). Designing with geosynthetics. 2nd edn. Prentice Hall, Englewood Cliffs, NJ, USA.
Kramer SL (1996). Geotechnical earthquake engineering. 1st edn. Upper Saddle River, New Jersey, USA.
Ling HI, Liu Z (2001). Performance of geosynthetic-reinforced asphalt pavements. J. Geotech. Geoenviron. Eng., 127(2): 177-184.
Ling HI, Liu H (2003). Finite element studies of asphalt concrete pavement reinforced with geogrid. J. Eng. Mech., 129(7): 801-811.
Loulizi A, Al-Qadi IL, Lahouar S, Freeman TE (2002). Measurement of vertical compressive stress pulse in flexible pavements. Transportation Research Board, Washington, D.C., Transportation Research Record 1816, pp. 1250-136.
Lysmer J, Kuhlmeyer RL (1969). Finite dynamic model for infinite media. J. Eng. Mech. Div. ASCE, 95: 859-877.
McDowell GR, Harireche O, Konietzky H, Brown SF, Thom NH (2006). Discrete element modeling of geogrid-reinforced aggregates. Proceedings of the Institution of Civil Engineers, Geotechnical Engineering, 159: 35-48.
Perkins SW, Ismeik M, Fogelsong ML, Wang Y, Cuelho EV (1998). Geosynthetic-reinforced pavements: Overview and preliminary results. Proceedings of the 6th International Conference on Geosynthetics, Industrial Fabrics Association International, Rosville, Minn., pp. 951-958.
Rigo JM, Degeimbre R, Francken L (1993). Reflective cracking in

pavements. 1st edn., E and FN Spon, London, UK. Roschen TJ (1997). A case study into the use of pavement reinforcing
grid, mastic, and membrane interlayers on asphalt concrete overlays. Proceedings of the Geosynthetics’97. Industrial Fabrics Association International, Rosville, Minn., pp. 725-747.
Saad B, Mitri H, Poorooshasb H (2006). 3D FE analysis of flexible pavement with geosynthetic reinforcement. J. Transportation Eng., 132(5): 402-415.
Shirazi MPN (2008). Calcareous algae from the cretaceous of zagros mountains (SW Iran). World Appl. Sci. J., 4(6): 803-807.
Skok EL, Johnson EN, Brown M (2003). Special practices for design and construction of subgrades in poor, wet and/or saturated soil conditions, Minnesota Dept. of Transportation, Report No. MN/RC – 2003, 36: 1-134.
Technical Guide (2008). Asphalt for road construction. Asphalt academy, CSIR Built Environment, Pretoria, South Africa, pp. 1-67.
Terrel RL, Awad IS, Foss LR (1974). Techniques for characterizing bituminous materials using a versatile triaxial testing system., American Society for Testing and Materials, Philadelphia, ASTM STP, 561: 47–66.
Vucetic M (2004). Emerging trends in dynamic simple shear testing. Proceedings of the International workshop on Uncertainties in Nonlinear Soil Properties and their Impact on Modeling Dynamic Soil Response. Peer Headquarters, UC Berkeley, pp. 1-15.
Kazemian et al. 3329 Wang YH, Santamarina JC (2007). Attenuation in sand: an exploratory
study on the small-strain behavior and the influence of moisture condensation. Granular Matter., 9(6): 365-376.
White TD, Haddock JE, Hand AJT, Fang H (2002). Contributions of pavement structural layers to rutting of hot mix asphalt pavements. Transportation Research Board, National Research Council, Washington, NCHRP Rep. No. 468.
Yang Z (1997). Finite element simulation of response of buried shelters to blast loadings. Finite Elements in Analysis and Design, 24: 113-132.
Zaghloul SM, White TD (1993). Use of a three-dimensional, dynamic finite element program for analysis of flexible pavement. Transportation Research Board, National Research Council, Washington, D.C., Transportation Res. Record, 1388: 60-69.


![Geosynthetic Reinforced Pavement System Testing Design[1]](https://static.fdocuments.in/doc/165x107/577ccfcc1a28ab9e78909acc/geosynthetic-reinforced-pavement-system-testing-design1.jpg)