


Reinforced Concrete Tilt-Up Wall Panel with Opening ... · Reinforced Concrete Tilt-Up Wall Panel...
42
Reinforced Concrete Tilt-Up Wall Panel with Opening Analysis and Design (ACI 551)
Transcript of Reinforced Concrete Tilt-Up Wall Panel with Opening ... · Reinforced Concrete Tilt-Up Wall Panel...

Reinforced Concrete Tilt-Up Wall Panel with Opening Analysis and Design (ACI 551)

Version: Apr-13-2018
Reinforced Concrete Tilt-Up Wall Panel with Opening Analysis and Design (ACI 551)
Tilt-up is form of construction with increasing popularity owing to its flexibility and economics. Tilt-up concrete is
essentially a precast concrete that is site cast instead of traditional factory cast concrete members. A structural
reinforced concrete tilt-up wall panel with opening in a single-story warehouse (big-box) building provides gravity
and lateral load resistance for the following applied loads from four roof joists bearing in wall pockets in addition to
the wind:
Roof dead load = 2.4 kip per joist
Roof live load = 2.5 kip per joist
Wind load = 27.2 psf
The assumed tilt-up wall panel section and reinforcement are investigated after analysis to verify suitability for the
applied loads then compared with numerical analysis results obtained from spWall engineering software program from
StructurePoint. Additionally, different modeling and analysis techniques using spWall engineering software program
to investigate and design tilt-up wall panels with openings are discussed.
Figure 1 – Reinforced Concrete Tilt-Up Wall Panel Geometry (with 10 x 15 ft Door Opening)

Version: Apr-13-2018
Contents
Left Leg Analysis and Design ....................................................................................................................................... 2
1. Minimum Vertical Reinforcement ........................................................................................................................... 2
2. Alternative Design Method ACI 318 Provisions ...................................................................................................... 3
3. Tilt-Up Wall Structural Analysis ............................................................................................................................. 3
3.1. Applied loads .................................................................................................................................................... 3
3.2. Maximum wall forces ....................................................................................................................................... 3
3.3. Tension-controlled verification ........................................................................................................................ 5
4. Tilt-Up Wall Cracking Moment Capacity (Mcr) ....................................................................................................... 5
5. Tilt-Up Wall Flexural Moment Capacity (ϕMn) ....................................................................................................... 5
6. Tilt-Up Wall Vertical Stress Check .......................................................................................................................... 6
7. Tilt-Up Wall Shear Stress Check ............................................................................................................................. 6
8. Tilt-Up Wall Mid-Height Deflection (Δs) ................................................................................................................ 6
Right Leg Analysis and Design ..................................................................................................................................... 7
9. Analysis and Design of the Section between the Design Strips ............................................................................... 8
10. Horizontal Reinforcement ........................................................................................................................................ 9
11. Tilt-Up Wall Panel Analysis and Design – spWall Software ................................................................................... 9
12. Design Results Comparison and Conclusions ........................................................................................................ 16
12.1. Comparison of Wall Modeling Methods ....................................................................................................... 17
12.2. Tilt-up Wall Stiffness Reduction ................................................................................................................... 25
12.3. Comparison of Load Type Effects ................................................................................................................ 26
12.4. Cracked Moment of Inertia Calculation Methods ......................................................................................... 26
13. Tilt-Up Wall Reinforcement and Cracking Coefficient Optimization ................................................................... 28
1
Code
Building Code Requirements for Structural Concrete (ACI 318-11) and Commentary (ACI 318R-11)
Reference
Design Guide for Tilt-Up Concrete Panels, ACI 551.2R-15, 2015, Example B.2
spWall Engineering Software Program Manual v5.01, STRUCTUREPOINT, 2016
Design Data
fc’ = 4,000 psi normal weight concrete (wc = 150 pcf)
fy = 60,000 psi
Wall length = lc = 31 ft – 1.5 ft = 29.5
Assumed wall thickness = 8.75 in. (Note: reference example started with a thickness of 6.25 in. that was deemed
not sufficient to meet tension control condition to use alternative design
method).
Assumed eccentricity = ecc = 3 in.
Assumed vertical reinforcement: 7 #6 (single layer) for the left leg (design strip)
7 #6 (single layer) for the right leg (design strip)
Solution
The effect of openings on out-of-plane bending in tilt-up panels can be approximated in hand calculations by a simple,
one-dimensional strip analysis that provides accuracy and economy for most designs. Where openings occur, the entire
lateral and axial load, including self-weight above the critical section, is distributed to supporting legs or design strips
at each side of the opening (sometimes referred to as wall piers). ACI 551.2R-15 (7.2)
The effective width of the strip should be limited to approximately 12 times the panel thickness to avoid localized
stress concentrations along the edge of the opening. This limit is not mandated by ACI 318, but is included as a
practical guideline where the opening width is less than one-half the clear vertical span. In most cases the tributary
width for loads can be taken as the width of the strip plus one-half the width of adjacent openings. Tilt-up design strips
should have constant properties for the full height and the reinforcement should not be cut off just above or below the
opening. Thickened vertical or horizontal sections can be introduced within the panel where openings are large or
where there are deep recesses on the exterior face. Some conditions may require ties around all vertical reinforcement
bars in a vertical pilaster for the full height of the tilt-up panel. ACI 551.2R-15 (7.2)

2
Left Leg Analysis and Design
Figure 2 – Tilt-Up Design Strips Tributary Widths for Loads
1. Minimum Vertical Reinforcement
, 3.08
0.00734 12 8.75
v vertical
l
A
b h
ACI 318-11 (2.1)
,min 0.0015l ACI 318-11 (14.3.2)
,min0.0073 0.0015 ( )l l o.k.
,max
3 3 8.75 26.25 in.smallest of smallest of smallest of 18 in.
18 in. 18 in. 18 in.l
hs
ACI 318-11 (7.6.5)
, ,max
4 126.86 in. 18 in.
7l provided ls s
o.k.

3
2. Alternative Design Method ACI 318 Provisions
The design guide for tilt-up concrete panels ACI 551 states that tilt-up concrete walls can be analyzed using the
provisions of Chapter 14 of the ACI 318-11. Most walls, and especially slender walls, are widely evaluated using
the “Alternative design of slender walls” in Section 14.8. The same provisions are presented in ACI 318-14 but
reorganized in different chapters and in slightly revised terminology. The method is applicable when the conditions
summarized below are met:
The cross section shall be constant over the height of the wall ACI 318-11 (14.8.2.2)
The wall can be designed as simply supported ACI 318-11 (14.8.2.1)
Maximum moments and deflections occurring at midspan ACI 318-11 (14.8.2.1)
The wall must be axially loaded ACI 318-11 (14.8.2.1)
The wall must be subjected to an out-of-plane uniform lateral load ACI 318-11 (14.8.2.1)
The wall shall be tension-controlled ACI 318-11 (14.8.2.3)
The reinforcement shall provide design strength greater than cracking strength ACI 318-11 (14.8.2.4)
3. Tilt-Up Wall Structural Analysis
3.1. Applied loads
The tributary width for loads can be taken as the width of the strip plus one-half the width of adjacent openings.
8.75 29.5 1 kip
Wall self-weight 150 4 1.5 5 31 15 15.9 kip12 2 1000 lb
Joist loads are divided between the individual legs
assuming an equivalent simply supported beam
across the top of the panel with the supports at the
centerline of each leg.
4.5 kip (for the left leg)DLP
4.7 kip (for the left leg)LLP
227.2 lb/ftw
3.2. Maximum wall forces
The calculation of maximum factored wall forces in accordance with 14.8.3 including moment magnification
due to second order (P-Δ) effects is shown below (load combination U = 1.2 D x 1.6 Lr x 0.5 W is considered
in this example):
1.2 4.5 1.6 4.7 12.9 kipuaP

4
12.9 1.2 15.9 32.0 kipumP
1 kip
0.5 27.2 4 5 0.122 kip/ft1000 lb
uw
251
0.75 48
ua
u
u c
c cr
MM
P l
E I
ACI 318-11 (Eq. 14-6)
22 0.122 29.5 12.9 3
14.9 ft-kip8 2 8 2 12
u c ua
ua
w l P eM
Where Mua is the maximum factored moment at midheight of wall due to lateral and eccentric vertical loads,
not including PΔ effects. ACI 318-11 (14.8.3)
'57,000 57,000 4,000 3,605,000 psic cE f ACI 318-11 (8.5.1)
3
2
3
w
cr se
l cI n A d c
ACI 318-11 (Eq. 14-7)
29,000
8.0 6.0 3,605
s
c
En
E o.k. ACI 318-11 (14.8.3)
Calculate the effective area of longitudinal reinforcement in a slender wall for obtaining an approximate
cracked moment of inertia.
232.0 8.75
3.08 3.61 in.2 2 60 8.75 / 2
um
se s
y
P hA A
f d
ACI 318-11 (R14.8.3)
The following calculations are performed with the effective area of steel in lieu of the actual area of steel.
'
3.61 601.33 in.
0.85 4 4 120.85
se y
c
A fa
f b
1
1.331.56 in.
0.85
ac
1.560.356 0.375 tension-controlled
4.375
c
d ACI 318-11 (R9.3.2.2)
0.9 ACI 318-11 (9.3.2)
3
2 44 12 1.56
8.0 3.61 4.375 1.56 292 in.3
crI
ACI 318-11 (Eq. 14-7)

5
10.75
ua
u
um
b
MM
P
K
ACI 318-11 (Eq. 14-6)
2 2
48 48 3605 29280.6 kip
5 5 29.5 12
c cr
b
c
E IK
l
14.931.7 ft-kip
32.01
0.75 80.6
uM
3.3. Tension-controlled verification ACI 318-11 (14.8.2.3)
32.035.5 kips
0.9
um
n
PP
,
' '
35.5 8.753.08 60
2 2 4.375 1.35 in.0.85 4 4 120.85 0.85
ns y
se w y
c w c w
P hA fA f da
f l f l
1
1.351.59 in.
0.85
ac
0.003 0.0030.003 4.375 0.003 0.0053 0.0050
1.59t td
c
Therefore, section is tension controlled ACI 318-11 (10.3.4)
4. Tilt-Up Wall Cracking Moment Capacity (Mcr)
Determine fr = Modulus of rapture of concrete and Ig = Moment of inertia of the gross uncracked concrete section
to calculate Mcr
'7.5 7.5 1.0 4,000 474.3 psir cf f ACI 318-11 (Eq. 9-10)
334
4 12 8.752680 in.
12 12
wg
l hI
8.754.375 in.
2 2t
hy
474.3 2680 1 124.2 ft-kip
4.375 1000 12
r g
cr
t
f IM
y
ACI 318-11 (Eq. 9-9)
5. Tilt-Up Wall Flexural Moment Capacity (ϕMn)
1.353.61 60 4.375 801.4 in.-kip 66.8 ft-kip
2 2n se y
aM A f d
It was shown previously that the section is tension controlled ϕ = 0.9

6
0.9 66.8 60.4 ft-kip 31.7 ft-kip n n uM M M o.k. ACI 318-11 (14.8.3)
60.4 ft-kip 24.4 ft-kip n crM M o.k. ACI 318-11 (14.8.2.4)
31.7 126.29 in.
0.75 0.75 80.6
u
u
b
M
K
ACI 318-11 (Eq. 14-5)
6. Tilt-Up Wall Vertical Stress Check
'32.0 1000
76.2 psi 0.06 0.06 4,000 240 psi 8.75 4 12
um
c
g
Pf
A
o.k. ACI 318-11 (14.8.2.6)
7. Tilt-Up Wall Shear Stress Check
In-plane shear is not evaluated since in-plane shear forces are not applied in this example. Out-of-plane shear due
to lateral load should be checked against the shear capacity of the wall. By inspection of the maximum shear forces
f, it can be determined that the maximum shear force is under 5 kip. The wall left leg (the weakest section) has a
shear capacity approximately 50 kip and no detailed calculations are required by engineering judgement. (See
figure 6 for detailed shear force diagram)
8. Tilt-Up Wall Mid-Height Deflection (Δs)
The maximum out-of-plane deflection (Δs) due to service lateral and eccentric vertical loads, including PΔ effects,
shall not exceed lc/150. Where Δs is calculated as follows: ACI 318-11 (14.8.4)
2
2 2 23 When 23 3 3
3
2 When
3
a cr
cr n cr a cr
n crs
a
cr a cr
cr
M M
M M
M M
MM M
M
ACI 318-11 (14.8.4)
Where Ma is the maximum moment at mid-height of wall due to service lateral and eccentric vertical loads
including PΔ effects.
a sa s sM M P
2
2
27.20.7 4 5 29.5
4.5 3 /121.612.2 ft-kip
8 2 8 1000 2
s c a
sa
w l P eM
wall self-weight 4.5 15.9 20.4 kips DLP P
24.2 ft-kip (as calculated perviously)r g
cr
t
f IM
y ACI 318-11 (Eq. 9-9)

7
22 24.2 12 29.5 125 5
0.392 in.48 48 3,605 2680
cr ccr
c g
M l
E I
ACI 318-11 (Eq. 14-10)
Δs will be calculated by trial and error method since Δs is a function of Ma and Ma is a function of Δs.
2Assume
3sa crM M
12.2Assume 0.392 0.198 in.
24.2
sa
s cr
cr
M
M
12.2 12 20.4 0.198 150.4 in.-kip 12.5 ft-kipa sa s sM M P
12.50.0.392 0.202 in.
24.2
a
s cr
cr
M
M
ACI 318-11 (Eq. 14-9)
No further iterations are required
2 2
12.5 ft-kip 24.2 16.1 ft-kip 3 3
a crM M o.k.
29.5 12
0.202 in. 2.36 in. 150 150
cs
l o.k.
The wall left leg is adequate with 7 #6 vertical reinforcement and 8.75 in. thickness.
Right Leg Analysis and Design
Repeating the same process for the right leg (right design strip) leads to the following results:
5.1kip (for the right leg)DLP
5.3 kip (for the right leg)LLP
227.2 lb/ftw
14.6 kipuaP
37.9 kipumP
0.150 kip/ftuw
18.1ft-kipuaM
23.71 in.seA
0.91 in.a

8
1.07 in.c
0.245 0.375 tension-controlledc
d
4355 in.crI
98.2 kipbK
37.3 ft-kipuM
36.3 ft-kipcrM
65.5 ft-kip 37.3 ft-kip n uM M o.k.
65.5 ft-kip 36.3 ft-kip n crM M o.k.
6.08 in.u
'60.2 psi 0.06 240 psi um
c
g
Pf
A o.k.
14.9 ft-kipsaM
0.392 in.cr
2
15.2 ft-kip 24.2 ft-kip 3
a crM M o.k.
0.164 in. 2.36 in. 150
cs
l o.k.
The wall right leg is adequate with 7 #6 vertical reinforcement and 8.75 in. thickness.
9. Analysis and Design of the Section between the Design Strips
For the vertical reinforcement for the section between the design strips, minimum area of steel should be provided
as follows:
,min 0.0015l ACI 318-11 (14.3.2)
Try single layer panel reinforcement of 9 #4.
, 9 0.20
0.001710 12 8.75
v vertical
l
A
b h
ACI 318-11 (2.1)
,min0.0017 0.0015 ( )l l o.k.

9
,max
3 3 8.75 26.25 in.smallest of smallest of smallest of 18 in.
18 in. 18 in. 18 in.l
hs
ACI 318-11 (7.6.5)
, ,max
10 1213.3 in. 18 in.
9l provided ls s
o.k.
10. Horizontal Reinforcement
,min 0.00200h ACI 318-11 (14.3.3)
Try single layer panel reinforcement of 33 #4.
, 33 0.20
0.0020331 12 8.75
v vertical
l
A
b h
ACI 318-11 (2.1)
,min0.00203 0.00200 ( )h h o.k.
Additional reinforcement requirements are outlined in ACI 318-11 (14.3.7) for header and jambs of openings.
11. Tilt-Up Wall Panel Analysis and Design – spWall Software
spWall is a program for the analysis and design of reinforced concrete shear walls, tilt-up walls, precast walls and
Insulate Concrete Form (ICF) walls. It uses a graphical interface that enables the user to easily generate complex
wall models. Graphical user interface is provided for:
Wall geometry (including any number of openings and stiffeners)
Material properties including cracking coefficients
Wall loads (point, line, and area),
Support conditions (including translational and rotational spring supports)
spWall uses the Finite Element Method for the structural modeling, analysis, and design of slender and non-
slender reinforced concrete walls subject to static loading conditions. The wall is idealized as a mesh of
rectangular plate elements and straight line stiffener elements. Walls of irregular geometry are idealized to
conform to geometry with rectangular boundaries. Plate and stiffener properties can vary from one element to
another but are assumed by the program to be uniform within each element.
Six degrees of freedom exist at each node: three translations and three rotations relating to the three Cartesian
axes. An external load can exist in the direction of each of the degrees of freedom. Sufficient number of nodal
degrees of freedom should be restrained in order to achieve stability of the model. The program assembles the
global stiffness matrix and load vectors for the finite element model. Then, it solves the equilibrium equations to
obtain deflections and rotations at each node. Finally, the program calculates the internal forces and internal
moments in each element. At the user’s option, the program can perform second order analysis. In this case, the

10
program takes into account the effect of in-plane forces on the out-of-plane deflection with any number of
openings and stiffeners.
In spWall, the required flexural reinforcement is computed based on the selected design standard (ACI 318-11 is
used in this example), and the user can specify one or two layers of wall reinforcement. In stiffeners and boundary
elements, spWall calculates the required shear and torsion steel reinforcement. Wall concrete strength (in-plane
and out-of-plane) is calculated for the applied loads and compared with the code permissible shear capacity.
For illustration and comparison purposes, the following figures provide a sample of the input modules and results
obtained from an spWall model created for the reinforced concrete wall in this example.
Figure 3 –Defining Loads for Tilt-Up Wall Panel with Opening (spWall)

11
Figure 4 –Factored Axial Forces Contour Normal to Tilt-Up Wall Panel Design Strips Cross-Sections (spWall)

12
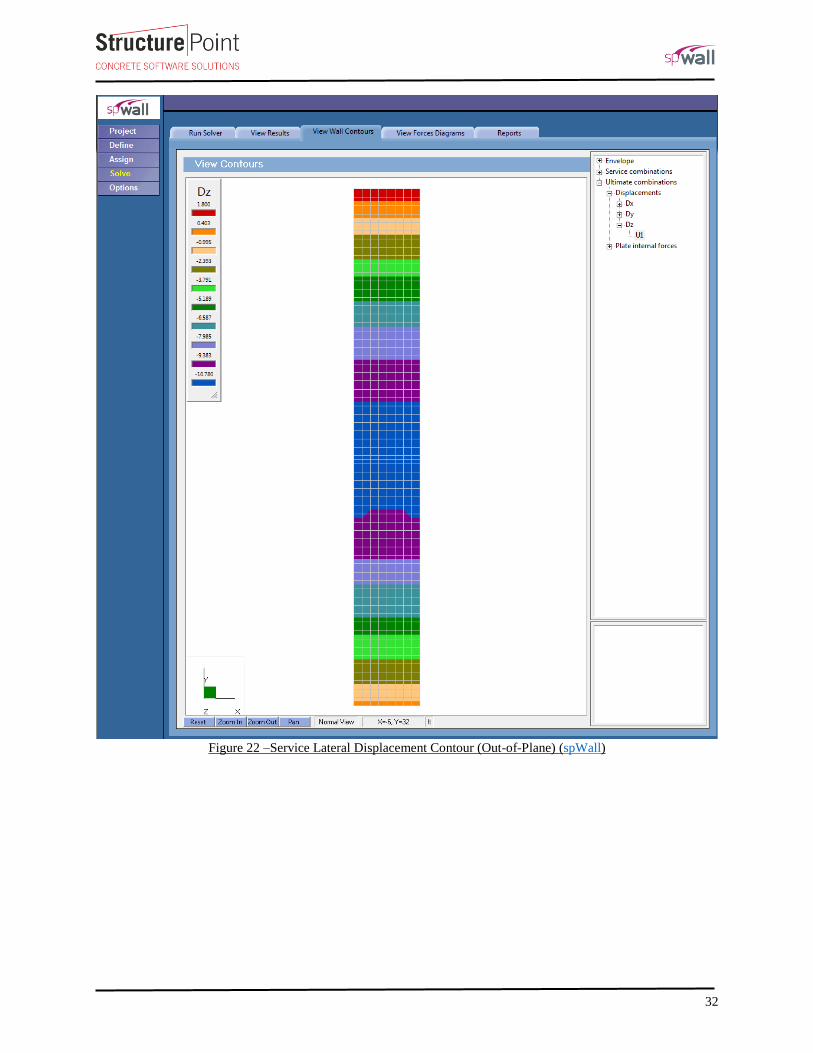
Figure 5 – Tilt-Up Wall Panel Service Lateral Displacement Contour (Out-of-Plane) (spWall)

15
Figure 8 – Tilt-Up Wall Panel with Opening Displacement at Critical Sections (Service Combinations) (spWall)
Figure 9 – Tilt-Up Wall Panel with Opening Displacement at Critical Sections (Ultimate Combinations) (spWall)

16
Figure 10 – Tilt-Up Wall Panel with Opening Cross-Sectional Forces (spWall)
12. Design Results Comparison and Conclusions
The model shown above was created in spWall taking into account the ACI 318-11 provisions (alternative design
method) and ACI 551 recommendations regarding the analysis and design of tilt-up wall panels with openings in order
to match the results presented in the reference. In this model the left and right design strips are modeled such that the
entire lateral and axial load, including self-weight above the critical section, are distributed to the two strips at each
side of the opening. The tributary width for loads was taken as the width of the strip plus one-half the width of the
opening. The following table shows the comparison between hand and reference results with spWall model results.
Table 1 – Comparison of Tilt-Up Wall Panel with Opening Analysis and Design Results
Solution Mu (kip-ft) Nu (kip) Dz,service (in.) Dz,ultimate (in.)
Design Strip Left Right Left Right Left Right Left Right
Hand 31.70 37.30 32.00 37.90 0.202 0.161 6.29 6.08
Reference 31.70 37.30 32.00 37.90 0.202 0.161 6.29 6.08
spWall 32.07 37.71 32.00 37.88 0.204 0.164 6.34 6.11
The results of all the hand calculations and the reference used illustrated above are in agreement with the automated
exact results obtained from the spWall program.

17
12.1. Comparison of Wall Modeling Methods
ACI 318 provides the alternative design method as a simple and accurate option for analysis and design of simple
walls meeting the method conditions. Other methods such as finite element analysis can be used to address panels not
meeting the numerous limitations of the alternative design method (cantilevered walls, variable thickness and width,
walls with openings, non-standard boundary conditions, walls with high compressive loads, in-plane lateral loads,
non-standard concentrated load position from attachments of piping, racking etc., concentrated out of plane loads).
The exact wall geometry and applied loads were modeled using spWall engineering software to investigate the
differences between the simplified approximate method and the finite element method. For illustration and comparison
purposes, the following figures provide a sample of the results obtained from an spWall model created for the
reinforced concrete wall in this example using exact wall geometry and applied loads.
It is very important to consider the wind load applied to the door opening and how it must be considered and applied
in the model based on the door boundary condition. In this example, the door support reactions are assumed along the
left and right side of the door opening. Load is modeled as an equivalent uniform line load applied along the right
edge of the left leg and the left side of the right leg. The magnitude of this load is calculated as follows:
10 127.2 0.136 kip/ft
2 1000doorW

18
Figure 11 –Factored Axial Forces Contour - Exact Geometry and Loads (spWall)

19
Figure 12 – Tilt-Up Wall Panel Service Lateral Displacement Contour (Out-of-Plane) - Exact Geometry and Loads
(spWall)

20
Figure 13 – Out-of-plane Shear Diagram - Exact Geometry and Loads (spWall)

21
Figure 14 – Tilt-Up Wall Panel with Opening Moment Diagram – Exact Geometry and Loads (spWall)

22
Figure 15 – Displacement at Critical Sections – Exact Geometry and Loads (Service Combinations) (spWall)
Figure 16 – Displacement at Critical Sections – Exact Geometry and Loads (Ultimate Combinations) (spWall)

23
Figure 17 – Tilt-Up Wall Panel with Opening Cross-Sectional Forces – Exact Geometry and Loads (spWall)
Table 2 – Comparison of Analysis Methods
Solution Mu (kip-ft) Nu (kips) Dz,service (in.) Dz,ultimate (in.)
Left Right Total Left Right Total Left Right Left Right
Simplified Model
Approximate Design Strips 32.07 37.71 69.78 32 37.88 69.88 0.204 0.164 6.34 6.11
Complete Model
Exact Geometry and Loads --- --- 59.88 --- --- 69.85 0.151 0.143 4.96 4.63
Using the complete model with the exact wall geometry and applied loads compared with the simplified model of two
equivalent design strips results in:
1. Reduction in the required moment capacity by 14%
2. Reduction in the out-of-plane displacements, at service and ultimate levels by 19% to 23% respectively.
The complete model, as shown in the following figure, displays a complete view of the torsional moment distribution
indicating areas of torsional stress concentration at opening edges. This corresponds to the additional reinforcement
requirements outlined in ACI 318-11 (14.3.7) for header and jambs of openings for improved serviceability.

24
Figure 18 – Tilt-Up Wall Panel with Opening Torsional Moment Contour (spWall)

25
12.2. Tilt-up Wall Stiffness Reduction
In column and wall analysis, section properties shall be determined by taking into account the influence of axial loads,
the presence of cracked regions along the length of the member, and the effect of load duration (creep effects). ACI
318 permits the use of reduced moment of inertia values of 0.70 Ig for uncracked walls and 0.35Ig for cracked
walls. ACI 318-11 (10.10.4.1)
In spWall program, these effects are accounted for where the user can input reduced moment of inertia using “cracking
coefficient” values for plate and stiffener elements to effectively reduce stiffness. Cracking coefficients for out-of-
plane (bending and torsion) and in-plane (axial and shear) stiffness can be entered for plate elements. Because the
values of the cracking coefficients can have a large effect on the analysis and design results, the user must take care
in selecting values that best represent the state of cracking at the particular loading stage. Cracking coefficients are
greater than 0 and less than 1.
At ultimate loads, a wall is normally in a highly cracked state. The user could enter a value of out-of-plane cracking
coefficient for plates of Icracked/Igross based on estimated values of As. after the analysis and design, if the computed
value of As greatly differs from the estimated value of As, the analysis should be performed again with new values for
the cracking coefficients. A factor 0.75 can be also used to reduce the calculated bending stiffness of the concrete
section in accordance with ACI 318-11, Chapters 10 and 14. It is intended to account for variations in material
properties and workmanship. This reduction factor in bending stiffness should be incorporated by all other alternate
design methods to comply with the requirements of ACI 318 as ACI 551 committee stated.
At service loads, a wall may or may not be in a highly cracked state. For service load deflection analysis, a problem
should be modeled with an out-of-plane cracking coefficient for plates of (Ieffective/Igross).
Based on the previous discussion, the ratio between Icr and Ig including the reduction factor (0.75) can be used as the
cracking coefficient for the out-of-plane case for the ultimate load combinations. In this example, Icr and Ig were found
to be equal to 292 in.4 and 2,680 in.4 for the left leg (design strip). Thus, the out-of-plane cracking coefficient for
ultimate load combinations for the left leg can be found as follows:
0.75 0.75 292 cracking coefficient 0.082
2,680
cr
g
I
I
For the service load combinations, it was found that Ma for the left leg equals to 12.5 ft-kip which is less than Mcr =
24.2 ft-kip. That means the left leg section is uncracked and the cracking coefficient can be taken equal to 1.

26
Figure 19 – Defining Cracking Coefficient (spWall)
12.3. Comparison of Load Type Effects
During the process of analyzing the tilt-up wall panels, the effect of load type on the wall behavior at the critical
section was investigated in terms of out-of-plane deflection at service and ultimate level, required axial capacity, and
required out-of-plane moment capacity.
Table 3 – Effect of Load Type on the Wall Behavior
Solution Mu (kip-ft) Nu (kips) Dz,service (in.) Dz,ultimate (in.)
Left Right Total Left Right Total Left Right Left Right
Actual Joists Point Loads --- --- 59.88 --- --- 69.85 0.151 0.143 4.96 4.63
Equivalent Uniform Line Load --- --- 58.90 --- --- 69.85 0.151 0.143 4.97 4.63
Using equivalent uniform line load along the section width to represent the actual joists point loads has only a slight
effect on the results obtained at the critical section (mid-height of the unbrace wall length). However, modeling point
loads to reflect actual behavior and stress distribution is beneficial in cases where there are openings, variable
thicknesses, changes in geometry, intermediate supports, and other variations from a simply supported wall with
constant width and thickness.
12.4. Cracked Moment of Inertia Calculation Methods
The cracked moment of inertia for tilt-up wall panels can be calculated using different ACI 318 provisions. The
following shows the commonly used provisions to calculate the cracked moment of inertia:
1. 0.35 Ig for cracked walls and 0.75 Ig for uncracked walls ACI 318-11 (10.10.4.1)
2. When treating the wall as compression member:
0.80 25 1 0.5 0.875st u u
g g
g u o
A M PI I
A P h P
ACI 318-11 (Eq. 10-8)

27
3. When treating the wall as flexural member:
0.10 25 1.2 0.2 0.5w
g g
bI I
d
ACI 318-11 (Eq. 10-9)
4. Using the moment magnification procedure for nonsway frames:
0.2
1
c g s se
dns c
E I E I
E
ACI 318-11 (Eq. 10-14)
5. Using the moment magnification procedure for nonsway frames:
0.4
1
c g
dns c
E I
E
ACI 318-11 (Eq. 10-15)
6. Using the alternative design method of slender walls:
3
2
3
w
se
l cn A d c
ACI 318-11 (Eq. 14-7)
Equation 14-7 is used in this example to calculate the cracked moment of inertia for the wall section modeled in
spWall. This is intended to best match the reference approach using the alternative design method to analyze and
design the tilt-up wall panels.
The variation in the magnitude of Icr has a significant effect on the analysis results and specifically the wall moments
and displacement. In the following table a comparison of the resulting values based on variation of the Icr is
summarized for information.
Table 3 – Comparison of Icr Effect on Results
Method
Icr,
in.4
Cracking coefficient
(α) for spWall
Mu,
kip-ft
Dz,service,
in.
Dz,ultimate,
in.
Left Right Left Right Left Right Total Left Right Left Right
10.10.4.1 938 1407 0.350 0.350 17.03 20.03 37.06 0.203 0.164 0.80 0.63
Eq. 10-8 2345 3517 0.875 0.875 15.66 18.77 34.43 0.203 0.164 0.29 0.24
Eq. 10-9 607 715 0.227 0.178 18.49 22.43 40.92 0.203 0.164 1.33 1.37
Eq. 10-14 126 159 0.047 0.040 177.67 121.55 299.22 0.203 0.164 59.8 32.2
Eq. 10-15 133 200 0.050 0.050 109.04 57.51 166.55 0.203 0.164 34.6 12.3
Eq. 14-7 291 356 0.109 0.088 29.68 29.79 59.47 0.204 0.164 5.46 3.65
Eq. 14-7 with reduction
factor (from 14-6) 218 267 0.081 0.066 32.41 37.85 70.26 0.204 0.164 6.46 6.16
From the table above the following can be observed:
1. The values above reveal the necessity to carefully select Icr value (and the corresponding α value) to ensure
the wall moment capacity and estimated deflections are calculated with sufficient conservatism ensuring
adequate strength and stability.

28
2. The Dz,service values are unaffected by the method used to calculate Icr since the section is uncracked and the
cracking coefficient α is taken as 1.
3. The Dz,ultimate, values are calculated however are not used in any calculations and the deflection limits are
given for Dz,service only.
4. The range of the cracking coefficient and the cracked moment of inertia values vary widely based on the
equation used.
5. In this example the spWall model utilized the value of the cracked moment of inertia using the alternative
design method equation Eq. 14-7 with reduction factor from 14-6.
13. Tilt-Up Wall Reinforcement and Cracking Coefficient Optimization
In the previous models, the cracking coefficients were selected based on the area of steel used by the reference and
equation 14-7 with the reduction factor to best match the reference. The reinforcement selected in the reference is
conservative and results in a higher cracking moment of inertia leading to lower values of reinforcement to be obtained
by spWall.
To explore this topic in further details, the left leg (design strip) model results will be used. Icr for this model based on
7 #6 bars (As = 3.08 in.2) vertical reinforcement was found to be equal to 292 in.4 which leads to a 0.08172 cracking
coefficient (the model outputs are highly dependent on and sensitive to the cracking coefficient and up to 4 significant
figures is recommended). Using this value, the required area of steel of 1.18 in.2 is less than the provided area of steel
used to calculate the cracking coefficient by 61.7%. This is expected since the provided area of steel in reference
example is much higher than the required (ϕMn = 60.4 ft-kip >> Mu = 31.7 ft-kip).
The use of the required area of steel from this model in this case is insufficient because it is based on a high assumed
value of the cracking coefficient. To confirm this, a model was reanalyzed using the new required area of steel (1.18
in.2) to calculate the cracking coefficient (0.05276). spWall in this case shows that the model is failing and the
following error will be provided:

29
Figure 20 – Failing Reinforcement Error (spWall)
In order to find the optimum required area of steel and the associated cracking coefficient for ultimate combinations
using spWall, the following procedure should be followed: spWall Manual v5.01 (2.7)
1. Estimate the value of As.
2. Calculate Ase using the following equation:
2
um
se s
y
P hA A
f d
ACI 318-11 (R14.8.3)
Where Ase is the effective area of longitudinal reinforcement in a slender wall.
3. Calculate Icr using the following equation:
3
2
3
w
cr se
l cI n A d c
ACI 318-11 (Eq. 14-7)
4. Calculate the cracking coefficient using the following equation:

30
0.75 cracking coefficient cr
g
I
I
Where the 0.75 is bending stiffness reduction factor of the concrete section in accordance with ACI 318-11,
Chapters 10 and 14. It is intended to account for variations in material properties and workmanship.
5. Run the first model in spWall using the initial cracking coefficient. After analysis and design, if the computed
value of As (As,n+1) is greatly differs from the estimated value of As ( As,n), the analysis should be performed
again with new values of As and cracking coefficient until As,n ≈ As,n+1.
The following table shows the iteration stages to obtain the optimum area of steel for the left leg (design strip) wall of
this example using the procedure described above:
Table 4 - Area of Steel Optimization (Using the Proposed Procedure)
Iteration # As,n, in.2 As,n+1, in.2 Difference, %
1 3.080 1.180* 61.7
2 1.220** 26.600 -2080.3
3 2.150 1.660 22.8
4 1.660 2.320 -39.8
5 1.905 1.920 -0.8
6 1.910 1.910 0.0 * Model wall reinforcement design failed ** The lowest wall reinforcement value that will produce a viable model
Using this procedure above for the left leg, we started with 3.080 in.2, the value used by the reference. After a few
iterations with averaging of two consecutive reinforcement areas, it was found that the solution converged at 1.91 in.2
as the optimum reinforcement area. For illustration and comparison purposes, the following figures provide a sample
of the results obtained from the spWall model created for the reinforced concrete wall with the optimum area of steel
(1.91 in.2).

31
Figure 21 –Factored Axial Forces Contour Normal to the Left Design Strip Cross-Section (spWall)

36
Figure 26 – Lateral Displacement at Critical Sections (Service Combinations) (spWall)
Figure 27 – Lateral Displacement at Critical Sections (Ultimate Combinations) (spWall)

37
Figure 28 –Cross-Sectional Forces (spWall)
Figure 29 – Cross-Sectional Vertical Reinforcement (spWall)
The hand calculation procedure shown earlier is repeated for the left leg based on the optimum area of steel (As = 1.91
in.2) as follows:
4.5 kip (for the left leg)DLP
4.7 kip (for the left leg)LLP
227.2 lb/ftw
12.9 kipuaP
∑As,i = 3.82 in.2/ft
Element width = 0.5 ft
∑As,i = 3.82 in.2/ft x 0.5 ft = 1.91 in.2

38
31.6 kipumP
0.122 kip/ftuw
14.9 ft-kipuaM
22.44 in.seA
0.90 in.a
1.054 in.c
0.241 0.375 tension-controlledc
d
4235 in.crI
64.9 kipbK
42.6 ft-kipuM
24.2 ft-kipcrM
43.1ft-kip 42.6 ft-kip n uM M o.k.
43.1ft-kip 24.4 ft-kip n crM M o.k.
10.5 in.u
'75.3 psi 0.06 240 psi um
c
g
Pf
A o.k.
12.2 ft-kipsaM
0.393 in.cr
2
12.5 ft-kip 24.2 ft-kip 3
a crM M o.k.
0.203 in. 2.36 in. 150
cs
l o.k.
The above calculations reveal a reduction in the cracked moment of inertia resulting in an increase in the Mu
applied. Note that the moment capacity is now very close to the required moment.

39
The following table shows the comparison between hand results with spWall model results for the optimum area of
steel.
Table 5 – Comparison of Analysis and Design Results for the Tilt-Up Wall with Optimum Area of Steel
Solution Mu (kip-ft) Nu (kip) Dz,service (in.) Dz,ultimate (in.) As,required (in.2)
Hand 42.6 31.6 0.203 10.5 1.91
spWall 44.0 32.0 0.204 10.7 1.91
After following the reinforcement optimization procedure, the results of all the hand calculations used above are in
agreement with the automated exact results obtained from the spWall program including the required area of steel.