Reimagining ASEAN: The Philippines reports on ASEAN trade ...€¦ · ASEAN’s regional economic...
8
Deutsche Bank Global Transaction Banking Reimagining ASEAN: The Philippines reports on ASEAN trade integration December 2017 With thanks to Bangko Sentral Ng Pilipinas and the Philippines Department of Finance for their detailed input to this report and our “Reimagining ASEAN” series.
Transcript of Reimagining ASEAN: The Philippines reports on ASEAN trade ...€¦ · ASEAN’s regional economic...

Deutsche BankGlobal Transaction Banking
Reimagining ASEAN: The Philippines reports on ASEAN trade integration
December 2017
With thanks to Bangko Sentral Ng Pilipinas and the Philippines Department of Finance for their detailed input to this report and our “Reimagining ASEAN” series.

2
The Philippines reports on ASEAN trade integration
As part of our “Reimagining ASEAN” series, we asked the Philippines’ Bangko Sentral Ng Pilipinas (BSP) and the Department of Finance for their inputs into ASEAN’s economic and trade outlook.
How have ASEAN trade patterns changed over the past decade?
Trade growth trends for the ASEAN region have tended to follow those of world trade (as shown in Figure 1), suffering a severe collapse in late 2008 at the height of the global financial crisis. The recovery has been sluggish ever since.
However, while ASEAN trade growth has fallen in ASEAN in recent years, the level of intra-regional trade activity among ASEAN economies has actually increased since the 1990s. Whereas in 1991, the volume of intra-ASEAN trade as a percentage of total ASEAN trade stood at 18%, by 2015, intra-ASEAN trade comprised approximately 24% of total ASEAN trade.
Figure 1: ASEAN trade, 1991-2015
Intra-ASEAN trade also accounted for 22.4% of the region’s total GDP in 2015. Already, it has become an important export market (with a share of 20% or higher) for most of the ASEAN Member States
Note: Data in Italics are the latest updated/revised figures.
Material from: ASEAN Merchandise Trade Statistics Database. See http://asean.org/storage/2015/12/table18_as-of-10-June-2016.pdf.
Figure 2: Intra- and Extra-ASEAN Trade (2015). Share to total exports in %.
Total exports value in USD million.
Country
Share to total exports
Total exports
Share to total imports
Total imports
Share to total trade
Total tradeIntra-ASEAN
Extra-ASEAN
Intra-ASEAN
Extra-ASEAN
Intra-ASEAN
Extra-ASEAN
Brunei Darussalam 19.5 80.5 8,709.4 46.2 53.8 4,180.9 28.2 71.8 12,890.3
Cambodia 9.0 91.0 9,825.5 33.9 66.1 12,933.9 23.1 76.9 22,759.3
Indonesia 22.3 77.7 150,282.3 21.0 79.0 142,694.8 21.7 78.3 292,977.1
Lao PDR 71.2 28.8 3,714.3 56.1 43.9 3,049.2 64.4 35.6 6,763.5
Malaysia 28.1 71.9 199,869.2 26.5 73.5 175,961.0 27.4 72.6 375,830.3
Myanmar 37.5 62.5 11,431.8 41.6 58.4 16,843.6 39.9 60.1 28,275.4
Philippines 14.6 85.4 58,648.4 24.3 75.7 70,295.3 19.9 80.1 128,943.8
Singapore 32.3 67.7 366,344.3 21.5 78.5 296,764.9 27.5 72.5 663,109.2
Thailand 28.9 71.1 214,396.2 21.2 78.8 202,751.2 25.1 74.9 417,147.4
Vietnam 11.1 88.9 162,013.9 14.4 85.6 165,729.9 12.8 87.2 327,743.7
ASEAN 25.8 74.2 1,185,235.3 21.9 78.1 1,091,204.7 24.0 76.0 2,276,440.0
40.0
30.0
1991
1992
1993
1994
1995
1996
1997
1998
1999
2000
2001
2002
2003
2004
2005
2006
2007
2008
2009
2010
2011
2012
2013
2014
2015
20.0
10.0
(10.0)
(20.0)
(30.0)
ASEAN intra-trade share to total (%)
ASEAN intra-trade growth (%)ASEAN trade growth (%)
Global trade growth (%)
-
Material from: ADB Asia Regional Integration Centre
3Reimagining ASEAN
(AMS), and a very important import supplier (with a share of 20% or higher) for nearly all AMS (see Figure 2).
Electronics products and mineral fuels/oils are the most common goods traded intra-regionally – these products comprised a 21.8% and 20.7% share of total intra-ASEAN trade respectively in 2015.
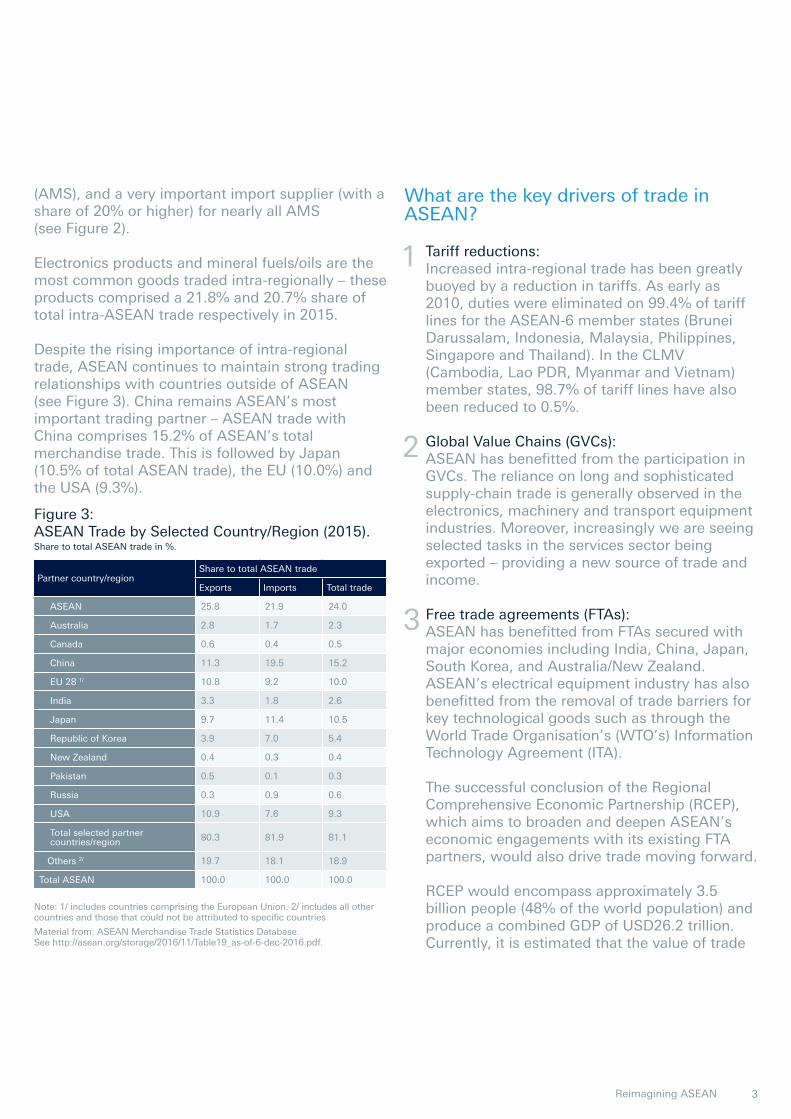
Despite the rising importance of intra-regional trade, ASEAN continues to maintain strong trading relationships with countries outside of ASEAN (see Figure 3). China remains ASEAN’s most important trading partner – ASEAN trade with China comprises 15.2% of ASEAN’s total merchandise trade. This is followed by Japan (10.5% of total ASEAN trade), the EU (10.0%) and the USA (9.3%).
What are the key drivers of trade in ASEAN?
Tariff reductions:Increased intra-regional trade has been greatly buoyed by a reduction in tariffs. As early as 2010, duties were eliminated on 99.4% of tariff lines for the ASEAN-6 member states (Brunei Darussalam, Indonesia, Malaysia, Philippines, Singapore and Thailand). In the CLMV (Cambodia, Lao PDR, Myanmar and Vietnam) member states, 98.7% of tariff lines have also been reduced to 0.5%.
Global Value Chains (GVCs): ASEAN has benefitted from the participation in GVCs. The reliance on long and sophisticated supply-chain trade is generally observed in the electronics, machinery and transport equipment industries. Moreover, increasingly we are seeing selected tasks in the services sector being exported – providing a new source of trade and income.
Free trade agreements (FTAs): ASEAN has benefitted from FTAs secured with major economies including India, China, Japan, South Korea, and Australia/New Zealand. ASEAN’s electrical equipment industry has also benefitted from the removal of trade barriers for key technological goods such as through the World Trade Organisation’s (WTO’s) Information Technology Agreement (ITA).
The successful conclusion of the Regional Comprehensive Economic Partnership (RCEP), which aims to broaden and deepen ASEAN’s economic engagements with its existing FTA partners, would also drive trade moving forward.
RCEP would encompass approximately 3.5 billion people (48% of the world population) and produce a combined GDP of USD26.2 trillion. Currently, it is estimated that the value of trade
1
2
3
Note: 1/ includes countries comprising the European Union. 2/ includes all other countries and those that could not be attributed to specific countries
Material from: ASEAN Merchandise Trade Statistics Database. See http://asean.org/storage/2016/11/Table19_as-of-6-dec-2016.pdf.
Partner country/region Share to total ASEAN trade
Exports Imports Total trade
ASEAN 25.8 21.9 24.0
Australia 2.8 1.7 2.3
Canada 0.6 0.4 0.5
China 11.3 19.5 15.2
EU 28 1/ 10.8 9.2 10.0
India 3.3 1.8 2.6
Japan 9.7 11.4 10.5
Republic of Korea 3.9 7.0 5.4
New Zealand 0.4 0.3 0.4
Pakistan 0.5 0.1 0.3
Russia 0.3 0.9 0.6
USA 10.9 7.6 9.3
Total selected partner countries/region 80.3 81.9 81.1
Others 2/ 19.7 18.1 18.9
Total ASEAN 100.0 100.0 100.0
Figure 3: ASEAN Trade by Selected Country/Region (2015). Share to total ASEAN trade in %.
4
between the Philippines and RCEP members is USD60 billion.1
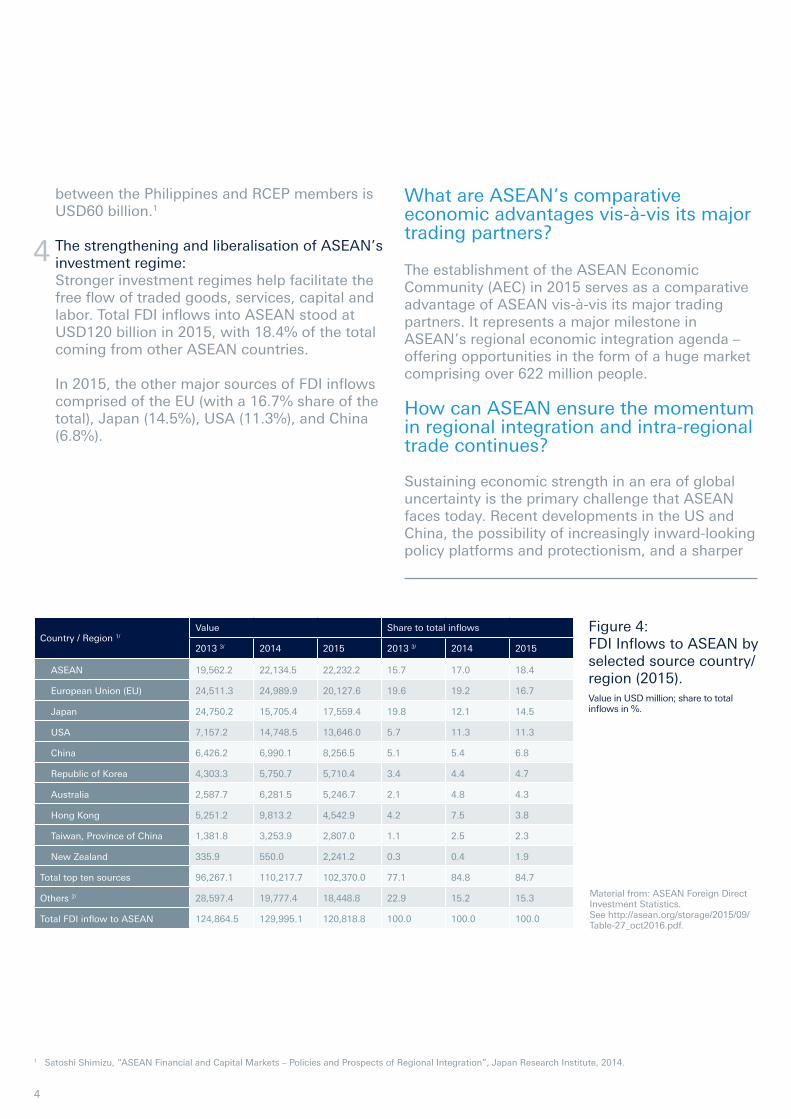
The strengthening and liberalisation of ASEAN’s investment regime: Stronger investment regimes help facilitate the free flow of traded goods, services, capital and labor. Total FDI inflows into ASEAN stood at USD120 billion in 2015, with 18.4% of the total coming from other ASEAN countries.
In 2015, the other major sources of FDI inflows comprised of the EU (with a 16.7% share of the total), Japan (14.5%), USA (11.3%), and China (6.8%).
4
What are ASEAN’s comparative economic advantages vis-à-vis its major trading partners? The establishment of the ASEAN Economic Community (AEC) in 2015 serves as a comparative advantage of ASEAN vis-à-vis its major trading partners. It represents a major milestone in ASEAN’s regional economic integration agenda – offering opportunities in the form of a huge market comprising over 622 million people.
How can ASEAN ensure the momentum in regional integration and intra-regional trade continues?
Sustaining economic strength in an era of global uncertainty is the primary challenge that ASEAN faces today. Recent developments in the US and China, the possibility of increasingly inward-looking policy platforms and protectionism, and a sharper
Country / Region 1/Value Share to total inflows
2013 3/ 2014 2015 2013 3/ 2014 2015
ASEAN 19,562.2 22,134.5 22,232.2 15.7 17.0 18.4
European Union (EU) 24,511.3 24,989.9 20,127.6 19.6 19.2 16.7
Japan 24,750.2 15,705.4 17,559.4 19.8 12.1 14.5
USA 7,157.2 14,748.5 13,646.0 5.7 11.3 11.3
China 6,426.2 6,990.1 8,256.5 5.1 5.4 6.8
Republic of Korea 4,303.3 5,750.7 5,710.4 3.4 4.4 4.7
Australia 2,587.7 6,281.5 5,246.7 2.1 4.8 4.3
Hong Kong 5,251.2 9,813.2 4,542.9 4.2 7.5 3.8
Taiwan, Province of China 1,381.8 3,253.9 2,807.0 1.1 2.5 2.3
New Zealand 335.9 550.0 2,241.2 0.3 0.4 1.9
Total top ten sources 96,267.1 110,217.7 102,370.0 77.1 84.8 84.7
Others 2/ 28,597.4 19,777.4 18,448.8 22.9 15.2 15.3
Total FDI inflow to ASEAN 124,864.5 129,995.1 120,818.8 100.0 100.0 100.0
Figure 4: FDI Inflows to ASEAN by selected source country/region (2015). Value in USD million; share to total inflows in %.
Material from: ASEAN Foreign Direct Investment Statistics. See http://asean.org/storage/2015/09/Table-27_oct2016.pdf.
1 Satoshi Shimizu, “ASEAN Financial and Capital Markets – Policies and Prospects of Regional Integration”, Japan Research Institute, 2014.
5Reimagining ASEAN
than expected tightening in global financial conditions are among the factors which could potentially drag the region’s growth prospects over the near and medium term.
Given a highly uncertain global environment, it is now imperative for the region to strengthen its integration efforts, and eliminate intra-regional barriers to trade. If resources in the region are leveraged according to each country’s comparative advantages – the region as a whole will benefit from increased productivity and efficiency – and by extension economic welfare can be improved. But how can ASEAN facilitate integration and the continued growth of intra-regional trade?
Already progress has been made in terms of tariff reductions. There has also been progress in financial liberalization initiatives and the
development of financial safety nets. An example is the Chiang Mai Initiative Multilateralization (or CMIM) launched in 2014 between the ASEAN member countries, The People’s Republic of China, Japan, South Korea and the Hong Kong Monetary Authority.2
However, the presence of non-tariff measures (NTMs) ranging from quantitative restrictions to technical regulations, as well as standards and customs rules, among others, continues to inhibit the free flow of goods.
It has also not proved easy to establish the region as a single investment market – although progress is being made. Relatively less developed ASEAN countries tend to be more open to investment in agriculture and mining, while other ASEAN members tend to be more open to manufacturing. The region’s rising costs of doing business are still another concern for investors in ASEAN.
How can the growing trend of IoT (Internet of Things) and automation impact the attractiveness of ASEAN member states as a destination for direct investment?
The growing trend of IoT and automation presents a tremendous opportunity for ASEAN. According to a study conducted by the International Labour Organization (ILO) 3, automation will have a substantial impact on key sectors within the region.
Automotive and auto parts: ASEAN has become a dominant player in the automotive industry and the automotive sector is one of the sectors most receptive to adopting available technologies (e.g., electrification of vehicles and vehicular components, advancement in lightweight materials, robotic automatic, among others).
2 See http://www.bsp.gov.ph/downloads/Publications/FAQs/CMIM.pdf for a more detailed explanation of the Chiang Mai Initiative Multilateralization.
3 International Labour Organisation, “ASEAN in Transformation: How Technology Is Changing Jobs and Enterprises”, 2016.
6
Electrical and electronics (E&E): One of ASEAN’s most prominent sectors – the mainstay of economic growth as the region jumps up the value ladder and shifts away from low-cost production.
Textiles, clothing and footwear (TCF): TCF in ASEAN is predominantly shaped by large multinational brands and retailers. While automation will encourage displacement of lower-skilled workers, it will increase the demand for higher skilled technicians and engineers to serve niche apparel products.
Business process outsourcing (BPO): These activities are prominent in ASEAN – especially in the Philippines. Cloud computing, software automation and knowledge process outsourcing are three technologies that are impacting the sector.
While cloud computing promises growth for the Philippines, software robots also pose a threat. Many BPO players in the Philippines are shifting their services towards knowledge process outsourcing – a higher value BPO service. Increases in the provision of BPO services will further raise the skills requirement of the sector. Highly skilled workers (for example those with credentials in medicine, business, law, finance, accounting, and data analysis) will be sought to provide added value and sector-specific skills.
Retail: ASEAN’s retail sector is primed for growth. However, disruptive technologies (such as mobile and e-Commerce platforms, IoT, cloud technology, and big data analytics) are still yet to achieve mainstream usage in the region.
We expect that ASEAN’s requirements of their workers in the retail space will change as a result of technological developments – demand will increase
for workers with the ability to keep up with the digital age. For example, enterprises seeking to intensify their e-Commerce and mobile shopping presence will increasingly recruit individuals with strong digital marketing and social media skills. In addition, demand for workers with technical capabilities in areas such as data analysis, programming and supply chain management is also likely to increase.
To capitalise on the sector’s growth opportunity and foreign direct investments, policy-makers urgently need to raise skills levels and innovatively connect skills providers to enterprise needs. In particular, more effort is needed to encourage studies in science, technology, engineering and mathematics – STEM disciplines that spur the availability of higher skilled labour.
What are the previously missed opportunities and future potentials that the private and public sectors can target in the run-up to AEC 2025?
The introduction of a new pillar under the AEC 2025 Blueprint – entitled “A Resilient, Inclusive, People-Oriented and People-Centred ASEAN” – is indicative

7Reimagining ASEAN
4 ASEAN Economic Community (AEC) Blueprint 2025. A Accessible online at http://www.asean.org/wp-content/uploads/images/2015/November/aec-page/AEC-Blueprint-2025-FINAL.pdf
5 Das, Sanchita Basu. (2016). “Huge challenges Await AEC 2025”, Institute of Southeast Asian Studies (ISEAS) Yosuf Ishak Institute, Singapore, Perspective Issue:2016, No. 48, 29 August 2016.
6 EU-28 includes: Austria, Belgium, Bulgaria, Croatia, Cyprus, Czech Republic, Denmark, Estonia, Finland, France, Germany, Greece, Hungary, Ireland, Italy, Latvia, Lithuania, Luxembourg, Malta, Netherlands, Poland, Portugal, Romania, Slovak Republic, Slovenia, Spain, Sweden, United Kingdom.
of some of the missed opportunities under the AEC 2015 Blueprint. This new pillar is a significant enhancement of the third characteristic of the AEC Blueprint 2015 on “Equitable Economic Development”.4 In particular, it is hoped the adoption of this new pillar will address concerns that the ASEAN integration process has had minimal input from ASEAN’s people – particularly the private sector.5
While the 2015 Blueprint only focused on two aspects of “equitable” and “inclusive” development (SME Development and narrowing the development gap between ASEAN nations), the new pillar provides a broader agenda. It is aimed at: strengthening the role of micro, small and medium enterprises (MSME); narrowing the Development Gap (includes IAI); strengthening the role of the private sector; promoting public-private partnership (PPP); and promoting the contribution of stakeholders in regional economic integration.
The AEC 2025 Blueprint is also a longer term vision. With its emphasis on the use of science and technology, the development of human resources, good governance and connectivity, we can expect greater opportunities for both private and public sectors.
For instance, the plan to pursue a more structured and targeted region-wide programme for MSMEs could help create new opportunities; not only for existing enterprises, but also for specific social groups, such as women, and other marginalised sectors of ASEAN member states.
Meanwhile, the plan to establish an ASEAN network of PPP agencies and stakeholders (legal firms, companies, financial institutions) in ASEAN countries, whom collaborate on joint projects and share experiences, could open even greater opportunities for the private and public sectors to pursue infrastructure investments in the run-up to AEC 2025.
On the other hand, what is BSP’s view of how a global trade slow down and rising protectionism will impact ASEAN in the long-term?
A continued slowdown of global trade along with rising protectionism could adversely impact the region, particularly if such a slowdown involves its major trading partners such as the China (which accounts for an average of 13.3% of the total ASEAN trade from 2010-2015), Japan (10.3%), EU-28 6 (9.9%), and the US (8.6%).
Nonetheless, these developments could provide greater imperative for the ASEAN region to facilitate and expedite the regional integration process and consider greater intra-ASEAN trade and investments as a way of compensating for the adverse impact of external developments.
Based on the ASEAN database, intra-ASEAN share in total ASEAN trade averaged 24.5% for the period 2010-2015. This number demonstrates that there is still room for ASEAN nations to expand their trade transactions with each other, and thus, transform the region into a trade and investment hub.
Thank you.
AcknowledgementsWe would like to thank the Philippines’ Bangko Sentral Ng Pilipinas (BSP) and the Department of Finance (DoF) for their invaluable contributions to our “Reimagining ASEAN” campaign.

This document is for information purposes only and is designed to serve as a general overview regarding the services of Deutsche Bank AG, any of its branches and affiliates. The general description in this document relates to services offered by Global Transaction Banking of Deutsche Bank AG, any of its branches and affiliates to customers as of December 2017, which may be subject to change in the future. This document and the general description of the services are in their nature only illustrative, do neither explicitly nor implicitly make an offer and therefore do not contain or cannot result in any contractual or non-contractual obligation or liability of Deutsche Bank AG, any of its branches or affiliates.
Deutsche Bank AG is authorised under German Banking Law (competent authorities: European Central Bank and German Federal Financial Supervisory Authority (BaFin)) and, in the United Kingdom, by the Prudential Regulation Authority. It is subject to supervision by the European Central Bank and the BaFin, and to limited supervision in the United Kingdom by the Prudential Regulation Authority and the Financial Conduct Authority. Details about the extent of our authorisation and supervision by these authorities are available on request.
Copyright© December 2017 Deutsche Bank AG. All rights reserved.